driving with data in indonesia · driving with data in indonesia: ... tally sheet - kpis path 4:...
TRANSCRIPT

Driving with Data in Indonesia:
How the “My Choice” project is
using data to strengthen the
family planning supply chain
management system and increase
product availability
Nurfadliah
Sarah Laaff
October 12, 2016

Our supply chain management component is working to use continuous data to make the system more dynamic to adapt to the changing method mix and support our partners’ LARC demand creation
“My Choice” project overview

Procurement & quantification:• Once/year• Target (not demand)
based
Resupply:• Target (not consumption)
based• Not scheduled/ad hoc
Findings:• High LARC stockouts at
SDPs• Poor data quality• Low usage of accurate
logistic records
Baseline: Shortcomings of existing system

Solutions? Data-driven interventions.

•Target-based
•Once per year
Resupply
•Min: 3 months
•Max: 24 months
Stock levels
• Resupply based on report data from: SDPs (consumption) and warehouses (available stock)
• Distribution done according to fixed review period, based on latest data
• District: Min 3 months – Max 6 months• SDP: Min 2 months – Max 4 months• Setting up reallocation point & emergency
order point (EOP)
Old system Project implementation
•Unscheduled
•Variations: every 3, 2, or 1 months
Supply schedule
• Province to district:Quarterly (staggered and non-staggered)
• District to SDPs:Bimonthly (staggered)
Path 1:Inventory management SOP

Output: Stock status across districts/cities by product and month
Output: Stock status of one district
(dropdown/selected) for each product
for a year
The IMM tool is a data processor, enablingstakeholders to conduct analysis from reported data (consumption & stock levels) for decision making (resupply quantity, reallocation, emergency order) and tracking SCM KPIs
Province level IMM Tool
Path 2:Inventory Management and Monitoring (IMM) Tool
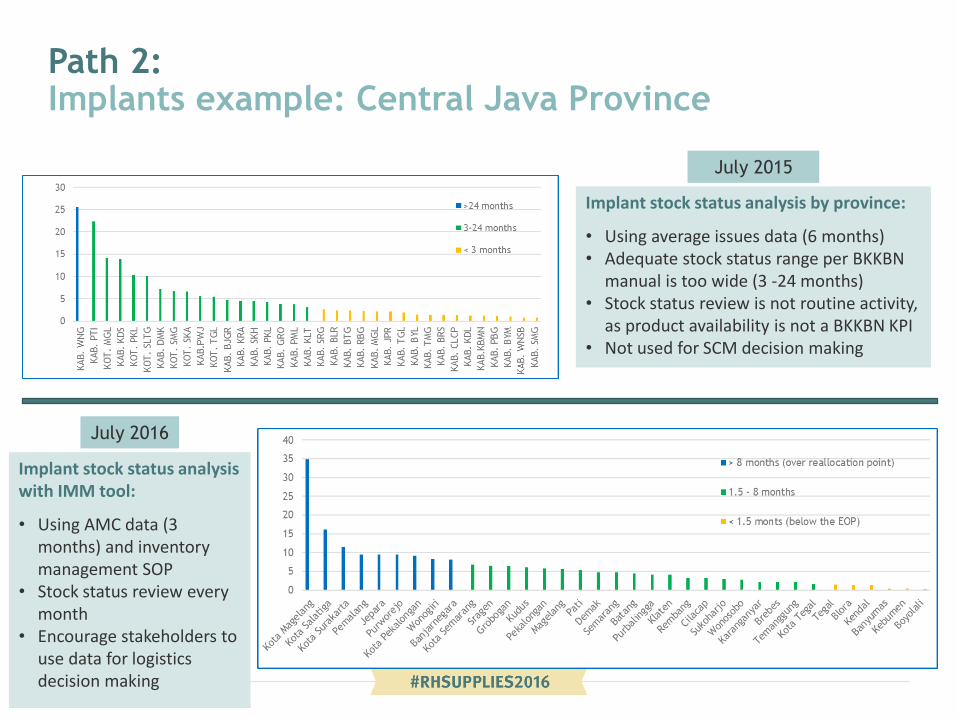
Implant stock status analysis by province:
• Using average issues data (6 months)• Adequate stock status range per BKKBN
manual is too wide (3 -24 months)• Stock status review is not routine activity,
as product availability is not a BKKBN KPI• Not used for SCM decision making
July 2015
July 2016
Implant stock status analysis with IMM tool:
• Using AMC data (3 months) and inventory management SOP
• Stock status review every month
• Encourage stakeholders to use data for logistics decision making
Path 2:Implants example: Central Java Province

Path 3:Technical assistance through supervisory visits/OJT
Using Android-based tools:
• Facilitates mentorship
• Guides mentor to follow supervisitory visit steps andOJT for logistics recording andreporting as well as beststorage practices
• Enables data collection for SCM KPI analysis
• Feedback mechanism

Progress to date: Stakeholders scaling up My Choice activities to conduct supervision with their own resources (South Sulawesi Province)
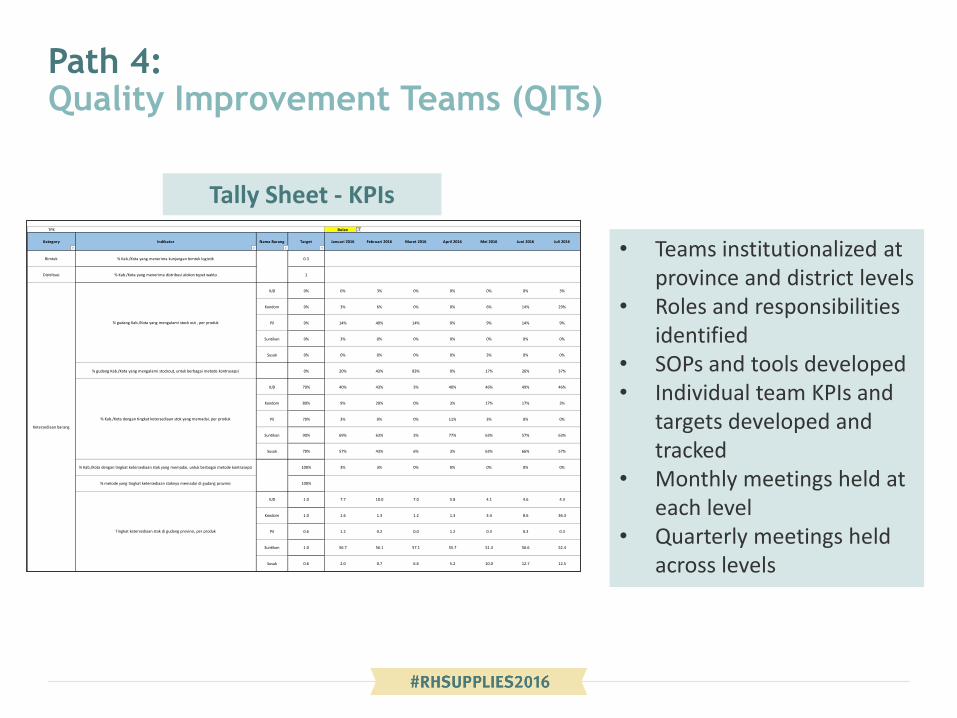
• Teams institutionalized at province and district levels
• Roles and responsibilities identified
• SOPs and tools developed • Individual team KPIs and
targets developed and tracked
• Monthly meetings held at each level
• Quarterly meetings held across levels
TPK Bulan
Kategory Indikator Nama Barang Target Januari 2016 Februari 2016 Maret 2016 April 2016 Mei 2016 Juni 2016 Juli 2016
Bimtek % Kab./Kota yang menerima kunjungan bimtek logistik 0.3
Distribusi % Kab./Kota yang menerima distribusi alokon tepat waktu 1
IUD 0% 0% 3% 0% 0% 0% 0% 3%
Kondom 0% 3% 6% 0% 0% 6% 14% 29%
Pil 0% 14% 40% 14% 0% 9% 14% 9%
Suntikan 0% 3% 0% 0% 0% 0% 0% 0%
Susuk 0% 0% 0% 0% 0% 3% 0% 0%
% gudang Kab./Kota yang mengalami stockout, untuk berbagai metode kontrasepsi (blank) 0% 20% 43% 83% 0% 17% 26% 37%
IUD 70% 40% 43% 3% 40% 46% 49% 46%
Kondom 80% 9% 20% 0% 3% 17% 17% 3%
Pil 70% 3% 0% 0% 11% 3% 0% 0%
Suntikan 90% 69% 63% 3% 77% 63% 57% 63%
Susuk 70% 57% 43% 6% 3% 63% 66% 57%
% Kab./Kota dengan tingkat ketersediaan stok yang memadai, untuk berbagai metode kontrasepsi 100% 3% 3% 0% 0% 0% 0% 0%
% metode yang tingkat ketersediaan stoknya memadai di gudang provinsi 100%
IUD 1.0 7.7 10.0 7.0 5.8 4.1 4.6 4.3
Kondom 1.0 1.6 1.3 1.2 1.3 3.4 8.6 36.3
Pil 0.6 1.2 0.2 0.0 1.2 0.3 0.3 0.3
Suntikan 1.0 56.7 56.1 57.1 55.7 51.3 56.6 52.4
Susuk 0.6 2.0 0.7 6.6 5.2 10.0 12.7 12.5
Ketersediaan barang
% gudang Kab./Kota yang mengalami stock out , per produk
% Kab./Kota dengan tingkat ketersediaan stok yang memadai, per produk
Tingkat ketersediaan stok di gudang provinsi, per produk
(blank)
(blank)
Tally Sheet - KPIs
Path 4: Quality Improvement Teams (QITs)

Path 5: Data-centric interventions: data quality & timeliness
Job aids to improve data quality & timeliness:
• Video-based
• Paper-based
• Classroom training
• OJT
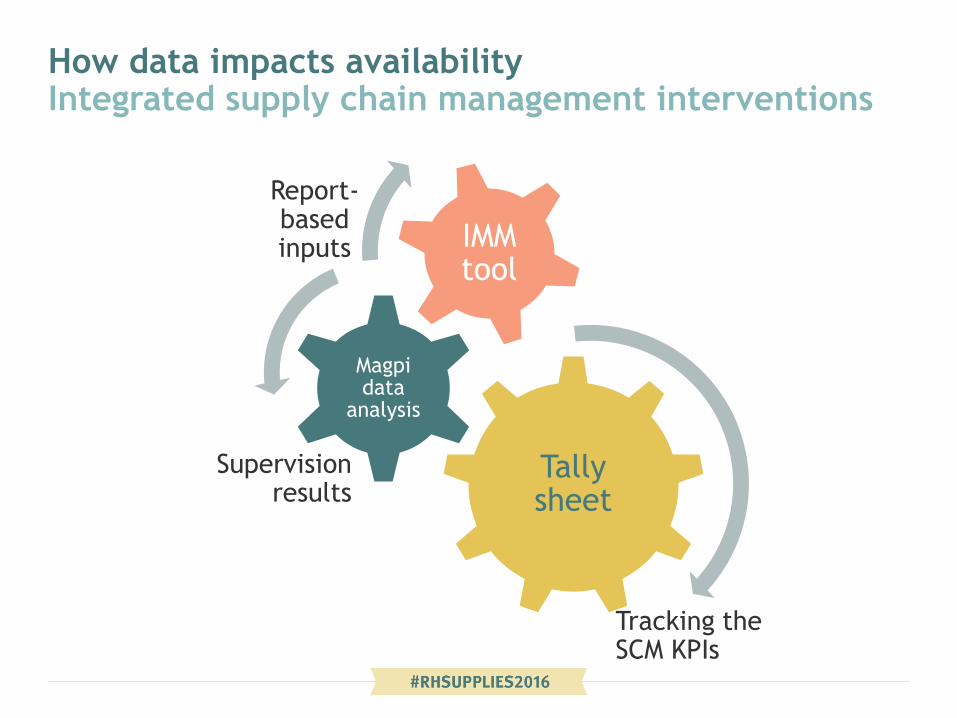
Tallysheet
Magpidata
analysis
IMM tool
Report-basedinputs
Supervision results
Tracking the SCM KPIs
How data impacts availabilityIntegrated supply chain management interventions

Terima kasih.