“driving using the rear view mirror” the dark art of population forecasting catherine scott ross...
TRANSCRIPT

“Driving using the rear view mirror”The Dark Art of Population Forecasting
Catherine ScottRoss MaconachiePublic Health Research UnitWest Sussex County CouncilApril 2013
Some simple questions..
• How many people with diabetes will live in West Sussex in 2020?
• If we reduce obesity prevalence by 10% what impact will that have on future need for healthcare?
• What skills will people need in the future?
• What will the composition of households be in future?
• What types of housing will we need in the future?
• What migration will there be in and out of West Sussex in future?


‘The first Baby Boomer has come to collect Social Security, how cute….’


‘As you can see, by late next month you’ll have over four dozen husbands. Better get a bulk rate on wedding cake.’

50
55
60
65
70
75
80
1966 1976 1986 1996 2006 2016 2026 2036 2046 2056
Year
Milli
ons
Actual 1971-based 1977-based 1989-based
1998-based 2004-based 2006-based
Past population projectionsSource: ONS
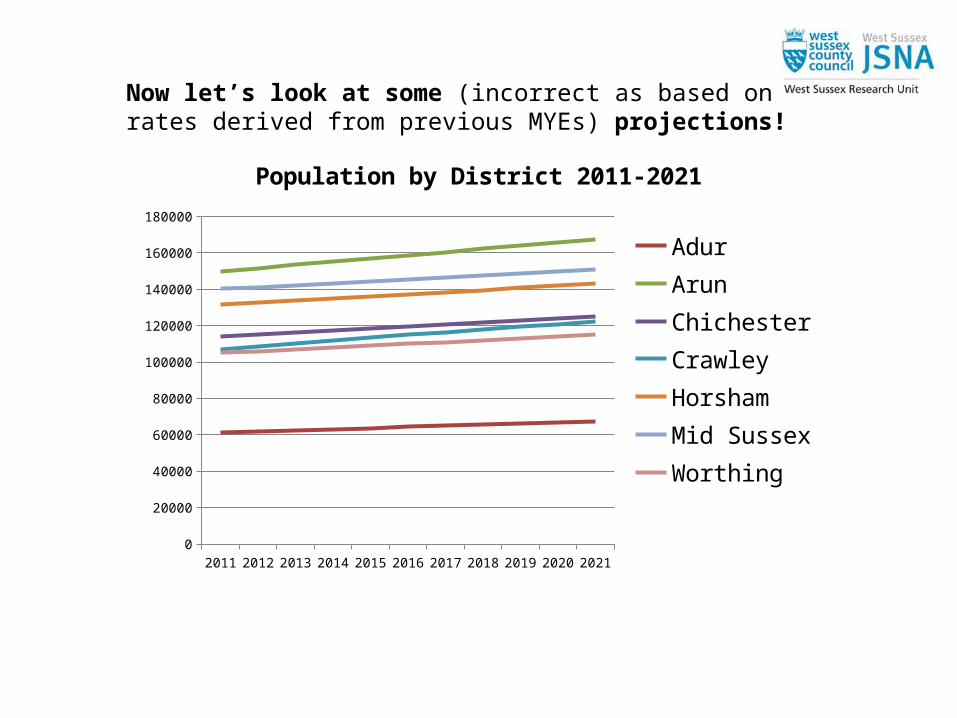
Now let’s look at some (incorrect as based on rates derived from previous MYEs) projections!
2011 2012 2013 2014 2015 2016 2017 2018 2019 2020 20210
20000
40000
60000
80000
100000
120000
140000
160000
180000
Population by District 2011-2021
AdurArunChichesterCrawleyHorshamMid SussexWorthing

0-4
5-9
10-14
15-19
20-24
25-29
30-34
35-39
40-44
45-49
50-54
55-59
60-64
65-69
70-74
75-79
80-84
85-89
90+
6.0% 4.0% 2.0% 0.0% 2.0% 4.0% 6.0%
Males MYE 2011 Females 2011 Females SNPP 2021
Males 2021
WSx Population 2011 - 2021
4 key areas are:-
1. 50% more people aged 90+
2. Huge expansion in number people aged 65+
3. Growth in upper working age - consider 2031!
4. Contraction of key carer groups to support
This corresponds to an 25% increase in 65+, a 31% increase in 85+ and an old age dependency ratio increase of 19%

MIGRATION

Sensitivity analysis - the effect of fertility, mortality and aggregate migration

Cautionary tale 1
‘It will be years - not in my time - before a woman will become Prime Minister’
Margaret Thatcher, future Prime Minister, October 26th, 1969.

Cautionary tale 2
‘Earlier on today, apparently, a woman rang the BBC and said she heard there was a hurricane on the way... well, if you're watching, don't worry, there isn't!’
Michael Fish, weather forecaster, a few hours before the worst storm since 1703 hit South East England in October 1987

Weather forecast for Crawley last week on Met Office website
There is a 20% chance of precipitation on Thursday

Chart 5.1 GDP projection based on market interest rate expectations
The fan chart depicts the probability of various outcomes for GDP growth. To the left of the first vertical dashed line, the distribution reflects the likelihood of revisions to the data over the past; to the right, it reflects uncertainty over the evolution of GDP growth in the future. If economic circumstances identical to today’s were to prevail on 100 occasions, the MPC’s best collective judgement is that the mature estimate of GDP would lie within the darkest central band on only 10 of those occasions. The fan chart is constructed so that outturns are also expected to lie within each pair of the lighter green areas on ten occasions. Consequently, GDP growth is expected to lie somewhere within the entire fan on 90 out of 100 occasions. The bands widen as the time horizon is extended, indicating the increasing uncertainty about outcomes. See the box on page 39 for a fuller description of the fan chart and what it represents. The second dashed line is drawn at the two-year point of the projection.

The effective of housing assumptions – various scenarios
2002
2003
2004
2005
2006
2007
2008
2009
2010
2011
2012
2013
2014
2015
2016
2017
2018
2019
2020
2021
2022
2023
2024
2025
2026
2027
2028
2029
2030
2031
750000
800000
850000
900000
950000
1000000
Population of West Sussex - Various Scenarios to 2030
ONS +5%ONS
Housing YoungFam
Housing Oldfam
WSCC Model
Natural Change
Natural Change -5%

Cautionary tale 3
‘They couldn't hit an elephant at this dist- ‘ Last words of Gen. John Sedgwick, spoken as he looked out over the parapet at enemy lines during the Battle of Spotsylvania in 1864.

Cautionary tale 4
‘There is not the slightest indication that nuclear energy will ever be obtainable. It would mean that the atom would have to be shattered at will’
Albert Einstein, 1932

Key messages
• Vital to have best population data possible
• Implications of different structures need to be understood by policy makers
• Dependency ratio an important statistic in the south east
• Key drivers of migration are jobs and housing, both can be influenced