driving economic growth - california economic forum...economic impact for ca l.a. county franchised...
TRANSCRIPT

Driving Economic Growth Opportunity With California Minority
Auto Consumers
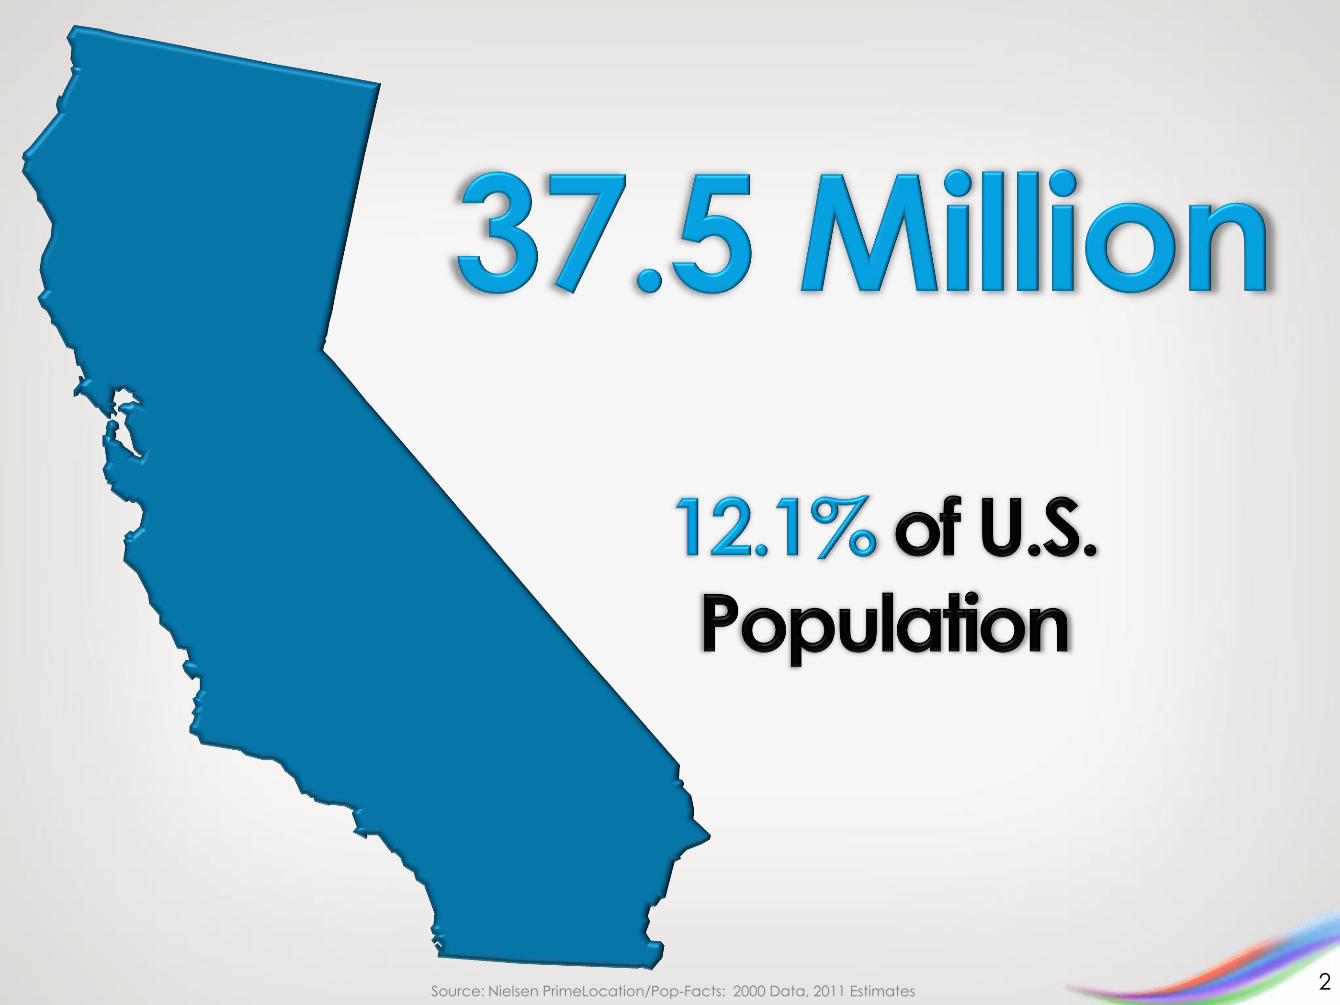
2 Source: Nielsen PrimeLocation/Pop-Facts: 2000 Data, 2011 Estimates
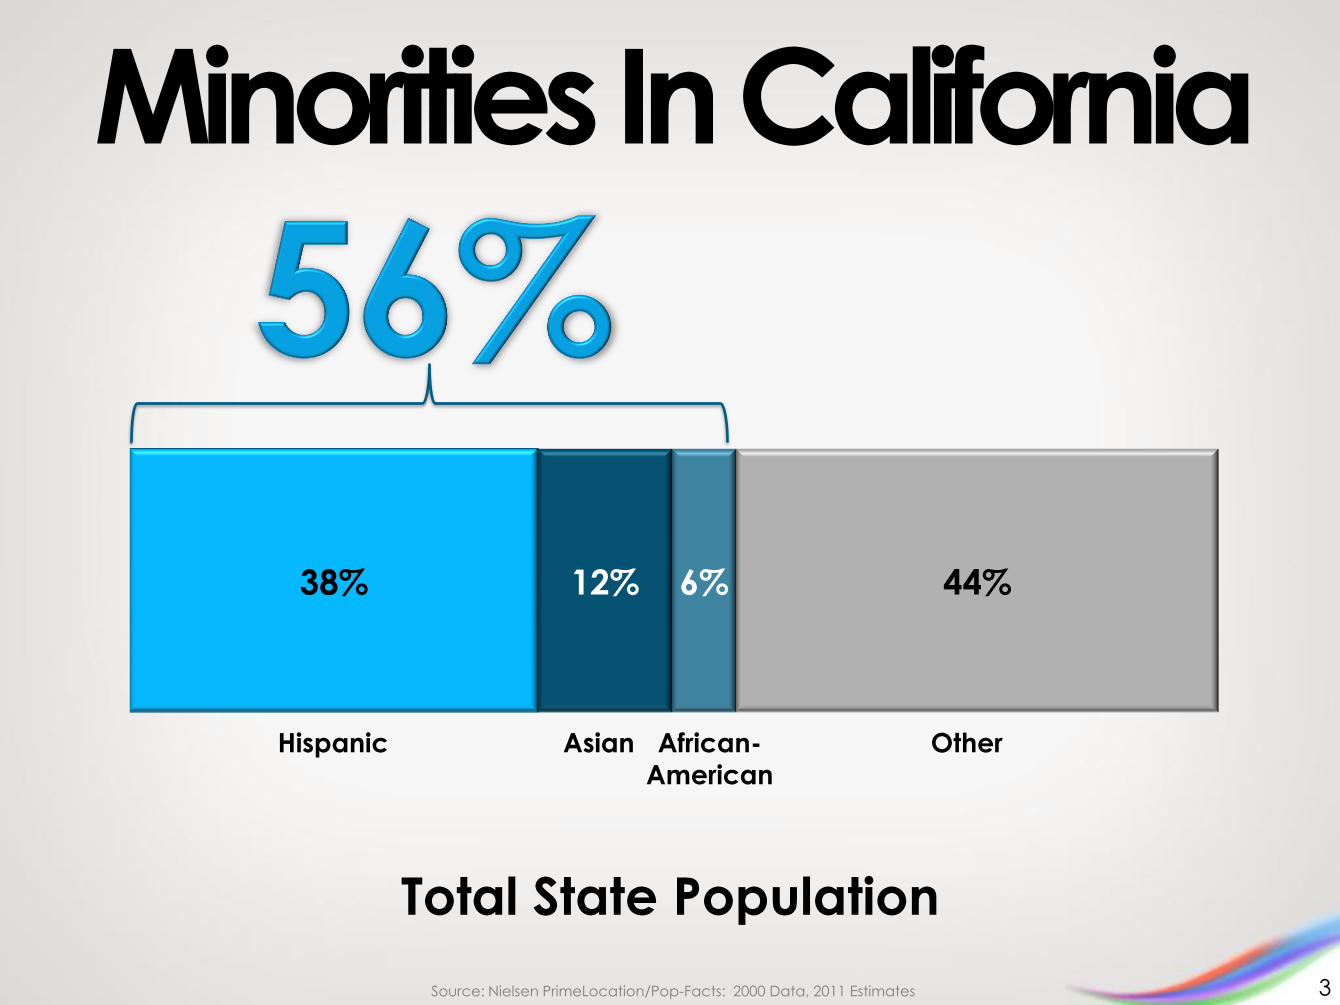
38% 12% 6% 44%
3
Minorities In California
Total State Population
Source: Nielsen PrimeLocation/Pop-Facts: 2000 Data, 2011 Estimates
Other Hispanic Asian African-
American

Significantly Younger
27%
22%
34%
22%
26%
53%
56%
54%
50%
52%
20%
22%
12%
28%
22%
African-American
Asian
Hispanic
White
Total CA
Under 18 18-54 55+ Median Age
4
Age Distribution of California’s Population
Source: Nielsen PrimeLocation/Pop-Facts: 2000 Data, 2011 Estimates, California
35.1
39.8
27.3
34.6
36.7
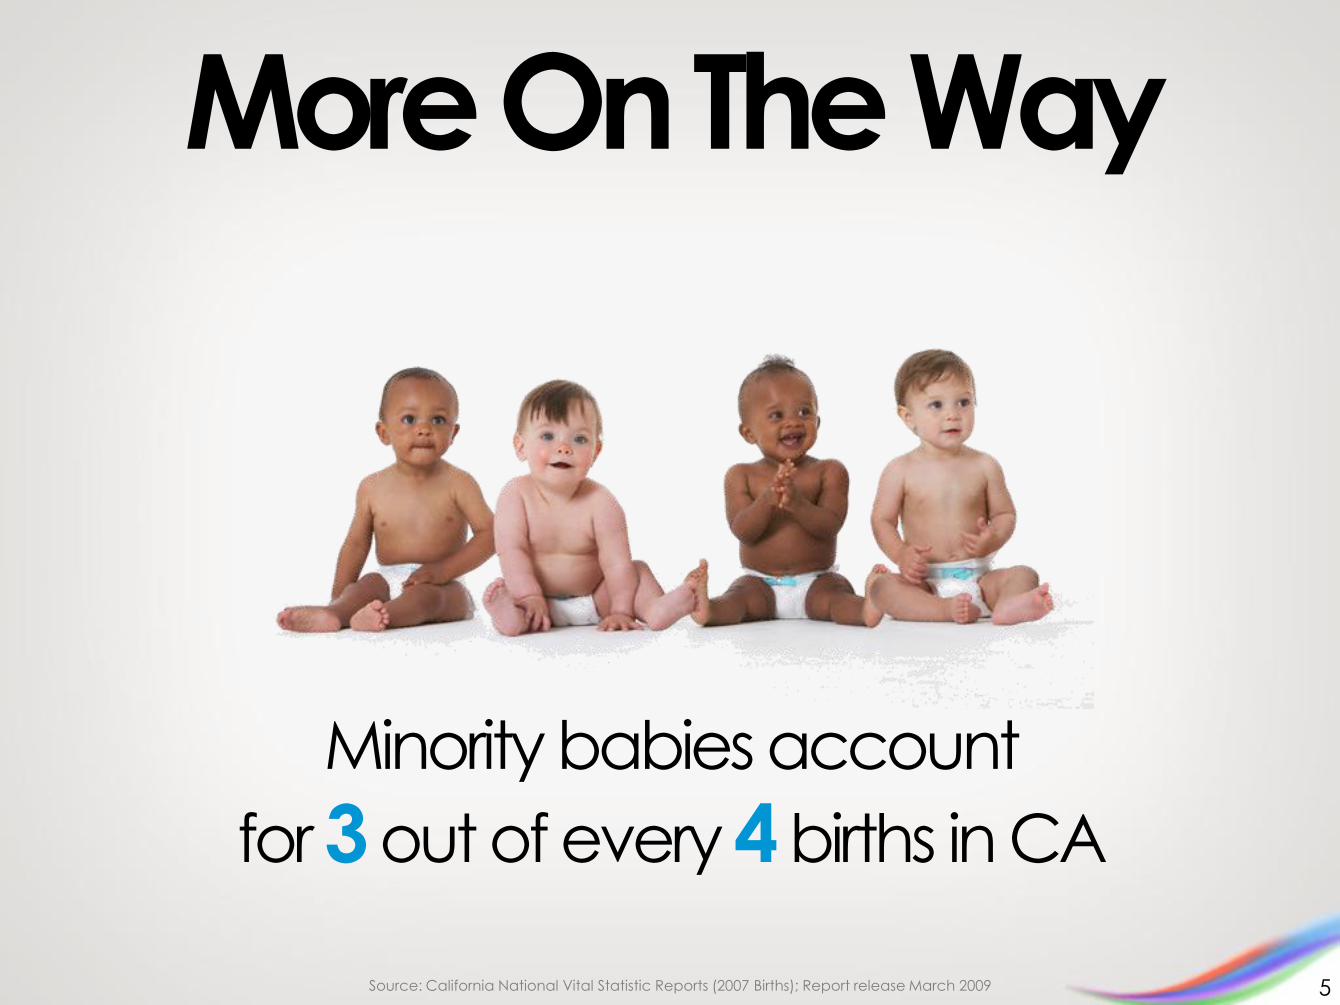
More On The Way
Minority babies account
for 3 out of every 4 births in CA
Source: California National Vital Statistic Reports (2007 Births); Report release March 2009 5
6
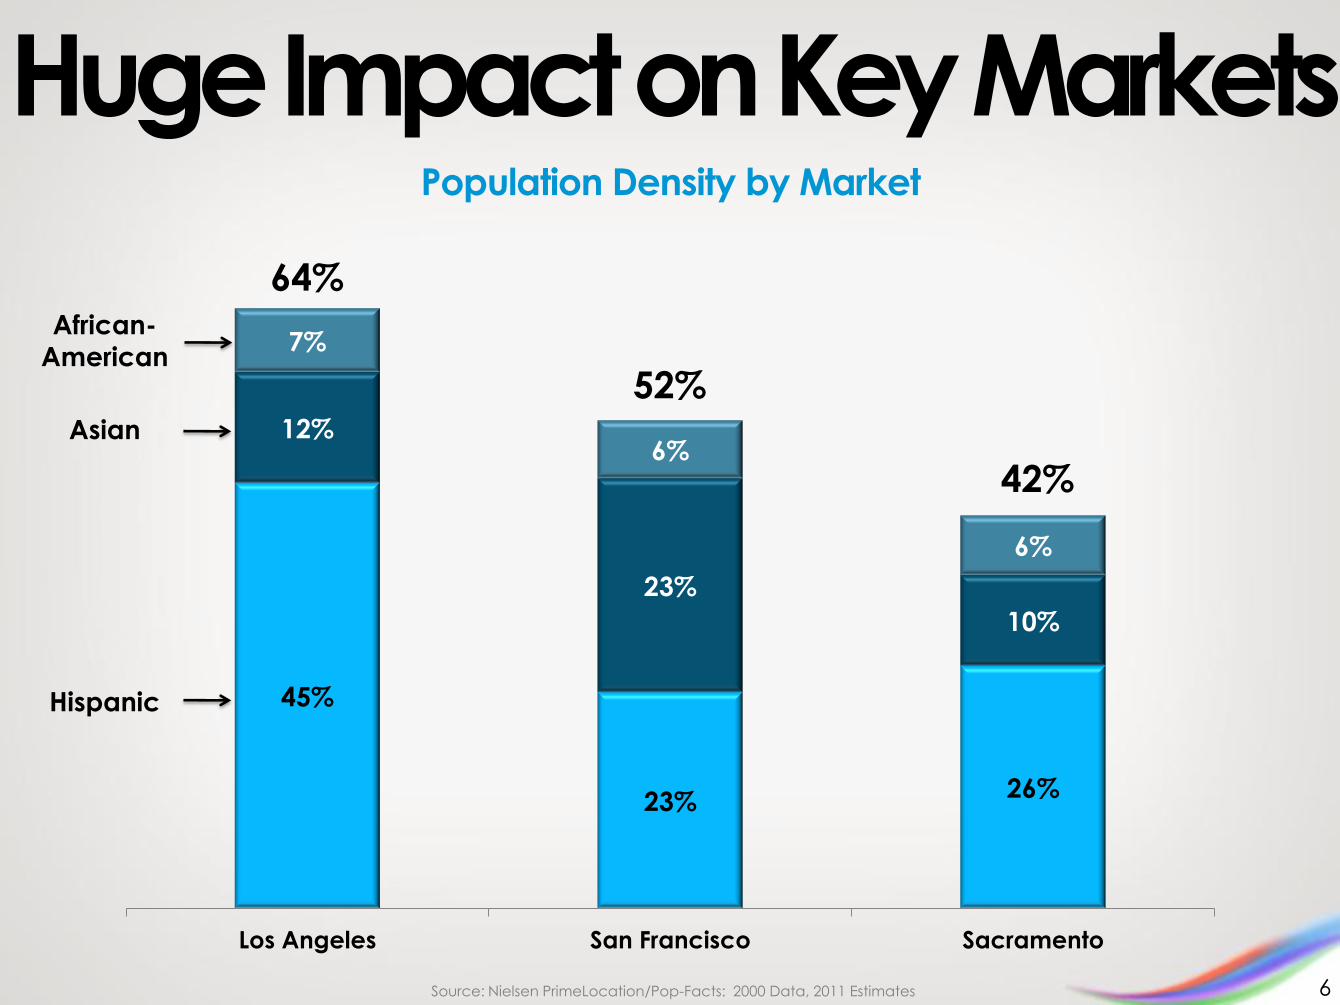
Huge Impact on Key Markets Population Density by Market
45%
23% 26%
12%
23%
10%
7%
6%
6%
Los Angeles San Francisco Sacramento
64%
52%
42%
Source: Nielsen PrimeLocation/Pop-Facts: 2000 Data, 2011 Estimates
Hispanic
Asian
African-
American

7
38% 26%
42%
37%
28%
32%
21%
32%
21%
4% 14%
5%
Hispanic Asian African-American
Economically Viable California Household Income
$75-150K
$35-75K
<$35K
Source: Nielsen PrimeLocation/Pop-Facts: 2011 Estimates
$150K+
8
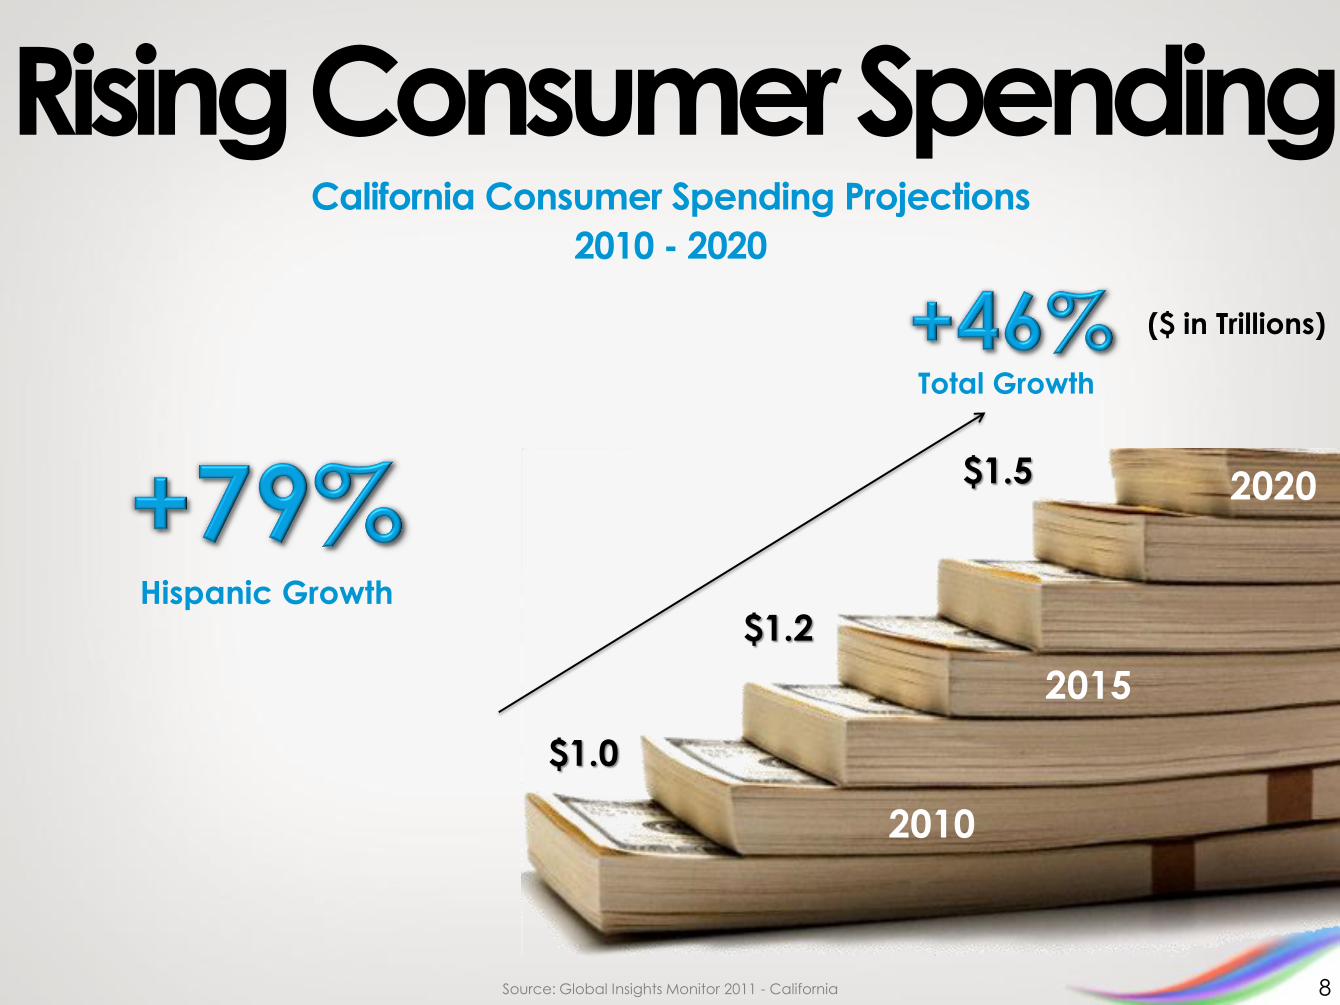
Rising Consumer Spending California Consumer Spending Projections
2010 - 2020
Source: Global Insights Monitor 2011 - California
Hispanic Growth
($ in Trillions)
Total Growth
2010
2015
2020
$1.0
$1.2
$1.5

Driving Home Ownership
9
% Change in CA Owned Housing Units
2011-2016
Source: Nielsen PrimeLocation/Pop-Facts: 2000 Data, 2011 Estimates, 2016 Projections
Total CA Hispanic Asian African-
American
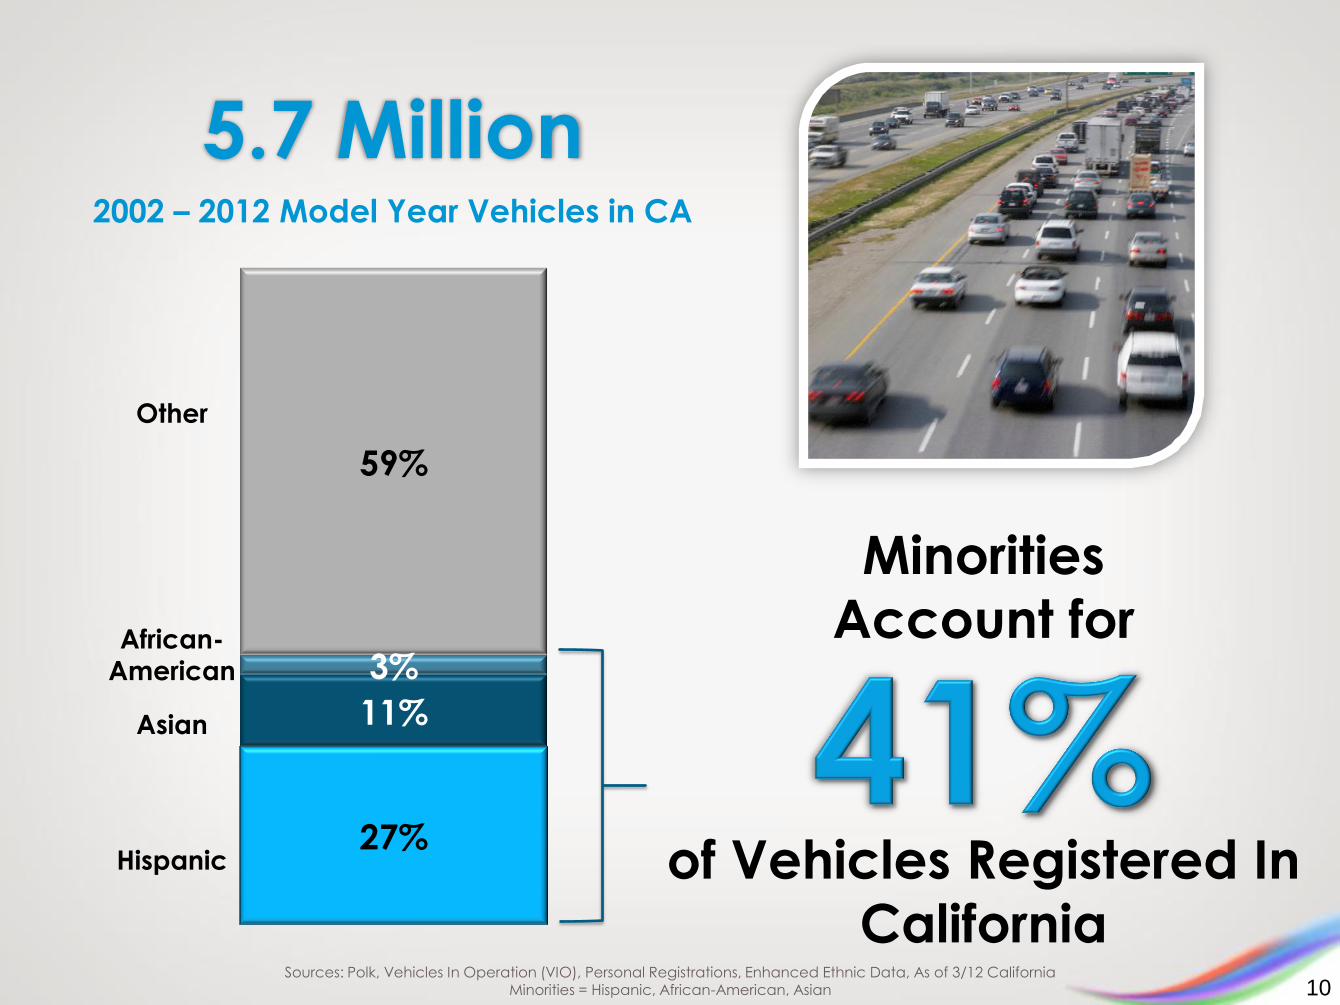
2002 – 2012 Model Year Vehicles in CA
Sources: Polk, Vehicles In Operation (VIO), Personal Registrations, Enhanced Ethnic Data, As of 3/12 California Minorities = Hispanic, African-American, Asian
5.7 Million
10
of Vehicles Registered In
California
Minorities
Account for
27%
11%
3%
59%
Other
Hispanic
Asian
African- American
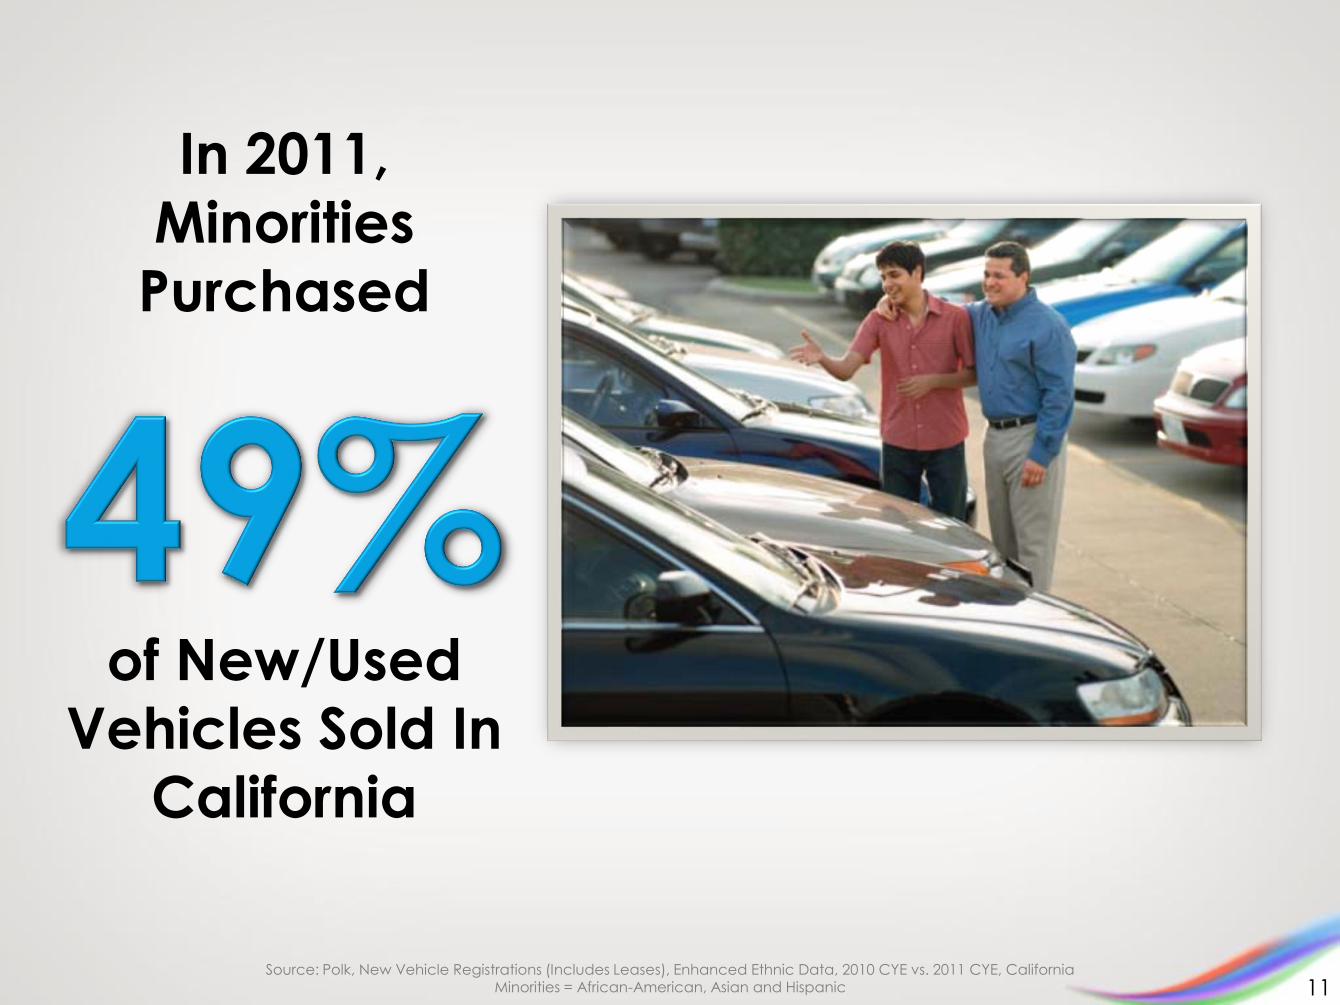
Source: Polk, New Vehicle Registrations (Includes Leases), Enhanced Ethnic Data, 2010 CYE vs. 2011 CYE, California Minorities = African-American, Asian and Hispanic
of New/Used
Vehicles Sold In
California
In 2011,
Minorities
Purchased
11
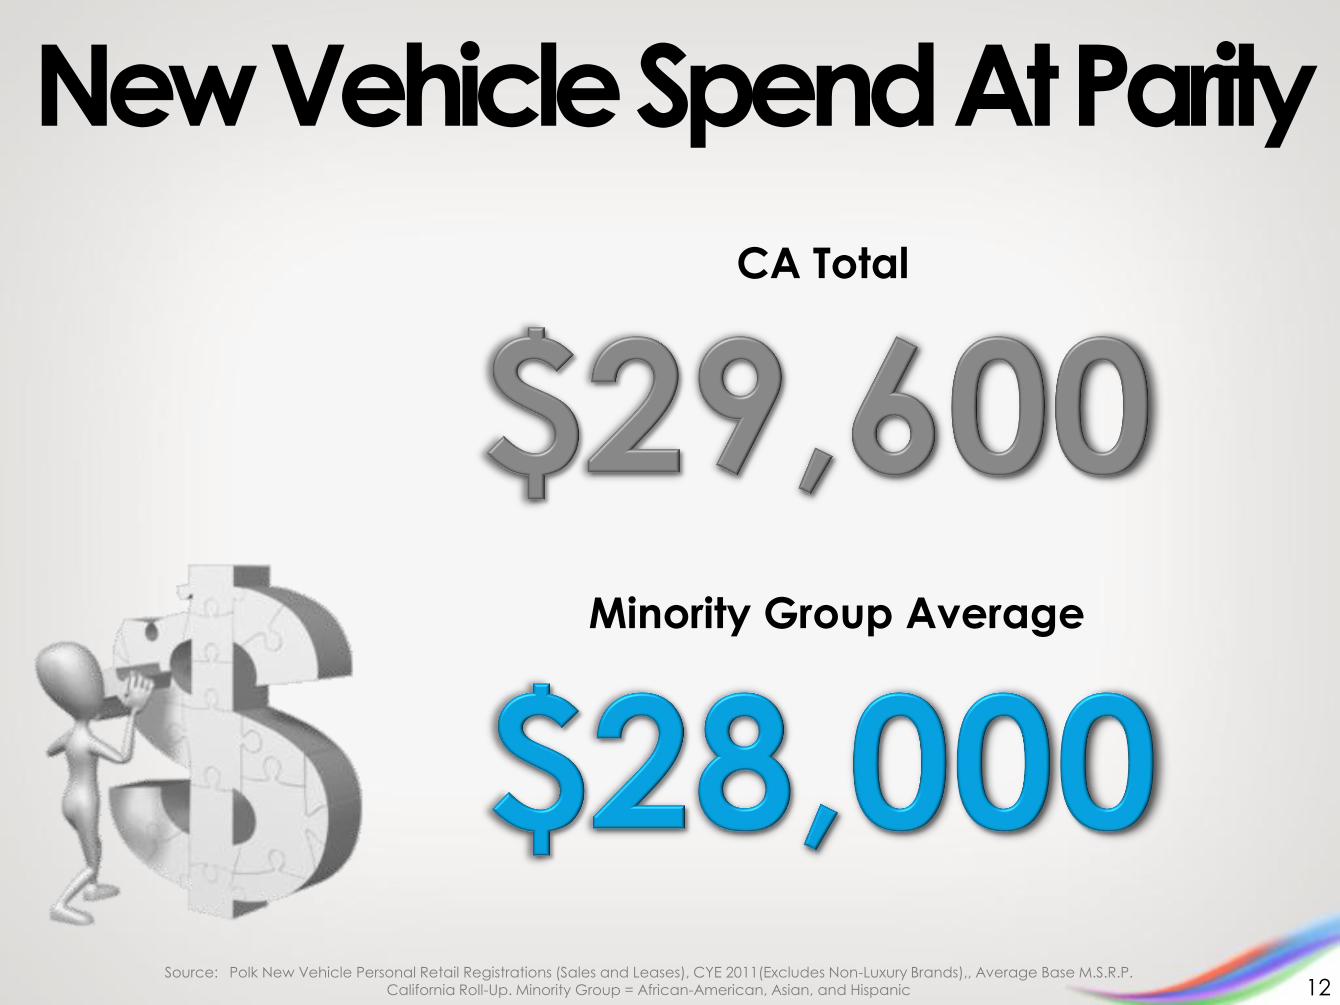
New Vehicle Spend At Parity
Source: Polk New Vehicle Personal Retail Registrations (Sales and Leases), CYE 2011(Excludes Non-Luxury Brands),, Average Base M.S.R.P. California Roll-Up. Minority Group = African-American, Asian, and Hispanic 12
Minority Group Average
CA Total
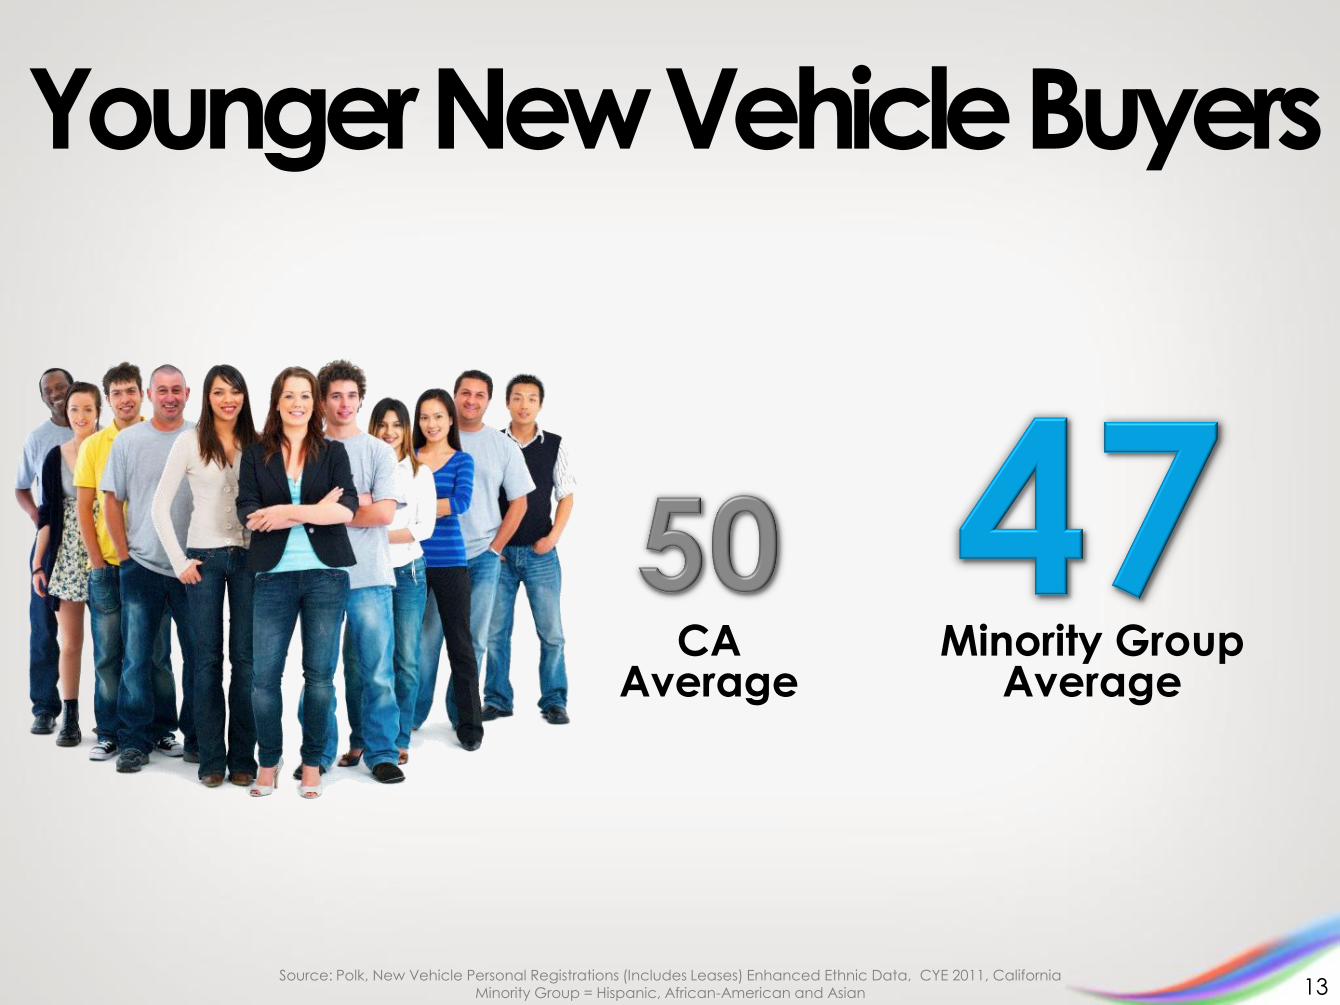
Younger New Vehicle Buyers
Minority Group Average
CA Average
Source: Polk, New Vehicle Personal Registrations (Includes Leases) Enhanced Ethnic Data, CYE 2011, California Minority Group = Hispanic, African-American and Asian 13
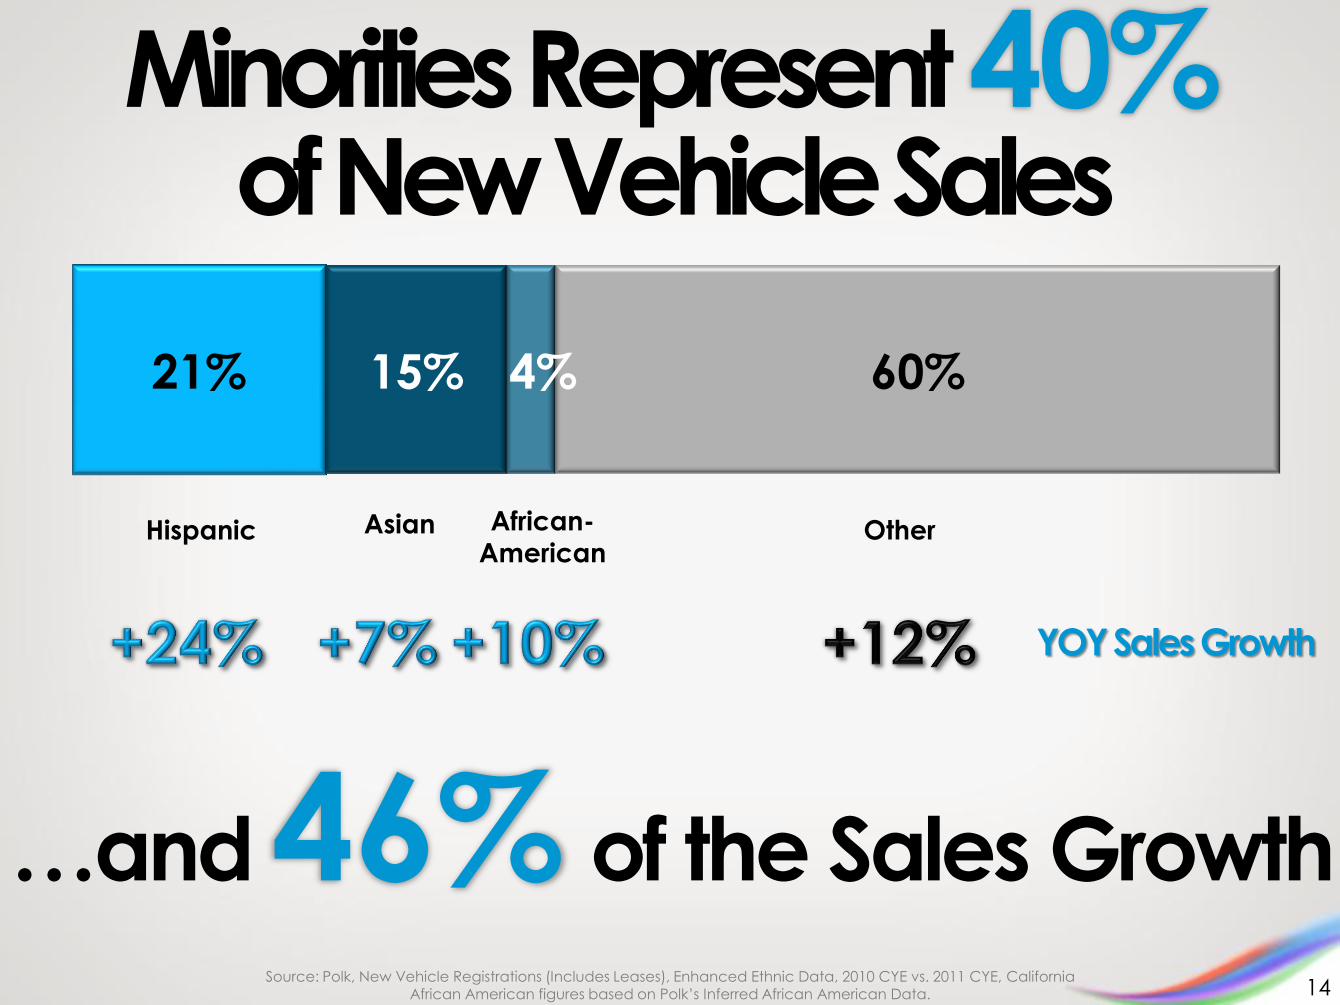
21% 15% 4% 60%
Minorities Represent 40% of New Vehicle Sales
14
Other Hispanic Asian African-
American
…and 46% of the Sales Growth Source: Polk, New Vehicle Registrations (Includes Leases), Enhanced Ethnic Data, 2010 CYE vs. 2011 CYE, California
African American figures based on Polk’s Inferred African American Data.
YOY Sales Growth
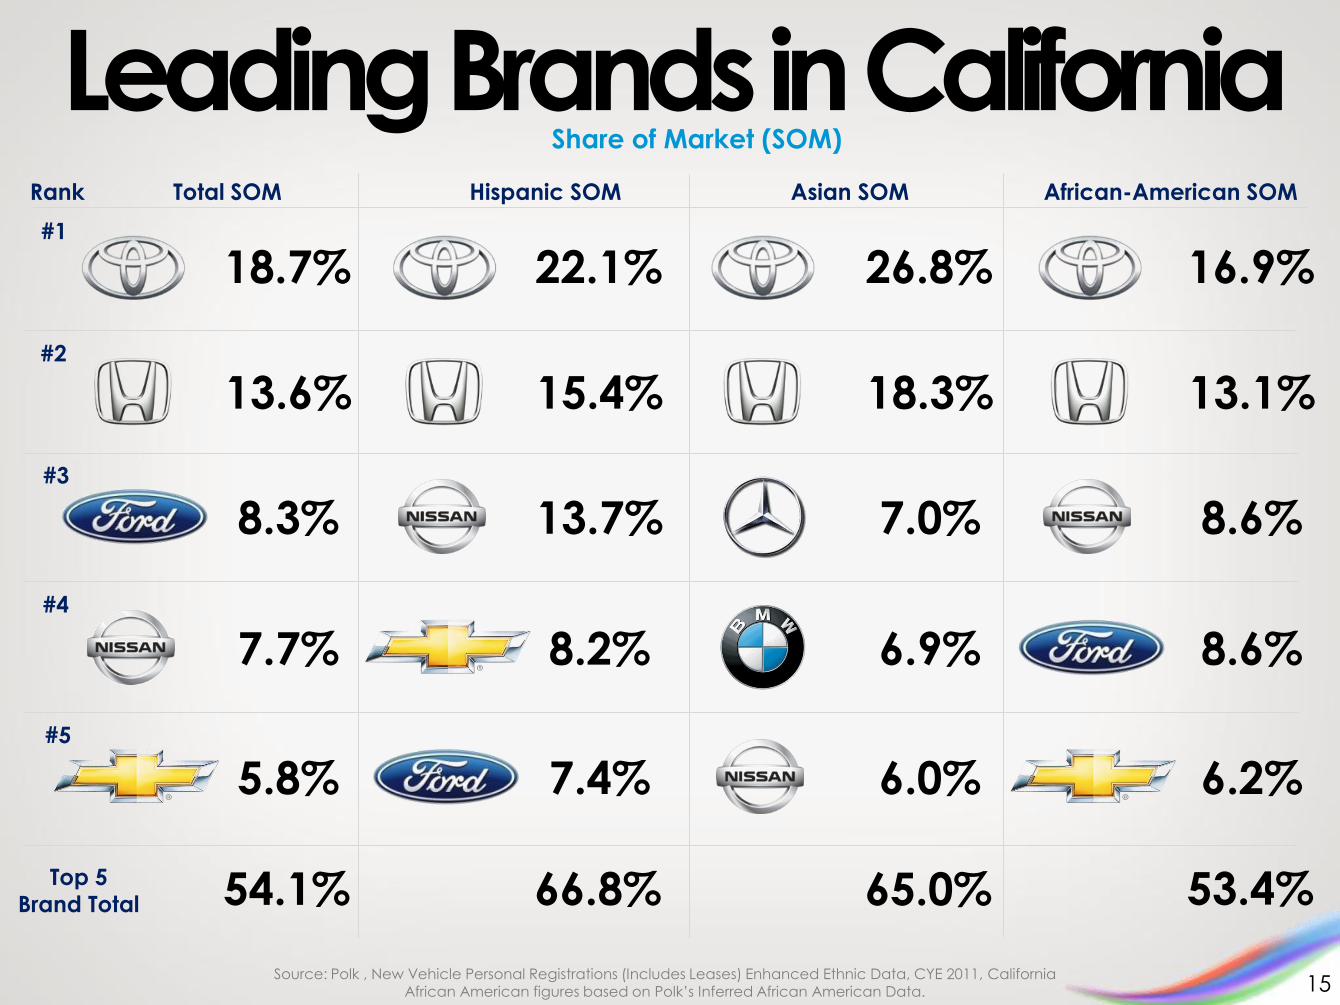
16.9%
Source: Polk , New Vehicle Personal Registrations (Includes Leases) Enhanced Ethnic Data, CYE 2011, California
African American figures based on Polk’s Inferred African American Data.
#1
#2
#3
#4
#5
Rank African-American SOM
Leading Brands in California
22.1%
Hispanic SOM Asian SOM
26.8%
15
53.4% 66.8% 65.0% Top 5 Brand Total
18.7%
Total SOM
54.1%
6.2% 7.4% 6.0% 5.8%
8.6% 8.2% 6.9% 7.7%
8.6% 13.7% 7.0% 8.3%
13.1% 15.4% 18.3% 13.6%
Share of Market (SOM)

Source: Polk , New Vehicle Personal Registrations (Includes Leases) Enhanced Ethnic Data, CYE 2011, California, Ethnic Group = African-Americans, Asians and Hispanics African American figures based on Polk’s Inferred African American Data.
Minorities Drive Total Sales
16
African-American Hispanic Asian
2011 Percent of Total Brand Sales
Minorities
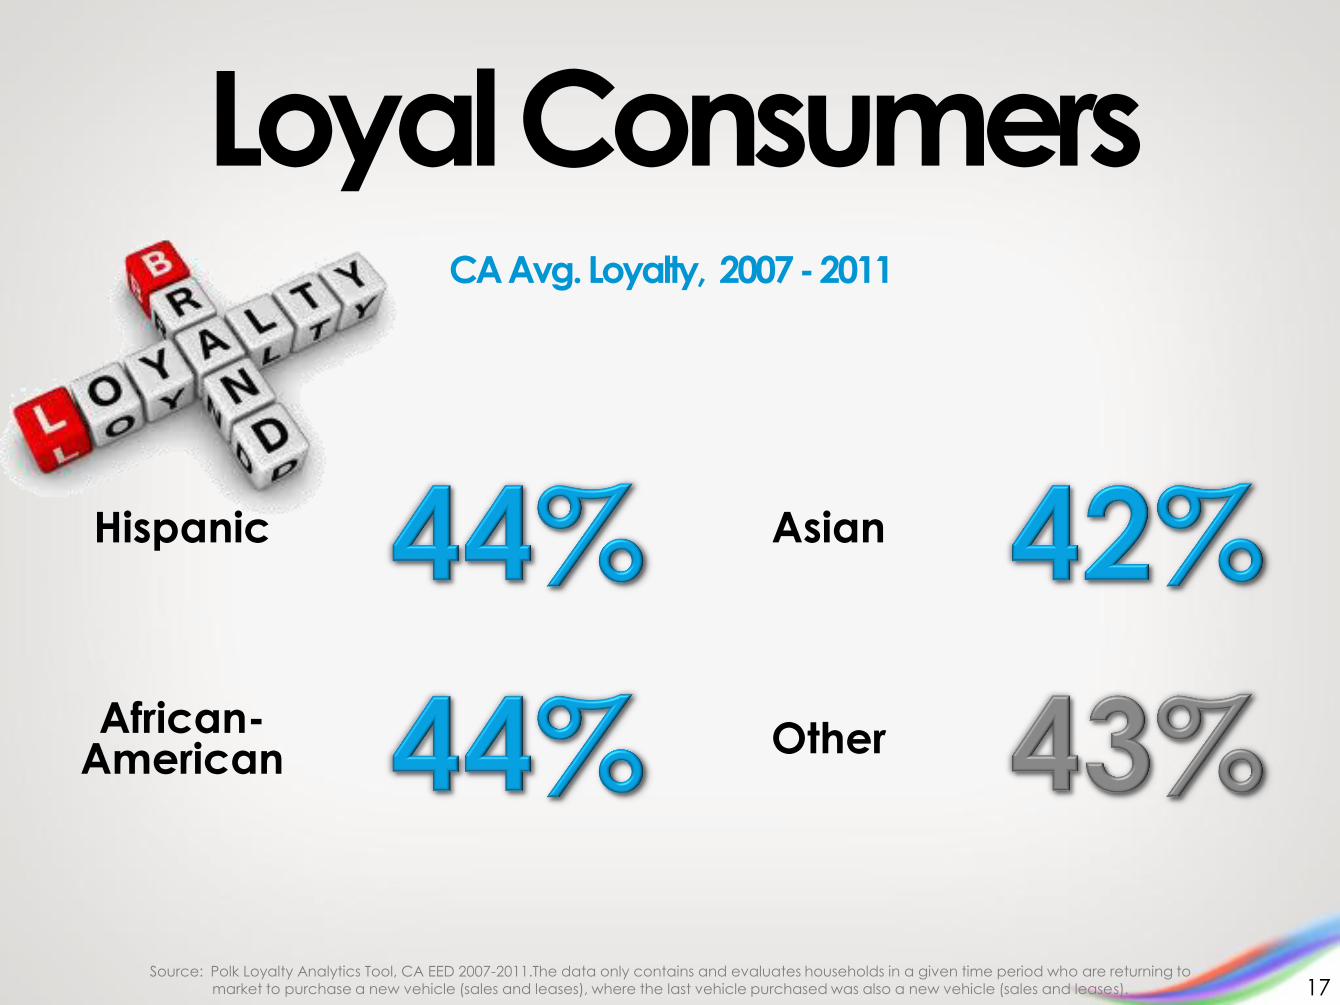
Loyal Consumers
Source: Polk Loyalty Analytics Tool, CA EED 2007-2011.The data only contains and evaluates households in a given time period who are returning to market to purchase a new vehicle (sales and leases), where the last vehicle purchased was also a new vehicle (sales and leases). 17
Hispanic
Other African-
American
Asian
CA Avg. Loyalty, 2007 - 2011
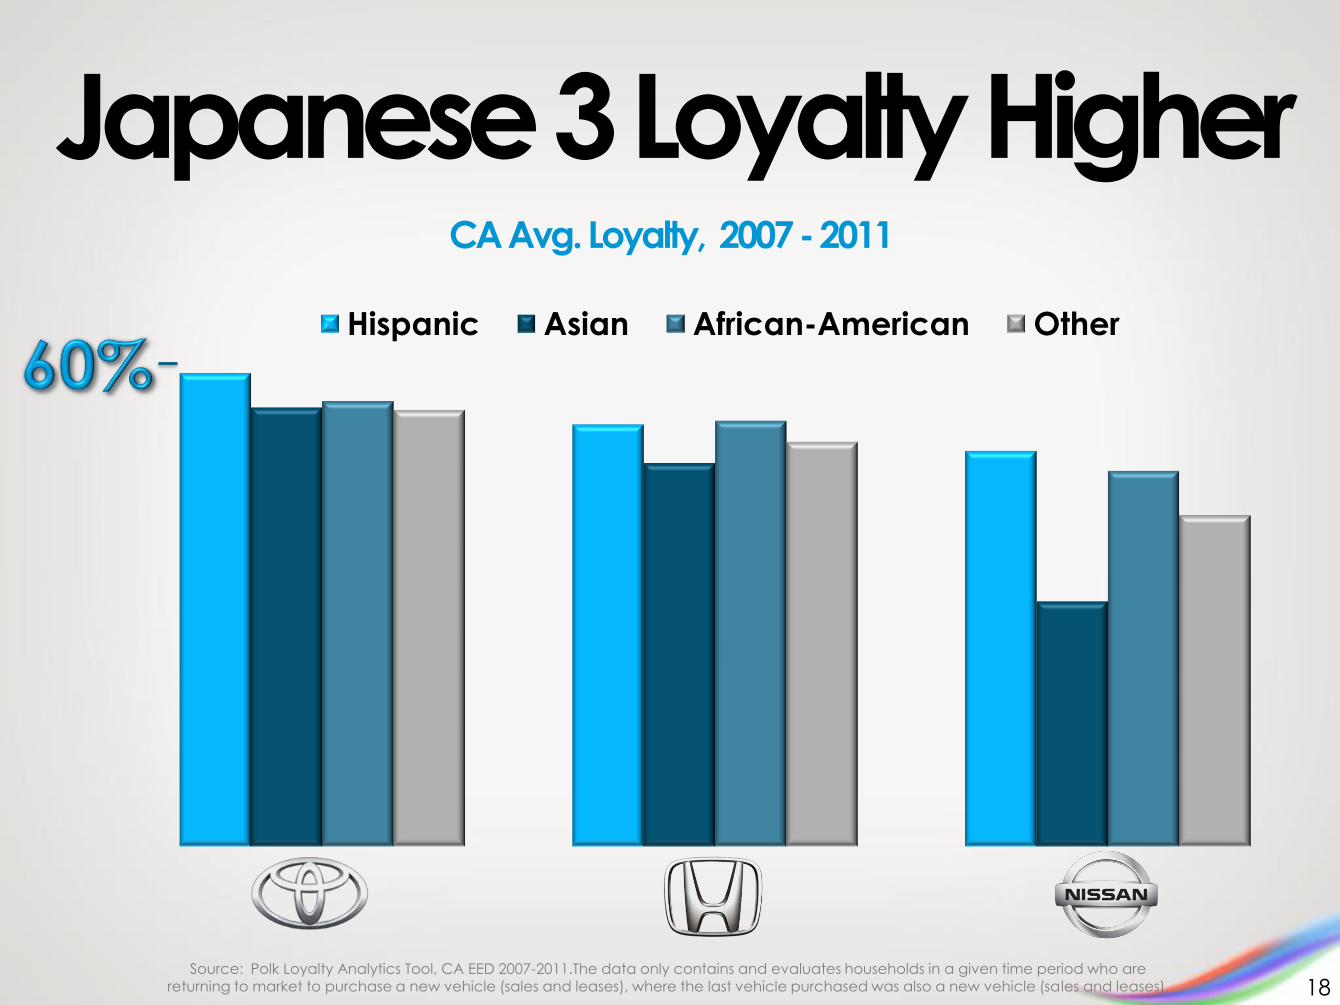
Japanese 3 Loyalty Higher
Hispanic Asian African-American Other
Source: Polk Loyalty Analytics Tool, CA EED 2007-2011.The data only contains and evaluates households in a given time period who are returning to market to purchase a new vehicle (sales and leases), where the last vehicle purchased was also a new vehicle (sales and leases).
CA Avg. Loyalty, 2007 - 2011
18
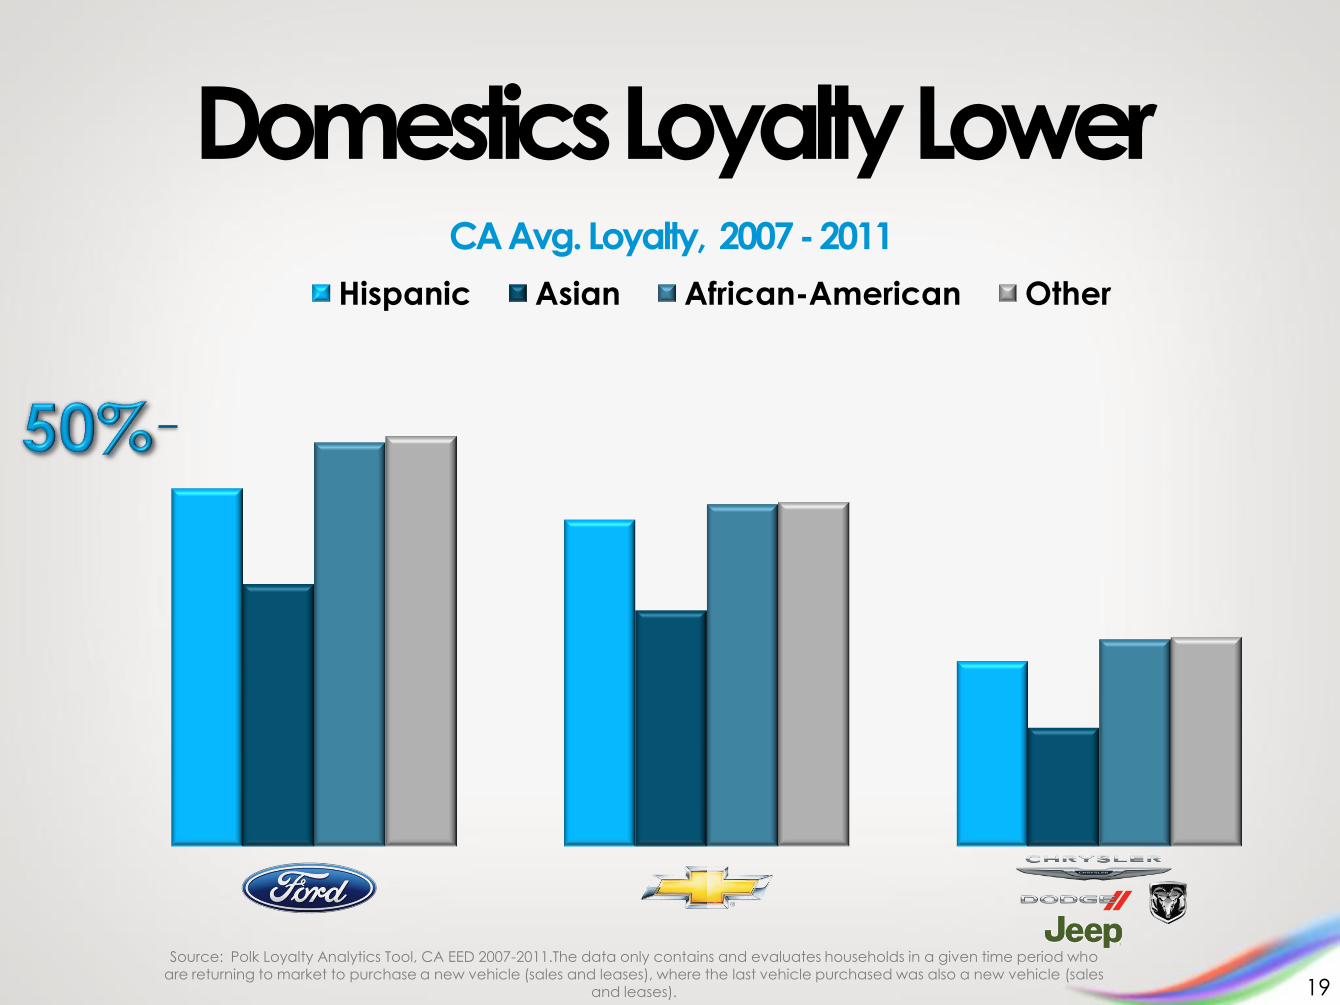
Domestics Loyalty Lower
Hispanic Asian African-American Other
Source: Polk Loyalty Analytics Tool, CA EED 2007-2011.The data only contains and evaluates households in a given time period who are returning to market to purchase a new vehicle (sales and leases), where the last vehicle purchased was also a new vehicle (sales
and leases). 19
CA Avg. Loyalty, 2007 - 2011

Scarborough 2011 Release 2, (Aug 2010-Jul 2011); Base: New Vehicle Owners; Los Angeles, A18+; Los Angeles, San Francisco, Sacramento (Minorities = Hispanics, Asian, African-American) 20
Traveled 10+ Miles
One Way To
Purchase Their Last
New Vehicle
Among Minorities,

Primary Reasons for Selecting a Dealership to Purchase Last New Vehicle
Looking For…
Source: Scarborough LA, San Fran, Sacramento, 2011 Release 2, (August 2010 – July 2011), Among A18+ Vehicle Owners
Price-
Value
Dealer
Financing
Dealer
Reputation
21
Dealer
Location
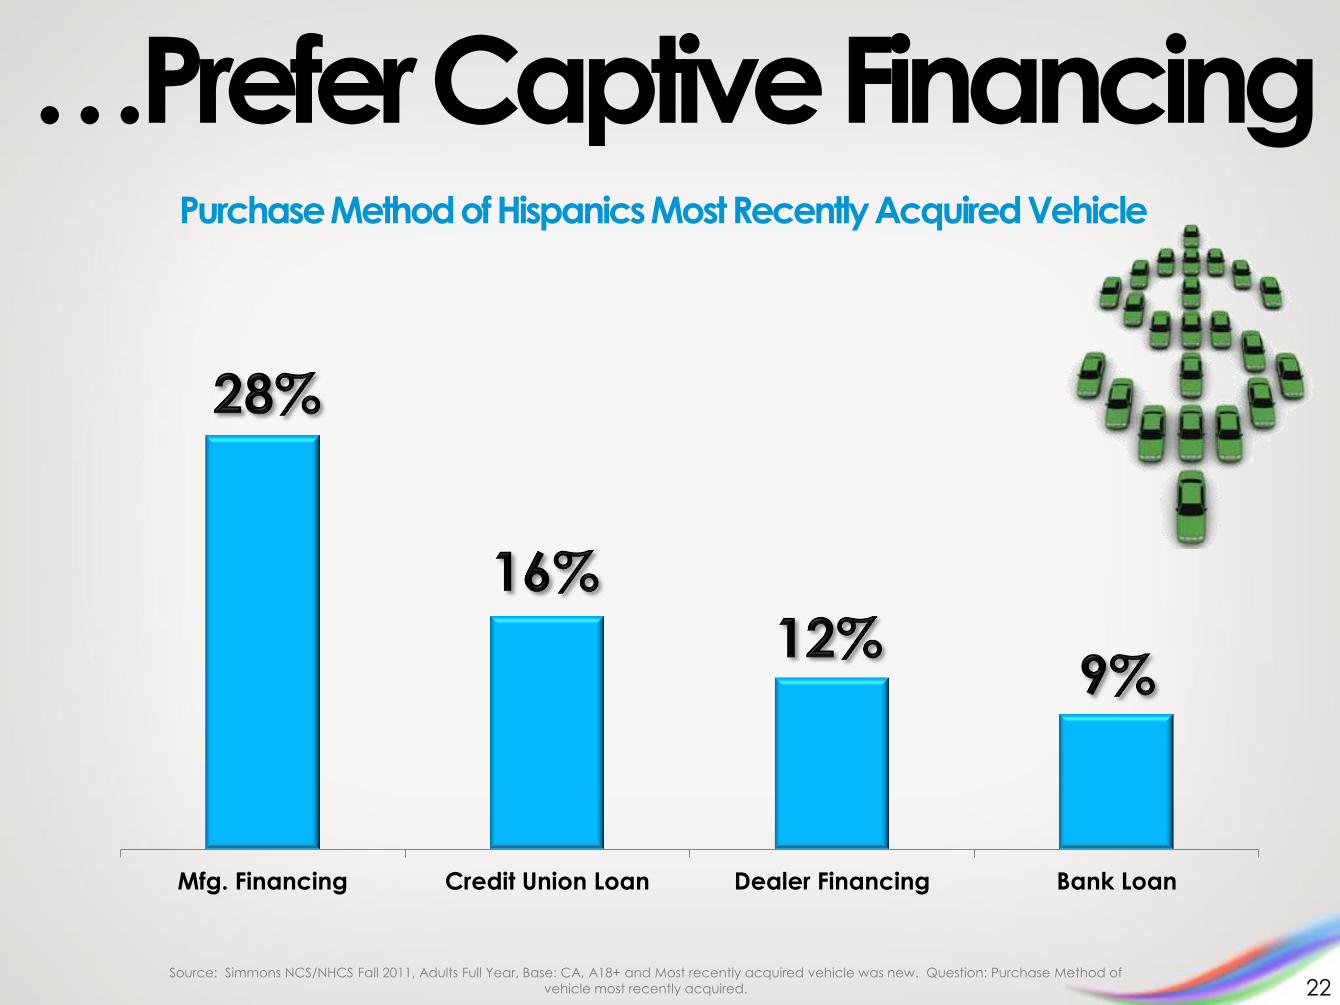
…Prefer Captive Financing
Mfg. Financing Credit Union Loan Dealer Financing Bank Loan
Source: Simmons NCS/NHCS Fall 2011, Adults Full Year, Base: CA, A18+ and Most recently acquired vehicle was new. Question: Purchase Method of
vehicle most recently acquired.
Purchase Method of Hispanics Most Recently Acquired Vehicle
22

Source: Polk, New Vehicle Personal Registrations (Includes Leases) Enhanced Ethnic Data, CYE 2011, California 23
Hispanic
Total
African-American
Asian
Strong Lease Opportunity 2011 California Lease Penetration
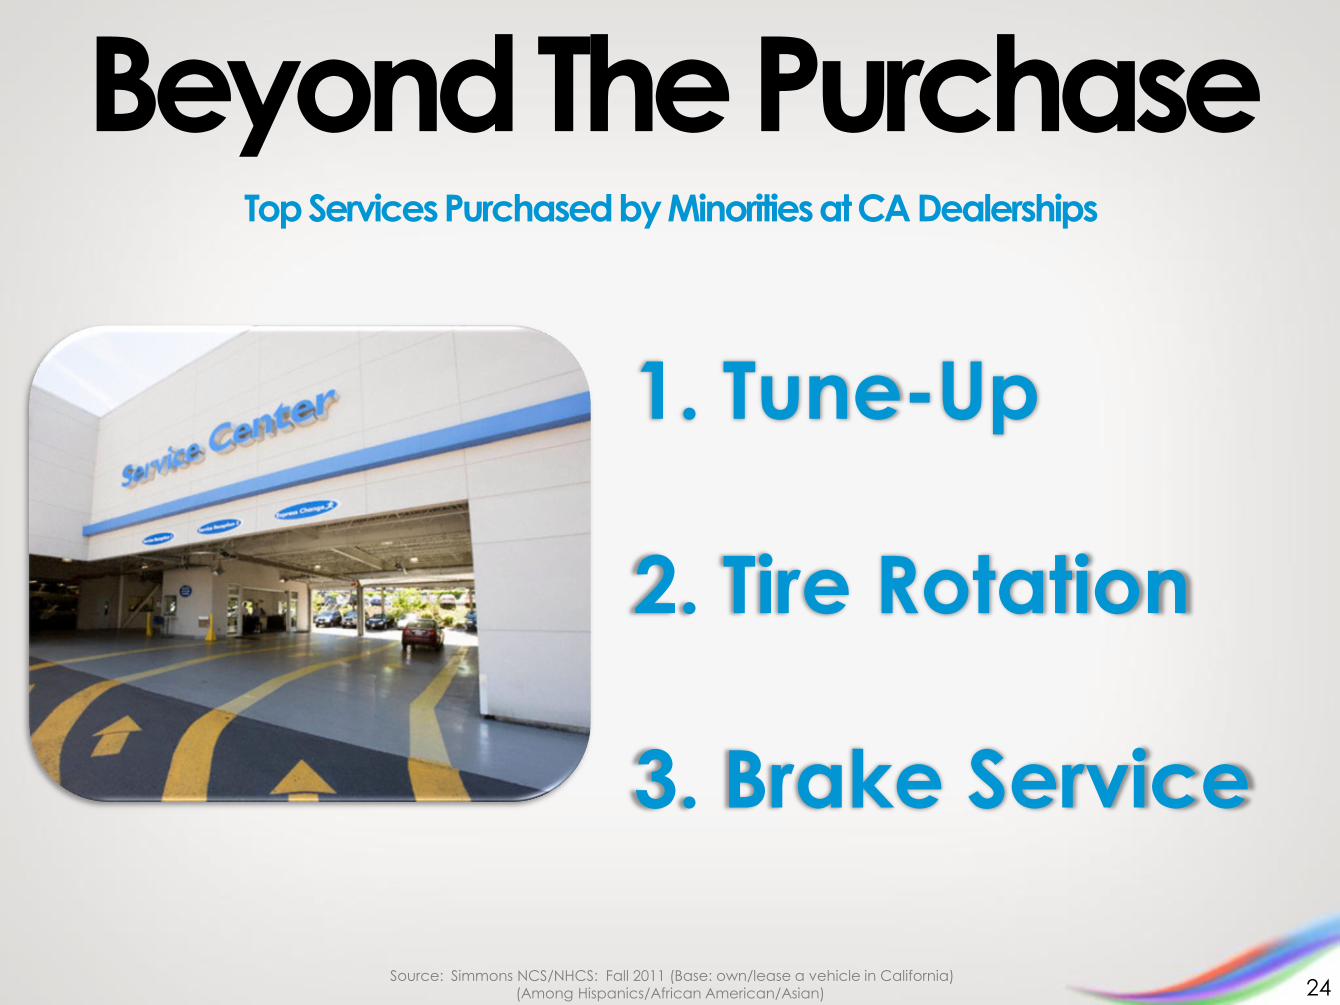
Beyond The Purchase
Source: Simmons NCS/NHCS: Fall 2011 (Base: own/lease a vehicle in California) (Among Hispanics/African American/Asian) 24
Top Services Purchased by Minorities at CA Dealerships
1. Tune-Up
2. Tire Rotation
3. Brake Service
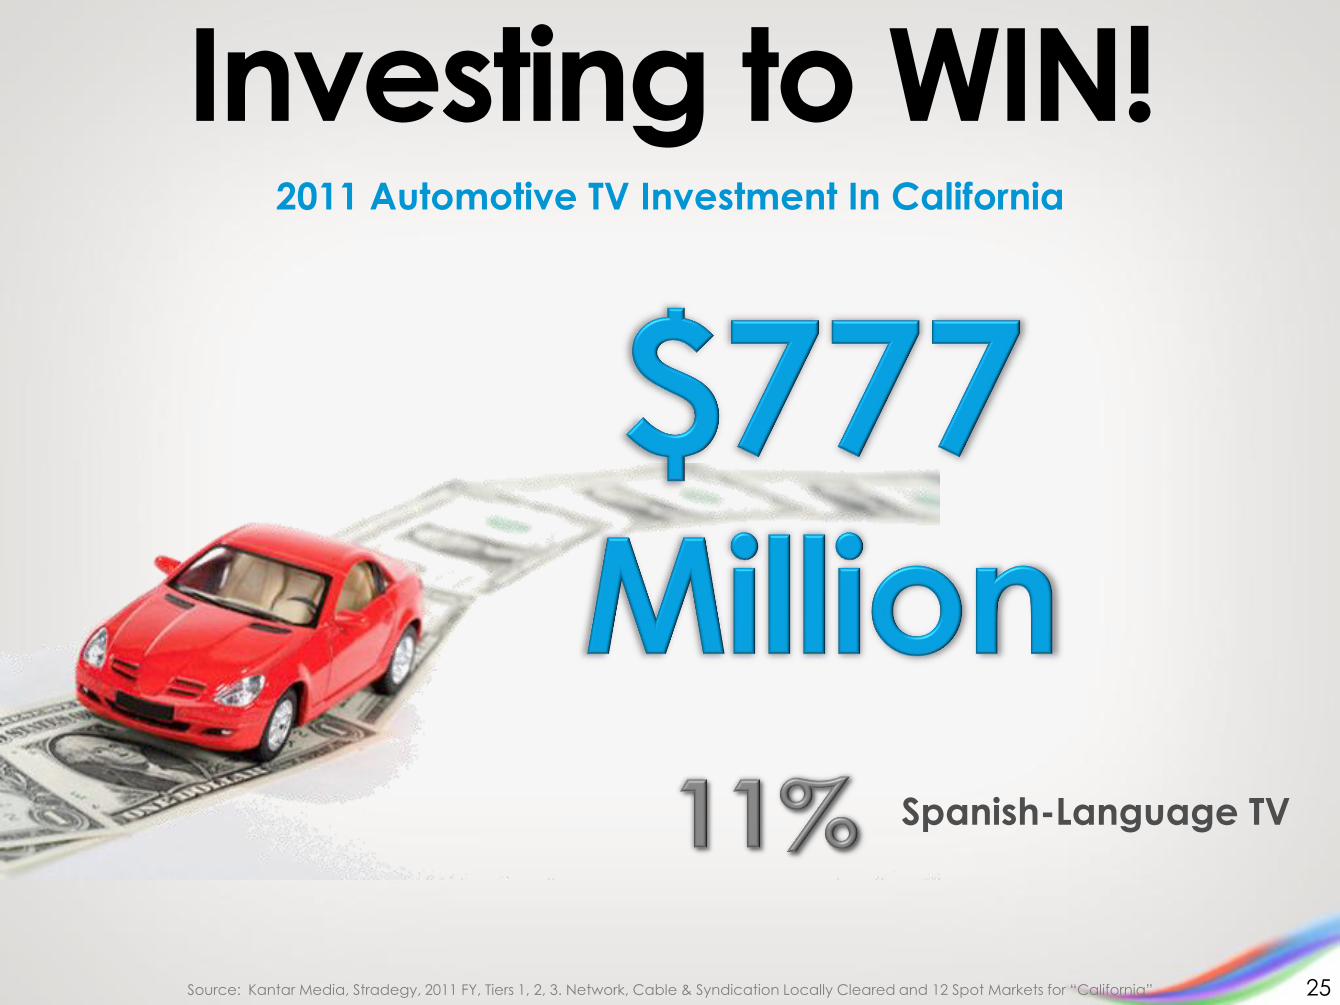
Source: Kantar Media, Stradegy, 2011 FY, Tiers 1, 2, 3. Network, Cable & Syndication Locally Cleared and 12 Spot Markets for “California”
2011 Automotive TV Investment In California
Investing to WIN!
25
Spanish-Language TV
26
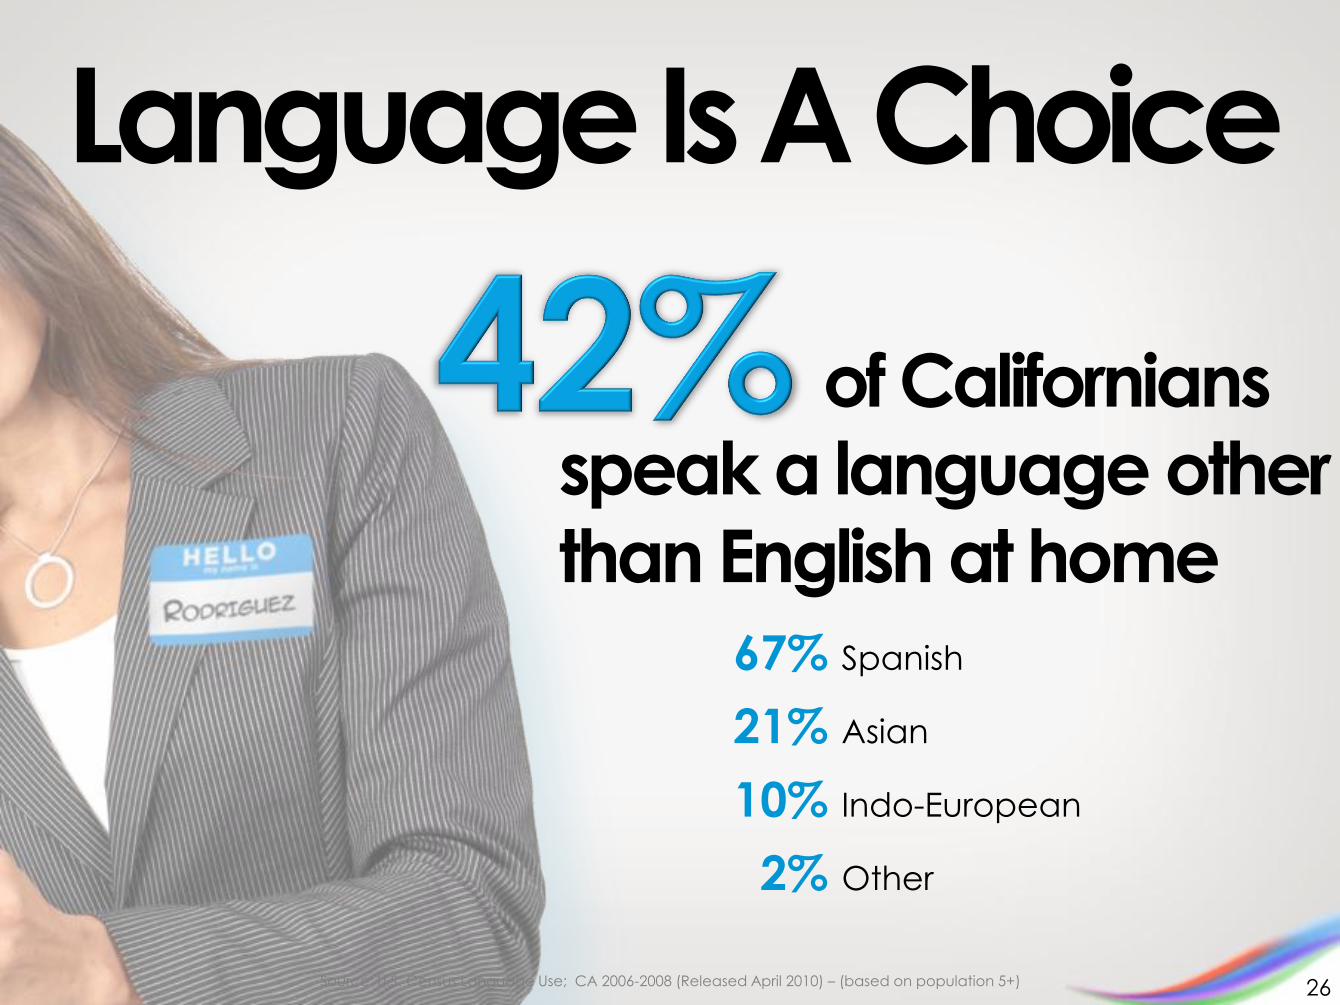
Language Is A Choice
of Californians
speak a language other
than English at home
Source: U.S. Census Language Use; CA 2006-2008 (Released April 2010) – (based on population 5+)
67% Spanish
21% Asian
10% Indo-European
2% Other

(In Millions)
Spanish Usage Growing
Source: Global Insights Hispanic Monitor 2011 – California Hispanic (based on population 5+) Number of Hispanics 5+ Who Speak Spanish at Home 27
2005
2010
2015
2020
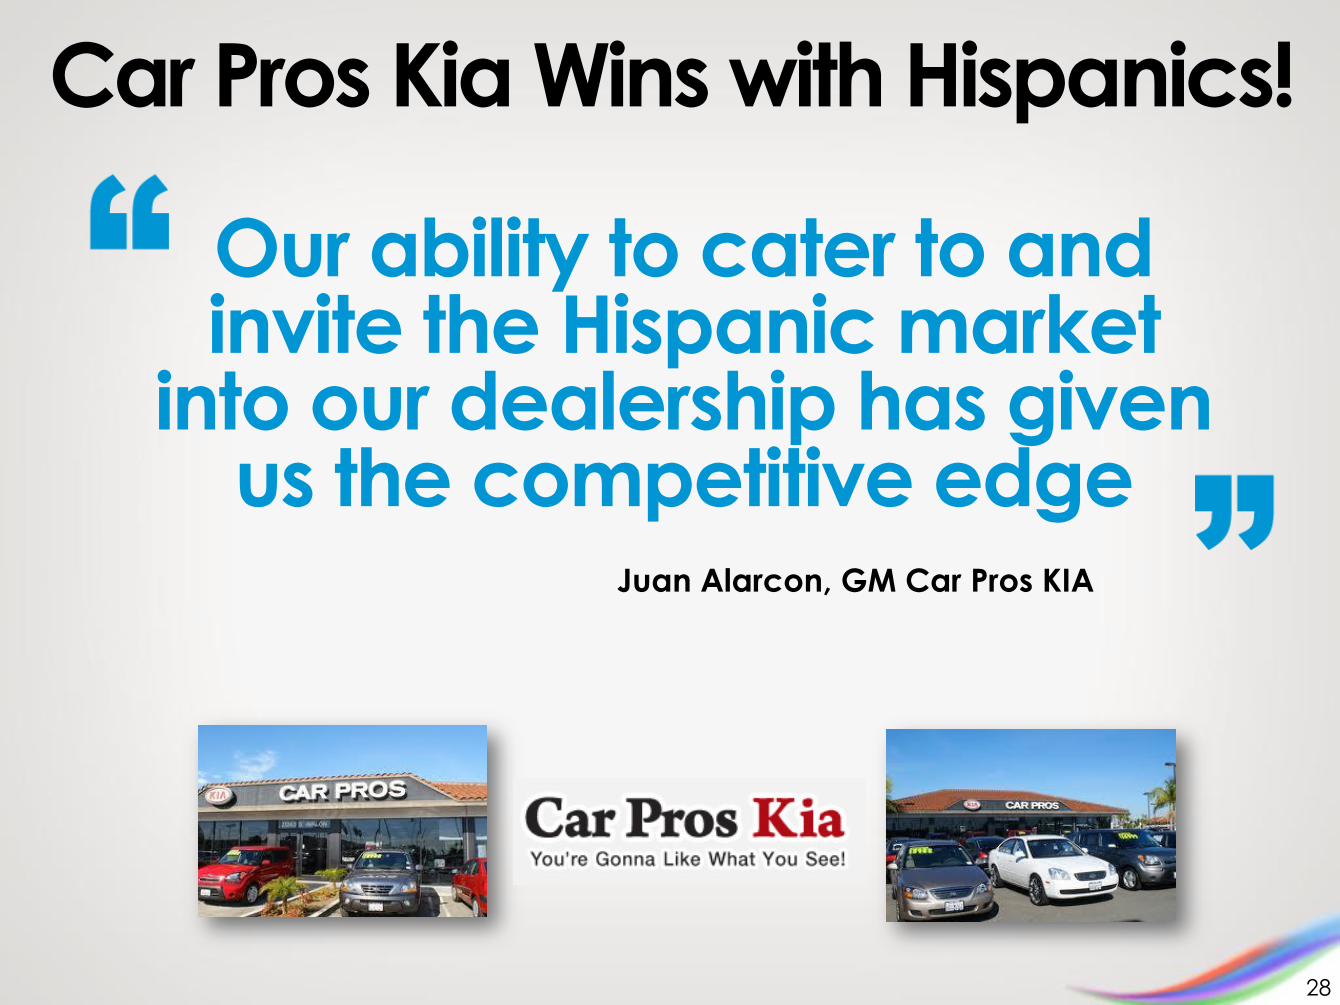
Juan Alarcon, GM Car Pros KIA
Our ability to cater to and invite the Hispanic market
into our dealership has given us the competitive edge
Car Pros Kia Wins with Hispanics!
28

Car Pros Kia Caters to Hispanics
75%+ % of Spanish Speaking Staff (Non-Hispanic Sales Staff are Spanish Capable)
25% Ad Budget Invested in Spanish
29

Investment in Spanish Media Delivers Sales Results
Source: Polk , New Vehicle Personal Retail Registrations (sales and leases). Enhanced Ethnic Data. CY11. Los Angeles DMA. www.carproskiacarson.com accessed 3/19/12
SEPT, OCT, DEC 2011 & FEB 2012
New Vehicle
Used Vehicle
Sales to Hispanics:
30
44%
39%
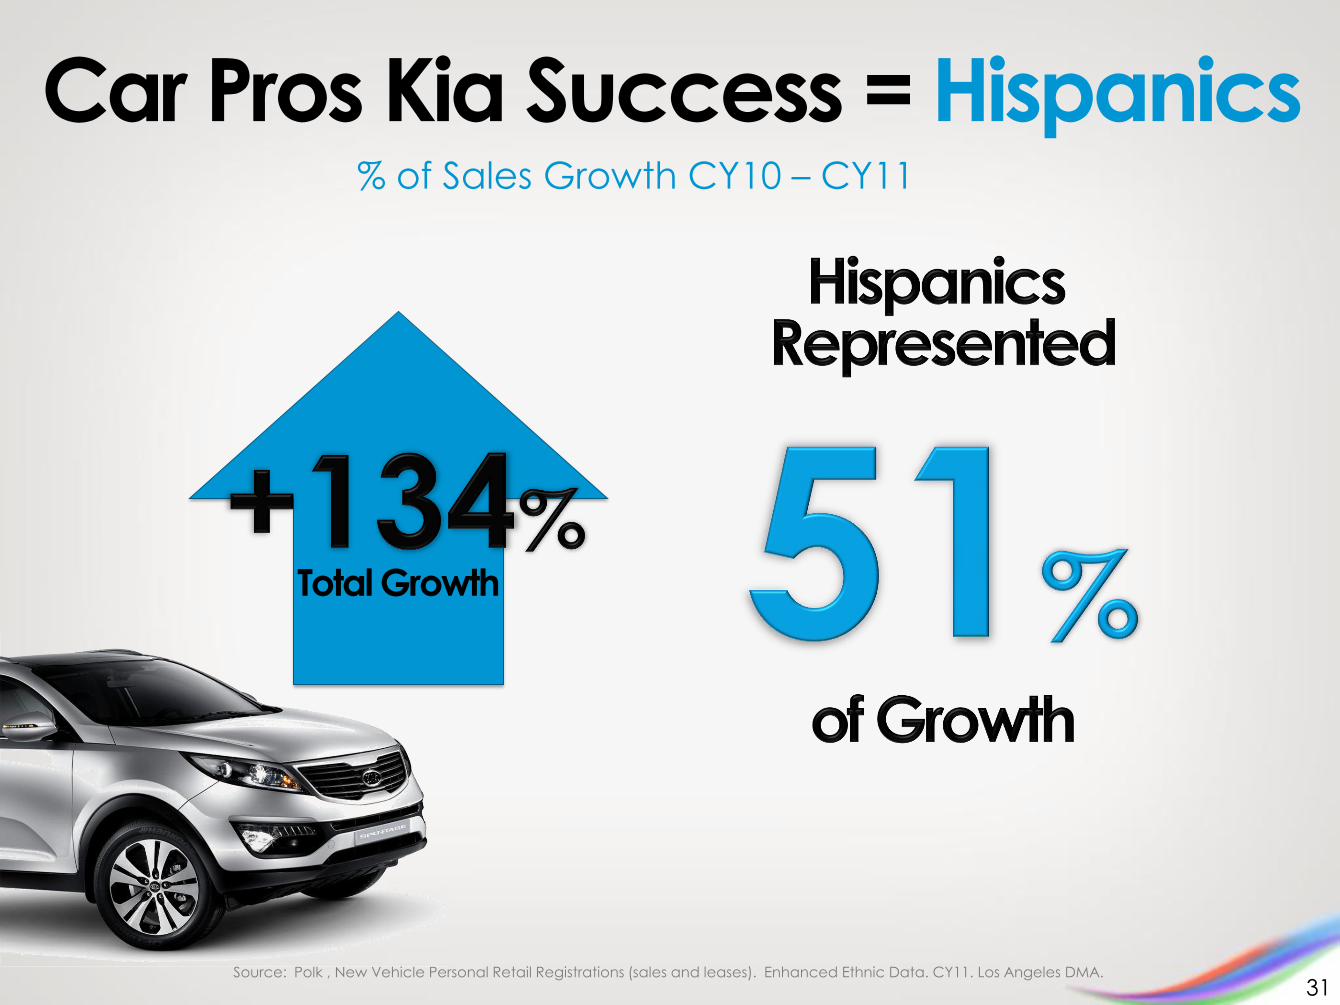
Car Pros Kia Success = Hispanics
Source: Polk , New Vehicle Personal Retail Registrations (sales and leases). Enhanced Ethnic Data. CY11. Los Angeles DMA.
Total Growth
31
% of Sales Growth CY10 – CY11

Create A
Minority
Advisory
Council
Incorporate
Minority
Strategy Into
All Stages Of
Business
Planning
Invest In
Culturally
Relevant
Research
Plan of Action Track and
Share
Results
Widely
32


Source: National Association of Minority Automobile Dealers, December 2011. Minority groups include: Asian, African-American and Hispanic, California
Minority-Owned Dealerships
Declined 26% in California
34

Asian
African-American
Minority
Group Pre-
Bankruptcy
December
2011
35 Source: National Association of Minority Automobile Dealers, December 2011. Minority groups include: Asian, African-American and Hispanic, California
%
Change
-23%
-60%
Total Minority
Groups -26%
Hispanic -15%
36
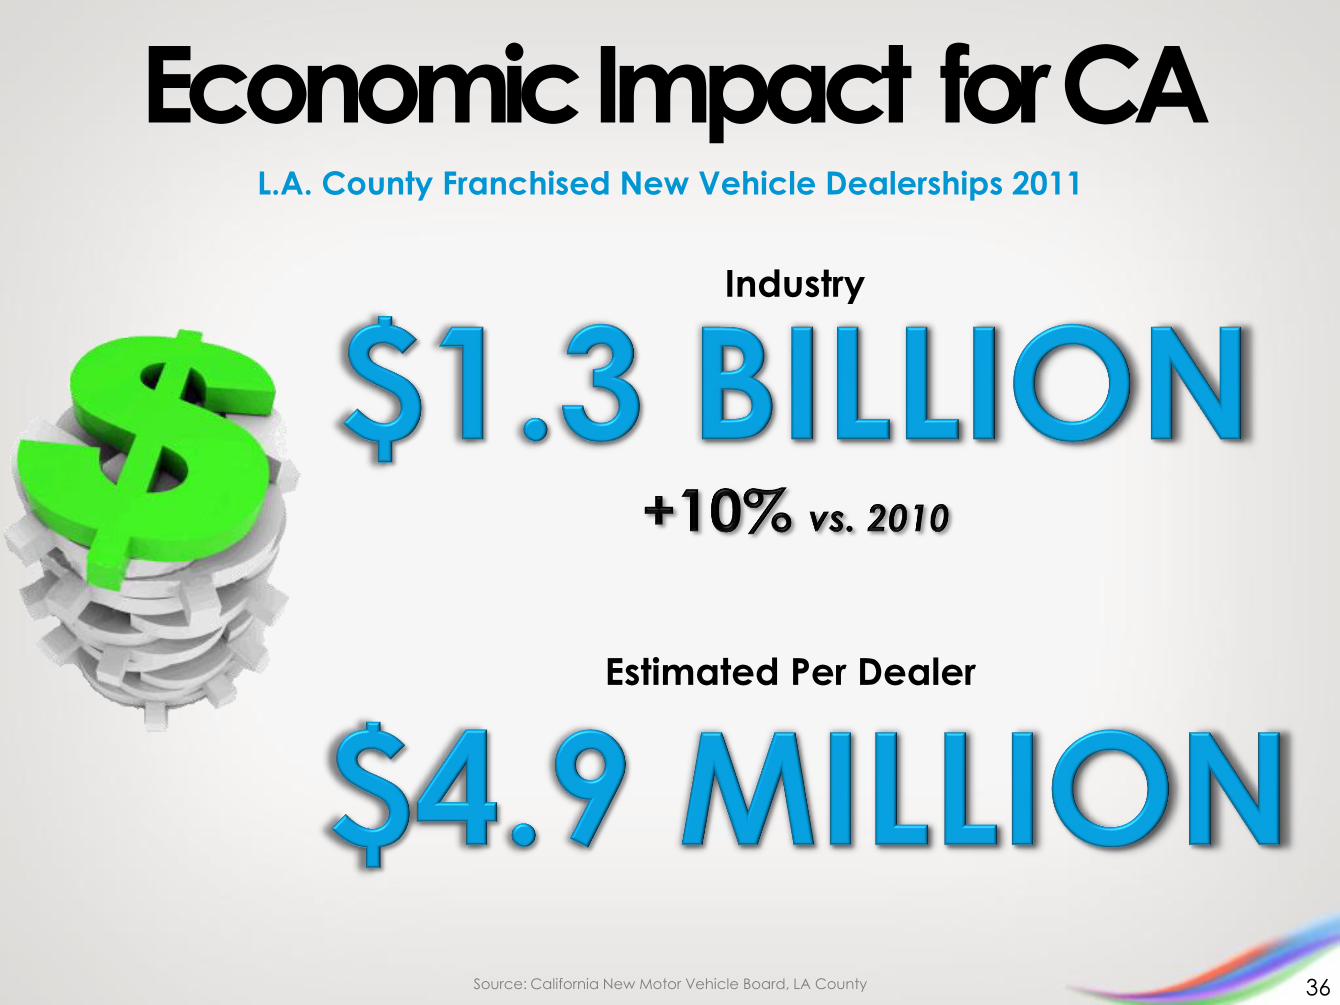
Economic Impact for CA L.A. County Franchised New Vehicle Dealerships 2011
Source: California New Motor Vehicle Board, LA County
Industry
Estimated Per Dealer
Impact on Minority Dealers in Light of Economic Climate
37
Panelists