drivers of metacommunity structure diverge for common and...
TRANSCRIPT

1
Drivers of metacommunity structure diverge for 1
common and rare Amazonian tree species 2
Polyanna da Conceição Bispo1,2*, Heiko Balzter1,2, Yadvinder Malhi3, J.W. Ferry Slik4, 3
João Roberto dos Santos5, Camilo Daleles Rennó6, Fernando D. Espírito-Santo7, LuizE. 4
O. C. Aragão5,8, Arimatéa C. Ximenes9, Pitágoras da Conceição Bispo10 5
1Leicester Institute for Space and Earth Observation, Centre for Landscape and Climate 6
Research, Department of Geography, University of Leicester, Leicester, UK 7
2NERC National Centre for Earth Observation at the University of Leicester, Leicester, 8
UK 9
3Environmental Change Institute, School of Geography and the Environment, University 10
of Oxford, Oxford, UK 11
4Faculty of Science, Universiti Brunei Darusallam, Gadong, Brunei 12
5 Divisão de Sensoriamento Remoto, Instituto Nacional de Pesquisas Espaciais, São José 13
dos Campos, São Paulo, Brazil 14
6 Divisão de Processamento de Imagens, Instituto Nacional de Pesquisas Espaciais, São 15
José dos Campos, São Paulo, Brazil 16
7Lancaster Environment Centre), Lancaster University, UK 17
8College of Life and Environmental Sciences, University of Exeter, UK 18
9Université Libre de Bruxelles, le Département de Biologie des Organismes, Brussels, 19
Belgium 20
10Department of Biological Sciences, Faculty of Sciences and Languages of Assis, State 21
University of São Paulo (UNESP), Assis, São Paulo, Brazil 22
* [email protected] 23

2
Abstract 1
We analysed the flora of 46 forest inventory plots (25m x 100m) in old growth 2
forests from Amazon region in order to identify the role of environmental (topography) 3
and spatial variables (obtained using Principal Coordinates of Neighborhood Matrix, 4
PCNM) for rare and common species. For the analyses, we used Multiple Partial 5
Regression in order to partition the specific effects of the topography and spatial variables 6
on the univariate data (standardised richness, total abundance and total biomass) and 7
partial RDA (Redundancy Analysis) for partitioning these effects on composition 8
(multivariate data) based on incidence data, abundance and biomass. Our results showed 9
that different attributes (richness, abundance, biomass and composition based in 10
incidence, abundance and biomass) used to study this metacommunity responded 11
differently to environmental and spatial processes. Considering standardised richness, 12
total abundance (univariate) and composition based on biomass, the results for common 13
species differ from those obtained for all species. On the other hand, for total biomass 14
(univariate) and for compositions based on incidence and abundance, there was 15
correspondence between the data obtained for the total community and for common 16
species. Except for total abundance, the environmental and spatial factors measured were 17
insufficient to explain the attributes of communities of rare species. These results indicate 18
that predicting the attributes of rare species tree communities based on environmental and 19
spatial factors is a huge challenge. Our data show that niche-related processes are 20
important; however, the spatial component is also important, possibly because of the mass 21
effect. As the spatial component was relevant for several community attributes, our results 22
demonstrate the importance of a metacommunities approach when attempting to 23
understand the main ecological processes underlying the diversity of forest communities 24
in the Amazon region. 25
Keywords: tropical forest, diversity, rarity, topography 26
27
28

3
Introduction 1
Throughout the history of ecology, researchers have sought to understand the 2
effects of environmental and spatial process on biodiversity. This quest has led to the 3
collection of a large number of datasets and the formulation of competing theories, such 4
as the niche and the neutral theories. Niche theory has been one of the most important 5
theoretical approaches in ecology and assumes that the combination of resources and 6
conditions determines the local characteristics of a community [1]. In this context, it is 7
expected that communities structured by niche-related processes have similar values of 8
local attributes (e.g. species richness, species abundance, biomass and composition) when 9
in similar habitat patches. In contrast, the neutral theory is based on functional 10
equivalence between species and considers dispersion and demographic stochasticity as 11
central phenomena [2,3]. According to the neutral theory, it is expected that similar values 12
for local attributes of a community in a particular patch can be determined by influence 13
from communities of nearby patches, stressing the importance of spatial variables. 14
Megadiverse tropical forests can be important model ecosystems for 15
understanding the relative roles of environmental and spatial variables on communities. 16
The endeavour to understand these roles may help clarifying the importance of different 17
processes in maintaining species diversity of these forests. Concerning the niche theory, 18
variables representative of topography are likely to play an important role in local 19
environmental conditions which may determine species diversity, functional and 20
structural attributes and composition of tree communities [4–7]. One advantage of using 21
topography in vegetation studies is that it can be assessed at large scales by remote 22
sensing. Moreover, it is considered a good surrogate to several important variables for 23
vegetation structure that would be difficult to measure on a larger scale, including nutrient 24
availability, soil moisture and texture, insolation, etc. [6]. 25
Despite their known importance, the influence of spatial process has long been 26
ignored in ecological studies, and until the 1990s, the main focus of ecology was the study 27
of niche-related processes [8]. Since the 1990s, the spatial process has been strongly 28
embedded in ecology [9]. Since then new methods and analytical strategies have been 29
proposed and empirical and theoretical data have been collected, generating a new body 30
of knowledge about the structuring factors of communities [10–12]. This knowledge, 31
4
along with other information (functional, phylogenetic, etc.), has provided a much more 1
detailed understanding of the processes involved in community structure [13–15], 2
supporting the search for better conservation and biodiversity monitoring strategies [16]. 3
Thus, understanding the role of spatial factors in community structure at different 4
landscape scales is essential, especially given the current scenario of rapid biodiversity 5
loss due to habitat degradation and fragmentation [17]. 6
Metacommunity theory recognises that communities are not isolated entities, but 7
they are connected by movements of individuals of different species [18,19]. Thus, the 8
metacommunity can be defined by groups of communities connected to each other by 9
dispersal of individuals. Metacommunity theory has benefited from discussions regarding 10
niche and neutral theory, and both have helped to understand the role of environmental 11
and spatial variables on the diversity and composition of the biota [18,19]. According to 12
the theory, the group of species occurring in a community is determined both by a 13
combination of local factors (interaction between species, interaction of species with local 14
factors) and by the ability of the species to reach that community (by dispersion) [18,20]. 15
In metacommunities structured by the principles of niche theory, it is expected that the 16
environmental component plays a more important role. On the other hand, in 17
metacommunities subject to the principles of neutral theory, it is expected that the spatial 18
component plays a more important role. The metacommunity theory encompasses four 19
main models (species sorting, mass effect, patch dynamics and neutral) which represent 20
points of a continuum formed by different combinations of environmental (niche) and 21
dispersal (spatial) processes [18,19,21,22]. 22
A remarkable feature of most communities is the presence of a few common 23
species and many rare species [23,24]. Rare and common species can respond to 24
ecological processes differentially [25], depending on the features of organisms (e.g. 25
competition and dispersion capacities) and spatial temporal dynamics. For example, 26
based on the niche theory, Tokeshi [8] proposed the composite niche model, arguing that 27
more than one process may be acting on the community. According to this model, rare 28
species should fit a random assortment model, while common species should fit any 29
model of niche apportionment. On the other hand, Siqueira et al. [24] studied 30
metacommunities of aquatic macroinvertebrates and showed that common and rare 31
species responded similarly and both were mainly structured by niche processes. 32

5
The analysis of different attributes of communities while considering groups of 1
common and rare species allows testing some hypotheses about the processes involved in 2
the structuring of metacommunities [24,26]. Empirical studies have shown that most of 3
the metacommunities are structured principally by niche processes [21,24]. Our first 4
hypothesis is that the niche processes are more important for structuring the 5
metacommunity studied [24], at least for the common species, which we expect to be 6
those most affected by competition [27]. In the case of rare species, as they can be more 7
affected by ecological drift [27], we expect spatial factors to be more relevant. Taking 8
into account that habitat generalist and habitat specialist species differ in terms of 9
population dynamics, we also propose an alternative hypothesis [24,28]. While generalist 10
species occupy habitats with a wide environmental variation, specialist species 11
preferentially occupy habitats with specific environmental characteristics, which are 12
generally rare in the landscape [28,29]. In this context, assuming that common species 13
are habitat generalists and rare species are habitat specialists, our alternative hypothesis 14
is that spatial factors are more important for common species, while environmental factors 15
are crucial for rare species [28]. 16
To test these hypotheses and to identify the role of environmental (topography) 17
and spatial variables for rare and common species, our aim was to analyse the flora of 46 18
forest inventory plots in the old growth forests of the eastern Amazon region. These 19
analyses were based on vegetation data collected in the field and topographic variables 20
obtained by remote sensing data. 21
Material and Methods 22
Study area 23
This study was conducted in the Tapajós National Forest (TNF). The TNF is a 24
large protected area of about 545,000 ha, located in Amazon biome, west of Pará State, 25
Brazil (Fig 1). This area has average annual temperature of 25.5°C and average annual 26
rainfall of 1,820 mm. The local topography ranges from flat to strongly undulating terrain. 27
Predominant soil types in the area are dystrophic oxisol (US classification) or dystrophic 28
yellow latosol (Brazil classification)) and red-yellow podzol. Vegetation is mainly 29
ombrophilous dense forest and ombrophilous open forest [30]. 30

6
Fig 1. Study area in the Tapajós National Forest (FNT), Pará State, Brazil with detail of 1
the five geomorphometric variables (elevation, slope, HAND, profile curvature and plan 2
curvature) of four areas where the 46 plots are distributed. 3
We sampled 46 forest inventory plots (Fig 1) of 25 x 100 m in TNF. Our plots 4
representing a sampling area of 11.5 ha. We installed the plots in different vegetal 5
typologies and topographies [5] using the phyto-ecologic classes from RADAM-BRASIL 6
project [31]. Our plots encompassed different floristic and geomorphological 7
characteristics [31]. We sampled and identify all individual trees with diameter at breast 8
height (dbh) ≥10 cm. The abundance was represented by number of individuals and 9
aboveground biomass (hereafter referred just as biomassa) was calculated by the 10
allometric equation [32], considering the measurements of DBH (diameter at breast 11
height) and TH (total height). 12
Biomass = 0.044 ∗ ((DBH2) ∗ TH)0.9719 13
Topographic data derived from SRTM 14
We used geomorphometric attributes (elevation, slope, profile curvature and plane 15
curvature) from Brazilian Geomorphometrics Database (TOPODATA) [33]. The 16
TOPODATA is based on SRTM (Shuttle Radar Topography Mission-version 1, NASA, 17
2006) and has different neighbourhood operations to calculate geomorphometric 18
variables [33]. The TOPODATA is free and the layers are easily accessible 19
(http://www.dsr.inpe.br/topodata/acesso.php). We also used the vertical distance to the 20
nearest drainage or HAND (height above the nearest drainage). Hand was derivate from 21
SRTM and describes the vertical distance of each point regarding the nearest drainage 22
channel detected by remote sensing [34]. All data used in this study has 30 m of spatial 23
resolution (Table 1). 24
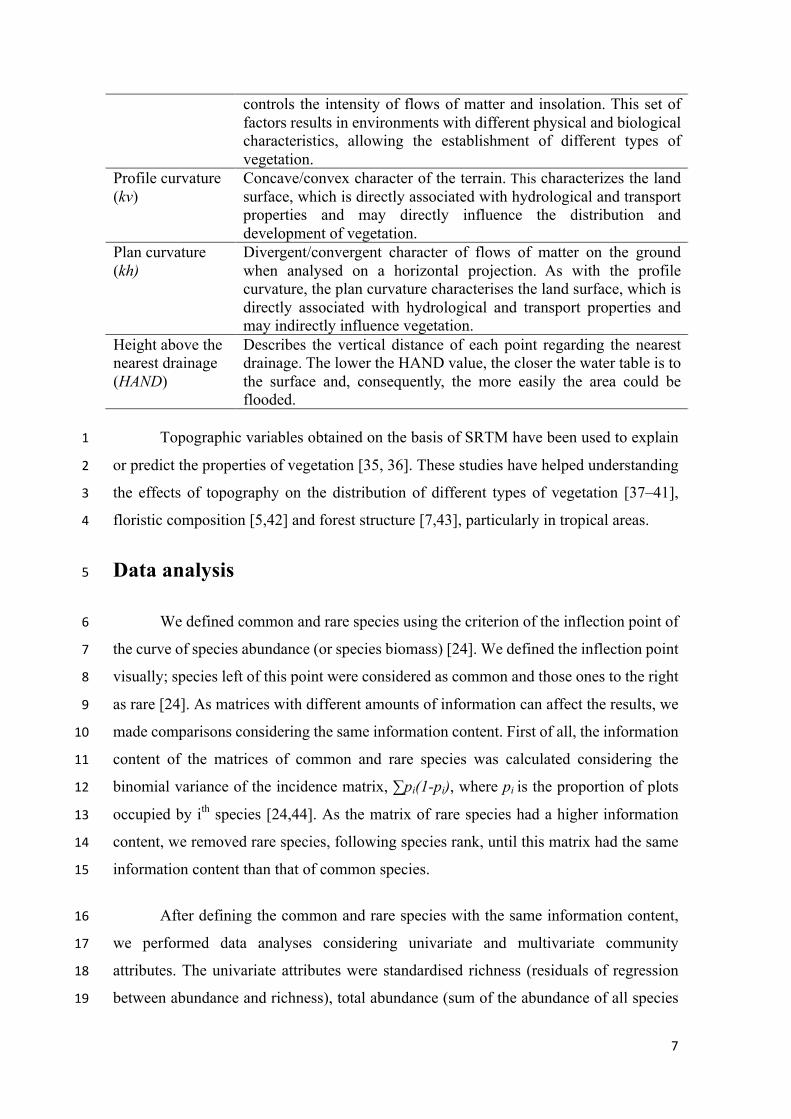
Table 1. Definitions of the topographic variables used in this study. 25
Topographic variables
Description
Elevation (h) Terrain altitude. This is related to the altitude distribution of soil and climate, determining different landscape vegetation patterns.
Slope (G) Inclination angle of the local surface. This has a direct effect on the balance between soil water infiltration and surface runoff and
7
controls the intensity of flows of matter and insolation. This set of factors results in environments with different physical and biological characteristics, allowing the establishment of different types of vegetation.
Profile curvature (kv)
Concave/convex character of the terrain. This characterizes the land surface, which is directly associated with hydrological and transport properties and may directly influence the distribution and development of vegetation.
Plan curvature (kh)
Divergent/convergent character of flows of matter on the ground when analysed on a horizontal projection. As with the profile curvature, the plan curvature characterises the land surface, which is directly associated with hydrological and transport properties and may indirectly influence vegetation.
Height above the nearest drainage (HAND)
Describes the vertical distance of each point regarding the nearest drainage. The lower the HAND value, the closer the water table is to the surface and, consequently, the more easily the area could be flooded.
Topographic variables obtained on the basis of SRTM have been used to explain 1
or predict the properties of vegetation [35, 36]. These studies have helped understanding 2
the effects of topography on the distribution of different types of vegetation [37–41], 3
floristic composition [5,42] and forest structure [7,43], particularly in tropical areas. 4
Data analysis 5
We defined common and rare species using the criterion of the inflection point of 6
the curve of species abundance (or species biomass) [24]. We defined the inflection point 7
visually; species left of this point were considered as common and those ones to the right 8
as rare [24]. As matrices with different amounts of information can affect the results, we 9
made comparisons considering the same information content. First of all, the information 10
content of the matrices of common and rare species was calculated considering the 11
binomial variance of the incidence matrix, ∑pi(1-pi), where pi is the proportion of plots 12
occupied by ith species [24,44]. As the matrix of rare species had a higher information 13
content, we removed rare species, following species rank, until this matrix had the same 14
information content than that of common species. 15
After defining the common and rare species with the same information content, 16
we performed data analyses considering univariate and multivariate community 17
attributes. The univariate attributes were standardised richness (residuals of regression 18
between abundance and richness), total abundance (sum of the abundance of all species 19
8
per plot) and total biomass (total biomass of all species per plot). The multivariate 1
attributes (species x plots) were represented by three different matrices of composition 2
(1. composition based on incidence; 2. composition based on abundance, and 3. 3
composition based on biomass) 4
The richness of species is usually positively correlated with abundance. As 5
abundance can explain part of the variation in richness, without due caution, we can 6
erroneously conclude that similar factors are important in explaining both community 7
attributes. Thus, disentangling the richness from abundance is necessary to understand 8
the real effect of topography on richness (free of abundance). For this reason, we used the 9
residuals of the regression between abundance and richness as standardised measure of 10
richness (standardised richness). In this case, the residuals indicate the part of variation 11
in richness that cannot be explained by abundance, in other words, richness free of 12
abundance. 13
In general, the community matrix based on abundance has many zeros, which is a 14
problem for multivariate analysis based on Euclidian distances, such as Principal 15
Components Analysis (PCA) and Redundancy Analysis (RDA). A strategy to minimise 16
this problem is using the Hellinger transformation [45]. Thus, in the case of composition 17
based on abundance, prior to analyses, we transformed the data matrix using the Hellinger 18
method [46]. 19
For the analyses, we used a multiple partial regression in order to partition the 20
specific effects of the topography and spatial variables on the univariate response 21
variables (standardised richness, abundance and total biomass) and partial RDA for 22
partitioning these effects on multivariate response matrices represented by incidence data, 23
abundance and biomass [10,47,48]. The RDA is a direct gradient analysis based on 24
multiple regression that deals with the variation in a multivariate response matrix (in our 25
case, composition based on incidence, abundance and biomass) and one or more matrices 26
of explanatory variables (in our case, topographic and spatial variables) [48]. 27
Spatial variables were obtained using the PCNM method (Principal Coordinates 28
of Neighborhood Matrix) [48]. The PCNM is based on Coordinates Principal Analysis 29
obtained from a geographic distance matrix. The eigenvectors (axes) obtained from this 30
analysis are called PCNMs, are uncorrelated and represent different spatial patterns, from 31

9
coarse (axes with higher eigenvalues) to more refined (axes with smaller eigenvalues) 1
[48,49]. Thus, in this paper, we extracted the spatial variables (PCNMs) from a Euclidean 2
distance matrix between plots, which were represented by eigenvectors with positive 3
eigenvalues and with spatial autocorrelation according to Moran’s I index [50]. For the 4
analyses, we selected variables using the forward selection method to evaluate only the 5
environmental and spatial variables that were more related to the studied metacommunity. 6
We assessed the following fractions: environmental (topography) component 7
independent of the space (a), environmental component inseparable of the spatial 8
component (b), spatial component independent of the environment (c) and component not 9
explained (d). As the coefficient of determination (R2) is influenced by the sample size 10
and number of predictor variables, we used the adjusted R2 to obtain the importance of 11
each assessed fraction [51]. We performed the analyses in the computing environment R 12
version 2.13 [52], associated with the PCNM package [53] to obtain the spatial variables, 13
Packfor [54] for variable selection and Vegan [55] for multiple regression and RDA. 14
Results 15
The results revealed that, when considering the inflection points of the abundance 16
curves, 22 species are considered common and 208 rare (Fig 2a). The 93 rarest species 17
have the same information content as the 22 most common species. When the inflection 18
of the curves of species biomass is considered, 35 species are considered common and 19
195 rare (Fig 2b). In this case, the 94 rarest species have the same information content as 20
the 35 most common species. 21
Fig 2. Rank of abundance (a) and rank of biomass (b) of Amazonian tree species of a 22
metacommunity of Tapajós National Forest, Pará State, Brazil. * indicate the rare species 23
with the same information content than common species. 24
Standardized richness, abundance and total biomass 25
Total standardised richness (without the abundance effect) and standardised 26
richness of rare species cannot be explained by any of the measured factors (topographic 27
or spatial variables) (Table 2). Nevertheless, standardised richness of common species is 28
significantly explained by topography (Table 2). The data also show that total abundance 29

10
is explained by spatial variables. Moreover, the abundance of common species is 1
significantly explained both by topographic and spatial variables, whereas rare species 2
are explained by topography (Table 2). The data show that in general, the topography 3
explains the total tree biomass, both for total and common species, but not for rare species 4
(Table 2). 5
Composition (incidence, abundance and biomass) 6
Our data reveal that topographic and spatial variables explained relevant 7
proportions of the variability, both when the analysis is based on an incidence matrix and 8
on an abundance matrix (Table 2), and both for total and common species (Table 2). 9
Topographic and spatial variables do not explain the variation of rare species (Table 2). 10
When the analysis is based on biomass, its variability is explained significantly by 11
topographic and spatial variables for total species, only by topography for common 12
species and by no factor for rare species (Table 2). 13
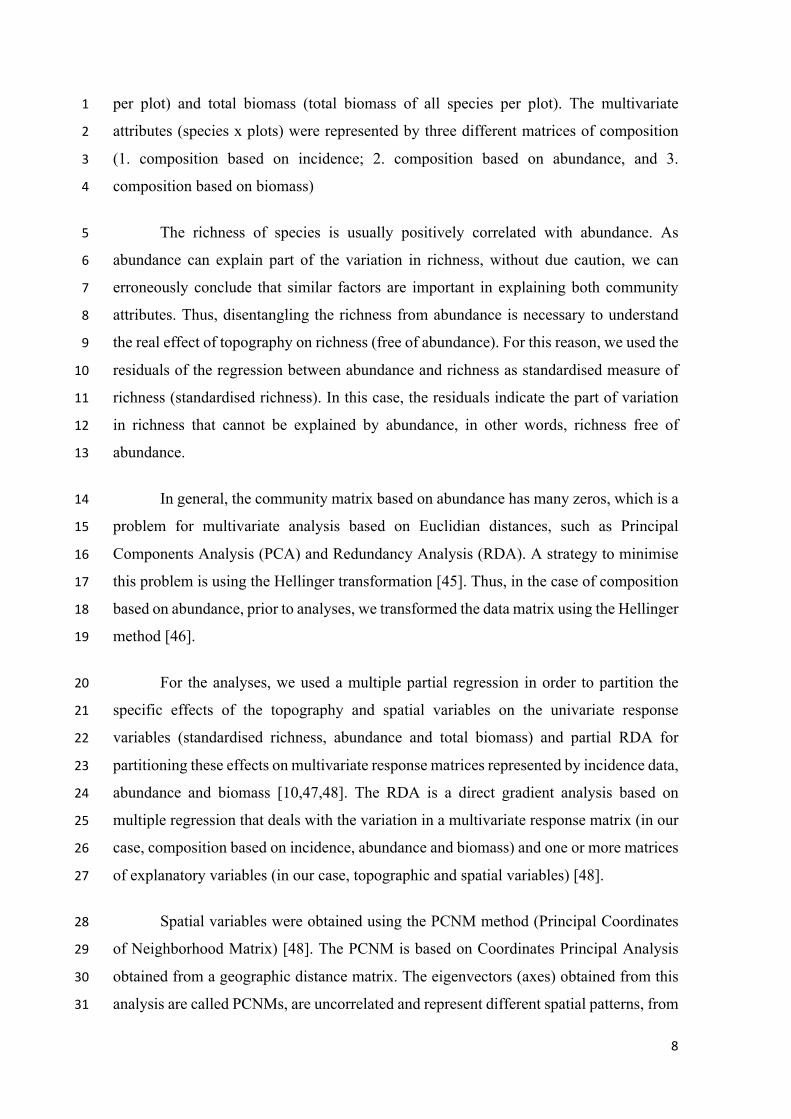
Table 2. Results of Partial Multiple Regression and Partial Redundancy Analysis with 14
the coefficient of determination (R2) for common and rare species. 15
Topography (%) Shared (%) Space (%) Not explained (%) Std Richness
Total - - - 100.00 Common (1-22) 10.4* - - 89.6 Rare (137-230) - - - 100.00
Abundance (Total)
Total - - 25.9** 74.1 Common (1-22) 11.4** - 10.3** 78.3 Rare (137-230) - - 26.3** 73.7
Biomass (Total)
Total 27.4*** 15.1 - 57.5 Common (1-35) 14.2** 12.5 - 73.3 Rare (136-230) - - - 100.00
C. Incidence Total 2.8*** 1.8 6.6*** 88.8 Common (1-22) 2.7** 2.7 5.4*** 89.2 Rare (137-230) - 0.9 0.3ns 98.8
C. Abundance
Total 6.2*** 0.4 10.4*** 83.0 Common (1-22) 5.1** 2.7 10.6*** 81.6
11
Rare (137-230) 0.1ns 0.8 0.4ns 98.7 C. Biomass
Total (1-230) 3.1** 3.2 1.6 92.1 Common (1-35) 4.0** 4.2 1.9ns 89.9 Rare (136-230) - - - 100.00
Topography refers to the effects of geomorphometric variables without spatial factors; 1shared refers to the effects of common variation between topographic and spatial factors; 2and space refers to the spatial effects (PCNMs) without topography. Common and rare 3species are delimited based on the inflection point species x abundance curve (in the case 4of abundance), or species x biomass curve (in the case of biomass). Numbers in 5parentheses refer to the rank position of the species. Std Richness (standardised richness, 6residuals of regression between abundance and richness); composition based on incidence 7(C. Incidence); composition based on abundance (C. Abundance) and composition based 8on biomass (C. Biomass). *p < 0.05; **p < 0.01; ***p < 0.001; ns non-significant. 9
Discussion 10
Our results show that different attributes (richness, abundance, biomass and 11
composition based on incidence, abundance and biomass) used to study this 12
metacommunity respond differently to environmental and spatial processes. This 13
indicates that the studied attributes represent different dimensions of the community and 14
that their analysis may provide insights about the main processes that structure the studied 15
metacommunity. Common and rare species differ in terms of biological traits [56–58] and 16
how they relate to environmental factors [28,29,59]. Our expectation was that the role of 17
environment and spatial variables differed between common and rare species. Our results 18
confirm our expectation, suggesting that common and rare species are subject to different 19
combinations of environmental and spatial variables and/or different ecological 20
processes. 21
The communities are composed of few common species and many rare species. 22
Due to the greater number of individuals, common species interact strongly with the 23
various components of the system. A common question is therefore whether the common 24
species are sufficient to describe the attributes (e.g. richness, abundance and composition) 25
of the whole community [44,59,60]. If this is the case, studies on communities could focus 26
on common species, which are more easily sampled. Most studies go in this direction, 27
since, in general, the results found for all species are equivalent to those found using only 28
common species [59–61]. Our results only partially confirm this expectation and show 29
that this depends on the analysed attribute. For example, for standardised richness, total 30

12
abundance (univariate) and for composition based on biomass, the results for common 1
species differ from those obtained for all species. However, for total biomass (univariate) 2
and for compositions based on incidence and abundance, there is a correspondence 3
between the data obtained for the total community and for common species. Thus, our 4
data suggest that for these last attributes, it is possible to draw appropriate conclusions 5
for a whole community based on common species. 6
Considering the standardised richness, our results are in disagreement with the 7
results of studies at different scales, which have shown that the richness patterns (total 8
community) can be predicted by richness of common species [43,62]. In our study, 9
topography only significantly explained the variability of common species, and neither 10
topographic nor spatial variables explained the variability of the total community or of 11
rare species. According to Lennon et al. [59], the richness of common species can be more 12
easily explained by simple environmental gradients when compared to the richness of 13
rare species. As the richness of rare species can be associated with rare environments 14
[29,59], it is harder to predict it. Thus, the absence of the effect of the environment on the 15
richness of rare species may be due to the fact that a part of the environmental factors 16
important for these species is not registered, since these must be associated to uncommon 17
niches [29], determined mainly by environmental factors that are difficult to measure. In 18
this context, our results show that on the scale of our study, part of the variation of the 19
standardised richness of common species can be predicted by the environmental gradient 20
(in our case, topography), which does not happen with rare species. 21
Total abundance (univariate) and biomass (univariate) were explained by different 22
processes when the total community, common species and rare species were considered. 23
For total abundance, in all combinations (total community, common and rare species), 24
spatial variables were important in explaining variability. These results show that spatial 25
processes determine a relevant part of total abundance variation, suggesting that the 26
effects of mass are important when abundance is considered. For common species, in 27
addition to spatial processes, the environmental variables were also important. In the case 28
of total biomass of the whole community, only environmental factors were important. 29
Topography influences other extremely important variables, such as soil texture, 30
availability of nutrients and water [4,63,64]. This may explain the results found. Our 31
observations may have practical consequences. For example, we have sought ways to 32

13
predict and monitor the biomass at larger scales, and this relationship with topography 1
can be important since it influences other extremely important factors for the 2
accumulation and maintenance of biomass. Therefore, topography can be a surrogate of 3
several variables difficult to be measured in building predictive models that facilitate 4
monitoring of the biomass and carbon stocks in tropical forests. 5
Considering the composition data based on incidence, abundance and biomass, 6
one of our initial expectations was that the niche-related factors were the most relevant to 7
explain data variability and that the studied metacommunity would follow the model 8
species sorting (SS) [21]. Our results showed that both topography and spatial variables 9
were relevant to explain variability, both for total and for common species (except for 10
biomass, which was explained only by environmental processes). These results suggest 11
that within the range studied, data fit the model species sorting (SS) + mass effect (ME). 12
The SS and SS + ME have been the most frequently adjusted models to empirical data. 13
For example, Cottenie [21] studied 158 metacommunities and found that 44% of them fit 14
the SS model and 29% the SS + ME model. These patterns (SS or SS + ME) have been 15
confirmed by most studies since Cottenie [21]. It is important to point out that the 16
inclusion of other relevant environmental variables could increase the percentage of 17
explanation of the environment and reduce the importance of spatial variables, whose 18
effects may be a reflection of both mass effects and dispersion difficulties, as well as 19
responses to no measured environmental factors [11]. Therefore, many SS + ME results 20
observed in the literature may indeed be SS, since many important variables may not have 21
been measured, suggesting that niche processes are highly relevant in structuring 22
metacommunities. 23
The data presented here show that the ecological processes underlying 24
composition based on incidence, abundance and biomass differ between common and 25
rare species, agreeing with Tsang & Bonebrake [61], which studied the composition of 26
butterflies. On the other hand, this result disagrees with other data for different organisms 27
(e.g. aquatic macroinvertebrates [24,60] and macrophytes [26]), which show that 28
common and rare species are governed by the same processes, in these cases by processes 29
related to the niche. Specifically for vegetation, Wang et al. [65], studying the effects of 30
topography on the species composition of a subtropical forest, also verified that the 31
environmental factors are important determinants of the variation of the composition of 32
14
common and rare species. On the other hand, this relation was much weaker for rare 1
species. Our initial hypothesis was that the composition of rare species could be explained 2
by the environment or by spatial factors. Our results refute this hypothesis, since none of 3
the components (environmental or spatial) explained the variation of the composition of 4
rare species. This may be a reflection of stochastic factors and of the non-inclusion of 5
specific variables important for rare species. 6
In this study, we found that much of the variability was neither explained by 7
environment (represented by the topography) nor by space. This is a relatively common 8
result in studies of metacommunities [10,12]. Two main factors can help explain this 9
common result: 1) there are a lot of environmental factors in tropical forests that affect 10
the biota, and often only one portion of them is measured, in our case, notably factors 11
related to topography; 2) tropical forests have a large number of biotic interactions which, 12
despite having the potential to affect the biota structure, are impossible to be measured to 13
capture their complexity. Thus, the proportion of unexplained variability is probably due 14
to stochastic and unmeasured factors. Baldeck et al. [11] showed that in addition to 15
topography, the inclusion of variables such as nutrients can improve a model’s 16
explanatory power. Thus, despite the topography being a good substitute for other 17
variables that are difficult to measure, the inclusion of additional relevant variables should 18
decrease the proportion of unexplained variability by the model. 19
Our results revealed that for the common species, the variation of the attributes 20
measured was explained by topography and/or spatial variables. On the other hand, except 21
for total abundance, none of the factors measured explained the measured attributes of 22
the rare species. These results indicate that predicting the attributes of rare species tree 23
communities from environmental and spatial variables is a huge challenge. Our data show 24
that niche-related processes are important; however, the spatial component, possibly 25
because of the mass effect, was also important. As the spatial component was important 26
for several community attributes, our results demonstrate the importance of a 27
metacommunity approach when attempting to understand the main ecological processes 28
underlying the diversity of forest communities in the Amazon region. 29
30

15
Authorization for the field work 1
The study was carried out in the Tapajós National Forest (TNF) and dendrometric 2
measurements (diameter at breast height and height) as well as botanical identification of 3
the trees were done, just inside of this area. The authorization to carry out the field work 4
at TNF was provided by the Instituto Chico Mendes de Conservação da Biodiversidade-5
ICMBio/MMA (SISBIO n. 20591–1). This study did not involve endangered or protected 6
species and no biological samples were taken. 7
Funding 8
PCB was supported by European Union’s Horizon 2020 research and innovation 9
programme under the Marie Skłodowska-Curie grant agreement N° 660020 (‘MF-10
RADAR’). HB was supported by Royal Society Wolfson Research Merit Award 11
(2011/R3) and by the Natural Environment Research Council’s National Centre for Earth 12
Observation. PITCB, JRS and LEOCA were supported by CNPq National Council for 13
Scientific and Technological Development) productivity fellowships (grants 14
305275/2014-3, 303228/2013-0 and 305054/2016-3, respectively). FES wassupported by 15
Natural Environment Research Council (NERC) grants (‘BIO-RED’ NE/N012542/1 and 16
‘AFIRE’ NE/P004512/1) and Newton Fund (‘The UK Academies/FAPESP Proc. N°: 17
2015/50392-8 Fellowship and Research Mobility’). 18
Acknowledgments 19
The authors acknowledge Brazil’s National Institute for Space Research (INPE) 20
and INPA-NAPPA/LBA/Santarém for logistic support during the field work, and 21
ICMBio/MMA for provide the authorization (SISBIO n. 20591-1) to carry out the field 22
work at Tapajós National Forest. The authors also thank Erly Pedroso (in memoriam) for 23
assisting during the field campaign and Dr. Márcio de Morisson Valeriano (INPE) and 24
his team for having developed and made available the TOPODATA (Brazilian 25
Geomorphometrics Database). 26
27

16
References 1
1. Hutchinson GE. Population studies - animal ecology and demography - concluding 2
remarks. Cold Spring Harbor Symposia on Quantitative Biology. 1957; 22: 415–3
427. 4
2. Hubbell SP. The Unified Neutral Theory of Biodiversity and Biogeography. 5
Monographs in Population Biology 32. Princeton University Press 2001, 375 pp.; 6
ISBN 0-691-02128-7 7
3. Hubbell SP. Neutral theory in community ecology and the hypothesis of functional 8
equivalence. Functional Ecology. 2005; 19: 166–172. doi:10.1111/j.0269-9
8463.2005.00965.x 10
4. Castilho C V, Magnusson WE, Araújo RNO, Luizão RCC, Luizão FJ, Lima AP, 11
et al. Variation in aboveground tree live biomass in a central Amazonian Forest: 12
Effects of soil and topography. Forest Ecology and Management. 2006; 234: 85–13
96. doi:10.1016/j.foreco.2006.06.024 14
5. Bispo PC, Valeriano MM, Santos JR. Effects of the geomorphometric 15
characteristics of the local terrain on floristic composition in the central Brazilian 16
Amazon. Austral Ecology. 2012; 37: 491–499. doi:10.1111/j.1442-17
9993.2011.02310.x 18
6. Liu J, Yunhong T, Slik JWF. Topography related habitat associations of tree 19
species traits, composition and diversity in a Chinese tropical forest. Forest 20
Ecology and Management. 2014; 330: 75–81. doi:10.1016/j.foreco.2014.06.045 21
7. Bispo PC, Santos JR, Valeriano MM, Graça PMLA, Balzter H, França H, et al. 22
Predictive models of primary tropical forest structure from geomorphometric 23
variables based on SRTM in the Tapajós region, Brazilian Amazon. PLoS One. 24
2016;11. doi:10.1371/journal.pone.0152009 25
8. Tokeshi M. Niche Apportionment or Random Assortment: Species Abundance 26
Patterns Revisited. Journal of Animal Ecology 1990; 59: 1129–1146. 27
doi:10.2307/5036 28
17
9. Legendre P. Spatial autocorrelation: trouble or new paradigm? Ecology. 1993. pp. 1
1659–1673. doi:10.2307/1939924 2
10. Beisner BE, Peres-Neto PR, Lindström ES, Barnett A, Longhi ML. The role of 3
environmental and spatial processes in structuring lake communities from bacteria 4
to fish. Ecology. 2006; 87: 2985–2991. doi:10.1890/0012-5
9658(2006)87[2985:TROEAS]2.0.CO;2 6
11. Baldeck CA, Harms KE, Yavitt JB, John R, Turner BL, Navarrete H, et al. Soil 7
resources and topography shape local tree community structure in tropical forests 8
Soil resources and topography shape local tree community structure in tropical 9
forests. Proceedings of the Royal Society London B Biol Sci. 2013; 280: 10
20122532. doi:10.1098/rspb.2012.2532 11
12. Branco CCZ, Bispo PC, Peres CK, Tonetto AF, Branco LHZ. The roles of 12
environmental conditions and spatial factors in controlling stream macroalgal 13
communities. Hydrobiologia. 2014; 732: 123–132. doi:10.1007/s10750-014-1852-14
2 15
13. Leibold MA, Economo EP, Peres-Neto P. Metacommunity phylogenetics: 16
Separating the roles of environmental filters and historical biogeography. Ecology 17
Letters. 2010; 13: 1290–1299. doi:10.1111/j.1461-0248.2010.01523.x 18
14. Spasojevic MJ, Copeland S, Suding KN. Using functional diversity patterns to 19
explore metacommunity dynamics: A framework for understanding local and 20
regional influences on community structure. Ecography (Cop). 2014; 37: 939–949. 21
doi:10.1111/ecog.00711 22
15. Saito VS, Soininen J, Fonseca-Gessner AA, Siqueira T. Dispersal traits drive the 23
phylogenetic distance decay of similarity in Neotropical stream metacommunities. 24
Journal of Biogeography. 2015; 42: 2101–2111. doi:10.1111/jbi.12577 25
16. Siqueira T, Bini LM, Roque FO, Cottenie K. A metacommunity framework for 26
enhancing the effectiveness of biological monitoring strategies. PLoS One. 2012. 27
doi:10.1371/journal.pone.0043626 28
18
17. Barlow J, Lennox GD, Ferreira J, Berenguer E, Lees AC, Nally RM, Thomson JR, 1
Ferraz SFDB.; Louzada J, Oliveira VHF, et al. Anthropogenic disturbance in 2
tropical forests can double biodiversity loss from deforestation. Nature. 2016; 535: 3
144–147.doi:10.1038/nature18326. 4
18. Leibold MA, Holyoak M, Mouquet N, Amarasekare P, Chase JM, Hoopes MF, et 5
al. The metacommunity concept: A framework for multi-scale community 6
ecology. Ecology Letters. 2004. pp. 601–613. doi:10.1111/j.1461-7
0248.2004.00608.x 8
19. Logue JB, Mouquet N, Peter H, Hillebrand H. Empirical approaches to 9
metacommunities: a review and comparison with theory. Trends in Ecology & 10
Evolution. 2011; 26: 482–91. doi:10.1016/j.tree.2011.04.009 11
20. Santos AS, Saraiva DD, Müller SC, Overbeck GE. Interactive effects of 12
environmental filtering predict beta-diversity patterns in a subtropical forest 13
metacommunity. Perspectives in Plant Ecology, Evolution and Systematics. 14
Elsevier GmbH.; 2015; 17: 96–106. doi:10.1016/j.ppees.2015.01.002 15
21. Cottenie K. Integrating environmental and spatial processes in ecological 16
community dynamics. Ecology Letters. 2005; 8: 1175–1182. doi:10.1111/j.1461-17
0248.2005.00820.x 18
22. Alexander HM, Foster BL, Ballantyne F, Collins CD, Antonovics J, Holt RD. 19
Metapopulations and metacommunities: Combining spatial and temporal 20
perspectives in plant ecology. Journal of Ecology. 2012; 100: 88–103. 21
doi:10.1111/j.1365-2745.2011.01917.x 22
23. Spitale D. A Comparative Study of Common and Rare Species in Spring Habitats. 23
Ecoscience. 2012; 19: 80–88. doi:10.2980/19-1-3435 24
24. Siqueira T, Bini LM, Roque FO, Marques Couceiro SR, Trivinho-Strixino S, 25
Cottenie K. Common and rare species respond to similar niche processes in 26
macroinvertebrate metacommunities. Ecography (Cop). 2012; 35: 183–192. 27
doi:10.1111/j.1600-0587.2011.06875.x 28
19
25. László Z, Rákosy L, Tóthmérész B. Landscape and local variables benefit rare 1
species and common ones differently. Journal of Insect Conservation. 2014; 18: 2
1203–1213. doi:10.1007/s10841-014-9734-5 3
26. Alahuhta J, Johnson LB, Olker J, Heino J. Species sorting determines variation in 4
the community composition of common and rare macrophytes at various spatial 5
extents. Ecological Complexity. 2014; 20: 61–68. 6
doi:10.1016/j.ecocom.2014.08.003 7
27. Chase JM, Amarasekare P, Cottenie K, Gonzalez A, Holt RD, Holyoak M, et al. 8
Competing theories for competitive metacommunities. In Holyoak M, Leibold 9
MA, Holt RD, eds. Metacommunities spatial dynamics and ecological 10
communities. 2005. pp. 335–354. Chicago University Press, Chicago. 11
28. Pandit SN, Kolasa J, Cottenie K. Contrasts between habitat generalists and 12
specialists: An empirical extension to the basic metacommunity framework. 13
Ecology. 2009; 90: 2253–2262. doi:10.1890/08-0851.1 14
29. Markham J. Rare species occupy uncommon niches. Scientific Reports. 2014; 4: 15
6012. doi:10.1038/srep06012 16
30. Veloso HP, Rangel Filho ALR, Lima JCA. Classificação da Vegetação Brasileira 17
Adaptada a um Sistema Universal. Rio de Janeiro, IBGE, Departamento de 18
Recursos Naturais e Estudos Ambientais. 1991. doi:ISBN 85-240-0384-7 19
31. RADAMBRASIL Departamento Nacional de Produção Mineral. No TitleFolha 20
AS.21- Santarém. Geologia, geomorfologia, pedologia, vegetação e uso potencial 21
da terra. Rio de Janeiro: DNPM (Levantamento dos Recursos Naturais v. 10). 22
1976. 23
32. Brown S, Gillespie AJR, LUGO A. E. Biomass estimation methods for tropical forest 24
with applications to forest inventory data. Forest Science, 1989; 35: (4): 881-902. 25
33. Valeriano MM, Rossetti DF. Topodata: Brazilian full coverage refinement of 26
SRTM data. Applied Geography. 2012; 32: 300–309. 27
doi:10.1016/j.apgeog.2011.05.004 28

20
34. Rennó CD, Nobre AD, Cuartas LA, Soares JV, Hodnett MG, Tomasella J, et al. 1
HAND, a new terrain descriptor using SRTM-DEM: Mapping terra-firme 2
rainforest environments in Amazonia. Remote Sensing of Environment. 2008; 3
112: 3469–3481. doi:10.1016/j.rse.2008.03.018 4
35. Kellndorfer J, Walker W, Pierce L, Dobson C, Fites JA, Hunsaker C, et al. 5
Vegetation height estimation from Shuttle Radar Topography Mission and 6
National Elevation Datasets. Remote Sensing of Environment. 2004; 93: 339–358. 7
doi:10.1016/j.rse.2004.07.017 8
36. Simard M, Rivera-Monroy VH, Mancera-Pineda JE, Castañeda-Moya E, Twilley 9
RR. A systematic method for 3D mapping of mangrove forests based on Shuttle 10
Radar Topography Mission elevation data, ICEsat/GLAS waveforms and field 11
data: Application to Ciénaga Grande de Santa Marta, Colombia. Remote Sensing 12
of Environment. 2008; 112: 2131–2144. doi:10.1016/j.rse.2007.10.012 13
37. Bispo, P C, Valeriano, M M, Kuplich TM. Variáveis geomorfométricas locais e 14
suarelação com a vegetação da região do interflúvio Madeira-Purus (AM-RO). 15
Acta Amazonica. 2009; 39: 81–90. 16
38. Bispo PC, Valeriano MM, Kuplich TM. Relação da vegetação de caatinga com a 17
condição geomorfométrica local. Revista Brasileira de Engenharia Agrícola e 18
Ambiental. 2010; 14: 523–530. doi:10.1590/S1415-43662010000500010 19
39. Bispo PC, Valeriano MM, Kuplich TM. Relação entre as variáveis morfométricas 20
extraídas de dados SRTM (Shuttle Radar Topography Mission) e a vegetação do 21
Parque Nacional de Brasília. Acta Botanica Brasilica. 2010; 24: 96–103. 22
doi:10.1590/S0102-33062010000100010 23
40. Muñoz V, Valeriano MM, Bispo P. Surveying the Topographic Height from 24
SRTM Data for Canopy Mapping in Brazilian Pantanal. Geografia. 2013; 38: 139–25
155. Available: 26
http://www.geopantanal.cnptia.embrapa.br/publicacoes/4geo/p10_139-155.pdf 27
41. Guadagnin PMA, Trentin R, Alves FDS. Relação entre as variáveis 28
Geomorfométricas e a Vegetação Florestal na Bacia Hidrográfica do Arroio 29

21
Caverá - Oeste do RS. Revista do Departamento de Geografia – USP. 2015; 29: 1
246. doi:10.11606/rdg.v29i0.102131 2
42. Guitet S, Pélissier R, Brunaux O, Jaouen G, Sabatier D. Geomorphological 3
landscape features explain floristic patterns in French Guiana rainforest. 4
Biodiversity and Conservation. 2015; 24: 1215–1237. doi:10.1007/s10531-014-5
0854-8 6
43. Bispo PC, Santos JR, Valeriano MM, Touzi R, Seifert FM. Integration of 7
polarimetric PALSAR attributes and local geomorphometric variables derived 8
from SRTM for forest biomass modeling in central Amazonia. Canadian Journal 9
of Remote Sensing. 2014; 40: 26–42. doi:10.1080/07038992.2014.913477 10
44. Lennon JJ, Koleff P, Greenwood JJD, Gaston KJ. Contribution of rarity and 11
commonness to patterns of species richness. Ecology Letters. 2004; 7: 81–87. 12
doi:10.1046/j.1461-0248.2004.00548.x 13
45. Legendre P, Gallagher ED. Ecologically meaningful transformations for 14
ordination of species data. Oecologia. 2001; 129: 271–280. 15
doi:10.1007/s004420100716 16
46. Borcard D, Gillet F, Legendre, Legendre P. Numerical Ecology with R. Springer. 17
2011. doi:10.1017/CBO9781107415324.004 18
47. Borcard D, Legendre P, Drapeau P. Partialling out the spatial component of 19
ecological variation. Ecology. 1992. pp. 1045–1055. doi:10.2307/1940179 20
48. Legendre P, L. L. Numerical ecology, 2nd English Edition. Numerical ecology,. 21
1998. doi:10.1017/CBO9781107415324.004 22
49. Griffith DA, Peres-Neto PR. Spatial modeling in ecology: The flexibility of 23
eigenfunction spatial analyses. Ecology. 2006; 87: 2603–2613. doi:10.1890/0012-24
9658(2006)87[2603:SMIETF]2.0.CO; 2 25
50. Borcard D, Legendre P. All-scale spatial analysis of ecological data by means of 26
principal coordinates of neighbor matrices. Ecological Modelling. 2002; 153: 51–27
68. doi:10.1016/S0304-3800(01)00501-4 28
22
51. Peres-Neto PR, Legendre P, Dray S, Borcard D. Variation partitioning of species 1
data matrices: Estimation and comparison of fractions. Ecology. 2006;87: 2614–2
2625. doi:10.1890/0012-9658(2006)87[2614:VPOSDM]2.0.CO;2 3
52. R Development Core Team R, Team RDC, R Development Core Team R. R: A 4
Language and Environment for Statistical Computing. R Foundation for Statistical 5
Computing. 2011. p. 409. doi:10.1007/978-3-540-74686-7 6
53. Legendre P, Cáceres M, Borcard D. Community surveys through space and time: 7
Testing the space-time interaction in the absence of replication. Ecology. 2010; 91: 8
262–272. doi:10.1890/09-0199.1 9
54. Dray S, Legendre P, Blanchet G. packfor: Forward selection with permutation [R 10
package version 0.0-8/r100]. Canoco. 2011. p. 46. 11
55. Oksanen J, Blanchet FG, Kindt R, Legendre P, O’Hara RB, Simpson GL, et al. 12
vegan: Community Ecology Package. R package version. 2007. p. R package 13
version 1.17-9. 14
56. Kunin WE, Shmida A. Plant Reproductive Traits as a Function of Local, Regional, 15
and Global Abundance. Conservation Biology. 1997; 11: 183–192. 16
doi:10.1046/j.1523-1739.1997.95469.x 17
57. Cornwell WK, Ackerly DD. A link between plant traits and abundance: evidence 18
from coastal California woody plants. Journal of Ecology. 2010; 98: 814–821. 19
doi:10.1111/j.1365-2745.2010.01662.x 20
58. Espeland EK, Emam TM. The value of structuring rarity: The seven types and links 21
to reproductive ecology. Biodiversity and Conservation. 2011; 20: 963–985. 22
doi:10.1007/s10531-011-0007-2. 23
59. Lennon JJ, Beale CM, Reid CL, Kent M, Pakeman RJ. Are richness patterns of 24
common and rare species equally well explained by environmental variables? 25
Ecography (Cop). 2011; 34: 529–539. doi:10.1111/j.1600-0587.2010.06669.x 26
60. Heino J, Soininen J. Are common species sufficient in describing turnover in 27
aquatic metacommunities along environmental and spatial gradients? Limnology 28
23
and Oceanography. 2010; 55: 2397–2402. doi:10.4319/lo.2010.55.6.2397 1
61. Tsang TPN, Bonebrake TC. Contrasting roles of environmental and spatial 2
processes for common and rare urban butterfly species compositions. Landscape 3
Ecology. 2016: 1–11. doi:10.1007/s10980-016-0427-1 4
62. Mazaris A, Tzanopoulos J, Kallimanis A, Matsinos Y, Sgardelis S, Pantis J. The 5
contribution of common and rare species to plant species richness patterns: the 6
effect of habitat type and size of sampling unit. Biodiversity and Conservation. 7
2008; 17: 3567–3577. doi:10.1007/s10531-008-9480-7 8
63. Luizão RCC, Luizão FJ, Paiva RQ, Monteiro TF, Sousa LS, Kruijt B. Variation of 9
carbon and nitrogen cycling processes along a topographic gradient in a central 10
Amazonian forest. Global Change Biology. 2004; 10: 592–600. 11
doi:10.1111/j.1529-8817.2003.00757.x 12
64. Balvanera P, Quijas S, Perez-Jimenez a. Distribution Patterns of Tropical Dry 13
Forest Trees Along a Mesoscale Water Availability Gradient. Biotropica. 2011; 14
43: 414–422. doi:DOI 10.1111/j.1744-7429.2010.00712.x 15
65. Wang Q, Punchi-Manage R, Lu Z, Franklin SB, Wang Z, Li Y, et al. Effects of 16
topography on structuring species assemblages in a subtropical forest. Journal of 17
Plant Ecology. 2016; 1–10. 18
19
Supporting information 20
S1 Table. Selected topographic and spatial variables for Partial Multiple Regression and 21
Partial Redundancy according to forward selection. 22
23
24

S1 Table. Selected topographic and spatial variables for Partial Multiple Regression and Partial
Redundancy according to forward selection.
Topographic variables Spatial variables Std Richness
Total (1-230) None selected None selected Common (1-22) h, HAND None selected
Rare (137-230) None selected None selected
Abundance(Total)
Total (1-230) None selected PCNM 2, PCNM 3 Common (1-22) kh PCNM 4
Rare (137-230) None selected PCNM 2, PCNM 3
Biomass (Total)
Total (1-230) h, G PCNM 1, PCNM 2 Common (1-22) h PCNM 1
Rare (136-230) None selected None selected
C. Incidence
Total (1-230) h HAND, kv PCNM 1, PCNM 2, PCNM 3, PCNM 4, PCNM 5
Common (1-22) h, G PCNM 1
Rare (137-230) G PCNM 1
C. Abundance
Total (1-230) h, HAND, kv PCNM 1, PCNM 2, PCNM 3, PCNM 4, PCNM 5
Common (1-22) G, HAND,kv PCNM 1, PCNM 2, PCNM3, PCNM 5
Rare (137-230) G, HAND PCNM 1
C. Biomass
Total (1-230) h, G PCNM 1, PCNM 2 Common (1-35) h, G PCNM 1, PCNM2
Rare (136-230) None selected None selected
Composition based on incidence (C. Incidence); Composition based on abundance (C. Abundance) and Composition based on biomass (C. Biomass). Variables: Elevation (h); Slope (G); Profile curvature (kv); Plan curvature (kh); Height above the nearest drainage (HAND); Spatial variables (PCNM) based on Coordinates Principal.

