drive action through energy data visualization · pdf fileclick to edit master title style...
TRANSCRIPT

Click To Edit Master
Title Style
Driving Action through
Energy Data Visualization
Moderated by:
Sarah Zaleski
U.S. DOE

Driving Action through Energy
Data Visualization
Dan Walworth
HEI Hotels

HEI Hotels & Resorts
Changing Behavior through
Data Visualization

$20 million annually$500k per hotel
About HEI Hotels & Resorts
• Over 40 upper-upscale, name brand hotels
• Approximately 6,000 employees across 15 states
• Total energy spend exceeds $20mm annually
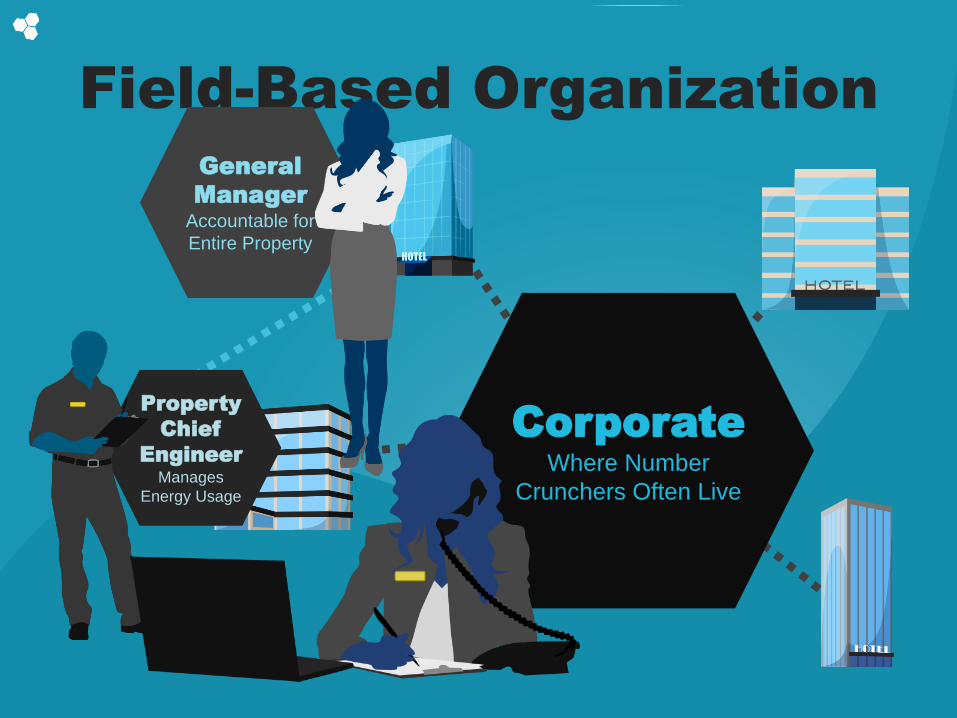
Field-Based Organization
Property
Chief
Engineer
Manages
Energy Usage
General
Manager
Accountable for
Entire Property
Corporate
Where Number
Crunchers Often Live

Backstory
History of
Sustainability
and Social
Responsibility
Monitored
Energy Costs
Installed
Energy-Saving
Technologies
HEI
Discovered…

hidusage.RateJ… F…
M…
A…
M… J…
Jul A…
S…
O…
N…
D… J… F…
M…
A…
M… J…
Jul A…
S…
O…
N…
D…
Electricity Cost
Look at that savings!
Our hotel has never
used less energy!
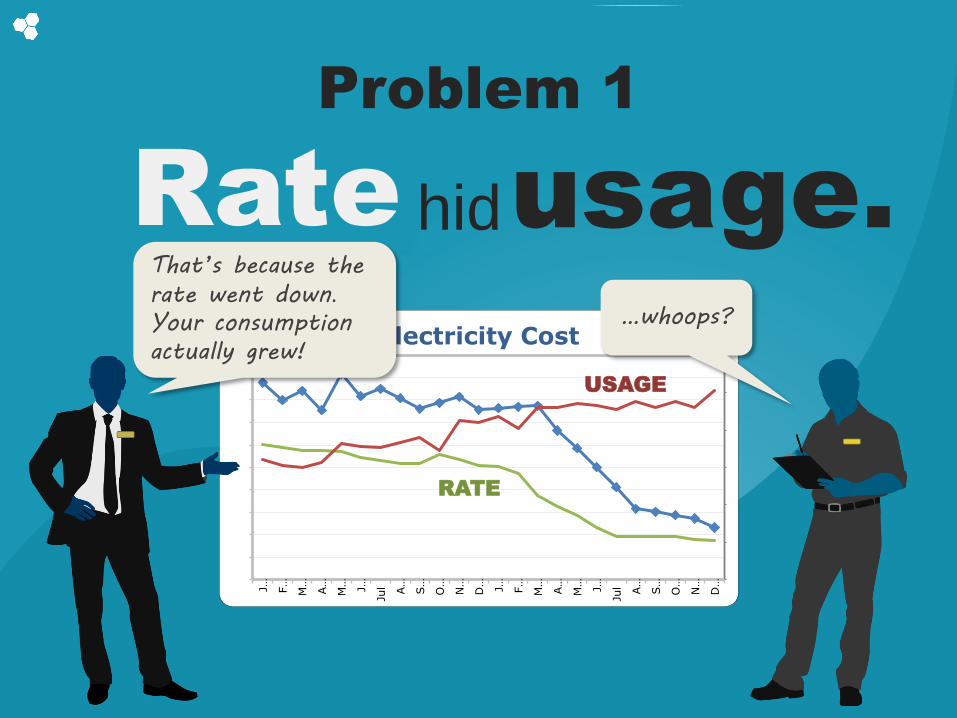
Problem 1
hidusage.RateJ… F…
M…
A…
M… J…
Jul A…
S…
O…
N…
D… J… F…
M…
A…
M… J…
Jul A…
S…
O…
N…
D…
Electricity Cost
Problem 1
That’s because the
rate went down.Your consumption
actually grew!
…whoops?
RATE
USAGE

Solution 1
COST OF ENERGY
RATE
(cost per unit)
CONSUMPTION
(units required)
Simple but highly effective change: focus
on consumption rather than cost!

Problem 2
Too many excuses resulting from
factors outside
our properties’ control.
August Last Year Electric Usage: 400,000 kWh
August This Year Electric Usage: 500,000 kWh
According to this text box,
you used 25% more
electricity than last year. Way to be wasteful.
That’s not fair! We had
a heat wave! My
clipboard and I think you
should check those
numbers again.

Solution 2

Solution 2
0
10000
20000
30000
40000
50000
60000
70000
Jan
Feb
Mar
Apr
May
Jun
Jul
Aug
Sep
Oct
Nov
Dec
Jan
Feb
Mar
Apr
May
Jun
Jul
Aug
Sep
Oct
Nov
Dec
Hotel Electricity Usage
Discover which primary factors
affect energy usage at our hotels.
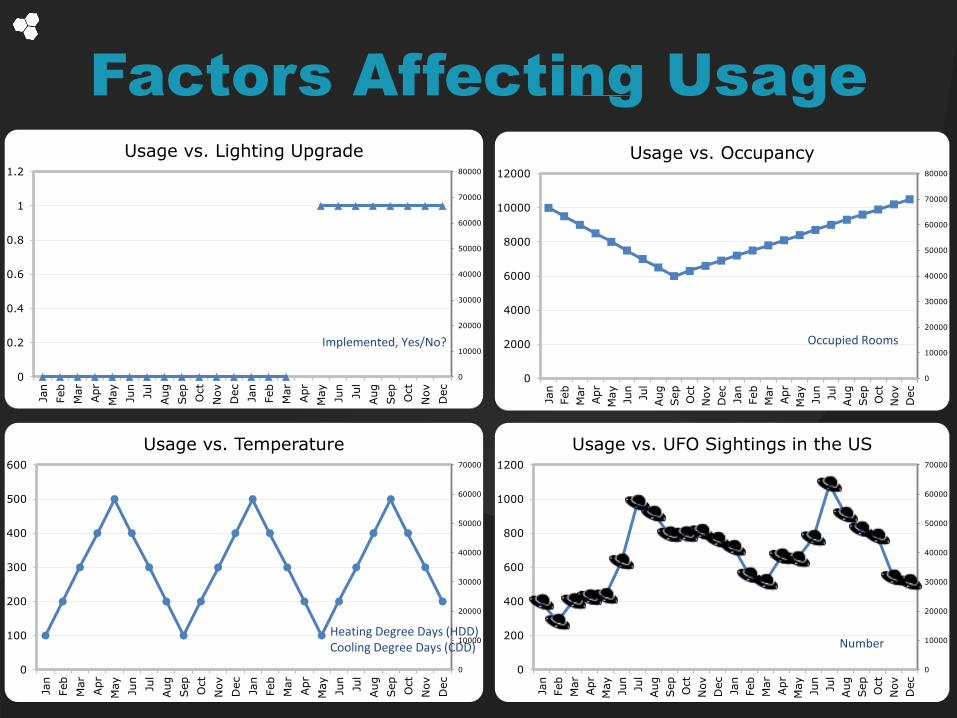
Factors Affecting Usage
0
10000
20000
30000
40000
50000
60000
70000
0
200
400
600
800
1000
1200
Jan
Feb
Mar
Apr
May
Jun
Jul
Aug
Sep
Oct
Nov
Dec
Jan
Feb
Mar
Apr
May
Jun
Jul
Aug
Sep
Oct
Nov
Dec
Usage vs. UFO Sightings in the US
Number
0
10000
20000
30000
40000
50000
60000
70000
80000
0
2000
4000
6000
8000
10000
12000
Jan
Feb
Mar
Apr
May
Jun
Jul
Aug
Sep
Oct
Nov
Dec
Jan
Feb
Mar
Apr
May
Jun
Jul
Aug
Sep
Oct
Nov
Dec
Usage vs. Occupancy
Occupied Rooms
0
10000
20000
30000
40000
50000
60000
70000
0
100
200
300
400
500
600
Jan
Feb
Mar
Apr
May
Jun
Jul
Aug
Sep
Oct
Nov
Dec
Jan
Feb
Mar
Apr
May
Jun
Jul
Aug
Sep
Oct
Nov
Dec
Usage vs. Temperature
Heating Degree Days (HDD)Cooling Degree Days (CDD)
0
10000
20000
30000
40000
50000
60000
70000
80000
0
0.2
0.4
0.6
0.8
1
1.2
Jan
Feb
Mar
Apr
May
Jun
Jul
Aug
Sep
Oct
Nov
Dec
Jan
Feb
Mar
Apr
May
Jun
Jul
Aug
Sep
Oct
Nov
Dec
Usage vs. Lighting Upgrade
Implemented, Yes/No?

Factors Affecting Usage
0
10000
20000
30000
40000
50000
60000
70000
80000
0
0.2
0.4
0.6
0.8
1
1.2
Jan
Feb
Mar
Apr
May
Jun
Jul
Aug
Sep
Oct
Nov
Dec
Jan
Feb
Mar
Apr
May
Jun
Jul
Aug
Sep
Oct
Nov
Dec
Usage vs. Lighting Upgrade
In this case, the lighting upgrade
reduced electric usage 7% overall.

Factors Affecting Usage
0
10000
20000
30000
40000
50000
60000
70000
80000
0
2000
4000
6000
8000
10000
12000
Jan
Feb
Mar
Apr
May
Jun
Jul
Aug
Sep
Oct
Nov
Dec
Jan
Feb
Mar
Apr
May
Jun
Jul
Aug
Sep
Oct
Nov
Dec
Usage vs. Occupancy
At our hotel, every occupied room
means 2.5 more kWh on average.

Factors Affecting Usage
0
10000
20000
30000
40000
50000
60000
70000
80000
0
100
200
300
400
500
600
Jan
Feb
Mar
Apr
May
Jun
Jul
Aug
Sep
Oct
Nov
Dec
Jan
Feb
Mar
Apr
May
Jun
Jul
Aug
Sep
Oct
Nov
Dec
Usage vs. Temperature
For temperature, we found that at this
hotel every CDD = 200 more kWh and
HDD = 300 more kWh

Factors Affecting Usage
0
10000
20000
30000
40000
50000
60000
70000
80000
0
200
400
600
800
1000
1200
Jan
Feb
Mar
Apr
May
Jun
Jul
Aug
Sep
Oct
Nov
Dec
Jan
Feb
Mar
Apr
May
Jun
Jul
Aug
Sep
Oct
Nov
Dec
Usage vs. UFO Sightings
There’s no connection between
UFO sightings and our energy
usage, no matter what you believe.

Solution 2
So does our engineer
have a point about
that heat wave?
Indeed he does . We found that for
every additional CDD, our hotel uses
200 kWh more of electricity on
average.
Since there were 450 more CDD this
August than last, we can make a
fairer comparison using this simple
adjustment.
450 CDD
X 200 kWh
90,000 kWh

Solution 2
August This Year Electric Usage: 500,000 kWh
August Last Year Electric Usage: 400,000 kWh
August Last Year Electric Usage,
ADJUSTED to Today’s Environment: 490,000 kWh
We crunched the numbers. Turns out if
last year was as hot as this year the
difference in your electric usage is only 2%.
That sounds reasonable. We did forget to turn lights off in unused
rooms. We’ll have to post reminders
for everyone.

Is that light saving
energy or are we?
That’s deep.
obscured energy-saving behaviors.
Energy-saving capital projects
Problem 3

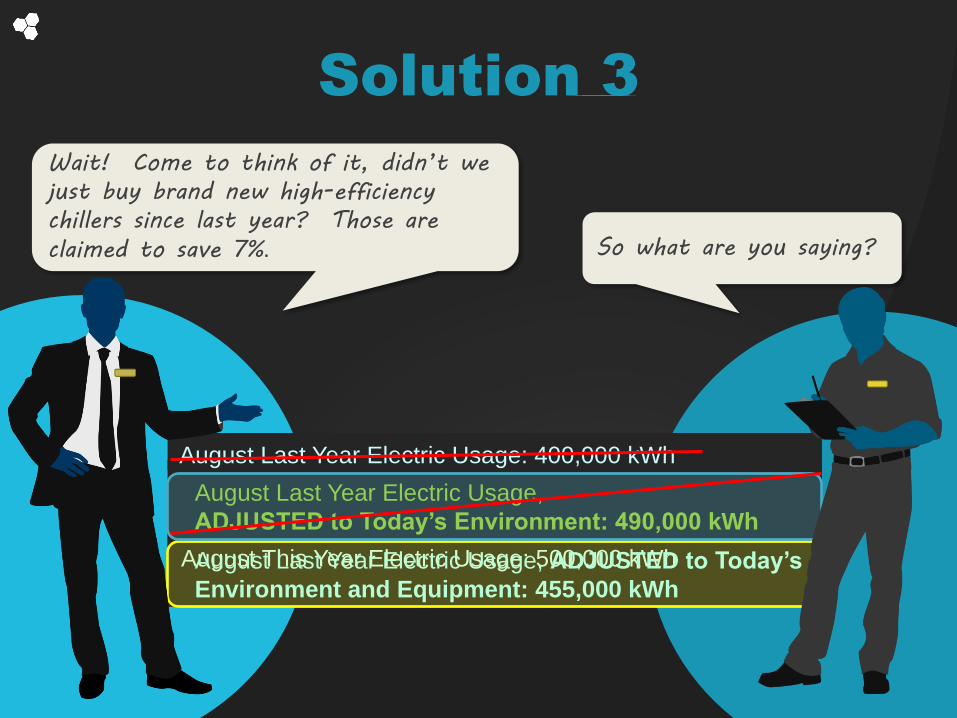
Solution 3
COST OF ENERGY
RATE
(cost per unit)
CONSUMPTION
(units required)
EQUIPMENT BEHAVIOR
Adjust usage calculations to remove the impact
of savings from Capital Projects. After that and
the prior adjustments are done, what’s left is
the impact of behavior.
Solution 3
Wait! Come to think of it, didn’t we
just buy brand new high-efficiency
chillers since last year? Those are
claimed to save 7%. So what are you saying?
August This Year Electric Usage: 500,000 kWh
August Last Year Electric Usage: 400,000 kWh
August Last Year Electric Usage, ADJUSTED to Today’s
Environment and Equipment: 455,000 kWh
August Last Year Electric Usage,
ADJUSTED to Today’s Environment: 490,000 kWh

Problem 4
How much energy do I
save if I do save energy?
That’s also deep.
Find a way to track the impact
of our associates in the field.
COST OF ENERGY
RATE
(cost per unit)
CONSUMPTION
(units required)
EQUIPMENT BEHAVIOR

Ultimate Solution
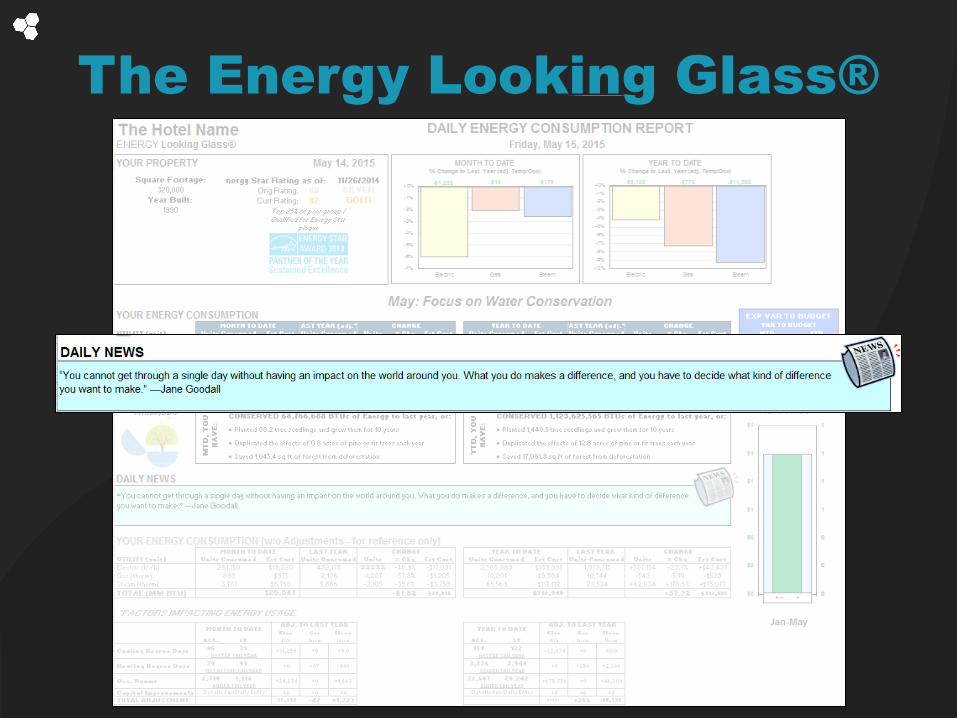
Introducing the Energy
Looking Glass®!

The Energy Looking Glass®

The Energy Looking Glass®
The Energy Looking Glass®

The Energy Looking Glass®

The Energy Looking Glass®

The Energy Looking Glass®

The Energy Looking Glass®

Reinforcement
Also known as how to keep
an energy-saving program
from losing steam!
That joke will
never be funny.
• Rewards and Recognition
• Consistent and Accurate Reporting
• Embracing a Cultural Shift

Results
600
650
700
750
800
850
Two years prior Year
prior
IMPLEMENTATION
YEAR
Year after Two years after
Billion B
TU
HEI Energy Usage
Includes portfolio of properties managed for entire period
14% reduction in overall energy usage in two years

In Summary
• Focus on consumption
• Use a methodology that everyone can
understand and to which everyone can relate
• Reinforce daily

Driving Action through Energy
Data Visualization
Aaron Bastion & Cody David
Atlanta Better Buildings Challenge

georgiatransitconnector.orgwww.AtlantaBBC.com
Driving Action through Data
Visualization
Atlanta Better Buildings Challenge
May 28, 2015

georgiatransitconnector.orgwww.AtlantaBBC.com
“Atlanta’s goal is to become a top-tier city for sustainability.
-Mayor Kasim Reed

georgiatransitconnector.orgwww.atlantabbc.com
Our sustainability Impact Areas
Air Quality
Land Use
Sustainability Planning
Transportation &
Mobility
Education
Growing Business
Energy Efficiency
& RenewablesCommunity Health &
Vitality
Materials Management
Water Management

georgiatransitconnector.orgwww.AtlantaBBC.com
Commercial EE Ordinance – 2015!
• Benchmarking
• Transparency
• Audits
• Retrocommissioning
Subject to commercial buildings 25,000 square
feet or greater.
2,350 buildings that, as a whole, currently
represent 80 percent of the city’s commercial
sector.

georgiatransitconnector.orgwww.AtlantaBBC.com
Atlanta BBC Steering Committee
City of Atlanta Central Atlanta Progress
ESCO
Midtown AllianceBATMA
Invest AtlantaSouthface

georgiatransitconnector.orgwww.AtlantaBBC.com
Participant Update: May 2015
*Includes City of Atlanta Facilities and Participants outside of listed Activity Centers
2 Million sq. ft.
Goal
25 Million sq. ft.
2012 Start
406 Buildings 96.3 Million sq. ft.*
Pledged Today
*83% of Portfolio Reporting

georgiatransitconnector.orgwww.AtlantaBBC.com
Annual Reporting

georgiatransitconnector.orgwww.AtlantaBBC.com
Using The Power of Data Visualizations

georgiatransitconnector.orgwww.AtlantaBBC.com
Support Program Initiatives
2011 2012 2013 2020
6%8% 9%
20%

georgiatransitconnector.orgwww.AtlantaBBC.com
Feature Atlanta’s Diverse Portfolio

georgiatransitconnector.orgwww.AtlantaBBC.com
ENERGY STAR Web Services

georgiatransitconnector.orgwww.AtlantaBBC.com
Development Challenges
• What do we want to display?• What can we display with the metrics available?• What should we actually display?• How to make data easier to display?

georgiatransitconnector.orgwww.AtlantaBBC.com
Demonstration
www.abbcdata.org

Driving Action through Energy
Data Visualization
Andrew Sharp
City of Philadelphia

Philadelphia Energy BenchmarkingTaking Building Energy Data to the Market
Andrew Sharp, Mayor’s Office of Sustainability


Buildings and Carbon Emissions

Year Two Benchmarking Results

Year Two Benchmarking Results

Connecting Individual Performance to
Financing and Technical Assistance

Delivering More Impactful Information to the Marketplace
http://visualization.phillybuildingbenchmarking.com

Visualization Tool Development

Understand Dynamics among Data Types

Allows Comparisons among Multiple Buildings
http://visualization.phillybuildingbenchmarking.com

What’s next?
• Benchmarking for multi-family
facilities
• Additional research and focus
groups related to outreach
tools
• Expanded outreach for Year
Three benchmarking

Philadelphia Energy BenchmarkingAndrew Sharp, Mayor’s Office of Sustainability
www.phila.gov/benchmarking

Questions & Discussion
abbcdata.com
http://visualization.phillybuil
dingbenchmarking.com