drip irrigation on avocados - welcome to · pdf filecalifornia avocado society 1979 yearbook...
TRANSCRIPT
California Avocado Society 1979 Yearbook 63: 95-134
DRIP IRRIGATION ON AVOCADOS C. D. Gustafson Farm Advisor, University of California Cooperative Extension, San Diego County A. W. Marsh Cooperative Extension, University of California, Riverside R. L. Branson University of California, Riverside Sterling Davis U.S. Department of Agriculture. Six-Year Summary of Project The Drip Irrigation on Avocados Project was one of the early drip irrigation experiments in the U.S.A. on a commercial scale with a tree crop. This six-year summary report includes the information accumulated during the period from June 1, 1970 until September 1, 1976. It was an experiment set up to compare a drip irrigation system with a sprinkler irrigation system on newly-planted avocado trees. Irrigation is the most important cultural practice in growing avocados. Saving water is an important part of any grower's job in raising a crop. Not only is the price of water unusually high in San Diego County, but there is also a limit to the amount of available water. Specific rules on how to irrigate orchards cannot be given because orchards have different characteristics that must be handled individually. These characteristics include soil factors such as texture, structure, depth, water intake and retention, slope, and drainability. Other factors which should be considered in developing and maintaining an efficient irrigation program are water quality, humidity, temperature, wind, irrigation system operation, and the general tree health. For many years, work has been going on in an attempt to improve the irrigation methods and techniques for growing avocados. Basins, furrows, and fixed and rotating sprinklers were the irrigation methods used. As water became higher priced, as labor became more expensive, and in some cases, unavailable, the grower had to refine as many of his cultural operations as possible. Some irrigation systems were automated. Tensiometers were used in order to have a better understanding of soil moisture conditions and their relationship to tree performance. Drip irrigation offered a refinement to previous irrigation techniques, and it was with this in mind that an attempt was made to introduce drip irrigation into avocado orchards of San Diego County. PROJECT DESCRIPTION History A drip irrigation experiment on avocados was planned in the fall of 1969. The irrigation

system design and experimental plot layout was a cooperative effort between Dr. Barauch Gornat, Hebrew University; University of California Cooperative Extension (C.E.), and U.S.D.A. (A.R.S.) research team; and the irrigation industry. In June of 1970, the orchard was planted and the irrigation system installed. Cooperators and Their Responsibilities The avocado experimental site was located on the Trendel orchard near the community of Bonsall in north San Diego County, center of 12,000 acres of avocados, which is 25% of the state's acreage. The research team consisted of Dr. R.L. Branson, University of California, Riverside (UCR); Sterling Davis, ARS, USDA; C.D. Gustafson, CE, University of California/San Diego County; and Dr. A.W. Marsh, CE, UCR. Cooperating in the experiment as part of the team from industry were the late Bill Johnson and Frank Koch of the W.L. Johnson Agricultural Corporation; Bruce Brown, Control Water Emission Systems, Inc.; John Johnson, field technician for the San Diego County Cooperative Extension; Ralph Strohman, Staff Research Associate, CE, UCR; Pat Scott, Manager, Rainbow Water District; California State Department of Water Resources; Trendel Brothers; Sheldon Pooley, Irrometer, Inc., Riverside; Toro Company, Riverside; and Xeros Company, Glendora. Plot Size and Layout The test orchard was five acres (2 hectares) divided into eight plots. Four plots were irrigated with fixed sprinklers and four plots with drip emitters. The number of trees in each plot was between 70 and 125 (Figure 1).

The orchard was originally engineered for a conventional sprinkler system. Buried PVC rigid pipes for mains, sub-mains, and laterals were in place at the time the trees were planted. The drip system was superimposed on this permanent irrigation system in the four plots that were drip irrigated. Varieties Two varieties, Mass and Reed, were selected by the grower for planting on the five-acre (2 ha) orchard. Both are Guatemalan type, summer producing, and somewhat tender to frost. Hass is a consistent heavy bearer of high quality fruit. The tree is of medium vigor, upright, and moderately spreading. Reed is a relatively new commercial avocado variety being planted in larger numbers. It is an upright and vigorously growing tree. Planting distance, for both Hass and Reed, was 15' x 20' (4.6 x 6.2 m). Each plot was divided between Hass and Reed, with about the same number of trees of each variety. Soils and Climate The soil in the orchard was a Fallbrook fine sandy loam-Vista sandy loam complex. The soil ranged in depth from 20 inches (50cm) to 60 inches (152cm) and was well drained. The pH ranged from 6.2 to 7.0. The orchard was at an elevation of 600 feet (185 m) and had a five percent slope. Annual precipitation ranged from 12 inches (30 cm) to 20 inches (50 cm), and air temperature ranged from 24°F (-4.5°C) to 102°F (39°C). Water Source and Quality Water used on the orchard was from the Colorado River. It is supplied to San Diego County by the Metropolitan Water District of Southern California. The Rainbow Municipal Water District serves the area in which the experiment was located. Analysis of the water is shown in Table No. 1.

Note: Obtained from MWD's Annual Report
The avocado is especially sensitive to total salts and chloride. The total salts in Colorado River water is equivalent to 1.1 millimhos, or about 700 parts per million (ppm) (mg/l). The chloride content of the water is approximately 100 ppm. These are levels at which considerable caution should be used in irrigation management. Frequent irrigations with periodic leaching are necessary to move excess salts through the soil profile and below the root zone; otherwise, tip burn will occur on the older leaves in the fall and winter. METHODS AND MATERIALS Engineering and Equipment The drip irrigation equipment arrived from Israel in the spring of 1970. This was a Netafim system and was used until May 1972, when it was changed to a Drip-Eze system. The Netafim system will be referred to as Drip 1 and the Drip-Eze system as Drip 2. Sprinklers Browning fixed sprinklers were used, one per tree. The sprinkler system was manually operated by a gate valve at the water source and a separate buried valve at each plot.


Drip System Hose Drip 1 used a 0.53-inch (1.35 cm) diameter polyethylene hose. Drip 2 used a 0.58-inch (1.47 cm) diameter polyethylene hose. The hose was placed parallel to the tree rows, uphill from the trunks. Emitters Drip 1 emitters were in-line drippers. The middle dripper was located opposite the tree trunk, the others two feet (60 cm) on either side. Drip 2 used four in-line emitters spaced 3.25 feet (one meter) apart with two emitters on each side of the tree. Each emitter discharged one gallon per hour (gph) (3.8 liters/hour). Valves From June-October 1970, the drip system was operated manually by a gate valve. An electrically-operated valve was installed in the line in October 1970. Timer An 11-station Toro Monitor II clock was furnished and installed by the Toro Company. Only one station was used. Fertilizer Tank The fertilizer tank was a 10-gallon (381) metal tank. The fertilizer was injected by differential pressure across an angle valve with the upstream pressure forcing the fertilizer into the downstream side. Later, an electric fertilizer injector was installed. Filters The first filter unit consisted of two concentric metal screens of 150 and 180 mesh. Subsequently, a Drip-Eze unit of the same type was used. This unit was supplemented with a Xeros sand filter in 1974. Meters Water to experiment was measured with a two-inch (5.1 cm) meter. The water applied to the drip plots was measured with a ¾ inch (1.9 cm) meter. Gauges The Drip 1 head had pressure gauges placed before and after the filter/screen and before the fertilizer injector. The Drip 2 installation had a valve stem adapter at each line so a hand pressure gauge could be used for pressure measuring. On steep hillsides, drip irrigated orchards require numerous pressure regulators to assure a relatively uniform water discharge throughout the system. A reasonable and workable difference in pressure in the line has been estimated at about ten percent. Evaporation Pan A standard U.S. Weather Bureau Class A pan and a standard hook gauge were used. The pan was placed adjacent to border trees on the east side of the orchard. This does

not meet the standard for pan setting, but was the best position available. Data from the pan are included with the other weather data. Rain Gauge A standard non-recording rain gauge was used. SYSTEM OPERATION Uniformity of Emitter Discharge Table 2 shows average flow rates. Emitters in the lower plots showed more flow due to increased pressure. Emitters that did not clog operated with + 6%.
Rodent Damage Rodent damage was slight, and confined to the first year. Clogging Some clogging of emitters did occur, but was not of serious con sequence. Most clogging was caused by particulate matter in the lower reaches of the lines before flushing was accomplished. During times when the water contained more particulate matter, a pressure drop across the screen filter occurred and was as much as 50 Ib/sc inch (3.3 kilograms per square centimeter) forcing some of the material through the screen which caused clogging. Operating Pressure [Head, Mainlines, Laterals] The pressure at the control center was 15 pounds per square inch (kg/cm2), but during the first two years pressures were slightly higher at lower elevations. When Drip 2 was installed, the beginning of each line was controlled at 15 psi (1 kg/cm2). Weather Data Type of Data The weather station was installed in the fall of 1970 to have a better understanding of climatic conditions and have a correlation between weather and irrigation. The type of data collected included: maximum/minimum temperature, humidity, evaporation, and rainfall.

Table 3 gives the monthly summary of weather data for the six-year period. See Table 9 for rainfall data. Measurements The following measurements and readings were made three days a week, weekly, monthly, and annually: (!) tensiometers, (2) evaporation, (3) emitter discharge, (4) water meters, (5) soil salinity, (6) leaf composition, (7) height and width of trees, (8) circumference of trunk below and above the bud union, (9) root growth pattern, (10) moisture patterns, and (11) fertilizer distribution.


RESULTS AND DISCUSSION Once a year, the height and width of trees were measured. Each individual tree has a record from 1970 to 1976. One year, the skirts of the sprinkler plots were pruned off to allow a better distribution of water under the trees. Another year, the Reed trees were topped because of their very tall upright growing habit that caused considerable limb breakage. Nothing else has been done to the trees. The measurements were continued as if no topping or skirting had been done. Table 4 summarizes the trees' canopy height and width by variety and irrigation method. The significant differences in tree measurements were usually between the two varieties

and not the irrigation methods.
Trunk Measurements The trunk circumference measurements above the bud union can be observed in Table 5. Here, as with canopy measurements, one can compare the differences between irrigation methods, varieties, and their interaction.

Fruit Yields The first crop was harvested in 1973, and the fruit yields for that and subsequent years are outlined in Table 6. The fruit harvested in the first crop was set in the spring of 1972. The trees were only 22 months of age at the time the first crop set. The total production averaged over 1,000 pounds (454 kg) per acre, which is exceptionally good for young trees. The 1974-75 crop, which was set in the spring of 1974 and harvested in the summer of 1975, was exceptionally large, averaging 10,000 pounds (4,540 kg) to the acre. Records of harvest were made on an individual tree basis to permit statistical analysis. In 1975, sprinkler irrigated trees produced approximately 920 pounds (418 kg) more fruit to the acre (assuming 145 trees to the acre), using 12.1 ac. in /ac (31 cm) more water than the drip irrigated trees.
A. Pounds per tree derived from fruit count (field data) times 16 ounces (454 grams) per fruit for Reed and 10 ounces (284 grams) per fruit for Hass.
B. Pounds per tree derived from fruit count. No Reed data because of theft.
C. Pounds per tree derived from an average weight of 40 pounds (18 kg) per box times the number of boxes per tree (field data).
In 1975, the difference between varieties was significant at the 5 percent level. Table 7 shows the yields per acre and per acre inch of water applied. Though Hass and Reed fruit are harvested in different months, the amount of water applied in 12 months prior to July 1 of the harvest year was used for these calculations. While the greatest yield per acre vacillated between sprinkler and drip irrigated plots, the yield per acre-inch of water applied was greater for the drip plots in six out of seven comparisons. This could be important where water is scarce.

Irrigation Water Source and Pressure Irrigation water for the experimental orchard was supplied by the Rainbow Municipal Water District by pipeline under continuous, but not necessarily constant pressure. It was delivered to the orchard through a two-inch meter that limited the rate of flow to about 200 gallons per minute (gpm). All water for both drip and sprinkler plots passed through this meter. Water for the drip plots subsequently passed through a three-quarter-inch meter which recorded directly the water used for drip irrigation. The difference between the readings of the large and small meter was the water used for sprinkler irrigation. To avoid pressure loss while irrigating, the drip and sprinkler plots were never irrigated simultaneously. The drip plots used about 25 gpm. Initially, when the trees were small, the sprinklers were the fixed jet type with 900 pattern (0.6 gpm) that required a total now of 195 gpm. In August 1972, when the trees became larger, sprinklers were changed to 180° jets (0.8 gpm) that required 260 gpm when all sprinkler plots were irrigated simultaneously. This large flow reduced the pressure excessively so the irrigation sets were divided to irrigate only two plots at once. In July 1974, the fixed jet sprinklers were replaced with reaction type rotating sprinklers (0.45 gpm) that required only 150 gpm total flow. After this, all four sprinkler plots could be irrigated simultaneously. Tensiometers Tensiometers were installed under two trees in each plot in different rows. (See Figure 2). They were installed just inside the canopy drip line on the south side of the trees. In the drip plots, they were located 12 inches from the nearest emitter. As the trees grew, tensiometers were moved to maintain the same relative position. At each tensiometer location, instruments were placed at 12 and 24-inch depth. Readings were obtained three days each week about 8 a.m. In April 1973, a third location was installed in two of the four drip plots using automatic tensiometers that were wired to the irrigation controller to provide direct tensiometer control over the amount of water applied. Schedules for Sprinkler Irrigation The frequency of avocado irrigation by sprinkling in northern San Diego County has increased in the past 25 years from approximately once every three weeks to once every seven to ten days with beneficial effect on production. Weekly irrigations were

selected for the sprinkler plots, a practice that continued for the duration of the trial except in certain hot periods when twice a week irrigations were necessary. The amounts applied at each irrigation were regulated by calculation of the amount needed to restore tensiometer readings to about 10 to 15 centibars (cb) after irrigation. If a second irrigation in a week was required, it was usually shorter than the regular weekly irrigation. Schedules for Drip Irrigation At the start, in July 1970, drip irrigation was also scheduled once a week using manual valves. In October 1970, a time clock with hydraulic valve was installed making possible the frequent irrigations characteristic of drip irrigation. The time clock program was adjusted to maintain tensiometer readings in the 10 to 20 cb range. Deviations from that range were corrected by changing the time clock program. After rainy periods, when 2 to 3 inches of rain had occurred, irrigation ceased until tensiometer readings indicated the need for more water. Starting in April 1973, and continuing for 20 months, the program was regulated by automatic tensiometers. Irrigation occurred only at the programmed time, and then only if a tensiometer signalled the need. During this time, regular readings were made from all tensiometers, from which the average readings are shown in Figure 2. The settings used to initiate irrigations are also shown for both depths. While the automatic tensiometers may not read exactly alike, nor the same as the standard tensiometers (whose readings are not all alike), the graphs show that the control method kept the average tensiometer readings within the target range, never becoming too wet nor too dry.

This continued until mid-December 1974, when tip burn following light rains suggested that irrigation during early rain periods was needed even when tensiometers had low readings. Subsequently, irrigations were programmed in the controller as they had been

before April 1973. The entire program for drip irrigation control is shown in Table 8.
Water Applied Separate water meters for the drip and sprinkler irrigated plots were read weekly. From these readings the amounts in gallons per tree and acre inches per acre were

calculated. The meters recorded the total applied to 325 trees by sprinklers and 349 trees by drip.
A summary of water applications by quarters for each year of the experiment for both drip and sprinkled plots is shown in Table 9. The table shows the small amount of water needed by very young trees and the rate at which the use increases as the trees grow. The ratio of water applied to drip plots versus sprinkled plots shows a change as the trees grew larger, from 31 percent as much for drip irrigation the first year to 74 percent as much the last full year of the experiment (Table 10). This table also shows the percent water saving by drip irrigation compared to sprinklers.

The early low use by drip irrigation was caused by the low evaporation loss from a small area of wet soil when the trees were small. Sprinkled plots had a greater area of exposed wet soil from which water evaporated. As the trees grew and shaded more of the soil, a larger proportion of the water applied to sprinkled trees was lost by transpiration. We assume that transpiration from trees was essentially the same for both irrigation methods. While the ratio of water applied by the two methods changed with tree growth, the difference between the two, caused mainly by evaporation from wet soil, remained fairly constant ranging from 4 to 5.5 inches per year in the first three and one-half years (Table 10). In June 1974, the sprinklers were changed from fixed jet to reaction type rotating sprinklers that wetted a much greater area. This increased losses by evaporation and possibly by deep percolation from soil into which roots had not yet penetrated. The difference in 1974 between the two methods was 13.4 inches. In 1975, it dropped back to 8.4 inches as the roots and tree canopy both spread. The greatest water use normally occurs in the third quarter, July to September, when the highest temperatures prevail. The pattern held in all years for both methods of irrigation except for drip irrigation in the fall of 1975, when the fourth quarter slightly exceeded the third (Table 9). The experience obtained from this experiment suggests that irrigation controlled by automatic tensiometers is desirable from January until the first fall rains. From onset of the first fall rain until the end of the year, it is advisable to irrigate regularly with time clock control until a minimum of three inches of rain has fallen within a 2 to 3-week period. This should minimize tip burn.

Drip irrigation wets a smaller soil volume than sprinkling and, therefore, has less water in storage to protect a tree from unusual demands. Since water should be applied daily, it is customary for irrigation system designers to think about the maximum potential daily requirements for planning system capacity. With some soil water storage potential available, it is probably safe to consider maximum use on a peak-week basis rather than a single peak day. Average daily use for the peak week is shown in Table 11.
Evaporation data from Class A pans have received increasing use in many areas for deciding frequency and amount of irrigation. That it does not serve well for scheduling drip or sprinkler irrigation of young avocados in San Diego County is evident when the evaporation figures are compared with the water use figures for the six principal irrigation months, as illustrated in the brief table below.

Wetting Patterns Drip irrigation properly applied wets a small area of surface soil. Fortunately, the small area does not represent the volume of soil that becomes wet by capillary flow of water in all directions away from the emitter. Soil excavations made during the first year of the experiment revealed capillary movement as much as six feet laterally away from the emitter at a time when wet soil surface was evident less than one foot away from the emitter. The extent of the lateral spread probably was enhanced by the denser granitic subsoil encountered between two and three feet in depth. Figure 3 illustrates the extent and position of wet soil with respect to an emitter.
Three emitters per tree, spaced 2 feet (60 cm) apart, were used from the start of the experiment. In August 1973, the lateral lines were changed to provide four emitters per tree, spaced three feet (1 m) apart. This was an improvement. However, it was inadequate to provide enough water to three trees on the outside row suffering competition from an adjacent un-irrigated pepper tree. The trees defoliated and looked bad until three more emitters per tree were added by a branched line. Subsequently, the three affected trees returned to excellent condition.
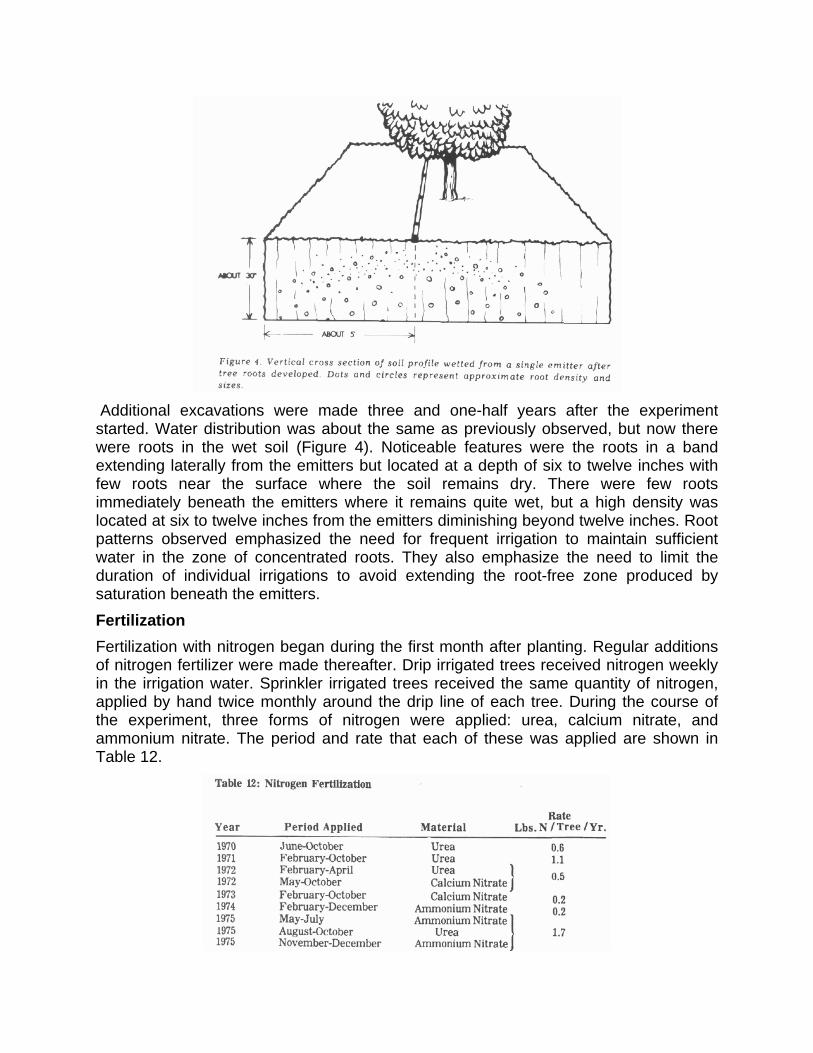
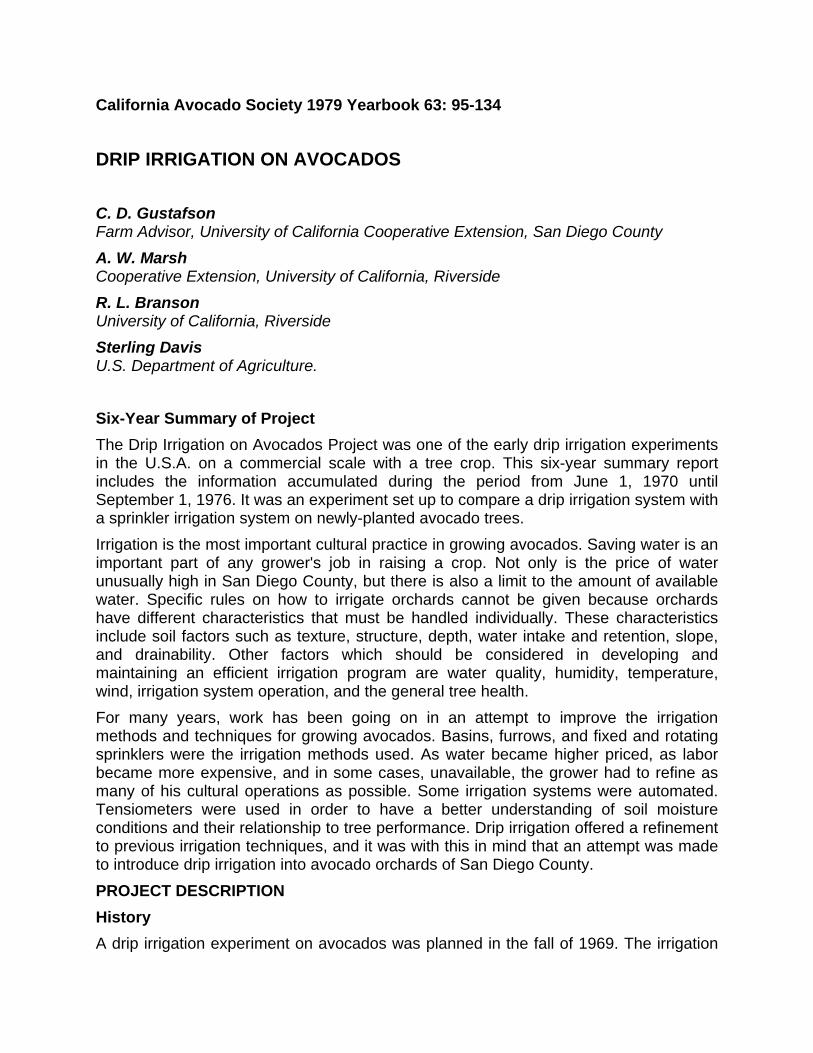
Additional excavations were made three and one-half years after the experiment started. Water distribution was about the same as previously observed, but now there were roots in the wet soil (Figure 4). Noticeable features were the roots in a band extending laterally from the emitters but located at a depth of six to twelve inches with few roots near the surface where the soil remains dry. There were few roots immediately beneath the emitters where it remains quite wet, but a high density was located at six to twelve inches from the emitters diminishing beyond twelve inches. Root patterns observed emphasized the need for frequent irrigation to maintain sufficient water in the zone of concentrated roots. They also emphasize the need to limit the duration of individual irrigations to avoid extending the root-free zone produced by saturation beneath the emitters. Fertilization Fertilization with nitrogen began during the first month after planting. Regular additions of nitrogen fertilizer were made thereafter. Drip irrigated trees received nitrogen weekly in the irrigation water. Sprinkler irrigated trees received the same quantity of nitrogen, applied by hand twice monthly around the drip line of each tree. During the course of the experiment, three forms of nitrogen were applied: urea, calcium nitrate, and ammonium nitrate. The period and rate that each of these was applied are shown in Table 12.
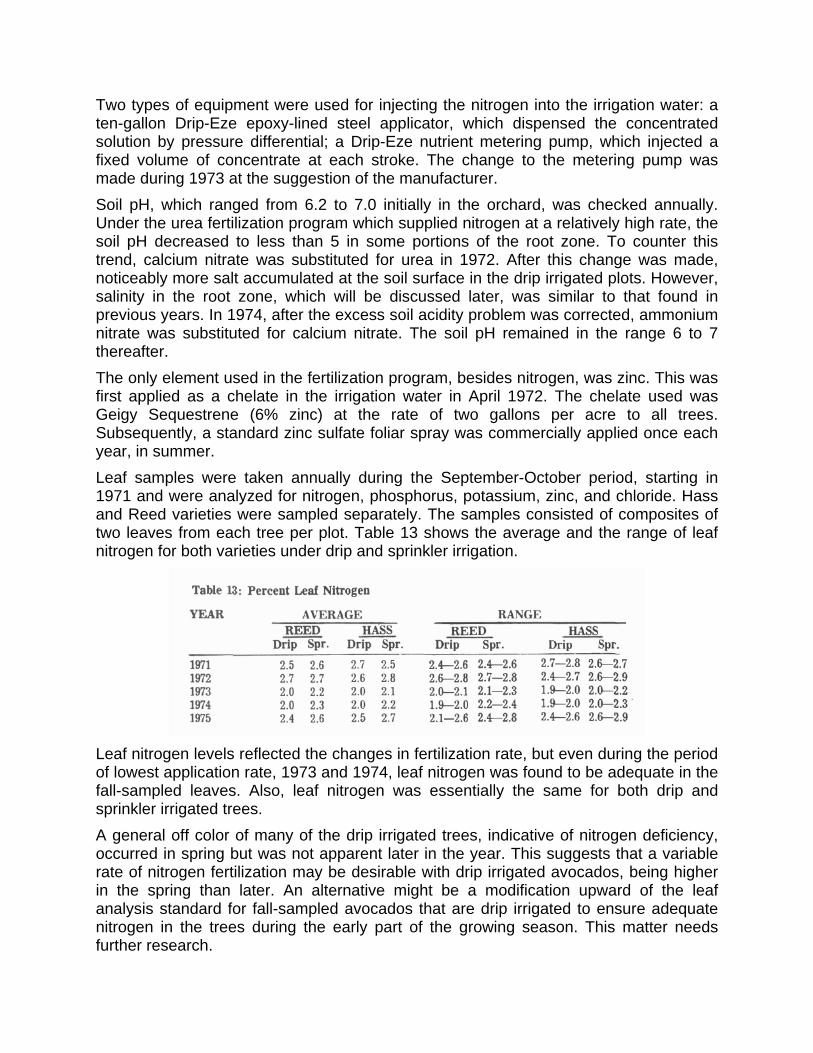
Two types of equipment were used for injecting the nitrogen into the irrigation water: a ten-gallon Drip-Eze epoxy-lined steel applicator, which dispensed the concentrated solution by pressure differential; a Drip-Eze nutrient metering pump, which injected a fixed volume of concentrate at each stroke. The change to the metering pump was made during 1973 at the suggestion of the manufacturer. Soil pH, which ranged from 6.2 to 7.0 initially in the orchard, was checked annually. Under the urea fertilization program which supplied nitrogen at a relatively high rate, the soil pH decreased to less than 5 in some portions of the root zone. To counter this trend, calcium nitrate was substituted for urea in 1972. After this change was made, noticeably more salt accumulated at the soil surface in the drip irrigated plots. However, salinity in the root zone, which will be discussed later, was similar to that found in previous years. In 1974, after the excess soil acidity problem was corrected, ammonium nitrate was substituted for calcium nitrate. The soil pH remained in the range 6 to 7 thereafter. The only element used in the fertilization program, besides nitrogen, was zinc. This was first applied as a chelate in the irrigation water in April 1972. The chelate used was Geigy Sequestrene (6% zinc) at the rate of two gallons per acre to all trees. Subsequently, a standard zinc sulfate foliar spray was commercially applied once each year, in summer. Leaf samples were taken annually during the September-October period, starting in 1971 and were analyzed for nitrogen, phosphorus, potassium, zinc, and chloride. Hass and Reed varieties were sampled separately. The samples consisted of composites of two leaves from each tree per plot. Table 13 shows the average and the range of leaf nitrogen for both varieties under drip and sprinkler irrigation.
Leaf nitrogen levels reflected the changes in fertilization rate, but even during the period of lowest application rate, 1973 and 1974, leaf nitrogen was found to be adequate in the fall-sampled leaves. Also, leaf nitrogen was essentially the same for both drip and sprinkler irrigated trees. A general off color of many of the drip irrigated trees, indicative of nitrogen deficiency, occurred in spring but was not apparent later in the year. This suggests that a variable rate of nitrogen fertilization may be desirable with drip irrigated avocados, being higher in the spring than later. An alternative might be a modification upward of the leaf analysis standard for fall-sampled avocados that are drip irrigated to ensure adequate nitrogen in the trees during the early part of the growing season. This matter needs further research.

Data on leaf phosphorus are shown in Table 14. In 1971 and 1972, the leaf samples from both varieties averaged 0.2 percent phosphorus. Starting in 1973 for Hass, and 1974 for Reed, a trend toward lower phosphorus levels, but not yet deficient, developed in drip irrigated trees. Possibly this is due to a smaller volume of soil wetted by the drip compared to the sprinkler irrigated systems. This could result in the drip irrigated trees having smaller feeder root systems and proportionately less phosphorus uptake.

Leaf potassium levels are shown in Table 15. As in the case of phosphorus, the drip irrigated trees of both varieties generally had less leaf potassium than did the sprinkled trees. However, unlike phosphorus, leaf potassium did not decrease with time; and this may be due to the relatively large amount of available potassium present in Southern California soils.
Leaf zinc levels, as shown in Table 16, averaged about 20 ppm at the first sampling. This is marginal for avocados. As a result, the entire orchard was fertilized with zinc annually thereafter. In subsequent samples, zinc concentrations ranged from 20 to 30 ppm.
Salinity Trends The irrigation water used is of marginal quality for avocados with respect to both total soluble salts and chloride. This water has an electrical conductivity of 1.1 mmhos/cm and contains about 3 milliequivalents per liter or 100 ppm of chloride. Soluble salt accumulation in the soil and chloride accumulation in both the soil and leaves were monitored to determine of there were any differences that might be associated with the two irrigation methods. The soil was analyzed initially when the orchard was established. Samples were taken from 0 to 1 foot and 1 to 2 foot depths at two sites in each of the eight plots. In no case did the soluble salts, as measured by electrical conductivity and chloride concentration of the saturation extract, exceed maximum safe levels for avocados on Mexican rootstock; i.e., 2 mmhos and 5 meq/l, respectively. Soil salinity was determined on a regular basis thereafter. Samples were taken twice a

year from around the drip line of the same designated trees, at the end of the winter rains, and again at the end of the irrigation season. Six tree sites, three in drip irrigated plots and three in sprinkler irrigated plots, were sampled by 6- or 12-inch increments to 3 feet, the maximum soil depth in most of the orchard.
Soil chloride levels measured from the fall of 1970 through the spring of 1976 are shown in Table 17. The values are averages of the 0 to 3-foot depth for all trees sampled for each irrigation method. Under both methods of irrigation chloride concentration in the root zone increased during each irrigation season and then decreased as a result of leaching during the period of winter rainfall. The degree of winter leaching varies in this region because the rainfall is characteristically variable in total amount per season and in distribution. The smallest rise in chloride occurred during the first year, and the level attained that fall was about the same for both irrigation treatments. The small rise was attributable to the short irrigation season that year. In subsequent years soil chloride rose by the end of the irrigation season to levels that approached or exceeded 5 meq/l, the tolerance level for this crop. Leaf burn increases in severity as that level is exceeded. The fall chloride levels were not consistently different for either drip or sprinkler irrigation. During the third winter, 1972-73, leaching did not reduce the soil chloride below the limit of tolerance, even though the total rainfall that year was the highest of the three winters. The monitoring data on total soluble salts in the soil (ECe x 103 ) for the period from the fall of 1970 through the spring of 1976 are shown in Table 18. The annual pattern of accumulation during the irrigation season followed by some leaching with winter rains is similar to that described above for chloride.
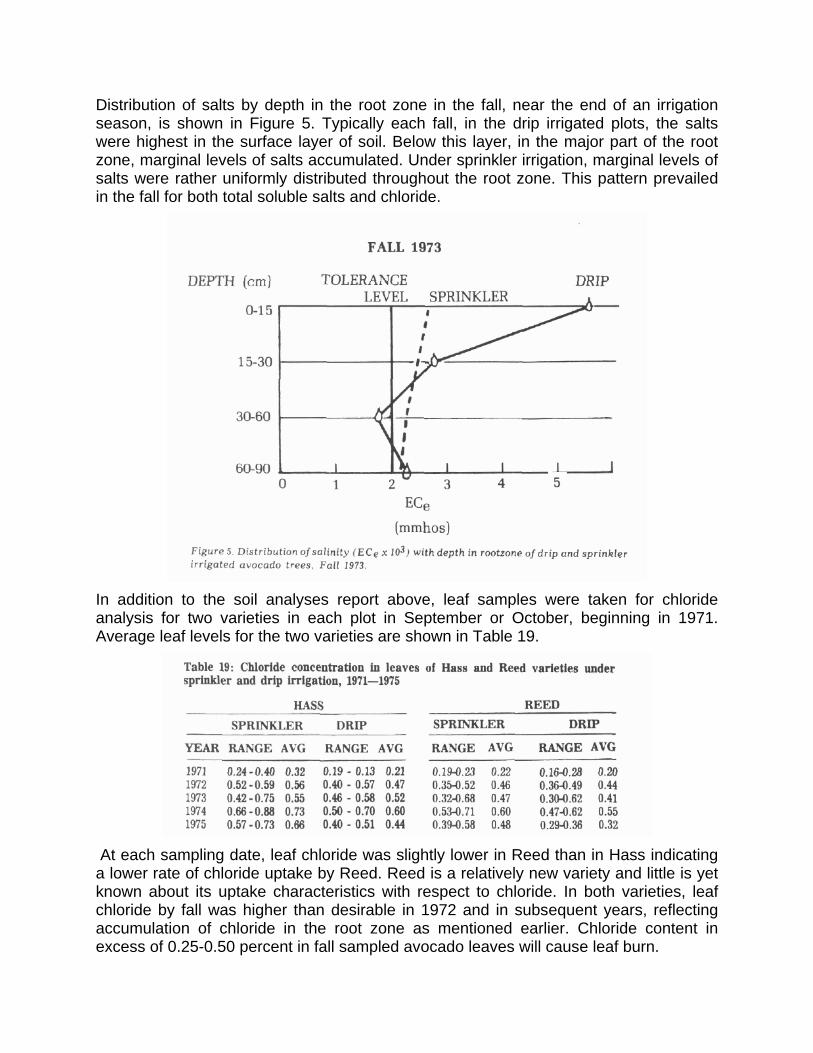
Distribution of salts by depth in the root zone in the fall, near the end of an irrigation season, is shown in Figure 5. Typically each fall, in the drip irrigated plots, the salts were highest in the surface layer of soil. Below this layer, in the major part of the root zone, marginal levels of salts accumulated. Under sprinkler irrigation, marginal levels of salts were rather uniformly distributed throughout the root zone. This pattern prevailed in the fall for both total soluble salts and chloride.
In addition to the soil analyses report above, leaf samples were taken for chloride analysis for two varieties in each plot in September or October, beginning in 1971. Average leaf levels for the two varieties are shown in Table 19.
At each sampling date, leaf chloride was slightly lower in Reed than in Hass indicating a lower rate of chloride uptake by Reed. Reed is a relatively new variety and little is yet known about its uptake characteristics with respect to chloride. In both varieties, leaf chloride by fall was higher than desirable in 1972 and in subsequent years, reflecting accumulation of chloride in the root zone as mentioned earlier. Chloride content in excess of 0.25-0.50 percent in fall sampled avocado leaves will cause leaf burn.

Average leaf chloride values for the drip irrigation treatment were consistently lower in both varieties than for the sprinkler irrigation treatment. These differences may be associated with the greater dilution of soil salts attainable with drip irrigation. Some burn on older leaves was observable each year on most trees in the orchard. This condition began in the fall and increased progressively until late winter when senescence and leaf drop occurred. Leaf burn ratings made on February 28, 1974 are shown in Table 20. The values are averages for all trees of each variety.
Degree of leaf burn was higher for Hass than Reed trees for both methods of irrigation; this is in line with leaf chloride values measured the previous fall. Irrigation treatment appeared to have no significant effect on leaf burn. Both soil and leave analyses indicate that the amount of irrigation water applied was not sufficient for complete salinity control under either drip or sprinkler irrigation. In early winter of 1974, severe leaf burn occurred on the drip irrigated plots. The automatic tensiometers kept the soil at the designated soil suction, but did not apply sufficient water for leaching. To counteract this, the drip irrigation schedule was returned to time clock control for leaching. Duration of irrigation by sprinklers was increased, starting in July 1974, to achieve more leaching for salinity control. In 1975, leaf chloride levels were reduced under both irrigation methods. SUMMARY The Drip Irrigation on Avocados Project, conducted on the Trendel Brothers Orchard, Bonsall, California, was initiated in fall, 1969 and was terminated in fall of 1976. During the six-year field experiment, comparing sprinkler with drip irrigation, many tests and evaluations were made. These included: leaf analysis for learning of nutrient uptake, soil analysis for nutrient and salt levels, tree growth determinations by measuring trunk above and below bud union, tree canopy growth, height and width, equipment performance, uniformity of fertilizer through system, excavations to determine wetting pattern and root development, climatic data, including maximum-minimum temperatures, humidity, wind direction and velocity, soil temperature (1'), and simulated leaf surface temperature, yields, soil moisture tensions (tensiometers), water use, and evaporative pan data. The overall view of the project, and the conclusions regarding drip irrigation on avocados are as follows: 1. Drip irrigation works satisfactorily on avocados in San Diego County.

2. Drip irrigation can now be accepted as another method of irrigation along with furrows, basin, and fixed and rotating sprinklers.
3. Frequent water application (daily) gives a fast start to young trees. 4. Water use is appreciably less in early years. In the first year, for instance, 75% less
water was used on trees under drip irrigation as compared with fixed sprinklers. 5. Enough emitters should be used to wet a substantial volume of soil as trees grow.
Never use only one emitter per tree because of the possibility of clogging. 6. As trees mature, yield may be less under drip irrigation than from sprinkled trees,
probably because insufficient soil volume is wetted. However, yield per acre-inch of water used is higher on drip irrigated trees than with sprinklers.
7. Drip irrigation must not be terminated as early as sprinkling after fall rains begin because of the high accumulation of salts in the soil surface which are washed down into the root zone. Under sprinkler irrigation, two inches of rain from the first rainstorm must fall before stopping the usual summer irrigation schedule. For drip irrigation, three inches of rainfall must be recorded from a storm before turning off the system.
8. Automatic tensiometer controlled irrigation is efficient and works well during the rain-free season.
9. Both drip irrigation systems, Netafim and Drip-Eze, operated with very few problems. 10. Leaf nitrogen was adequate in fall sampled leaves, whether fertilizer nitrogen was
applied through the irrigation water or broadcast. 11. Foliage color in spring indicated that nitrogen was less than optimum in drip irrigated
trees and that a variable rate of nitrogen application, higher at the beginning of the irrigation season, may be desirable for drip irrigated avocados.
12. Sprinkler irrigated trees tended to have slightly higher leaf levels of phosphorus and potassium than did drip irrigated trees, possibly due to differences in root volumes. Leaf levels of both elements were adequate regardless of method of irrigation.
13. Soil salinity rose to marginal levels in the root zone by the end of the irrigation season. Winter rains were effective in leaching excess salts.
14. Leaf chloride was slightly lower in Reed than in the Hass variety indicating a lower rate of uptake of chloride by Reed.
15. Both avocado varieties had consistently less leaf chloride under drip than sprinkler irrigation. The differences may be associated with the greater dilution of salts attainable with drip irrigation.
In summary, drip irrigation works satisfactorily on avocado trees. Because this type of irrigation is a more sophisticated method, good management is necessary. This means the system must be monitored on a regular basis to be sure the equipment performs correctly.