drinking water source assessment for the city of … of the city of willard water treatment plant....
TRANSCRIPT
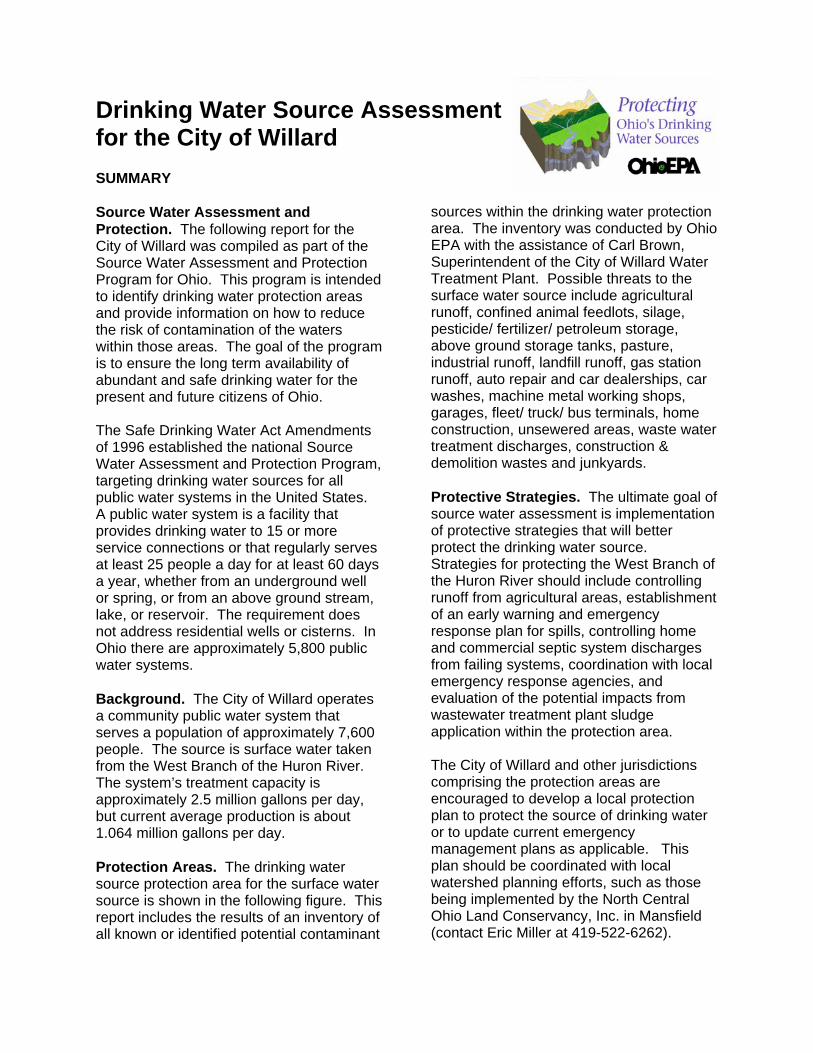
Drinking Water Source Assessmentfor the City of WillardSUMMARY
Source Water Assessment andProtection. The following report for theCity of Willard was compiled as part of theSource Water Assessment and ProtectionProgram for Ohio. This program is intendedto identify drinking water protection areasand provide information on how to reducethe risk of contamination of the waterswithin those areas. The goal of the programis to ensure the long term availability ofabundant and safe drinking water for thepresent and future citizens of Ohio.
The Safe Drinking Water Act Amendmentsof 1996 established the national SourceWater Assessment and Protection Program,targeting drinking water sources for allpublic water systems in the United States. A public water system is a facility thatprovides drinking water to 15 or moreservice connections or that regularly servesat least 25 people a day for at least 60 daysa year, whether from an underground wellor spring, or from an above ground stream,lake, or reservoir. The requirement doesnot address residential wells or cisterns. InOhio there are approximately 5,800 publicwater systems.
Background. The City of Willard operatesa community public water system thatserves a population of approximately 7,600people. The source is surface water takenfrom the West Branch of the Huron River. The system’s treatment capacity isapproximately 2.5 million gallons per day,but current average production is about1.064 million gallons per day.
Protection Areas. The drinking watersource protection area for the surface watersource is shown in the following figure. Thisreport includes the results of an inventory ofall known or identified potential contaminant
sources within the drinking water protectionarea. The inventory was conducted by OhioEPA with the assistance of Carl Brown,Superintendent of the City of Willard WaterTreatment Plant. Possible threats to thesurface water source include agriculturalrunoff, confined animal feedlots, silage,pesticide/ fertilizer/ petroleum storage,above ground storage tanks, pasture,industrial runoff, landfill runoff, gas stationrunoff, auto repair and car dealerships, carwashes, machine metal working shops,garages, fleet/ truck/ bus terminals, homeconstruction, unsewered areas, waste watertreatment discharges, construction &demolition wastes and junkyards.
Protective Strategies. The ultimate goal ofsource water assessment is implementationof protective strategies that will betterprotect the drinking water source. Strategies for protecting the West Branch ofthe Huron River should include controllingrunoff from agricultural areas, establishmentof an early warning and emergencyresponse plan for spills, controlling homeand commercial septic system dischargesfrom failing systems, coordination with localemergency response agencies, andevaluation of the potential impacts fromwastewater treatment plant sludgeapplication within the protection area.
The City of Willard and other jurisdictionscomprising the protection areas areencouraged to develop a local protectionplan to protect the source of drinking wateror to update current emergencymanagement plans as applicable. Thisplan should be coordinated with localwatershed planning efforts, such as thosebeing implemented by the North CentralOhio Land Conservancy, Inc. in Mansfield(contact Eric Miller at 419-522-6262).

These efforts ultimately will help protect thedrinking water source. Guidance on how toform a Drinking Water Protection Team andprotection plan is available from Ohio EPAby calling (614) 644-2752.
For More Information. Additionalinformation on protective strategies and howthis assessment was completed is includedin the detailed Drinking Water SourceAssessment Report for the City of Willard.
For information on how to obtain a copy ofthis report, please visit Ohio EPA’s SourceWater Assessment and Protection ProgramWeb page at
http://www.epa.state.oh.us/ddagw/pdu/swap.html or contact the City of Willard for acopy.
Current information on the quality of thetreated water supplied by the City of Willardis available in the Consumer ConfidenceReport (CCR) for the City of Willard PublicWater System. The CCR is distributedannually and reports the most currentdetected contaminants and any associatedhealth risks from data collected during thepast five years. Consumer ConfidenceReports are available from the City ofWillard.
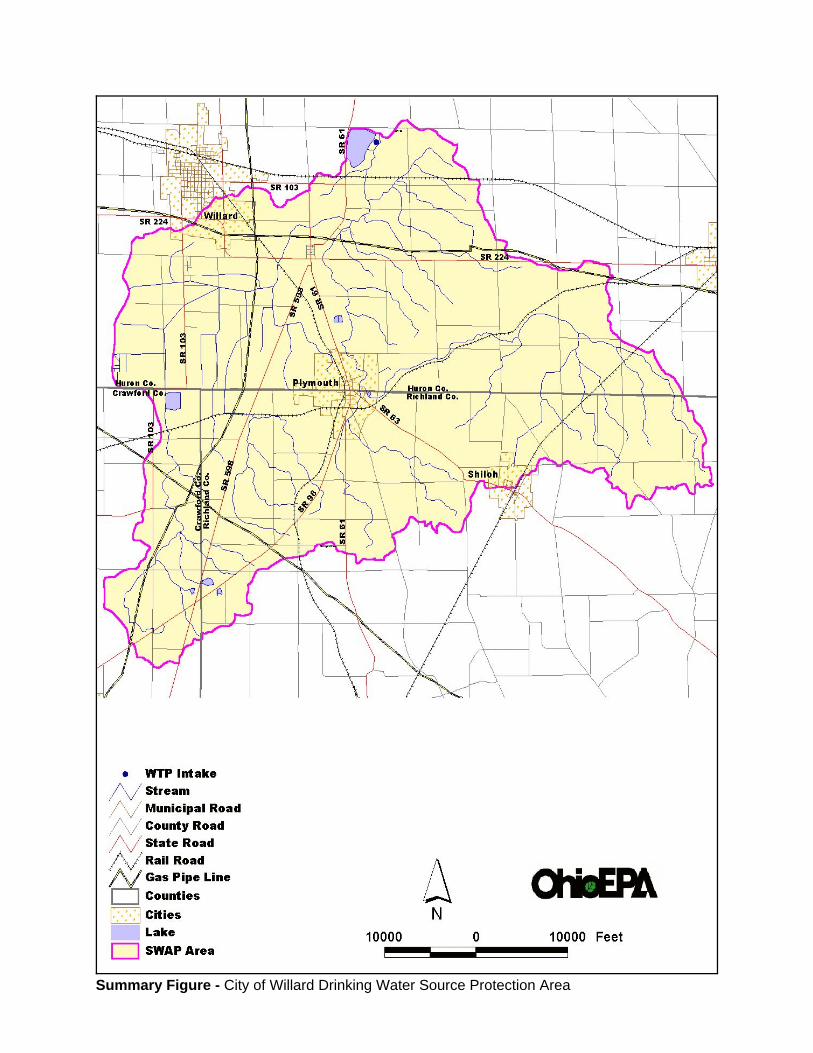
Summary Figure - City of Willard Drinking Water Source Protection Area
Drinking Water Source Assessment
for the City of Willard
Public Water System # 3901511
Huron County
Prepared by:Ohio Environmental Protection Agency
Division of Surface WaterDivision of Drinking and Ground Waters
Northwest District Office
November, 2003
1
How to Use this Assessment
Clean and safe drinking water is essential to everyone. Protecting the source of drinking wateris a wise and cost effective investment. The purpose of this drinking water source assessmentis to provide information your community can use to develop a local Drinking Water ProtectionProgram. The Drinking Water Source Assessment benefits your community by providing thefollowing:
A basis for focusing limited resources within the community to protect the drinking watersource(s).
The assessment provides your community with information regarding activities within theDrinking Water Source Protection Area that directly affect your water supply sourcearea. It is within this area that a release of contaminants, from a spill or improper usage,may travel through the watershed and reach the surface water intake. By examiningwhere the source waters are most sensitive to contaminants, and where potentialcontaminants are located, the assessment identifies the potential risks that should beaddressed first.
A basis for informed decision-making regarding land use within the community.The assessment provides your community with a significant amount of informationregarding where your drinking water comes from (the source) and what the risks are tothe quality of that source. This information allows your community planning authoritiesto make informed decisions regarding proposed land uses within the protection area thatare compatible with both your drinking water resource and the vision of growthembraced by your community.
A start to a comprehensive plan for the watershed and source water area.This assessment can be the beginning of a comprehensive plan for the water resource,one that addresses all of the uses the water resource provides. An ecologically healthylake, stream and watershed will provide a stable, high quality resource for drinkingwater.
For information about developing a local Drinking Water Source Protection Program, pleasecontact the Ohio EPA Division of Drinking and Ground Waters at (614) 644-2752 or visit theDivision’s web site at http://www.epa.state.oh.us/ddagw/pdu/swap.html.
2
1.0 INTRODUCTION
The 1996 Amendments to the Safe Drinking Water Act established a program for states toassess the drinking water source for all public water systems. The Source Water Assessmentand Protection (SWAP) Program is designed to help Ohio’s public water systems protect theirsources of drinking water from becoming contaminated.
The purpose of this assessment is to identify where and how the City of Willard's source watersare at risk of contamination. The report• identifies the drinking water source protection area,• examines the characteristics of the watershed and the water quality,• inventories the potential contaminant sources within that area, and discusses the
susceptibility of the system to contamination.
Finally, the report suggests actions that the public water supplier and local community may taketo reduce the risk of contaminating their source of drinking water and ensure the long termavailability of abundant and safe drinking water resources.
Results and recommendations presented in this report are based on the information available atthe time of publication. Ohio EPA recognizes that additional information may become availablein the future that could be used to more accurately determine the drinking water sourceprotection area. Also, changes in land use may occur after Ohio EPA completes the potentialcontaminant source inventory. This report should be used as a starting point to develop a planto protect drinking water resources.
This report was prepared by Dana Martin-Hayden and Janet Hageman, Ohio EPA, NorthwestDistrict Office.
2.0 PUBLIC WATER SYSTEM DESCRIPTION
The City of Willard operates a community public water system that serves a population ofapproximately 7,600 people through 2,913 service connections. A community public watersystem is a system that regularly supplies drinking water from its own sources to at least 15service connections used by year-round residents of the area or regularly serves 25 or morepeople throughout the entire year. The water treatment system obtains its water from the WestBranch of the Huron River. The system's treatment capacity is approximately 2.5 million gallonsper day, but current average production is 1.064 million gallons per day. Water is pumped fromthe river to a 2.3 billion gallon reservoir. The City of Willard's water treatment system consistsof coagulation, sedimentation, filtration, adsorption, stabilization, fluoridation and disinfection.
3.0 DRINKING WATER SOURCE PROTECTION AREA
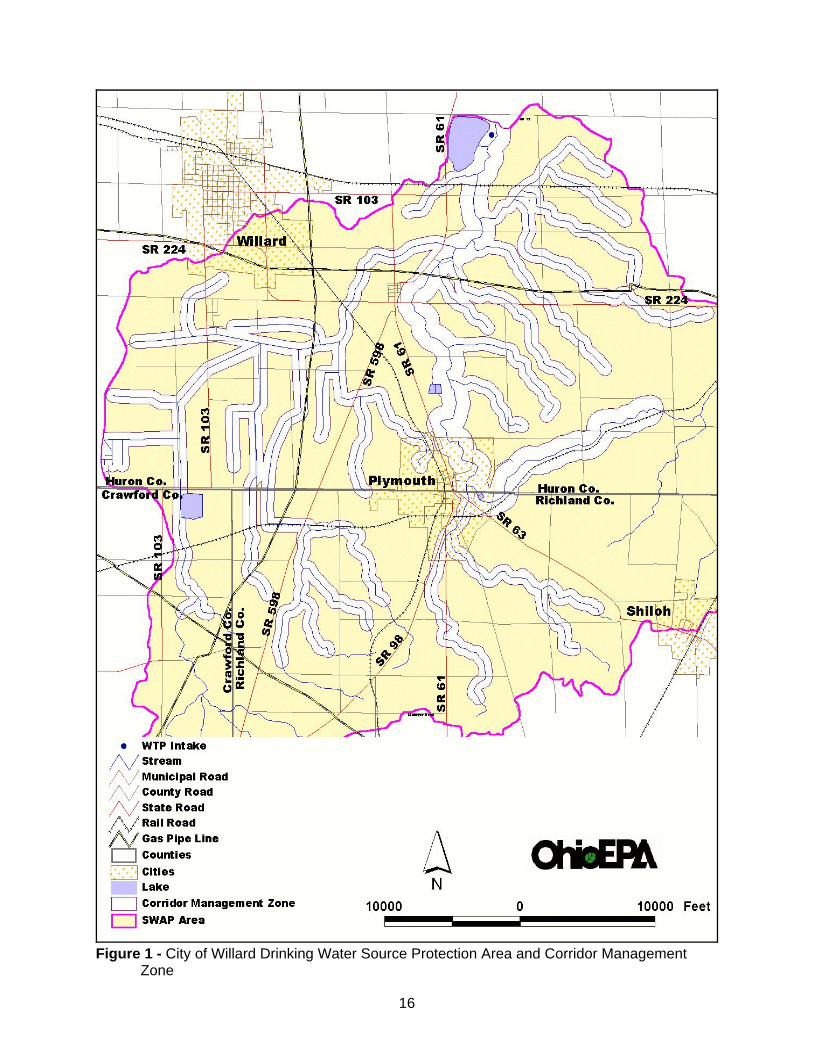
The Drinking Water Source Protection Area (protection area) for an inland stream is definedas the drainage area upstream of the point where the water is withdrawn from a surface sourcesuch as a stream, lake or reservoir. The protection area is subdivided into corridor andemergency management zones. An illustration of the protection area and corridor managementzone for the City of Willard Public Water System is shown in Figure 1. The emergencymanagement zone is shown in Figure 2.
The Corridor Management Zone, (CMZ), is an area along streams and tributaries within thesource water assessment area that warrants delineation, inventory, and management.
3
Typically, this zone runs a total of ten miles upstream from the intake, and includes thetributaries that drain into it. The zone is 1,000 feet wide on each side of the West Branch of theHuron River mainstem and 500 feet wide on each side of any tributaries.
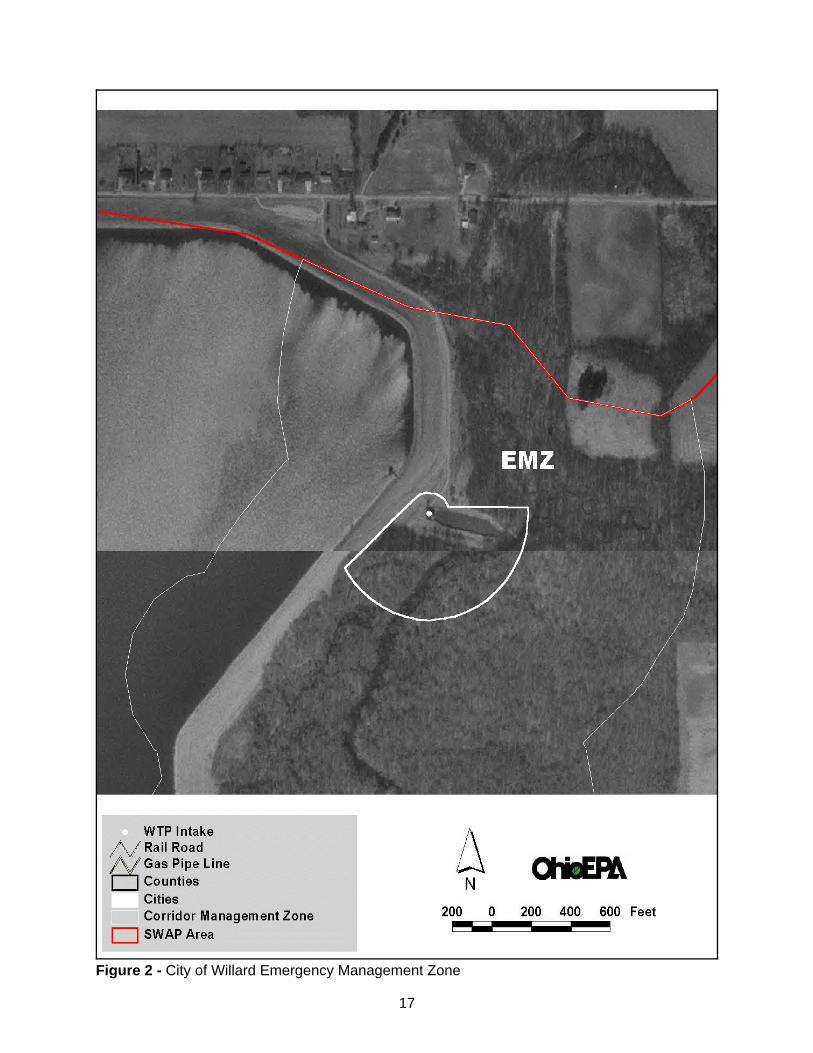
The Emergency Management Zone, (EMZ), is defined as an area in the immediate vicinity ofthe surface water intake in which the public water system operator has little or no time torespond to a spill. The boundary of the emergency management zone is delineated incooperation with the water supplier. Figure 2 shows the boundary of the emergencymanagement zone for the City of Willard Public Water System. The City of Willard’s EmergencyManagement Zone (EMZ) is an area in the immediate vicinity of the West Branch of the HuronRiver intake structure and the upland reservoir. This zone is defined as a semi-circle thatextends 500 feet upstream and 100 feet downstream of the intake.
The corridor and emergency management zones were the focus of field and windshield surveysto inventory potential contaminant sources. Information was also collected during interviewswith water treatment plant personnel.
4.0 HYDROLOGIC SETTING
The West Branch of the Huron River serves as the surface water source for the City of Willard. The West Branch of the Huron River flows into the Huron River and is approximately 46 miles inlength with a drainage area of 262 square miles. The water system intake is located slightlymore than 33.8 miles from the mouth. The protection area comprises approximately 71 squaremiles. The average fall of the West Branch of the Huron River is 10.8 feet per mile. Annualaverage precipitation in the protection area is approximately 36 to 37 inches, of which 10 to 11inches become surface runoff.
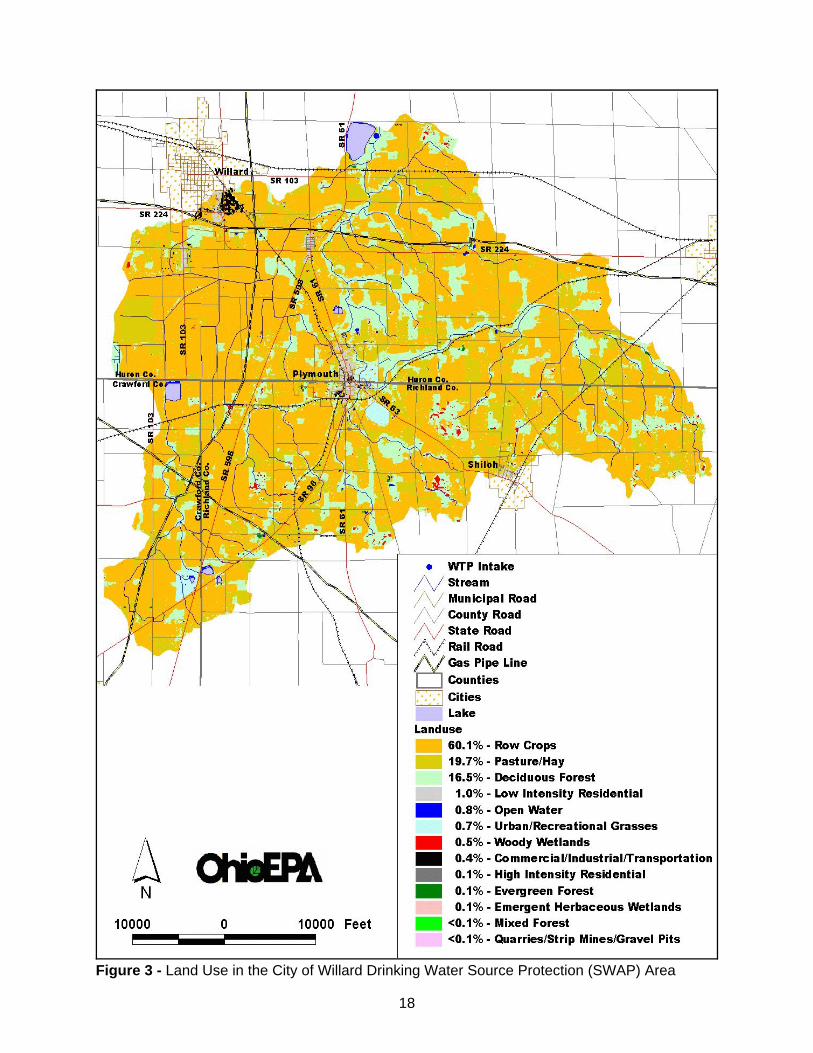
Figure 3 shows the land use for the protection area. The predominant land use is agriculture/open urban, non-impervious (e.g. lawns), agriculture at 75.77% of the total area. The percentage cover for other land uses includes: 21.62% wooded, 1.30% shrub, 0.55%nonforested wetlands, 0.41% urban/impervious, 0.26% open water, and 0.09% barren.
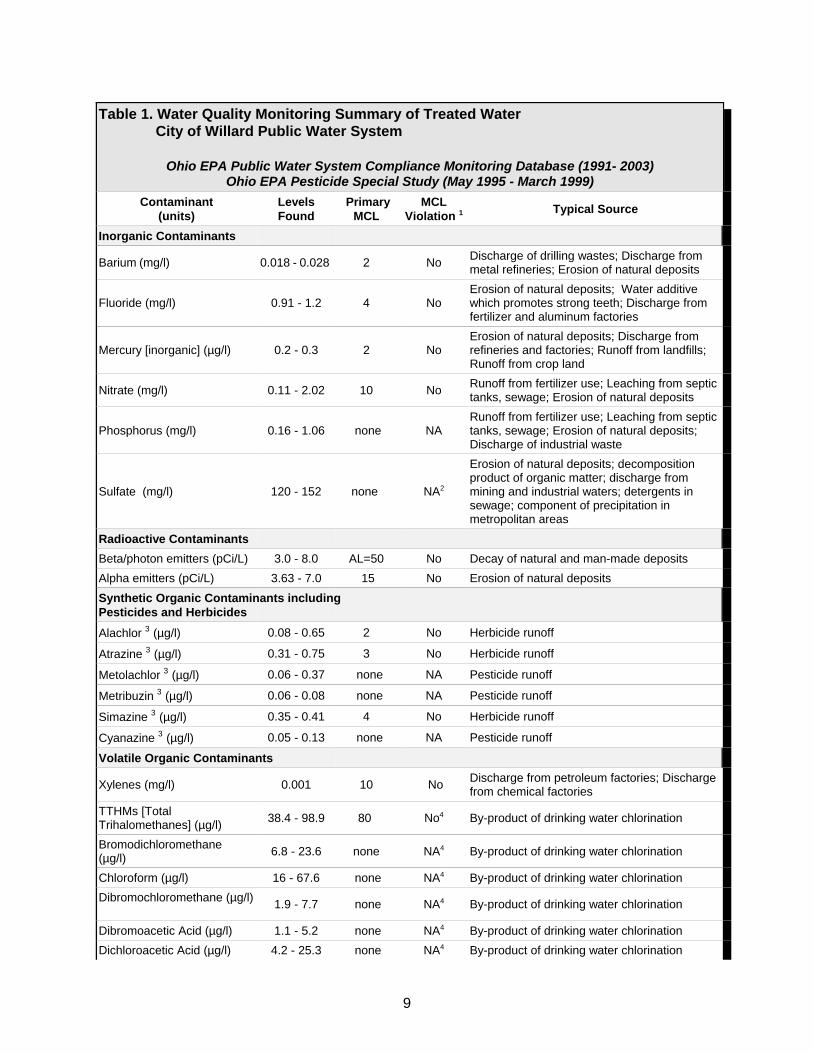
Drinking Water Quality Monitoring SummaryAvailable chemical and biological water quality data collected from the streams in the protectionarea, and sampling results from finished water reported to Ohio EPA by the public watersupplier were evaluated to characterize water quality. A review of the City of Willard compliancemonitoring data (for treated drinking water) from 1991-2002 revealed that the system had nohealth based or maximum contaminant level (MCL) violations. Table 1 lists contaminants whereat least one result was above the level of detection, and does not include all contaminantstested for by the public water system. Several pesticides (alachlor, atrazine, metolachlor,metribuzine, simazine, and cyanazine) were detected in the City of Williard’s finished water,indicating an impact from land use activities within the watershed.
It should be recognized that sampling results presented in this report can only provideinformation on the quality of the water at the time the sample was collected. Water quality maychange over time due to a number of reasons. Therefore, it is recommended that the readeralso consult the most recent Consumer Confidence Report (CCR) for the City of Willard publicwater system. All public water systems are required to annually prepare and distribute the CCRto their customers. The report is a good source of information on health effects associated withdetected contaminants and contains information on the community's drinking water, includingthe source of the water, contaminants detected, the likely sources of detected contaminants,
4
and the potential health effects of contaminants at levels above the drinking water standards.
Biological and Chemical Monitoring in the West Branch of the Huron River and itsTributariesWater quality data are available for nine sampling sites in the Willard corridor management zone(CMZ). These sites were sampled in 1998 and 2002 as part of the Biological and Water QualityStudy of the Huron River and Selected Tributaries. Results of stream samples are availablefrom the Ohio EPA, Division of Surface Water.
Five sampling sites were located on the West Branch Huron River within the Willard CMZ (RM33.5 to RM 45.4). The most upstream site (RM 42.23), which is upstream of the Village ofPlymouth, was in full attainment of the Warmwater Habitat (WWH) aquatic life use designation. On the downstream side of Plymouth, the use becomes impaired and is only partially attainingthe WWH use at RM 40.35. The West Branch Huron River at Skinner Road (RM 38.40), whichis downstream of the Plymouth WWTP lagoon discharge, is in non-attainment of the WWH use. At Klein Road (RM 36.26), there is some recovery, and the river at this site was partiallyattaining the WWH use. Further downstream, at Green Bush Road (RM 35.33), the WestBranch is once again in full attainment. The Plymouth WWTP is the primary stressor of thisimpaired section of the West Branch Huron River. The Plymouth WWTP frequently violatesNPDES permit limits for dissolved oxygen (DO), cBOD5, and total suspended solids (TSS). Elevated levels of ammonia and phosphorus were also recorded. However, there is also impactto the stream occurring upstream of the WWTP. High bacteria levels at RM 40.35 are the resultof failing onlot septic systems discharging to the stream. There may also be some impact fromlivestock which have access to the West Branch Huron River Tributary on the upstream side ofPlymouth. Three sites on Marsh Run and one of its tributaries are all in non-attainment of theWWH use designation. Marsh Run is very channel modified and is also impacted by nutrientinputs from agricultural areas. Use attainment of both the West Branch Huron River and MarshRun could also have been compromised by water withdrawals for irrigation during the alreadylow flow conditions in 2002.
Downsteam of the Plymouth WWTP at Skinner Road, the most impacted West Branch HuronRiver site, DO levels were frequently below the Ohio EPA Water Quality Criteria (OAC 3745-1)during the 2002 sampling. There were two exceedences of ammonia and three elevatedphosphorus levels in the 2002 samples as well. Manganese levels at this site exceeded theWater Quality Criterion established for the protection of human health in drinking water in 2002,but not in 1998. However, the criteria for the protection of human health only directly apply towaters within 500 yards of a drinking water intake. Upstream of the WWTP (RM 40.35), therewere three exceedences of the Primary Contact Recreation Criteria for fecal coliform bacteria. There were also some slightly elevated manganese levels. At Green Bush Road (RM 35.33),which is the site closest to the Willard drinking water intake, levels of manganese, totaldissolved solids (TDS), and sulfate all exceeded the human health criteria for untreated surfacewaters. The water quality at this site appears to be affected by Marsh Run, where there werealso exceedences of the criteria for these same parameters. The human health criterion foraluminum was exceeded in three samples from Marsh Run as well.
In 1998, samples were also collected at selected sites in the Huron River Basin to characterizenew age pesticide concentrations in the vicinity of the Monroeville and Norwalk WTPs. Theresults of these samples are presented in Table 2. One of the sites sampled was in Marsh Run,within the Willard CMZ. Low levels of atrazine, cyanazine and metolachlor were detected.5.0 POTENTIAL CONTAMINANT SOURCES
A review of available regulated facility data bases and a field survey of the corridor management
5
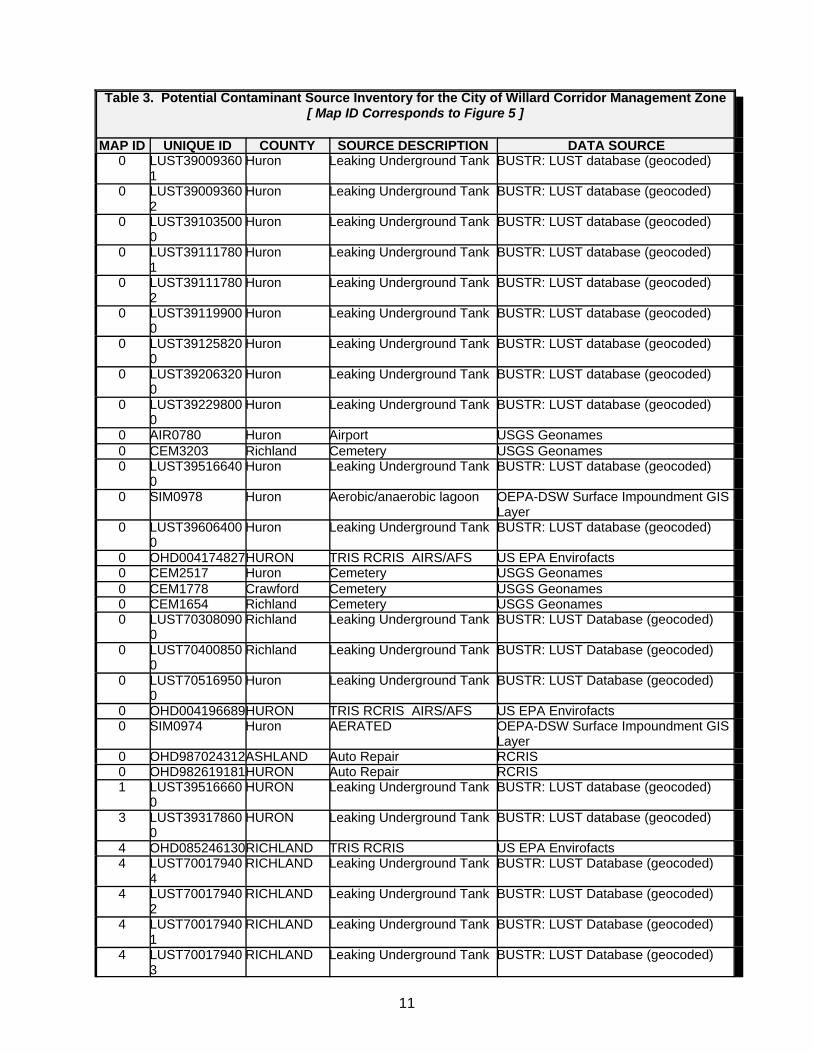
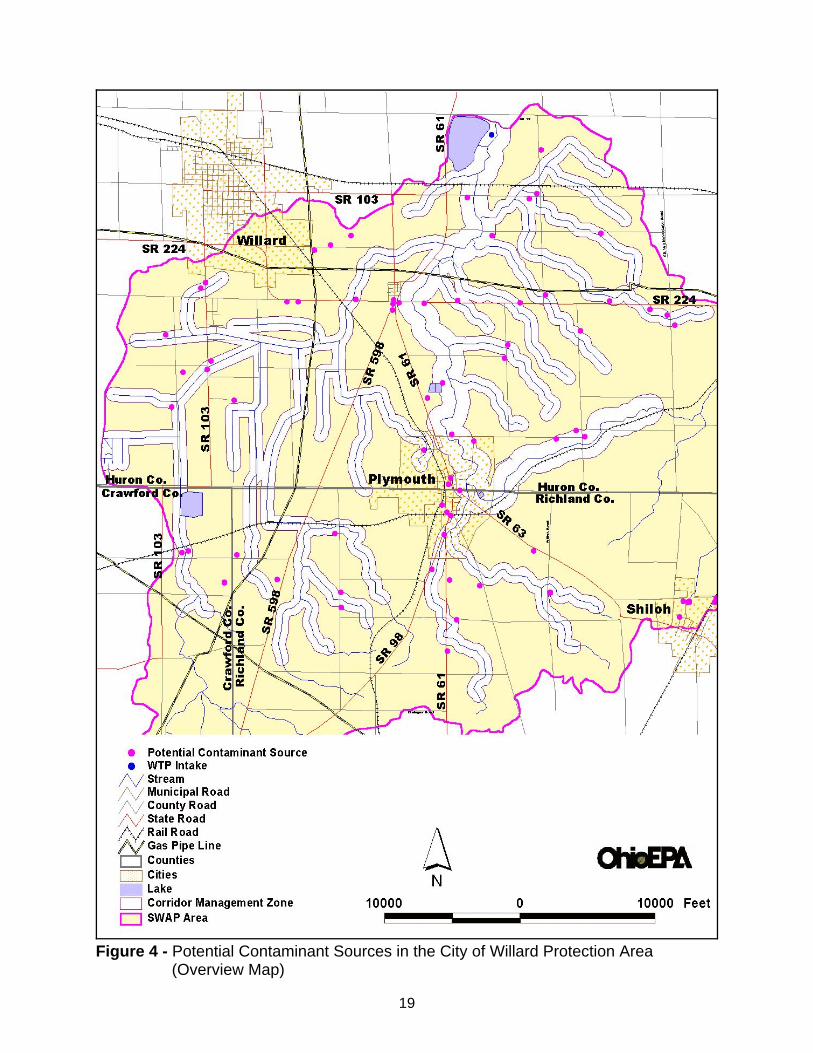
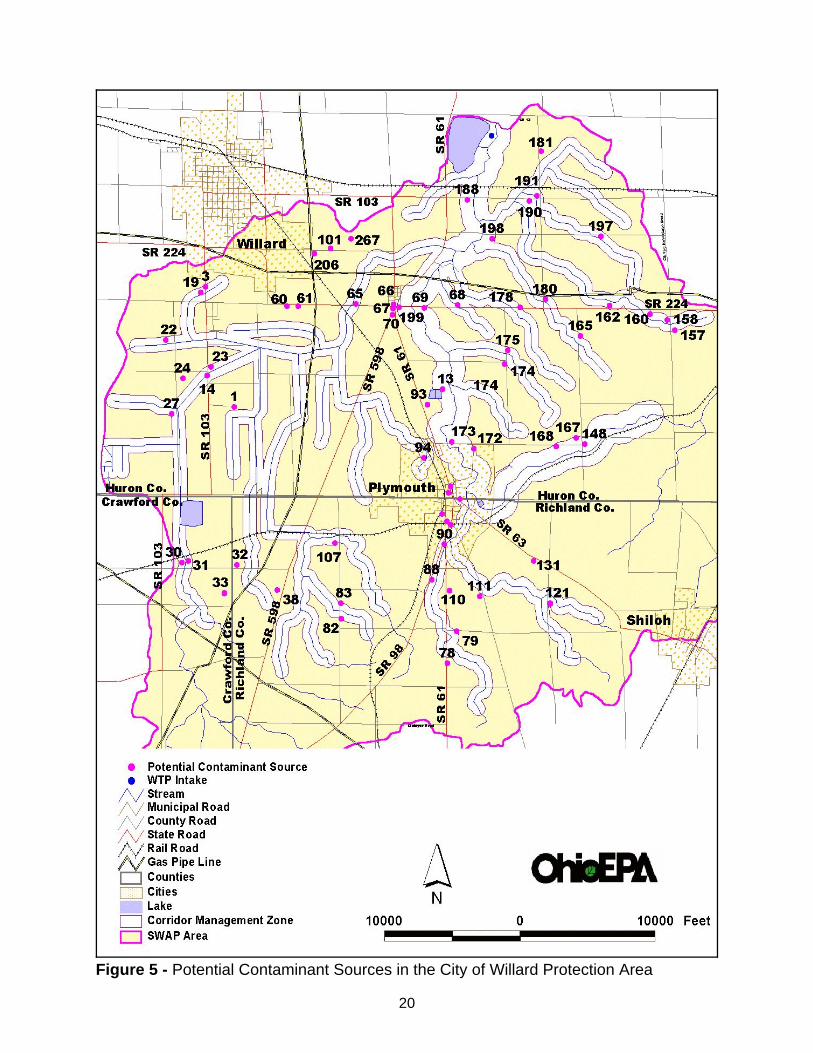
zone indicate that 73 potential contaminant sources are present in the drinking water sourceprotection area. Only 39 of these sources are within the corridor management zone and noneare within the emergency management zone. Table 3 provides a list of the identified potentialcontaminant sources in the drinking water source protection area. The location of potentialcontaminant sources in the protection area is shown in Figures 4 and 5.
It is important to note that this inventory represents potential contaminant sources, and includesany source that has the potential to release a contaminant to surface or ground waters in theprotection area. It is beyond the scope of this study to determine whether any specific potentialsource is actually releasing a contaminant, or to what extent any potential source(s) may becontributing to the overall pollutant load.
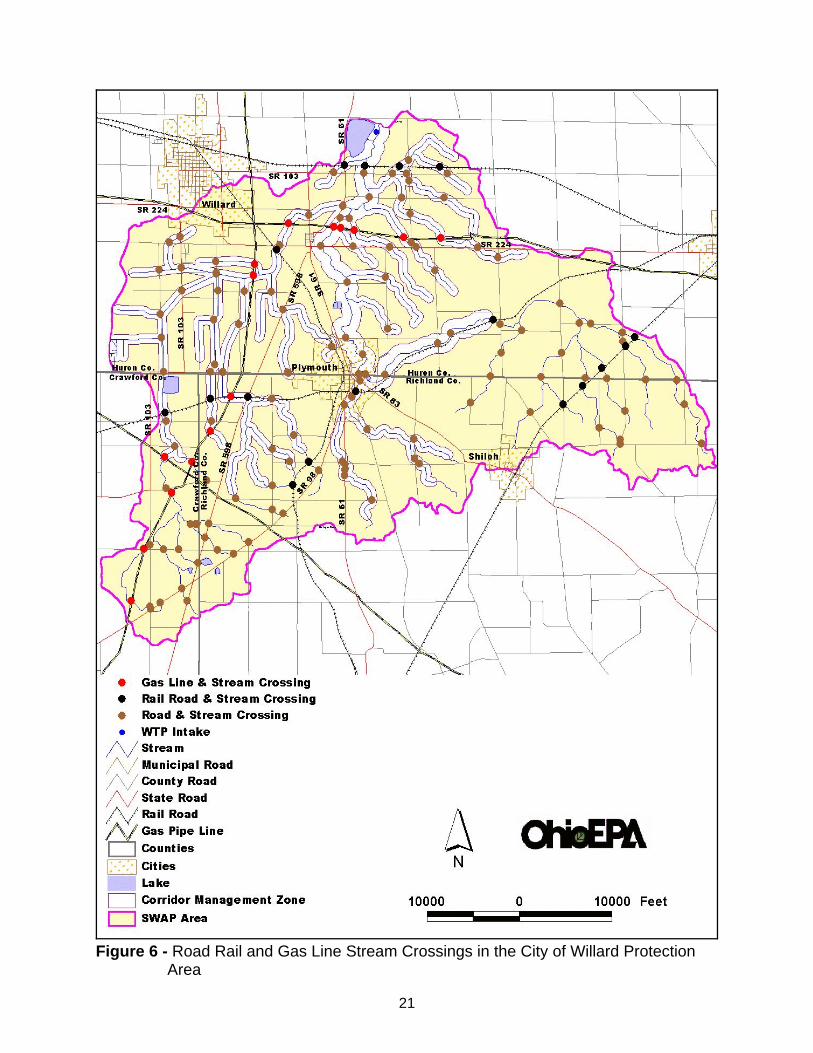
The transportation network is a potential source of contamination through vehicular accidentsthat release hazardous materials. Approximately 168 miles of roads and 24 miles of rail linestraverse the protection area, creating a total of 143 road and 17 rail crossings of the WestBranch of the Huron River or its tributaries.
Approximately 5 miles of roads and 1.1 miles of rail are within 100 feet of a stream. Approximately 86 of the road crossings and nine of the rail crossings occur within the corridormanagement zone. Figure 6 shows the locations where road and rail lines cross the WestBranch of the Huron River or tributaries.
Extensive petroleum and natural gas production within the protection area and the corridormanagement zone is also considered a potential source of contamination to surface and groundwaters. A total of 15 oil and gas wells are located in the City of Willard protection area, of whichtwo are found within the corridor management zone. Approximately 0.5 miles of gas lines arewithin 100 feet of a stream. Approximately 11 of the gas line crossings occur within the corridormanagement zone. Figure 6 also shows the locations where the gas lines cross the WestBranch of the Huron River. Figure 7 shows the locations of oil and gas wells located in the Cityof Willard Protection Area.
Pollution impacts related to spills are mostly petroleum related, with other releases resultingfrom industrial, commercial, or agricultural activities.
6.0 SUSCEPTIBILITY ANALYSIS
For the purposes of source water assessments, all surface waters are considered to besusceptible to contamination. By their nature surface waters are accessible and can be readilycontaminated by chemicals and pathogens, with relatively short travel times from source to theintake. Based on the information compiled for this assessment, the City of Willard’s drinkingwater source protection area is susceptible to agricultural runoff, confined animal feedlots,silage, pesticide/ fertilizer/ petroleum storage, above ground storage tanks, pasture, industrialrunoff, landfill runoff, gas station runoff, auto repair and car dealerships, car washes, machinemetal working shops, garages, fleet/ truck/ bus terminals, home construction, unsewered areas,waste water treatment discharges, construction and demolition wastes and junkyards.
It is important to note that this assessment is based on available data, and therefore may notreflect current conditions in all cases. Water quality, land uses and other activities that arepotential sources of contamination may change with time. While the source water for the City ofWillard Public Water System is considered susceptible to contamination, historically, the City ofWillard Public Water System has effectively treated this source water to meet drinking waterquality standards.
6
7.0 PROTECTIVE STRATEGIES
Source water protection efforts for the City of Willard should focus on controlling agriculturalrunoff and runoff from cattle grazing pastures, with particular attention to sources of pesticides,nitrates, phosphorus, and microorganisms such as fecal coliform bacteria. This can beaccomplished via educational efforts. County extension agents are an excellent resource forassisting the agricultural community with controlling agricultural runoff, and staff from local andcounty health offices can instruct homeowners in proper maintenance of their septic systems.
Other source water protection efforts may include:
Education and Outreach: Informing people who live, work, or own property within theprotection area about the benefits of drinking water protection is very important. Although somecommunities develop their own educational outreach resources, assistance is available at nocost from various agencies. For example, staff from Ohio EPA’s Office of Pollution Preventioncan visit businesses (free of charge) and provide recommendations on how they can modifytheir processes, materials and practices to generate less pollution in a cost-effective andtechnically feasible manner. An effort should be made to educate homeowners and businessesof the potential threat their activities can pose to the water supply. Education could also focuson increasing public awareness of illegal dumping and drinking water protection, particularly in recreational boating areas.
Coordination with Existing Activities: Many local groups are engaged in programs thatcomplement a public water system’s drinking water source protection efforts. Working withgroups such as the Natural Resources Conservation Service, the Soil and Water ConservationDistrict, the Ohio Farm Bureau, or a local watershed planning organization ensures coordinationof their respective programs. Local watershed planning organizations include the North CentralOhio Land Conservancy, Incorporated located at Suite 300, 24 West 3rd Street in Mansfield,Ohio 44903. Contact Eric Miller, Trustee by phone at (419) 522-6262. Oil and Gas Production: Provide education (material/meetings) to owners and land owners onproper operation and maintenance. Develop an early warning system for accidental spills andreleases.
Agricultural Activities: Provide education to local farmers on the use of best managementpractices to reduce agricultural and animal feedlot runoff, use of proper manure handlingfacilities, proper handling and road safety with agricultural chemicals, and other methods tocontrol or reduce impacts to surface waters.
Transportation Routes: There is a potential for spills along roads within the protection area.The City of Willard may want to consider contacting the local fire department and localemergency planning agency about the location of the drinking water source protection area, sothat strategies can be developed to prevent spilled materials from impacting the West Branch ofthe Huron River.
Emergency Response Planning: The City of Willard should prepare a plan that includes earlywarning of spills and coordination of response and remediation activities for spills that may enterthe West Branch of the Huron River. This plan should include emergency response actions forthe West Branch of the Huron River, such as the placement of absorbent booms to control oilspills, or the ability to mechanically add oxygen to oxidize chemicals with a high oxygen
7
demand. Different response plans could be developed for different types of contamination. Theemergency response plan may also contain strategies for dealing with unexpected levels ofrunoff containing chemicals such as fertilizers and pesticides from adjacent land uses. Thoughit may be less catastrophic than a major spill, this kind of contamination is more prevalent and isharder to detect and contain.
Water Quality Monitoring: Monitoring does not directly prevent contamination, but theprotection plan will be more effective if the City of Willard conducts periodic monitoring of rawwater quality and quantity from the West Branch of the Huron River. For example, monitoringdata can be used to (1) determine optimal conditions or seasons for pumping water to thereservoirs; (2) estimate time-of-travel for a chemical to reach the water treatment intake fromvarious locations in the West Branch of the Huron River; (3) track water quality trends; and (4)evaluate the effectiveness of selected protective strategies. Sampling locations and schedulescould be modified on an emergency basis to monitor spills or the runoff of contaminants thatmay enter the West Branch of the Huron River.
Zoning Ordinances: A water protection zoning ordinance is a regulatory control that typicallyplaces some restrictions or standards on activities conducted within a specified zone (such asthe corridor management zone and/or the emergency management zone). Such ordinancesenable the municipality to require people who live or work in this area to avoid contaminating thesource of the municipality’s drinking water. Ordinances can help ensure best managementpractices are being employed at local businesses and can help reduce the volume ofcontaminants stored within the protection area. The City of Willard may want to considerworking with the counties, townships, and municipalities in the protection area to develop zoningoverlays that require specific standards for chemical storage, handling of waste materials, andother source control strategies. Several communities in Ohio have enacted very successfuldrinking water source protection ordinances. Copies can be obtained by contacting Craig Smithat (614) 644-2752.
Regulatory Compliance: Where possible, the City of Willard can monitor the compliance ofpotential contaminant sources with existing regulations through inspections and/or contact withregulatory agencies. If routine inspections are a regulatory requirement, they provide anexcellent opportunity to educate an important segment of the community about the importanceof drinking water source protection. Inspections also provide an opportunity to encourageimproved materials handling procedures, hazardous materials training, waste and disposalassessments, facility spill/contingency planning, and pollution prevention initiatives.
Ohio EPA encourages the City of Willard to incorporate the types of protective strategies listedabove into a drinking water source protection plan. Two guidance documents are available fromOhio EPA to assist with development of such a plan. A Guide to Developing Local WatershedAction Plans in Ohio is available on the internet at www.epa.state.oh.us/dsw/hps/wsguide.pdfand Developing Local Drinking Water Source Protection Plans in Ohio is available atwww.epa.state.oh.us/ddagw/pdu/swap_psdoc.pdf. For more information on drinking watersource protection please contact the Drinking Water Protection staff at (614) 644-2752.
8
References
Chow, Ven Te, et al. Handbook of Applied Hydrology, A Compendium of Water-ResourcesTechnology. McGraw-Hill, 1964. Page 21-10.
Gazetteer of Ohio Streams, Second Edition, Ohio Department of Natural Resources, Division ofWater. 2001.
Harstine, Leonard J.. 1991. Hydrologic Atlas for Ohio. Water Inventory Report No. 28. State ofOhio Department of Natural Resources. Columbus, Ohio.
Ohio EPA. 2002. EAS Division of Surface Water aquatic life attainment status table for HuronRiver study area.
Ohio EPA. 2002, 1998. NWDO Division of Surface Water Monitoring Data.
Ohio EPA. 2000. Year 2000 Ohio Water Resource Inventory. Appendix D1- 2000 305(b):Rivers and Streams.
9
Table 1. Water Quality Monitoring Summary of Treated Water City of Willard Public Water System
Ohio EPA Public Water System Compliance Monitoring Database (1991- 2003)Ohio EPA Pesticide Special Study (May 1995 - March 1999)
Contaminant(units)
LevelsFound
PrimaryMCL
MCLViolation 1 Typical Source
Inorganic Contaminants
Barium (mg/l) 0.018 - 0.028 2 No Discharge of drilling wastes; Discharge frommetal refineries; Erosion of natural deposits
Fluoride (mg/l) 0.91 - 1.2 4 NoErosion of natural deposits; Water additivewhich promotes strong teeth; Discharge fromfertilizer and aluminum factories
Mercury [inorganic] (µg/l) 0.2 - 0.3 2 NoErosion of natural deposits; Discharge fromrefineries and factories; Runoff from landfills;Runoff from crop land
Nitrate (mg/l) 0.11 - 2.02 10 No Runoff from fertilizer use; Leaching from septictanks, sewage; Erosion of natural deposits
Phosphorus (mg/l) 0.16 - 1.06 none NARunoff from fertilizer use; Leaching from septictanks, sewage; Erosion of natural deposits;Discharge of industrial waste
Sulfate (mg/l) 120 - 152 none NA2
Erosion of natural deposits; decompositionproduct of organic matter; discharge frommining and industrial waters; detergents insewage; component of precipitation inmetropolitan areas
Radioactive Contaminants Beta/photon emitters (pCi/L) 3.0 - 8.0 AL=50 No Decay of natural and man-made depositsAlpha emitters (pCi/L) 3.63 - 7.0 15 No Erosion of natural depositsSynthetic Organic Contaminants including Pesticides and Herbicides
Alachlor 3 (µg/l) 0.08 - 0.65 2 No Herbicide runoff
Atrazine 3 (µg/l) 0.31 - 0.75 3 No Herbicide runoff
Metolachlor 3 (µg/l) 0.06 - 0.37 none NA Pesticide runoff
Metribuzin 3 (µg/l) 0.06 - 0.08 none NA Pesticide runoff
Simazine 3 (µg/l) 0.35 - 0.41 4 No Herbicide runoff
Cyanazine 3 (µg/l) 0.05 - 0.13 none NA Pesticide runoff
Volatile Organic Contaminants
Xylenes (mg/l) 0.001 10 No Discharge from petroleum factories; Dischargefrom chemical factories
TTHMs [TotalTrihalomethanes] (µg/l) 38.4 - 98.9 80 No4 By-product of drinking water chlorination
Bromodichloromethane (µg/l) 6.8 - 23.6 none NA4 By-product of drinking water chlorination
Chloroform (µg/l) 16 - 67.6 none NA4 By-product of drinking water chlorinationDibromochloromethane (µg/l) 1.9 - 7.7 none NA4 By-product of drinking water chlorination
Dibromoacetic Acid (µg/l) 1.1 - 5.2 none NA4 By-product of drinking water chlorinationDichloroacetic Acid (µg/l) 4.2 - 25.3 none NA4 By-product of drinking water chlorination
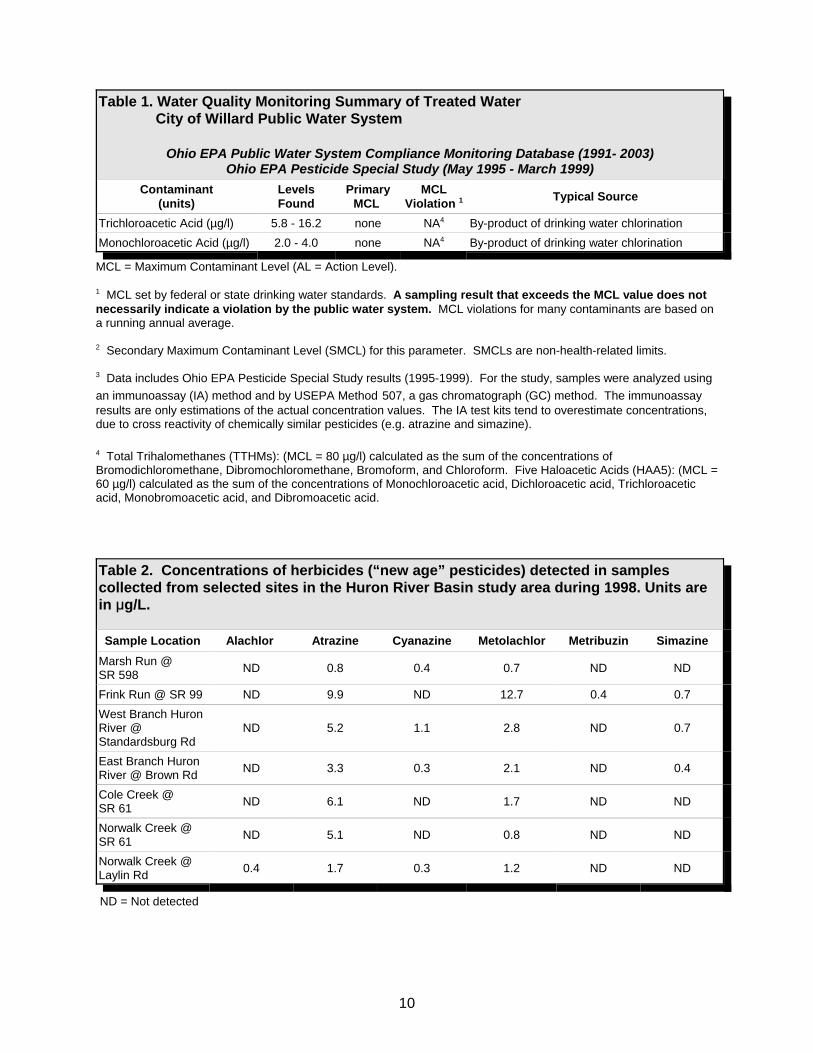
Table 1. Water Quality Monitoring Summary of Treated Water City of Willard Public Water System
Ohio EPA Public Water System Compliance Monitoring Database (1991- 2003)Ohio EPA Pesticide Special Study (May 1995 - March 1999)
Contaminant(units)
LevelsFound
PrimaryMCL
MCLViolation 1 Typical Source
10
Trichloroacetic Acid (µg/l) 5.8 - 16.2 none NA4 By-product of drinking water chlorinationMonochloroacetic Acid (µg/l) 2.0 - 4.0 none NA4 By-product of drinking water chlorination
MCL = Maximum Contaminant Level (AL = Action Level).
1 MCL set by federal or state drinking water standards. A sampling result that exceeds the MCL value does notnecessarily indicate a violation by the public water system. MCL violations for many contaminants are based ona running annual average.
2 Secondary Maximum Contaminant Level (SMCL) for this parameter. SMCLs are non-health-related limits.
3 Data includes Ohio EPA Pesticide Special Study results (1995-1999). For the study, samples were analyzed usingan immunoassay (IA) method and by USEPA Method 507, a gas chromatograph (GC) method. The immunoassayresults are only estimations of the actual concentration values. The IA test kits tend to overestimate concentrations,due to cross reactivity of chemically similar pesticides (e.g. atrazine and simazine).
4 Total Trihalomethanes (TTHMs): (MCL = 80 µg/l) calculated as the sum of the concentrations ofBromodichloromethane, Dibromochloromethane, Bromoform, and Chloroform. Five Haloacetic Acids (HAA5): (MCL =60 µg/l) calculated as the sum of the concentrations of Monochloroacetic acid, Dichloroacetic acid, Trichloroaceticacid, Monobromoacetic acid, and Dibromoacetic acid.
Table 2. Concentrations of herbicides (“new age” pesticides) detected in samplescollected from selected sites in the Huron River Basin study area during 1998. Units arein :g/L.
Sample Location Alachlor Atrazine Cyanazine Metolachlor Metribuzin SimazineMarsh Run @ SR 598 ND 0.8 0.4 0.7 ND ND
Frink Run @ SR 99 ND 9.9 ND 12.7 0.4 0.7West Branch HuronRiver @Standardsburg Rd
ND 5.2 1.1 2.8 ND 0.7
East Branch HuronRiver @ Brown Rd ND 3.3 0.3 2.1 ND 0.4
Cole Creek @ SR 61 ND 6.1 ND 1.7 ND ND
Norwalk Creek @SR 61 ND 5.1 ND 0.8 ND ND
Norwalk Creek @Laylin Rd 0.4 1.7 0.3 1.2 ND ND
ND = Not detected
11
Table 3. Potential Contaminant Source Inventory for the City of Willard Corridor Management Zone[ Map ID Corresponds to Figure 5 ]
MAP ID UNIQUE ID COUNTY SOURCE DESCRIPTION DATA SOURCE0 LUST39009360
1Huron Leaking Underground Tank BUSTR: LUST database (geocoded)
0 LUST390093602
Huron Leaking Underground Tank BUSTR: LUST database (geocoded)
0 LUST391035000
Huron Leaking Underground Tank BUSTR: LUST database (geocoded)
0 LUST391117801
Huron Leaking Underground Tank BUSTR: LUST database (geocoded)
0 LUST391117802
Huron Leaking Underground Tank BUSTR: LUST database (geocoded)
0 LUST391199000
Huron Leaking Underground Tank BUSTR: LUST database (geocoded)
0 LUST391258200
Huron Leaking Underground Tank BUSTR: LUST database (geocoded)
0 LUST392063200
Huron Leaking Underground Tank BUSTR: LUST database (geocoded)
0 LUST392298000
Huron Leaking Underground Tank BUSTR: LUST database (geocoded)
0 AIR0780 Huron Airport USGS Geonames0 CEM3203 Richland Cemetery USGS Geonames0 LUST39516640
0Huron Leaking Underground Tank BUSTR: LUST database (geocoded)
0 SIM0978 Huron Aerobic/anaerobic lagoon OEPA-DSW Surface Impoundment GISLayer
0 LUST396064000
Huron Leaking Underground Tank BUSTR: LUST database (geocoded)
0 OHD004174827HURON TRIS RCRIS AIRS/AFS US EPA Envirofacts0 CEM2517 Huron Cemetery USGS Geonames0 CEM1778 Crawford Cemetery USGS Geonames0 CEM1654 Richland Cemetery USGS Geonames0 LUST70308090
0Richland Leaking Underground Tank BUSTR: LUST Database (geocoded)
0 LUST704008500
Richland Leaking Underground Tank BUSTR: LUST Database (geocoded)
0 LUST705169500
Huron Leaking Underground Tank BUSTR: LUST Database (geocoded)
0 OHD004196689HURON TRIS RCRIS AIRS/AFS US EPA Envirofacts0 SIM0974 Huron AERATED OEPA-DSW Surface Impoundment GIS
Layer0 OHD987024312ASHLAND Auto Repair RCRIS0 OHD982619181HURON Auto Repair RCRIS1 LUST39516660
0HURON Leaking Underground Tank BUSTR: LUST database (geocoded)
3 LUST393178600
HURON Leaking Underground Tank BUSTR: LUST database (geocoded)
4 OHD085246130RICHLAND TRIS RCRIS US EPA Envirofacts4 LUST70017940
4RICHLAND Leaking Underground Tank BUSTR: LUST Database (geocoded)
4 LUST700179402
RICHLAND Leaking Underground Tank BUSTR: LUST Database (geocoded)
4 LUST700179401
RICHLAND Leaking Underground Tank BUSTR: LUST Database (geocoded)
4 LUST700179403
RICHLAND Leaking Underground Tank BUSTR: LUST Database (geocoded)
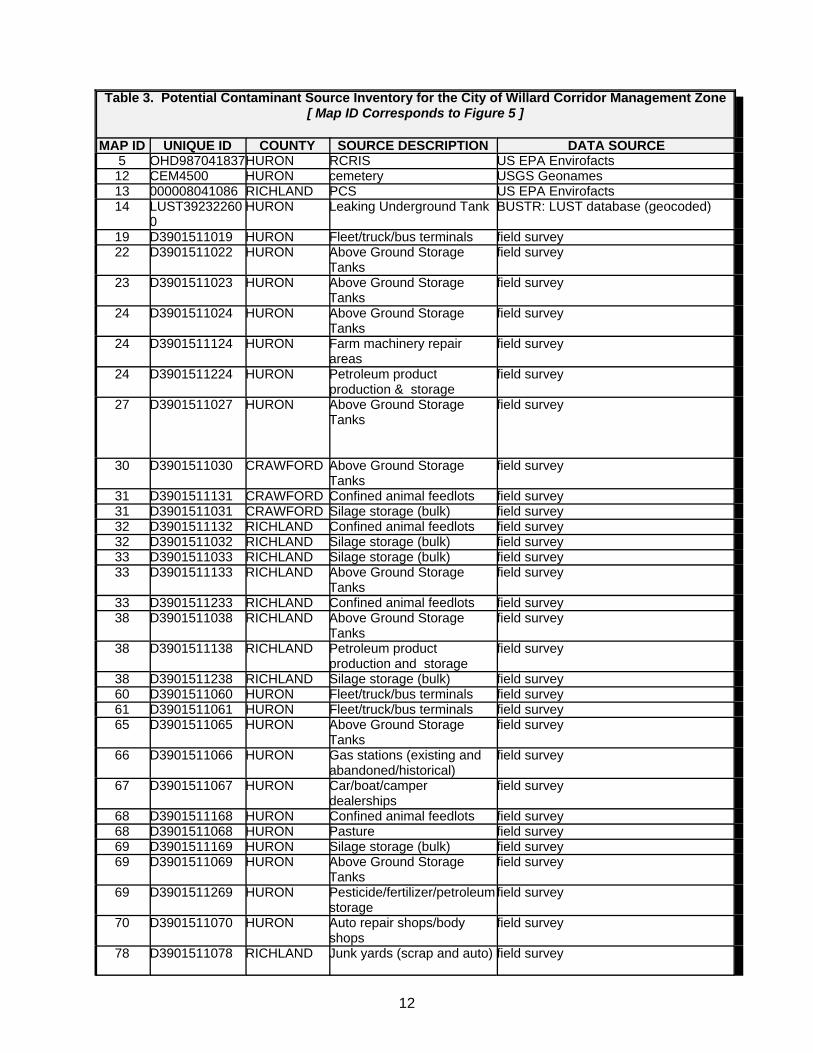
Table 3. Potential Contaminant Source Inventory for the City of Willard Corridor Management Zone[ Map ID Corresponds to Figure 5 ]
MAP ID UNIQUE ID COUNTY SOURCE DESCRIPTION DATA SOURCE
12
5 OHD987041837HURON RCRIS US EPA Envirofacts12 CEM4500 HURON cemetery USGS Geonames13 000008041086 RICHLAND PCS US EPA Envirofacts14 LUST39232260
0HURON Leaking Underground Tank BUSTR: LUST database (geocoded)
19 D3901511019 HURON Fleet/truck/bus terminals field survey22 D3901511022 HURON Above Ground Storage
Tanksfield survey
23 D3901511023 HURON Above Ground StorageTanks
field survey
24 D3901511024 HURON Above Ground StorageTanks
field survey
24 D3901511124 HURON Farm machinery repairareas
field survey
24 D3901511224 HURON Petroleum productproduction & storage
field survey
27 D3901511027 HURON Above Ground StorageTanks
field survey
30 D3901511030 CRAWFORD Above Ground StorageTanks
field survey
31 D3901511131 CRAWFORD Confined animal feedlots field survey31 D3901511031 CRAWFORD Silage storage (bulk) field survey32 D3901511132 RICHLAND Confined animal feedlots field survey32 D3901511032 RICHLAND Silage storage (bulk) field survey33 D3901511033 RICHLAND Silage storage (bulk) field survey33 D3901511133 RICHLAND Above Ground Storage
Tanksfield survey
33 D3901511233 RICHLAND Confined animal feedlots field survey38 D3901511038 RICHLAND Above Ground Storage
Tanksfield survey
38 D3901511138 RICHLAND Petroleum productproduction and storage
field survey
38 D3901511238 RICHLAND Silage storage (bulk) field survey60 D3901511060 HURON Fleet/truck/bus terminals field survey61 D3901511061 HURON Fleet/truck/bus terminals field survey65 D3901511065 HURON Above Ground Storage
Tanksfield survey
66 D3901511066 HURON Gas stations (existing andabandoned/historical)
field survey
67 D3901511067 HURON Car/boat/camperdealerships
field survey
68 D3901511168 HURON Confined animal feedlots field survey68 D3901511068 HURON Pasture field survey69 D3901511169 HURON Silage storage (bulk) field survey69 D3901511069 HURON Above Ground Storage
Tanksfield survey
69 D3901511269 HURON Pesticide/fertilizer/petroleumstorage
field survey
70 D3901511070 HURON Auto repair shops/bodyshops
field survey
78 D3901511078 RICHLAND Junk yards (scrap and auto) field survey
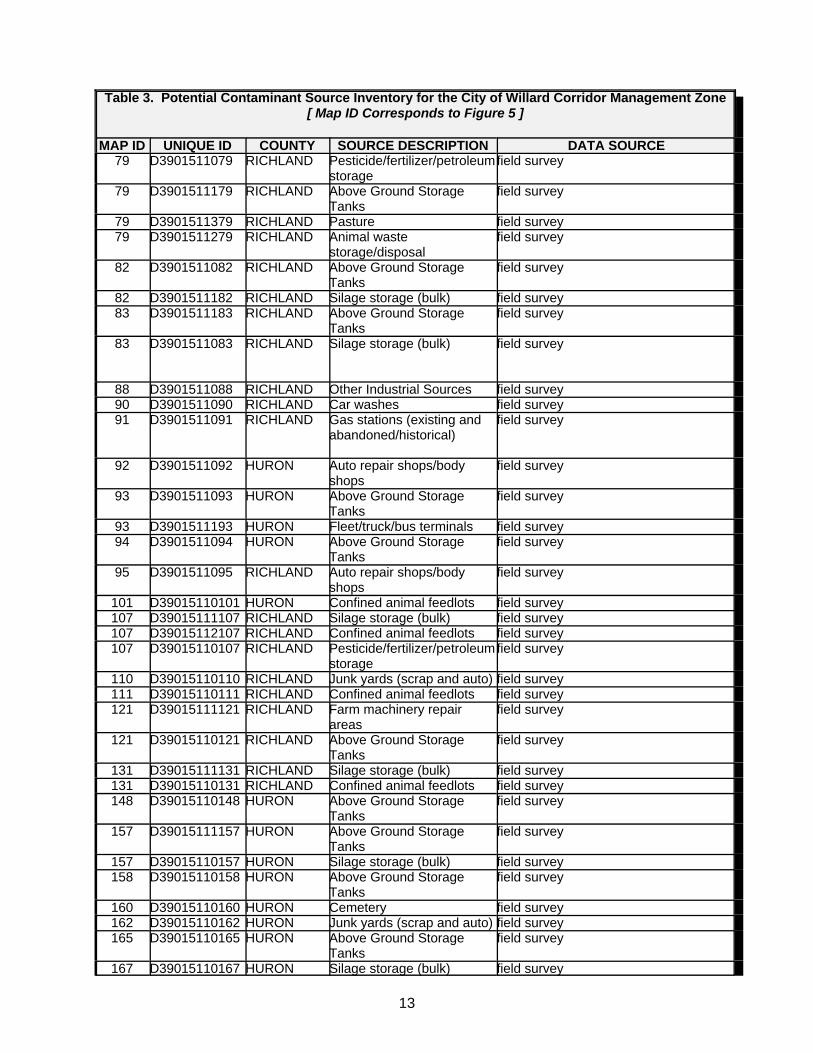
Table 3. Potential Contaminant Source Inventory for the City of Willard Corridor Management Zone[ Map ID Corresponds to Figure 5 ]
MAP ID UNIQUE ID COUNTY SOURCE DESCRIPTION DATA SOURCE
13
79 D3901511079 RICHLAND Pesticide/fertilizer/petroleumstorage
field survey
79 D3901511179 RICHLAND Above Ground StorageTanks
field survey
79 D3901511379 RICHLAND Pasture field survey79 D3901511279 RICHLAND Animal waste
storage/disposalfield survey
82 D3901511082 RICHLAND Above Ground StorageTanks
field survey
82 D3901511182 RICHLAND Silage storage (bulk) field survey83 D3901511183 RICHLAND Above Ground Storage
Tanksfield survey
83 D3901511083 RICHLAND Silage storage (bulk) field survey
88 D3901511088 RICHLAND Other Industrial Sources field survey90 D3901511090 RICHLAND Car washes field survey91 D3901511091 RICHLAND Gas stations (existing and
abandoned/historical)field survey
92 D3901511092 HURON Auto repair shops/bodyshops
field survey
93 D3901511093 HURON Above Ground StorageTanks
field survey
93 D3901511193 HURON Fleet/truck/bus terminals field survey94 D3901511094 HURON Above Ground Storage
Tanksfield survey
95 D3901511095 RICHLAND Auto repair shops/bodyshops
field survey
101 D39015110101 HURON Confined animal feedlots field survey107 D39015111107 RICHLAND Silage storage (bulk) field survey107 D39015112107 RICHLAND Confined animal feedlots field survey107 D39015110107 RICHLAND Pesticide/fertilizer/petroleum
storage field survey
110 D39015110110 RICHLAND Junk yards (scrap and auto) field survey111 D39015110111 RICHLAND Confined animal feedlots field survey121 D39015111121 RICHLAND Farm machinery repair
areasfield survey
121 D39015110121 RICHLAND Above Ground StorageTanks
field survey
131 D39015111131 RICHLAND Silage storage (bulk) field survey131 D39015110131 RICHLAND Confined animal feedlots field survey148 D39015110148 HURON Above Ground Storage
Tanksfield survey
157 D39015111157 HURON Above Ground StorageTanks
field survey
157 D39015110157 HURON Silage storage (bulk) field survey158 D39015110158 HURON Above Ground Storage
Tanksfield survey
160 D39015110160 HURON Cemetery field survey162 D39015110162 HURON Junk yards (scrap and auto) field survey165 D39015110165 HURON Above Ground Storage
Tanksfield survey
167 D39015110167 HURON Silage storage (bulk) field survey
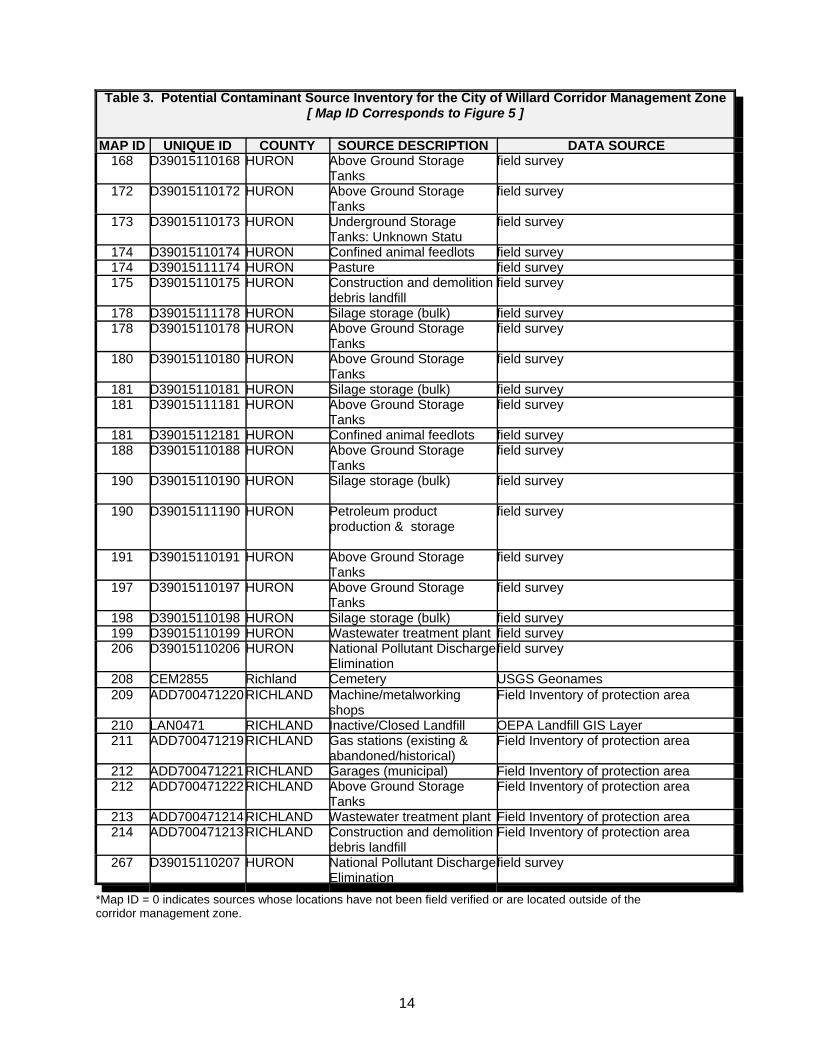
Table 3. Potential Contaminant Source Inventory for the City of Willard Corridor Management Zone[ Map ID Corresponds to Figure 5 ]
MAP ID UNIQUE ID COUNTY SOURCE DESCRIPTION DATA SOURCE
14
168 D39015110168 HURON Above Ground StorageTanks
field survey
172 D39015110172 HURON Above Ground StorageTanks
field survey
173 D39015110173 HURON Underground StorageTanks: Unknown Statu
field survey
174 D39015110174 HURON Confined animal feedlots field survey174 D39015111174 HURON Pasture field survey175 D39015110175 HURON Construction and demolition
debris landfillfield survey
178 D39015111178 HURON Silage storage (bulk) field survey178 D39015110178 HURON Above Ground Storage
Tanksfield survey
180 D39015110180 HURON Above Ground StorageTanks
field survey
181 D39015110181 HURON Silage storage (bulk) field survey181 D39015111181 HURON Above Ground Storage
Tanksfield survey
181 D39015112181 HURON Confined animal feedlots field survey188 D39015110188 HURON Above Ground Storage
Tanksfield survey
190 D39015110190 HURON Silage storage (bulk) field survey
190 D39015111190 HURON Petroleum productproduction & storage
field survey
191 D39015110191 HURON Above Ground StorageTanks
field survey
197 D39015110197 HURON Above Ground StorageTanks
field survey
198 D39015110198 HURON Silage storage (bulk) field survey199 D39015110199 HURON Wastewater treatment plant field survey206 D39015110206 HURON National Pollutant Discharge
Eliminationfield survey
208 CEM2855 Richland Cemetery USGS Geonames209 ADD700471220RICHLAND Machine/metalworking
shopsField Inventory of protection area
210 LAN0471 RICHLAND Inactive/Closed Landfill OEPA Landfill GIS Layer211 ADD700471219RICHLAND Gas stations (existing &
abandoned/historical)Field Inventory of protection area
212 ADD700471221RICHLAND Garages (municipal) Field Inventory of protection area212 ADD700471222RICHLAND Above Ground Storage
TanksField Inventory of protection area
213 ADD700471214RICHLAND Wastewater treatment plant Field Inventory of protection area214 ADD700471213RICHLAND Construction and demolition
debris landfillField Inventory of protection area
267 D39015110207 HURON National Pollutant DischargeElimination
field survey
*Map ID = 0 indicates sources whose locations have not been field verified or are located outside of the corridor management zone.
15
Database Explanation
AFS Airborne Emissions (AIRS) Facilities report releases of pollutants into the air. Airborne pollutants can be deposited in surface waters.
RCRIS Facilities regulated by U.S. EPA under the Resource Conservation and RecoveryAct (RCRA) as hazardous waste generators or handlers. These types of facilitiesmay be associated with potential releases of hazardous materials.
TRIS Toxics Release Inventory (TRI) facilities are industrial facilities that manufacture,process, or import any of over 300 listed toxic chemicals that are releaseddirectly into the air, water, or land, or are transported off-site.
LUST Facilities that have reported a leaking underground storage tank (LUSTs) toOhio’s Bureau of Underground Storage Tank Regulations (BUSTR). Leakingunderground storage tanks have been associated soil and water contaminationrelated to leaks and spills of gasoline and other petroleum products. Unusedunderground storage tanks may be used for the improper disposal of wastes.
16
Figure 1 - City of Willard Drinking Water Source Protection Area and Corridor Management Zone
17
Figure 2 - City of Willard Emergency Management Zone
18
Figure 3 - Land Use in the City of Willard Drinking Water Source Protection (SWAP) Area
19
Figure 4 - Potential Contaminant Sources in the City of Willard Protection Area (Overview Map)
20
Figure 5 - Potential Contaminant Sources in the City of Willard Protection Area
21
Figure 6 - Road Rail and Gas Line Stream Crossings in the City of Willard Protection Area

22
Figure 7 - Oil/Gas Well Locations in the City of Willard Protection Area