drinking water safety plan training coursedrinking water safety plan training course this training...
TRANSCRIPT

Drinking Water Safety
Plan
Training Course
This Training is Sponsored by Alberta Environment and Sustainable Resource
Development
2
Contents About This Training Package.........................................................................................................................4
What is a Drinking Water Safety Plan? .........................................................................................................4
Why do we Need Drinking Water Safety Plans?...........................................................................................4
Ready to Identify Some Risks? ......................................................................................................................5
DWSP Benefits ..............................................................................................................................................8
DWSP Background ........................................................................................................................................9
Assessing Risks ‐ Control Measures ............................................................................................................10
Assessing and Measuring Risks ...................................................................................................................11
Likelihood Scoring .......................................................................................................................................11
Consequence Scoring..................................................................................................................................12
Assessing and Measuring Risks ...................................................................................................................12
Risk Scoring Matrix......................................................................................................................................13
Risk Scoring Practice ‐ Scenario 1 ...........................................................................................................13
Risk Scoring Practice ‐ Scenario 2 ...........................................................................................................14
Describing the Water Supply System..........................................................................................................14
Source Node (Watershed) ‐ Includes ..........................................................................................................15
Describing the Source Node........................................................................................................................15
Source Schematic........................................................................................................................................16
Schematic Diagram Symbols.......................................................................................................................16
Alberta Lake Source Schematic Exercise.....................................................................................................17
Source Schematic Exercise......................................................................................................................17
Source Risk Assessment Information..........................................................................................................18
Common Source Risks – Surface and Catchment .......................................................................................19
Common Source Risks – Wells ....................................................................................................................19
Common Source Risks – Raw Water Assets................................................................................................20
Source Risk Assessment Practice Scenarios................................................................................................20
Source Risks ‐ Surface Water Scenario ...................................................................................................21
Source Risks ‐ Well Scenario ...................................................................................................................23
Treatment Node – Includes ........................................................................................................................24
Water Treatment Risk Assessment.............................................................................................................25
Describing the Water Treatment System ...................................................................................................25
3
Example of a Treatment Schematic – Simple Treatment Process ..........................................................26
Example of a Treatment Schematic – Complex Treatment Process.......................................................27
Treatment Schematic Exercise................................................................................................................27
Common Treatment Risks – General Risks .................................................................................................28
Common Treatment Risks – Process...........................................................................................................28
Common Treatment Risks – Treated Storage.............................................................................................29
Treatment Risk Assessment Practice Scenarios..........................................................................................30
Alberta Surface Treatment Practice Scenario.........................................................................................31
Alberta Well Treatment Practice Scenario..............................................................................................33
Network Node – Includes............................................................................................................................34
Network Risk Assessment ...........................................................................................................................35
Describing the Network (Distribution System) ...........................................................................................35
Example of a Network Schematic ...........................................................................................................36
Network Risk Examples...............................................................................................................................37
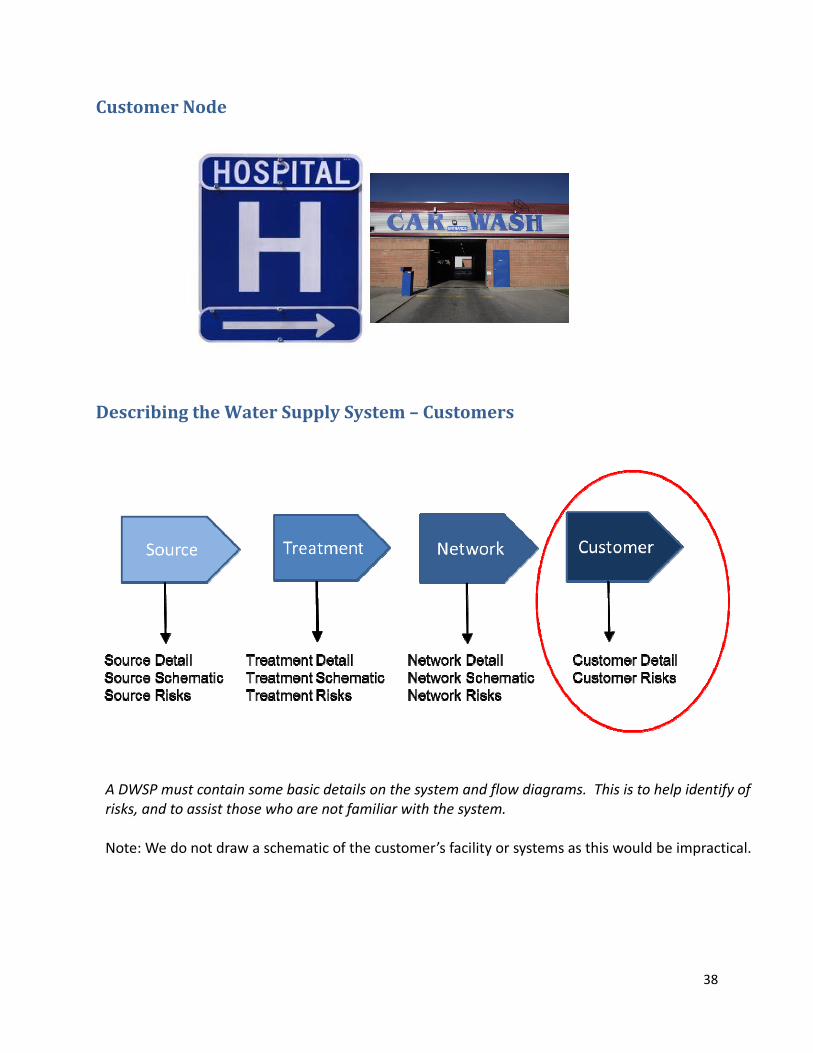
Customer Node ...........................................................................................................................................38
Describing the Water Supply System – Customers.....................................................................................38
Common Customer Related Risks...............................................................................................................39
Network and Customer Practice Scenario ..................................................................................................40
Alberta Water Supply..............................................................................................................................41
Interventions – Reducing or Removing the Risk .........................................................................................44
Consolidating Your Key Risks into an Action Plan.......................................................................................45
Creating an Action Summary (Action Plan).................................................................................................46
Reviewing Your DWSP.................................................................................................................................46
Sources of Additional DWSP Information ...................................................................................................46
Writing Your DWSP .....................................................................................................................................47
Documents to Support Writing Your DWSP............................................................................................47
Your DWSP Team ....................................................................................................................................47
Conclusion...................................................................................................................................................47
4
0B0BAbout This Training Package This training package has been written to help you understand more about the Drinking Water
Safety Planning (DWSP) process, and specifically to help you identify and categorize risks.
The training package uses photos, scenarios and descriptions to help you understand the DWSP
and risk assessment process.
This training package should be used along with the following documents:
Alberta DWSP Template (the Excel template you will use to record your safety plan)
Guidance Notes for the DWSP Template (which explains how to use the DWSP template)
Alberta DWSP Guidance Manual (which shows how to prepare and create a DWSP)
These documents are available from the Alberta Environment and Sustainable Resource
Development DWSP webpage HHwww.environment.alberta.ca/apps/regulateddwq/dwsp.aspx
Please email the DWSP team if you have specific questions at [email protected]
1B1BWhat is a Drinking Water Safety Plan? A Drinking Water Safety Plan (DWSP) represents a system‐wide approach to ensuring that the
quality of water delivered to consumers is of good and consistent quality.
A DWSP is based on a comprehensive assessment of risk factors that could adversely affect the
quality of the water delivered to consumers, and sets out how risk factors are to be monitored
and managed.
When creating your plan you need to consider all aspects of your system, including the source
of the water; how it is treated; and the storage and distribution of the treated water.
2B2BWhy do we Need Drinking Water Safety Plans? DWSPs provide a proactive method for identifying and dealing with risks.
Traditionally, the regulatory approach to maintaining the quality and safety of drinking water
has largely been a prescriptive one, based on the ability of any given supply to meet standards
(usually in the form of Maximum Acceptable Concentrations or MACs).
Your DWSP helps you manage risks to reduce the chance of MAC failure or water safety
incidents UUbefore UU they happen.
This is better than waiting for a MAC failure or safety incident to happen and then dealing with
it after the fact.

5
Livestock grazing in the top of a valley
Write what you think the risk is here
3B3BReady to Identify Some Risks? DWSP’s help you look at each part of your water system to identify possible risks. Take a look at
the picture below and identify the level of risk you see.
1. High I wouldn’t drink the water!
2. Medium That’s not great …
3. Low Not really a problem …
4. None Risk, what risk?
What is the Risk?
1. High I wouldn’t drink the water!
2. Medium That’s not great …
3. Low Not really a problem …
4. None Risk, what risk?

6
Write what you think the risk is here
Livestock grazing in the top of a valley
Potential Risk – Possible contamination of the source water.
When you are assessing the level of risk, look at what’s currently in place to control the risk (e.g. how likely are the livestock to contaminate the source? will your treatment process remove contaminates? etc.).
What is the Risk?
1. High I wouldn’t drink the water!
2. Medium That’s not great …
3. Low Not really a problem …
4. None Risk, what risk?
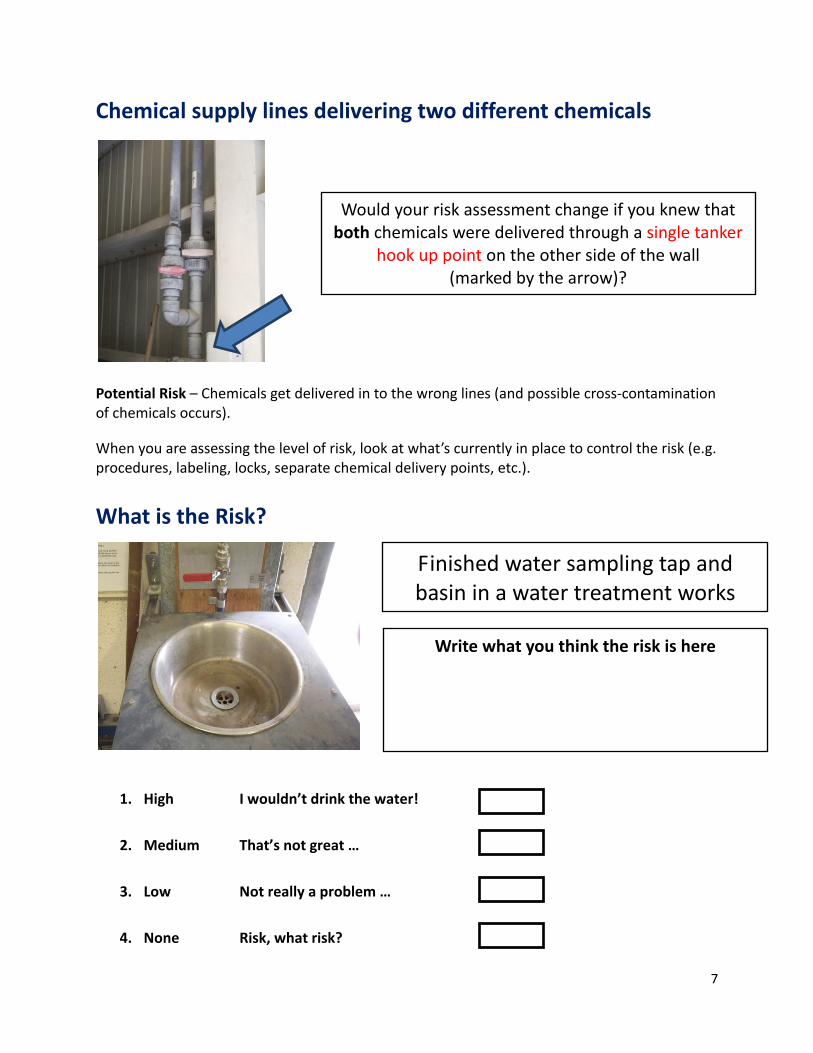
Chemical supply lines delivering two different chemicals
7
Write what you think the risk is here
Chemical supply lines delivering two different chemicals
Potential Risk – Chemicals get delivered in to the wrong lines (and possible cross‐contamination of chemicals occurs).
When you are assessing the level of risk, look at what’s currently in place to control the risk (e.g. procedures, labeling, locks, separate chemical delivery points, etc.).
What is the Risk?
1. High I wouldn’t drink the water!
2. Medium That’s not great …
3. Low Not really a problem …
4. None Risk, what risk?
Would your risk assessment change if you knew that both chemicals were delivered through a single tanker
hook up point on the other side of the wall (marked by the arrow)?
Finished water sampling tap and basin in a water treatment works

8
Finished water sampling tap & basin in water treatment works
Potential Risk – Contamination of the finished water.
The basin shown above was in use for many years before someone spotted that the basin was incorrectly plumbed. Anything could have been drained or washed down the sink into the finished water tank.
The DWSP process encourages you to step back and take a fresh look at your whole system to identify potential risks.
4B4BDWSP Benefits The benefits of creating DWSPs include:
• They help you develop a better understanding of risk, how it is controlled and help you identify potential weak points in your system.
• DWSPs encourage you take a step back and look at things from a different perspective.
• They can help make your assets more robust, make water quality safer, and make operator’s lives easier.
• The plans can help you to identify critical maintenance and investment requirements.
Would your risk assessment change if you knew that the basin drained directly back in to
the finished water storage tank (as it actually did)?
9
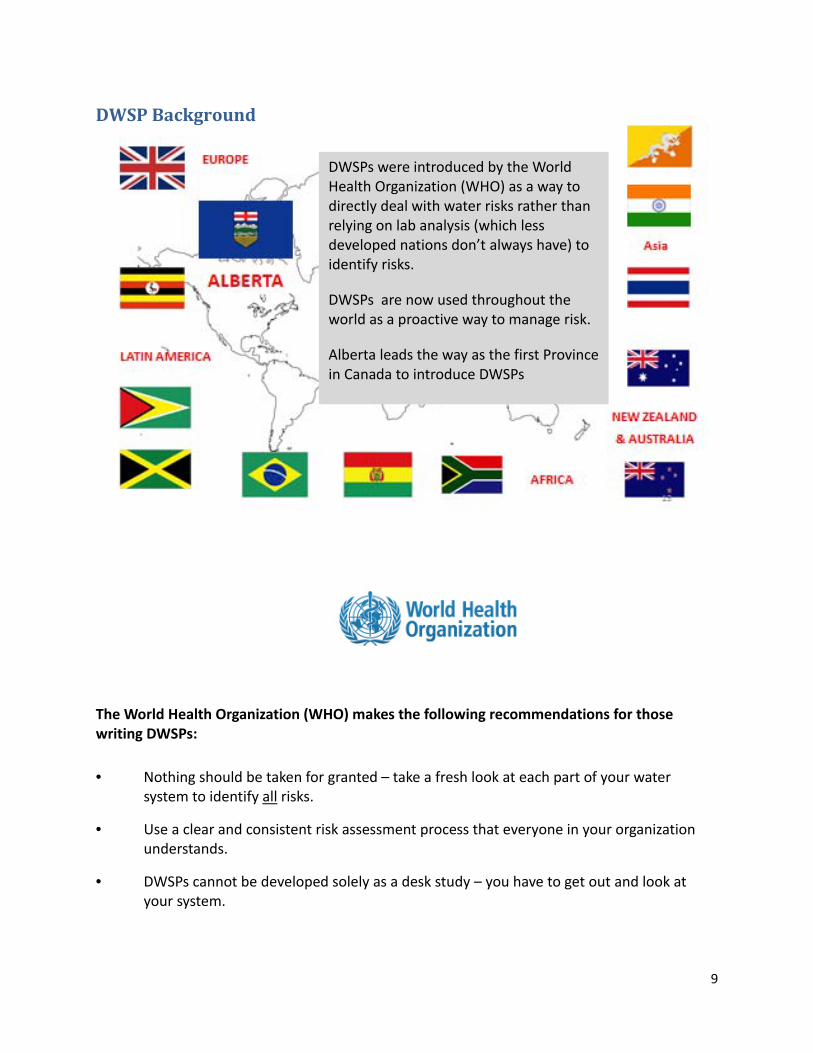
DWSP Background
The World Health Organization (WHO) makes the following recommendations for those writing DWSPs:
• Nothing should be taken for granted – take a fresh look at each part of your water system to identify UUall UU risks.
• Use a clear and consistent risk assessment process that everyone in your organization understands.
• DWSPs cannot be developed solely as a desk study – you have to get out and look at your system.
DWSPs were introduced by the World Health Organization (WHO) as a way to directly deal with water risks rather than relying on lab analysis (which less developed nations don’t always have) to identify risks.
DWSPs are now used throughout the world as a proactive way to manage risk.
Alberta leads the way as the first Province in Canada to introduce DWSPs

10
• DWSPs should be dynamic – it’s important to monitor, review and revise them on a regular basis
5B5BAssessing Risks Control Measures
When we assess risks we need to look at what the risk is and is there anything currently in place to manage or control the risk.
We call this a Control Measure.
A Control Measure is any action or activity that is currently used to prevent or eliminate a hazard or reduce the risk of it occurring to an acceptable level.
Control Measures (e.g. clear labelling and work procedures for chemical deliveries) help us reduce risks.
Assessing Risk ‐ Control Measures
Think about the example of the livestock grazing in the valley.
1. What controls are currently in place?
2. Is/are the control(s) adequate?
Write your answers in the spaces in the table.
Fencing and treatment works processes.
Fencing – No. Treatment processes – yes.
Livestock having access to source
Microbiological contamination of source

11
...it’s not rocket science
Assessing and Measuring Risks We categorize Risk as the Probability of something happening that will impact water safety. Risk is measured in terms of Likelihood and Consequence. Likelihood – The probability that the event will happen Consequence – The assessed outcome of any hazardous event
Likelihood X Consequence = Risk Score
6B6BLikelihood Scoring
When measuring and scoring “Likelihood” we look at how UUlikelyUU is the risk to happen within the next 4 – 5 years.
You will see there are 6 categories, each with their own value (between 0 and 16).
Choose a Likelihood definition and value that suits your risk e.g. Medium – Value = 4.
12
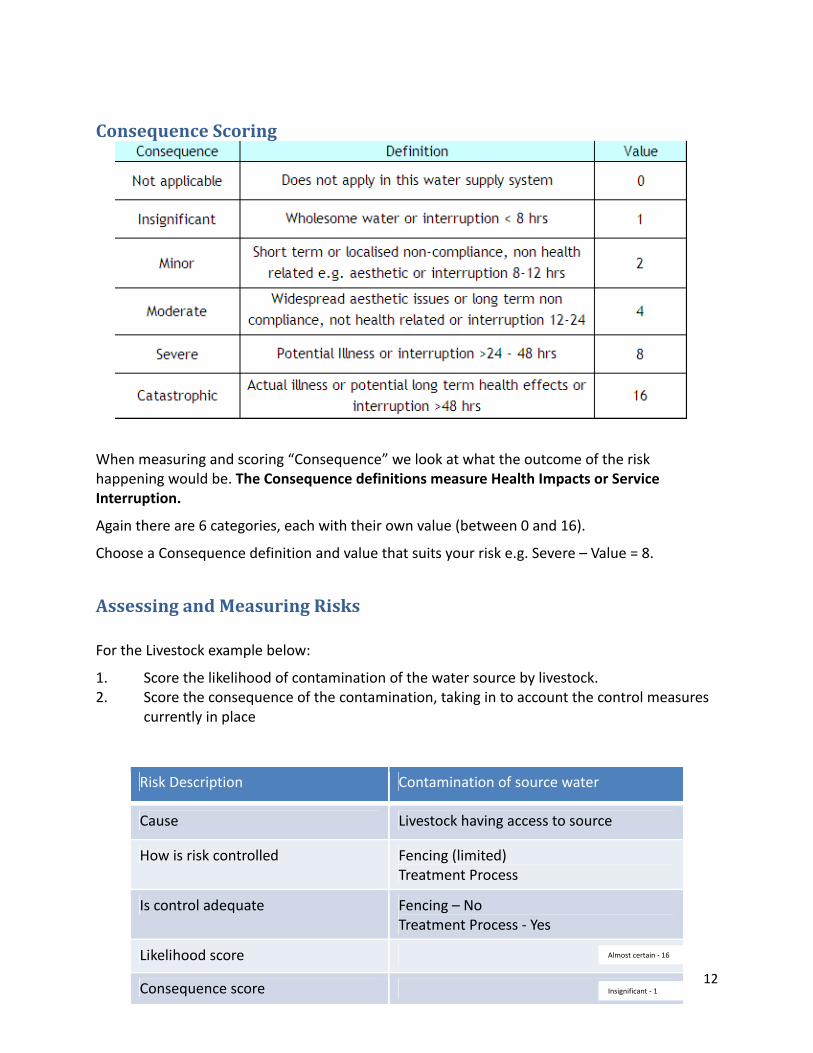
Consequence Scoring
When measuring and scoring “Consequence” we look at what the outcome of the risk happening would be. The Consequence definitions measure Health Impacts or Service Interruption.
Again there are 6 categories, each with their own value (between 0 and 16).
Choose a Consequence definition and value that suits your risk e.g. Severe – Value = 8.
7B7BAssessing and Measuring Risks
For the Livestock example below:
1. Score the likelihood of contamination of the water source by livestock. 2. Score the consequence of the contamination, taking in to account the control measures
currently in place
Risk Description Contamination of source water
Cause Livestock having access to source
How is risk controlled Fencing (limited) Treatment Process
Is control adequate Fencing – No Treatment Process ‐ Yes
Likelihood score
Consequence score
Almost certain ‐ 16
Insignificant ‐ 1

13
Our answer: Likelihood ‐ Almost Certain (16) and Consequence ‐ Insignificant (1) = Risk Score of 16 because of the auto shutdown
8B8BRisk Scoring Matrix
1. Plot the Likelihood and Consequence scores on to the Risk Scoring matrix. 2. Scores of 32 or more (shown in red) are high and require you to take action to reduce
the risk. 3. We recommend you recheck risk scores of 8 – 16 (shown in yellow) and, where
appropriate, introduce actions to help manage the risk or monitor for changes. 4. Risk with scores of 0 – 4 are unlikely to require action.
36B36BRisk Scoring Practice Scenario 1
Calculate a Risk Score (Likelihood X Consequence) for the following scenario: A groundwater supply is pumped directly from the source to a treatment facility located approximately 100m from the source. The treatment works consists of a duty only chlorine dosing pump which is flow and residually controlled, with chlorine monitoring on the inlet and outlet of the contact tank. Low chlorine results in telemetry alarms and an automated shutdown of the well facility. The dosing pump is approximately 10 years old and has had only basic maintenance since its installation. It is prone to air locking and has failed mechanically twice in the last 12 months. Using the definitions shown, determine the Likelihood and Consequence of the dosing pump failure resulting in a Microbiological Failure exiting the WTW.
Likelihood _____ X Consequence _____ = Risk Score _____

14
Our answer: Likelihood ‐ Almost Certain (16) and Consequence ‐ is between Insignificant and Catastrophic (depending on how quickly you can get to site) because of the auto shutdown.
Source Treatment Network Customer
37B37BRisk Scoring Practice Scenario 2
Calculate a Risk Score (Likelihood X Consequence) for the following scenario: For the same treatment facility as before, you are now made aware that the site is visited once per week as it is located in an extremely remote location. It has only 8 hours treated water storage at normal demand. Using the definitions shown, determine the Likelihood and Consequence of Loss of Supply at the WTW as a result of a dosing pump failure.
Likelihood _____ X Consequence _____ = Risk Score _____
9B9BDescribing the Water Supply System
1. You need to complete information and identify risks for each part (node) of your water supply system: e.g. Source, Treatment, Network, and Customer.
2. Open the Alberta DWSP Excel Template and identify the different tabs/worksheets that relate to Source, Treatment, Network, and Customer.
3. See the Guidance Notes for DWSP Template document to see how to complete each sheet of the Excel template.
4. Complete the Detail worksheet for each part of your system. Adding in details about your system helps you step back and identify risks and also helps others who may not be as familiar with your system.
5. Add a flowchart Schematic in to the relevant worksheets in Excel template This helps you and others less familiar consider all aspects of your system.
Complete the relevant Risks worksheets in the Excel Template (refer to the Guidance Notes for
DWSP Template document to see how to do this).
15
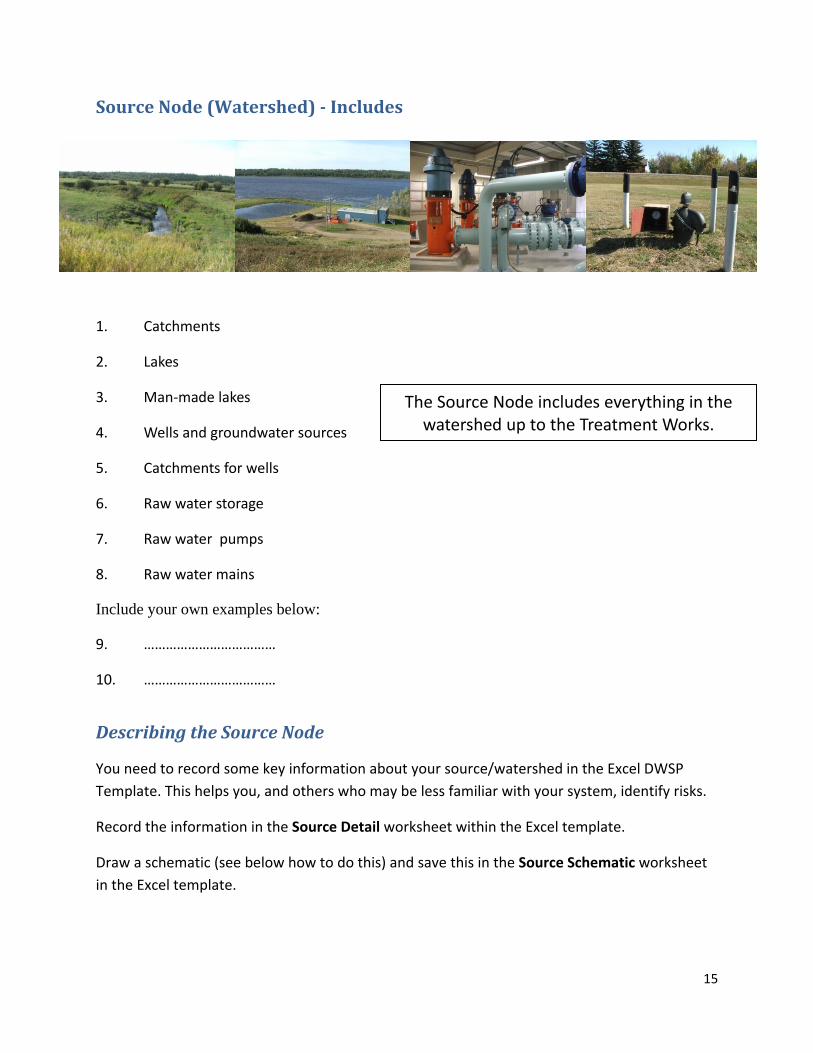
The Source Node includes everything in the watershed up to the Treatment Works.
10B10BSource Node (Watershed) Includes
1. Catchments
2. Lakes
3. Man‐made lakes
4. Wells and groundwater sources
5. Catchments for wells
6. Raw water storage
7. Raw water pumps
8. Raw water mains
Include your own examples below:
9. ………………………………
10. ………………………………
11B11BDescribing the Source Node
You need to record some key information about your source/watershed in the Excel DWSP
Template. This helps you, and others who may be less familiar with your system, identify risks.
Record the information in the Source Detail worksheet within the Excel template.
Draw a schematic (see below how to do this) and save this in the Source Schematic worksheet
in the Excel template.

16
Operational Step
Source Schematic • This is a diagram illustrating flow from the source to the treatment works
• Usually a simplified flow diagram showing main components
• Important for understanding risk
• Cut and paste a copy in the Source Schematic worksheet of the DWSP Excel Template
12B12BSchematic Diagram Symbols
You can use the example symbols below (which are used in World Health Organization versions) or you can use your own flowchart symbols. The most important thing is that you draw a diagram that you and others can easily understand.
pHTurb Colour
Treatment Facility
Pumping Station Lake

17
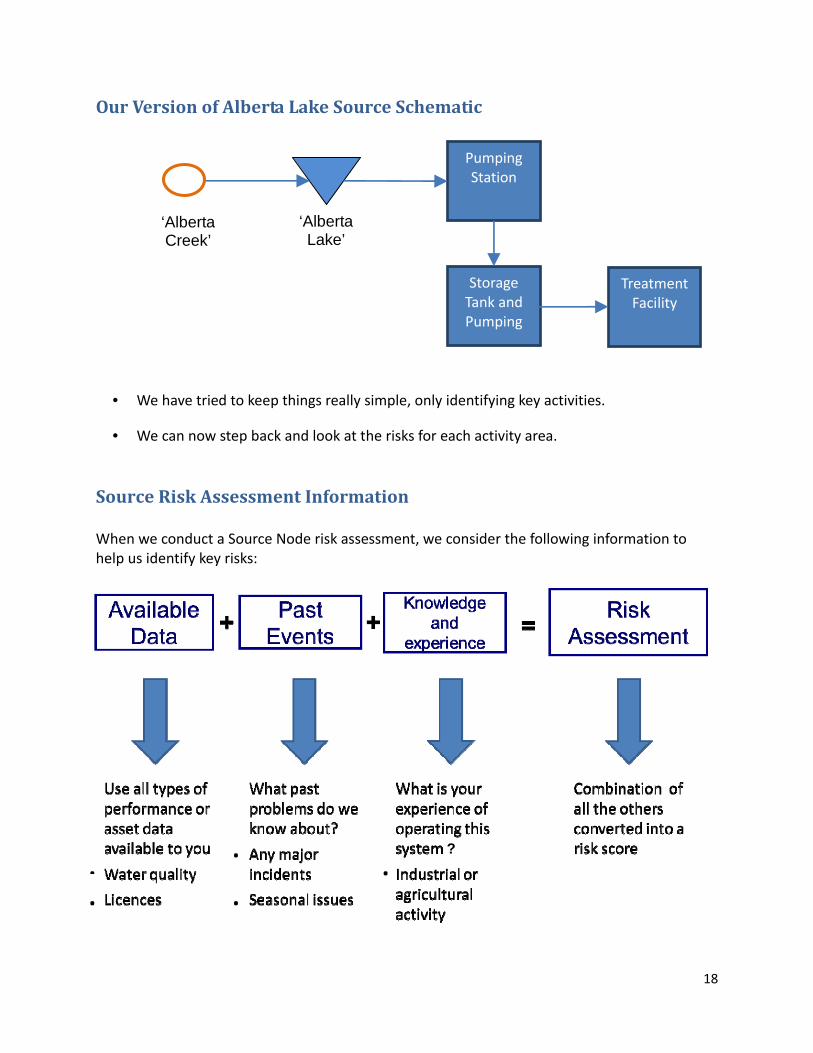
A number of streams feed Alberta Lake. Water is abstracted by the pumping station at the edge of the lake. It is then pumped to a storage reservoir; from there a second pump sends it to the water treatment works.
In the space below, draw a simple flowchart schematic that shows the key components of Alberta Lake Source Node. Either use the WHO schematic symbols or use your own.
Alberta Lake Source Schematic Exercise
38B38BSource Schematic Exercise
18
• We have tried to keep things really simple, only identifying key activities.
• We can now step back and look at the risks for each activity area.
Our Version of Alberta Lake Source Schematic
13B13BSource Risk Assessment Information When we conduct a Source Node risk assessment, we consider the following information to help us identify key risks:
Storage Tank and Pumping
Pumping Station
Treatment Facility
‘Alberta Lake’
‘Alberta Creek’
.
.
.
.
?
.
19
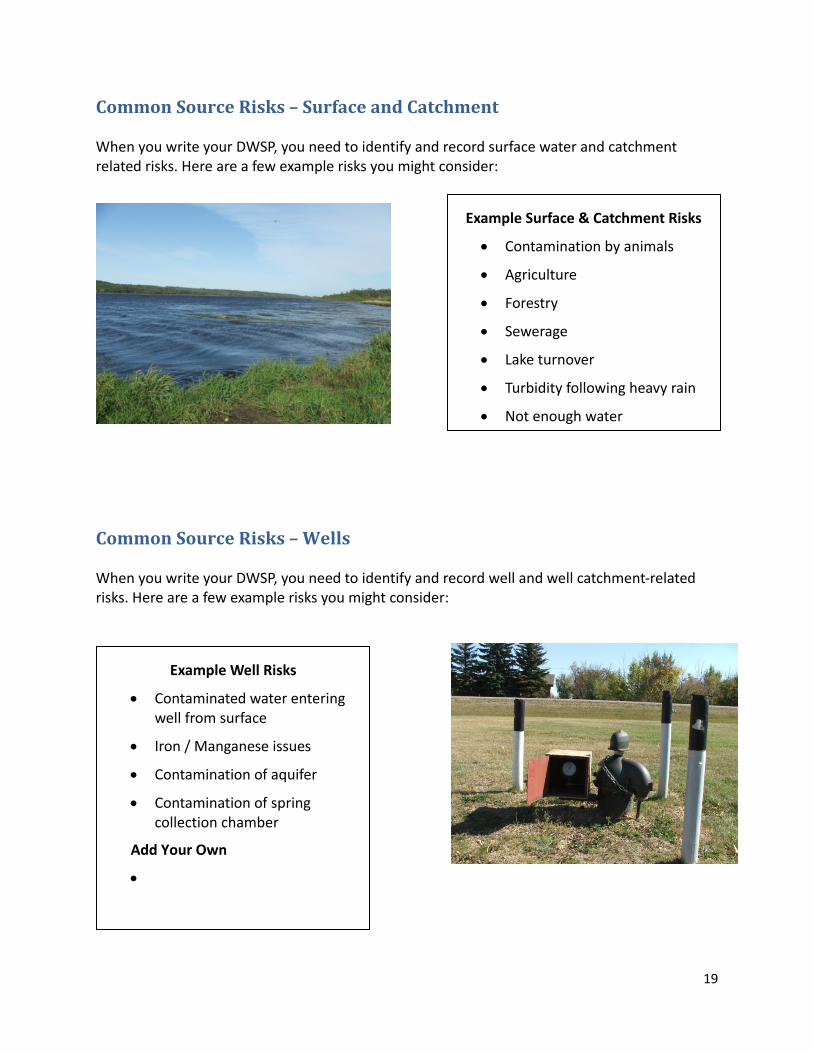
14B14BCommon Source Risks – Surface and Catchment
When you write your DWSP, you need to identify and record surface water and catchment related risks. Here are a few example risks you might consider:
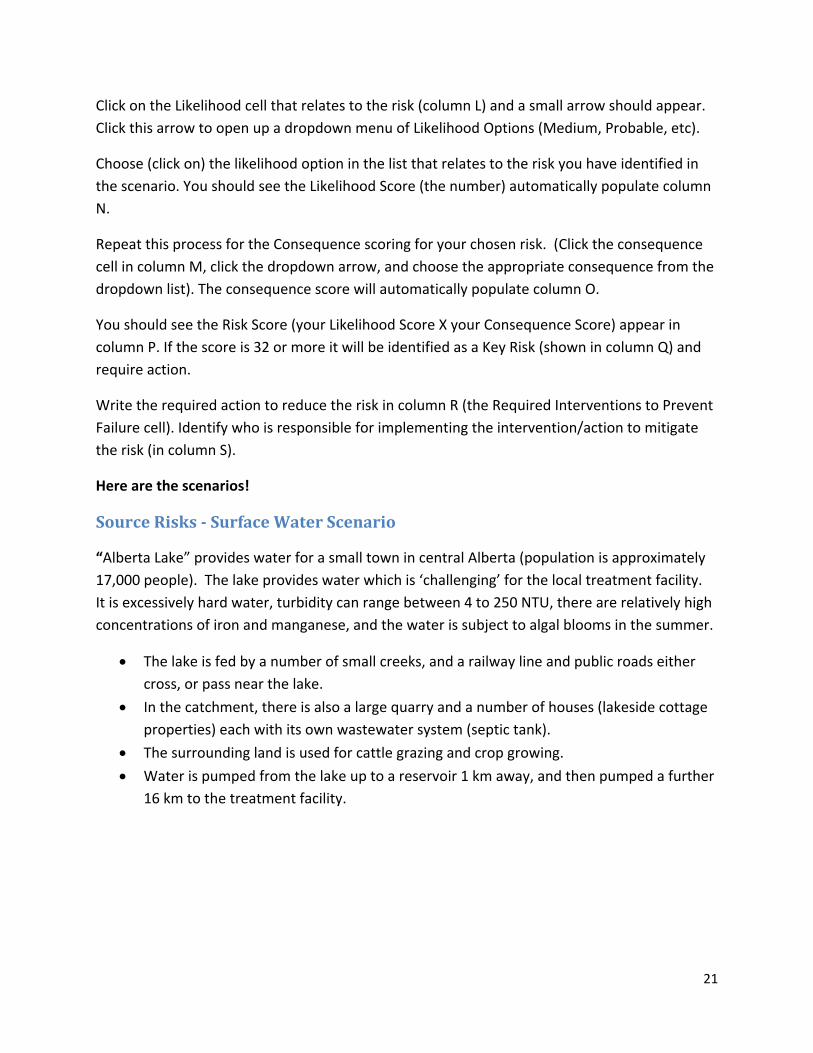
15B15BCommon Source Risks – Wells
When you write your DWSP, you need to identify and record well and well catchment‐related risks. Here are a few example risks you might consider:
Example Surface & Catchment Risks
Contamination by animals
Agriculture
Forestry
Sewerage
Lake turnover
Turbidity following heavy rain
Not enough water
Example Well Risks
Contaminated water entering well from surface
Iron / Manganese issues
Contamination of aquifer
Contamination of spring collection chamber
Add Your Own

20
Common Source Risks – Raw Water Assets
Finally, consider any asset or operator‐related risks associated with source or raw water activities:
16B16BSource Risk Assessment Practice Scenarios
You will find two scenarios on the following pages that are designed to give you practice with
identifying source risks. Please read each scenario and identify one or two risks for each.
Open up the Alberta DWSP Template (the Excel template you will use to record your safety
plan) and make a copy of this that you can use for training purposes (rename this document
Scenario Training Copy). Remember to click “Enable Macros” each time you open the DWSP
Template so that all of the Excel links work correctly.
Go to the Source Risks worksheet in the DWSP Template and scroll down the list of Risk
Descriptions (column C in the Excel template) until you match the risk(s) you identified in the
scenario with the appropriate risk in the DWSP template. Risks are grouped together (e.g. the
Well Risks are grouped together, general Surface Risks are grouped together, etc.)
Add a comment (in column G) about the risk you have identified and details of any Monitoring
in place (in column H). Add details regarding any risk Controls that are currently in place to help
manage the risk (in column I) and notes if the control(s) is/are adequate (column J).
Example Raw Water Asset Risks
Mechanical failure of pumps
Loss of power
Main break
Sediment issues
Contamination of water in storage
Operator error
21
Click on the Likelihood cell that relates to the risk (column L) and a small arrow should appear.
Click this arrow to open up a dropdown menu of Likelihood Options (Medium, Probable, etc).
Choose (click on) the likelihood option in the list that relates to the risk you have identified in
the scenario. You should see the Likelihood Score (the number) automatically populate column
N.
Repeat this process for the Consequence scoring for your chosen risk. (Click the consequence
cell in column M, click the dropdown arrow, and choose the appropriate consequence from the
dropdown list). The consequence score will automatically populate column O.
You should see the Risk Score (your Likelihood Score X your Consequence Score) appear in
column P. If the score is 32 or more it will be identified as a Key Risk (shown in column Q) and
require action.
Write the required action to reduce the risk in column R (the Required Interventions to Prevent
Failure cell). Identify who is responsible for implementing the intervention/action to mitigate
the risk (in column S).
Here are the scenarios!
39B39BSource Risks Surface Water Scenario
“Alberta Lake” provides water for a small town in central Alberta (population is approximately
17,000 people). The lake provides water which is ‘challenging’ for the local treatment facility.
It is excessively hard water, turbidity can range between 4 to 250 NTU, there are relatively high
concentrations of iron and manganese, and the water is subject to algal blooms in the summer.
The lake is fed by a number of small creeks, and a railway line and public roads either
cross, or pass near the lake.
In the catchment, there is also a large quarry and a number of houses (lakeside cottage
properties) each with its own wastewater system (septic tank).
The surrounding land is used for cattle grazing and crop growing.
Water is pumped from the lake up to a reservoir 1 km away, and then pumped a further
16 km to the treatment facility.
22
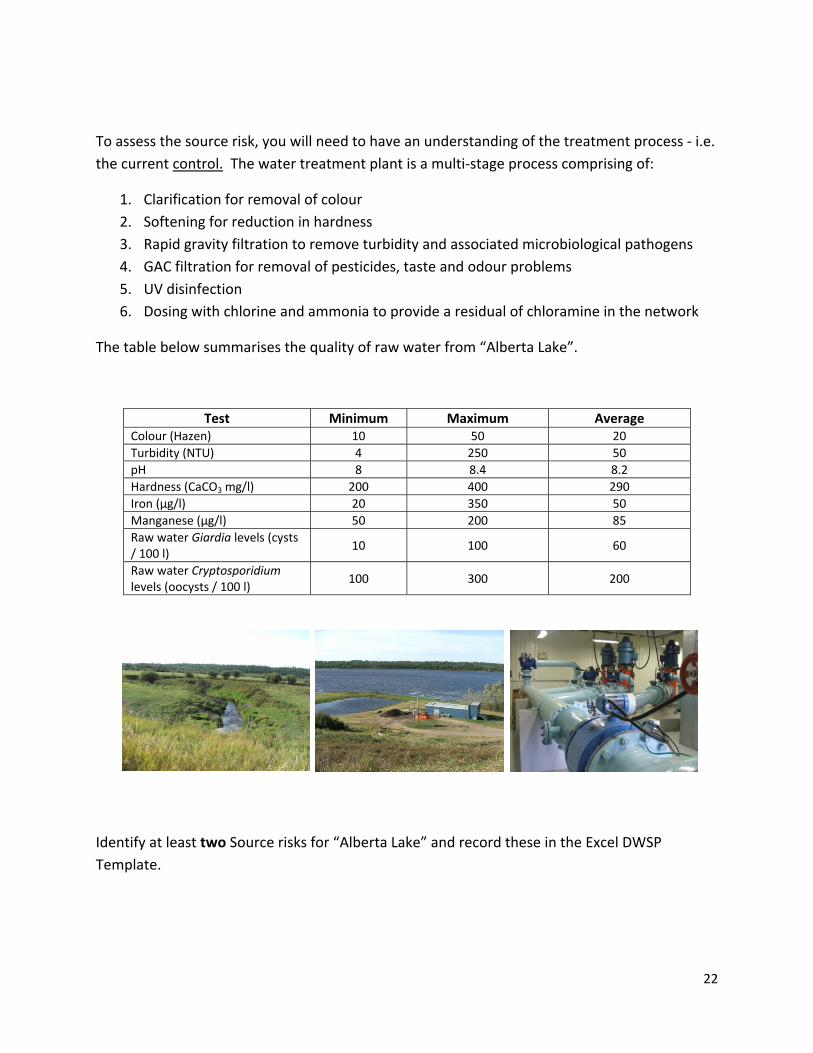
To assess the source risk, you will need to have an understanding of the treatment process ‐ i.e.
the current UUcontrol.UU The water treatment plant is a multi‐stage process comprising of:
1. Clarification for removal of colour
2. Softening for reduction in hardness
3. Rapid gravity filtration to remove turbidity and associated microbiological pathogens
4. GAC filtration for removal of pesticides, taste and odour problems
5. UV disinfection
6. Dosing with chlorine and ammonia to provide a residual of chloramine in the network
The table below summarises the quality of raw water from “Alberta Lake”.
Test Minimum Maximum Average Colour (Hazen) 10 50 20
Turbidity (NTU) 4 250 50
pH 8 8.4 8.2
Hardness (CaCO3 mg/l) 200 400 290
Iron (µg/l) 20 350 50
Manganese (µg/l) 50 200 85
Raw water Giardia levels (cysts / 100 l)
10 100 60
Raw water Cryptosporidium levels (oocysts / 100 l)
100 300 200
Identify at least two Source risks for “Alberta Lake” and record these in the Excel DWSP
Template.

23
40B40BSource Risks Well Scenario
“Alberta Well” provides water for a small town in Alberta (population is approximately 2,000
people). Water is pumped from three operational wells which are located in a public park near
the edge of the town. The wells are relatively close to the public roads which surround the
park, and the park has been known to flood during heavy rain.
“Willie”, the local grounds keeper, is especially proud of his grass, frequently mowing and
applying fertilizers and other chemicals.
The source is designated as ‘High Quality Groundwater’ )i.e. it does not require filtration for
removal of microbiological pathogens). However, the raw water has not recently been tested
for coliforms, E.Coli, Giardia, or Cryptosporidium.
The treatment at the “Alberta Well” treatment facility consists of raw water storage, greensand
filtration, chlorination, and a treated water tank. The well water sometimes contains elevated
levels of iron and manganese.
Test Minimum Maximum Average
Colour (Hazen) < 2 <2 <2
Turbidity (NTU) 0.1 0.5 0.2
pH 7.2 8.2 7.6
Iron (µg/l) 24 350 54
Manganese (µg/l) 5.6 120 12
Identify at least two Source risks for “Alberta Well” and record these in the Excel DWSP
Template.
24
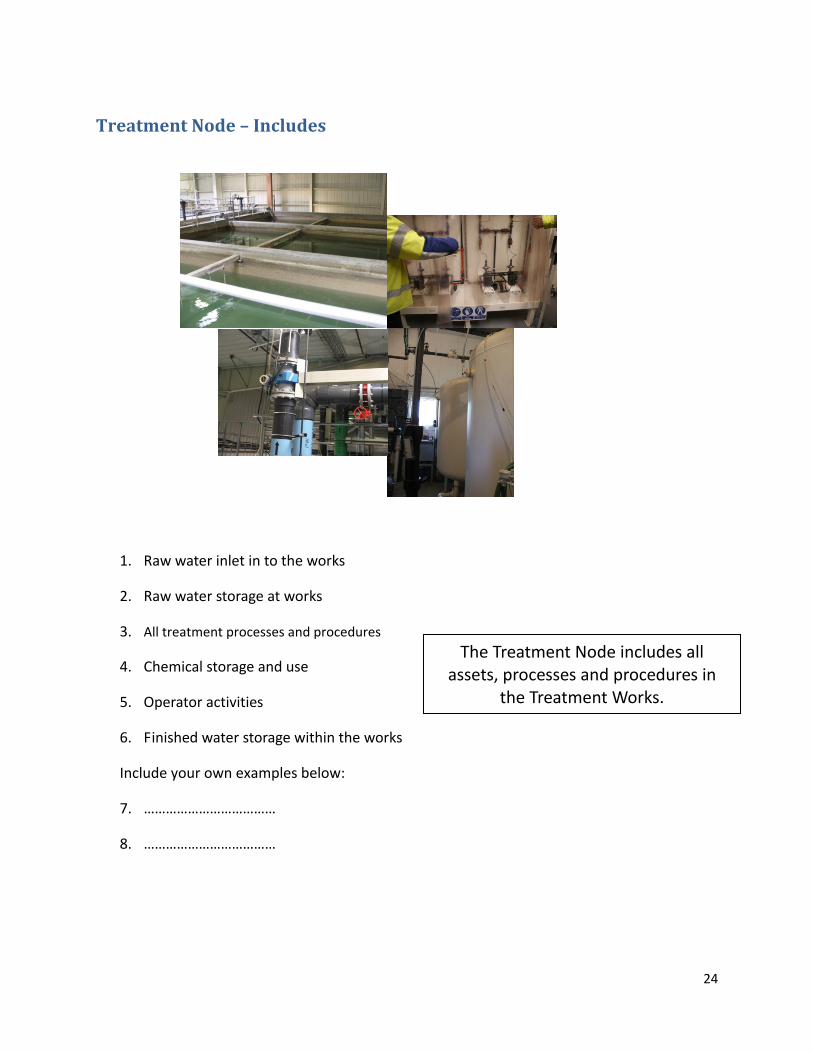
The Treatment Node includes all assets, processes and procedures in
the Treatment Works.
Treatment Node – Includes
1. Raw water inlet in to the works
2. Raw water storage at works
3. All treatment processes and procedures
4. Chemical storage and use
5. Operator activities
6. Finished water storage within the works
Include your own examples below:
7. ………………………………
8. ………………………………
25
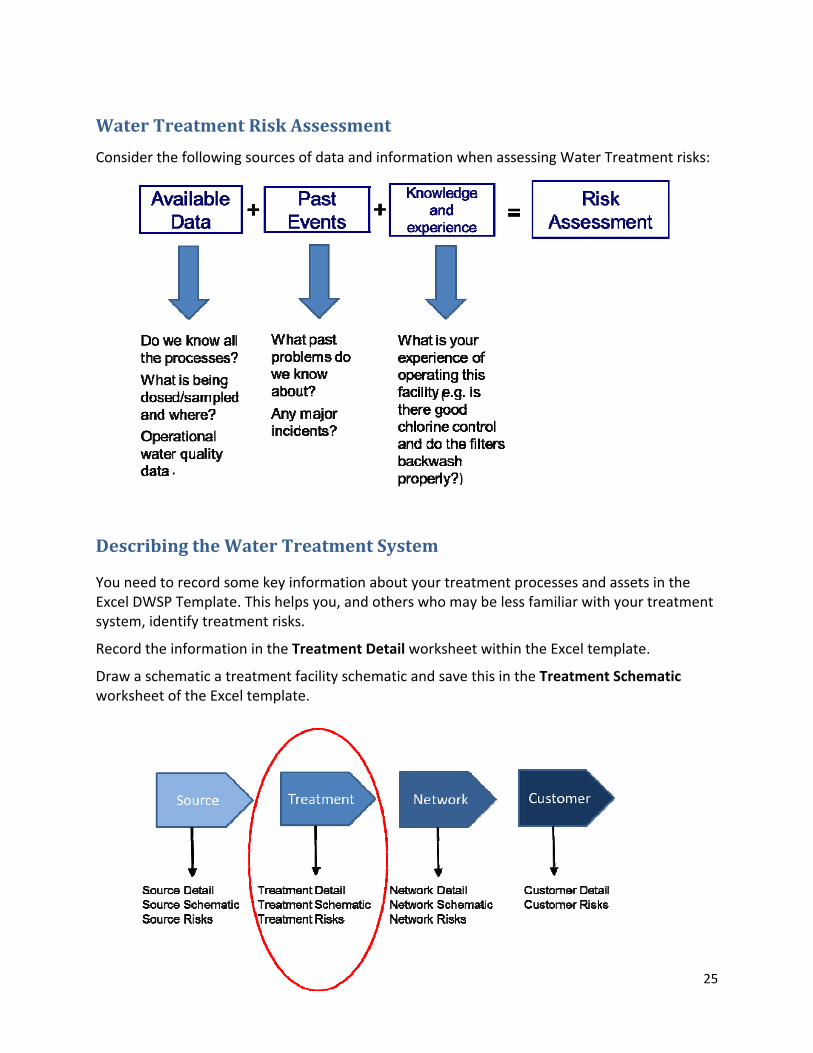
Water Treatment Risk Assessment
Consider the following sources of data and information when assessing Water Treatment risks:
17B17BDescribing the Water Treatment System
You need to record some key information about your treatment processes and assets in the Excel DWSP Template. This helps you, and others who may be less familiar with your treatment system, identify treatment risks.
Record the information in the Treatment Detail worksheet within the Excel template.
Draw a schematic a treatment facility schematic and save this in the Treatment Schematic worksheet of the Excel template.
. )
(

26
41B41BExample of a Treatment Schematic – Simple Treatment Process
You can see (marked in red below) that it is important to identify the points where chemicals are introduced. This helps you consider the key risks associated with each chemical.
It is useful to identify key telemetary or monitoring points because failiure of technology at these points could lead to increased risk.
Raw Water Tank
Filters for Iron & Manganese Removal
Treated Water Tank Chlorination

27
In the space below, draw a simple flowchart schematic that shows the key components of your own treatment process (if you have a treatment process).
42B42BExample of a Treatment Schematic – Complex Treatment Process
43B43BTreatment Schematic Exercise
28
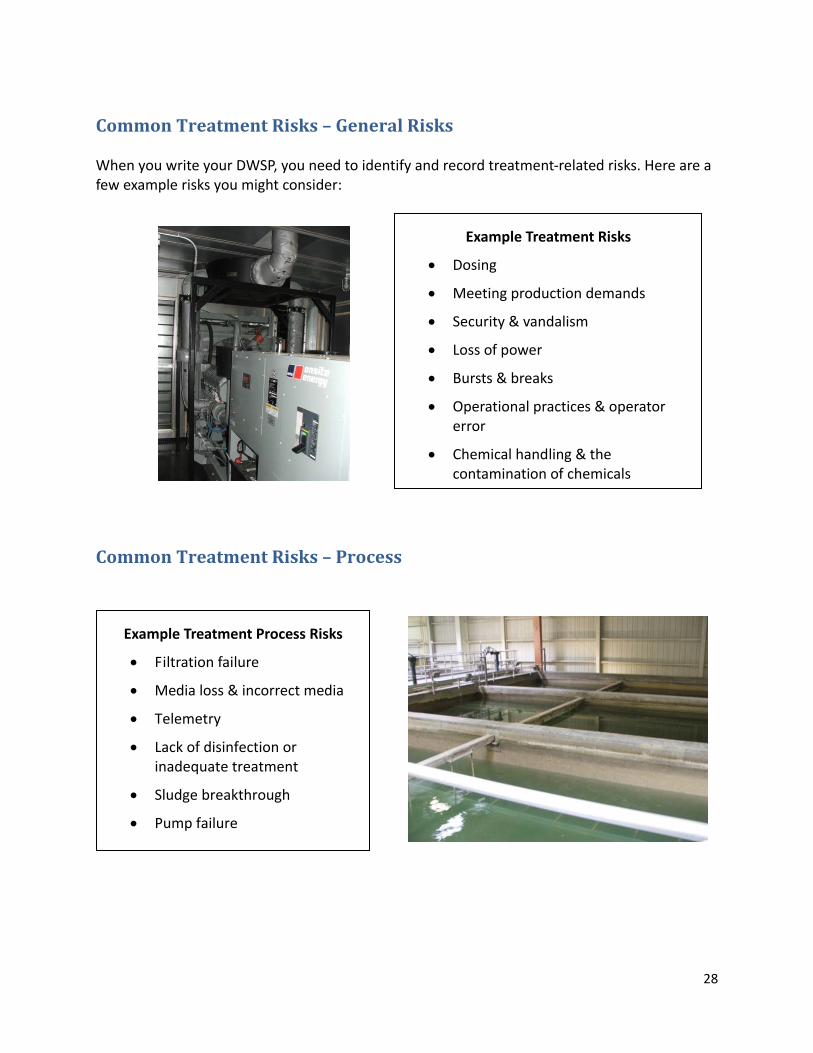
18B18BCommon Treatment Risks – General Risks
When you write your DWSP, you need to identify and record treatment‐related risks. Here are a few example risks you might consider:
19B19BCommon Treatment Risks – Process
Example Treatment Risks
Dosing
Meeting production demands
Security & vandalism
Loss of power
Bursts & breaks
Operational practices & operator error
Chemical handling & the contamination of chemicals
Example Treatment Process Risks
Filtration failure
Media loss & incorrect media
Telemetry
Lack of disinfection or inadequate treatment
Sludge breakthrough
Pump failure
29
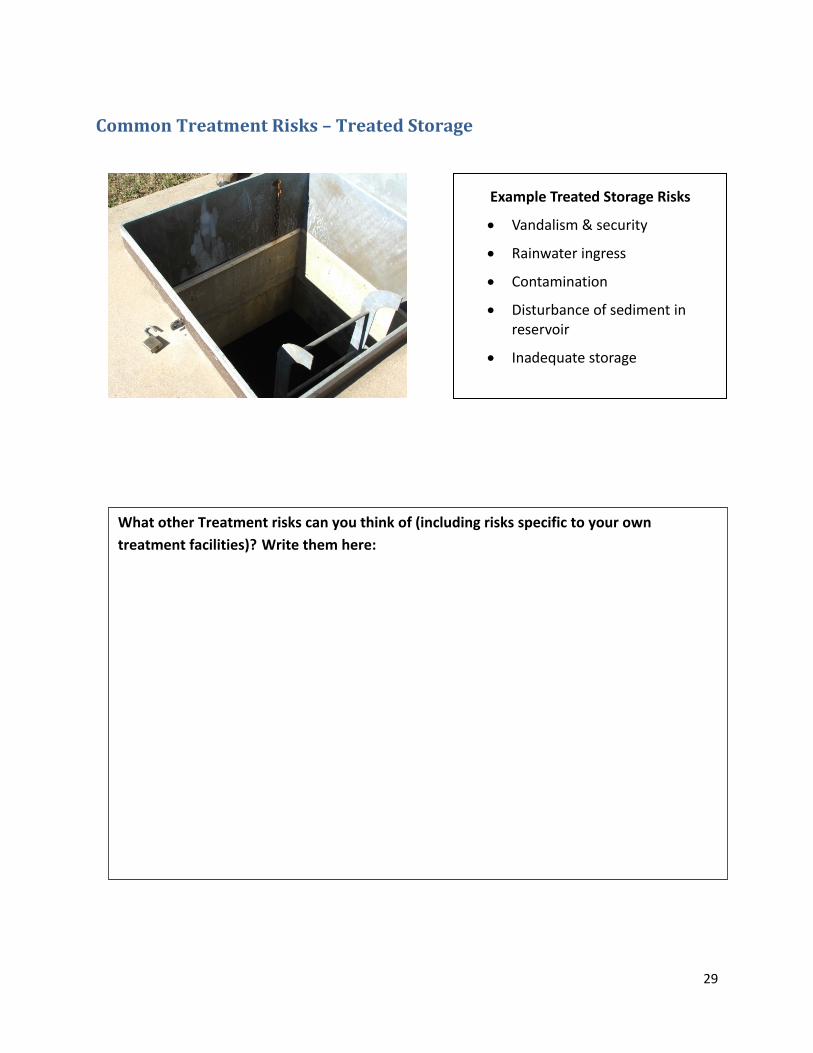
20B20BCommon Treatment Risks – Treated Storage
Example Treated Storage Risks
Vandalism & security
Rainwater ingress
Contamination
Disturbance of sediment in reservoir
Inadequate storage
What other Treatment risks can you think of (including risks specific to your own
treatment facilities)? Write them here:
30
21B21BTreatment Risk Assessment Practice Scenarios You will find two scenarios on the following pages that are designed to give you practice with
identifying treatment related risks. Please read each scenario and identify one or two risks for
each.
Open up the Alberta DWSP Template (the Excel template you will use to record your safety
plan) and make a copy (if you have not already done so) that you can use for training purposes
(rename this document Scenario Training Copy). Remember to click “Enable Macros” each time
you open the DWSP Template so that all of the Excel links work correctly.
Go to the Treatment Risks worksheet in the DWSP Template and scroll down the list of Risk
Descriptions (column C in the Excel template) until you match the risk(s) you identified in the
scenario with the appropriate risk in the DWSP template. Risks are grouped together (e.g. the
Disinfection risks are grouped, the Membrane risks are grouped together etc.).
Add a comment (in column G) about the risk you have identified and details of any Monitoring
in place (in column H). Add details regarding any risk “Controls” that are currently in place to
help manage the risk (column I) and notes if the control(s) is/are adequate (column J).
Click on the Likelihood cell that relates to the risk (column L) and a small arrow should appear.
Click this arrow to open up a dropdown menu of Likelihood Options (Medium, Probable, etc).
Choose (click on) the likelihood option in the list that relates to the risk you have identified in
the scenario. You should see the Likelihood Score (the number) automatically populate in
column N.
Repeat this process for the Consequence scoring for your chosen risk. (Click the consequence
cell in column M, click the dropdown arrow and choose the appropriate consequence from the
dropdown list). The consequence score will automatically populate column O.
You should see the Risk Score (your Likelihood Score X your Consequence Score) appear in
column P. If the score is 32 or more, it will be identified as a Key Risk (shown in column Q) and
require action.
Write the required action to reduce the risk in column R (the Required Interventions to Prevent
Failure cell). Identify who is responsible for implementing the intervention/action to mitigate
the risk in column S.
31
44B44BAlberta Surface Treatment Practice Scenario The Alberta Surface Water Treatment Works treats poor quality water that is high in colour,
turbidity and coliforms. It is a hard water supply which requires softening. Treatment at the
facility consists of a series of processes shown in the slide. They include:
Addition of PAC, alum, acid, and poly followed by a clarification stage
Addition of lime followed by a softening stage
Addition of carbon dioxide (to lower the pH) followed by a reaction tank and rapid
gravity filters
A GAC filter for removal of low level pollutants including pesticides
UV for cryptosporidium inactivation and general disinfection
The water is then dosed with chlorine and ammonia to provide a residual of chloramine
in the network
Finally fluoride is added before the water enters the network
The site is on the edge of a large town and is unmanned at the weekends. Although there is a
fence around the site, the gate is unlocked and security in general is poor. A team of four
operators used to run the plant but recently two operators have retired.
There is a standby generator on site as the power supply is unreliable (see photo). There is no
storage at the WTW and it pumps directly to three SRs (and then finally on to the customers).
The alum dosing pump is duty only and prone to failure on a regular basis. There is a common
dosing delivery point for both alum and acid (see photo).
The signal from the flowmeter (see photo) is very noisy and the flowmeter has not been
calibrated for some time.
The level of media in the rapid gravity filters has not been checked regularly and media has
been seen in the backwashing channel.
Although there are duty/standby pumps for chlorine dosing, the pump which doses ammonia
into the water has not been calibrated and is known to drift.
Treated water has, on occasion, high turbidity and high aluminium levels. Sometimes there are
taste and odour problems. Treated water quality from the last two years is given below.

32
Test Minimum Maximum Average
Colour (Hazen) < 2 <2 <2
Turbidity (NTU) 0.1 2.0 0.95
pH 7.6 8.4 8.2
Iron (µg/l) 24 35 29
Manganese (µg/l) 5.6 41 32
Total Coliforms/100mls 0 0 0
Residual Chlorine(mg/l) 0.60 0.80 0.65
Chemical delivery points
Surface Water Treatment Scenario Example Photos
Inlet flow meterValves from delivery point to chemical tank
Standby generatorFlow meter for dosing chlorine Railway runs through site
Now identify the key risks from the scenario and add them in to the electronic copy of the
DWSP Excel Template as directed above.
33
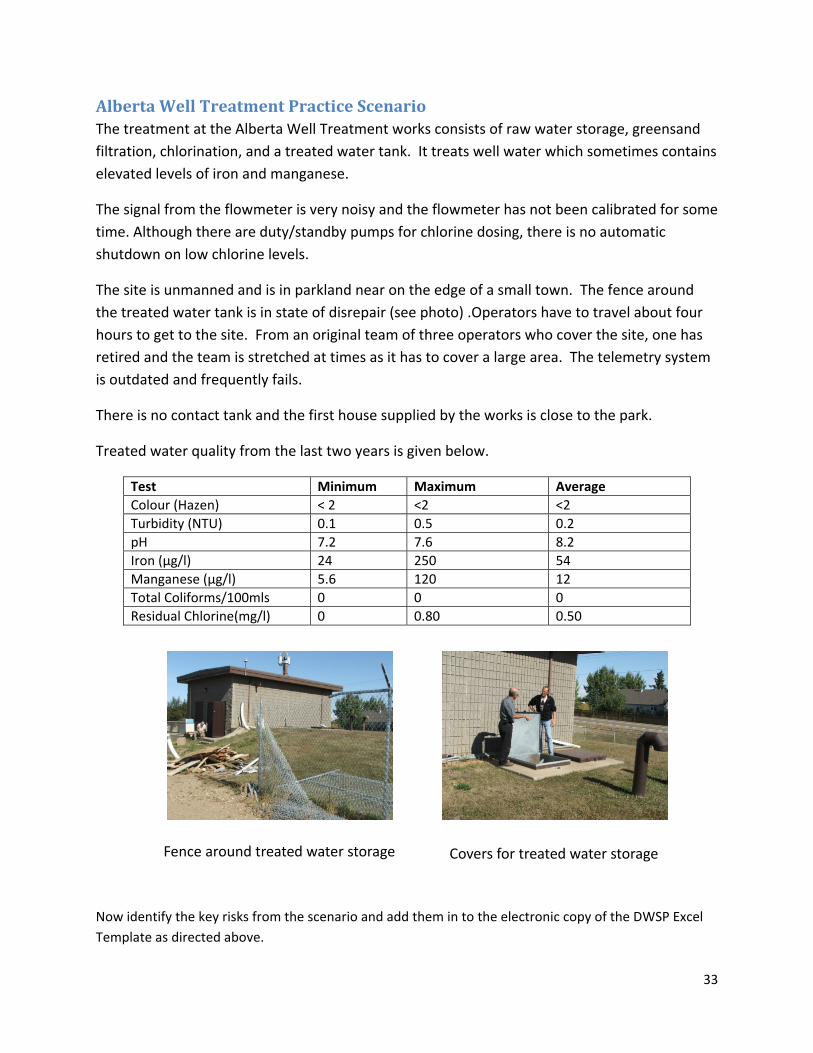
45B45BAlberta Well Treatment Practice Scenario The treatment at the Alberta Well Treatment works consists of raw water storage, greensand
filtration, chlorination, and a treated water tank. It treats well water which sometimes contains
elevated levels of iron and manganese.
The signal from the flowmeter is very noisy and the flowmeter has not been calibrated for some
time. Although there are duty/standby pumps for chlorine dosing, there is no automatic
shutdown on low chlorine levels.
The site is unmanned and is in parkland near on the edge of a small town. The fence around
the treated water tank is in state of disrepair (see photo) .Operators have to travel about four
hours to get to the site. From an original team of three operators who cover the site, one has
retired and the team is stretched at times as it has to cover a large area. The telemetry system
is outdated and frequently fails.
There is no contact tank and the first house supplied by the works is close to the park.
Treated water quality from the last two years is given below.
Test Minimum Maximum Average
Colour (Hazen) < 2 <2 <2
Turbidity (NTU) 0.1 0.5 0.2
pH 7.2 7.6 8.2
Iron (µg/l) 24 250 54
Manganese (µg/l) 5.6 120 12
Total Coliforms/100mls 0 0 0
Residual Chlorine(mg/l) 0 0.80 0.50
Now identify the key risks from the scenario and add them in to the electronic copy of the DWSP Excel
Template as directed above.
Covers for treated water storageFence around treated water storage

34
The Network Node includes all assets, processes and procedures from the finished water leaving the treatment works to the arrival at the
customer’s premises.
22B22BNetwork Node – Includes
1. Distribution systems and assets
2. Pumping stations
3. Storage resevoirs
4. Water towers
5. Operator activities
6. Valves and hydrants
Include your own examples below:
7. ………………………………
8. ………………………………

35
23B23BNetwork Risk Assessment
Consider the following sources of data and information when assessing Network risks:
24B24BDescribing the Network (Distribution System)
You need to record some key information about your distribution processes and assets in the Excel DWSP Template. This helps you, and others who may be less familiar with your distribution system, identify treatment risks.
Record the information in the Network Detail worksheet within the Excel template.
Draw a schematic of your distribution system and save this in the Network Schematic worksheet of the Excel template. Avoid making the schematic too complex.
(
)
36
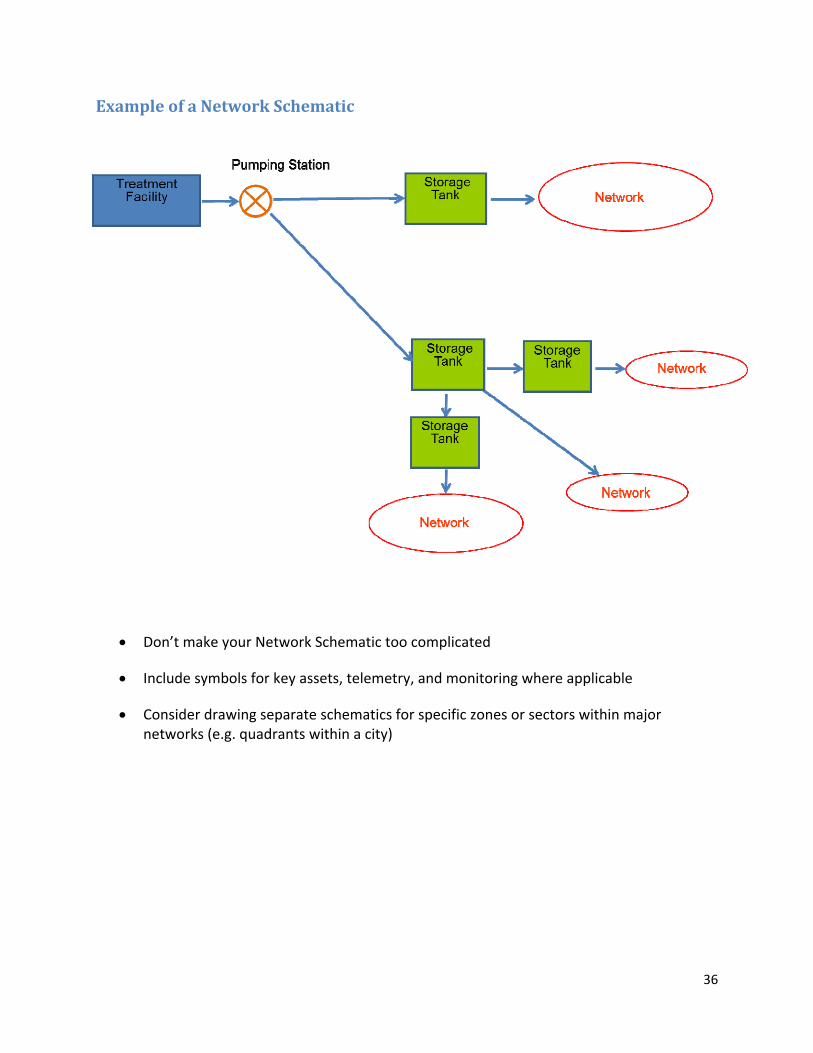
46B46BExample of a Network Schematic
Don’t make your Network Schematic too complicated
Include symbols for key assets, telemetry, and monitoring where applicable
Consider drawing separate schematics for specific zones or sectors within major networks (e.g. quadrants within a city)
37
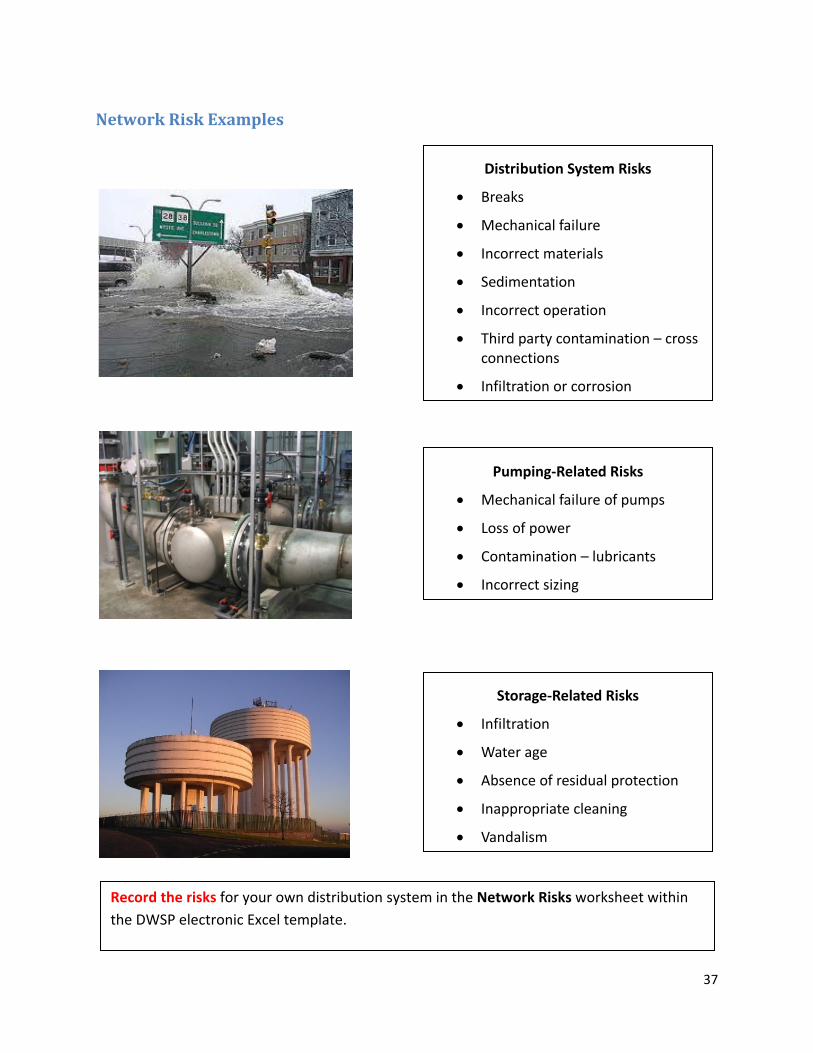
47B47BNetwork Risk Examples
Distribution System Risks
Breaks
Mechanical failure
Incorrect materials
Sedimentation
Incorrect operation
Third party contamination – cross connections
Infiltration or corrosion
Pumping‐Related Risks
Mechanical failure of pumps
Loss of power
Contamination – lubricants
Incorrect sizing
Storage‐Related Risks
Infiltration
Water age
Absence of residual protection
Inappropriate cleaning
Vandalism
Record the risks for your own distribution system in the Network Risks worksheet within
the DWSP electronic Excel template.
38
25B25BCustomer Node
26B26BDescribing the Water Supply System – Customers
A DWSP must contain some basic details on the system and flow diagrams. This is to help identify of risks, and to assist those who are not familiar with the system. Note: We do not draw a schematic of the customer’s facility or systems as this would be impractical.

39
27B27BCommon Customer Related Risks
“At Risk” Customers
Water outage
Water quality issues
Contamination
Commercial & Industrial
Water outage
Cross‐connection
Water quality
Residential Risks
Contamination of water
Use of incorrect materials
Poor plumbing practice
Failure to follow codes of practice
Outage & quality
Consider both the impact you can have on the customer and the impact the customer can have on your system (e.g. cross‐connection, contamination, usage, etc)
Record Customer Risks in the Customer Risks worksheet within the DWSP electronic Excel template.

40
28B28BNetwork and Customer Practice Scenario Open up the Alberta DWSP Template (the Excel template you will use to record your safety
plan) and make a copy (if you have not already done so) that you can use for training purposes
(rename this document Scenario Training Copy). Remember to click “Enable Macros” each time
you open the DWSP Template so that all of the Excel links work correctly.
Go to the Network Risks worksheet and the Customer Risks worksheet in the DWSP Template
and scroll down the list of Risk Descriptions (column C in the Excel template) until you match
the risk(s) you identified in the scenario below with the appropriate risk in the DWSP template.
Add a comment (in column G) about the risk you have identified and details of any Monitoring
in place (in column H). Add details regarding any risk “Controls” that are currently in place to
help manage the risk (in column I) and notes if the control(s) is/are adequate (in column J).
Click on the Likelihood cell that relates to the risk (column L) and a small arrow should appear.
Click this arrow to open up a dropdown menu of Likelihood Options (Medium, Probable, etc).
Choose (click on) the likelihood option in the list that relates to the risk you have identified in
the scenario. You should see the Likelihood Score (the number) automatically populate column
N.
Repeat this process for the Consequence scoring for your chosen risk. (Click the consequence
cell in column M, click the dropdown arrow and choose the appropriate consequence from the
dropdown list). The consequence score will automatically populate column O.
You should see the Risk Score (your Likelihood Score X your Consequence Score) appear in
column P. If the score is 32 or more, it will be identified as a Key Risk (shown in column Q) and
require action.
Write the required action to reduce the risk in column R (the Required Interventions to Prevent
Failure cell). Identify who is responsible for implementing the intervention/action to mitigate
the risk in column S.
Identify at least three Network‐related risks and three Customer related risks from the scenario below and record these in the DWSP electronic template.
41
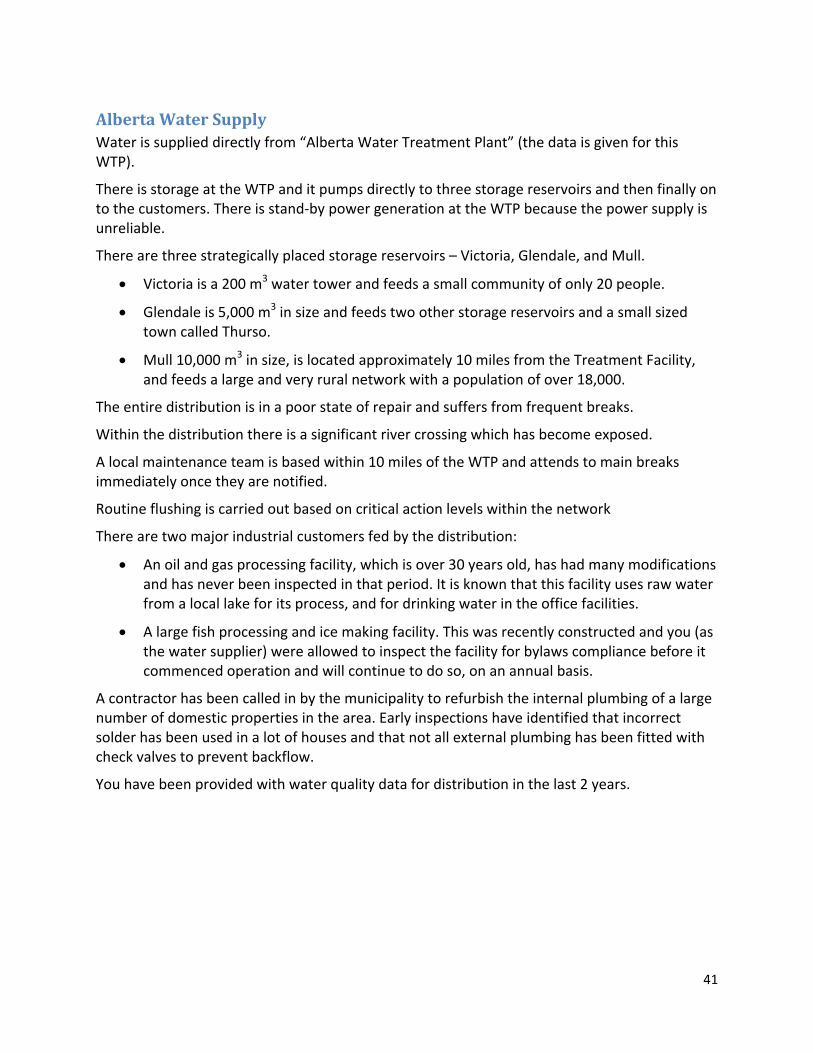
48B48BAlberta Water Supply Water is supplied directly from “Alberta Water Treatment Plant” (the data is given for this WTP).
There is storage at the WTP and it pumps directly to three storage reservoirs and then finally on to the customers. There is stand‐by power generation at the WTP because the power supply is unreliable.
There are three strategically placed storage reservoirs – Victoria, Glendale, and Mull.
Victoria is a 200 m3 water tower and feeds a small community of only 20 people.
Glendale is 5,000 m3 in size and feeds two other storage reservoirs and a small sized town called Thurso.
Mull 10,000 m3 in size, is located approximately 10 miles from the Treatment Facility, and feeds a large and very rural network with a population of over 18,000.
The entire distribution is in a poor state of repair and suffers from frequent breaks.
Within the distribution there is a significant river crossing which has become exposed.
A local maintenance team is based within 10 miles of the WTP and attends to main breaks immediately once they are notified.
Routine flushing is carried out based on critical action levels within the network
There are two major industrial customers fed by the distribution:
An oil and gas processing facility, which is over 30 years old, has had many modifications and has never been inspected in that period. It is known that this facility uses raw water from a local lake for its process, and for drinking water in the office facilities.
A large fish processing and ice making facility. This was recently constructed and you (as the water supplier) were allowed to inspect the facility for bylaws compliance before it commenced operation and will continue to do so, on an annual basis.
A contractor has been called in by the municipality to refurbish the internal plumbing of a large number of domestic properties in the area. Early inspections have identified that incorrect solder has been used in a lot of houses and that not all external plumbing has been fitted with check valves to prevent backflow.
You have been provided with water quality data for distribution in the last 2 years.

42
Alberta Water Treatment Plant Test Minimum Maximum Average
Colour (Hazen) < 2 <2 <2
Turbidity (NTU) 0.1 2.0 0.95
pH 7.6 8.4 8.2
Iron (µg/l) 24 35 29
Manganese (µg/l) 5.6 41 32
Total Coliforms/100mls 0 0 0
Residual Chlorine(mg/l) 0.60 0.80 0.65
Victoria Storage Reservoir Outlet Test Minimium Maximum Average
Colour (Hazen) 2 3 2.2
Turbidity (NTU) 0.1 0.55 0.45
pH 7.4 8.3 8.1
Iron (µg/l) 30 56 42
Manganese (µg/l) 5.6 43.1 29.1
Total Coliforms/100mls 0 0 0
Residual Chlorine(mg/l) 0.02 0.14 0.06
Glendale Storage Reservoir Outlet Test Minimium Maximum Average
Colour (Hazen) 2 3 2.2
Turbidity (NTU) 0.1 0.47 0.33
pH 7.2 8.4 8.2
Iron (µg/l) 24 48 33
Manganese (µg/l) 3.5 37.2 26.5
Total Coliforms/100mls 0 13 5.6
Residual Chlorine(mg/l) 0.08 0.40 0.17
Mull Storage Reservoir Outlet Test Minimum Maximum Average
Colour (Hazen) 2 3 2.1
Turbidity (NTU) 0.1 0.16 0.12
pH 6.8 8.3 7.4
Iron (µg/l) <20 43 27
Manganese (µg/l) 3.8 33.1 24.3
Total Coliforms/100mls 0 4 2.6
Residual Chlorine(mg/l) 0.04 0.25 0.13
Alberta Lake Distribution (Customers tap) Test Minimum Maximum Average
Colour (Hazen) 2.6 4.8 2.8
Turbidity (NTU) 0.1 0.75 0.47
pH 6.7 8.0 7.3
Iron (µg/l) 24 377 195
Manganese (µg/l) 3.4 76.2 47.6
Lead (µg/l) <2 75 18.2
Total Coliforms/100mls 0 13 5.6
Residual Chlorine(mg/l) 0.02 0.25 0.14

43
Example Photos
Risks You Might Consider:
Storage Reservoirs
Victoria – old tank, significant water age, low residual – potential risk of failure
Glendale – overgrown, potential integrity issues – coliform failures
Mull – above ground, coliform failures
All three storage reservoirs have significant manganese levels and may have some deposition issues
Distribution System
Loss of supply – regular bursts/managed by find and fix
Corrosion – mains are encrusted/iron manganese results
River crossing – likely to break or freeze/repair time – loss of supply
Dirty water – manganese issues
Customers
Oil and gas facility – possible cross connections with raw water supplies
Back siphonage ‐ domestic properties
Victoria Storage Reservoir River Crossing A Recent Pipe Cutting Taken from the Distribution System
44
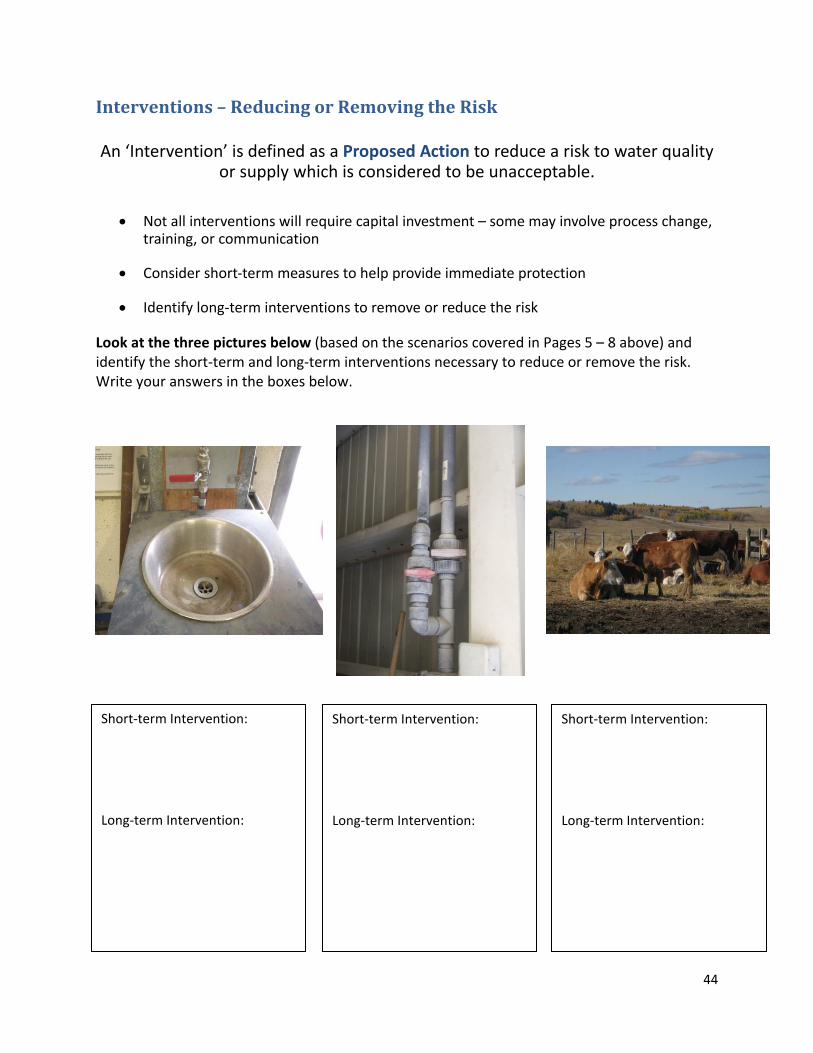
29B29BInterventions – Reducing or Removing the Risk An ‘Intervention’ is defined as a Proposed Action to reduce a risk to water quality
or supply which is considered to be unacceptable.
Not all interventions will require capital investment – some may involve process change, training, or communication
Consider short‐term measures to help provide immediate protection
Identify long‐term interventions to remove or reduce the risk
Look at the three pictures below (based on the scenarios covered in Pages 5 – 8 above) and identify the short‐term and long‐term interventions necessary to reduce or remove the risk. Write your answers in the boxes below.
Short‐term Intervention:
Long‐term Intervention:
Short‐term Intervention:
Long‐term Intervention:
Short‐term Intervention:
Long‐term Intervention:
45
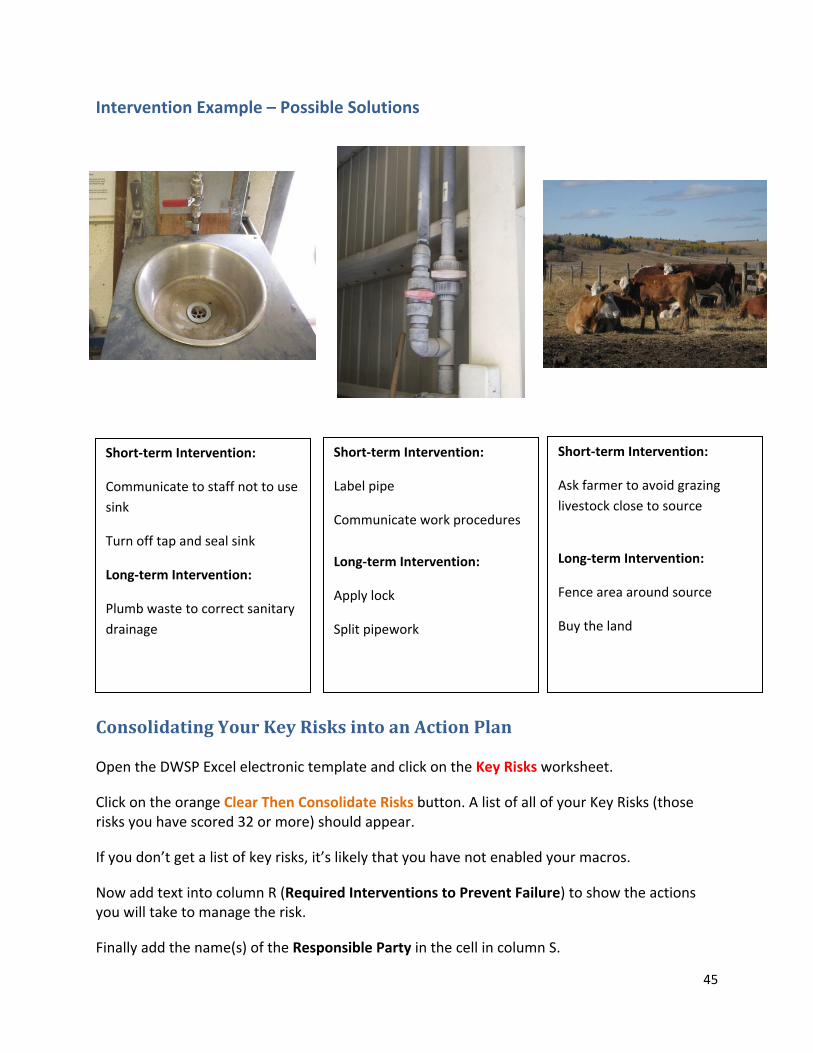
Intervention Example – Possible Solutions
30B30BConsolidating Your Key Risks into an Action Plan
Open the DWSP Excel electronic template and click on the Key Risks worksheet.
Click on the orange Clear Then Consolidate Risks button. A list of all of your Key Risks (those risks you have scored 32 or more) should appear.
If you don’t get a list of key risks, it’s likely that you have not enabled your macros.
Now add text into column R (Required Interventions to Prevent Failure) to show the actions you will take to manage the risk.
Finally add the name(s) of the Responsible Party in the cell in column S.
Short‐term Intervention:
Communicate to staff not to use
sink
Turn off tap and seal sink
Long‐term Intervention:
Plumb waste to correct sanitary
drainage
Short‐term Intervention:
Label pipe
Communicate work procedures
Long‐term Intervention:
Apply lock
Split pipework
Short‐term Intervention:
Ask farmer to avoid grazing
livestock close to source
Long‐term Intervention:
Fence area around source
Buy the land
46
31B31BCreating an Action Summary (Action Plan)
Open the DWSP Excel electronic template and click on the Action Summary worksheet. Click on the orange Update Action Summary button. A list of all of your Key Risks (those risks you have scored 32 or more) that require action should appear. If you don’t get a list of key risks, it’s likely that you have not “enabled your macros”.
This Action Summary Sheet forms a simple and easy to follow action plan for managing your key risks. Add text into cells E, F, G, H, I, J, and K to create your action plan.
It is likely that Alberta Environment and Sustainable Resource Development will want to see this action plan when they review your DWSP. Make sure that you complete this in detail.
32B32BReviewing Your DWSP
When to Review
You should consider reviewing your DWSP:
On a predetermined frequency of update
On a predetermined frequency for full review
In response to event, incident, or near miss
When there is a significant change to system configuration, operation or performance
33B33BSources of Additional DWSP Information
You may find the following websites useful for providing additional DWSP information:
Alberta Environment and Sustainable Resource Development Website (and to download the Excel DWSP Template)
HHhttp://www.environment.alberta.ca/apps/regulateddwq/dwsp.aspx
Email questions regarding DWSPs to [email protected] HH or contact your local DWOS representative.
World Health Organization
http://www.who.int/water_sanitation_health/dwq/wsp0506/en/index.html
Scotland Private Water Supplies
http://www.privatewatersupplies.gov.uk/private_water/CCC_FirstPage.jsp
Ministry of Health New Zealand http://www.moh.govt.nz/drinkingwater
47
34B34BWriting Your DWSP
49B49BDocuments to Support Writing Your DWSP It’s now time to write your DWSP. Go to the Alberta Environment and Sustainable Resource
Development DWSP webpage HHwww.environment.alberta.ca/apps/regulateddwq/dwsp.aspx
Download and review the following documents (if you don’t already have them):
Alberta DWSP Template (the Excel template you will use to record your safety plan)
Guidance Notes for the DWSP Template (which explains how to use the DWSP template)
Alberta DWSP Guidance Manual (which shows how to prepare and create a DWSP)
The documents show you how to write your DWSP.
50B50BYour DWSP Team
It is useful to get more than one person involved in writing your DWSP – this helps with risk assessment decisions and sharing the workload of writing and maintaining the plan.
The DWSP cannot be written as a “desktop” exercise. You need to get out on site, with those people that really understand and can operate your system, to identify risks. Think about who these people are and involve them in writing the plan.
You will also need the buy‐in of your system sponsors (management, Councillors, Mayor, etc.) both to understand the value of conducting risk assessments and to support any actions required to remove or reduce the key risks you identify.
Finally, you may need the support of administrative or IT staff to help you record and securely save the electronic copy of your DWSP.
35B35BConclusion
The DWSP is a useful tool to help you identify and reduce risks before an incident happens. This is far more effective than dealing with the consequences of a failure. We hope you have found these training materials useful, and we wish you success in developing your DWSP.