drinking water quality assessment in selected …ijesd.org/vol6/556-c3011.pdf · noblan in laoang...
TRANSCRIPT
Abstract—This study aimed to assess drinking water quality
of the different water sources in Barangays Vigo, Yapas and
Tinoblan in Laoang Northern Samar. Water sources were: deep
well, pump well and communal faucets. Water quality is based
on the physical, chemical and bacteriological properties for
each of the eight sampling stations. Three sampling periods
were made at an interval of at least 15 days from
January-February, 2012. Findings revealed that most water
sources were within the permissible limits in terms of color,
odor, pH, total dissolved solids (TDS), salinity, dissolved oxygen
(DO) and nitrite. However, hardness and alkalinity were
beyond the allowable limits. All water samples were positive for
fecal coliforms. Thus, this study concludes that all water sources
tested are not safe and not potable.
Index Terms—Barangays, nitrite, water quality, water
sources.
I. INTRODUCTION
Contamination of drinking water remains a problem in
rural areas where deep well, common faucets and sometimes
water direct from streams or springs are the available sources
which does not undergo proper water treatment before it is
consumed. In 2010 and 2011, results of the morbidity reports
for water-borne diseases from Rural Health Unit in Laoang,
Northern Samar (LNS) and in hospital was alarming [1].
Acute gastroenteritis, cholera and typhoid fever ranked first
[2], [3]. Thus, this study aimed to assess the drinking water
quality of the three barangays. Specifically, it tried to
determine the physical, chemical and bacteriological
properties [4] of these drinking water sources and compared
these parameters with the standards set by the Department of
Environmental and Natural Resources (DENR) [5].
II. MATERIALS AND METHODS
Eight sampling stations were purposively selected from
the three barangays. Three sampling periods with three trials
for each parameter were taken from January-February 2011.
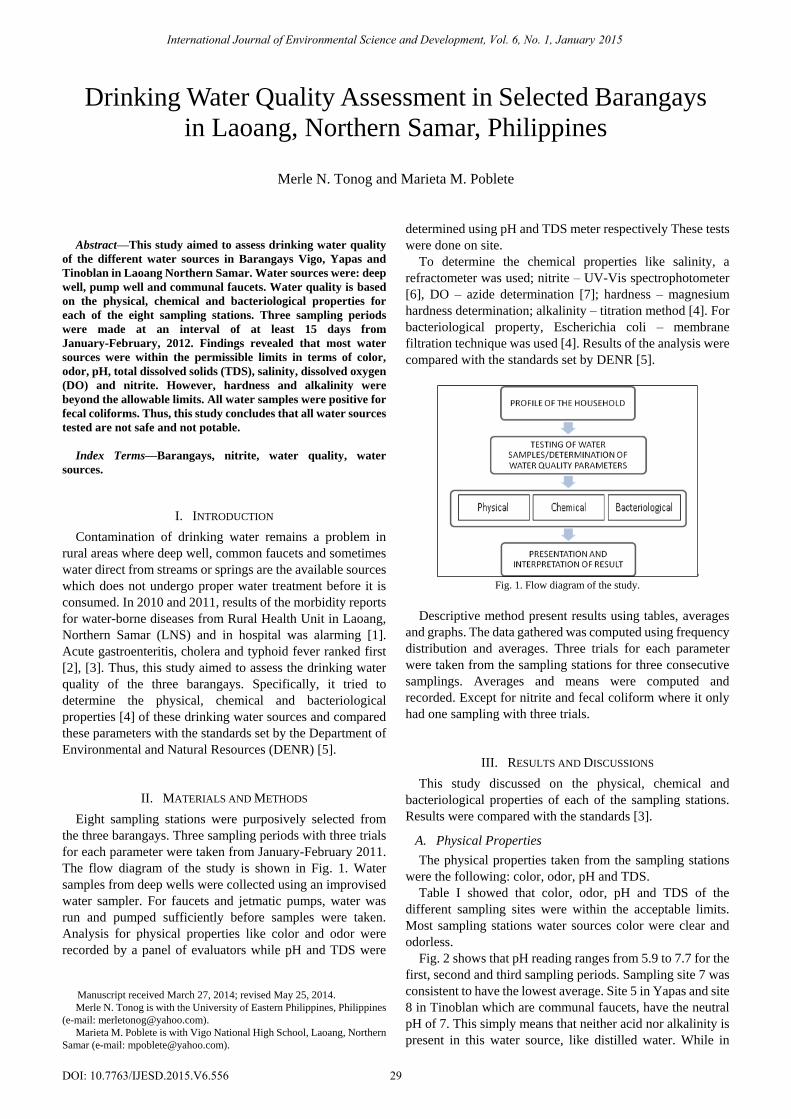
The flow diagram of the study is shown in Fig. 1. Water
samples from deep wells were collected using an improvised
water sampler. For faucets and jetmatic pumps, water was
run and pumped sufficiently before samples were taken.
Analysis for physical properties like color and odor were
recorded by a panel of evaluators while pH and TDS were
Manuscript received March 27, 2014; revised May 25, 2014.
Merle N. Tonog is with the University of Eastern Philippines, Philippines
(e-mail: [email protected]).
Marieta M. Poblete is with Vigo National High School, Laoang, Northern
Samar (e-mail: [email protected]).
determined using pH and TDS meter respectively These tests
were done on site.
To determine the chemical properties like salinity, a
refractometer was used; nitrite – UV-Vis spectrophotometer
[6], DO – azide determination [7]; hardness – magnesium
hardness determination; alkalinity – titration method [4]. For
bacteriological property, Escherichia coli – membrane
filtration technique was used [4]. Results of the analysis were
compared with the standards set by DENR [5].
Fig. 1. Flow diagram of the study.
Descriptive method present results using tables, averages
and graphs. The data gathered was computed using frequency
distribution and averages. Three trials for each parameter
were taken from the sampling stations for three consecutive
samplings. Averages and means were computed and
recorded. Except for nitrite and fecal coliform where it only
had one sampling with three trials.
III. RESULTS AND DISCUSSIONS
This study discussed on the physical, chemical and
bacteriological properties of each of the sampling stations.
Results were compared with the standards [3].
A. Physical Properties
The physical properties taken from the sampling stations
were the following: color, odor, pH and TDS.
Table I showed that color, odor, pH and TDS of the
different sampling sites were within the acceptable limits.
Most sampling stations water sources color were clear and
odorless.
Fig. 2 shows that pH reading ranges from 5.9 to 7.7 for the
first, second and third sampling periods. Sampling site 7 was
consistent to have the lowest average. Site 5 in Yapas and site
8 in Tinoblan which are communal faucets, have the neutral
pH of 7. This simply means that neither acid nor alkalinity is
present in this water source, like distilled water. While in
Drinking Water Quality Assessment in Selected Barangays
in Laoang, Northern Samar, Philippines
Merle N. Tonog and Marieta M. Poblete
29DOI: 10.7763/IJESD.2015.V6.556
International Journal of Environmental Science and Development, Vol. 6, No. 1, January 2015
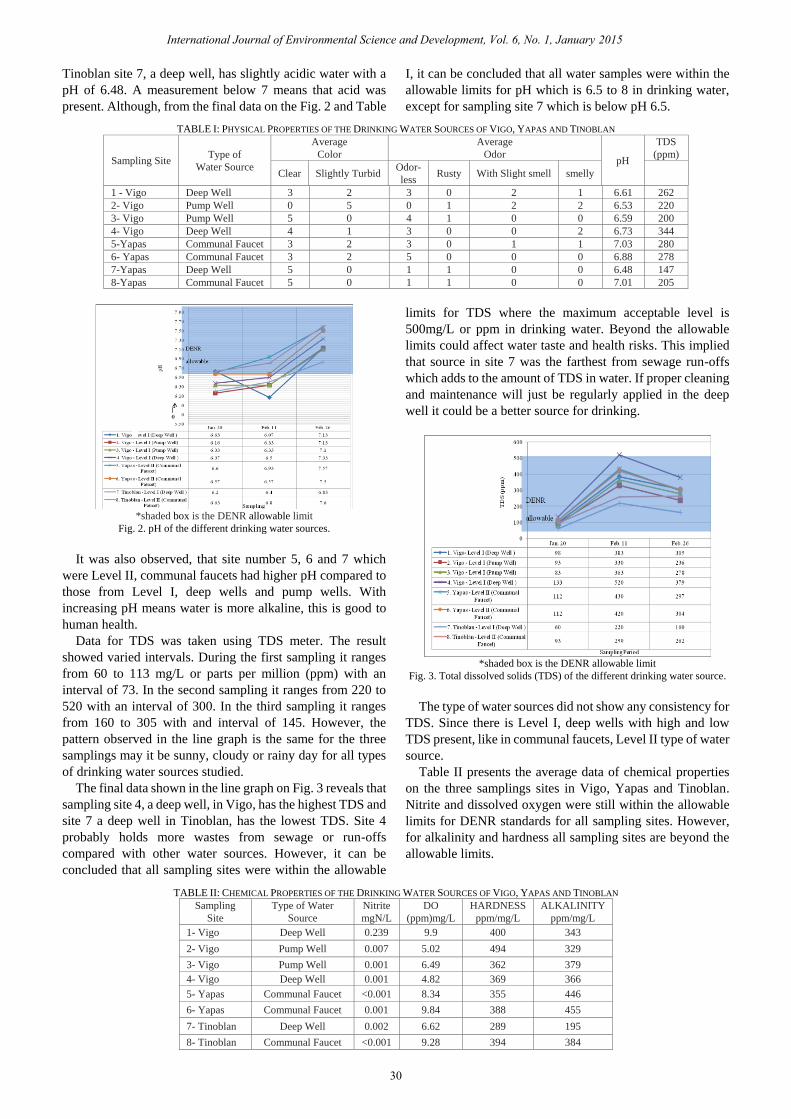
Tinoblan site 7, a deep well, has slightly acidic water with a
pH of 6.48. A measurement below 7 means that acid was
present. Although, from the final data on the Fig. 2 and Table
I, it can be concluded that all water samples were within the
allowable limits for pH which is 6.5 to 8 in drinking water,
except for sampling site 7 which is below pH 6.5.
TABLE I: PHYSICAL PROPERTIES OF THE DRINKING WATER SOURCES OF VIGO, YAPAS AND TINOBLAN
Sampling Site Type of
Water Source
Average
Color
Average
Odor pH
TDS
(ppm)
Clear Slightly Turbid Odor-
less Rusty With Slight smell smelly
1 - Vigo Deep Well 3 2 3 0 2 1 6.61 262
2- Vigo Pump Well 0 5 0 1 2 2 6.53 220
3- Vigo Pump Well 5 0 4 1 0 0 6.59 200
4- Vigo Deep Well 4 1 3 0 0 2 6.73 344
5-Yapas Communal Faucet 3 2 3 0 1 1 7.03 280
6- Yapas Communal Faucet 3 2 5 0 0 0 6.88 278
7-Yapas Deep Well 5 0 1 1 0 0 6.48 147
8-Yapas Communal Faucet 5 0 1 1 0 0 7.01 205
*shaded box is the DENR allowable limit
Fig. 2. pH of the different drinking water sources.
It was also observed, that site number 5, 6 and 7 which
were Level II, communal faucets had higher pH compared to
those from Level I, deep wells and pump wells. With
increasing pH means water is more alkaline, this is good to
human health.
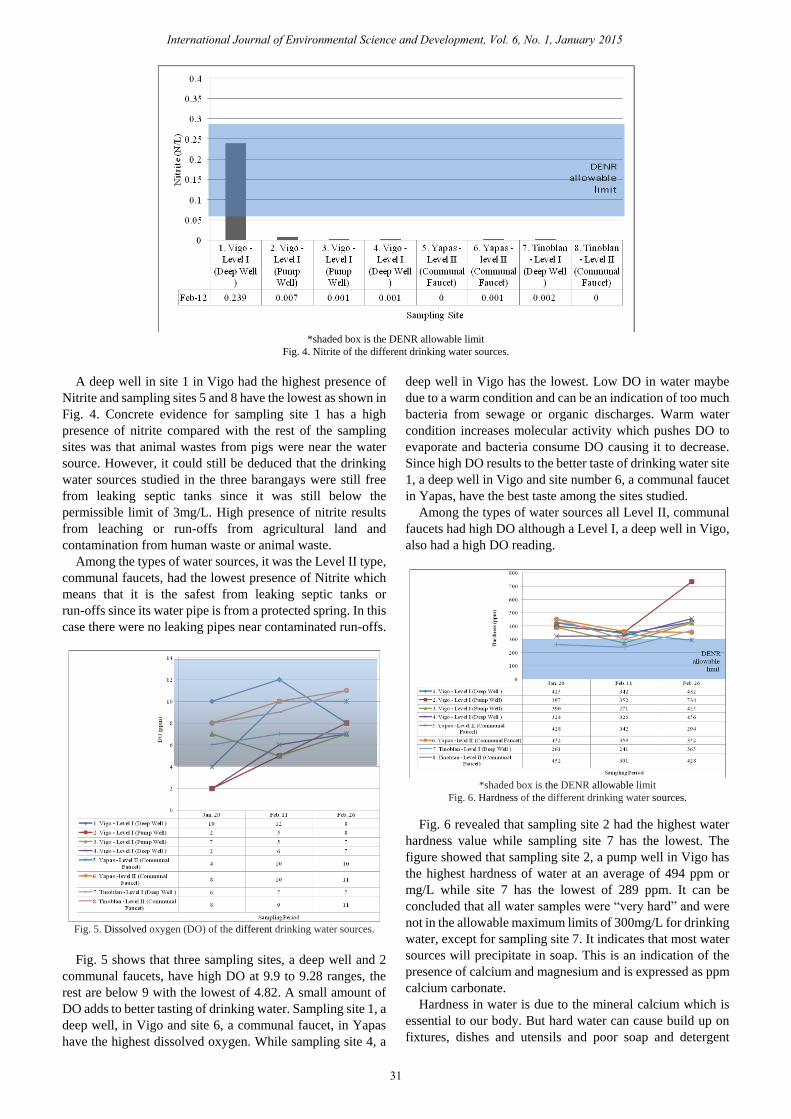
Data for TDS was taken using TDS meter. The result
showed varied intervals. During the first sampling it ranges
from 60 to 113 mg/L or parts per million (ppm) with an
interval of 73. In the second sampling it ranges from 220 to
520 with an interval of 300. In the third sampling it ranges
from 160 to 305 with and interval of 145. However, the
pattern observed in the line graph is the same for the three
samplings may it be sunny, cloudy or rainy day for all types
of drinking water sources studied.
The final data shown in the line graph on Fig. 3 reveals that
sampling site 4, a deep well, in Vigo, has the highest TDS and
site 7 a deep well in Tinoblan, has the lowest TDS. Site 4
probably holds more wastes from sewage or run-offs
compared with other water sources. However, it can be
concluded that all sampling sites were within the allowable
limits for TDS where the maximum acceptable level is
500mg/L or ppm in drinking water. Beyond the allowable
limits could affect water taste and health risks. This implied
that source in site 7 was the farthest from sewage run-offs
which adds to the amount of TDS in water. If proper cleaning
and maintenance will just be regularly applied in the deep
well it could be a better source for drinking.
*shaded box is the DENR allowable limit
Fig. 3. Total dissolved solids (TDS) of the different drinking water source.
The type of water sources did not show any consistency for
TDS. Since there is Level I, deep wells with high and low
TDS present, like in communal faucets, Level II type of water
source.
Table II presents the average data of chemical properties
on the three samplings sites in Vigo, Yapas and Tinoblan.
Nitrite and dissolved oxygen were still within the allowable
limits for DENR standards for all sampling sites. However,
for alkalinity and hardness all sampling sites are beyond the
allowable limits.
TABLE II: CHEMICAL PROPERTIES OF THE DRINKING WATER SOURCES OF VIGO, YAPAS AND TINOBLAN
Sampling
Site
Type of Water
Source
Nitrite
mgN/L
DO
(ppm)mg/L
HARDNESS
ppm/mg/L
ALKALINITY
ppm/mg/L
1- Vigo Deep Well 0.239 9.9 400 343
2- Vigo Pump Well 0.007 5.02 494 329
3- Vigo Pump Well 0.001 6.49 362 379
4- Vigo Deep Well 0.001 4.82 369 366
5- Yapas Communal Faucet <0.001 8.34 355 446
6- Yapas Communal Faucet 0.001 9.84 388 455
7- Tinoblan Deep Well 0.002 6.62 289 195
8- Tinoblan Communal Faucet <0.001 9.28 394 384
30
International Journal of Environmental Science and Development, Vol. 6, No. 1, January 2015
*shaded box is the DENR allowable limit
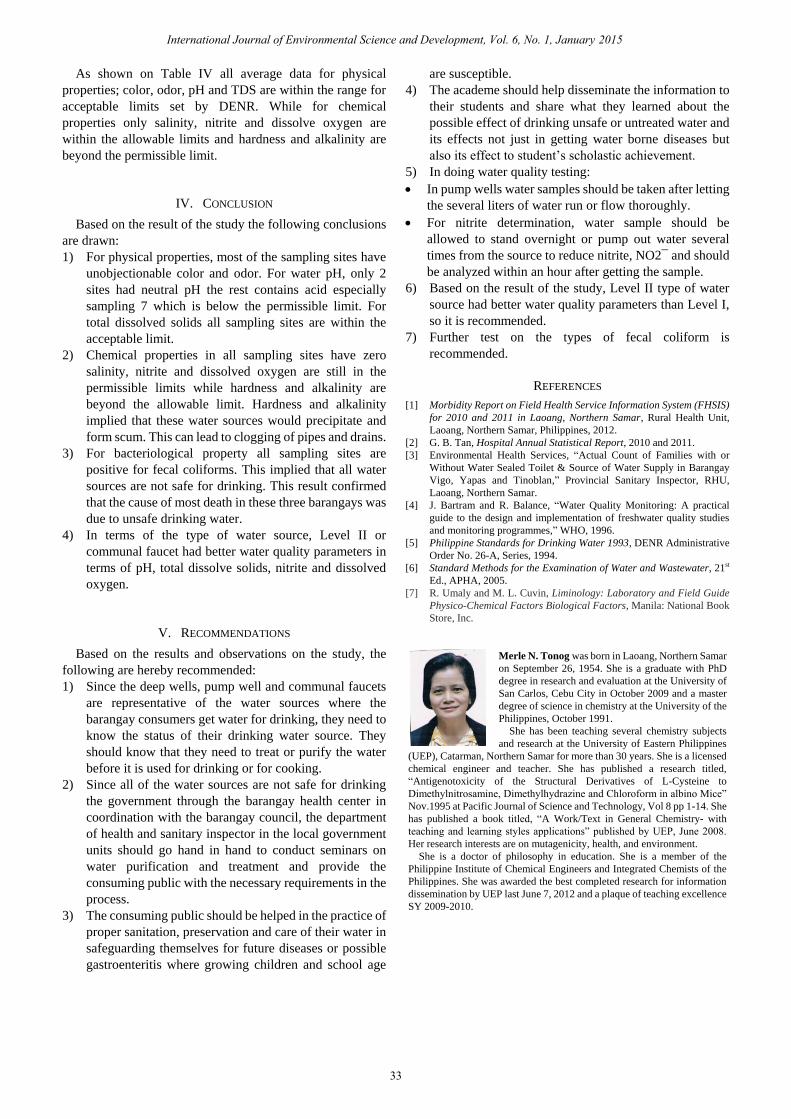
Fig. 4. Nitrite of the different drinking water sources.
A deep well in site 1 in Vigo had the highest presence of
Nitrite and sampling sites 5 and 8 have the lowest as shown in
Fig. 4. Concrete evidence for sampling site 1 has a high
presence of nitrite compared with the rest of the sampling
sites was that animal wastes from pigs were near the water
source. However, it could still be deduced that the drinking
water sources studied in the three barangays were still free
from leaking septic tanks since it was still below the
permissible limit of 3mg/L. High presence of nitrite results
from leaching or run-offs from agricultural land and
contamination from human waste or animal waste.
Among the types of water sources, it was the Level II type,
communal faucets, had the lowest presence of Nitrite which
means that it is the safest from leaking septic tanks or
run-offs since its water pipe is from a protected spring. In this
case there were no leaking pipes near contaminated run-offs.
Fig. 5. Dissolved oxygen (DO) of the different drinking water sources.
Fig. 5 shows that three sampling sites, a deep well and 2
communal faucets, have high DO at 9.9 to 9.28 ranges, the
rest are below 9 with the lowest of 4.82. A small amount of
DO adds to better tasting of drinking water. Sampling site 1, a
deep well, in Vigo and site 6, a communal faucet, in Yapas
have the highest dissolved oxygen. While sampling site 4, a
deep well in Vigo has the lowest. Low DO in water maybe
due to a warm condition and can be an indication of too much
bacteria from sewage or organic discharges. Warm water
condition increases molecular activity which pushes DO to
evaporate and bacteria consume DO causing it to decrease.
Since high DO results to the better taste of drinking water site
1, a deep well in Vigo and site number 6, a communal faucet
in Yapas, have the best taste among the sites studied.
Among the types of water sources all Level II, communal
faucets had high DO although a Level I, a deep well in Vigo,
also had a high DO reading.
*shaded box is the DENR allowable limit
Fig. 6. Hardness of the different drinking water sources.
Fig. 6 revealed that sampling site 2 had the highest water
hardness value while sampling site 7 has the lowest. The
figure showed that sampling site 2, a pump well in Vigo has
the highest hardness of water at an average of 494 ppm or
mg/L while site 7 has the lowest of 289 ppm. It can be
concluded that all water samples were “very hard” and were
not in the allowable maximum limits of 300mg/L for drinking
water, except for sampling site 7. It indicates that most water
sources will precipitate in soap. This is an indication of the
presence of calcium and magnesium and is expressed as ppm
calcium carbonate.
Hardness in water is due to the mineral calcium which is
essential to our body. But hard water can cause build up on
fixtures, dishes and utensils and poor soap and detergent
M
i
n
i
m
u
m
:
5
T
h
e
h
i
g
h
e
r
t
h
e
b
e
t
t
e
31
International Journal of Environmental Science and Development, Vol. 6, No. 1, January 2015

performance. Its alkaline taste makes coffee bitter and lowers
the efficiency of electric water heater. Furthermore, all of the
water sources studied have high water hardness may it be a
Level I or Level II type of water source.
*shaded box is the DENR allowable limit
Fig. 7. Alkalinity of the different drinking water sources.
Fig. 7 revealed that sampling site 6, a communal faucet in
Yapas has the highest alkalinity of water and site 7 has the
lowest. Main sources for alkalinity are rocks, which contain
carbonate, bicarbonate and hydroxide compounds. Only
sampling site 7, a deep well was within the permissible limit
of 300mg/L. This result implied that most of the water
studied were “very hard” water which indicate the presence
of many carbonates and bicarbonates.
Alkalinity of water is its capacity to neutralize acid which
is independent of the sample. This means that whatever is the
amount of the sample, its power to react with acid and buffer
its pH will still be the same. So that the higher the alkalinity
the better its buffering capacity. This makes water become
less vulnerable to acid rain.
*shaded box is the DENR allowable limit
Fig. 8. Alkalinity and hardness of the different drinking water sources.
Table II shows the comparison of the average data between
water hardness and alkalinity. It can be observed that the data
for the two parameters are closely related where most
sampling sites have high result except for sampling site
number 7. Sampling site number 2 has the greatest difference
in hardness and alkalinity.
As observed in Fig. 8, station 2 had a highest hardness
value, while station 7 lowest. Similar trend occurs as to the
Alkalinity. Fig. 8 indicates that these drinking water sources
have very hard water. It implies the presence of carbonates of
magnesium and calcium. Though these values affect some
pipes and lather capacity during laundry these calcium and
magnesium are minerals that add to the sweet taste of water.
B. Bacteriological Properties
Table III gives the result on the fecal coliform
determination for the sampling sites studied in barangay Vigo,
Yapas and Tinoblan.
The data on Table III shows that all sampling sites; Level I,
deep well and pump well and Level II, communal faucets,
indicate that these are positive for fecal contamination. This
means that water samples are contaminated with Escherichia
coli and water are not safe for drinking.
This also mean that water sources in these barangays are
not safe because there are bacteria that can cause diarrhea,
gastroenteritis, typhoid fever and other water borne related
diseases.
TABLE III: FECAL COLIFORM OF THE DRINKING WATER SOURCES OF VIGO,
YAPAS AND TINOBLAN
Sampling
Site
Type of Water
Source
Fecal
Coliform Interpretation
1 Deep Well + Positive for fecal
coliform
2 Pump Well + Positive for fecal
coliform
3 Pump Well + Positive for fecal
coliform
4 Deep Well + Positive for fecal
coliform
5 Communal Faucet + Positive for fecal
coliform
6 Communal Faucet + Positive for fecal
coliform
7 Deep Well + Positive for fecal
coliform
8 Communal Faucet + Positive for fecal
coliform
C. Research Data and DENR Standards
Table IV gives the research data and the DENR standards
[3] applied for the parameters studied on the drinking water
sources in Vigo, Yapas and Tinoblan, Laoang.
TABLE IV: TABLE OF THE AVERAGE RESEARCH DATA AND DENR
STANDARD
PARAMETERS Research Data DENR Standard
Physical
Property
Color Clear Unobjectionable
Odor Odorless Unobjectionable
pH 6.48 – 7.03 6.5 to 8.0
Total
Dissolved
Solids
147 – 344
mg/L
500 mg/L
Chemical
Property
Salinity 0.00 0
Nitrite < 0.001 – 0.239
mgN/L
3 mg/L
Dissolved
Oxygen
4.82 – 9.9
mg/L
min.=5,thehigher
the better
Hardness 289 – 494
mg/L
300mg/L
Alkalinity 195 – 455
mg/L
300mg/L
Bacteriological
Property
Fecal
Coliform
positive 0 / 100mL
32
International Journal of Environmental Science and Development, Vol. 6, No. 1, January 2015
As shown on Table IV all average data for physical
properties; color, odor, pH and TDS are within the range for
acceptable limits set by DENR. While for chemical
properties only salinity, nitrite and dissolve oxygen are
within the allowable limits and hardness and alkalinity are
beyond the permissible limit.
IV. CONCLUSION
Based on the result of the study the following conclusions
are drawn:
1) For physical properties, most of the sampling sites have
unobjectionable color and odor. For water pH, only 2
sites had neutral pH the rest contains acid especially
sampling 7 which is below the permissible limit. For
total dissolved solids all sampling sites are within the
acceptable limit.
2) Chemical properties in all sampling sites have zero
salinity, nitrite and dissolved oxygen are still in the
permissible limits while hardness and alkalinity are
beyond the allowable limit. Hardness and alkalinity
implied that these water sources would precipitate and
form scum. This can lead to clogging of pipes and drains.
3) For bacteriological property all sampling sites are
positive for fecal coliforms. This implied that all water
sources are not safe for drinking. This result confirmed
that the cause of most death in these three barangays was
due to unsafe drinking water.
4) In terms of the type of water source, Level II or
communal faucet had better water quality parameters in
terms of pH, total dissolve solids, nitrite and dissolved
oxygen.
V. RECOMMENDATIONS
Based on the results and observations on the study, the
following are hereby recommended:
1) Since the deep wells, pump well and communal faucets
are representative of the water sources where the
barangay consumers get water for drinking, they need to
know the status of their drinking water source. They
should know that they need to treat or purify the water
before it is used for drinking or for cooking.
2) Since all of the water sources are not safe for drinking
the government through the barangay health center in
coordination with the barangay council, the department
of health and sanitary inspector in the local government
units should go hand in hand to conduct seminars on
water purification and treatment and provide the
consuming public with the necessary requirements in the
process.
3) The consuming public should be helped in the practice of
proper sanitation, preservation and care of their water in
safeguarding themselves for future diseases or possible
gastroenteritis where growing children and school age
are susceptible.
4) The academe should help disseminate the information to
their students and share what they learned about the
possible effect of drinking unsafe or untreated water and
its effects not just in getting water borne diseases but
also its effect to student’s scholastic achievement.
5) In doing water quality testing:
In pump wells water samples should be taken after letting
the several liters of water run or flow thoroughly.
For nitrite determination, water sample should be
allowed to stand overnight or pump out water several
times from the source to reduce nitrite, NO2 ̄and should
be analyzed within an hour after getting the sample.
6) Based on the result of the study, Level II type of water
source had better water quality parameters than Level I,
so it is recommended.
7) Further test on the types of fecal coliform is
recommended.
REFERENCES
[1] Morbidity Report on Field Health Service Information System (FHSIS)
for 2010 and 2011 in Laoang, Northern Samar, Rural Health Unit,
Laoang, Northern Samar, Philippines, 2012.
[2] G. B. Tan, Hospital Annual Statistical Report, 2010 and 2011.
[3] Environmental Health Services, “Actual Count of Families with or
Without Water Sealed Toilet & Source of Water Supply in Barangay
Vigo, Yapas and Tinoblan,” Provincial Sanitary Inspector, RHU,
Laoang, Northern Samar.
[4] J. Bartram and R. Balance, “Water Quality Monitoring: A practical
guide to the design and implementation of freshwater quality studies
and monitoring programmes,” WHO, 1996.
[5] Philippine Standards for Drinking Water 1993, DENR Administrative
Order No. 26-A, Series, 1994.
[6] Standard Methods for the Examination of Water and Wastewater, 21st
Ed., APHA, 2005.
[7] R. Umaly and M. L. Cuvin, Liminology: Laboratory and Field Guide
Physico-Chemical Factors Biological Factors, Manila: National Book
Store, Inc.
Merle N. Tonog was born in Laoang, Northern Samar
on September 26, 1954. She is a graduate with PhD
degree in research and evaluation at the University of
San Carlos, Cebu City in October 2009 and a master
degree of science in chemistry at the University of the
Philippines, October 1991.
She has been teaching several chemistry subjects
and research at the University of Eastern Philippines
(UEP), Catarman, Northern Samar for more than 30 years. She is a licensed
chemical engineer and teacher. She has published a research titled,
“Antigenotoxicity of the Structural Derivatives of L-Cysteine to
Dimethylnitrosamine, Dimethylhydrazine and Chloroform in albino Mice”
Nov.1995 at Pacific Journal of Science and Technology, Vol 8 pp 1-14. She
has published a book titled, “A Work/Text in General Chemistry- with
teaching and learning styles applications” published by UEP, June 2008.
Her research interests are on mutagenicity, health, and environment.
She is a doctor of philosophy in education. She is a member of the
Philippine Institute of Chemical Engineers and Integrated Chemists of the
Philippines. She was awarded the best completed research for information
dissemination by UEP last June 7, 2012 and a plaque of teaching excellence
SY 2009-2010.
33
International Journal of Environmental Science and Development, Vol. 6, No. 1, January 2015