drinking profiles, social capital and health in later life (2013-2014) clare holdsworth (pi)nicola...
TRANSCRIPT
Drinking profiles, social capital and health in later life
(2013-2014)
Clare Holdsworth (PI) Nicola SheltonMarina Mendonça Hynek Pikhart
Martin Frisher Cesar Oliveira
Background
• Levels of alcohol consumption increased for middle and older age groups in the last 30 years for both men and women (Smith and Foxcroft, 2009).– Cohort effect (i.e. Generation)– Period effect (e.g. more financial resources)– Age (e.g. active ageing and greater life expectancy)
• Number of elderly population expected to increase 38% in the UK by 2031 (IAS, 2010): Alcohol consumption among the elderly - cause of public concern
Background
• U-shape relationship between alcohol consumption and health: Poorer health associated with abstainers (e.g. ‘sick-quitter’ hypothesis ) or excessive drinkers (e.g. Polen et al, 2010).
• Relation between drinking and health contradictory in older ages:– Alcohol consumption associated with more physical and mental health
problems and higher mortality rates (e.g. Crome, et al. 2011; Dar, 2006; NHS Information Centre, 2008)
– But, some studies found no association between levels of alcohol consumption and health (e.g. Lang, et al., 2007).
Background• Alcohol consumption and health moderated by social capital (Bloomfield
et al., 2006; Marmot 2005) – Alcohol Harm Paradox: Higher social position associated with higher
alcohol consumption and better health, whereas alcohol-related illness and mortality linked with deprivation.
• Research on drinking behaviours focused both on quantity and frequency of drinking. – But findings suggest that they are not equally associated with health
and social capital
• Unpacking complexity : Explore relationship between different drinking behaviours/profiles and its association with health and social capital
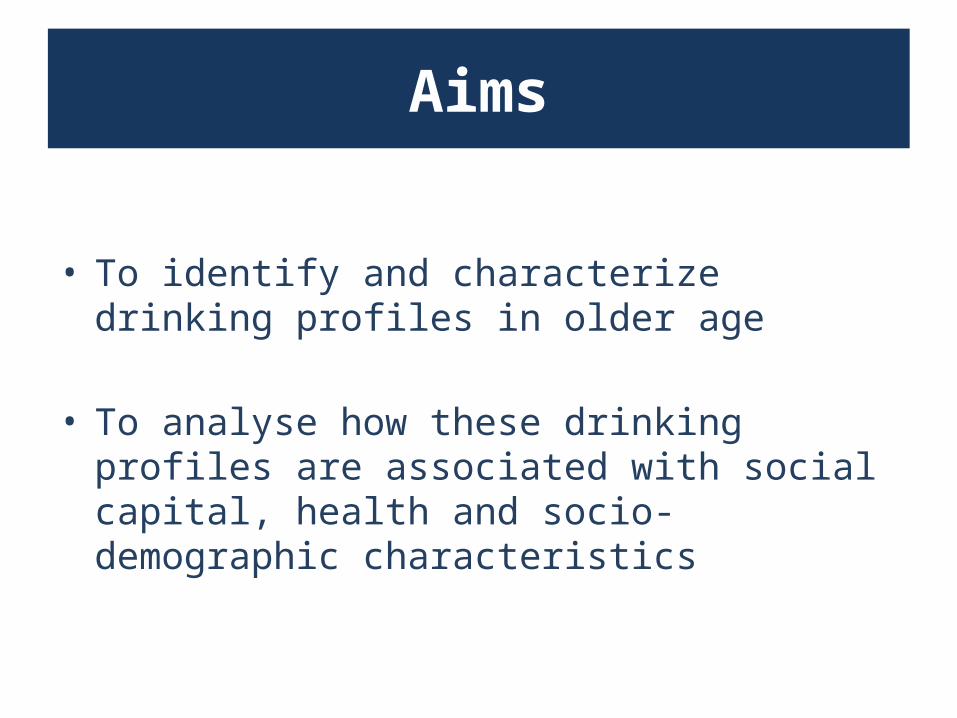
Aims
• To identify and characterize drinking profiles in older age
• To analyse how these drinking profiles are associated with social capital, health and socio-demographic characteristics

Data
ELSA W0 (HSE): Baseline for alcohol variables
• Present study: – W0: Drinking and health variables– W1: Social capital variables
1998 1999 2001
W62012/13
W42008/9
W52010/11
W32006/7
W22004/5
W12002/3
N = 11205
English Longitudinal Study of Ageing (ELSA): Panel study of people living in England aged 50 and older
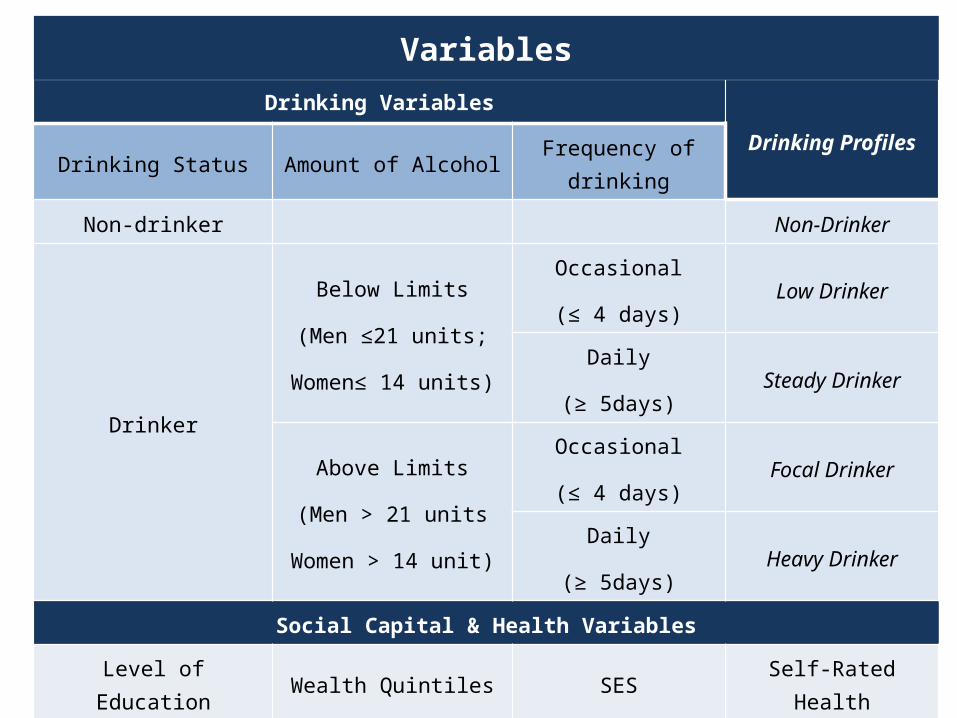
Drinking VariablesDrinking Profiles
Drinking Status Amount of Alcohol Frequency of drinking
Non-drinker Non-Drinker
Drinker
Below Limits
(Men ≤21 units;
Women≤ 14 units)
Occasional
(≤ 4 days)Low Drinker
Daily
(≥ 5days)Steady Drinker
Above Limits
(Men > 21 units
Women > 14 unit)
Occasional
(≤ 4 days)Focal Drinker
Daily
(≥ 5days)Heavy Drinker
Social Capital & Health Variables
Level of Education Wealth Quintiles SES Self-Rated Health
Socio-demographic
Age Marital Status
Variables
VariablesMen (%)
(n = 5057)
Women (%)
(n = 6148)
All (%)
(N = 11205)
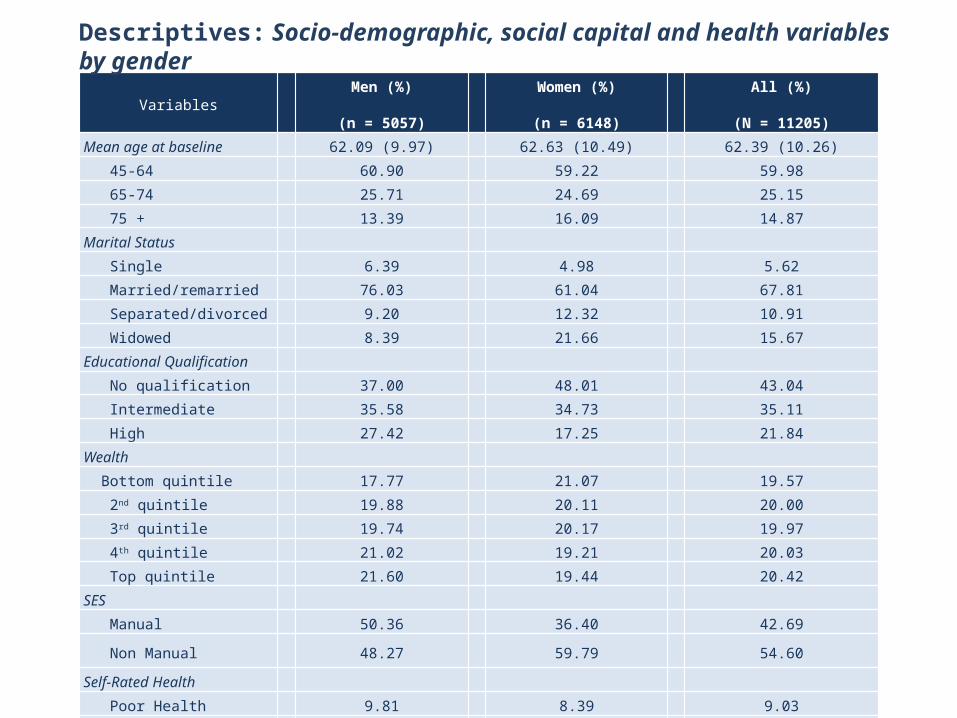
Mean age at baseline 62.09 (9.97) 62.63 (10.49) 62.39 (10.26) 45-64 60.90 59.22 59.98 65-74 25.71 24.69 25.15 75 + 13.39 16.09 14.87Marital Status Single 6.39 4.98 5.62 Married/remarried 76.03 61.04 67.81 Separated/divorced 9.20 12.32 10.91 Widowed 8.39 21.66 15.67Educational Qualification No qualification 37.00 48.01 43.04 Intermediate 35.58 34.73 35.11 High 27.42 17.25 21.84Wealth Bottom quintile 17.77 21.07 19.57 2nd quintile 19.88 20.11 20.00 3rd quintile 19.74 20.17 19.97 4th quintile 21.02 19.21 20.03 Top quintile 21.60 19.44 20.42SES Manual 50.36 36.40 42.69
Non Manual 48.27 59.79 54.60
Self-Rated Health Poor Health 9.81 8.39 9.03 Fair Health 23.75 25.07 24.48 Good Health 66.44 66.54 66.49
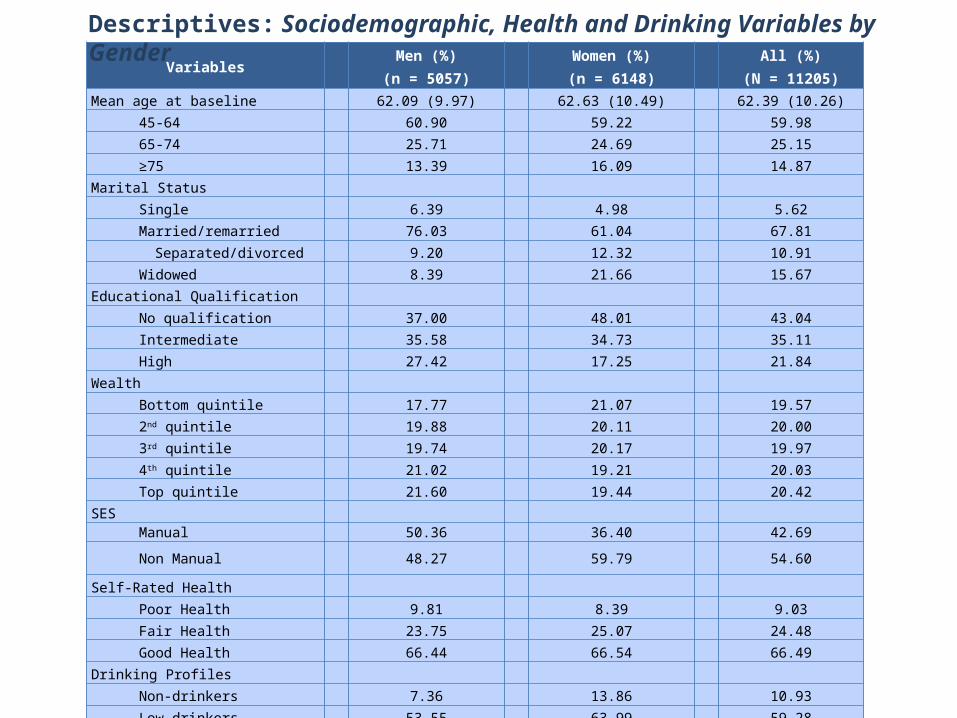
Descriptives: Socio-demographic, social capital and health variables by gender

Descriptives: Percentage distribution of drinking patterns by gender
Non-drinker Low Steady Focal Heavy
7.36
53.55
12.197.16
19.7513.86
64
8.182.67
11.29
Men Women
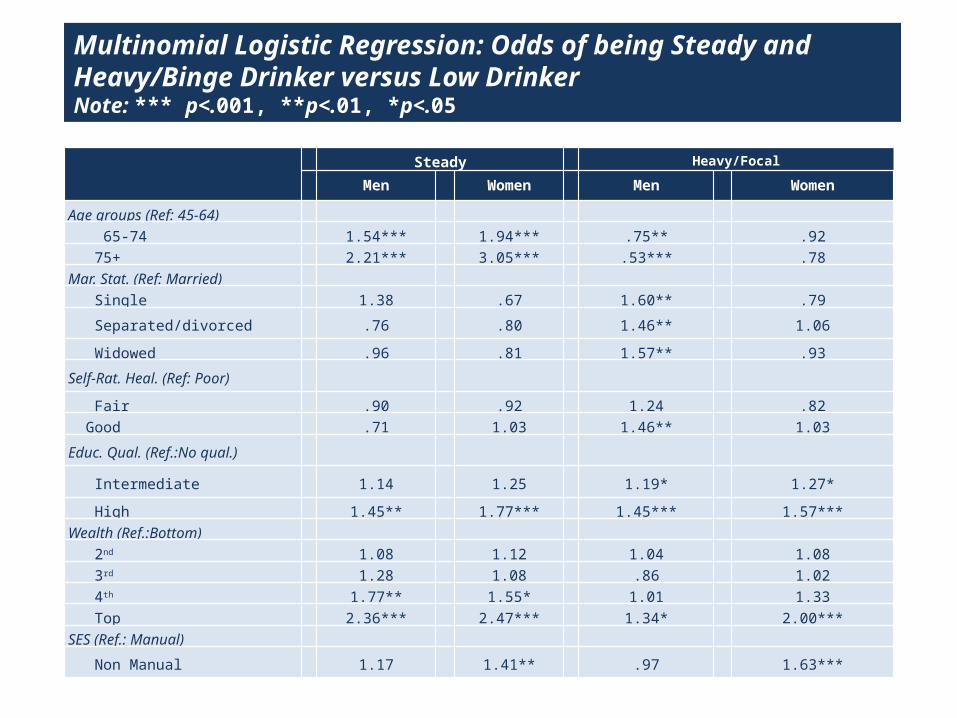
Multinomial Logistic Regression: Odds of being Steady and Heavy/Binge Drinker versus Low Drinker Note: *** p<.001, **p<.01, *p<.05
Steady Heavy/Focal
Men Women Men Women
Age groups (Ref: 45-64) 65-74 1.54*** 1.94*** .75** .92 75+ 2.21*** 3.05*** .53*** .78Mar. Stat. (Ref: Married) Single 1.38 .67 1.60** .79
Separated/divorced .76 .80 1.46** 1.06
Widowed .96 .81 1.57** .93
Self-Rat. Heal. (Ref: Poor)
Fair .90 .92 1.24 .82 Good .71 1.03 1.46** 1.03
Educ. Qual. (Ref.:No qual.)
Intermediate 1.14 1.25 1.19* 1.27*
High 1.45** 1.77*** 1.45*** 1.57***Wealth (Ref.:Bottom) 2nd 1.08 1.12 1.04 1.08 3rd 1.28 1.08 .86 1.02 4th 1.77** 1.55* 1.01 1.33 Top 2.36*** 2.47*** 1.34* 2.00***SES (Ref.: Manual)
Non Manual 1.17 1.41** .97 1.63***
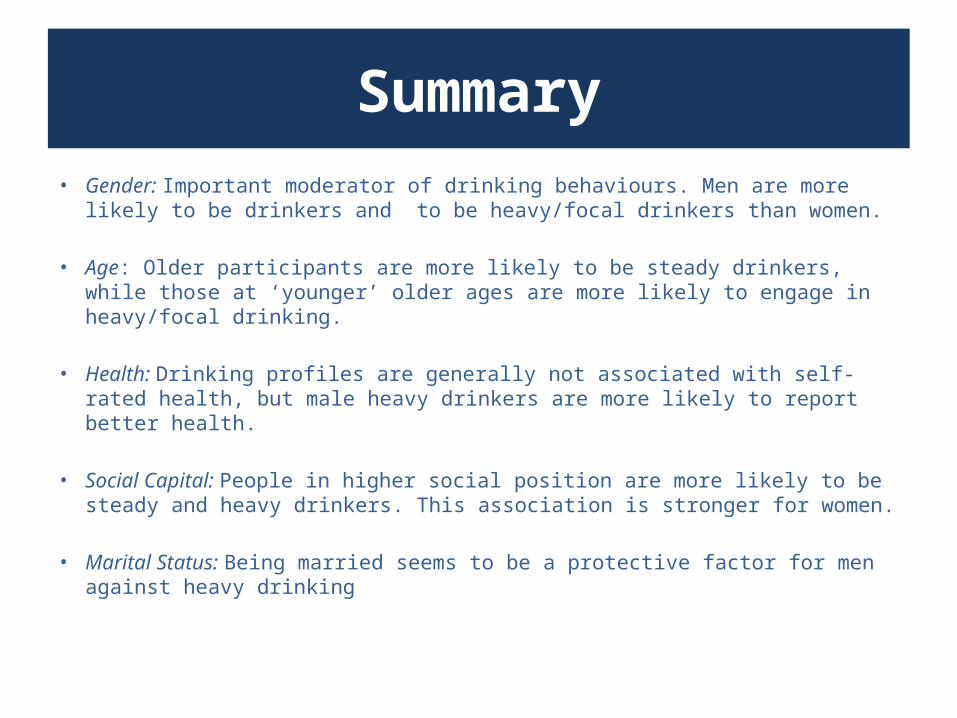
Summary• Gender: Important moderator of drinking behaviours. Men are more likely
to be drinkers and to be heavy/focal drinkers than women. • Age: Older participants are more likely to be steady drinkers, while those at
‘younger’ older ages are more likely to engage in heavy/focal drinking. • Health: Drinking profiles are generally not associated with self-rated health,
but male heavy drinkers are more likely to report better health.
• Social Capital: People in higher social position are more likely to be steady and heavy drinkers. This association is stronger for women.
• Marital Status: Being married seems to be a protective factor for men against heavy drinking

Variables Men (%)(n = 5057)
Women (%)(n = 6148)
All (%)(N = 11205)
Mean age at baseline 62.09 (9.97) 62.63 (10.49) 62.39 (10.26)45-64 60.90 59.22 59.9865-74 25.71 24.69 25.15≥75 13.39 16.09 14.87
Marital StatusSingle 6.39 4.98 5.62Married/remarried 76.03 61.04 67.81
Separated/divorced 9.20 12.32 10.91Widowed 8.39 21.66 15.67
Educational QualificationNo qualification 37.00 48.01 43.04Intermediate 35.58 34.73 35.11High 27.42 17.25 21.84
WealthBottom quintile 17.77 21.07 19.572nd quintile 19.88 20.11 20.003rd quintile 19.74 20.17 19.974th quintile 21.02 19.21 20.03Top quintile 21.60 19.44 20.42
SESManual 50.36 36.40 42.69
Non Manual 48.27 59.79 54.60
Self-Rated HealthPoor Health 9.81 8.39 9.03Fair Health 23.75 25.07 24.48Good Health 66.44 66.54 66.49
Drinking ProfilesNon-drinkers 7.36 13.86 10.93Low drinkers 53.55 63.99 59.28Steady drinkers 12.19 8.18 9.99
Focal drinkers 7.16 2.67 4.70Heavy drinkers 19.75 11.29 15.10
Descriptives: Sociodemographic, Health and Drinking Variables by Gender