drained and undrained behavior of fiber-reinforced … · drained and undrained behavior of...
TRANSCRIPT
Drained and Undrained Behavior of Fiber-Reinforced Sand
by Cheng-Wei Chen
Cheng-Wei Chen
University of Missouri – Columbia
Graduate Research Assistant
Department of Civil and Environmental Engineering
E2509 Lafferre Hall
Columbia, MO 65211
Telephone: (573) 882-3862
Fax: (573) 884-4784
E-mail: [email protected]
Submitted October 12, 2006
Word Count: 2290 words plus 2750 word equivalents for tables and figures (5040 total words)
Cneng-Wei Chen
2
Drained and Undrained Behavior of Fiber-Reinforced Sand
by Cheng-Wei Chen
ABSTRACT
A series of CU and CD type triaxial compression tests were performed on comparable
unreinforced and fiber-reinforced specimens of Ottawa Sands to evaluate the effective stress-
strain-pore pressure-volume change behavior of fiber-reinforced soils. The results show that
fibers increase the cohesion (c’) and effective friction angle ( ’) for Ottawa Sands. The c’ and ’
determined for the reinforced specimens increases with strains. Reinforced loose specimens tend
to have a higher friction angle, but lower cohesion intercept than the reinforced medium-dense
specimens. In addition, the inclusion of fibers with loose specimens has a significant effect in
increasing effective friction angle than with medium-dense specimens. In CU tests, the loose
reinforced specimens exhibited lower pore pressures than unreinforced specimens. In CD tests,
the loose and medium-dense reinforced specimens showed more dilation than unreinforced
specimens at moderate and larger strains. These are in agreement with the response observed in
undrained tests. For Ottawa sands, the fiber resistance is mobilized at small strains in both
undrained and drained conditions. However, the mobilized shear resistances in drained tests
occur sooner than in undrained tests.
Cneng-Wei Chen
3
INTRODUCTION
The behavior of fiber-reinforced soils has been studied by several investigators over the
last two decades. Fiber-reinforced soil is becoming a viable soil improvement method for
geotechnical engineering problems. Fiber-reinforced soils are currently being used or considered
include stabilization of shallow slope failures (1), construction of new embankments with
marginal soils, reduction of shrinkage cracking in compacted clay liners (2), and mechanical
stabilization of roadway subgrades (3).
PREVIOUS WORK
Fiber-reinforced soil is a mixture of soil and synthetic fibers. Synthetic fibers can be
made of different materials, shapes and lengths. Polypropylene and polyester are the most
common materials used to manufacture fibers. Fibers can be flat or round, and continuous or
discrete. Discrete fibers are manufactured in several lengths, ranging from 0.5 in to 3 in, and in
different types such as monofilament, fibrillated, tape, and mesh.
Significant fundamental research has been performed over the last few decades to
evaluate basic shear strength properties and deformation characteristics of fiber-reinforced soils.
Previous work has clearly shown that an increase in fiber content increased the shear strength of
the soils. Most investigators found that shear strength increased in direct proportion to fiber
content or area ratio (3, 5, 6, 7, 8). However, (9) observed that increase in strength was not
proportional to the reinforcement concentration.
Some of the previous research has shown that inclusion of fibers increased both the
cohesion intercept and angle of internal friction values as compare to values for unreinforced soil
(10, 11, 1). However, (4, 5, 7, 8) found that inclusion of fibers did not significantly affect the
angle of internal friction of the unreinforced soils, but rather that fiber-reinforced specimens
exhibited bi-linear failure envelopes as a result of the existence of a critical confining stress
below which the fibers tended to slip or pull-out. (12) observed an increase in the angle of
internal friction but a decrease in the cohesion intercept. (6) found that an increase in fiber
content only increased the cohesion intercept whereas the angle of internal friction remained
unchanged from that of the unreinforced soil.
Inclusion of fibers was generally found to increase the peak and post-peak strength, as
well as the strain at failure. Furthermore, inclusion of fibers has been found to not noticeably
affect the initial stiffness of the unreinforced specimens. However, some investigators have
reported an increase in the initial stiffness of specimens with increasing fiber content (11),
whereas others have shown a decrease in initial stiffness with increasing fiber content (12,13). It
is shown by many researchers that inclusion of fibers increases the shear strength under different
loading conditions.
Most of pervious work in this area has concentrated on the behavior of fiber-reinforced
granular (i.e. sand) and undrained behavior of clays under total stress conditions. The laboratory
work was mainly utilizing the simply direct shear tests. The data from most investigators lacks
evaluation of the load transfer mechanics in terms of effective stress. Additional tests of fiber-
reinforced sand are needed to confirm the reinforcement response with different loading
conditions in terms of effective stress measurements.
TESTING MATERIALS AND PROGRAM
The soil used in triaxial testing program was Ottawa sand (Grade F-75), which is well
known laboratory-tested sand. The particles have a mean diameter, D50 of 0.18 mm, a
uniformity coefficient, Uc of 1.7, a minimum void ratio, emin of 0.46, a maximum void ratio, emax
Cneng-Wei Chen
4
of 0.77, and a specific gravity of 2.65, respectively. The soil classifies as poorly graded sands
(SP) according to the Unified Soil Classification System.
The fibers utilized in the specimens are commercially available 2-inch (50-mm) long
fibrillated polypropylene fibers of 3600 denier. The specific gravity of the fibers is 0.91 gr/cm3
(14). The ultimate tensile strength (15) and modulus of elasticity (16) of the fiber are 45 ksi, and
700 ksi, respectively.
An undercompaction process (17) was selected to produce homogeneous samples using
Ottawa sand for a parametric study in a laboratory-testing program. Unreinforced and fiber-
reinforced Ottawa sand specimens were prepared and mixed to the nominal 10 percent water
content as loose state and 3 percent water content as medium-dense state, which nominal
relatively density were equal to 10 percent (e0 = 0.74) and 55 percent (e0 = 0.60), respectively.
The soil was also allowed to hydrate overnight prior to compaction. Decided how many lifts of
compacting and calculated the desired thickness of each layers according to the undercompaction
process suggested.
All specimens were backpressure saturated at effective consolidation stresses of 2.5 psi
using the dry mounting method as specified in ASTM D4767 (18). Skempton’s pore pressure
coefficient B (18) was measured during saturation. All specimens were allowed to saturate until
measured B-values were reached at least 0.96 before consolidation and shear. Approximately 5
days were required to bring the B-value of the Ottawa sand specimens to 0.96.
The strain rate used to shear all conventional triaxial compression and extension
specimens was 10 percent per hour (deformation rate of 0.49-inch per hour) to eliminate concern
over strain rate when compared to drained and undrained test results. Most specimens were
sheared up to a maximum axial strain of 30 percent to permit evaluation of the post-peak stress-
strain behavior.
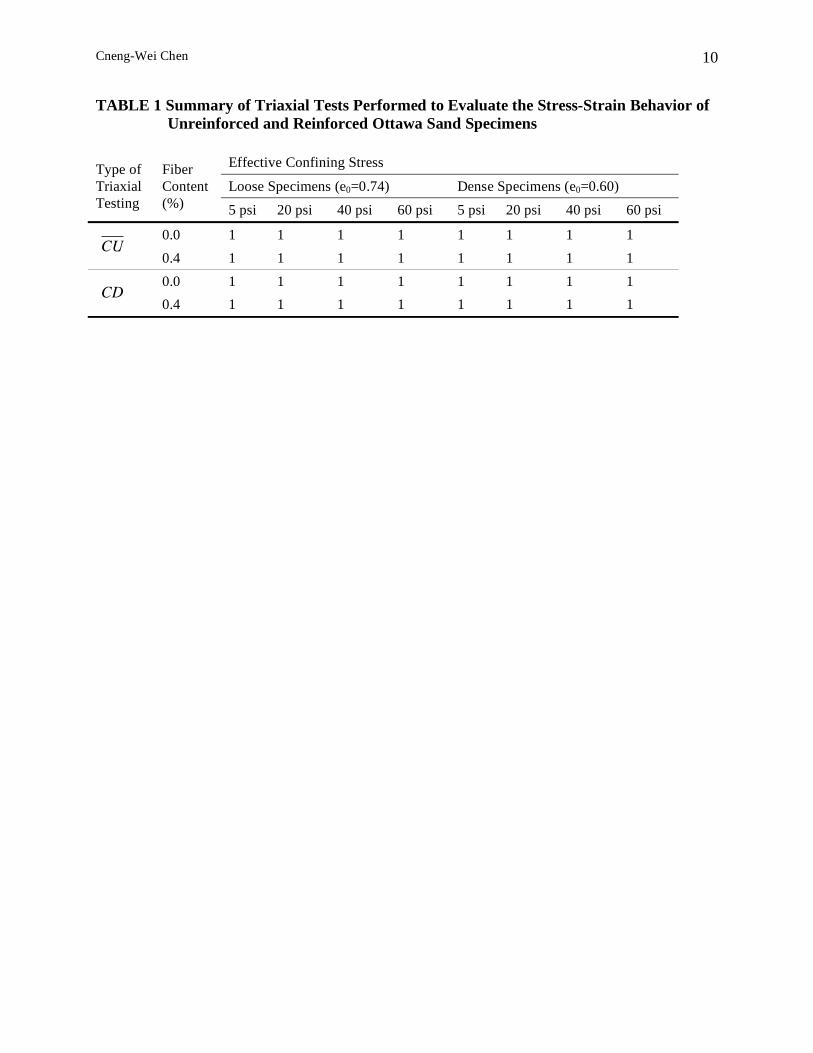
A summary of testing program undertaken to evaluate the stress-strain behavior of
unreinforced and fiber-reinforced specimens in term of effective stresses is shown in Table 1. A
total of sixteen consolidated-undrained triaxial compression tests with pore pressure
measurements (CU tests) were performed to evaluate the stress-strain-pore pressure generation
behavior of fiber-reinforced specimens under undrained loading conditions. A total of sixteen
consolidated-drained triaxial compression tests (CD tests) were also performed for specimens
compacted at loose and medium-dense state to evaluate the stress-strain-volume change behavior
of fiber-reinforced specimens under drained loading conditions. All tests were performed on
2.5-inch diameter by nominal 4.9-inch tall specimens. Specimens isotropically consolidated to
the target effective stress of 5, 20, 40, and 60-psi.
STRESS-STRAIN-PORE PRESSURE-VOLUME CHANGE RESPONSE
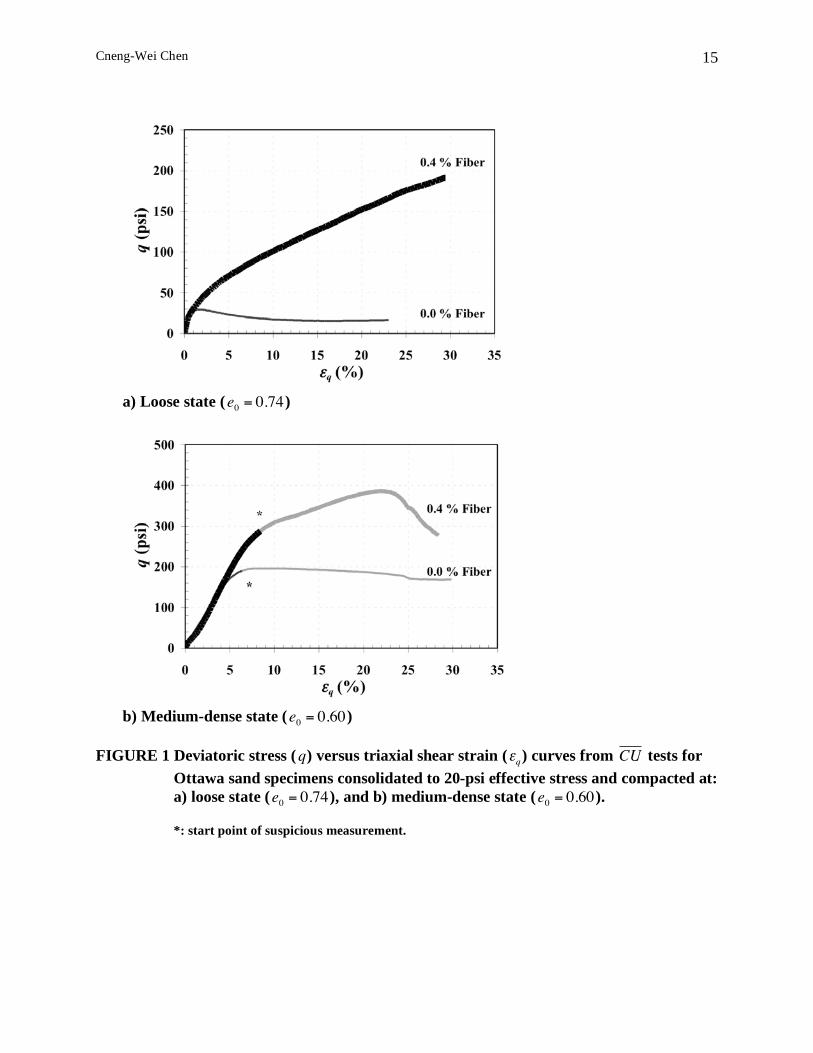
Typical deviatoric stress versus triaxial shear strain behavior from CU and CD tests for
unreinforced and reinforced specimens is shown in Figure 1 and 2. Loose fiber-reinforced
specimens show a strain-hardening type of behavior whereas medium-dense reinforced
specimens exhibit a noticeable peak stress at large strains of 20 percent. Figure 1 shows that
stress-strain behavior of medium-dense reinforced specimen begins to deviate at 5 percent stain
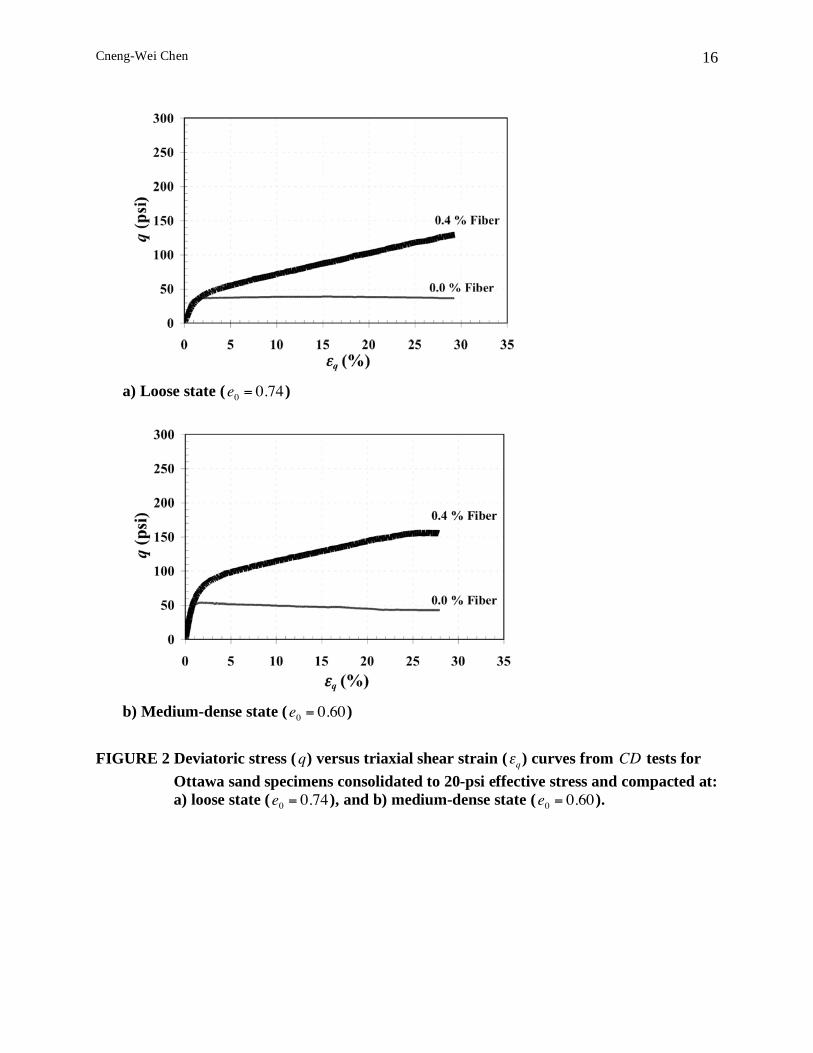
under undrained condition. However, Figure 2 shows that the considerable strength is gained by
the inclusion of fibers at 1 percent strain of medium-dense reinforced specimen under drained
condition.
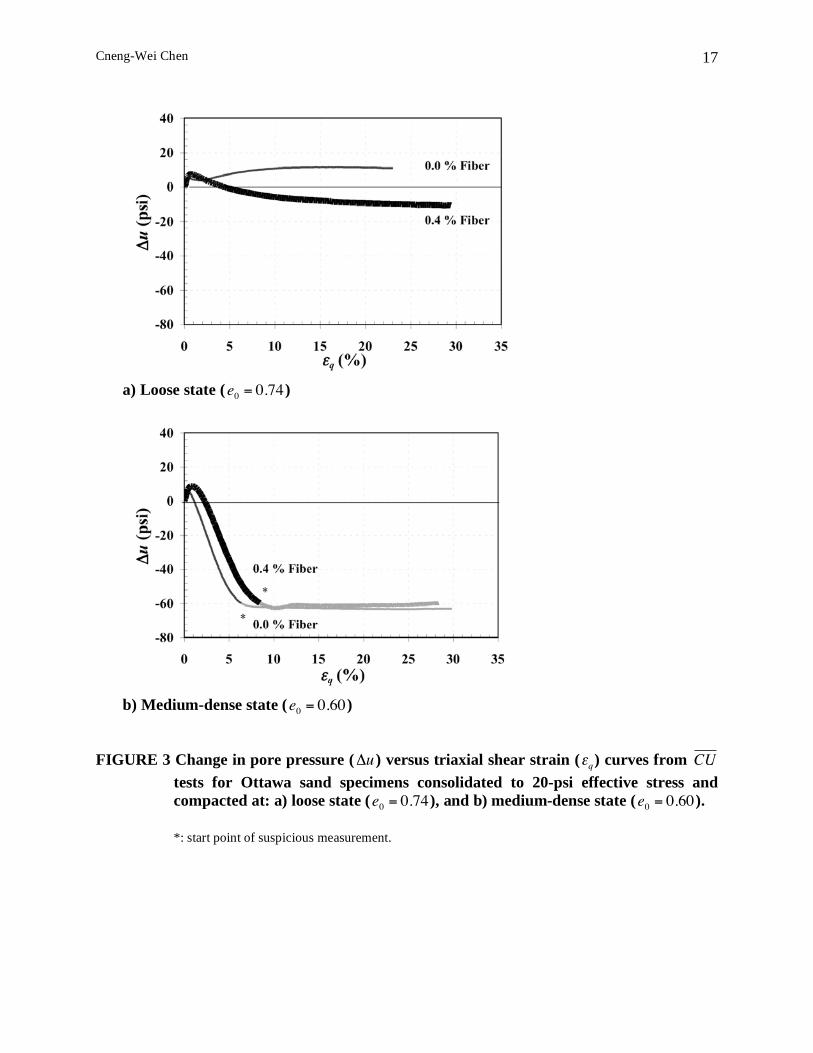
Change in pore pressure versus triaxial shear strain observed in tests for both
unreinforced and reinforced Ottawa sand specimens are shown in Figure 3. Loose unreinforced
specimen exhibits the lower initial increase in pore pressure than reinforced specimen at 1
Cneng-Wei Chen
5
percent strain, slightly decrease in a range of 1 percent to 2 percent and increase again slowly
with addition strains. In contrast, the loose fiber-reinforced specimens show the initial increases
in pore pressure at very small strain, decrease with additional strains, and tend to level at large
strains. Both medium-dense unreinforced and reinforced specimens show the initial increases in
pore pressure followed by significant decreases and absolute value of pore pressures equal or less
than zero before 10 percent strains. It is noticed that medium-dense reinforced specimens tend to
have higher initial increases in pore pressure than unreinforced specimens and keep relative
higher pore pressures when compared to the unreinforced specimens at given strains before
absolute pore pressures equal or less than zero. When the readings of pore pressure transducer
measured less than the atmosphere pressure, cavitation is taken place. Pore pressure transducers
cannot measure negative pressure accurately. Therefore, the measure values can not represent
the real readings in the soil when the absolute value of pore pressures is equal or less than zero.
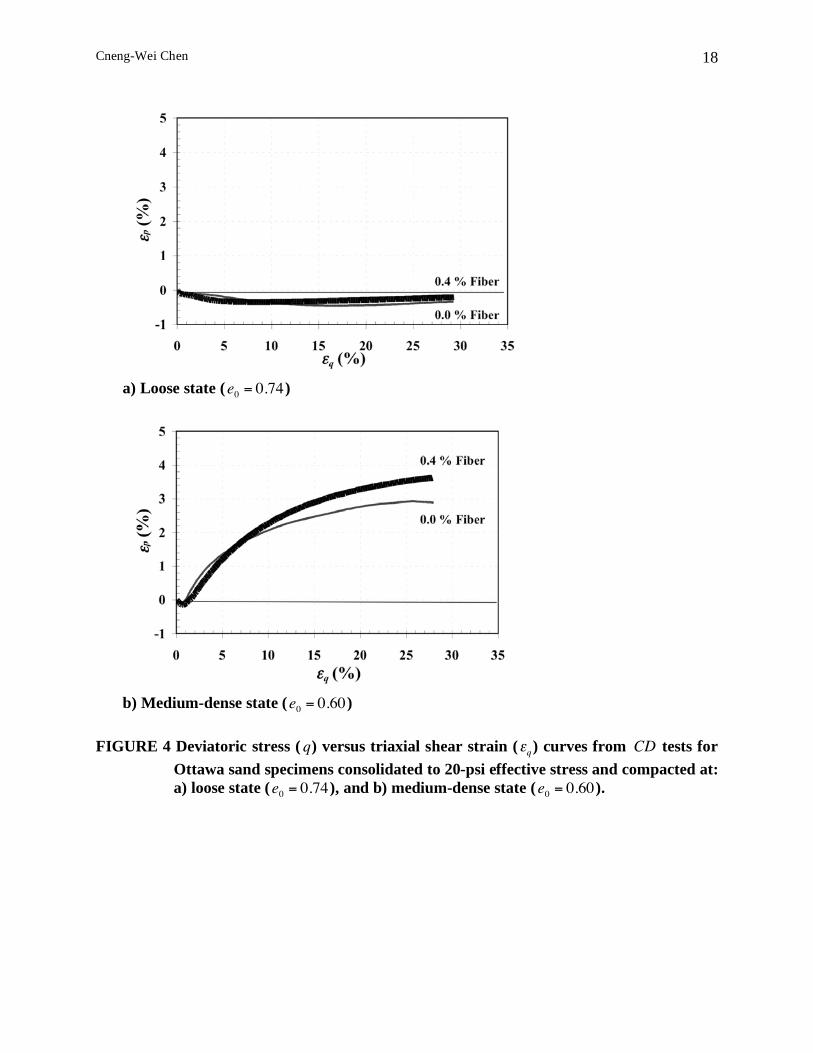
The typical volumetric strain versus triaxial shear strain response from CD tests for the
unreinforced and reinforced Ottawa sand specimens are shown in Figure 4 for the samples
compacted to loose and medium-dense state. The unreinforced specimens exhibit volumetric
strain response typical of loose and medium-dense behavior, with volume compressing at small
strains and then keeping constant at large strains for loose specimen whereas with initial volume
decreasing followed by significant dilation up to large strains. The loose fiber-reinforced
specimens show that less volume compressing than the unreinforced specimen consolidated to
20-psi or higher effective confining stresses. Conversely, medium-dense specimens exhibit less
dilation at low shear strains at the range of 2 percent to 5 percent, but more dilation at moderate
and large strains than observed on unreinforced specimens. Therefore, it indicates that the
medium-dense sand exhibit the lower pore pressure to maintain the zero volume change in
undrained loading condition at moderate to large strains, which is similar to loose sand behavior.
The volumetric strain versus triaxial shear strain behavior inspect on the fiber-reinforced
specimens under drained tests is in agreement with the pore pressure versus triaxial shear strain
response tested at undrained condition.
The causes for the unusual pore pressure responses observed in the fiber-reinforced
specimens are not clear. (20) assumed that the fibers create an “internal confining stress” (due to
tension developed in the fibers) that, when added to the applied total stresses and actual pore
pressures generated in the fiber-reinforced soil, the fibers produces additional effective stress to
prevent volume change in undrained tests. However, the results presented above show that fiber-
reinforced Ottawa sand require lower pore pressure to maintain the zero volume change in
undrained loading conditions for both loose and medium-dense state, which are different
observation with (20) for fiber-reinforced silty clay specimens. The inclusion of fibers generates
a “negative internal confining stress” and produces negative effective stress to maintain zero
volume change in undrained tests.
FAILURE ENVELOPES FOR TRIAXIAL COMPRESSION TEST
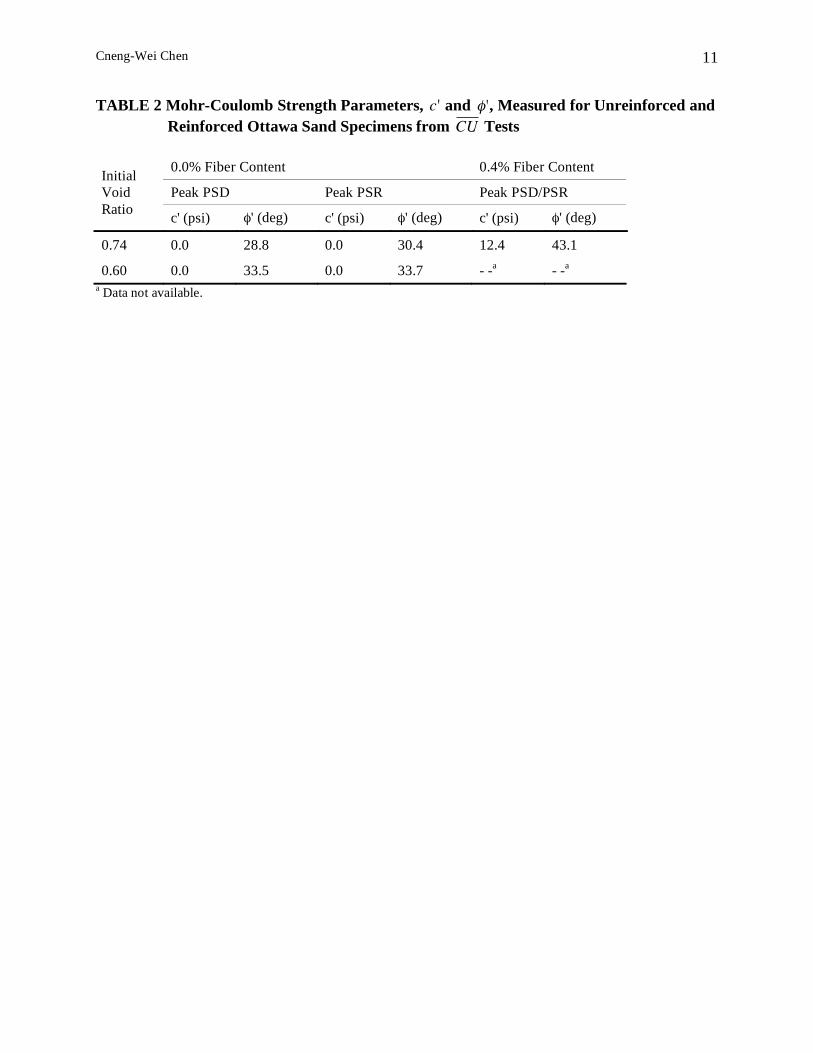
Failure envelopes were determined from the peak deviator stress (PDS) and peak
effective stress ratio (PSR) failure criteria for CU tests. Values of the Mohr-Coulomb strength
parameters, effective cohesion intercept, c', and effective internal friction angle, ', for the
unreinforced Ottawa sand specimens from CU tests and CD tests are listed in Tables 2 and 3,
respectively. The results indicate that the strength of unreinforced specimens under undrained
loading can be represented by no cohesion intercept, and an effective friction angle of 29° and
34°, for loose state and medium-dense specimens, respectively. The shear strength parameters
determined from PRS failure criteria show a slightly greater than the results from the PDS failure
Cneng-Wei Chen
6
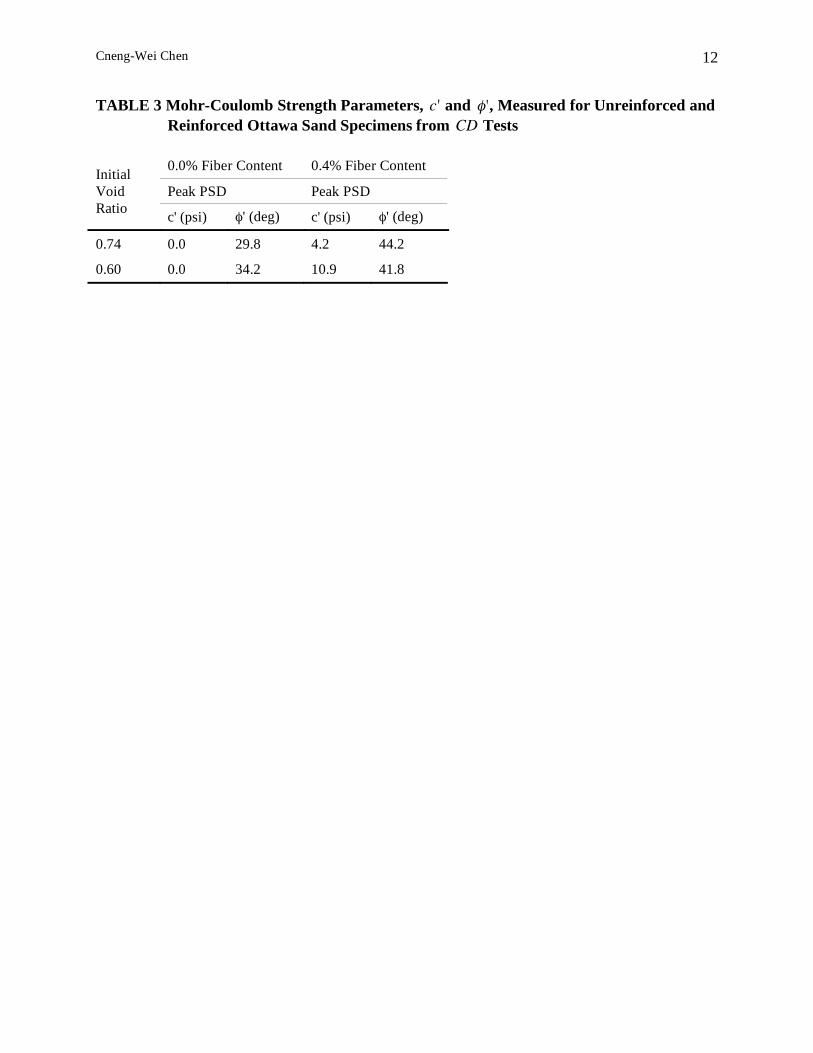
criteria. Furthermore, the shear strength parameters determined from CD tests show a greater
value than the results from the CU tests, which are presented in Table 3.
Table 2 and 3 also present the strength parameters for the fiber-reinforced Ottawa sand
specimens from CU tests and CD tests. It can be seen that inclusion of fibers has a pronounce
effect both on the effective cohesion intercept and on the measured effective friction angle.
Reinforced specimens compacted at loose state tend to have a higher friction angle, but lower
cohesion intercept than specimens compacted at medium-dense state. In addition, the inclusion
of fibers with loose specimens has a significant effect in increasing effective friction angle than
with medium-dense specimens, which is shown in Table 3.
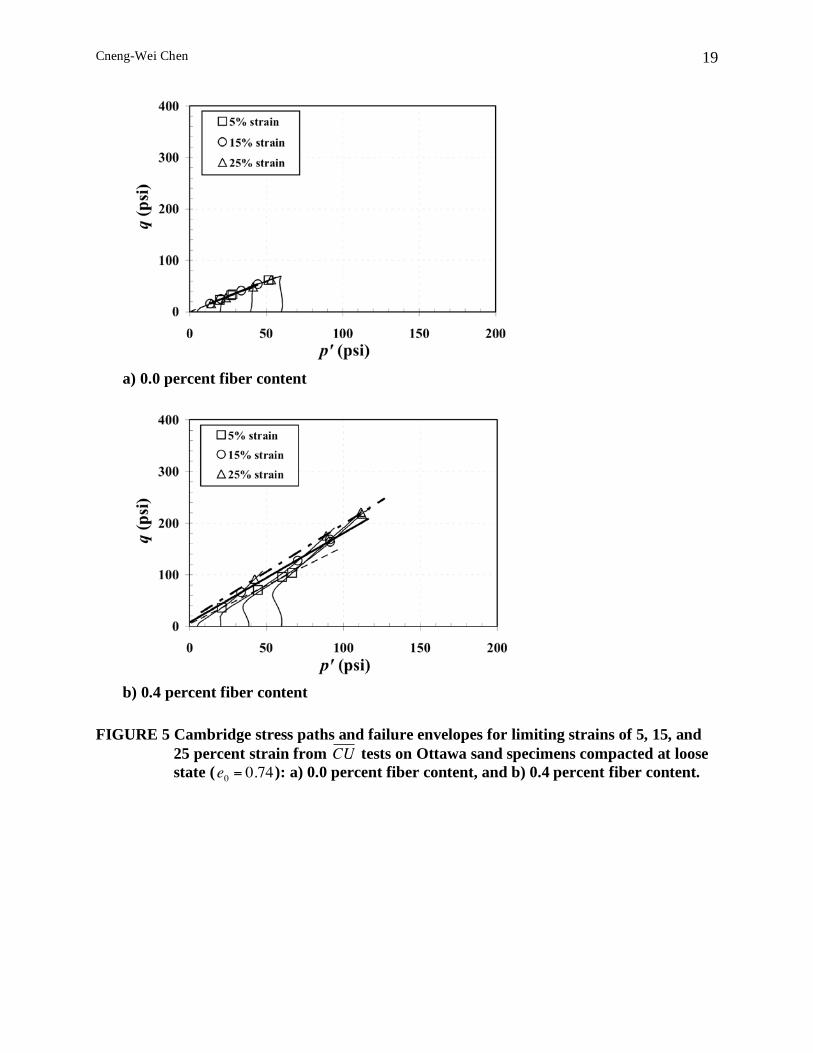
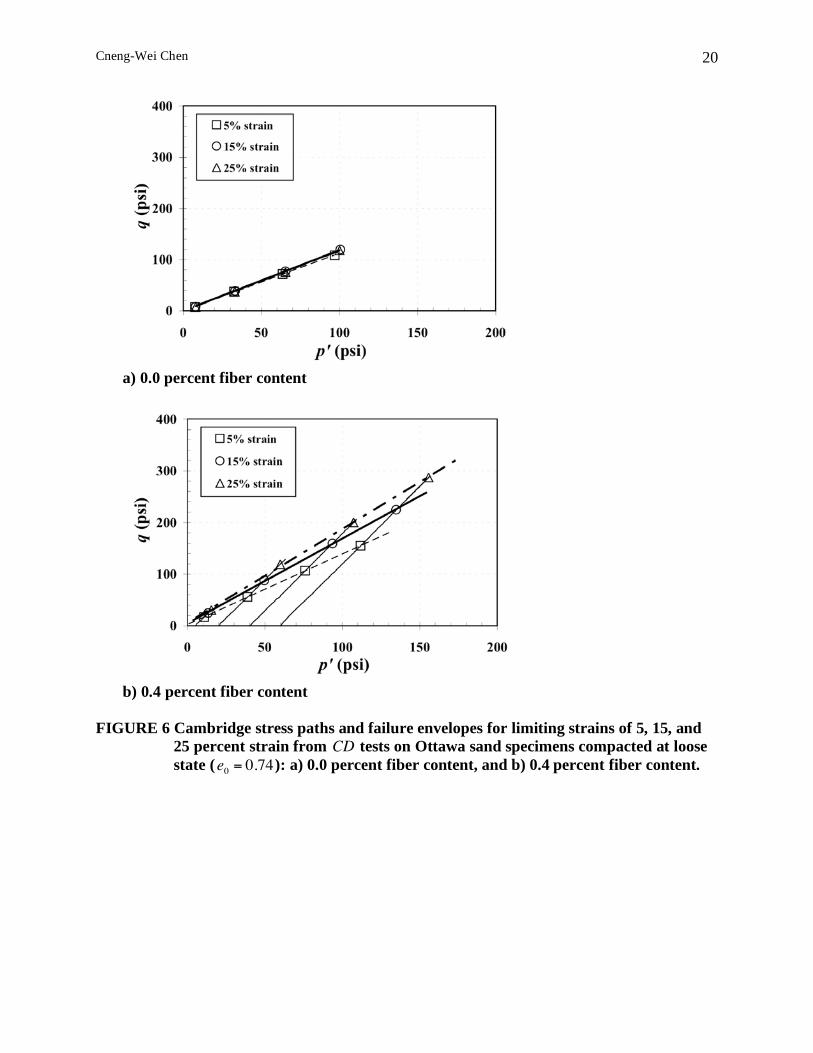
Peak deviator stress and peak effective stress ratio for the fiber-reinforced specimens
under undrained and drained loading occurred at very large strain. Since such large strain are
seldom tolerable, the data were also analyzed for limiting strains of 5, 15, and 25 percent strain.
For these analyses, the PDS and PSR failure criteria were taken to be the maximum values
measured at strains close or equal to the limiting strains. Figure 5 and 6 show the Cambridge
stress path diagrams and failure envelopes for the chosen limiting strains from CU tests and CD
tests on unreinforced and reinforced loose specimens. The failure envelopes of unreinforced
specimens do not show a significant difference at established limiting strains for both loose and
medium-dense state. In contrast, the shear strength parameters calculated from reinforced
specimens increase with chosen limiting strains in terms of effective cohesion intercept and
effective friction angle.
The results of Mohr-Coulomb strength parameters for the unreinforced and reinforced
specimens at the limiting strains from CU and CD tests are summarized in Table 4 and 5,
respectively. In general, the strength parameters measured from CU tests are greater than those
from CD tests for loose reinforced specimens, whereas the effective friction measured from CU tests are less than those from CD tests. Furthermore, reinforced specimens compacted at loose
state show a significant increase in the effective friction angle from CU and CD tests. The
opposite was observed for specimens compacted at medium-dense state, a significant increase in
the effective cohesion intercept.
CONCLUSIONS
The results of the triaxial compression tests performed on loose and medium-dense
Ottawa sand show that inclusion of fibers can improve the strength of soils under undrained and
drained loading conditions. Shear strength parameters of effective cohesion intercept and
effective friction angle increase significantly in the CU and CD tests, due to the addition of
fibers. The angle of internal friction under drained loading was slightly greater than for those
under undrained loading for both unreinforced and reinforced specimens. It is noted the
reinforcing fibers alter the pore pressure response of specimens tested under undrained loading
conditions and the volume change response of specimens tested under drained loading condition.
However, the response in Ottawa sand is totally different from the response in silty clay (20).
It was shown that fiber reinforced specimens must deform before developing and increase
in shear strength due to the inclusion of fibers. Under undrained conditions, deformations can be
high for most structures. However, drained specimens mobilized the shear fiber resistance at
very low strain, which can be tolerable for must structures. As a result, more strains are needed
to mobilize the fiber shear strain for specimens consolidated at high effective stresses.
Cneng-Wei Chen
7
REFERENCES
1. Gregory, G.H., and D.S. Chil. Stabilization of Earth Slopes with Fiber Reinforcement.
Proceedings of the Sixth International Conference on Geosynthetics, March 25-29, Atlanta,
Georgia, 1998, pp. 1073-1078.
2. Rifai, S.M. Impact of Polypropylene Fibers on Dessication Cracking and Hydraulic
Conductivity of Compacted Clay Liners. Dissertation submitted in partial fulfillment for the
requirements of the Doctoral Degree, Wayne State University, Detroit, Michigan, 2000.
3. Santoni, R.L., J.S. Tingle, and S.L. Webster. Engineering Properties of Sand-Fiber Mixtures
for Road Construction, Journal of Geotechnical and Environmental Engineering, ASCE,
Vol. 127, No. 3, 2001, pp. 258-268.
4. Gray, D.H., and H. Ohashi. Mechanics of Fiber Reinforcement in Sand. Journal of the
Geotechnical Engineering Division, ASCE, Vol. 109, No. 3, 1983, pp. 335-353.
5. Ranjan G., R.M. Vasan, and H.D. Charan. Probability Analysis of Randomly Distributed
Fiber-reinforced Soil. Journal of the Geotechnical Engineering Division, ASCE, Vol. 122,
No. 6, 1996, pp. 419-426.
6. Bauer, G., and A. Oancea. Soils Reinforced with Discrete Synthetic Fibers. Geosynthetics’99
– Specifying Geosynthetics and Developing Design Detail, IFAI, Boston, Massachusetts,
1999, pp. 465-475.
7. Maher, M.H., and D.H. Gray. Static Response of Sands Reinforced with Randomly
Distributed Fibers. Journal of the Geotechnical Engineering Division, ASCE, Vol. 116, No.
11, 1990, pp. 1661-1677.
8. Gray, D.H., and T. Al-Refeai. Behavior of Fabric- versus Fiber-reinforced Sand. Journal of
the Geotechnical Engineering Division, ASCE, Vol. 112, No. 8, 1986, pp. 804-820.
9. Shewbridge, S.E., and N. Sitar. Deformation Characteristics of Reinforced Soil in Direct
Shear. Journal of the Geotechnical Engineering Division, ASCE, Vol. 115, No. 8, 1989, pp.
1134-1147.
10. Kumar, R., V.K. Kanaujia, and D. Chandra. Engineering Behaviour of Fibre-Reinforced
Pond Ash and Silty Sand,” Geosynthetics International, Vol. 6, No. 6, 1999, pp. 509-518.
11. Nataraj, M.S., and K.L. McManis. Strength and Deformation Properties of Soils Reinforced
with Fibrillated Fibers," Geosynthetics International, Vol. 4, No. 1, 1997, pp. 65-79.
12. Consoli, N.C., P.D.M. Prietto, and L.A. Ulbrich. Influence of Fiber and Cement Addition on
Behavior of Sandy Soil. Journal of the Geotechnical Engineering Division, ASCE, Vol. 124,
No.12, 1998, pp. 1211-1214.
13. Michalowski R.L., and J. Cermak. Triaxial Compression of Sand Reinforced With fibers,
Journal of the Geotechnical Engineering Division, ASCE, Vol. 192, No. 2, 2003, pp. 125-
136.
14. ASTM. D792. “Standard test methods for density and specific gravity (relative density) of
plastics by displacement.” Annual Book of ASTM Standards, Vol. 08.01, Philadelphia.
15. ASTM. D2256. “Standard test method for tensile properties of yarns by the single-strand
method.” Annual Book of ASTM Standards, Vol. 07.01, Philadelphia.
16. ASTM. D2101. “Standard test methods for tensile properties of single man-made textile
fibers taken from yarns and tows.” Annual Book of ASTM Standards, Vol. 07.01,
Philadelphia.
17. Ladd, R. S. Preparing Test Specimens Using Undercompaction Geotechnical Testing
Journal, Vol. 1, No. 1,1978, pp. 16-23.
Cneng-Wei Chen
8
18. ASTM D4767, “Standard test method for consolidated-undrained triaxial compression test on
cohesive soils,” Annual Book of ASTM Standards, Vol. 04.08, Philadelphia.
19. Skempton, A.W. The Pore Pressure Coefficient A and B,” Geotechnique, Vol. 4, 1954, pp.
143-147.
20. Romero, R.J. Development of a Constitutive Model for Fiber-Reinforced Soils. Dissertation
submitted in partial fulfillment for the requirements of the Doctoral Degree, University of
Missouri-Columbia, 2003.
Cneng-Wei Chen
9
List of Tables
TABLE 1 Summary of Triaxial Tests Performed to Evaluate the Stress-Strain Behavior of
Unreinforced and Reinforced Ottawa Sand Specimens
TABLE 2 Mohr-Coulomb Strength Parameters, c' and ', Measured for Unreinforced and
Reinforced Ottawa Sand Specimens from CU Tests
TABLE 3 Mohr-Coulomb Strength Parameters, c' and ', Measured for Unreinforced and
Reinforced Ottawa Sand Specimens from CD Tests
TABLE 4 Mohr-Coulomb Strength Parameters, c' and ', from CU Tests on Unreinforced
and Reinforced Ottawa Sand Specimens When Strength Is Taken as Peak Stress
Experienced at Limiting Strains of 5, 15, 25 Percent
TABLE 5 Mohr-Coulomb Strength Parameters, c' and ', from CD Tests on Unreinforced
and Reinforced Ottawa Sand Specimens When Strength Is Taken as Peak Stress
Experienced at Limiting Strains of 5, 15, 25 Percent
List of Figures
FIGURE 1 Deviatoric stress (q) versus triaxial shear strain ( q) curves from CU tests for
Ottawa sand specimens consolidated to 20-psi effective stress and compacted at: a) loose
state (e0 = 0.74), and b) medium-dense state (e0 = 0.60).
FIGURE 2 Deviatoric stress ( q) versus triaxial shear strain ( q) curves from CD tests for
Ottawa sand specimens consolidated to 20-psi effective stress and compacted at: a) loose
state (e0 = 0.74), and b) medium-dense state (e0 = 0.60).
FIGURE 3 Change in pore pressure ( u ) versus triaxial shear strain ( q) curves from CU
tests for Ottawa sand specimens consolidated to 20-psi effective stress and compacted at: a)
loose state (e0 = 0.74), and b) medium-dense state (e0 = 0.60).
FIGURE 4 Deviatoric stress ( q) versus triaxial shear strain ( q) curves from CD tests for
Ottawa sand specimens consolidated to 20-psi effective stress and compacted at: a) loose
state (e0 = 0.74), and b) medium-dense state (e0 = 0.60).
FIGURE 5 Cambridge stress paths and failure envelopes for limiting strains of 5, 15, and
25 percent strain from CU tests on Ottawa sand specimens compacted at loose state
(e0 = 0.74): a) 0.0 percent fiber content, and b) 0.4 percent fiber content.
FIGURE 6 Cambridge stress paths and failure envelopes for limiting strains of 5, 15, and
25 percent strain from CD tests on Ottawa sand specimens compacted at loose state
(e0 = 0.74): a) 0.0 percent fiber content, and b) 0.4 percent fiber content.
Cneng-Wei Chen
10
TABLE 1 Summary of Triaxial Tests Performed to Evaluate the Stress-Strain Behavior of
Unreinforced and Reinforced Ottawa Sand Specimens
Effective Confining Stress
Loose Specimens (e0=0.74) Dense Specimens (e0=0.60)
Type of
Triaxial
Testing
Fiber
Content
(%) 5 psi 20 psi 40 psi 60 psi 5 psi 20 psi 40 psi 60 psi
0.0 1 1 1 1 1 1 1 1 CU
0.4 1 1 1 1 1 1 1 1
0.0 1 1 1 1 1 1 1 1 CD
0.4 1 1 1 1 1 1 1 1
Cneng-Wei Chen
11
TABLE 2 Mohr-Coulomb Strength Parameters, c' and ', Measured for Unreinforced and
Reinforced Ottawa Sand Specimens from CU Tests
0.0% Fiber Content 0.4% Fiber Content
Peak PSD Peak PSR Peak PSD/PSR
Initial
Void
Ratio c' (psi) ' (deg) c' (psi) ' (deg) c' (psi) ' (deg)
0.74 0.0 28.8 0.0 30.4 12.4 43.1
0.60 0.0 33.5 0.0 33.7 - -a - -
a
a Data not available.
Cneng-Wei Chen
12
TABLE 3 Mohr-Coulomb Strength Parameters, c' and ', Measured for Unreinforced and
Reinforced Ottawa Sand Specimens from CD Tests
0.0% Fiber Content 0.4% Fiber Content
Peak PSD Peak PSD
Initial
Void
Ratio c' (psi) ' (deg) c' (psi) ' (deg)
0.74 0.0 29.8 4.2 44.2
0.60 0.0 34.2 10.9 41.8

Cneng-Wei Chen
13
TABLE 4 Mohr-Coulomb Strength Parameters, c' and ', from CU Tests on Unreinforced
and Reinforced Ottawa Sand Specimens When Strength Is Taken as Peak Stress
Experienced at Limiting Strains of 5, 15, 25 Percent
0.0% Fiber content 0.4% Fiber content
5% Strain 15% Strain 25% Strain 5% Strain 15% Strain 25% Strain Initial
Void
Ratio c'
(psi)
'
(deg)
c'
(psi)
'
(deg)
c'
(psi)
'
(deg)
c'
(psi)
'
(deg)
c'
(psi)
'
(deg)
c'
(psi)
'
(deg)
0.74 0.0 29.9 0.0 30.2 0.0 29.6 2.3 36.7 4.0 42.0 7.0 44.9
0.60 0.0 33.6 - -a
- -a
- -a
- -a
8.1 35.6 - -a
- -a
- -a
- -a
a Data not available.
Cneng-Wei Chen
14
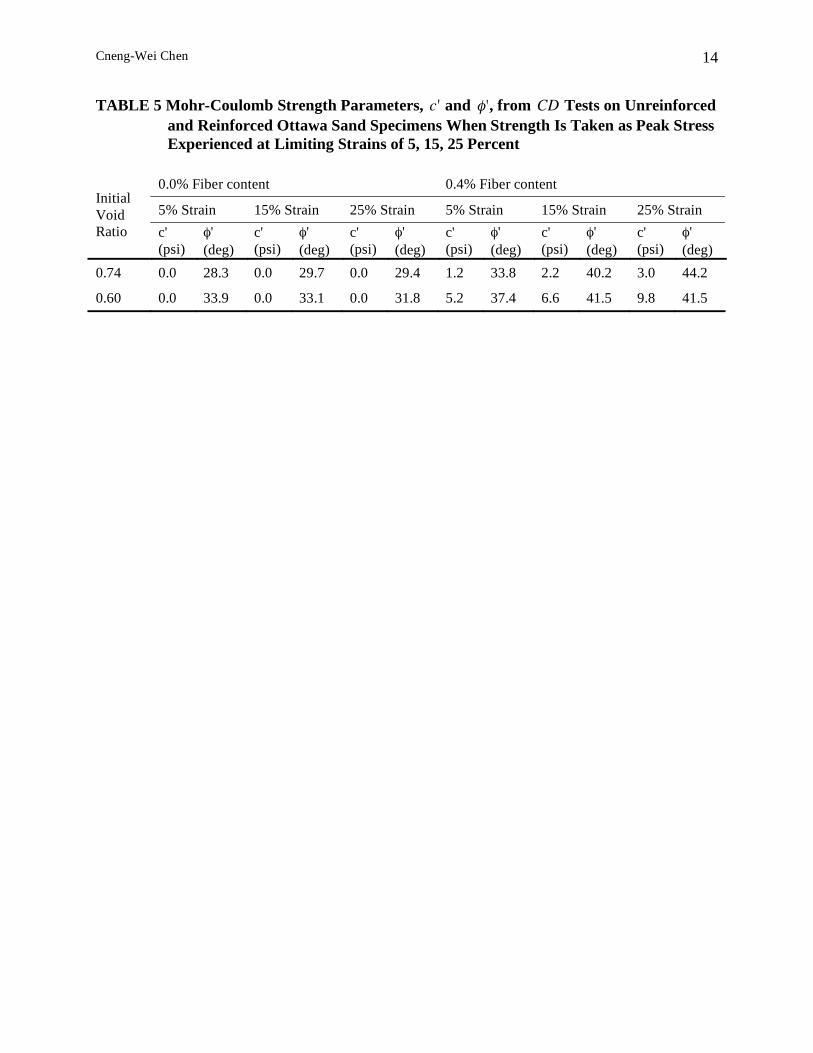
TABLE 5 Mohr-Coulomb Strength Parameters, c' and ', from CD Tests on Unreinforced
and Reinforced Ottawa Sand Specimens When Strength Is Taken as Peak Stress
Experienced at Limiting Strains of 5, 15, 25 Percent
0.0% Fiber content 0.4% Fiber content
5% Strain 15% Strain 25% Strain 5% Strain 15% Strain 25% Strain Initial
Void
Ratio c'
(psi)
'
(deg)
c'
(psi)
'
(deg)
c'
(psi)
'
(deg)
c'
(psi)
'
(deg)
c'
(psi)
'
(deg)
c'
(psi)
'
(deg)
0.74 0.0 28.3 0.0 29.7 0.0 29.4 1.2 33.8 2.2 40.2 3.0 44.2
0.60 0.0 33.9 0.0 33.1 0.0 31.8 5.2 37.4 6.6 41.5 9.8 41.5
Cneng-Wei Chen
15
FIGURE 1 Deviatoric stress (q) versus triaxial shear strain ( q) curves from CU tests for
Ottawa sand specimens consolidated to 20-psi effective stress and compacted at:
a) loose state (e0 = 0.74), and b) medium-dense state (e0 = 0.60).
*: start point of suspicious measurement.
a) Loose state (e0 = 0.74)
b) Medium-dense state (e0 = 0.60)
Cneng-Wei Chen
16
FIGURE 2 Deviatoric stress (q) versus triaxial shear strain ( q) curves from CD tests for
Ottawa sand specimens consolidated to 20-psi effective stress and compacted at:
a) loose state (e0 = 0.74), and b) medium-dense state (e0 = 0.60).
a) Loose state (e0 = 0.74)
b) Medium-dense state (e0 = 0.60)
Cneng-Wei Chen
17
FIGURE 3 Change in pore pressure ( u ) versus triaxial shear strain ( q) curves from CU
tests for Ottawa sand specimens consolidated to 20-psi effective stress and
compacted at: a) loose state (e0 = 0.74), and b) medium-dense state (e0 = 0.60).
*: start point of suspicious measurement.
a) Loose state (e0 = 0.74)
b) Medium-dense state (e0 = 0.60)
Cneng-Wei Chen
18
FIGURE 4 Deviatoric stress ( q) versus triaxial shear strain ( q) curves from CD tests for
Ottawa sand specimens consolidated to 20-psi effective stress and compacted at:
a) loose state (e0 = 0.74), and b) medium-dense state (e0 = 0.60).
a) Loose state (e0 = 0.74)
b) Medium-dense state (e0 = 0.60)
Cneng-Wei Chen
19
FIGURE 5 Cambridge stress paths and failure envelopes for limiting strains of 5, 15, and
25 percent strain from CU tests on Ottawa sand specimens compacted at loose
state (e0 = 0.74): a) 0.0 percent fiber content, and b) 0.4 percent fiber content.
a) 0.0 percent fiber content
b) 0.4 percent fiber content
Cneng-Wei Chen
20
FIGURE 6 Cambridge stress paths and failure envelopes for limiting strains of 5, 15, and
25 percent strain from CD tests on Ottawa sand specimens compacted at loose
state (e0 = 0.74): a) 0.0 percent fiber content, and b) 0.4 percent fiber content.
a) 0.0 percent fiber content
b) 0.4 percent fiber content