drainage strategy framework 012 final - home - ofwat · pdf filedrainage strategy framework...
TRANSCRIPT

Drainage Strategy Framework
For water and sewerage companies to prepare Drainage Strategies
Good practice guidance commissioned by the Environment Agency and Ofwat
May 2013
Drainage Strategy Framework
For water and sewerage companies to prepare Drainage Strategies
Good practice guidance commissioned by the Environment Agency and Ofwat
May 2013
Halcrow Group Limited Burderop Park Swindon Wiltshire SN4 0QD
tel 01793 812479 fax 01793 812089 halcrowcom
Halcrow Group Limited is a CH2M HILL company Halcrow Group Limited has prepared this report in accordance with
the instructions of The Environment Agency for the clientrsquos sole and specific use Any other persons who use any information contained herein do so at their own risk
Ordnance Survey mapping copy Crown Copyright and database right 2013 Ordnance Survey licence number 100024198
copy Halcrow Group Limited 2013
Drainage Strategy Framework
Document history
Drainage Strategy Framework
This document has been issued and amended as follows
Version Date Description Created by Verified by Approved by
012 030513 Final Elliot Gill Paul Conroy Elliot Gill
Drainage Strategy Framework
Contents
1 Introduction 1 11 Background and Purpose 1
12 Attributes of a Drainage Strategy 2
13 Suggested Elements of a Drainage Strategy for Sharing with Partners and the Public 3
14 Links with Established Drainage Planning Processes 5
15 Statutory Obligations and Regulatory Drivers 8 151 Government 8
16 Six Guiding Principles for a Drainage Strategy 10 161 Partnership 11
162 Uncertainty 11
163 Risk based 11
164 Whole life costs and benefits 11
165 Live process 12
166 Innovative and sustainable 12
17 Mapping the Framework to Current Planning Processes 12
18 Who will benefit from the Framework 13
2 Drainage Strategy Framework 13 21 Principle One Partnership 14 211 Recommended good practice 15
212 Good practice example ndash South West Water working with local authorities 16
213 Good practice example ndash Northumbrian Water partnership working in Tyneside 17
22 Principle Two Uncertainty 18 221 Recommended good practice 19
222 Good practice example ndash Severn Trent Waterrsquos MICAS 21
23 Principle Three Risk Based 22 231 Recommended good practice 22
232 Good practice example ndash United Utilities risk assessment 24
233 Good practice example ndash Northumbrian Water risk assessment 25
24 Principle Four Whole Life Costs and Benefits 27 241 Recommended good practice 27
242 Good practice example ndash Severn Trent Water making the case for surface water separation in Stoke-on-Trent 29
243 Good practice example ndash New York City comparison of grey and green infrastructure drainage strategies 30
25 Principle Five Live Process 31 251 Recommended good practice 32
252 Good practice example ndash Thames Water live DAP 32
253 Good practice example ndash Wessex Water Water live data 35
26 Principle Six Innovative and Sustainable Solutions 36
Drainage Strategy Framework
261 Recommended good practice 37
262 Good practice example ndash Welsh Water surface water reduction and removal strategy for Gowerton and Llanelli 38
Appendices Appendix A Glossary
Drainage Strategy Framework
1 Introduction 11 Background and Purpose
Water for Life1 recognised that longer term planning for water and sewerage company drainage infrastructure has had less focus than water supply infrastructure It set out a commitment to ensure a more strategic approach to drainage planning This is important to demonstrate that economic growth is supported the environment continues to be protected and that climate change adaptation2 is planned for appropriately
Since privatisation water and sewerage companies have invested to achieve significant improvements to the environment and the service customers receive notably reducing the number of properties known to be at risk of flooding This investment has been a reaction to the issues inherited at privatisation It is now appropriate to look forward to ensure that water and sewerage companies working together with other partners are able to deliver the outcomes that customers need and want
For the next price review water and sewerage companies will propose a number of high level outcomes that they will deliver An outcome should reflect their customersrsquo priorities identified through appropriate customer engagement and deliver the best long‐term sustainable solution for customers and the environment An outcome may not be bound by a single price control period and should be set in the context of customersrsquo and the environmentrsquos long term needs
Outcomes are likely to be framed at a high level for each water and sewerage companyrsquos area However the way in which these outcomes are delivered in a particular drainage catchment will depend on the characteristics of that catchment and the partners that the water and sewerage companies work with
Companies will set out the measures they will use to demonstrate delivery of outcomes An UKWIR study3 has described example measures that include the number of properties which experience sewer flooding the number of properties at risk of flooding the number of properties at risk from sewerage asset failure risk indices that capture both the probability and consequence of failure customer satisfaction with regards to clean rivers and beaches the number of pollution incidents the frequency of combined sewer overflow operation and compliance with discharge permit conditions3 Most measures are likely to be meaningful at a catchment scale as well as at the overall company level This Drainage Strategy Framework illustrates good practice in how to prepare a Drainage Strategy for a particular catchment that is in line with it delivering its outcomes in that location It is based around established planning approaches and emphasises six key principles It has been designed to be informative and flexible so that it can be applied in different circumstances to suit companiesrsquo needs and customersrsquo expectations Most of the elements of the framework are taken from existing good practice in water and sewerage companies However articulating and communicating a clear Drainage Strategy for an area is not yet common practice By adopting the
1 httpwwwdefragovukenvironmentqualitywaterlegislationwhitepaper 2 Ofwat has published research illustrating the predicted scale of increased sewer flooding risks due to climate change and growth httpwwwofwatgovuksustainabilityclimatechangerpt_com201106mottmacsewerpdf 3 UKWIR has published guidance on Defining and Incentivising Outcomes and Measures of Success httpwwwukwirorgukwirlibrary96066
205240txt012|May 2013
1
12
Drainage Strategy Framework
Framework principles and developing Drainage Strategies water and sewerage companies will be better able to provide greater confidence to all stakeholders that outcomes can be achieved in the long term
A Drainage Strategy should help customers and other stakeholders understand how a water and sewerage company intends to deliver its statutory functions over the long term within a particular area in a sustainable and economic manner The Drainage Strategy should explain how a water and sewerage company will do this in conjunction with other organisations (eg The Environment Agency Natural Resources Wales local authorities highways authorities housing developers)4 and how the company in turn will support these organisations in delivering their own responsibilities as well For example the Drainage Strategy should signal to housing developers and other interested parties how sewerage infrastructure will develop so that they are able to plan accordingly and contribute to economic growth
The Environment Agency Natural Resources Wales and Ofwat expect that Drainage Strategies will be developed (following a risk based approach) in accordance with the six principles in a way that suits local circumstances and customersrsquo expectations In England Defra has described5 the requirement for companies to continue their investment in Drainage Area Plans for the period 2015 to 2020 and subsequent planning cycles so that these can be used as the basis for the development of Drainage Strategies The Environment Agency Natural Resources Wales and Ofwat believe that companies completing Drainage Strategies will be well placed to deliver their long term outcomes
Attributes of a Drainage Strategy
A Drainage Strategy should be accessible and understandable to customers local authorities developers the Environment Agency (in England) Natural Resources Wales and other stakeholders that may be interested in what the water and sewerage company intends to do in the future It will give confidence to all stakeholders that the water and sewerage company will deliver their duty of providing a public sewerage system that will deliver stated outcomes The Drainage Strategy will encourage a more strategic approach that is less reactive and more proactive in providing what customers and environment requires
A Drainage Strategy should normally cover the drainage area containing public sewers serving a single wastewater treatment works although in large cities it may be prudent to sub‐divide into smaller areas Adjacent drainage catchments impacting on the same receiving water ought to be considered together When planning to accommodate growth allow for climate change and maintain or improve water quality (in rivers and the sea) it will often be necessary to consider the interaction of public sewers and wastewater treatment works
A Drainage Strategy should be developed by the water and sewerage company with a primary focus on its network of foul combined and surface water sewers However the company should work with other organisations so that their role in controlling the demand on sewers is confirmed and the company plays its part in the resolution of wider drainage surface water flooding and water pollution issues in the catchment
4 The Environment Agency and Natural Resources Wales already collaborate with local authorities to undertake strategic planning for flood risk management from rivers and the sea (eg through the control of development in floodplains) 5 httpwwwdefragovukpublications20121005pb13829‐statement‐obligations
205240txt012|May 2013
2
13
Drainage Strategy Framework
The following section (13) is provided as a generic illustration of how companies might choose to communicate the process of developing selecting and delivering a Drainage Strategy in a location Full technical analysis and documentation demonstrating how the six principles have been followed neednrsquot be made publically available as this may contain confidential complex and sensitive information It is envisaged that a Drainage Strategy could be communicated within up to 20 written pages depending on size and complexity
Suggested Elements of a Drainage Strategy for Sharing with Partners and the Public
The following is provided as an example of the type of information that could be shared publically to communicate the Drainage Strategy for a catchment
1 Provide a catchment description and map illustrating principal drainage and related water infrastructure (eg larger sewers combined sewer overflows wastewater treatment works rivers and ordinary water courses) Explain how wastewater and stormwater are collected and treated
2 Describe company aims and outcomes and how these relate to the drainage system Indicate the performance measures that will be used to monitor progress towards the achievement of outcomes Report on current and historical patterns in performance measures for the catchment (eg number of flooded properties number of pollution incidents and frequency of combined sewer overflow operation)
3 Summarise the wider drainage issues in the catchment their relation to the companyrsquos assets and the organisations consulted in the development of the Drainage Strategy (eg describe areas of significant surface water flooding)
4 Describe and quantify any pressures in the catchment that will affect the achievement of outcomes ndash eg population change urban creep new development climate change asset deterioration water consumption and environmental legislation
5 Describe how the pressures identified will influence predicted future performance measures (a do nothing scenario) Show the rate of change over time and discuss any uncertainties
6 Describe a short‐list of alternative strategies that are technically feasible and result in the achievement of outcomes for the catchment Explain the strengths weaknesses opportunities and threats of alternative strategies considering societal benefits whole life costs programming uncertainties and the role of other organisations Consider the perspectives of customers and other organisations (eg with reference to Local Flood Risk Management Strategies or River Basin Management Plans)
7 Explain the selection of a preferred strategy (with reference to SWOT analysis) and illustrate this in more detail with plans timelines and images so that stakeholders understand what might be involved and how it will impact on them A full disclosure of strategy appraisal is not necessary The roles of other organisations should be agreed and described
8 Explain how progress towards delivery of the Drainage Strategy and the achievement of outcomes will be monitored and reported
205240txt012|May 2013
3
Drainage Strategy Framework
Figure 1 Water and sewerage company Drainage Strategy interactions with other strategies plans and processes relating to flood and water quality management
Figure 1 illustrates how a water and sewerage company produced Drainage Strategy relates to the strategies plans and processes of other partner organisations in flood and water quality management The principal external (to water and sewerage company) relationships are between Drainage Strategies and
205240txt012|May 2013
4
14
Drainage Strategy Framework
bull Local Development Plans (of planning authorities) bull Flood Risk Management Plans bull Local Flood Risk Management Strategies (of Lead Local Flood Authorities) and bull River Basin Management Plans (led by the Environment Agency)
A Drainage Strategy should be risk and evidence based and should lead to companies minimising whole life costs whilst still delivering outcomes for customers and the environment It should recognise that population growth new development urban creep climate change and changing customer behaviour all exert new pressures and demands on drainage systems
A Drainage Strategy is there to facilitate both long and short term planning While relatively few Strategies are likely to be complete in advance of 2015 we expect companies to adopt a risk based prioritisation approach to develop further Strategies in the coming years Once complete more detailed planning should be consistent with the long term Strategy both up to and beyond future price reviews (although it is recognised that competing priorities may affect the pace at which outcomes are delivered)
A Drainage Strategy is likely to contain a mixture of responding to current problems pro‐actively reducing risks for predicted problems improving operational responses and acting to improve data and reduce uncertainty An example structure for a Drainage Strategy is included in Section 13
Links with Established Drainage Planning Processes
The Drainage Strategy framework encompasses and supplements established planning processes and technical guidance which have been applied selectively and adapted by water and sewerage companies (and Lead Local Flood Authorities) in recent years when planning for drainage systems
These include
bull Common Framework for Capital Maintenance Planning6
bull Sewerage Management Plans (Sewerage Risk Management 5)7
bull Urban Pollution Management 38
bull Surface Water Management Plan technical guidance9
bull Local Government Association Framework to assist the development of the Local Strategy for Flood Risk Management10
bull Long Term Least Cost Planning for Wastewater Supply‐Demand (to be superseded in 2013)11
bull Water Cycle Study Guidance (2013 revision in print) 12
These CIWEM13 Urban Drainage Group (WaPUG) published technical guides are also in widespread use
6httpwwwukwirorgukwirlibrary80474 (poundpound‐ indicating that a charge is made to access this content) 7 httpsrmwrcplccouk (poundpound) 8 httpwwwfwrorgUPM3 9 httpwwwdefragovukpublications20110610pb13546‐surface‐water‐guidance 10httpwwwlocalgovukwebguestlocal‐flood‐risk‐management‐journal_content56101713618366ARTICLE‐TEMPLATE 11 httpukwirforefront‐librarycomreports07‐rg‐08‐291714 (poundpound) 12 httpwwwenvironment‐agencygovukresearchplanning33368aspx
205240txt012|May 2013
5
Drainage Strategy Framework
bull WaPUG code of practice for the hydraulic modelling of sewers (3rd edition) bull WaPUG guide to quality modelling of sewer systems bull WaPUG integrated drainage modelling guide
The sewerage risk management and surface water management methodologies in particular share a common phased approach to understanding drainage problems and developing cost effective solutions These phases are central to good practice in drainage planning and are central to the development of a Drainage Strategy
Generically these phases include
bull Initialisation Preparation phase where data are collated to understand current issues in the system and necessary partners are consulted with to agree success measures and objectives
bull Risk assessment phase where predictive tools are used to quantify current problems and predict how these problems will change in the future
bull Options appraisal phase where the costs and benefits of alternative remedies that meet agreed objectives are considered This informs the selection of a preferred solution or solutions
bull Implementation phase where drainage improvements are financed and delivered and the effectiveness of improvements monitored
The process is cyclical indicating that it is periodically revisited to confirm previous decisions address uncertainties and adapt to a changing environment Figure 2 and Figure 3 illustrate the Sewerage Risk Management and Surface Water Management Plan planning processes
Figure 2 Sewerage Risk Management Approach (Copyright WRc plc httpsrmwrcplccouk used with permission)
13 httpwwwciwemorgknowledge‐networksgroupsurban‐drainagepublicationsmodelling‐guidesaspx
205240txt012|May 2013
6
Drainage Strategy Framework
Figure 3 Surface Water Management Plan Approach
Ofwat has previously commissioned research14 on current practice in sewerage planning and drainage area plans concluding that traditional drainage area plans are no longer widely undertaken but that these activities are generally undertaken under different guises
14httpwwwofwatgovukfuturesustainabledrainagerpt_com20111208drainagepdf
205240txt012|May 2013
7
15
Drainage Strategy Framework
Statutory Obligations and Regulatory Drivers
151 Government
Drainage planning is undertaken within a context established by a variety of Government policies and instruments These are succinctly detailed in Defrarsquos October 2012 Statement of Obligations15
(for England) which is to be referenced by water and sewerage companies in the preparation of business plans for the 2015‐2020 price review period More specific guidance over priorities for 2015‐2020 is provided in Defrarsquos16 strategic policy statement for Ofwat A Water Strategy for Wales17 will be consulted on in 2013
The key legislative drivers and Government priorities relevant to drainage planning are summarised here
bull Section 94 of the Water Industry Act 199118 describes how every water and sewerage company is under a duty to lsquoprovide improve and extend hellip a system of public sewers hellip as to ensure that the area is and continues to be effectually drainedrsquo This is relevant to drainage planning because it explicitly indicates that the sewerage system should be improved to keep pace with growing pressures over the long term this requirement is assured if a long term Drainage Strategy is in place and implemented
bull The Urban Wastewater Treatment Directive19 provides a further requirement to provide sufficient capacity in wastewater collection systems
bull The Governments in England and Wales are committed to taking an ecosystems approach to environmental management which accounts for the environmental economic and social benefits that result from an improved water environment Water and sewerage companies are encouraged to invest in natural as well as built infrastructure to deliver their desired outcomes The Natural Choice 20 demonstrated how this type of investment can deliver a wide range of positive social environmental and economic outcomes Benefits can be determined using lsquopayments for ecosystem servicesrsquo 21 methods Water and sewerage companies are encouraged to consider these approaches where they can deliver cost beneficial outcomes for their customers This is relevant to drainage planning because it encourages the use of retrofit sustainable drainage systems in place of more traditional sewer upsizing and storage Ofwat has supported water and sewerage companies to investigate these approaches through pilot studies22 in the 2010 to 2015 price review period
bull Water and sewerage companies may work in partnership with other organisations to jointly invest in shared outcomes and to discuss with customers their willingness to pay for wider
15 httpwwwdefragovukpublications20121005pb13829‐statement‐obligations 16 httpwwwdefragovukpublications20130307pb13884‐sps‐seg‐ofwat 17httpwalesgovuktopicsenvironmentcountrysideepqwaterfloodingpublicationswater‐strategyjsessionid=235D11ADCC6EEC8EE88886DD69CE0784lang=en 18 httpwwwlegislationgovukukpga199156partIVchapterI 19 httparchivedefragovukenvironmentqualitywaterwaterqualitysewageuwwtdindexhtm 20 httpwwwdefragovukenvironmentnaturalwhitepaper 21 httpwwwdefragovukenvironmentnaturalecosystems‐services 22 httpwwwofwatgovukfuturesustainabledrainage
205240txt012|May 2013
8
Drainage Strategy Framework
benefits This is relevant to sewerage planning because it encourages water and sewerage companies to partner with local authorities to resolve complex storm water management problems (for flooding or pollution control) through the use of retrofit sustainable drainage systems The wider benefits to citizens outside of the water and sewerage companyrsquos customer base can be accounted for
bull The governments of England and Wales are promoting a catchment‐based approach23 to River Basin Management Planning to meet the water quality requirements of the Water Framework Directive (WFD)24 The important aspect of the approach is that all interested parties should work together to build consensus about the best way to improve water quality and habitats Water and sewerage companies should expect to be involved in the process of agreeing objectives and the apportionment of responsibility for delivering those objectives within the river basin districts they operate The central requirements of the Water Framework Directive are to prevent deterioration in water quality aim to achieve good chemical status and aim to achieve good ecological status It additionally seeks to limit the discharge of priority substances River Basin Management Plans will undergo consultation in the second half of 2014 and be published in December 2015 thereafter the programmes of measures included become statutory requirements and the Environment Agency (in England) and Natural Resources Wales will use permit and license conditions to ensure that water and sewerage companies deliver their agreed contributions This is relevant to drainage planning because misconnections blockages mechanical failure sewer flooding and combined sewer overflows (CSOs) can all contribute to the deterioration of water quality and the failure to achieve good ecological status or meet environmental quality standards for priority substances Climate change and growth may increase these risks but water and sewerage companies are not the only polluters and need to partner to ensure that outcomes are met Defra is consulting (closing February 2013) on developing its policies with respect to the control of diffuse urban pollution25
bull A revised Bathing Water Directive (20067EC)26 applies from 2015 and by then the Governmentrsquos aim is for all bathing waters to achieve at least lsquosufficient classrsquo this is approximately twice as stringent as requirements for the current Directive Subsequent planning should aim to achieve lsquogoodrsquo or lsquoexcellentrsquo classifications This is relevant to drainage planning because CSOs other wet weather intermittent discharges final effluent discharges and misconnections can all contribute to bathing water failures Climate change and growth may increase these risks but water and sewerage companies are not the only polluters and need to partner to ensure that outcomes are met
bull Under the Flood and Water Management Act (2010)27 water and sewerage companies (in England and Wales) must act in a manner consistent with the National Flood and Coastal Erosion Risk Management (NFCERM) Strategies28 for England and Wales and have regard to
23httpwwwdefragovukenvironmentqualitywaterlegislationcatchment‐approach 24httpwwwdefragovukenvironmentqualitywaterlegislationwater‐framework‐directive 25 httpwwwdefragovukconsult20121120water‐pollution 26 httpwwwenvironment‐agencygovukbusinessregulation107017aspx 27 httpwwwdefragovukenvironmentfloodinglegislation 28 httpwwwenvironment‐agencygovukresearchpolicy130073aspx
205240txt012|May 2013
9
16
Drainage Strategy Framework
Local Flood Risk Management Strategies29 NFCERM is based around six principles community amp partnership catchment based approach sustainability risk based planning beneficiary investment and delivering multiple benefits Companies should also co‐operate with local authorities and the Environment Agency in the exercise of their functions in relation to surface water management and combined sewers under section 94 of the Water Industry Act 1991 The Flood Risk Regulations 200930 implement the Floods Directive and give particular responsibilities to Lead Local Flood Authorities In lsquoFlood Risk Areasrsquo Lead Local Flood Authorities and the Environment Agency are expected to prepare Flood Risk Management Plans that set out flood risk management objectives and measures to manage risk from local flooding The Environment Agency is required to prepare Flood Risk Management Plans for the whole of England and Wales that cover flooding from main rivers the sea and reservoirs It is important for all risk management authorities to work in an effective way to plan to manage flood risk from all sources in a way that is well coordinated across catchments and coastal cells These duties are relevant to drainage planning because of the vital (but not unlimited) role surface water and combined sewers play in reducing flood risk in urban areas The Act also makes provision for the compulsory drainage of new developments through sustainable drainage systems (SuDS) and the lsquoright to connectrsquo being conditional on SuDS being approved by the SuDS Approval Body of the Lead Local Flood Authority
bull The Climate Change Act 200831 created a legal framework to cut greenhouse gas emissions and build the UKrsquos ability to adapt to a changing climate Water and sewerage companies are expected to reduce carbon emissions and adapt to the impact of climate change over the next decades The Government published its first UK climate change risk assessment in January 2012 and this will be updated every 5 years This is relevant to drainage planning because of the carbon embodied in new drainage infrastructure the carbon emitted during the pumping and treatment of sewage and the increase in flooding and pollution that will occur if climate change adaptations are not made The Government expects Ofwat to work towards the targets of its Adaptation Report and to ensure that its regulatory approach explicitly supports companies in adapting to climate change
bull From October 2011 the Water Industry (Schemes for Adoption of Private Sewers) Regulations 201132 transferred responsibility for existing private sewers and lateral drains to water and sewerage companies Pumping stations will be transferred by October 2016 This is relevant to drainage planning because of the significant increase in assets now within the responsibility of the water and sewerage company and the need to understand and respond to risks therein
Six Guiding Principles for a Drainage Strategy
This Drainage Strategy Framework describes good practice themed around six guiding principles Adherence to these principles will help ensure a Drainage Strategy which meets the expectations of Defra the Welsh Government the Environment Agency Natural Resources Wales and Ofwat and
29 The Local Government Association has published guidance on Local Flood Risk Management Strategies httpwwwlocalgovukcdocument_libraryget_fileuuid=a2538b94‐d3c1‐4cec‐81b0‐8aefd2996c5eampgroupId=10171 30 httpwwwenvironment‐agencygovukresearchplanning125459aspx 31 httpwwwdeccgovukencontentcmslegislationcc_act_08cc_act_08aspx 32 httpwwwlegislationgovukukdsi20119780111510933contents
205240txt012|May 2013
10
Drainage Strategy Framework
will be an essential means of communicating with customers and other partners Further details on each principle are described in Section 2 of this document along with examples of good practice
The six principles are
161 Partnership
Water and sewerage companies cannot develop optimal Drainage Strategies on their own and therefore partnership is key to developing and defining objectives performance indicators and the milestones that will need to be achieved in order to achieve measures that will demonstrate the delivery of outcomes Strategies should be developed and implemented in partnership with customers developers Lead Local Flood Authorities planning authorities the Environment Agency and Natural Resources Wales Strategies should align with (informing and informed by) River Basin Management Plans Local Flood Risk Management Strategies Flood Risk Management Plans and local plans (from planning authorities)
162 Uncertainty
Strategies should explain the reliability of data and knowledge about current and future performance of drainage systems They should explain what steps are planned to improve this understanding and how this will benefit customers Where future performance is uncertain (eg because of sensitivity to climate change) they should explain how adaptive approaches will be used to ensure outcomes are met The uncertainty in predictions of future risks should be recognised and accommodated within decision making
163 Risk based
Strategies should be risk based This means that planning operational and investment activities should be based on consideration of the probability and consequence of inadequate drainage function (risks) as these relate to the achievement of measures that demonstrate delivery of outcomes A risk based strategy ensures that investment is made where risks are the greatest
To aid communication risks should be visualised through maps and plans (Figure 10 is an example) To aid risk assessment risks should be monetised combined and predicted into the future To aid options appraisal the impact of interventions on the level of risk should be predicted
The approach to Drainage Strategy development should be risk based itself The degree of detail included should be related to an understanding of the overall level of risks in the catchment now and in the future
164 Whole life costs and benefits
Strategies should be informed by consideration of whole life costs and benefits They should promote a series of interventions which in view of the quantified uncertainties are most likely to result in performance indicators which demonstrate the achievement of outcomes at lowest cost to customers and the community more widely
Costs relate to capital and operational expenditure to deliver interventions and the monetised impacts of drainage failures such as flooding and pollution
Benefits relate to the reduction in risks from drainage failures such as flooding and pollution but should also include wider societal impacts such as those calculated using a lsquoPayments for Ecosystems Servicesrsquo approach
205240txt012|May 2013
11
17
Drainage Strategy Framework
When considering the lsquowhole lifersquo the strategy should consider climate population and asset deterioration trends These are likely to increase risks over the long term if no interventions are made The strategy should state lsquowhatrsquo should be done but also broadly lsquowhenrsquo and in what sequence interventions should happen
165 Live process
The Strategy should be adaptable and periodically reviewed Whilst outcomes are expected to be relatively stable over time the pace at which the strategy delivers outcomes will be linked to volatile influences (like climate and population change) and the decisions made at each price review about the priorities for the following period The strategy should be reviewed at regular intervals to reflect investments already made the changing priorities of the water and sewerage company and partners and the presence of emerging risks The review is also an opportunity to report drainage catchment performance relative to performance measures designed to monitor progress towards achieving outcomes
166 Innovative and sustainable
The framework promotes the full evaluation of alternatives to traditionally engineered sewerage solutions to test whether these offer lower whole life cost options or better responses to uncertainty It is anticipated that drainage solutions of the future will be different from the ones we are used to
These should include (at least at a high level) real time control or active management storm water retrofit techniques education to enable customers to change behaviour enhancing incentives for customers to reduce surface water flowing to sewers and innovative permitting arrangements across drainage networks and wastewater treatment works Water and sewerage companies should continue to review and develop other innovative solutions
For example where a company may historically have preferred to tackle sewer flooding or combined sewer overflow pollution by increasing its underground equipment to store more rainfall during storms it might consider other options in future such as working with customers to manage the rainfall close to source preventing it from entering the sewer system
Mapping the Framework to Current Planning Processes
We assume that practitioners will be following a broad and generic four‐stage planning process common to the Sewerage Risk Management (SRM5) and Surface Water Management Plan (SWMP) processes when preparing Drainage Strategies
Figure 4 is provided to guide water and sewerage companies in the development of Drainage Strategies It identifies each stage of the drainage planning process and highlights the good practice principles (colour coded by theme) in the locations through the process where it is most important that they are adopted
205240txt012|May 2013
12
e
u
t
v
b
DDrainage Strateegy Frameworrk
Initializepre
Establish partne and consultat
process
Define uncertai
Prepare risk d
Partnership
epare
rship ion
nties
ata
Ris
Co
Uncertainty
k assessmen
onsultation on risk issues
Quantify uncertainties
Quantify risks
Risk based
nt Options
Consult
Plan for
Demons life cost
Whole lif costs amp benefits
s appraisal
on options
uncertainties
strate whole and benefit
fe
s Live pro
Intervent
Aligned deliv collaborat solution
Innovative sustainab
Live and vis
cess Innova sustai
tion
ery amp ive s
and le
sible
ative amp nable
Figgure 4 Draina ge Strategy frramework prinnciples mappe d to the drainaage planning pprocess
118 WWho will bennefit from tthe Framewwork
Thhe Drainage Strategy Fraamework willl benefit
bull Water andd sewerage coompanies loooking to impprove their coompany speccific drainagge planning approach and make it fit for purpoose for the deelivery of lonng term outcoomes over mmultiple pricee review cyccles It will ppoint them toowards good practice andd provide exaamples as innspiration andd to promott ne innovation
bull Organisatiions and inddividuals lookking to enga ge with the ddevelopmen t of Drainagee Strategies and scruti nise progresss towards thhe achievemeent of outcommes associateed with enabbling growth adapting tto climate chhange managging floodingg and managging water poollution
22 DDrainagee Strateegy Frammeworkk Thhis section deescribes recoommended ggood practicee against eachh of the six kkey principle s necessary too develop a DDrainage Straategy For refference linkss are made too relevant annd establisheed planning prrocesses and emerging guuidance whicch drainage planners maay find usefuul These exammples are prrovided for innformation aand referenc e only
WWater and sewwerage comppanies shouldd work towaards developiing Drainagee Strategies wwhich apply thhese approachhes in a wayy that is consiistent with thheir needs annd those of thheir customeers and paartners Partnners should ttake note of tthis advice aand prepare tto engage wiith water andd sewerage coompanies on this basis
Thhe recommennded good ppractice is orgganised withhin each prinnciple as it wwould be appproached chhronologicallly in developping a Drainaage Strategy following thhe planning pprocesses alrready esstablished in the Seweragge Risk Manaagement anddor Surface WWater Managgement Plann mmethodologiess
2205240txt012|Mayy 2013
13
21
Drainage Strategy Framework
Principle One Partnership
Water and sewerage companies cannot develop optimal Drainage Strategies on their own and therefore partnership is key to developing and defining objectives performance indicators and the milestones that will need to be achieved in order to achieve measures that will demonstrate the delivery of outcomes Strategies should be developed and implemented in partnership with customers developers Lead Local Flood Authorities planning authorities the Environment Agency and Natural Resources Wales Strategies should align (informing and informed by) with River Basin Management Plans Local Flood Risk Management Strategies Flood Risk Management Plans and local plans (from planning authorities)
205240txt012|May 2013
14
Drainage Strategy Framework
211 Recommended good practice
No Good practice Example references
1 Engage with partners in a drainage catchment to bull Explain the purpose of developing a Drainage Strategy
and partnersrsquo roles in its success amp how each party will benefit from establishing a long term Drainage Strategy
bull Explain what outcomes are and how progress towards achieving them will be measured
bull Share data and information so that a shared understanding of risks and opportunities is developed
bull Explain what current drainage system performance is and how this is expected to change in the future Use risk visualisation tools to do this
bull Explain significant uncertainties and how these affect how interventions are delivered
Thames Water has demonstrated good practice through the development of its Counters Creek sewer flooding proposals This website describes the engagement process and how customers have been kept informed
2 Engage with the following partners in the development of the Drainage Strategy
bull Lead Local Flood Authority (the drainage area may include more than one) because of its responsibilities for local flood risk management and SuDS approval
bull Planning authority (the drainage area may include more than one) because of its role in determining the location and pace of housing development
bull Highways Authority because of the connection of highway runoff to public sewer systems
bull The Environment Agency (in England) because of its responsibilities for flood risk management (strategic overview) and ensuring good ecological quality is met in water bodies
bull Natural Resources Wales (in Wales) because of its responsibilities for flood risk management (strategic oversight) and ensuing good ecological quality is met in water bodies
bull Regional Flood and Coastal Committees who help develop a mutual understanding of flood and coastal erosion risks in an area
bull Bodies representing customers (eg Consumer Council for Water large local businesses flood action groups faith communities)
bull Bodies representing local environmental concerns (eg Wildlife Trusts Rivers Trusts)
bull Water only companies and water and sewerage company departments planning and operating water supply systems Water demand management practice can have an important impact on sewerage headroom
SWMP guidance (Chapter 2) advises on the establishment of partnerships for urban flood management and how to agree and align local objectives
3 Understand alignment of planning cycles and what this means locally (eg periodic review River Basin Management Plan Local Flood Risk Management Strategy Flood Risk Management Plan local plan)
205240txt012|May 2013
15
Drainage Strategy Framework
No Good practice Example references
4 Be alert to opportunities for joint solutions andor shared funding by understanding local plans for new development re‐development improving street furniture and public open space improving parks and green infrastructure Understand Lead Local Flood Authority and Environment Agency programmes for the management of flood and pollution risks
A guide to joint funding of local flood risk management intervention has been published by Defra33 and provides relevant advice to water and sewerage companies and other partners
5 Consider water and sewerage company funded solutions which deliver third‐party non‐sewerage assets that result in the long term least cost delivery of outcomes (eg water and sewerage company funding of household rain barrels and rain gardens to prevent surface water entering sewers)
6 Use data and mapping from the Environment Agency and Natural Resources Wales to understand exposure of drainage infrastructure to extreme events (eg coastal fluvial and surface water flood maps) so that network resilience can be understood and improved if this is cost beneficial
UKWIR has completed a project in 2013 lsquoResilience building a business case for PR14 and beyondrsquo
7 Work with LLFAs and the Environment Agency (or Natural Resources Wales) to understand the effectiveness of interventions at reducing risk and use this information to improve intervention planning
The UPM3 manual (section 7) advises on post project monitoring needs for water quality driven improvements
8 Share Drainage Strategies with partners and stakeholders so that there is transparency around challenges opportunities and the roles expected of different organisations
212 Good practice example ndash South West Water working with local authorities
These examples from South West Water illustrate how the company has worked with local authorities to coordinate investments and to share resources and skills in the development of integrated urban drainage management studies and Surface Water Management Plans
bull South West Water approached Devon County Council (DCC) to pool resources in delivering two (of five) pilot integrated urban drainage management studies (IUDMs) for Exeter and Exmouth South West Water took the lead role for Exmouth but DCC led in Exeter This engagement shared costs across organisations and has facilitated the production of full Surface Water Management Plans The collaboration has resulted in a shared understanding of the urban drainage challenges faced by both organisations and has opened dialogue around investment priorities
bull In Lyme Regis South West Water supported extensive coastal erosion defence works being carried out by West Dorset District Council by accelerating a programme of sewer rehabilitation and targeting renovation of sewers in vulnerable areas
bull In partnership with Cornwall County Council (CCC) and the Environment Agency South West Water has been working on a number of key drainage issues identified by CCC in its Preliminary Flood Risk Assessment (PFRA)
33 httprandddefragovukDefaultaspxMenu=MenuampModule=MoreampLocation=NoneampCompleted=0ampProjectID=17085
205240txt012|May 2013
16
Drainage Strategy Framework
bull In Camborne South West Water has taken the opportunity to invest in sewer separation works which align with the aims of the Camborne Pool Redruth urban regeneration group supported by Cornwall Council and to promote sustainable development economic growth and a strategic aim of lsquosewers for sewagersquo
213 Good practice example ndash Northumbrian Water partnership working in Tyneside
Northumbrian Water has led a sustainable sewerage study for Tyneside34 between 2010 and 2012 It is a good example of how partner organisations can collaborate to understand and resolve drainage issues in their urban area
Its approach was informed by the fact that a shared urban drainage problem around flooding and pollution was best addressed by a shared response from all the relevant organisations The project steering group involved representatives of Northumbrian Water the Consumer Council for Water the Environment Agency and five Lead Local Flood Authorities The urban drainage system collects wastewater for a single wastewater treatment works serving a population of over 900000
Working together the group studied the impact of growth urban creep and climate change on future urban drainage issues Figure 5 illustrates how a city‐wide map of potential problem areas was generated by the project team sharing data on sewer capacity (from Northumbrian Water) population change (from the local authorities) and river flooding (the Environment Agency) It was predicted that future problems were more likely to occur in the darker shaded areas These became focus areas for the project where a range of traditional and novel drainage solutions were tested
Figure 5 Future drainage problem areas indentified through data sharing
34httpcommunicatoremailcomINfNLOjNRayfOA1rfrfYcdK‐S7UwRcYcNoWebViewaspx
205240txt012|May 2013
17
22
Drainage Strategy Framework
The project team was keen to promote its work to customers and the community and prepared a series of newsletters updating interested parties on progress and issues An example is illustrated in Figure 6
C lic k here if y ou are hav in g d if f ic u lties v iew ing th is new s letter
Ho m e A b o u t u s M e d ia ce n tre C o n tact
Issue 2
Ap ril 2012
In th is ed ition U n d e rs tan d in g th e fu tu re
S u s tain ab le d ra ina g e o p tio ns
F ind ou t more about Th e 2 0 1 1 an n ua l re po rt
Ou r e n viro n m e n ta l p o licy
Ou r co rp o ra te re sp o nsib il i ty s tra te g y
W e lcom e to th e s e con d e ditio n o f S u sta inab le se we ra g e a s ix-m on th ly n e ws le tte r p ro d u ce d to b ring yo u th e la te s t n e ws on o u r m a jo r s tud ye xp lo rin g s us tain ab le s ew e ra ge o p tions in th e Tyn e s id e a rea I h o p e yo u fin d th e in fo rm a tio n o f in te res t a n d wo u ld w e lcom e fe e db a ck o n an y o f th e issu es ra ise d
Ric ha rd W a rne ford W a s te wa te r Dire c tor
U nderstand ing the fu tu re W e a ll kn o w th e difficu lties o f a ccu ra tely p re d ic tin g th e fu tu re h ow e ve r ifw e a re to p re pa re fo r i t th e n it is s om e thin g we m us t a tte m p t As p a rt o f th is s tu d y w e a re co ns id e rin g w ha t d em a nds w ill b e p la ce d on th e d ra ina g e s ys tem s a t 2 0 20 a n d a t 2 0 50 in co rpo ra ting g ro w th u rba n cre e p a nd c lim a te cha n ge B y w o rk in g close ly w ith o u r p a rtn e rs an d u s in g th e la tes t te ch n ical res e a rch we h a ve d e ve lo p ed a n d com p u te rm od e lle d a num b e r o f s ce na rios to id en tify a n d d e fin e fu tu re ris ks Th es e ris ks in c lud e p red ic tions o f p o te n tia l floo d in g p o llu tion o r b a rrie rs to g ro w th N o w th a t w e be tte r u n d e rs ta nd th e iss u es we a re a ble to p re pa re p la ns p rom o ting o p po rtu n ities fo r s us ta in a ble d rain ag e s ys tem s in o rde r to d e live r th e b es t p oss ible s e rvice fo r o u r cu s tom e rs b a la n ced a g ains te n viro nm e n tal n e eds a n d cos ts
S usta inab le d ra inage op tions W e b e lie ve o u r a pp ro a ch re p res en ts go o d p ra ctice fo r th e m a n ag em en t o f s u rfa ce wa te r w h ich is to d ea l w ith th e s u rfa ce wa te r as c los e to s ou rce as p oss ib le A w id e ra n g e o f p o te n tial o p po rtu n ities a re b ein g id e n tifie d in c lu d in g lo ca l a n d s tra te gic o p tions
S tra te g ic o p tions a re typ ica lly la rg e r th a n th e lo ca l on es a nd in c lu d e fe a tu res s u ch as a re as o f la nd w h ich w o uld b e a llo we d to flo o d d u rin g he a vy ra in (s a crific ial s to ra g e ) a n d p e rm a n en t w e tla nd fe a tu res
L o ca l op tio ns d esp ite b ein g sm a lle r th a n th e s tra te gic o n es w ill s til l p la y a ke y ro le in th e p ro vis io n o f s us tain ab le d ra ina g e Th e ir n a tu re m e a ns de p lo ym e n t co u ld be m o re w id es p re a d th a n s tra te gic o p tions fe a tu res su ch as w a te r b u tts ra in g a rde ns a nd p e rm e ab le pa vin g co u ld b e re la tive ly e a s y to fi t in to
Figure 6 Newsletter promoting urban drainage partnership working
Principle Two Uncertainty
Strategies should explain the reliability of data and knowledge about current and future performance of drainage systems They should explain what steps are planned to improve this understanding and how this will benefit customers Where future performance is uncertain (eg because of sensitivity to climate change) they should explain how adaptive approaches will be used to ensure outcomes are met The uncertainty in predictions of future risks should be recognised and accommodated within decision making
205240txt012|May 2013
18
Drainage Strategy Framework
221 Recommended good practice
No Good practice Example references
1 Data analysed and used in the development of the strategy related to asset location dimensions condition failure and flood and pollution incidents should be assigned a confidence grading The confidence grading should be related to its accuracy completeness compatibility credibility and currency
Models used to predict blockages and collapses flooding locations polluting discharges and water quality impacts should be assigned a confidence grading based on their accuracy completeness compatibility credibility and currency
Model predictions should be assigned a confidence grading depending on the confidence in the model and whether it is being applied outside of its verification range (eg for extreme events or for atypical geographies)
The purpose of confidence grading data and model results used in strategy setting is to understand the likelihood that outcomes will be achieved in a cost efficient manner Where the outcomes remain uncertain knowledge of data confidence can be used to target improvement programmes
SRM5 (S3‐03‐17) refers to Ofwatrsquos method for recording the reliability and accuracy of regulatory data in bands A to D
The SWMP guidance (Section 319) describes an alternative system of grading data and model results
2 Use the Drainage Strategy to justify data and model improvement programmes This should be focussed on areas where risks are currently (or predicted to be) high and uncertainty in data or models reduces the ability to determine robust operational or capital solutions Poor model verification in high risk areas would be an indicator that model improvements were required
CIWEMrsquos urban drainage group has published a series of guides on hydraulic and water quality modelling They discuss model calibration verification and uses
SRM5 (S3‐04) describes how to determine where the current assessment of risk is sufficient to proceed or whether data and models should be improved
3 Improve understanding of network performance (and improve models) by using long term flow and level monitoring on sewers and CSOs
Yorkshire Water discusses its CSO
monitoring programme here
4 Demonstrate how the uncertainty in both the underlying datamodels and in the future projections is addressed in options appraisal Consider if this should be done implicitly (eg through choosing conservative assumptions) or explicitly through the use of sensitivity analysis or scenario testing
Treasury Green Book supplementary guidance illustrates how to accommodate climate change uncertainties
205240txt012|May 2013
19
Drainage Strategy Framework
No Good practice Example references
5 Population growth new homes and businesses climate change and urban creep combine to make the future highly uncertain but will almost certainly increase flooding and pollution risks from drainage systems Use the Drainage Strategy to explore different scenarios (combining the impact of these drivers) for a near term (le 10 years) and future (ge 30 years) epoch
For example combine modest growth and slight climate change (a low impact case) and contrast with high growth and significant climate change (a high impact case) Where the location of significant new development is unknown include scenarios accommodating different possibilities
Running multiple scenarios is time consuming and costly A risk based approach should be adopted to focus efforts where flooding and pollution risks are especially sensitive to changes in demand
UKWIR has published research on accounting for climate change35 and urban creep36 in sewerage planning together with more general advice on accommodating climate change in water asset management planning37
Ofwat has published research38
predicting the combined impacts of climate change urban creep and development on a national basis
6 In the face of significant uncertainties about future demands on the drainage system and their consequences the Drainage Strategy should identify low‐regrets interventions (ie ones that are robust no matter what the future holds) and ensure that solutions can be adapted if greater certainty is achieved For example through quickening the pace of SuDS retrofit activities or using (previously identified and secured) land to extend underground storage facilities Strategies which remove surface water from sewerage networks provide lsquoheadroomrsquo for unpredictable increases in demand from population and climate change
Designing Resilient Cities A guide to good practice DR Lomardi et al HIS BRE Press
7 Post project appraisal and cost monitoring should be used to capture real costs and performance so that Strategies can be updated and improved with latest information It is especially important to collate and understand the whole life costs of new technologies where industry understanding is currently poor
35httpwwwukwirorgreports03‐cl‐10‐09042794658901799019890198 (poundpound) 36httpukwirforefront‐librarycomreports10‐wm‐07‐1493273 (poundpound) 37httpukwirforefront‐librarycomreports12‐cl‐01‐1694816900019015590145901409465890155 (poundpound) 38httpwwwofwatgovuksustainabilityclimatechangerpt_com201106mottmacsewerpdf
205240txt012|May 2013
20
Drainage Strategy Framework
222 Good practice example ndash Severn Trent Waterrsquos MICAS
Severn Trent Water has developed a process to measure confidence in hydraulic models of sewer systems Modelling Investment Confidence Assessment Scoring (MICAS) was developed to provide an objective evaluation of model confidence It uses information stored in the hydraulic model about the provenance of each data element and the quality of model verification Before the approach was developed the assessment of lsquofitness for purposersquo of models was subjective and based on modellers judgment This was not always reliable and certainly not repeatable and transparent MICAS provides an objective assessment of hydraulic model quality which can be used to inform its use and prioritise improvements to input data and model verification
Figure 7 and Figure 8 illustrate how an understanding of model confidence from the MICAS assessment (right hand side images) can be used to interpret predictions of flooding (left hand side images) In Figure 7 areas at predicted high risk of flooding (red in the left hand side image) are shown to be in high confidence areas of the hydraulic model (green in the right hand side image) In contrast in Figure 8 areas at predicted high risk of flooding (red in the left hand side image) are shown to be in poor confidence areas of the hydraulic models (orange in the right hand side image) In the latter case this information is used to identify where further model improvements would be beneficial
Flood Risk MICAS
Figure 7 Modelled flood risk and MICAS confidence scores (high model confidence)
Flood Risk MICAS
Figure 8 Modelled flood risk and MICAS confidence scores (lower model confidence)
205240txt012|May 2013
21
23
Drainage Strategy Framework
Principle Three Risk Based
Strategies should be risk based This means that planning operational and investment activities should be based on consideration of the probability and consequence of inadequate drainage function (risks) as these relate to the achievement of measures that demonstrate delivery of outcomes A risk based Strategy ensures that investment is made where risks are the greatest
To aid communication risks should be visualised through maps and plans (Figure 10 is an example) To aid risk assessment risks should be monetised combined and predicted into the future To aid options appraisal the impact of interventions on the level of risk should be predicted
The approach to Drainage Strategy development should be risk based itself The degree of detail included should be related to an understanding of the overall level of risks in the catchment now and in the future
231 Recommended good practice
No Good practice Example references
1 Determine where a Drainage Strategy is required by combining current performance with external influences likely to result in deteriorating performance This stage requires no modelling or detailed assessment On a catchment‐by‐catchment (drainage area) basis understand current risks by collating data on current performance eg blockages collapses pumping station failures pollution incidents CSO spills storm tank spills internal flooding incidents external flooding incidents and infiltration rates Relate these risks to performance indicators and the achievement of outcomes Combine with information about known growth rates predictions of urban creep quantity of newly adopted lsquoprivatersquo sewers surface water flooding risks (eg from flood map for surface water) WFD water body status and bathing water status Prioritise catchments with high current risks andor factors suggesting that risks are likely to worsen significantly in the future Consider normalising scoring method for size of catchment (eg by unit area or unit length of sewer) Consult with stakeholders to confirm correct prioritisation Commence with development of Drainage Strategies for the highest ranked catchments Periodically revisit prioritisation (updating with new data) to check that priorities are still correct
The initialisation stage of a Sewer Management Plan (SMP) (described in SRM5) considers how a risk assessment can be used to prioritise which spatial units (eg catchments) should be prioritised for a SMP study
2 Visualise catchment risks (from 1) to illustrate and explain to partners the reasons for prioritisation Accommodate their views amp consider changing prioritisation to aid wider drainage planning requirements (eg increase prioritisation of a catchment with significant surface water flooding problems where close collaboration between water and sewerage company and LLFA will benefit the community)
205240txt012|May 2013
22
Drainage Strategy Framework
No Good practice Example references
3 Clearly relate sewerage risks to the performance indicators that will be used to measure progress towards achieving outcomes eg relate blockage rates to flooding and pollution incidents eg relate increase in flows to increased CSO frequency breaches of permit conditions and deterioration in receiving water quality Adopt a sourcendashpathway‐receptor model and workshop techniques to ensure that cause effect and consequences are fully captured Use performance indicators as the basis for a comprehensive risk assessment that considers likelihood (frequency) and consequence (extent degree and duration of impact) of failure expressed as risk scores Monetise risks in GBP (pound) to align with principle four (whole life costs amp benefits) Use (verified) predictive models to understand near term (lt10 years) and long term (gt30 years) risks The latter to align with principle four (whole life costs amp benefits) Align complexity of method with level of risk recognising the needs of partners eg use complex 2D flood routing models to ascertain (with greater certainty) flood mechanisms and damages where the quantity and frequency of flooding is high and interventions will be complex and costly Elsewhere more simple approaches are appropriate eg use complex UPM3 water quality modelling methods where compliance with river standards or discharge consents is already failing or is expected to do so Elsewhere more simple approaches are appropriate Combine risk scores from different risks to describe the total level of risk in a catchment Use visualisation techniques to communicate combined level of risk Combine analysis from hydraulic blockage and asset deterioration models on a catchment basis In hydraulic analysis consider flooding performance for rainfall events beyond the usually provided standard of protection to understand performance in extreme events in support of partners (especially LLFAs) and in search of cost beneficial interventions at a higher standard than normal
SRM 5 (S3‐03) details approaches to simple and more complex approaches to risk assessment that are consistent with CMPCF guidelines
4 Be alert to interactions between sewer networks and wastewater treatment plans eg by modelling the impact of changing sewer flows on wastewater treatment worksrsquo performance and costs Consider combined impact of different catchments on a single or linked water body (eg an inland river bathing water or shell fishery)
UPM3 guidance discusses approaches to understanding these interactions and applying more complex water quality impact models
5 Establish systems and apply methods to predict how interventions can reduce risks eg how a targeted and pro‐active maintenance can reduce the occurrence of sewer blockage and flooding from lsquoother causesrsquo eg how reducing infiltration can reduce CSO spills eg how reducing connected impermeable area can reduce sewer flooding
205240txt012|May 2013
23
Drainage Strategy Framework
232 Good practice example ndash United Utilities risk assessment
United Utilities has demonstrated a robust risk based approach in the development of sewerage management plans used for long term planning across their area of operations
Hydraulic models were applied in 235 catchments and configured to look at future performance and to evaluate the consequences of inadequate capacity Starting from a baseline of 2010 versions of the models were built for 2020 and 2036 epochs The following model input parameters were adjusted population water consumption infiltration planned development known sewerage improvement projects urban creep rainfall (for climate change)
Two‐dimensional (2D) modelling was used to consider the consequences of sewer flooding resulting from the changes made to reflect the future operating environments As well as the impact on homes and business (from internal and external flooding) the flood risk to critical infrastructure was also considered The operation of CSOs was considered by computing the annual spill volume duration and frequency
Finally predictions of the likelihood and consequence of sewer failure were added taking account of sewer material age and the incident records relating to similar assets
All these data were combined and weighted to generate a Sewer Management Plan (SMP) Risk Score for each length of sewer The process is illustrated in Figure 9
Figure 9 United Utilitiesrsquo process for calculating risk score in sewerage catchments
205240txt012|May 2013
24
Drainage Strategy Framework
Risk scores were summed spatially and monetised so that high priority locations could be identified Mapping and visualisation were used to communicate the results of this assessment priority areas for further investigation and how risks change through time (Figure 10)
Figure 10 Visualisation of sewerage risks
233 Good practice example ndash Northumbrian Water risk assessment
Northumbrian Water completes an annual assessment of hydraulic capacity in its sewerage network at the drainage area scale Its approach does not require hydraulic models to have been completed and yet can reliably highlight areas of under‐capacity in need of further investigation through more detailed analysis including hydraulic modelling New and emerging risk areas can also be identified by applying data for population growth which occurs through development lsquoWhat ifrsquo scenarios can be run to test when capacity limits may be overcome and flood risks potentially set to increase It demonstrates good lsquorisk basedrsquo planning principles because it shows the drainage planner where more detailed analysis is warranted
The approach uses the following data from company records population connected to sewer P water consumption rate G (lhd) trade discharge E (ls) pipe diameter and gradient pipe connectivity CSO consent pass forward rate (ls) pumping station rate (ls) sewage treatment flow rate (ls) A wastewater dry weather capacity map calculates pipe full capacity dry weather flow (PG+E+I) and Formula A flow for fully combined (1360P+2E+DWF) and separate (4PG+3I+E) areas of the network Infiltration (I) is assumed to be 50 PG +E
205240txt012|May 2013
25
Drainage Strategy Framework
A theoretical assessment of network capacity is then calculated by comparing Formula A with pipe full capacity flow consent values at CSOs and wastewater treatment works and pumping rates This determines areas of the network with a capacity shortfall with a potential capacity shortfall and with no capacity shortfall
When run across the whole company area approximately 100 out of 500 drainage areas were found to be under capacity Over 60 of these areas had recorded sewer flooding incidents In over 300 drainage areas there was no forecast capacity shortfall Only 7 of these drainage areas had recorded sewer flooding incidents Overall the system proved to be very reliable at predicting drainage areas likely to have sewer flooding problems because of sewer under‐capacity
In under capacity drainage areas an intermediate (hydraulic model based) assessment is then carried out Figure 11 shows the results thematically mapped for an example drainage area Red areas are predicted to have a very high risk of sewer flooding Yellow and green areas are predicted to have a low risk of sewer flooding
Figure 11 Example of a drainage area capacity map
205240txt012|May 2013
26
24
Drainage Strategy Framework
Principle Four Whole Life Costs and Benefits
Strategies should be informed by consideration of whole life costs and benefits They should promote a series of interventions which in view of the quantified uncertainties are most likely to result in performance indicators which demonstrate the achievement of outcomes at lowest cost to customers and the community more widely
Costs relate to capital and operational expenditure to deliver interventions and the monetised impacts of drainage failures such as flooding and pollution
Benefits relate to the reduction in risks from drainage failures such as flooding and pollution but should also include wider societal impacts such as those calculated using a lsquoPayments for Ecosystems Servicesrsquo approach
When considering the lsquowhole lifersquo the strategy should consider climate population and asset deterioration trends These are likely to increase risks over the long term if no interventions are made The strategy should state lsquowhatrsquo should be done but also broadly lsquowhenrsquo and in what sequence interventions should happen
241 Recommended good practice
No Good practice Example references
1 Predict risks into the future for at least two epochs le10 years (to understand what the company needs to do now and how this fits with longer term outcomes) and ge30 years to understand long term needs in light of changing population and other pressures
Account for the following changes in demand
bull Growth ‐ new homes and businesses
bull Urban creep ndash uncontrolled addition of connected impermeable area
bull Climate change ndash affecting design events (flood predictions) time‐series (CSO and treated effluent quantities) river flows and temperatures
bull Infiltrationexfiltration ndash through deteriorating sewer condition
bull Dry weather flows ndash through changes in water consumption rates
2 Combining monetised risks (associated with sewerage failures) determine whole life costs for a lsquodo nothingrsquo scenario (ie no interventions)
Include costs associated with electricity consumption (in the network and at the wastewater treatment works) and CO2 emissions
UKWIR will publish in 2014 a revision to their Long Term Least Cost Planning for Wastewater Supply‐Demand
guidance This may provide tools and methods for expressing costs and benefits to support the development of a Drainage Strategy
205240txt012|May 2013
27
Drainage Strategy Framework
No Good practice Example references
3 Test intervention strategies which keep performance indicators on track to deliver outcomes by adding capacity (supply) reducing flows (demand) or altering operational regimes
Include the costs of interventions and the benefits of reduced risks to inform selection of the most cost beneficial strategy over the whole life
Have regard to the timing of interventions recognising that uncertainty may require low‐regrets (insensitive to uncertainty) solutions and that delaying major interventions may be more affordable and attractive in the short term Discounting should be used to compare the costs and benefits of interventions occurring at different times
Recognise that some interventions will be obligatory and defined (eg maintenance of a spill frequency standard at a CSO) whilst others will be more discretionary focused on achieving outcomes rather than specific outputs
SRM5 (Section 8) defines and contrasts cost benefit analysis cost effectiveness analysis whole life cost analysis and risk cost benefit analysis
HM Treasury Green Book39
sets out a framework for the appraisal of long term projects which can be applied to the development of a Drainage Strategy
4 Donrsquot at first be concerned with the distribution of costs and benefits between partners who may be sharing costs Identify the most cost beneficial solution first and then debate and agree an equitable sharing of costs
Give equal weighting to OPEX (operating expenditure) and CAPEX (capital expenditure) costs so not to cause bias towards capital intensive solutions Properly consider the costs and benefits of pro‐active maintenance regimes and campaigns to influence customers to reduce fats oils and greases (FOG) build‐ups and the misuse of sewers
Consider the affordability of solutions the impact on customersrsquo bills and the resources of other organisations to play their part
UKWIR research outputs40 in 2013 (SW01) will provide a framework for making a business case for separating storm water from combined sewers
5 Where interventions include the provision of green space public amenity and improved habitats then Payment for Ecosystem Services approaches should be used to identify further monetised benefits in the appraisal Customers should be consulted to help value these benefits
Supplementary Green Book41
guidance describes methods for accounting for environmental impacts including the ecosystems approach
39 httpwwwhm‐treasurygovukdata_greenbook_indexhtm 40 httpwwwukwirorgpublishorsystemcomponent_viewaspLogDocId=96116 41 httpwwwhm‐treasurygovukdaccounting_environmental_impactspdf
205240txt012|May 2013
28
Drainage Strategy Framework
242 Good practice example ndash Severn Trent Water making the case for surface water separation in Stoke-on-Trent
In this example42 Severn Trent Water compared alternative ways of addressing sewer flooding problems by looking at a range of costs and benefits not all of which were directly associated with its specific responsibilities as a water and sewerage company Whilst the example does not express a monetised value for all costs and benefits over the whole life it does illustrate the types of factors which could be included in an appraisal of this type scaled to address problems at a catchment level It also demonstrates how working collaboratively can help identify solutions which are cost‐beneficial for the community at large
In an area of Stoke served by a combined sewer system five properties were at risk from sewer flooding in cellars for events equal to and less frequent than the 1 in 10 year probability A conventional sewer pumping station based solution was presented as the standard option
However a nearby former hospital site was also undergoing re‐development which would result in reduced runoff to the combined sewer The new drainage regime in the redevelopment site was sufficient to remove the flood risk at the five properties (this was a do nothing strategy)
A third option completely separated the development site runoff from the combined sewer and also addressed local flood risk issues nearby The solution required a new storm sewer and a network of swales and other SuDS features connecting with an ordinary watercourse
Table 1 illustrates how costs and benefits were compared across the three alternative strategies Each provided the same benefit in terms of the number of homes (5) relieved from sewer flooding The novel SuDS and surface water management solution additionally gave local flood risk relief to 3 further properties The separationSuDS strategy came at a higher capital cost but delivered greater social cost benefits savings in annual operating costs and a bonus improvement water quality (because of reduced CSO spill volume) Severn Trent selected the separation SuDS solution because the higher capital costs were offset by other benefits
Table 1 Costs and benefits of drainage improvements in part of Stoke-on-Trent
Do nothing Standard option
SuDS
Sewer flooding benefits 5 5 5
Other flooding benefits 0 0 3
Change in runoff to combined sewer (m3year) 0 0 ‐40000
Estimated cost (pound) 0 168000 419000
42httpwwwciwemorgmedia695460Paper203_Creating20Sewer20Capacity_Presentation2 0by20Mike20Woodpdf
205240txt012|May 2013
29
Drainage Strategy Framework
Do nothing Standard option
SuDS
Social Cost Benefit (pound) 16000 5000 51000
Change in electricity costs (poundyear) 0 +75 ‐525
Programme impact (years to deliver solution) + 4 0 +4
CSO spill volume (m3 in 1year event) +298 0 ‐397
243 Good practice example ndash New York City comparison of grey and green infrastructure drainage strategies
This example is taken from New York in the United States of America Itrsquos an illustration of how whole life costs have been compared for alternative strategies to solve urban drainage issues on a mega‐city scale The key data are summarised in Table 2
Table 2 Comparing drainage strategies in New York
Grey Strategy
Green Strategy
CSO spill volume reduction (billion gallons year)
101 122
Wider benefits over 20 years ($ million) 0 139 to 418
Whole life costs over 20 years ($ billion) 68 53
The information is taken from the New York City Green Infrastructure Plan43 produced by the Mayorrsquos Office in 2010 The Plan (and recent updates) provides a comprehensive evidence base around costs and benefits of different approaches to address the cityrsquos drainage problems It is therefore an excellent example of how drainage strategies can be described in plain language for a non‐specialist audience concerned with their environment and the cost of providing infrastructure to enhance it
It is becoming commonplace for North American cities (eg Portland and Philadelphia) to address the issue of frequent combined sewer overflow (CSO) operation by using a combination of grey infrastructure (sewers) and green infrastructure (sustainable drainage systems) The wider health
43 httpwwwnycgovhtmldephtmlstormwaternyc_green_infrastructure_planshtml
205240txt012|May 2013
30
25
Drainage Strategy Framework
and ecological benefits of green infrastructure approaches and the reduced reliance on materials and energy are attractive to utility planners and cities alike
New York has 422 CSOs and an agreed Long Term Control Strategy to significantly reduce the impact wet weather discharges have on aquatic systems throughout the city Annual discharges are currently (2010) estimated to be 30 billion gallons (114 million cubic meters) per year Building on existing and committed new sewer plans an agreed grey infrastructure based strategy to this problem is set to reduce these discharges to 198 billion gallons per year (a 34 reduction) by the 2030s An alternative green infrastructure approach based around intercepting the first inch (25mm) of rainfall across 10 of the impermeable city area by 2030 is predicted to reduce CSO spills to 179 billion gallons per year
Planners have calculated that the whole life costs after 20 years of the grey infrastructure solution will be $68 billion (2010 prices) compared to the green infrastructure whole life costs of $53 billion The green infrastructure strategy reduces CSO spills by more than the grey alternative for $15 billion less in terms of whole life cost Further planners have calculated that New Yorkers will benefit by up to $41844 million (accumulated over 20 years) in additional benefits associated with lower energy bills from control of urban heating increased property values and improved health
Based on this analysis New York City has committed itself to an aggressive green infrastructure based runoff control strategy to provide long term reductions in CSO spills The plan is to achieve interception of 15 of impermeable area by 2015 4 by 2020 7 by 2025 and 10 by 2030
Principle Five Live Process
The Strategy should be adaptable and periodically reviewed Whilst outcomes are expected to be relatively stable over time the pace at which the Strategy delivers outcomes will be linked to volatile influences (like climate and population change) and to the decisions made at each price review about the priorities for the following period The Strategy should be reviewed at regular intervals to reflect investments already made the changing priorities of the water and sewerage company and partners and the presence of emerging risks The review is also an opportunity to report drainage catchment performance relative to performance measures designed to monitor progress towards achieving outcomes
44 Estimated using methods from the New York Municipal Forest Resource Analysis (MFRA) prepared by the US Dept of Agriculture
205240txt012|May 2013
31
Drainage Strategy Framework
251 Recommended good practice
No Good practice Example references
1 Regularly repeat screening exercise to determine catchments requiring a Drainage Strategy and modify programme of Strategy development accordingly
Check for changes in measured rates of flooding and pollution incidents blockages collapses pumping station failures etc
Check for changes in extent and location of new development
Check for activities being undertaken by partners (eg redevelopment urban realm improvements and flooding and pollution management activities)
SRM5 illustrates how improved and updated knowledge of system performance should be applied to establish Strategies
2 In lsquolive Strategiesrsquo repeat risk assessment when data and models improve and adjust confidence scores accordingly
Confirm that Strategy will still achieve performance indicators and outcomes at least cost Revise Strategy as necessary
3 Periodically refresh Strategy accommodating impact of interventions already delivered using re‐verified predictive tools as appropriate
Confirm that Strategy will still achieve performance indicators and outcomes at least cost Revise Strategy as necessary
Triggers for a wholesale review of the Strategy are likely to be significant changes to the location or extent of planned development
4 Monitor report and share (with partners) the measures used to demonstrate delivery of outcomes Example measures may include the number of properties which experience sewer flooding the number of properties at risk of flooding the number of properties at risk from sewerage asset failure risk indices that capture both the probability and consequence of failure customer satisfaction with regards to clean rivers and beaches the number of pollution incidents the frequency of combined sewer overflow operation and compliance with discharge permit conditions
252 Good practice example ndash Thames Water live DAP
Thames Water has initiated a DAP (drainage area plan) Live approach Itrsquos a good example of how companies are continuously monitoring and updating the status of drainage area risks It provides a lsquoliversquo snapshot of the current health of all drainage areas in Thames Waterrsquos region allowing real time planning as part of a strategic approach It enables drainage planners to view the effectiveness
205240txt012|May 2013
32
Drainage Strategy Framework
of intervention strategies and compare incident rates across varying geographies and development types in the Thames Valley
DAP Live will be available for all catchments in the Thames Water area thus enabling
bull high level monitoring of risks across the business bull a live and strategic review of catchment performance bull prioritisation of catchments based on risk and bull an ability to share data with partners collaborating in drainage planning and improvements
Figure 12 illustrates the types of data managed through the DAP Live system These include asset data political and drainage boundaries environmental data operational data property amp growth data and modelling data As new data become available the DAP Live system is updated so that drainage planners have the most current view on emerging risks and issues
Asset data
Operational data
Property and growth data
Modelling data
Environmental data
Boundaries (SDACs operational political)
Figure 12 Data types held in the DAP Live system
Figure 13 illustrates how the system can provide analysis at a variety of scales from local authority boundaries sewage treatment works catchments drainage areas or a regular grid
205240txt012|May 2013
33
Drainage Strategy Framework
NE PROVINCES
WESTERN PROVINCES
NE LONDON bull Ops areas local W LONDON
SE LONDON authorities Large TIDWORTH SE PROVINCES
bull STW Catchments
bull Drainage areas(SDACs)
bull Regular grid Small
Figure 13 DAP Live reporting performance at different scales
205240txt012|May 2013
34
Drainage Strategy Framework
253 Good practice example ndash Wessex Water Water live data
Wessex Water is regularly using data geospatially to proactively identify and respond to risk Theirs is a good example of how data can be used to provide an adaptable approach that is regularly reviewed to plan investment
The risk‐based and live approach uses a set of likelihood and consequence models which are built up from all currently available data asset data (eg CCTV data material age) operational data (eg flooding and pollutions incidents) and information (eg locality near hospital or downstream of an overflow) All these data are collated for the entire Wessex region updated regularly and analysed geospatially
Figure 14 Sewer risk scores presented in a risk matrix and geospatially
This allows a risk score (Figure 14) to be calculated for each mapped sewer length which directs investigation more efficiently by allocating each mapped sewer a planned CCTV inspection date
This risk‐based approach has been successful in targeting problematic sewers increasing identification rates threefold Density analysis is performed using asset failure and operational information which allows planning of both proactive structural and operational investment
Proactively found structural issues are far more cost effective to repair before failure and can also prevent serviceability issues
205240txt012|May 2013
35
f
DDrainage Strateegy Frameworrk
Figgure 15 Hotsppot analysis
Thhe hotspot annalysis (Figuure 15) showss where operrational clustters have beeen calculatedd This hootspot analyssis is made aavailable on tthe Wessex WWater corporrate GIS to a llow operati onal staff to target their effforts to mitiggate against ffurther repeaat incidents AAdditional innformation ffrom asset annd operationnal activities ccan be addedd regularly too the databasses which drrive the mod els enabling rissk scores to bbe kept as livve as require d
226 Prrinciple Sixx Innovativve and Susstainable SSolutions
Thhe Drainage Strategy Fraamework proomotes the fuull evaluationn of alternatiives to tradit ionally enngineered sewwerage soluttions to test wwhether thesse offer loweer whole life ccost options or better reesponses to uuncertainty It is anticipaated that draainage solutioons of the futture will be ddifferent froom the ones we are usedd to
Thhese should iinclude (at leeast at a highh level) real ttime control storm waterr retrofit techhniques edducation to eenable custommers to changge behaviou r enhancingg incentives for customerss to reduce suurface water flowing to seewers and innnovative pe rmitting arraangements a cross drainagge networks annd sewage tr eatment worrks Water annd sewerage companies sshould continnue to revieww and deevelop other innovative ssolutions
Foor example wwhere a commpany may hiistorically haave preferredd to tackle seewer floodingg or coombined sewwer overflow pollution byy increasing iits undergrouund equipmment to store mmore rainfalll duuring stormss it might connsider other options in fuuture ndash such as working wwith custommers to mmanage the raainfall close tt eventing it foorm enteringg the sewer syystem o source pre
2205240txt012|Mayy 2013
36
Drainage Strategy Framework
261 Recommended good practice
No Good practice Example references
1 Use cost‐benefit methods to demonstrate that innovative and sustainable solution types provide best value for customers and the wider community
UKWIR will publish new research and guidance in 2013 addressing active control and storm water removal demonstrating how these technologies can be justified and included within Drainage Strategies
2 Consider integrated water resource management Work with partners (especially developers and local authorities) to examine whether use of stored stormwater reduces potable water consumption AND need for capacity in sewers
CIRIA has published a scoping study for water sensitive urban design45 in the UK
3 Consider a mix of conventional and new technologies using more adaptive approaches as low‐regrets responses to uncertainty eg prevent current sewer flooding with underground tank storage but address future risks (worsened by climate change) with retrofit SuDS implemented progressively
CIRIA has published lsquoRetrofitting to manage surface waterrsquo46 a comprehensive guide to planning and delivering this type of project
4 Use carbon accounting methods to compare embodied and emitted carbon in alternative intervention strategies so that these impacts are accounted for in whole life costs
Consider the benefits of surface water removal on the costs (including carbon) of pumping and sewage treatment
UKWIR47 has and continues to publish detailed guidance on carbon accounting for water and sewerage company use
45httpwwwciriaorgserviceresearch_informationAMContentManagerNet ContentDisplayaspxSection=research_informationampContentID=23581 46httpwwwciriaorgSERVICEHomecoreordersproductaspxcatid=5ampprodid=1909 47httpukwirforefront‐librarycomreports08‐cl‐01‐6923419000190269902659465890269
205240txt012|May 2013
37
Drainage Strategy Framework
No Good practice Example references
5 Where interventions include the provision of green space public amenity and improved habitats then Payment for Ecosystem Services approaches can be used to claim further monetised benefits in the appraisal Customers should be consulted to help value these benefits
The Environment Agency will publish data in 2013 on costs and benefits of retrofit stormwater projects to promote understanding and uptake
6 Share data within the industry on innovative solutions to increase knowledge of new technology and SuDs approaches
EA retrofitting SuDs costs and benefits database48
accommodating data from Ofwat AMP5 SuDS pilot initiative and other examples
262 Good practice example ndash Welsh Water surface water reduction and removal strategy for Gowerton and Llanelli
Dŵr Cymru Welsh Water and partners are applying innovative storm water removal methods to address capacity problems in the sewer network in Gowerton and Llanelli49 (population 140000) Current under capacity leads to localised sewer flooding and excessive combined sewer overflow (CSO) spill to the Burry Inlet a protected shellfish water and special area of conservation The capacity problems in the system were a concern for the Environment Agency (Wales) and there was a risk of widespread restrictions to economic development being imposed Dŵr Cymru Welsh Water Carmarthenshire County Council City and County of Swansea Consumer Council for Water Environment Agency Wales and the Welsh Government all worked in partnership to resolve the situation
A brand new hydraulic model was built for the entire sewerage network with particular attention paid to accurately representing the sources of storm run‐off and infiltration The model was verified against data from flow monitors and observed CSO spill frequencies into the Burry Inlet
To begin with a traditional sewer storage solution was proposed that would result in an average 10 spills a year into the shellfish water from all 90 CSOs in the two catchments Although this reduced spills and dealt with some of the flooding and growth issues the storage requirements would have been unaffordable provide no protection against long term climate change and would not tackle the fundamental problem of too much surface water getting into the combined network
An alternative approach based on the reduction and removal of storm water from the combined sewer system was also developed This was in accordance with Dŵr Cymru Welsh Waterrsquos Rainscape50 (surface water elimination and reduction) strategy To identify areas with the most
48httpevidenceenvironment‐agencygovukfcermenDefaultHomeAndLeisureFloodsWhatWereDoingIntoTheFutureScience ProgrammeResearchAndDevelopmentFCRMProjectaspxProjectID=15515be8‐bbed‐4204‐ae56‐3e810ba47694ampPageID=56bad68e‐dcb1‐4bf8‐84cc‐cbfd03ab63a2 49 httpwwwciwemorgmedia674511Paper20820Stephen20Ollierpdf 50httpwwwdwrcymrucom_libraryleaflets_publications_english
205240txt012|May 2013
38
Drainage Strategy Framework
potential for effective storm water removal a flowareaflooding thematic map was developed This was used to focus attention on areas which would deliver the most benefit if storm water removal was carried out These areas are coloured red in Figure 16
Figure 16 Thematic map showing areas of maximum potential for storm water removal
The following interventions (181 in total) were combined into single strategy to be delivered in phases by 2015 2020 and afterwards
bull The management of surface water through swales basins and soakaways rather than through combined sewers resulting in new amenity and ecological areas within the built‐up environment
bull Implementing smarter flow control to better use existing storage and conveyance assets bull Relining of sewers to prevent groundwater ingress bull Removal of land drainage connections to sewers bull Household rainwater harvesting retrofit schemes
surface_water_management_strategypdf
205240txt012|May 2013
39
Drainage Strategy Framework
Figure 17 is an artistrsquos impression of what one of the sustainable urban drainage system solutions may look like
Figure 17 Example retrofit SuDS solution proposed for Gowerton and Llanelli
Modelling has demonstrated that the alternative strategy will achieve the same CSO reduction benefit as the storage strategy together with flooding improvements and additional less tangible benefits at significantly lower cost than the traditional sewer storage solution
Figure 18 illustrates the dispersed nature of solutions identified for central Llanelli
Figure 18 Water sensitive urban design interventions planned for central Llanelli
205240txt012|May 2013
40
Drainage Strategy Framework
Appendix A
Glossary
205240txt012|May 2013
Drainage Strategy Framework
Appendix A Glossary
CAPEX Capital expenditure Appointed water and sewerage companiesrsquo spending on new replacement or refurbished capital assets such as construction or buying machinery
CIWEM Urban Drainage Group (WaPUG) A group of the Chartered Institution of Water and Environmental Management supporting professionals working in urban drainage
Combined Sewer Overflow (CSO) The discharge of untreated sewage diluted with storm water into rivers and the sea CSOs occur during heavy rain and are necessary to reduce the risk of sewer flooding The physical overflow structure is also called a CSO
Common Framework for Capital A planning approach developed for the water and Maintenance Planning sewerage companies in 2002 which provides a robust basis
for assessing future capital maintenance needs The approach is consistent with the needs of Ofwat
Defra The Department for Environment Food and Rural Affairs The Government Department with responsibility for water flooding and water quality in England
Drainage Area Plan (DAP) A detailed plan for a drainage catchment that prioritises a list of interventions based on risk using an approach established in the WRc Sewerage Rehabilitation Manual This approach has been succeeded by Sewerage Risk Management which guides the preparation of Sewerage Management Plans (SMP) Companies vary in how they prepare DAPs or SMPs (or their equivalents) following the general principles that have been established
Drainage Strategy Developed by water and sewerage companies to demonstrate how outcomes will be delivered in drainage catchments over the long term Drainage Strategies will use the information developed in producing a DAPSMP and if a drainage strategy has been produced this should be the starting point in producing a more detailed DAPSMP should this be required It is likely that the activities required to prepare DAPSMP and Drainage Strategies may overlap Drainage Strategies might not refer to specific interventions but instead outline a general approach
Drainage Strategy Framework Guidance to describe the contents and intention of Drainage Strategies
205240txt012|May 2013
Drainage Strategy Framework
Flood Risk Management Plans Required by the Flood Risk Regulations in Flood Risk Areas by December 2015
Flood Risk Regulations The legislative instrument used to implement the requirements of the Floods Directive in England and Wales
Floods Directive DIRECTIVE 200760EC of the European Parliament and of the Council of 23 October 2007 on the assessment and management of flood risks
Lead Local Flood Authority (LLFA) The Shire County or unitary authority with responsibility for managing local flood risk
Local development plans Developed by planning authorities to explain where and what type of development (new homes and businesses) will occur within their area They are required to explain water infrastructure needs to support this development
Local Flood Risk Management Strategy Developed by the Lead Local Flood Authority to explain (LFRMS) how local flood risk will be managed by the Authority and
in partnership with others
Natural Resources Wales From 1 April 2013 Natural Resources Wales (NRW) a new body formed by the Welsh Government will take over the functions previously carried out by the Environment Agency (EA) in Wales alongside those of the Forestry Commission Wales and the Countryside Council for Wales
Ofwat The Water Services Regulation Authority ndash the economic regulator of the water and sewerage companies of England and Wales
OPEX Operating expenditure Appointed water and sewerage companiesrsquo day‐to‐day spending on running the services for example staff costs and power This is likely to include investment in joint projects that do not create or relate to an asset that the company solely or jointly owns
Outcomes Outcomes are the higher level objectives that a companyrsquos actions are intended to deliver A companyrsquos outcome should reflect its customersrsquo priorities identified through appropriate customer engagement and deliver the best long‐term sustainable solution for customers and the environment An outcome may not be bound by a single price control period and should be set in the context of customersrsquo and the environmentrsquos long‐term needs
205240txt012|May 2013
Drainage Strategy Framework
Price Review The process of setting appointed water and sewerage companiesrsquo price limits The next price review will take place in 2014 for the period 2015‐20 Ofwat currently sets price limits every five years
Real Time Control (RTC) Using actuated pumps gates and weirs to actively control flow in sewers Better use can be made of existing infrastructure and links can be made between network treatment and receiving water systems for operational benefits Sometimes referred to as Active Management
River Basin Management (Plans) River Basin Management is a continuous process of planning (to develop River Basin Management Plans) and delivery The Water Framework Directive introduces a formal series of 6 year cycles The first cycle will end in 2015 when following further planning and consultation the River Basin Management Plans will be updated and reissued
Sewerage Management Plan A risk based approach to indentifying investment needs in sewerage systems as described in the Sewerage Risk Management (SRM) approach developed by WRc plc
Storm water retrofit Releasing capacity in sewers by controlling stormwater at the surface using disconnection swales and other sustainable drainage systems (SuDS)
205240txt012|May 2013
We are the Environment Agency We protect and improve the environment and make it a better place for people and wildlife We operate at the place where environmental change has its greatest impact on peoplersquos lives We reduce the risks to people and properties from flooding make sure there is enough water for people and wildlife protect and improve air land and water quality and apply the environmental standards within which industry can operate Acting to reduce climate change and helping people and wildlife adapt to its consequences are at the heart of all that we do We cannot do this alone We work closely with a wide range of partners including government business local authorities other agencies civil society groups and the communities we serve
wwwenvironment‐agencygovuk
Environment Agency National Customer Contact Centre
Telephone 03708 506 506 enquiriesenvironment‐agencygovuk
Ofwat (The Water Services Regulation Authority) is a non‐ministerial government department We are responsible for making sure that the water and sewerage sectors in England and Wales provide consumers with a good quality and efficient service at a fair price
wwwofwatgovuk
Telephone 0121 644 7500 mailboxofwatgsigovuk
Halcrow Group Limited Burderop Park Swindon Wiltshire SN4 0QD
tel 01793 812479 fax 01793 812089 halcrowcom
Halcrow Group Limited is a CH2M HILL company Halcrow Group Limited has prepared this report in accordance with
the instructions of The Environment Agency for the clientrsquos sole and specific use Any other persons who use any information contained herein do so at their own risk

Drainage Strategy Framework
261 Recommended good practice 37
262 Good practice example ndash Welsh Water surface water reduction and removal strategy for Gowerton and Llanelli 38
Appendices Appendix A Glossary
Drainage Strategy Framework
1 Introduction 11 Background and Purpose
Water for Life1 recognised that longer term planning for water and sewerage company drainage infrastructure has had less focus than water supply infrastructure It set out a commitment to ensure a more strategic approach to drainage planning This is important to demonstrate that economic growth is supported the environment continues to be protected and that climate change adaptation2 is planned for appropriately
Since privatisation water and sewerage companies have invested to achieve significant improvements to the environment and the service customers receive notably reducing the number of properties known to be at risk of flooding This investment has been a reaction to the issues inherited at privatisation It is now appropriate to look forward to ensure that water and sewerage companies working together with other partners are able to deliver the outcomes that customers need and want
For the next price review water and sewerage companies will propose a number of high level outcomes that they will deliver An outcome should reflect their customersrsquo priorities identified through appropriate customer engagement and deliver the best long‐term sustainable solution for customers and the environment An outcome may not be bound by a single price control period and should be set in the context of customersrsquo and the environmentrsquos long term needs
Outcomes are likely to be framed at a high level for each water and sewerage companyrsquos area However the way in which these outcomes are delivered in a particular drainage catchment will depend on the characteristics of that catchment and the partners that the water and sewerage companies work with
Companies will set out the measures they will use to demonstrate delivery of outcomes An UKWIR study3 has described example measures that include the number of properties which experience sewer flooding the number of properties at risk of flooding the number of properties at risk from sewerage asset failure risk indices that capture both the probability and consequence of failure customer satisfaction with regards to clean rivers and beaches the number of pollution incidents the frequency of combined sewer overflow operation and compliance with discharge permit conditions3 Most measures are likely to be meaningful at a catchment scale as well as at the overall company level This Drainage Strategy Framework illustrates good practice in how to prepare a Drainage Strategy for a particular catchment that is in line with it delivering its outcomes in that location It is based around established planning approaches and emphasises six key principles It has been designed to be informative and flexible so that it can be applied in different circumstances to suit companiesrsquo needs and customersrsquo expectations Most of the elements of the framework are taken from existing good practice in water and sewerage companies However articulating and communicating a clear Drainage Strategy for an area is not yet common practice By adopting the
1 httpwwwdefragovukenvironmentqualitywaterlegislationwhitepaper 2 Ofwat has published research illustrating the predicted scale of increased sewer flooding risks due to climate change and growth httpwwwofwatgovuksustainabilityclimatechangerpt_com201106mottmacsewerpdf 3 UKWIR has published guidance on Defining and Incentivising Outcomes and Measures of Success httpwwwukwirorgukwirlibrary96066
205240txt012|May 2013
1
12
Drainage Strategy Framework
Framework principles and developing Drainage Strategies water and sewerage companies will be better able to provide greater confidence to all stakeholders that outcomes can be achieved in the long term
A Drainage Strategy should help customers and other stakeholders understand how a water and sewerage company intends to deliver its statutory functions over the long term within a particular area in a sustainable and economic manner The Drainage Strategy should explain how a water and sewerage company will do this in conjunction with other organisations (eg The Environment Agency Natural Resources Wales local authorities highways authorities housing developers)4 and how the company in turn will support these organisations in delivering their own responsibilities as well For example the Drainage Strategy should signal to housing developers and other interested parties how sewerage infrastructure will develop so that they are able to plan accordingly and contribute to economic growth
The Environment Agency Natural Resources Wales and Ofwat expect that Drainage Strategies will be developed (following a risk based approach) in accordance with the six principles in a way that suits local circumstances and customersrsquo expectations In England Defra has described5 the requirement for companies to continue their investment in Drainage Area Plans for the period 2015 to 2020 and subsequent planning cycles so that these can be used as the basis for the development of Drainage Strategies The Environment Agency Natural Resources Wales and Ofwat believe that companies completing Drainage Strategies will be well placed to deliver their long term outcomes
Attributes of a Drainage Strategy
A Drainage Strategy should be accessible and understandable to customers local authorities developers the Environment Agency (in England) Natural Resources Wales and other stakeholders that may be interested in what the water and sewerage company intends to do in the future It will give confidence to all stakeholders that the water and sewerage company will deliver their duty of providing a public sewerage system that will deliver stated outcomes The Drainage Strategy will encourage a more strategic approach that is less reactive and more proactive in providing what customers and environment requires
A Drainage Strategy should normally cover the drainage area containing public sewers serving a single wastewater treatment works although in large cities it may be prudent to sub‐divide into smaller areas Adjacent drainage catchments impacting on the same receiving water ought to be considered together When planning to accommodate growth allow for climate change and maintain or improve water quality (in rivers and the sea) it will often be necessary to consider the interaction of public sewers and wastewater treatment works
A Drainage Strategy should be developed by the water and sewerage company with a primary focus on its network of foul combined and surface water sewers However the company should work with other organisations so that their role in controlling the demand on sewers is confirmed and the company plays its part in the resolution of wider drainage surface water flooding and water pollution issues in the catchment
4 The Environment Agency and Natural Resources Wales already collaborate with local authorities to undertake strategic planning for flood risk management from rivers and the sea (eg through the control of development in floodplains) 5 httpwwwdefragovukpublications20121005pb13829‐statement‐obligations
205240txt012|May 2013
2
13
Drainage Strategy Framework
The following section (13) is provided as a generic illustration of how companies might choose to communicate the process of developing selecting and delivering a Drainage Strategy in a location Full technical analysis and documentation demonstrating how the six principles have been followed neednrsquot be made publically available as this may contain confidential complex and sensitive information It is envisaged that a Drainage Strategy could be communicated within up to 20 written pages depending on size and complexity
Suggested Elements of a Drainage Strategy for Sharing with Partners and the Public
The following is provided as an example of the type of information that could be shared publically to communicate the Drainage Strategy for a catchment
1 Provide a catchment description and map illustrating principal drainage and related water infrastructure (eg larger sewers combined sewer overflows wastewater treatment works rivers and ordinary water courses) Explain how wastewater and stormwater are collected and treated
2 Describe company aims and outcomes and how these relate to the drainage system Indicate the performance measures that will be used to monitor progress towards the achievement of outcomes Report on current and historical patterns in performance measures for the catchment (eg number of flooded properties number of pollution incidents and frequency of combined sewer overflow operation)
3 Summarise the wider drainage issues in the catchment their relation to the companyrsquos assets and the organisations consulted in the development of the Drainage Strategy (eg describe areas of significant surface water flooding)
4 Describe and quantify any pressures in the catchment that will affect the achievement of outcomes ndash eg population change urban creep new development climate change asset deterioration water consumption and environmental legislation
5 Describe how the pressures identified will influence predicted future performance measures (a do nothing scenario) Show the rate of change over time and discuss any uncertainties
6 Describe a short‐list of alternative strategies that are technically feasible and result in the achievement of outcomes for the catchment Explain the strengths weaknesses opportunities and threats of alternative strategies considering societal benefits whole life costs programming uncertainties and the role of other organisations Consider the perspectives of customers and other organisations (eg with reference to Local Flood Risk Management Strategies or River Basin Management Plans)
7 Explain the selection of a preferred strategy (with reference to SWOT analysis) and illustrate this in more detail with plans timelines and images so that stakeholders understand what might be involved and how it will impact on them A full disclosure of strategy appraisal is not necessary The roles of other organisations should be agreed and described
8 Explain how progress towards delivery of the Drainage Strategy and the achievement of outcomes will be monitored and reported
205240txt012|May 2013
3
Drainage Strategy Framework
Figure 1 Water and sewerage company Drainage Strategy interactions with other strategies plans and processes relating to flood and water quality management
Figure 1 illustrates how a water and sewerage company produced Drainage Strategy relates to the strategies plans and processes of other partner organisations in flood and water quality management The principal external (to water and sewerage company) relationships are between Drainage Strategies and
205240txt012|May 2013
4
14
Drainage Strategy Framework
bull Local Development Plans (of planning authorities) bull Flood Risk Management Plans bull Local Flood Risk Management Strategies (of Lead Local Flood Authorities) and bull River Basin Management Plans (led by the Environment Agency)
A Drainage Strategy should be risk and evidence based and should lead to companies minimising whole life costs whilst still delivering outcomes for customers and the environment It should recognise that population growth new development urban creep climate change and changing customer behaviour all exert new pressures and demands on drainage systems
A Drainage Strategy is there to facilitate both long and short term planning While relatively few Strategies are likely to be complete in advance of 2015 we expect companies to adopt a risk based prioritisation approach to develop further Strategies in the coming years Once complete more detailed planning should be consistent with the long term Strategy both up to and beyond future price reviews (although it is recognised that competing priorities may affect the pace at which outcomes are delivered)
A Drainage Strategy is likely to contain a mixture of responding to current problems pro‐actively reducing risks for predicted problems improving operational responses and acting to improve data and reduce uncertainty An example structure for a Drainage Strategy is included in Section 13
Links with Established Drainage Planning Processes
The Drainage Strategy framework encompasses and supplements established planning processes and technical guidance which have been applied selectively and adapted by water and sewerage companies (and Lead Local Flood Authorities) in recent years when planning for drainage systems
These include
bull Common Framework for Capital Maintenance Planning6
bull Sewerage Management Plans (Sewerage Risk Management 5)7
bull Urban Pollution Management 38
bull Surface Water Management Plan technical guidance9
bull Local Government Association Framework to assist the development of the Local Strategy for Flood Risk Management10
bull Long Term Least Cost Planning for Wastewater Supply‐Demand (to be superseded in 2013)11
bull Water Cycle Study Guidance (2013 revision in print) 12
These CIWEM13 Urban Drainage Group (WaPUG) published technical guides are also in widespread use
6httpwwwukwirorgukwirlibrary80474 (poundpound‐ indicating that a charge is made to access this content) 7 httpsrmwrcplccouk (poundpound) 8 httpwwwfwrorgUPM3 9 httpwwwdefragovukpublications20110610pb13546‐surface‐water‐guidance 10httpwwwlocalgovukwebguestlocal‐flood‐risk‐management‐journal_content56101713618366ARTICLE‐TEMPLATE 11 httpukwirforefront‐librarycomreports07‐rg‐08‐291714 (poundpound) 12 httpwwwenvironment‐agencygovukresearchplanning33368aspx
205240txt012|May 2013
5
Drainage Strategy Framework
bull WaPUG code of practice for the hydraulic modelling of sewers (3rd edition) bull WaPUG guide to quality modelling of sewer systems bull WaPUG integrated drainage modelling guide
The sewerage risk management and surface water management methodologies in particular share a common phased approach to understanding drainage problems and developing cost effective solutions These phases are central to good practice in drainage planning and are central to the development of a Drainage Strategy
Generically these phases include
bull Initialisation Preparation phase where data are collated to understand current issues in the system and necessary partners are consulted with to agree success measures and objectives
bull Risk assessment phase where predictive tools are used to quantify current problems and predict how these problems will change in the future
bull Options appraisal phase where the costs and benefits of alternative remedies that meet agreed objectives are considered This informs the selection of a preferred solution or solutions
bull Implementation phase where drainage improvements are financed and delivered and the effectiveness of improvements monitored
The process is cyclical indicating that it is periodically revisited to confirm previous decisions address uncertainties and adapt to a changing environment Figure 2 and Figure 3 illustrate the Sewerage Risk Management and Surface Water Management Plan planning processes
Figure 2 Sewerage Risk Management Approach (Copyright WRc plc httpsrmwrcplccouk used with permission)
13 httpwwwciwemorgknowledge‐networksgroupsurban‐drainagepublicationsmodelling‐guidesaspx
205240txt012|May 2013
6
Drainage Strategy Framework
Figure 3 Surface Water Management Plan Approach
Ofwat has previously commissioned research14 on current practice in sewerage planning and drainage area plans concluding that traditional drainage area plans are no longer widely undertaken but that these activities are generally undertaken under different guises
14httpwwwofwatgovukfuturesustainabledrainagerpt_com20111208drainagepdf
205240txt012|May 2013
7
15
Drainage Strategy Framework
Statutory Obligations and Regulatory Drivers
151 Government
Drainage planning is undertaken within a context established by a variety of Government policies and instruments These are succinctly detailed in Defrarsquos October 2012 Statement of Obligations15
(for England) which is to be referenced by water and sewerage companies in the preparation of business plans for the 2015‐2020 price review period More specific guidance over priorities for 2015‐2020 is provided in Defrarsquos16 strategic policy statement for Ofwat A Water Strategy for Wales17 will be consulted on in 2013
The key legislative drivers and Government priorities relevant to drainage planning are summarised here
bull Section 94 of the Water Industry Act 199118 describes how every water and sewerage company is under a duty to lsquoprovide improve and extend hellip a system of public sewers hellip as to ensure that the area is and continues to be effectually drainedrsquo This is relevant to drainage planning because it explicitly indicates that the sewerage system should be improved to keep pace with growing pressures over the long term this requirement is assured if a long term Drainage Strategy is in place and implemented
bull The Urban Wastewater Treatment Directive19 provides a further requirement to provide sufficient capacity in wastewater collection systems
bull The Governments in England and Wales are committed to taking an ecosystems approach to environmental management which accounts for the environmental economic and social benefits that result from an improved water environment Water and sewerage companies are encouraged to invest in natural as well as built infrastructure to deliver their desired outcomes The Natural Choice 20 demonstrated how this type of investment can deliver a wide range of positive social environmental and economic outcomes Benefits can be determined using lsquopayments for ecosystem servicesrsquo 21 methods Water and sewerage companies are encouraged to consider these approaches where they can deliver cost beneficial outcomes for their customers This is relevant to drainage planning because it encourages the use of retrofit sustainable drainage systems in place of more traditional sewer upsizing and storage Ofwat has supported water and sewerage companies to investigate these approaches through pilot studies22 in the 2010 to 2015 price review period
bull Water and sewerage companies may work in partnership with other organisations to jointly invest in shared outcomes and to discuss with customers their willingness to pay for wider
15 httpwwwdefragovukpublications20121005pb13829‐statement‐obligations 16 httpwwwdefragovukpublications20130307pb13884‐sps‐seg‐ofwat 17httpwalesgovuktopicsenvironmentcountrysideepqwaterfloodingpublicationswater‐strategyjsessionid=235D11ADCC6EEC8EE88886DD69CE0784lang=en 18 httpwwwlegislationgovukukpga199156partIVchapterI 19 httparchivedefragovukenvironmentqualitywaterwaterqualitysewageuwwtdindexhtm 20 httpwwwdefragovukenvironmentnaturalwhitepaper 21 httpwwwdefragovukenvironmentnaturalecosystems‐services 22 httpwwwofwatgovukfuturesustainabledrainage
205240txt012|May 2013
8
Drainage Strategy Framework
benefits This is relevant to sewerage planning because it encourages water and sewerage companies to partner with local authorities to resolve complex storm water management problems (for flooding or pollution control) through the use of retrofit sustainable drainage systems The wider benefits to citizens outside of the water and sewerage companyrsquos customer base can be accounted for
bull The governments of England and Wales are promoting a catchment‐based approach23 to River Basin Management Planning to meet the water quality requirements of the Water Framework Directive (WFD)24 The important aspect of the approach is that all interested parties should work together to build consensus about the best way to improve water quality and habitats Water and sewerage companies should expect to be involved in the process of agreeing objectives and the apportionment of responsibility for delivering those objectives within the river basin districts they operate The central requirements of the Water Framework Directive are to prevent deterioration in water quality aim to achieve good chemical status and aim to achieve good ecological status It additionally seeks to limit the discharge of priority substances River Basin Management Plans will undergo consultation in the second half of 2014 and be published in December 2015 thereafter the programmes of measures included become statutory requirements and the Environment Agency (in England) and Natural Resources Wales will use permit and license conditions to ensure that water and sewerage companies deliver their agreed contributions This is relevant to drainage planning because misconnections blockages mechanical failure sewer flooding and combined sewer overflows (CSOs) can all contribute to the deterioration of water quality and the failure to achieve good ecological status or meet environmental quality standards for priority substances Climate change and growth may increase these risks but water and sewerage companies are not the only polluters and need to partner to ensure that outcomes are met Defra is consulting (closing February 2013) on developing its policies with respect to the control of diffuse urban pollution25
bull A revised Bathing Water Directive (20067EC)26 applies from 2015 and by then the Governmentrsquos aim is for all bathing waters to achieve at least lsquosufficient classrsquo this is approximately twice as stringent as requirements for the current Directive Subsequent planning should aim to achieve lsquogoodrsquo or lsquoexcellentrsquo classifications This is relevant to drainage planning because CSOs other wet weather intermittent discharges final effluent discharges and misconnections can all contribute to bathing water failures Climate change and growth may increase these risks but water and sewerage companies are not the only polluters and need to partner to ensure that outcomes are met
bull Under the Flood and Water Management Act (2010)27 water and sewerage companies (in England and Wales) must act in a manner consistent with the National Flood and Coastal Erosion Risk Management (NFCERM) Strategies28 for England and Wales and have regard to
23httpwwwdefragovukenvironmentqualitywaterlegislationcatchment‐approach 24httpwwwdefragovukenvironmentqualitywaterlegislationwater‐framework‐directive 25 httpwwwdefragovukconsult20121120water‐pollution 26 httpwwwenvironment‐agencygovukbusinessregulation107017aspx 27 httpwwwdefragovukenvironmentfloodinglegislation 28 httpwwwenvironment‐agencygovukresearchpolicy130073aspx
205240txt012|May 2013
9
16
Drainage Strategy Framework
Local Flood Risk Management Strategies29 NFCERM is based around six principles community amp partnership catchment based approach sustainability risk based planning beneficiary investment and delivering multiple benefits Companies should also co‐operate with local authorities and the Environment Agency in the exercise of their functions in relation to surface water management and combined sewers under section 94 of the Water Industry Act 1991 The Flood Risk Regulations 200930 implement the Floods Directive and give particular responsibilities to Lead Local Flood Authorities In lsquoFlood Risk Areasrsquo Lead Local Flood Authorities and the Environment Agency are expected to prepare Flood Risk Management Plans that set out flood risk management objectives and measures to manage risk from local flooding The Environment Agency is required to prepare Flood Risk Management Plans for the whole of England and Wales that cover flooding from main rivers the sea and reservoirs It is important for all risk management authorities to work in an effective way to plan to manage flood risk from all sources in a way that is well coordinated across catchments and coastal cells These duties are relevant to drainage planning because of the vital (but not unlimited) role surface water and combined sewers play in reducing flood risk in urban areas The Act also makes provision for the compulsory drainage of new developments through sustainable drainage systems (SuDS) and the lsquoright to connectrsquo being conditional on SuDS being approved by the SuDS Approval Body of the Lead Local Flood Authority
bull The Climate Change Act 200831 created a legal framework to cut greenhouse gas emissions and build the UKrsquos ability to adapt to a changing climate Water and sewerage companies are expected to reduce carbon emissions and adapt to the impact of climate change over the next decades The Government published its first UK climate change risk assessment in January 2012 and this will be updated every 5 years This is relevant to drainage planning because of the carbon embodied in new drainage infrastructure the carbon emitted during the pumping and treatment of sewage and the increase in flooding and pollution that will occur if climate change adaptations are not made The Government expects Ofwat to work towards the targets of its Adaptation Report and to ensure that its regulatory approach explicitly supports companies in adapting to climate change
bull From October 2011 the Water Industry (Schemes for Adoption of Private Sewers) Regulations 201132 transferred responsibility for existing private sewers and lateral drains to water and sewerage companies Pumping stations will be transferred by October 2016 This is relevant to drainage planning because of the significant increase in assets now within the responsibility of the water and sewerage company and the need to understand and respond to risks therein
Six Guiding Principles for a Drainage Strategy
This Drainage Strategy Framework describes good practice themed around six guiding principles Adherence to these principles will help ensure a Drainage Strategy which meets the expectations of Defra the Welsh Government the Environment Agency Natural Resources Wales and Ofwat and
29 The Local Government Association has published guidance on Local Flood Risk Management Strategies httpwwwlocalgovukcdocument_libraryget_fileuuid=a2538b94‐d3c1‐4cec‐81b0‐8aefd2996c5eampgroupId=10171 30 httpwwwenvironment‐agencygovukresearchplanning125459aspx 31 httpwwwdeccgovukencontentcmslegislationcc_act_08cc_act_08aspx 32 httpwwwlegislationgovukukdsi20119780111510933contents
205240txt012|May 2013
10
Drainage Strategy Framework
will be an essential means of communicating with customers and other partners Further details on each principle are described in Section 2 of this document along with examples of good practice
The six principles are
161 Partnership
Water and sewerage companies cannot develop optimal Drainage Strategies on their own and therefore partnership is key to developing and defining objectives performance indicators and the milestones that will need to be achieved in order to achieve measures that will demonstrate the delivery of outcomes Strategies should be developed and implemented in partnership with customers developers Lead Local Flood Authorities planning authorities the Environment Agency and Natural Resources Wales Strategies should align with (informing and informed by) River Basin Management Plans Local Flood Risk Management Strategies Flood Risk Management Plans and local plans (from planning authorities)
162 Uncertainty
Strategies should explain the reliability of data and knowledge about current and future performance of drainage systems They should explain what steps are planned to improve this understanding and how this will benefit customers Where future performance is uncertain (eg because of sensitivity to climate change) they should explain how adaptive approaches will be used to ensure outcomes are met The uncertainty in predictions of future risks should be recognised and accommodated within decision making
163 Risk based
Strategies should be risk based This means that planning operational and investment activities should be based on consideration of the probability and consequence of inadequate drainage function (risks) as these relate to the achievement of measures that demonstrate delivery of outcomes A risk based strategy ensures that investment is made where risks are the greatest
To aid communication risks should be visualised through maps and plans (Figure 10 is an example) To aid risk assessment risks should be monetised combined and predicted into the future To aid options appraisal the impact of interventions on the level of risk should be predicted
The approach to Drainage Strategy development should be risk based itself The degree of detail included should be related to an understanding of the overall level of risks in the catchment now and in the future
164 Whole life costs and benefits
Strategies should be informed by consideration of whole life costs and benefits They should promote a series of interventions which in view of the quantified uncertainties are most likely to result in performance indicators which demonstrate the achievement of outcomes at lowest cost to customers and the community more widely
Costs relate to capital and operational expenditure to deliver interventions and the monetised impacts of drainage failures such as flooding and pollution
Benefits relate to the reduction in risks from drainage failures such as flooding and pollution but should also include wider societal impacts such as those calculated using a lsquoPayments for Ecosystems Servicesrsquo approach
205240txt012|May 2013
11
17
Drainage Strategy Framework
When considering the lsquowhole lifersquo the strategy should consider climate population and asset deterioration trends These are likely to increase risks over the long term if no interventions are made The strategy should state lsquowhatrsquo should be done but also broadly lsquowhenrsquo and in what sequence interventions should happen
165 Live process
The Strategy should be adaptable and periodically reviewed Whilst outcomes are expected to be relatively stable over time the pace at which the strategy delivers outcomes will be linked to volatile influences (like climate and population change) and the decisions made at each price review about the priorities for the following period The strategy should be reviewed at regular intervals to reflect investments already made the changing priorities of the water and sewerage company and partners and the presence of emerging risks The review is also an opportunity to report drainage catchment performance relative to performance measures designed to monitor progress towards achieving outcomes
166 Innovative and sustainable
The framework promotes the full evaluation of alternatives to traditionally engineered sewerage solutions to test whether these offer lower whole life cost options or better responses to uncertainty It is anticipated that drainage solutions of the future will be different from the ones we are used to
These should include (at least at a high level) real time control or active management storm water retrofit techniques education to enable customers to change behaviour enhancing incentives for customers to reduce surface water flowing to sewers and innovative permitting arrangements across drainage networks and wastewater treatment works Water and sewerage companies should continue to review and develop other innovative solutions
For example where a company may historically have preferred to tackle sewer flooding or combined sewer overflow pollution by increasing its underground equipment to store more rainfall during storms it might consider other options in future such as working with customers to manage the rainfall close to source preventing it from entering the sewer system
Mapping the Framework to Current Planning Processes
We assume that practitioners will be following a broad and generic four‐stage planning process common to the Sewerage Risk Management (SRM5) and Surface Water Management Plan (SWMP) processes when preparing Drainage Strategies
Figure 4 is provided to guide water and sewerage companies in the development of Drainage Strategies It identifies each stage of the drainage planning process and highlights the good practice principles (colour coded by theme) in the locations through the process where it is most important that they are adopted
205240txt012|May 2013
12
e
u
t
v
b
DDrainage Strateegy Frameworrk
Initializepre
Establish partne and consultat
process
Define uncertai
Prepare risk d
Partnership
epare
rship ion
nties
ata
Ris
Co
Uncertainty
k assessmen
onsultation on risk issues
Quantify uncertainties
Quantify risks
Risk based
nt Options
Consult
Plan for
Demons life cost
Whole lif costs amp benefits
s appraisal
on options
uncertainties
strate whole and benefit
fe
s Live pro
Intervent
Aligned deliv collaborat solution
Innovative sustainab
Live and vis
cess Innova sustai
tion
ery amp ive s
and le
sible
ative amp nable
Figgure 4 Draina ge Strategy frramework prinnciples mappe d to the drainaage planning pprocess
118 WWho will bennefit from tthe Framewwork
Thhe Drainage Strategy Fraamework willl benefit
bull Water andd sewerage coompanies loooking to impprove their coompany speccific drainagge planning approach and make it fit for purpoose for the deelivery of lonng term outcoomes over mmultiple pricee review cyccles It will ppoint them toowards good practice andd provide exaamples as innspiration andd to promott ne innovation
bull Organisatiions and inddividuals lookking to enga ge with the ddevelopmen t of Drainagee Strategies and scruti nise progresss towards thhe achievemeent of outcommes associateed with enabbling growth adapting tto climate chhange managging floodingg and managging water poollution
22 DDrainagee Strateegy Frammeworkk Thhis section deescribes recoommended ggood practicee against eachh of the six kkey principle s necessary too develop a DDrainage Straategy For refference linkss are made too relevant annd establisheed planning prrocesses and emerging guuidance whicch drainage planners maay find usefuul These exammples are prrovided for innformation aand referenc e only
WWater and sewwerage comppanies shouldd work towaards developiing Drainagee Strategies wwhich apply thhese approachhes in a wayy that is consiistent with thheir needs annd those of thheir customeers and paartners Partnners should ttake note of tthis advice aand prepare tto engage wiith water andd sewerage coompanies on this basis
Thhe recommennded good ppractice is orgganised withhin each prinnciple as it wwould be appproached chhronologicallly in developping a Drainaage Strategy following thhe planning pprocesses alrready esstablished in the Seweragge Risk Manaagement anddor Surface WWater Managgement Plann mmethodologiess
2205240txt012|Mayy 2013
13
21
Drainage Strategy Framework
Principle One Partnership
Water and sewerage companies cannot develop optimal Drainage Strategies on their own and therefore partnership is key to developing and defining objectives performance indicators and the milestones that will need to be achieved in order to achieve measures that will demonstrate the delivery of outcomes Strategies should be developed and implemented in partnership with customers developers Lead Local Flood Authorities planning authorities the Environment Agency and Natural Resources Wales Strategies should align (informing and informed by) with River Basin Management Plans Local Flood Risk Management Strategies Flood Risk Management Plans and local plans (from planning authorities)
205240txt012|May 2013
14
Drainage Strategy Framework
211 Recommended good practice
No Good practice Example references
1 Engage with partners in a drainage catchment to bull Explain the purpose of developing a Drainage Strategy
and partnersrsquo roles in its success amp how each party will benefit from establishing a long term Drainage Strategy
bull Explain what outcomes are and how progress towards achieving them will be measured
bull Share data and information so that a shared understanding of risks and opportunities is developed
bull Explain what current drainage system performance is and how this is expected to change in the future Use risk visualisation tools to do this
bull Explain significant uncertainties and how these affect how interventions are delivered
Thames Water has demonstrated good practice through the development of its Counters Creek sewer flooding proposals This website describes the engagement process and how customers have been kept informed
2 Engage with the following partners in the development of the Drainage Strategy
bull Lead Local Flood Authority (the drainage area may include more than one) because of its responsibilities for local flood risk management and SuDS approval
bull Planning authority (the drainage area may include more than one) because of its role in determining the location and pace of housing development
bull Highways Authority because of the connection of highway runoff to public sewer systems
bull The Environment Agency (in England) because of its responsibilities for flood risk management (strategic overview) and ensuring good ecological quality is met in water bodies
bull Natural Resources Wales (in Wales) because of its responsibilities for flood risk management (strategic oversight) and ensuing good ecological quality is met in water bodies
bull Regional Flood and Coastal Committees who help develop a mutual understanding of flood and coastal erosion risks in an area
bull Bodies representing customers (eg Consumer Council for Water large local businesses flood action groups faith communities)
bull Bodies representing local environmental concerns (eg Wildlife Trusts Rivers Trusts)
bull Water only companies and water and sewerage company departments planning and operating water supply systems Water demand management practice can have an important impact on sewerage headroom
SWMP guidance (Chapter 2) advises on the establishment of partnerships for urban flood management and how to agree and align local objectives
3 Understand alignment of planning cycles and what this means locally (eg periodic review River Basin Management Plan Local Flood Risk Management Strategy Flood Risk Management Plan local plan)
205240txt012|May 2013
15
Drainage Strategy Framework
No Good practice Example references
4 Be alert to opportunities for joint solutions andor shared funding by understanding local plans for new development re‐development improving street furniture and public open space improving parks and green infrastructure Understand Lead Local Flood Authority and Environment Agency programmes for the management of flood and pollution risks
A guide to joint funding of local flood risk management intervention has been published by Defra33 and provides relevant advice to water and sewerage companies and other partners
5 Consider water and sewerage company funded solutions which deliver third‐party non‐sewerage assets that result in the long term least cost delivery of outcomes (eg water and sewerage company funding of household rain barrels and rain gardens to prevent surface water entering sewers)
6 Use data and mapping from the Environment Agency and Natural Resources Wales to understand exposure of drainage infrastructure to extreme events (eg coastal fluvial and surface water flood maps) so that network resilience can be understood and improved if this is cost beneficial
UKWIR has completed a project in 2013 lsquoResilience building a business case for PR14 and beyondrsquo
7 Work with LLFAs and the Environment Agency (or Natural Resources Wales) to understand the effectiveness of interventions at reducing risk and use this information to improve intervention planning
The UPM3 manual (section 7) advises on post project monitoring needs for water quality driven improvements
8 Share Drainage Strategies with partners and stakeholders so that there is transparency around challenges opportunities and the roles expected of different organisations
212 Good practice example ndash South West Water working with local authorities
These examples from South West Water illustrate how the company has worked with local authorities to coordinate investments and to share resources and skills in the development of integrated urban drainage management studies and Surface Water Management Plans
bull South West Water approached Devon County Council (DCC) to pool resources in delivering two (of five) pilot integrated urban drainage management studies (IUDMs) for Exeter and Exmouth South West Water took the lead role for Exmouth but DCC led in Exeter This engagement shared costs across organisations and has facilitated the production of full Surface Water Management Plans The collaboration has resulted in a shared understanding of the urban drainage challenges faced by both organisations and has opened dialogue around investment priorities
bull In Lyme Regis South West Water supported extensive coastal erosion defence works being carried out by West Dorset District Council by accelerating a programme of sewer rehabilitation and targeting renovation of sewers in vulnerable areas
bull In partnership with Cornwall County Council (CCC) and the Environment Agency South West Water has been working on a number of key drainage issues identified by CCC in its Preliminary Flood Risk Assessment (PFRA)
33 httprandddefragovukDefaultaspxMenu=MenuampModule=MoreampLocation=NoneampCompleted=0ampProjectID=17085
205240txt012|May 2013
16
Drainage Strategy Framework
bull In Camborne South West Water has taken the opportunity to invest in sewer separation works which align with the aims of the Camborne Pool Redruth urban regeneration group supported by Cornwall Council and to promote sustainable development economic growth and a strategic aim of lsquosewers for sewagersquo
213 Good practice example ndash Northumbrian Water partnership working in Tyneside
Northumbrian Water has led a sustainable sewerage study for Tyneside34 between 2010 and 2012 It is a good example of how partner organisations can collaborate to understand and resolve drainage issues in their urban area
Its approach was informed by the fact that a shared urban drainage problem around flooding and pollution was best addressed by a shared response from all the relevant organisations The project steering group involved representatives of Northumbrian Water the Consumer Council for Water the Environment Agency and five Lead Local Flood Authorities The urban drainage system collects wastewater for a single wastewater treatment works serving a population of over 900000
Working together the group studied the impact of growth urban creep and climate change on future urban drainage issues Figure 5 illustrates how a city‐wide map of potential problem areas was generated by the project team sharing data on sewer capacity (from Northumbrian Water) population change (from the local authorities) and river flooding (the Environment Agency) It was predicted that future problems were more likely to occur in the darker shaded areas These became focus areas for the project where a range of traditional and novel drainage solutions were tested
Figure 5 Future drainage problem areas indentified through data sharing
34httpcommunicatoremailcomINfNLOjNRayfOA1rfrfYcdK‐S7UwRcYcNoWebViewaspx
205240txt012|May 2013
17
22
Drainage Strategy Framework
The project team was keen to promote its work to customers and the community and prepared a series of newsletters updating interested parties on progress and issues An example is illustrated in Figure 6
C lic k here if y ou are hav in g d if f ic u lties v iew ing th is new s letter
Ho m e A b o u t u s M e d ia ce n tre C o n tact
Issue 2
Ap ril 2012
In th is ed ition U n d e rs tan d in g th e fu tu re
S u s tain ab le d ra ina g e o p tio ns
F ind ou t more about Th e 2 0 1 1 an n ua l re po rt
Ou r e n viro n m e n ta l p o licy
Ou r co rp o ra te re sp o nsib il i ty s tra te g y
W e lcom e to th e s e con d e ditio n o f S u sta inab le se we ra g e a s ix-m on th ly n e ws le tte r p ro d u ce d to b ring yo u th e la te s t n e ws on o u r m a jo r s tud ye xp lo rin g s us tain ab le s ew e ra ge o p tions in th e Tyn e s id e a rea I h o p e yo u fin d th e in fo rm a tio n o f in te res t a n d wo u ld w e lcom e fe e db a ck o n an y o f th e issu es ra ise d
Ric ha rd W a rne ford W a s te wa te r Dire c tor
U nderstand ing the fu tu re W e a ll kn o w th e difficu lties o f a ccu ra tely p re d ic tin g th e fu tu re h ow e ve r ifw e a re to p re pa re fo r i t th e n it is s om e thin g we m us t a tte m p t As p a rt o f th is s tu d y w e a re co ns id e rin g w ha t d em a nds w ill b e p la ce d on th e d ra ina g e s ys tem s a t 2 0 20 a n d a t 2 0 50 in co rpo ra ting g ro w th u rba n cre e p a nd c lim a te cha n ge B y w o rk in g close ly w ith o u r p a rtn e rs an d u s in g th e la tes t te ch n ical res e a rch we h a ve d e ve lo p ed a n d com p u te rm od e lle d a num b e r o f s ce na rios to id en tify a n d d e fin e fu tu re ris ks Th es e ris ks in c lud e p red ic tions o f p o te n tia l floo d in g p o llu tion o r b a rrie rs to g ro w th N o w th a t w e be tte r u n d e rs ta nd th e iss u es we a re a ble to p re pa re p la ns p rom o ting o p po rtu n ities fo r s us ta in a ble d rain ag e s ys tem s in o rde r to d e live r th e b es t p oss ible s e rvice fo r o u r cu s tom e rs b a la n ced a g ains te n viro nm e n tal n e eds a n d cos ts
S usta inab le d ra inage op tions W e b e lie ve o u r a pp ro a ch re p res en ts go o d p ra ctice fo r th e m a n ag em en t o f s u rfa ce wa te r w h ich is to d ea l w ith th e s u rfa ce wa te r as c los e to s ou rce as p oss ib le A w id e ra n g e o f p o te n tial o p po rtu n ities a re b ein g id e n tifie d in c lu d in g lo ca l a n d s tra te gic o p tions
S tra te g ic o p tions a re typ ica lly la rg e r th a n th e lo ca l on es a nd in c lu d e fe a tu res s u ch as a re as o f la nd w h ich w o uld b e a llo we d to flo o d d u rin g he a vy ra in (s a crific ial s to ra g e ) a n d p e rm a n en t w e tla nd fe a tu res
L o ca l op tio ns d esp ite b ein g sm a lle r th a n th e s tra te gic o n es w ill s til l p la y a ke y ro le in th e p ro vis io n o f s us tain ab le d ra ina g e Th e ir n a tu re m e a ns de p lo ym e n t co u ld be m o re w id es p re a d th a n s tra te gic o p tions fe a tu res su ch as w a te r b u tts ra in g a rde ns a nd p e rm e ab le pa vin g co u ld b e re la tive ly e a s y to fi t in to
Figure 6 Newsletter promoting urban drainage partnership working
Principle Two Uncertainty
Strategies should explain the reliability of data and knowledge about current and future performance of drainage systems They should explain what steps are planned to improve this understanding and how this will benefit customers Where future performance is uncertain (eg because of sensitivity to climate change) they should explain how adaptive approaches will be used to ensure outcomes are met The uncertainty in predictions of future risks should be recognised and accommodated within decision making
205240txt012|May 2013
18
Drainage Strategy Framework
221 Recommended good practice
No Good practice Example references
1 Data analysed and used in the development of the strategy related to asset location dimensions condition failure and flood and pollution incidents should be assigned a confidence grading The confidence grading should be related to its accuracy completeness compatibility credibility and currency
Models used to predict blockages and collapses flooding locations polluting discharges and water quality impacts should be assigned a confidence grading based on their accuracy completeness compatibility credibility and currency
Model predictions should be assigned a confidence grading depending on the confidence in the model and whether it is being applied outside of its verification range (eg for extreme events or for atypical geographies)
The purpose of confidence grading data and model results used in strategy setting is to understand the likelihood that outcomes will be achieved in a cost efficient manner Where the outcomes remain uncertain knowledge of data confidence can be used to target improvement programmes
SRM5 (S3‐03‐17) refers to Ofwatrsquos method for recording the reliability and accuracy of regulatory data in bands A to D
The SWMP guidance (Section 319) describes an alternative system of grading data and model results
2 Use the Drainage Strategy to justify data and model improvement programmes This should be focussed on areas where risks are currently (or predicted to be) high and uncertainty in data or models reduces the ability to determine robust operational or capital solutions Poor model verification in high risk areas would be an indicator that model improvements were required
CIWEMrsquos urban drainage group has published a series of guides on hydraulic and water quality modelling They discuss model calibration verification and uses
SRM5 (S3‐04) describes how to determine where the current assessment of risk is sufficient to proceed or whether data and models should be improved
3 Improve understanding of network performance (and improve models) by using long term flow and level monitoring on sewers and CSOs
Yorkshire Water discusses its CSO
monitoring programme here
4 Demonstrate how the uncertainty in both the underlying datamodels and in the future projections is addressed in options appraisal Consider if this should be done implicitly (eg through choosing conservative assumptions) or explicitly through the use of sensitivity analysis or scenario testing
Treasury Green Book supplementary guidance illustrates how to accommodate climate change uncertainties
205240txt012|May 2013
19
Drainage Strategy Framework
No Good practice Example references
5 Population growth new homes and businesses climate change and urban creep combine to make the future highly uncertain but will almost certainly increase flooding and pollution risks from drainage systems Use the Drainage Strategy to explore different scenarios (combining the impact of these drivers) for a near term (le 10 years) and future (ge 30 years) epoch
For example combine modest growth and slight climate change (a low impact case) and contrast with high growth and significant climate change (a high impact case) Where the location of significant new development is unknown include scenarios accommodating different possibilities
Running multiple scenarios is time consuming and costly A risk based approach should be adopted to focus efforts where flooding and pollution risks are especially sensitive to changes in demand
UKWIR has published research on accounting for climate change35 and urban creep36 in sewerage planning together with more general advice on accommodating climate change in water asset management planning37
Ofwat has published research38
predicting the combined impacts of climate change urban creep and development on a national basis
6 In the face of significant uncertainties about future demands on the drainage system and their consequences the Drainage Strategy should identify low‐regrets interventions (ie ones that are robust no matter what the future holds) and ensure that solutions can be adapted if greater certainty is achieved For example through quickening the pace of SuDS retrofit activities or using (previously identified and secured) land to extend underground storage facilities Strategies which remove surface water from sewerage networks provide lsquoheadroomrsquo for unpredictable increases in demand from population and climate change
Designing Resilient Cities A guide to good practice DR Lomardi et al HIS BRE Press
7 Post project appraisal and cost monitoring should be used to capture real costs and performance so that Strategies can be updated and improved with latest information It is especially important to collate and understand the whole life costs of new technologies where industry understanding is currently poor
35httpwwwukwirorgreports03‐cl‐10‐09042794658901799019890198 (poundpound) 36httpukwirforefront‐librarycomreports10‐wm‐07‐1493273 (poundpound) 37httpukwirforefront‐librarycomreports12‐cl‐01‐1694816900019015590145901409465890155 (poundpound) 38httpwwwofwatgovuksustainabilityclimatechangerpt_com201106mottmacsewerpdf
205240txt012|May 2013
20
Drainage Strategy Framework
222 Good practice example ndash Severn Trent Waterrsquos MICAS
Severn Trent Water has developed a process to measure confidence in hydraulic models of sewer systems Modelling Investment Confidence Assessment Scoring (MICAS) was developed to provide an objective evaluation of model confidence It uses information stored in the hydraulic model about the provenance of each data element and the quality of model verification Before the approach was developed the assessment of lsquofitness for purposersquo of models was subjective and based on modellers judgment This was not always reliable and certainly not repeatable and transparent MICAS provides an objective assessment of hydraulic model quality which can be used to inform its use and prioritise improvements to input data and model verification
Figure 7 and Figure 8 illustrate how an understanding of model confidence from the MICAS assessment (right hand side images) can be used to interpret predictions of flooding (left hand side images) In Figure 7 areas at predicted high risk of flooding (red in the left hand side image) are shown to be in high confidence areas of the hydraulic model (green in the right hand side image) In contrast in Figure 8 areas at predicted high risk of flooding (red in the left hand side image) are shown to be in poor confidence areas of the hydraulic models (orange in the right hand side image) In the latter case this information is used to identify where further model improvements would be beneficial
Flood Risk MICAS
Figure 7 Modelled flood risk and MICAS confidence scores (high model confidence)
Flood Risk MICAS
Figure 8 Modelled flood risk and MICAS confidence scores (lower model confidence)
205240txt012|May 2013
21
23
Drainage Strategy Framework
Principle Three Risk Based
Strategies should be risk based This means that planning operational and investment activities should be based on consideration of the probability and consequence of inadequate drainage function (risks) as these relate to the achievement of measures that demonstrate delivery of outcomes A risk based Strategy ensures that investment is made where risks are the greatest
To aid communication risks should be visualised through maps and plans (Figure 10 is an example) To aid risk assessment risks should be monetised combined and predicted into the future To aid options appraisal the impact of interventions on the level of risk should be predicted
The approach to Drainage Strategy development should be risk based itself The degree of detail included should be related to an understanding of the overall level of risks in the catchment now and in the future
231 Recommended good practice
No Good practice Example references
1 Determine where a Drainage Strategy is required by combining current performance with external influences likely to result in deteriorating performance This stage requires no modelling or detailed assessment On a catchment‐by‐catchment (drainage area) basis understand current risks by collating data on current performance eg blockages collapses pumping station failures pollution incidents CSO spills storm tank spills internal flooding incidents external flooding incidents and infiltration rates Relate these risks to performance indicators and the achievement of outcomes Combine with information about known growth rates predictions of urban creep quantity of newly adopted lsquoprivatersquo sewers surface water flooding risks (eg from flood map for surface water) WFD water body status and bathing water status Prioritise catchments with high current risks andor factors suggesting that risks are likely to worsen significantly in the future Consider normalising scoring method for size of catchment (eg by unit area or unit length of sewer) Consult with stakeholders to confirm correct prioritisation Commence with development of Drainage Strategies for the highest ranked catchments Periodically revisit prioritisation (updating with new data) to check that priorities are still correct
The initialisation stage of a Sewer Management Plan (SMP) (described in SRM5) considers how a risk assessment can be used to prioritise which spatial units (eg catchments) should be prioritised for a SMP study
2 Visualise catchment risks (from 1) to illustrate and explain to partners the reasons for prioritisation Accommodate their views amp consider changing prioritisation to aid wider drainage planning requirements (eg increase prioritisation of a catchment with significant surface water flooding problems where close collaboration between water and sewerage company and LLFA will benefit the community)
205240txt012|May 2013
22
Drainage Strategy Framework
No Good practice Example references
3 Clearly relate sewerage risks to the performance indicators that will be used to measure progress towards achieving outcomes eg relate blockage rates to flooding and pollution incidents eg relate increase in flows to increased CSO frequency breaches of permit conditions and deterioration in receiving water quality Adopt a sourcendashpathway‐receptor model and workshop techniques to ensure that cause effect and consequences are fully captured Use performance indicators as the basis for a comprehensive risk assessment that considers likelihood (frequency) and consequence (extent degree and duration of impact) of failure expressed as risk scores Monetise risks in GBP (pound) to align with principle four (whole life costs amp benefits) Use (verified) predictive models to understand near term (lt10 years) and long term (gt30 years) risks The latter to align with principle four (whole life costs amp benefits) Align complexity of method with level of risk recognising the needs of partners eg use complex 2D flood routing models to ascertain (with greater certainty) flood mechanisms and damages where the quantity and frequency of flooding is high and interventions will be complex and costly Elsewhere more simple approaches are appropriate eg use complex UPM3 water quality modelling methods where compliance with river standards or discharge consents is already failing or is expected to do so Elsewhere more simple approaches are appropriate Combine risk scores from different risks to describe the total level of risk in a catchment Use visualisation techniques to communicate combined level of risk Combine analysis from hydraulic blockage and asset deterioration models on a catchment basis In hydraulic analysis consider flooding performance for rainfall events beyond the usually provided standard of protection to understand performance in extreme events in support of partners (especially LLFAs) and in search of cost beneficial interventions at a higher standard than normal
SRM 5 (S3‐03) details approaches to simple and more complex approaches to risk assessment that are consistent with CMPCF guidelines
4 Be alert to interactions between sewer networks and wastewater treatment plans eg by modelling the impact of changing sewer flows on wastewater treatment worksrsquo performance and costs Consider combined impact of different catchments on a single or linked water body (eg an inland river bathing water or shell fishery)
UPM3 guidance discusses approaches to understanding these interactions and applying more complex water quality impact models
5 Establish systems and apply methods to predict how interventions can reduce risks eg how a targeted and pro‐active maintenance can reduce the occurrence of sewer blockage and flooding from lsquoother causesrsquo eg how reducing infiltration can reduce CSO spills eg how reducing connected impermeable area can reduce sewer flooding
205240txt012|May 2013
23
Drainage Strategy Framework
232 Good practice example ndash United Utilities risk assessment
United Utilities has demonstrated a robust risk based approach in the development of sewerage management plans used for long term planning across their area of operations
Hydraulic models were applied in 235 catchments and configured to look at future performance and to evaluate the consequences of inadequate capacity Starting from a baseline of 2010 versions of the models were built for 2020 and 2036 epochs The following model input parameters were adjusted population water consumption infiltration planned development known sewerage improvement projects urban creep rainfall (for climate change)
Two‐dimensional (2D) modelling was used to consider the consequences of sewer flooding resulting from the changes made to reflect the future operating environments As well as the impact on homes and business (from internal and external flooding) the flood risk to critical infrastructure was also considered The operation of CSOs was considered by computing the annual spill volume duration and frequency
Finally predictions of the likelihood and consequence of sewer failure were added taking account of sewer material age and the incident records relating to similar assets
All these data were combined and weighted to generate a Sewer Management Plan (SMP) Risk Score for each length of sewer The process is illustrated in Figure 9
Figure 9 United Utilitiesrsquo process for calculating risk score in sewerage catchments
205240txt012|May 2013
24
Drainage Strategy Framework
Risk scores were summed spatially and monetised so that high priority locations could be identified Mapping and visualisation were used to communicate the results of this assessment priority areas for further investigation and how risks change through time (Figure 10)
Figure 10 Visualisation of sewerage risks
233 Good practice example ndash Northumbrian Water risk assessment
Northumbrian Water completes an annual assessment of hydraulic capacity in its sewerage network at the drainage area scale Its approach does not require hydraulic models to have been completed and yet can reliably highlight areas of under‐capacity in need of further investigation through more detailed analysis including hydraulic modelling New and emerging risk areas can also be identified by applying data for population growth which occurs through development lsquoWhat ifrsquo scenarios can be run to test when capacity limits may be overcome and flood risks potentially set to increase It demonstrates good lsquorisk basedrsquo planning principles because it shows the drainage planner where more detailed analysis is warranted
The approach uses the following data from company records population connected to sewer P water consumption rate G (lhd) trade discharge E (ls) pipe diameter and gradient pipe connectivity CSO consent pass forward rate (ls) pumping station rate (ls) sewage treatment flow rate (ls) A wastewater dry weather capacity map calculates pipe full capacity dry weather flow (PG+E+I) and Formula A flow for fully combined (1360P+2E+DWF) and separate (4PG+3I+E) areas of the network Infiltration (I) is assumed to be 50 PG +E
205240txt012|May 2013
25
Drainage Strategy Framework
A theoretical assessment of network capacity is then calculated by comparing Formula A with pipe full capacity flow consent values at CSOs and wastewater treatment works and pumping rates This determines areas of the network with a capacity shortfall with a potential capacity shortfall and with no capacity shortfall
When run across the whole company area approximately 100 out of 500 drainage areas were found to be under capacity Over 60 of these areas had recorded sewer flooding incidents In over 300 drainage areas there was no forecast capacity shortfall Only 7 of these drainage areas had recorded sewer flooding incidents Overall the system proved to be very reliable at predicting drainage areas likely to have sewer flooding problems because of sewer under‐capacity
In under capacity drainage areas an intermediate (hydraulic model based) assessment is then carried out Figure 11 shows the results thematically mapped for an example drainage area Red areas are predicted to have a very high risk of sewer flooding Yellow and green areas are predicted to have a low risk of sewer flooding
Figure 11 Example of a drainage area capacity map
205240txt012|May 2013
26
24
Drainage Strategy Framework
Principle Four Whole Life Costs and Benefits
Strategies should be informed by consideration of whole life costs and benefits They should promote a series of interventions which in view of the quantified uncertainties are most likely to result in performance indicators which demonstrate the achievement of outcomes at lowest cost to customers and the community more widely
Costs relate to capital and operational expenditure to deliver interventions and the monetised impacts of drainage failures such as flooding and pollution
Benefits relate to the reduction in risks from drainage failures such as flooding and pollution but should also include wider societal impacts such as those calculated using a lsquoPayments for Ecosystems Servicesrsquo approach
When considering the lsquowhole lifersquo the strategy should consider climate population and asset deterioration trends These are likely to increase risks over the long term if no interventions are made The strategy should state lsquowhatrsquo should be done but also broadly lsquowhenrsquo and in what sequence interventions should happen
241 Recommended good practice
No Good practice Example references
1 Predict risks into the future for at least two epochs le10 years (to understand what the company needs to do now and how this fits with longer term outcomes) and ge30 years to understand long term needs in light of changing population and other pressures
Account for the following changes in demand
bull Growth ‐ new homes and businesses
bull Urban creep ndash uncontrolled addition of connected impermeable area
bull Climate change ndash affecting design events (flood predictions) time‐series (CSO and treated effluent quantities) river flows and temperatures
bull Infiltrationexfiltration ndash through deteriorating sewer condition
bull Dry weather flows ndash through changes in water consumption rates
2 Combining monetised risks (associated with sewerage failures) determine whole life costs for a lsquodo nothingrsquo scenario (ie no interventions)
Include costs associated with electricity consumption (in the network and at the wastewater treatment works) and CO2 emissions
UKWIR will publish in 2014 a revision to their Long Term Least Cost Planning for Wastewater Supply‐Demand
guidance This may provide tools and methods for expressing costs and benefits to support the development of a Drainage Strategy
205240txt012|May 2013
27
Drainage Strategy Framework
No Good practice Example references
3 Test intervention strategies which keep performance indicators on track to deliver outcomes by adding capacity (supply) reducing flows (demand) or altering operational regimes
Include the costs of interventions and the benefits of reduced risks to inform selection of the most cost beneficial strategy over the whole life
Have regard to the timing of interventions recognising that uncertainty may require low‐regrets (insensitive to uncertainty) solutions and that delaying major interventions may be more affordable and attractive in the short term Discounting should be used to compare the costs and benefits of interventions occurring at different times
Recognise that some interventions will be obligatory and defined (eg maintenance of a spill frequency standard at a CSO) whilst others will be more discretionary focused on achieving outcomes rather than specific outputs
SRM5 (Section 8) defines and contrasts cost benefit analysis cost effectiveness analysis whole life cost analysis and risk cost benefit analysis
HM Treasury Green Book39
sets out a framework for the appraisal of long term projects which can be applied to the development of a Drainage Strategy
4 Donrsquot at first be concerned with the distribution of costs and benefits between partners who may be sharing costs Identify the most cost beneficial solution first and then debate and agree an equitable sharing of costs
Give equal weighting to OPEX (operating expenditure) and CAPEX (capital expenditure) costs so not to cause bias towards capital intensive solutions Properly consider the costs and benefits of pro‐active maintenance regimes and campaigns to influence customers to reduce fats oils and greases (FOG) build‐ups and the misuse of sewers
Consider the affordability of solutions the impact on customersrsquo bills and the resources of other organisations to play their part
UKWIR research outputs40 in 2013 (SW01) will provide a framework for making a business case for separating storm water from combined sewers
5 Where interventions include the provision of green space public amenity and improved habitats then Payment for Ecosystem Services approaches should be used to identify further monetised benefits in the appraisal Customers should be consulted to help value these benefits
Supplementary Green Book41
guidance describes methods for accounting for environmental impacts including the ecosystems approach
39 httpwwwhm‐treasurygovukdata_greenbook_indexhtm 40 httpwwwukwirorgpublishorsystemcomponent_viewaspLogDocId=96116 41 httpwwwhm‐treasurygovukdaccounting_environmental_impactspdf
205240txt012|May 2013
28
Drainage Strategy Framework
242 Good practice example ndash Severn Trent Water making the case for surface water separation in Stoke-on-Trent
In this example42 Severn Trent Water compared alternative ways of addressing sewer flooding problems by looking at a range of costs and benefits not all of which were directly associated with its specific responsibilities as a water and sewerage company Whilst the example does not express a monetised value for all costs and benefits over the whole life it does illustrate the types of factors which could be included in an appraisal of this type scaled to address problems at a catchment level It also demonstrates how working collaboratively can help identify solutions which are cost‐beneficial for the community at large
In an area of Stoke served by a combined sewer system five properties were at risk from sewer flooding in cellars for events equal to and less frequent than the 1 in 10 year probability A conventional sewer pumping station based solution was presented as the standard option
However a nearby former hospital site was also undergoing re‐development which would result in reduced runoff to the combined sewer The new drainage regime in the redevelopment site was sufficient to remove the flood risk at the five properties (this was a do nothing strategy)
A third option completely separated the development site runoff from the combined sewer and also addressed local flood risk issues nearby The solution required a new storm sewer and a network of swales and other SuDS features connecting with an ordinary watercourse
Table 1 illustrates how costs and benefits were compared across the three alternative strategies Each provided the same benefit in terms of the number of homes (5) relieved from sewer flooding The novel SuDS and surface water management solution additionally gave local flood risk relief to 3 further properties The separationSuDS strategy came at a higher capital cost but delivered greater social cost benefits savings in annual operating costs and a bonus improvement water quality (because of reduced CSO spill volume) Severn Trent selected the separation SuDS solution because the higher capital costs were offset by other benefits
Table 1 Costs and benefits of drainage improvements in part of Stoke-on-Trent
Do nothing Standard option
SuDS
Sewer flooding benefits 5 5 5
Other flooding benefits 0 0 3
Change in runoff to combined sewer (m3year) 0 0 ‐40000
Estimated cost (pound) 0 168000 419000
42httpwwwciwemorgmedia695460Paper203_Creating20Sewer20Capacity_Presentation2 0by20Mike20Woodpdf
205240txt012|May 2013
29
Drainage Strategy Framework
Do nothing Standard option
SuDS
Social Cost Benefit (pound) 16000 5000 51000
Change in electricity costs (poundyear) 0 +75 ‐525
Programme impact (years to deliver solution) + 4 0 +4
CSO spill volume (m3 in 1year event) +298 0 ‐397
243 Good practice example ndash New York City comparison of grey and green infrastructure drainage strategies
This example is taken from New York in the United States of America Itrsquos an illustration of how whole life costs have been compared for alternative strategies to solve urban drainage issues on a mega‐city scale The key data are summarised in Table 2
Table 2 Comparing drainage strategies in New York
Grey Strategy
Green Strategy
CSO spill volume reduction (billion gallons year)
101 122
Wider benefits over 20 years ($ million) 0 139 to 418
Whole life costs over 20 years ($ billion) 68 53
The information is taken from the New York City Green Infrastructure Plan43 produced by the Mayorrsquos Office in 2010 The Plan (and recent updates) provides a comprehensive evidence base around costs and benefits of different approaches to address the cityrsquos drainage problems It is therefore an excellent example of how drainage strategies can be described in plain language for a non‐specialist audience concerned with their environment and the cost of providing infrastructure to enhance it
It is becoming commonplace for North American cities (eg Portland and Philadelphia) to address the issue of frequent combined sewer overflow (CSO) operation by using a combination of grey infrastructure (sewers) and green infrastructure (sustainable drainage systems) The wider health
43 httpwwwnycgovhtmldephtmlstormwaternyc_green_infrastructure_planshtml
205240txt012|May 2013
30
25
Drainage Strategy Framework
and ecological benefits of green infrastructure approaches and the reduced reliance on materials and energy are attractive to utility planners and cities alike
New York has 422 CSOs and an agreed Long Term Control Strategy to significantly reduce the impact wet weather discharges have on aquatic systems throughout the city Annual discharges are currently (2010) estimated to be 30 billion gallons (114 million cubic meters) per year Building on existing and committed new sewer plans an agreed grey infrastructure based strategy to this problem is set to reduce these discharges to 198 billion gallons per year (a 34 reduction) by the 2030s An alternative green infrastructure approach based around intercepting the first inch (25mm) of rainfall across 10 of the impermeable city area by 2030 is predicted to reduce CSO spills to 179 billion gallons per year
Planners have calculated that the whole life costs after 20 years of the grey infrastructure solution will be $68 billion (2010 prices) compared to the green infrastructure whole life costs of $53 billion The green infrastructure strategy reduces CSO spills by more than the grey alternative for $15 billion less in terms of whole life cost Further planners have calculated that New Yorkers will benefit by up to $41844 million (accumulated over 20 years) in additional benefits associated with lower energy bills from control of urban heating increased property values and improved health
Based on this analysis New York City has committed itself to an aggressive green infrastructure based runoff control strategy to provide long term reductions in CSO spills The plan is to achieve interception of 15 of impermeable area by 2015 4 by 2020 7 by 2025 and 10 by 2030
Principle Five Live Process
The Strategy should be adaptable and periodically reviewed Whilst outcomes are expected to be relatively stable over time the pace at which the Strategy delivers outcomes will be linked to volatile influences (like climate and population change) and to the decisions made at each price review about the priorities for the following period The Strategy should be reviewed at regular intervals to reflect investments already made the changing priorities of the water and sewerage company and partners and the presence of emerging risks The review is also an opportunity to report drainage catchment performance relative to performance measures designed to monitor progress towards achieving outcomes
44 Estimated using methods from the New York Municipal Forest Resource Analysis (MFRA) prepared by the US Dept of Agriculture
205240txt012|May 2013
31
Drainage Strategy Framework
251 Recommended good practice
No Good practice Example references
1 Regularly repeat screening exercise to determine catchments requiring a Drainage Strategy and modify programme of Strategy development accordingly
Check for changes in measured rates of flooding and pollution incidents blockages collapses pumping station failures etc
Check for changes in extent and location of new development
Check for activities being undertaken by partners (eg redevelopment urban realm improvements and flooding and pollution management activities)
SRM5 illustrates how improved and updated knowledge of system performance should be applied to establish Strategies
2 In lsquolive Strategiesrsquo repeat risk assessment when data and models improve and adjust confidence scores accordingly
Confirm that Strategy will still achieve performance indicators and outcomes at least cost Revise Strategy as necessary
3 Periodically refresh Strategy accommodating impact of interventions already delivered using re‐verified predictive tools as appropriate
Confirm that Strategy will still achieve performance indicators and outcomes at least cost Revise Strategy as necessary
Triggers for a wholesale review of the Strategy are likely to be significant changes to the location or extent of planned development
4 Monitor report and share (with partners) the measures used to demonstrate delivery of outcomes Example measures may include the number of properties which experience sewer flooding the number of properties at risk of flooding the number of properties at risk from sewerage asset failure risk indices that capture both the probability and consequence of failure customer satisfaction with regards to clean rivers and beaches the number of pollution incidents the frequency of combined sewer overflow operation and compliance with discharge permit conditions
252 Good practice example ndash Thames Water live DAP
Thames Water has initiated a DAP (drainage area plan) Live approach Itrsquos a good example of how companies are continuously monitoring and updating the status of drainage area risks It provides a lsquoliversquo snapshot of the current health of all drainage areas in Thames Waterrsquos region allowing real time planning as part of a strategic approach It enables drainage planners to view the effectiveness
205240txt012|May 2013
32
Drainage Strategy Framework
of intervention strategies and compare incident rates across varying geographies and development types in the Thames Valley
DAP Live will be available for all catchments in the Thames Water area thus enabling
bull high level monitoring of risks across the business bull a live and strategic review of catchment performance bull prioritisation of catchments based on risk and bull an ability to share data with partners collaborating in drainage planning and improvements
Figure 12 illustrates the types of data managed through the DAP Live system These include asset data political and drainage boundaries environmental data operational data property amp growth data and modelling data As new data become available the DAP Live system is updated so that drainage planners have the most current view on emerging risks and issues
Asset data
Operational data
Property and growth data
Modelling data
Environmental data
Boundaries (SDACs operational political)
Figure 12 Data types held in the DAP Live system
Figure 13 illustrates how the system can provide analysis at a variety of scales from local authority boundaries sewage treatment works catchments drainage areas or a regular grid
205240txt012|May 2013
33
Drainage Strategy Framework
NE PROVINCES
WESTERN PROVINCES
NE LONDON bull Ops areas local W LONDON
SE LONDON authorities Large TIDWORTH SE PROVINCES
bull STW Catchments
bull Drainage areas(SDACs)
bull Regular grid Small
Figure 13 DAP Live reporting performance at different scales
205240txt012|May 2013
34
Drainage Strategy Framework
253 Good practice example ndash Wessex Water Water live data
Wessex Water is regularly using data geospatially to proactively identify and respond to risk Theirs is a good example of how data can be used to provide an adaptable approach that is regularly reviewed to plan investment
The risk‐based and live approach uses a set of likelihood and consequence models which are built up from all currently available data asset data (eg CCTV data material age) operational data (eg flooding and pollutions incidents) and information (eg locality near hospital or downstream of an overflow) All these data are collated for the entire Wessex region updated regularly and analysed geospatially
Figure 14 Sewer risk scores presented in a risk matrix and geospatially
This allows a risk score (Figure 14) to be calculated for each mapped sewer length which directs investigation more efficiently by allocating each mapped sewer a planned CCTV inspection date
This risk‐based approach has been successful in targeting problematic sewers increasing identification rates threefold Density analysis is performed using asset failure and operational information which allows planning of both proactive structural and operational investment
Proactively found structural issues are far more cost effective to repair before failure and can also prevent serviceability issues
205240txt012|May 2013
35
f
DDrainage Strateegy Frameworrk
Figgure 15 Hotsppot analysis
Thhe hotspot annalysis (Figuure 15) showss where operrational clustters have beeen calculatedd This hootspot analyssis is made aavailable on tthe Wessex WWater corporrate GIS to a llow operati onal staff to target their effforts to mitiggate against ffurther repeaat incidents AAdditional innformation ffrom asset annd operationnal activities ccan be addedd regularly too the databasses which drrive the mod els enabling rissk scores to bbe kept as livve as require d
226 Prrinciple Sixx Innovativve and Susstainable SSolutions
Thhe Drainage Strategy Fraamework proomotes the fuull evaluationn of alternatiives to tradit ionally enngineered sewwerage soluttions to test wwhether thesse offer loweer whole life ccost options or better reesponses to uuncertainty It is anticipaated that draainage solutioons of the futture will be ddifferent froom the ones we are usedd to
Thhese should iinclude (at leeast at a highh level) real ttime control storm waterr retrofit techhniques edducation to eenable custommers to changge behaviou r enhancingg incentives for customerss to reduce suurface water flowing to seewers and innnovative pe rmitting arraangements a cross drainagge networks annd sewage tr eatment worrks Water annd sewerage companies sshould continnue to revieww and deevelop other innovative ssolutions
Foor example wwhere a commpany may hiistorically haave preferredd to tackle seewer floodingg or coombined sewwer overflow pollution byy increasing iits undergrouund equipmment to store mmore rainfalll duuring stormss it might connsider other options in fuuture ndash such as working wwith custommers to mmanage the raainfall close tt eventing it foorm enteringg the sewer syystem o source pre
2205240txt012|Mayy 2013
36
Drainage Strategy Framework
261 Recommended good practice
No Good practice Example references
1 Use cost‐benefit methods to demonstrate that innovative and sustainable solution types provide best value for customers and the wider community
UKWIR will publish new research and guidance in 2013 addressing active control and storm water removal demonstrating how these technologies can be justified and included within Drainage Strategies
2 Consider integrated water resource management Work with partners (especially developers and local authorities) to examine whether use of stored stormwater reduces potable water consumption AND need for capacity in sewers
CIRIA has published a scoping study for water sensitive urban design45 in the UK
3 Consider a mix of conventional and new technologies using more adaptive approaches as low‐regrets responses to uncertainty eg prevent current sewer flooding with underground tank storage but address future risks (worsened by climate change) with retrofit SuDS implemented progressively
CIRIA has published lsquoRetrofitting to manage surface waterrsquo46 a comprehensive guide to planning and delivering this type of project
4 Use carbon accounting methods to compare embodied and emitted carbon in alternative intervention strategies so that these impacts are accounted for in whole life costs
Consider the benefits of surface water removal on the costs (including carbon) of pumping and sewage treatment
UKWIR47 has and continues to publish detailed guidance on carbon accounting for water and sewerage company use
45httpwwwciriaorgserviceresearch_informationAMContentManagerNet ContentDisplayaspxSection=research_informationampContentID=23581 46httpwwwciriaorgSERVICEHomecoreordersproductaspxcatid=5ampprodid=1909 47httpukwirforefront‐librarycomreports08‐cl‐01‐6923419000190269902659465890269
205240txt012|May 2013
37
Drainage Strategy Framework
No Good practice Example references
5 Where interventions include the provision of green space public amenity and improved habitats then Payment for Ecosystem Services approaches can be used to claim further monetised benefits in the appraisal Customers should be consulted to help value these benefits
The Environment Agency will publish data in 2013 on costs and benefits of retrofit stormwater projects to promote understanding and uptake
6 Share data within the industry on innovative solutions to increase knowledge of new technology and SuDs approaches
EA retrofitting SuDs costs and benefits database48
accommodating data from Ofwat AMP5 SuDS pilot initiative and other examples
262 Good practice example ndash Welsh Water surface water reduction and removal strategy for Gowerton and Llanelli
Dŵr Cymru Welsh Water and partners are applying innovative storm water removal methods to address capacity problems in the sewer network in Gowerton and Llanelli49 (population 140000) Current under capacity leads to localised sewer flooding and excessive combined sewer overflow (CSO) spill to the Burry Inlet a protected shellfish water and special area of conservation The capacity problems in the system were a concern for the Environment Agency (Wales) and there was a risk of widespread restrictions to economic development being imposed Dŵr Cymru Welsh Water Carmarthenshire County Council City and County of Swansea Consumer Council for Water Environment Agency Wales and the Welsh Government all worked in partnership to resolve the situation
A brand new hydraulic model was built for the entire sewerage network with particular attention paid to accurately representing the sources of storm run‐off and infiltration The model was verified against data from flow monitors and observed CSO spill frequencies into the Burry Inlet
To begin with a traditional sewer storage solution was proposed that would result in an average 10 spills a year into the shellfish water from all 90 CSOs in the two catchments Although this reduced spills and dealt with some of the flooding and growth issues the storage requirements would have been unaffordable provide no protection against long term climate change and would not tackle the fundamental problem of too much surface water getting into the combined network
An alternative approach based on the reduction and removal of storm water from the combined sewer system was also developed This was in accordance with Dŵr Cymru Welsh Waterrsquos Rainscape50 (surface water elimination and reduction) strategy To identify areas with the most
48httpevidenceenvironment‐agencygovukfcermenDefaultHomeAndLeisureFloodsWhatWereDoingIntoTheFutureScience ProgrammeResearchAndDevelopmentFCRMProjectaspxProjectID=15515be8‐bbed‐4204‐ae56‐3e810ba47694ampPageID=56bad68e‐dcb1‐4bf8‐84cc‐cbfd03ab63a2 49 httpwwwciwemorgmedia674511Paper20820Stephen20Ollierpdf 50httpwwwdwrcymrucom_libraryleaflets_publications_english
205240txt012|May 2013
38
Drainage Strategy Framework
potential for effective storm water removal a flowareaflooding thematic map was developed This was used to focus attention on areas which would deliver the most benefit if storm water removal was carried out These areas are coloured red in Figure 16
Figure 16 Thematic map showing areas of maximum potential for storm water removal
The following interventions (181 in total) were combined into single strategy to be delivered in phases by 2015 2020 and afterwards
bull The management of surface water through swales basins and soakaways rather than through combined sewers resulting in new amenity and ecological areas within the built‐up environment
bull Implementing smarter flow control to better use existing storage and conveyance assets bull Relining of sewers to prevent groundwater ingress bull Removal of land drainage connections to sewers bull Household rainwater harvesting retrofit schemes
surface_water_management_strategypdf
205240txt012|May 2013
39
Drainage Strategy Framework
Figure 17 is an artistrsquos impression of what one of the sustainable urban drainage system solutions may look like
Figure 17 Example retrofit SuDS solution proposed for Gowerton and Llanelli
Modelling has demonstrated that the alternative strategy will achieve the same CSO reduction benefit as the storage strategy together with flooding improvements and additional less tangible benefits at significantly lower cost than the traditional sewer storage solution
Figure 18 illustrates the dispersed nature of solutions identified for central Llanelli
Figure 18 Water sensitive urban design interventions planned for central Llanelli
205240txt012|May 2013
40
Drainage Strategy Framework
Appendix A
Glossary
205240txt012|May 2013
Drainage Strategy Framework
Appendix A Glossary
CAPEX Capital expenditure Appointed water and sewerage companiesrsquo spending on new replacement or refurbished capital assets such as construction or buying machinery
CIWEM Urban Drainage Group (WaPUG) A group of the Chartered Institution of Water and Environmental Management supporting professionals working in urban drainage
Combined Sewer Overflow (CSO) The discharge of untreated sewage diluted with storm water into rivers and the sea CSOs occur during heavy rain and are necessary to reduce the risk of sewer flooding The physical overflow structure is also called a CSO
Common Framework for Capital A planning approach developed for the water and Maintenance Planning sewerage companies in 2002 which provides a robust basis
for assessing future capital maintenance needs The approach is consistent with the needs of Ofwat
Defra The Department for Environment Food and Rural Affairs The Government Department with responsibility for water flooding and water quality in England
Drainage Area Plan (DAP) A detailed plan for a drainage catchment that prioritises a list of interventions based on risk using an approach established in the WRc Sewerage Rehabilitation Manual This approach has been succeeded by Sewerage Risk Management which guides the preparation of Sewerage Management Plans (SMP) Companies vary in how they prepare DAPs or SMPs (or their equivalents) following the general principles that have been established
Drainage Strategy Developed by water and sewerage companies to demonstrate how outcomes will be delivered in drainage catchments over the long term Drainage Strategies will use the information developed in producing a DAPSMP and if a drainage strategy has been produced this should be the starting point in producing a more detailed DAPSMP should this be required It is likely that the activities required to prepare DAPSMP and Drainage Strategies may overlap Drainage Strategies might not refer to specific interventions but instead outline a general approach
Drainage Strategy Framework Guidance to describe the contents and intention of Drainage Strategies
205240txt012|May 2013
Drainage Strategy Framework
Flood Risk Management Plans Required by the Flood Risk Regulations in Flood Risk Areas by December 2015
Flood Risk Regulations The legislative instrument used to implement the requirements of the Floods Directive in England and Wales
Floods Directive DIRECTIVE 200760EC of the European Parliament and of the Council of 23 October 2007 on the assessment and management of flood risks
Lead Local Flood Authority (LLFA) The Shire County or unitary authority with responsibility for managing local flood risk
Local development plans Developed by planning authorities to explain where and what type of development (new homes and businesses) will occur within their area They are required to explain water infrastructure needs to support this development
Local Flood Risk Management Strategy Developed by the Lead Local Flood Authority to explain (LFRMS) how local flood risk will be managed by the Authority and
in partnership with others
Natural Resources Wales From 1 April 2013 Natural Resources Wales (NRW) a new body formed by the Welsh Government will take over the functions previously carried out by the Environment Agency (EA) in Wales alongside those of the Forestry Commission Wales and the Countryside Council for Wales
Ofwat The Water Services Regulation Authority ndash the economic regulator of the water and sewerage companies of England and Wales
OPEX Operating expenditure Appointed water and sewerage companiesrsquo day‐to‐day spending on running the services for example staff costs and power This is likely to include investment in joint projects that do not create or relate to an asset that the company solely or jointly owns
Outcomes Outcomes are the higher level objectives that a companyrsquos actions are intended to deliver A companyrsquos outcome should reflect its customersrsquo priorities identified through appropriate customer engagement and deliver the best long‐term sustainable solution for customers and the environment An outcome may not be bound by a single price control period and should be set in the context of customersrsquo and the environmentrsquos long‐term needs
205240txt012|May 2013
Drainage Strategy Framework
Price Review The process of setting appointed water and sewerage companiesrsquo price limits The next price review will take place in 2014 for the period 2015‐20 Ofwat currently sets price limits every five years
Real Time Control (RTC) Using actuated pumps gates and weirs to actively control flow in sewers Better use can be made of existing infrastructure and links can be made between network treatment and receiving water systems for operational benefits Sometimes referred to as Active Management
River Basin Management (Plans) River Basin Management is a continuous process of planning (to develop River Basin Management Plans) and delivery The Water Framework Directive introduces a formal series of 6 year cycles The first cycle will end in 2015 when following further planning and consultation the River Basin Management Plans will be updated and reissued
Sewerage Management Plan A risk based approach to indentifying investment needs in sewerage systems as described in the Sewerage Risk Management (SRM) approach developed by WRc plc
Storm water retrofit Releasing capacity in sewers by controlling stormwater at the surface using disconnection swales and other sustainable drainage systems (SuDS)
205240txt012|May 2013
We are the Environment Agency We protect and improve the environment and make it a better place for people and wildlife We operate at the place where environmental change has its greatest impact on peoplersquos lives We reduce the risks to people and properties from flooding make sure there is enough water for people and wildlife protect and improve air land and water quality and apply the environmental standards within which industry can operate Acting to reduce climate change and helping people and wildlife adapt to its consequences are at the heart of all that we do We cannot do this alone We work closely with a wide range of partners including government business local authorities other agencies civil society groups and the communities we serve
wwwenvironment‐agencygovuk
Environment Agency National Customer Contact Centre
Telephone 03708 506 506 enquiriesenvironment‐agencygovuk
Ofwat (The Water Services Regulation Authority) is a non‐ministerial government department We are responsible for making sure that the water and sewerage sectors in England and Wales provide consumers with a good quality and efficient service at a fair price
wwwofwatgovuk
Telephone 0121 644 7500 mailboxofwatgsigovuk
Halcrow Group Limited Burderop Park Swindon Wiltshire SN4 0QD
tel 01793 812479 fax 01793 812089 halcrowcom
Halcrow Group Limited is a CH2M HILL company Halcrow Group Limited has prepared this report in accordance with
the instructions of The Environment Agency for the clientrsquos sole and specific use Any other persons who use any information contained herein do so at their own risk
Drainage Strategy Framework
1 Introduction 11 Background and Purpose
Water for Life1 recognised that longer term planning for water and sewerage company drainage infrastructure has had less focus than water supply infrastructure It set out a commitment to ensure a more strategic approach to drainage planning This is important to demonstrate that economic growth is supported the environment continues to be protected and that climate change adaptation2 is planned for appropriately
Since privatisation water and sewerage companies have invested to achieve significant improvements to the environment and the service customers receive notably reducing the number of properties known to be at risk of flooding This investment has been a reaction to the issues inherited at privatisation It is now appropriate to look forward to ensure that water and sewerage companies working together with other partners are able to deliver the outcomes that customers need and want
For the next price review water and sewerage companies will propose a number of high level outcomes that they will deliver An outcome should reflect their customersrsquo priorities identified through appropriate customer engagement and deliver the best long‐term sustainable solution for customers and the environment An outcome may not be bound by a single price control period and should be set in the context of customersrsquo and the environmentrsquos long term needs
Outcomes are likely to be framed at a high level for each water and sewerage companyrsquos area However the way in which these outcomes are delivered in a particular drainage catchment will depend on the characteristics of that catchment and the partners that the water and sewerage companies work with
Companies will set out the measures they will use to demonstrate delivery of outcomes An UKWIR study3 has described example measures that include the number of properties which experience sewer flooding the number of properties at risk of flooding the number of properties at risk from sewerage asset failure risk indices that capture both the probability and consequence of failure customer satisfaction with regards to clean rivers and beaches the number of pollution incidents the frequency of combined sewer overflow operation and compliance with discharge permit conditions3 Most measures are likely to be meaningful at a catchment scale as well as at the overall company level This Drainage Strategy Framework illustrates good practice in how to prepare a Drainage Strategy for a particular catchment that is in line with it delivering its outcomes in that location It is based around established planning approaches and emphasises six key principles It has been designed to be informative and flexible so that it can be applied in different circumstances to suit companiesrsquo needs and customersrsquo expectations Most of the elements of the framework are taken from existing good practice in water and sewerage companies However articulating and communicating a clear Drainage Strategy for an area is not yet common practice By adopting the
1 httpwwwdefragovukenvironmentqualitywaterlegislationwhitepaper 2 Ofwat has published research illustrating the predicted scale of increased sewer flooding risks due to climate change and growth httpwwwofwatgovuksustainabilityclimatechangerpt_com201106mottmacsewerpdf 3 UKWIR has published guidance on Defining and Incentivising Outcomes and Measures of Success httpwwwukwirorgukwirlibrary96066
205240txt012|May 2013
1
12
Drainage Strategy Framework
Framework principles and developing Drainage Strategies water and sewerage companies will be better able to provide greater confidence to all stakeholders that outcomes can be achieved in the long term
A Drainage Strategy should help customers and other stakeholders understand how a water and sewerage company intends to deliver its statutory functions over the long term within a particular area in a sustainable and economic manner The Drainage Strategy should explain how a water and sewerage company will do this in conjunction with other organisations (eg The Environment Agency Natural Resources Wales local authorities highways authorities housing developers)4 and how the company in turn will support these organisations in delivering their own responsibilities as well For example the Drainage Strategy should signal to housing developers and other interested parties how sewerage infrastructure will develop so that they are able to plan accordingly and contribute to economic growth
The Environment Agency Natural Resources Wales and Ofwat expect that Drainage Strategies will be developed (following a risk based approach) in accordance with the six principles in a way that suits local circumstances and customersrsquo expectations In England Defra has described5 the requirement for companies to continue their investment in Drainage Area Plans for the period 2015 to 2020 and subsequent planning cycles so that these can be used as the basis for the development of Drainage Strategies The Environment Agency Natural Resources Wales and Ofwat believe that companies completing Drainage Strategies will be well placed to deliver their long term outcomes
Attributes of a Drainage Strategy
A Drainage Strategy should be accessible and understandable to customers local authorities developers the Environment Agency (in England) Natural Resources Wales and other stakeholders that may be interested in what the water and sewerage company intends to do in the future It will give confidence to all stakeholders that the water and sewerage company will deliver their duty of providing a public sewerage system that will deliver stated outcomes The Drainage Strategy will encourage a more strategic approach that is less reactive and more proactive in providing what customers and environment requires
A Drainage Strategy should normally cover the drainage area containing public sewers serving a single wastewater treatment works although in large cities it may be prudent to sub‐divide into smaller areas Adjacent drainage catchments impacting on the same receiving water ought to be considered together When planning to accommodate growth allow for climate change and maintain or improve water quality (in rivers and the sea) it will often be necessary to consider the interaction of public sewers and wastewater treatment works
A Drainage Strategy should be developed by the water and sewerage company with a primary focus on its network of foul combined and surface water sewers However the company should work with other organisations so that their role in controlling the demand on sewers is confirmed and the company plays its part in the resolution of wider drainage surface water flooding and water pollution issues in the catchment
4 The Environment Agency and Natural Resources Wales already collaborate with local authorities to undertake strategic planning for flood risk management from rivers and the sea (eg through the control of development in floodplains) 5 httpwwwdefragovukpublications20121005pb13829‐statement‐obligations
205240txt012|May 2013
2
13
Drainage Strategy Framework
The following section (13) is provided as a generic illustration of how companies might choose to communicate the process of developing selecting and delivering a Drainage Strategy in a location Full technical analysis and documentation demonstrating how the six principles have been followed neednrsquot be made publically available as this may contain confidential complex and sensitive information It is envisaged that a Drainage Strategy could be communicated within up to 20 written pages depending on size and complexity
Suggested Elements of a Drainage Strategy for Sharing with Partners and the Public
The following is provided as an example of the type of information that could be shared publically to communicate the Drainage Strategy for a catchment
1 Provide a catchment description and map illustrating principal drainage and related water infrastructure (eg larger sewers combined sewer overflows wastewater treatment works rivers and ordinary water courses) Explain how wastewater and stormwater are collected and treated
2 Describe company aims and outcomes and how these relate to the drainage system Indicate the performance measures that will be used to monitor progress towards the achievement of outcomes Report on current and historical patterns in performance measures for the catchment (eg number of flooded properties number of pollution incidents and frequency of combined sewer overflow operation)
3 Summarise the wider drainage issues in the catchment their relation to the companyrsquos assets and the organisations consulted in the development of the Drainage Strategy (eg describe areas of significant surface water flooding)
4 Describe and quantify any pressures in the catchment that will affect the achievement of outcomes ndash eg population change urban creep new development climate change asset deterioration water consumption and environmental legislation
5 Describe how the pressures identified will influence predicted future performance measures (a do nothing scenario) Show the rate of change over time and discuss any uncertainties
6 Describe a short‐list of alternative strategies that are technically feasible and result in the achievement of outcomes for the catchment Explain the strengths weaknesses opportunities and threats of alternative strategies considering societal benefits whole life costs programming uncertainties and the role of other organisations Consider the perspectives of customers and other organisations (eg with reference to Local Flood Risk Management Strategies or River Basin Management Plans)
7 Explain the selection of a preferred strategy (with reference to SWOT analysis) and illustrate this in more detail with plans timelines and images so that stakeholders understand what might be involved and how it will impact on them A full disclosure of strategy appraisal is not necessary The roles of other organisations should be agreed and described
8 Explain how progress towards delivery of the Drainage Strategy and the achievement of outcomes will be monitored and reported
205240txt012|May 2013
3
Drainage Strategy Framework
Figure 1 Water and sewerage company Drainage Strategy interactions with other strategies plans and processes relating to flood and water quality management
Figure 1 illustrates how a water and sewerage company produced Drainage Strategy relates to the strategies plans and processes of other partner organisations in flood and water quality management The principal external (to water and sewerage company) relationships are between Drainage Strategies and
205240txt012|May 2013
4
14
Drainage Strategy Framework
bull Local Development Plans (of planning authorities) bull Flood Risk Management Plans bull Local Flood Risk Management Strategies (of Lead Local Flood Authorities) and bull River Basin Management Plans (led by the Environment Agency)
A Drainage Strategy should be risk and evidence based and should lead to companies minimising whole life costs whilst still delivering outcomes for customers and the environment It should recognise that population growth new development urban creep climate change and changing customer behaviour all exert new pressures and demands on drainage systems
A Drainage Strategy is there to facilitate both long and short term planning While relatively few Strategies are likely to be complete in advance of 2015 we expect companies to adopt a risk based prioritisation approach to develop further Strategies in the coming years Once complete more detailed planning should be consistent with the long term Strategy both up to and beyond future price reviews (although it is recognised that competing priorities may affect the pace at which outcomes are delivered)
A Drainage Strategy is likely to contain a mixture of responding to current problems pro‐actively reducing risks for predicted problems improving operational responses and acting to improve data and reduce uncertainty An example structure for a Drainage Strategy is included in Section 13
Links with Established Drainage Planning Processes
The Drainage Strategy framework encompasses and supplements established planning processes and technical guidance which have been applied selectively and adapted by water and sewerage companies (and Lead Local Flood Authorities) in recent years when planning for drainage systems
These include
bull Common Framework for Capital Maintenance Planning6
bull Sewerage Management Plans (Sewerage Risk Management 5)7
bull Urban Pollution Management 38
bull Surface Water Management Plan technical guidance9
bull Local Government Association Framework to assist the development of the Local Strategy for Flood Risk Management10
bull Long Term Least Cost Planning for Wastewater Supply‐Demand (to be superseded in 2013)11
bull Water Cycle Study Guidance (2013 revision in print) 12
These CIWEM13 Urban Drainage Group (WaPUG) published technical guides are also in widespread use
6httpwwwukwirorgukwirlibrary80474 (poundpound‐ indicating that a charge is made to access this content) 7 httpsrmwrcplccouk (poundpound) 8 httpwwwfwrorgUPM3 9 httpwwwdefragovukpublications20110610pb13546‐surface‐water‐guidance 10httpwwwlocalgovukwebguestlocal‐flood‐risk‐management‐journal_content56101713618366ARTICLE‐TEMPLATE 11 httpukwirforefront‐librarycomreports07‐rg‐08‐291714 (poundpound) 12 httpwwwenvironment‐agencygovukresearchplanning33368aspx
205240txt012|May 2013
5
Drainage Strategy Framework
bull WaPUG code of practice for the hydraulic modelling of sewers (3rd edition) bull WaPUG guide to quality modelling of sewer systems bull WaPUG integrated drainage modelling guide
The sewerage risk management and surface water management methodologies in particular share a common phased approach to understanding drainage problems and developing cost effective solutions These phases are central to good practice in drainage planning and are central to the development of a Drainage Strategy
Generically these phases include
bull Initialisation Preparation phase where data are collated to understand current issues in the system and necessary partners are consulted with to agree success measures and objectives
bull Risk assessment phase where predictive tools are used to quantify current problems and predict how these problems will change in the future
bull Options appraisal phase where the costs and benefits of alternative remedies that meet agreed objectives are considered This informs the selection of a preferred solution or solutions
bull Implementation phase where drainage improvements are financed and delivered and the effectiveness of improvements monitored
The process is cyclical indicating that it is periodically revisited to confirm previous decisions address uncertainties and adapt to a changing environment Figure 2 and Figure 3 illustrate the Sewerage Risk Management and Surface Water Management Plan planning processes
Figure 2 Sewerage Risk Management Approach (Copyright WRc plc httpsrmwrcplccouk used with permission)
13 httpwwwciwemorgknowledge‐networksgroupsurban‐drainagepublicationsmodelling‐guidesaspx
205240txt012|May 2013
6
Drainage Strategy Framework
Figure 3 Surface Water Management Plan Approach
Ofwat has previously commissioned research14 on current practice in sewerage planning and drainage area plans concluding that traditional drainage area plans are no longer widely undertaken but that these activities are generally undertaken under different guises
14httpwwwofwatgovukfuturesustainabledrainagerpt_com20111208drainagepdf
205240txt012|May 2013
7
15
Drainage Strategy Framework
Statutory Obligations and Regulatory Drivers
151 Government
Drainage planning is undertaken within a context established by a variety of Government policies and instruments These are succinctly detailed in Defrarsquos October 2012 Statement of Obligations15
(for England) which is to be referenced by water and sewerage companies in the preparation of business plans for the 2015‐2020 price review period More specific guidance over priorities for 2015‐2020 is provided in Defrarsquos16 strategic policy statement for Ofwat A Water Strategy for Wales17 will be consulted on in 2013
The key legislative drivers and Government priorities relevant to drainage planning are summarised here
bull Section 94 of the Water Industry Act 199118 describes how every water and sewerage company is under a duty to lsquoprovide improve and extend hellip a system of public sewers hellip as to ensure that the area is and continues to be effectually drainedrsquo This is relevant to drainage planning because it explicitly indicates that the sewerage system should be improved to keep pace with growing pressures over the long term this requirement is assured if a long term Drainage Strategy is in place and implemented
bull The Urban Wastewater Treatment Directive19 provides a further requirement to provide sufficient capacity in wastewater collection systems
bull The Governments in England and Wales are committed to taking an ecosystems approach to environmental management which accounts for the environmental economic and social benefits that result from an improved water environment Water and sewerage companies are encouraged to invest in natural as well as built infrastructure to deliver their desired outcomes The Natural Choice 20 demonstrated how this type of investment can deliver a wide range of positive social environmental and economic outcomes Benefits can be determined using lsquopayments for ecosystem servicesrsquo 21 methods Water and sewerage companies are encouraged to consider these approaches where they can deliver cost beneficial outcomes for their customers This is relevant to drainage planning because it encourages the use of retrofit sustainable drainage systems in place of more traditional sewer upsizing and storage Ofwat has supported water and sewerage companies to investigate these approaches through pilot studies22 in the 2010 to 2015 price review period
bull Water and sewerage companies may work in partnership with other organisations to jointly invest in shared outcomes and to discuss with customers their willingness to pay for wider
15 httpwwwdefragovukpublications20121005pb13829‐statement‐obligations 16 httpwwwdefragovukpublications20130307pb13884‐sps‐seg‐ofwat 17httpwalesgovuktopicsenvironmentcountrysideepqwaterfloodingpublicationswater‐strategyjsessionid=235D11ADCC6EEC8EE88886DD69CE0784lang=en 18 httpwwwlegislationgovukukpga199156partIVchapterI 19 httparchivedefragovukenvironmentqualitywaterwaterqualitysewageuwwtdindexhtm 20 httpwwwdefragovukenvironmentnaturalwhitepaper 21 httpwwwdefragovukenvironmentnaturalecosystems‐services 22 httpwwwofwatgovukfuturesustainabledrainage
205240txt012|May 2013
8
Drainage Strategy Framework
benefits This is relevant to sewerage planning because it encourages water and sewerage companies to partner with local authorities to resolve complex storm water management problems (for flooding or pollution control) through the use of retrofit sustainable drainage systems The wider benefits to citizens outside of the water and sewerage companyrsquos customer base can be accounted for
bull The governments of England and Wales are promoting a catchment‐based approach23 to River Basin Management Planning to meet the water quality requirements of the Water Framework Directive (WFD)24 The important aspect of the approach is that all interested parties should work together to build consensus about the best way to improve water quality and habitats Water and sewerage companies should expect to be involved in the process of agreeing objectives and the apportionment of responsibility for delivering those objectives within the river basin districts they operate The central requirements of the Water Framework Directive are to prevent deterioration in water quality aim to achieve good chemical status and aim to achieve good ecological status It additionally seeks to limit the discharge of priority substances River Basin Management Plans will undergo consultation in the second half of 2014 and be published in December 2015 thereafter the programmes of measures included become statutory requirements and the Environment Agency (in England) and Natural Resources Wales will use permit and license conditions to ensure that water and sewerage companies deliver their agreed contributions This is relevant to drainage planning because misconnections blockages mechanical failure sewer flooding and combined sewer overflows (CSOs) can all contribute to the deterioration of water quality and the failure to achieve good ecological status or meet environmental quality standards for priority substances Climate change and growth may increase these risks but water and sewerage companies are not the only polluters and need to partner to ensure that outcomes are met Defra is consulting (closing February 2013) on developing its policies with respect to the control of diffuse urban pollution25
bull A revised Bathing Water Directive (20067EC)26 applies from 2015 and by then the Governmentrsquos aim is for all bathing waters to achieve at least lsquosufficient classrsquo this is approximately twice as stringent as requirements for the current Directive Subsequent planning should aim to achieve lsquogoodrsquo or lsquoexcellentrsquo classifications This is relevant to drainage planning because CSOs other wet weather intermittent discharges final effluent discharges and misconnections can all contribute to bathing water failures Climate change and growth may increase these risks but water and sewerage companies are not the only polluters and need to partner to ensure that outcomes are met
bull Under the Flood and Water Management Act (2010)27 water and sewerage companies (in England and Wales) must act in a manner consistent with the National Flood and Coastal Erosion Risk Management (NFCERM) Strategies28 for England and Wales and have regard to
23httpwwwdefragovukenvironmentqualitywaterlegislationcatchment‐approach 24httpwwwdefragovukenvironmentqualitywaterlegislationwater‐framework‐directive 25 httpwwwdefragovukconsult20121120water‐pollution 26 httpwwwenvironment‐agencygovukbusinessregulation107017aspx 27 httpwwwdefragovukenvironmentfloodinglegislation 28 httpwwwenvironment‐agencygovukresearchpolicy130073aspx
205240txt012|May 2013
9
16
Drainage Strategy Framework
Local Flood Risk Management Strategies29 NFCERM is based around six principles community amp partnership catchment based approach sustainability risk based planning beneficiary investment and delivering multiple benefits Companies should also co‐operate with local authorities and the Environment Agency in the exercise of their functions in relation to surface water management and combined sewers under section 94 of the Water Industry Act 1991 The Flood Risk Regulations 200930 implement the Floods Directive and give particular responsibilities to Lead Local Flood Authorities In lsquoFlood Risk Areasrsquo Lead Local Flood Authorities and the Environment Agency are expected to prepare Flood Risk Management Plans that set out flood risk management objectives and measures to manage risk from local flooding The Environment Agency is required to prepare Flood Risk Management Plans for the whole of England and Wales that cover flooding from main rivers the sea and reservoirs It is important for all risk management authorities to work in an effective way to plan to manage flood risk from all sources in a way that is well coordinated across catchments and coastal cells These duties are relevant to drainage planning because of the vital (but not unlimited) role surface water and combined sewers play in reducing flood risk in urban areas The Act also makes provision for the compulsory drainage of new developments through sustainable drainage systems (SuDS) and the lsquoright to connectrsquo being conditional on SuDS being approved by the SuDS Approval Body of the Lead Local Flood Authority
bull The Climate Change Act 200831 created a legal framework to cut greenhouse gas emissions and build the UKrsquos ability to adapt to a changing climate Water and sewerage companies are expected to reduce carbon emissions and adapt to the impact of climate change over the next decades The Government published its first UK climate change risk assessment in January 2012 and this will be updated every 5 years This is relevant to drainage planning because of the carbon embodied in new drainage infrastructure the carbon emitted during the pumping and treatment of sewage and the increase in flooding and pollution that will occur if climate change adaptations are not made The Government expects Ofwat to work towards the targets of its Adaptation Report and to ensure that its regulatory approach explicitly supports companies in adapting to climate change
bull From October 2011 the Water Industry (Schemes for Adoption of Private Sewers) Regulations 201132 transferred responsibility for existing private sewers and lateral drains to water and sewerage companies Pumping stations will be transferred by October 2016 This is relevant to drainage planning because of the significant increase in assets now within the responsibility of the water and sewerage company and the need to understand and respond to risks therein
Six Guiding Principles for a Drainage Strategy
This Drainage Strategy Framework describes good practice themed around six guiding principles Adherence to these principles will help ensure a Drainage Strategy which meets the expectations of Defra the Welsh Government the Environment Agency Natural Resources Wales and Ofwat and
29 The Local Government Association has published guidance on Local Flood Risk Management Strategies httpwwwlocalgovukcdocument_libraryget_fileuuid=a2538b94‐d3c1‐4cec‐81b0‐8aefd2996c5eampgroupId=10171 30 httpwwwenvironment‐agencygovukresearchplanning125459aspx 31 httpwwwdeccgovukencontentcmslegislationcc_act_08cc_act_08aspx 32 httpwwwlegislationgovukukdsi20119780111510933contents
205240txt012|May 2013
10
Drainage Strategy Framework
will be an essential means of communicating with customers and other partners Further details on each principle are described in Section 2 of this document along with examples of good practice
The six principles are
161 Partnership
Water and sewerage companies cannot develop optimal Drainage Strategies on their own and therefore partnership is key to developing and defining objectives performance indicators and the milestones that will need to be achieved in order to achieve measures that will demonstrate the delivery of outcomes Strategies should be developed and implemented in partnership with customers developers Lead Local Flood Authorities planning authorities the Environment Agency and Natural Resources Wales Strategies should align with (informing and informed by) River Basin Management Plans Local Flood Risk Management Strategies Flood Risk Management Plans and local plans (from planning authorities)
162 Uncertainty
Strategies should explain the reliability of data and knowledge about current and future performance of drainage systems They should explain what steps are planned to improve this understanding and how this will benefit customers Where future performance is uncertain (eg because of sensitivity to climate change) they should explain how adaptive approaches will be used to ensure outcomes are met The uncertainty in predictions of future risks should be recognised and accommodated within decision making
163 Risk based
Strategies should be risk based This means that planning operational and investment activities should be based on consideration of the probability and consequence of inadequate drainage function (risks) as these relate to the achievement of measures that demonstrate delivery of outcomes A risk based strategy ensures that investment is made where risks are the greatest
To aid communication risks should be visualised through maps and plans (Figure 10 is an example) To aid risk assessment risks should be monetised combined and predicted into the future To aid options appraisal the impact of interventions on the level of risk should be predicted
The approach to Drainage Strategy development should be risk based itself The degree of detail included should be related to an understanding of the overall level of risks in the catchment now and in the future
164 Whole life costs and benefits
Strategies should be informed by consideration of whole life costs and benefits They should promote a series of interventions which in view of the quantified uncertainties are most likely to result in performance indicators which demonstrate the achievement of outcomes at lowest cost to customers and the community more widely
Costs relate to capital and operational expenditure to deliver interventions and the monetised impacts of drainage failures such as flooding and pollution
Benefits relate to the reduction in risks from drainage failures such as flooding and pollution but should also include wider societal impacts such as those calculated using a lsquoPayments for Ecosystems Servicesrsquo approach
205240txt012|May 2013
11
17
Drainage Strategy Framework
When considering the lsquowhole lifersquo the strategy should consider climate population and asset deterioration trends These are likely to increase risks over the long term if no interventions are made The strategy should state lsquowhatrsquo should be done but also broadly lsquowhenrsquo and in what sequence interventions should happen
165 Live process
The Strategy should be adaptable and periodically reviewed Whilst outcomes are expected to be relatively stable over time the pace at which the strategy delivers outcomes will be linked to volatile influences (like climate and population change) and the decisions made at each price review about the priorities for the following period The strategy should be reviewed at regular intervals to reflect investments already made the changing priorities of the water and sewerage company and partners and the presence of emerging risks The review is also an opportunity to report drainage catchment performance relative to performance measures designed to monitor progress towards achieving outcomes
166 Innovative and sustainable
The framework promotes the full evaluation of alternatives to traditionally engineered sewerage solutions to test whether these offer lower whole life cost options or better responses to uncertainty It is anticipated that drainage solutions of the future will be different from the ones we are used to
These should include (at least at a high level) real time control or active management storm water retrofit techniques education to enable customers to change behaviour enhancing incentives for customers to reduce surface water flowing to sewers and innovative permitting arrangements across drainage networks and wastewater treatment works Water and sewerage companies should continue to review and develop other innovative solutions
For example where a company may historically have preferred to tackle sewer flooding or combined sewer overflow pollution by increasing its underground equipment to store more rainfall during storms it might consider other options in future such as working with customers to manage the rainfall close to source preventing it from entering the sewer system
Mapping the Framework to Current Planning Processes
We assume that practitioners will be following a broad and generic four‐stage planning process common to the Sewerage Risk Management (SRM5) and Surface Water Management Plan (SWMP) processes when preparing Drainage Strategies
Figure 4 is provided to guide water and sewerage companies in the development of Drainage Strategies It identifies each stage of the drainage planning process and highlights the good practice principles (colour coded by theme) in the locations through the process where it is most important that they are adopted
205240txt012|May 2013
12
e
u
t
v
b
DDrainage Strateegy Frameworrk
Initializepre
Establish partne and consultat
process
Define uncertai
Prepare risk d
Partnership
epare
rship ion
nties
ata
Ris
Co
Uncertainty
k assessmen
onsultation on risk issues
Quantify uncertainties
Quantify risks
Risk based
nt Options
Consult
Plan for
Demons life cost
Whole lif costs amp benefits
s appraisal
on options
uncertainties
strate whole and benefit
fe
s Live pro
Intervent
Aligned deliv collaborat solution
Innovative sustainab
Live and vis
cess Innova sustai
tion
ery amp ive s
and le
sible
ative amp nable
Figgure 4 Draina ge Strategy frramework prinnciples mappe d to the drainaage planning pprocess
118 WWho will bennefit from tthe Framewwork
Thhe Drainage Strategy Fraamework willl benefit
bull Water andd sewerage coompanies loooking to impprove their coompany speccific drainagge planning approach and make it fit for purpoose for the deelivery of lonng term outcoomes over mmultiple pricee review cyccles It will ppoint them toowards good practice andd provide exaamples as innspiration andd to promott ne innovation
bull Organisatiions and inddividuals lookking to enga ge with the ddevelopmen t of Drainagee Strategies and scruti nise progresss towards thhe achievemeent of outcommes associateed with enabbling growth adapting tto climate chhange managging floodingg and managging water poollution
22 DDrainagee Strateegy Frammeworkk Thhis section deescribes recoommended ggood practicee against eachh of the six kkey principle s necessary too develop a DDrainage Straategy For refference linkss are made too relevant annd establisheed planning prrocesses and emerging guuidance whicch drainage planners maay find usefuul These exammples are prrovided for innformation aand referenc e only
WWater and sewwerage comppanies shouldd work towaards developiing Drainagee Strategies wwhich apply thhese approachhes in a wayy that is consiistent with thheir needs annd those of thheir customeers and paartners Partnners should ttake note of tthis advice aand prepare tto engage wiith water andd sewerage coompanies on this basis
Thhe recommennded good ppractice is orgganised withhin each prinnciple as it wwould be appproached chhronologicallly in developping a Drainaage Strategy following thhe planning pprocesses alrready esstablished in the Seweragge Risk Manaagement anddor Surface WWater Managgement Plann mmethodologiess
2205240txt012|Mayy 2013
13
21
Drainage Strategy Framework
Principle One Partnership
Water and sewerage companies cannot develop optimal Drainage Strategies on their own and therefore partnership is key to developing and defining objectives performance indicators and the milestones that will need to be achieved in order to achieve measures that will demonstrate the delivery of outcomes Strategies should be developed and implemented in partnership with customers developers Lead Local Flood Authorities planning authorities the Environment Agency and Natural Resources Wales Strategies should align (informing and informed by) with River Basin Management Plans Local Flood Risk Management Strategies Flood Risk Management Plans and local plans (from planning authorities)
205240txt012|May 2013
14
Drainage Strategy Framework
211 Recommended good practice
No Good practice Example references
1 Engage with partners in a drainage catchment to bull Explain the purpose of developing a Drainage Strategy
and partnersrsquo roles in its success amp how each party will benefit from establishing a long term Drainage Strategy
bull Explain what outcomes are and how progress towards achieving them will be measured
bull Share data and information so that a shared understanding of risks and opportunities is developed
bull Explain what current drainage system performance is and how this is expected to change in the future Use risk visualisation tools to do this
bull Explain significant uncertainties and how these affect how interventions are delivered
Thames Water has demonstrated good practice through the development of its Counters Creek sewer flooding proposals This website describes the engagement process and how customers have been kept informed
2 Engage with the following partners in the development of the Drainage Strategy
bull Lead Local Flood Authority (the drainage area may include more than one) because of its responsibilities for local flood risk management and SuDS approval
bull Planning authority (the drainage area may include more than one) because of its role in determining the location and pace of housing development
bull Highways Authority because of the connection of highway runoff to public sewer systems
bull The Environment Agency (in England) because of its responsibilities for flood risk management (strategic overview) and ensuring good ecological quality is met in water bodies
bull Natural Resources Wales (in Wales) because of its responsibilities for flood risk management (strategic oversight) and ensuing good ecological quality is met in water bodies
bull Regional Flood and Coastal Committees who help develop a mutual understanding of flood and coastal erosion risks in an area
bull Bodies representing customers (eg Consumer Council for Water large local businesses flood action groups faith communities)
bull Bodies representing local environmental concerns (eg Wildlife Trusts Rivers Trusts)
bull Water only companies and water and sewerage company departments planning and operating water supply systems Water demand management practice can have an important impact on sewerage headroom
SWMP guidance (Chapter 2) advises on the establishment of partnerships for urban flood management and how to agree and align local objectives
3 Understand alignment of planning cycles and what this means locally (eg periodic review River Basin Management Plan Local Flood Risk Management Strategy Flood Risk Management Plan local plan)
205240txt012|May 2013
15
Drainage Strategy Framework
No Good practice Example references
4 Be alert to opportunities for joint solutions andor shared funding by understanding local plans for new development re‐development improving street furniture and public open space improving parks and green infrastructure Understand Lead Local Flood Authority and Environment Agency programmes for the management of flood and pollution risks
A guide to joint funding of local flood risk management intervention has been published by Defra33 and provides relevant advice to water and sewerage companies and other partners
5 Consider water and sewerage company funded solutions which deliver third‐party non‐sewerage assets that result in the long term least cost delivery of outcomes (eg water and sewerage company funding of household rain barrels and rain gardens to prevent surface water entering sewers)
6 Use data and mapping from the Environment Agency and Natural Resources Wales to understand exposure of drainage infrastructure to extreme events (eg coastal fluvial and surface water flood maps) so that network resilience can be understood and improved if this is cost beneficial
UKWIR has completed a project in 2013 lsquoResilience building a business case for PR14 and beyondrsquo
7 Work with LLFAs and the Environment Agency (or Natural Resources Wales) to understand the effectiveness of interventions at reducing risk and use this information to improve intervention planning
The UPM3 manual (section 7) advises on post project monitoring needs for water quality driven improvements
8 Share Drainage Strategies with partners and stakeholders so that there is transparency around challenges opportunities and the roles expected of different organisations
212 Good practice example ndash South West Water working with local authorities
These examples from South West Water illustrate how the company has worked with local authorities to coordinate investments and to share resources and skills in the development of integrated urban drainage management studies and Surface Water Management Plans
bull South West Water approached Devon County Council (DCC) to pool resources in delivering two (of five) pilot integrated urban drainage management studies (IUDMs) for Exeter and Exmouth South West Water took the lead role for Exmouth but DCC led in Exeter This engagement shared costs across organisations and has facilitated the production of full Surface Water Management Plans The collaboration has resulted in a shared understanding of the urban drainage challenges faced by both organisations and has opened dialogue around investment priorities
bull In Lyme Regis South West Water supported extensive coastal erosion defence works being carried out by West Dorset District Council by accelerating a programme of sewer rehabilitation and targeting renovation of sewers in vulnerable areas
bull In partnership with Cornwall County Council (CCC) and the Environment Agency South West Water has been working on a number of key drainage issues identified by CCC in its Preliminary Flood Risk Assessment (PFRA)
33 httprandddefragovukDefaultaspxMenu=MenuampModule=MoreampLocation=NoneampCompleted=0ampProjectID=17085
205240txt012|May 2013
16
Drainage Strategy Framework
bull In Camborne South West Water has taken the opportunity to invest in sewer separation works which align with the aims of the Camborne Pool Redruth urban regeneration group supported by Cornwall Council and to promote sustainable development economic growth and a strategic aim of lsquosewers for sewagersquo
213 Good practice example ndash Northumbrian Water partnership working in Tyneside
Northumbrian Water has led a sustainable sewerage study for Tyneside34 between 2010 and 2012 It is a good example of how partner organisations can collaborate to understand and resolve drainage issues in their urban area
Its approach was informed by the fact that a shared urban drainage problem around flooding and pollution was best addressed by a shared response from all the relevant organisations The project steering group involved representatives of Northumbrian Water the Consumer Council for Water the Environment Agency and five Lead Local Flood Authorities The urban drainage system collects wastewater for a single wastewater treatment works serving a population of over 900000
Working together the group studied the impact of growth urban creep and climate change on future urban drainage issues Figure 5 illustrates how a city‐wide map of potential problem areas was generated by the project team sharing data on sewer capacity (from Northumbrian Water) population change (from the local authorities) and river flooding (the Environment Agency) It was predicted that future problems were more likely to occur in the darker shaded areas These became focus areas for the project where a range of traditional and novel drainage solutions were tested
Figure 5 Future drainage problem areas indentified through data sharing
34httpcommunicatoremailcomINfNLOjNRayfOA1rfrfYcdK‐S7UwRcYcNoWebViewaspx
205240txt012|May 2013
17
22
Drainage Strategy Framework
The project team was keen to promote its work to customers and the community and prepared a series of newsletters updating interested parties on progress and issues An example is illustrated in Figure 6
C lic k here if y ou are hav in g d if f ic u lties v iew ing th is new s letter
Ho m e A b o u t u s M e d ia ce n tre C o n tact
Issue 2
Ap ril 2012
In th is ed ition U n d e rs tan d in g th e fu tu re
S u s tain ab le d ra ina g e o p tio ns
F ind ou t more about Th e 2 0 1 1 an n ua l re po rt
Ou r e n viro n m e n ta l p o licy
Ou r co rp o ra te re sp o nsib il i ty s tra te g y
W e lcom e to th e s e con d e ditio n o f S u sta inab le se we ra g e a s ix-m on th ly n e ws le tte r p ro d u ce d to b ring yo u th e la te s t n e ws on o u r m a jo r s tud ye xp lo rin g s us tain ab le s ew e ra ge o p tions in th e Tyn e s id e a rea I h o p e yo u fin d th e in fo rm a tio n o f in te res t a n d wo u ld w e lcom e fe e db a ck o n an y o f th e issu es ra ise d
Ric ha rd W a rne ford W a s te wa te r Dire c tor
U nderstand ing the fu tu re W e a ll kn o w th e difficu lties o f a ccu ra tely p re d ic tin g th e fu tu re h ow e ve r ifw e a re to p re pa re fo r i t th e n it is s om e thin g we m us t a tte m p t As p a rt o f th is s tu d y w e a re co ns id e rin g w ha t d em a nds w ill b e p la ce d on th e d ra ina g e s ys tem s a t 2 0 20 a n d a t 2 0 50 in co rpo ra ting g ro w th u rba n cre e p a nd c lim a te cha n ge B y w o rk in g close ly w ith o u r p a rtn e rs an d u s in g th e la tes t te ch n ical res e a rch we h a ve d e ve lo p ed a n d com p u te rm od e lle d a num b e r o f s ce na rios to id en tify a n d d e fin e fu tu re ris ks Th es e ris ks in c lud e p red ic tions o f p o te n tia l floo d in g p o llu tion o r b a rrie rs to g ro w th N o w th a t w e be tte r u n d e rs ta nd th e iss u es we a re a ble to p re pa re p la ns p rom o ting o p po rtu n ities fo r s us ta in a ble d rain ag e s ys tem s in o rde r to d e live r th e b es t p oss ible s e rvice fo r o u r cu s tom e rs b a la n ced a g ains te n viro nm e n tal n e eds a n d cos ts
S usta inab le d ra inage op tions W e b e lie ve o u r a pp ro a ch re p res en ts go o d p ra ctice fo r th e m a n ag em en t o f s u rfa ce wa te r w h ich is to d ea l w ith th e s u rfa ce wa te r as c los e to s ou rce as p oss ib le A w id e ra n g e o f p o te n tial o p po rtu n ities a re b ein g id e n tifie d in c lu d in g lo ca l a n d s tra te gic o p tions
S tra te g ic o p tions a re typ ica lly la rg e r th a n th e lo ca l on es a nd in c lu d e fe a tu res s u ch as a re as o f la nd w h ich w o uld b e a llo we d to flo o d d u rin g he a vy ra in (s a crific ial s to ra g e ) a n d p e rm a n en t w e tla nd fe a tu res
L o ca l op tio ns d esp ite b ein g sm a lle r th a n th e s tra te gic o n es w ill s til l p la y a ke y ro le in th e p ro vis io n o f s us tain ab le d ra ina g e Th e ir n a tu re m e a ns de p lo ym e n t co u ld be m o re w id es p re a d th a n s tra te gic o p tions fe a tu res su ch as w a te r b u tts ra in g a rde ns a nd p e rm e ab le pa vin g co u ld b e re la tive ly e a s y to fi t in to
Figure 6 Newsletter promoting urban drainage partnership working
Principle Two Uncertainty
Strategies should explain the reliability of data and knowledge about current and future performance of drainage systems They should explain what steps are planned to improve this understanding and how this will benefit customers Where future performance is uncertain (eg because of sensitivity to climate change) they should explain how adaptive approaches will be used to ensure outcomes are met The uncertainty in predictions of future risks should be recognised and accommodated within decision making
205240txt012|May 2013
18
Drainage Strategy Framework
221 Recommended good practice
No Good practice Example references
1 Data analysed and used in the development of the strategy related to asset location dimensions condition failure and flood and pollution incidents should be assigned a confidence grading The confidence grading should be related to its accuracy completeness compatibility credibility and currency
Models used to predict blockages and collapses flooding locations polluting discharges and water quality impacts should be assigned a confidence grading based on their accuracy completeness compatibility credibility and currency
Model predictions should be assigned a confidence grading depending on the confidence in the model and whether it is being applied outside of its verification range (eg for extreme events or for atypical geographies)
The purpose of confidence grading data and model results used in strategy setting is to understand the likelihood that outcomes will be achieved in a cost efficient manner Where the outcomes remain uncertain knowledge of data confidence can be used to target improvement programmes
SRM5 (S3‐03‐17) refers to Ofwatrsquos method for recording the reliability and accuracy of regulatory data in bands A to D
The SWMP guidance (Section 319) describes an alternative system of grading data and model results
2 Use the Drainage Strategy to justify data and model improvement programmes This should be focussed on areas where risks are currently (or predicted to be) high and uncertainty in data or models reduces the ability to determine robust operational or capital solutions Poor model verification in high risk areas would be an indicator that model improvements were required
CIWEMrsquos urban drainage group has published a series of guides on hydraulic and water quality modelling They discuss model calibration verification and uses
SRM5 (S3‐04) describes how to determine where the current assessment of risk is sufficient to proceed or whether data and models should be improved
3 Improve understanding of network performance (and improve models) by using long term flow and level monitoring on sewers and CSOs
Yorkshire Water discusses its CSO
monitoring programme here
4 Demonstrate how the uncertainty in both the underlying datamodels and in the future projections is addressed in options appraisal Consider if this should be done implicitly (eg through choosing conservative assumptions) or explicitly through the use of sensitivity analysis or scenario testing
Treasury Green Book supplementary guidance illustrates how to accommodate climate change uncertainties
205240txt012|May 2013
19
Drainage Strategy Framework
No Good practice Example references
5 Population growth new homes and businesses climate change and urban creep combine to make the future highly uncertain but will almost certainly increase flooding and pollution risks from drainage systems Use the Drainage Strategy to explore different scenarios (combining the impact of these drivers) for a near term (le 10 years) and future (ge 30 years) epoch
For example combine modest growth and slight climate change (a low impact case) and contrast with high growth and significant climate change (a high impact case) Where the location of significant new development is unknown include scenarios accommodating different possibilities
Running multiple scenarios is time consuming and costly A risk based approach should be adopted to focus efforts where flooding and pollution risks are especially sensitive to changes in demand
UKWIR has published research on accounting for climate change35 and urban creep36 in sewerage planning together with more general advice on accommodating climate change in water asset management planning37
Ofwat has published research38
predicting the combined impacts of climate change urban creep and development on a national basis
6 In the face of significant uncertainties about future demands on the drainage system and their consequences the Drainage Strategy should identify low‐regrets interventions (ie ones that are robust no matter what the future holds) and ensure that solutions can be adapted if greater certainty is achieved For example through quickening the pace of SuDS retrofit activities or using (previously identified and secured) land to extend underground storage facilities Strategies which remove surface water from sewerage networks provide lsquoheadroomrsquo for unpredictable increases in demand from population and climate change
Designing Resilient Cities A guide to good practice DR Lomardi et al HIS BRE Press
7 Post project appraisal and cost monitoring should be used to capture real costs and performance so that Strategies can be updated and improved with latest information It is especially important to collate and understand the whole life costs of new technologies where industry understanding is currently poor
35httpwwwukwirorgreports03‐cl‐10‐09042794658901799019890198 (poundpound) 36httpukwirforefront‐librarycomreports10‐wm‐07‐1493273 (poundpound) 37httpukwirforefront‐librarycomreports12‐cl‐01‐1694816900019015590145901409465890155 (poundpound) 38httpwwwofwatgovuksustainabilityclimatechangerpt_com201106mottmacsewerpdf
205240txt012|May 2013
20
Drainage Strategy Framework
222 Good practice example ndash Severn Trent Waterrsquos MICAS
Severn Trent Water has developed a process to measure confidence in hydraulic models of sewer systems Modelling Investment Confidence Assessment Scoring (MICAS) was developed to provide an objective evaluation of model confidence It uses information stored in the hydraulic model about the provenance of each data element and the quality of model verification Before the approach was developed the assessment of lsquofitness for purposersquo of models was subjective and based on modellers judgment This was not always reliable and certainly not repeatable and transparent MICAS provides an objective assessment of hydraulic model quality which can be used to inform its use and prioritise improvements to input data and model verification
Figure 7 and Figure 8 illustrate how an understanding of model confidence from the MICAS assessment (right hand side images) can be used to interpret predictions of flooding (left hand side images) In Figure 7 areas at predicted high risk of flooding (red in the left hand side image) are shown to be in high confidence areas of the hydraulic model (green in the right hand side image) In contrast in Figure 8 areas at predicted high risk of flooding (red in the left hand side image) are shown to be in poor confidence areas of the hydraulic models (orange in the right hand side image) In the latter case this information is used to identify where further model improvements would be beneficial
Flood Risk MICAS
Figure 7 Modelled flood risk and MICAS confidence scores (high model confidence)
Flood Risk MICAS
Figure 8 Modelled flood risk and MICAS confidence scores (lower model confidence)
205240txt012|May 2013
21
23
Drainage Strategy Framework
Principle Three Risk Based
Strategies should be risk based This means that planning operational and investment activities should be based on consideration of the probability and consequence of inadequate drainage function (risks) as these relate to the achievement of measures that demonstrate delivery of outcomes A risk based Strategy ensures that investment is made where risks are the greatest
To aid communication risks should be visualised through maps and plans (Figure 10 is an example) To aid risk assessment risks should be monetised combined and predicted into the future To aid options appraisal the impact of interventions on the level of risk should be predicted
The approach to Drainage Strategy development should be risk based itself The degree of detail included should be related to an understanding of the overall level of risks in the catchment now and in the future
231 Recommended good practice
No Good practice Example references
1 Determine where a Drainage Strategy is required by combining current performance with external influences likely to result in deteriorating performance This stage requires no modelling or detailed assessment On a catchment‐by‐catchment (drainage area) basis understand current risks by collating data on current performance eg blockages collapses pumping station failures pollution incidents CSO spills storm tank spills internal flooding incidents external flooding incidents and infiltration rates Relate these risks to performance indicators and the achievement of outcomes Combine with information about known growth rates predictions of urban creep quantity of newly adopted lsquoprivatersquo sewers surface water flooding risks (eg from flood map for surface water) WFD water body status and bathing water status Prioritise catchments with high current risks andor factors suggesting that risks are likely to worsen significantly in the future Consider normalising scoring method for size of catchment (eg by unit area or unit length of sewer) Consult with stakeholders to confirm correct prioritisation Commence with development of Drainage Strategies for the highest ranked catchments Periodically revisit prioritisation (updating with new data) to check that priorities are still correct
The initialisation stage of a Sewer Management Plan (SMP) (described in SRM5) considers how a risk assessment can be used to prioritise which spatial units (eg catchments) should be prioritised for a SMP study
2 Visualise catchment risks (from 1) to illustrate and explain to partners the reasons for prioritisation Accommodate their views amp consider changing prioritisation to aid wider drainage planning requirements (eg increase prioritisation of a catchment with significant surface water flooding problems where close collaboration between water and sewerage company and LLFA will benefit the community)
205240txt012|May 2013
22
Drainage Strategy Framework
No Good practice Example references
3 Clearly relate sewerage risks to the performance indicators that will be used to measure progress towards achieving outcomes eg relate blockage rates to flooding and pollution incidents eg relate increase in flows to increased CSO frequency breaches of permit conditions and deterioration in receiving water quality Adopt a sourcendashpathway‐receptor model and workshop techniques to ensure that cause effect and consequences are fully captured Use performance indicators as the basis for a comprehensive risk assessment that considers likelihood (frequency) and consequence (extent degree and duration of impact) of failure expressed as risk scores Monetise risks in GBP (pound) to align with principle four (whole life costs amp benefits) Use (verified) predictive models to understand near term (lt10 years) and long term (gt30 years) risks The latter to align with principle four (whole life costs amp benefits) Align complexity of method with level of risk recognising the needs of partners eg use complex 2D flood routing models to ascertain (with greater certainty) flood mechanisms and damages where the quantity and frequency of flooding is high and interventions will be complex and costly Elsewhere more simple approaches are appropriate eg use complex UPM3 water quality modelling methods where compliance with river standards or discharge consents is already failing or is expected to do so Elsewhere more simple approaches are appropriate Combine risk scores from different risks to describe the total level of risk in a catchment Use visualisation techniques to communicate combined level of risk Combine analysis from hydraulic blockage and asset deterioration models on a catchment basis In hydraulic analysis consider flooding performance for rainfall events beyond the usually provided standard of protection to understand performance in extreme events in support of partners (especially LLFAs) and in search of cost beneficial interventions at a higher standard than normal
SRM 5 (S3‐03) details approaches to simple and more complex approaches to risk assessment that are consistent with CMPCF guidelines
4 Be alert to interactions between sewer networks and wastewater treatment plans eg by modelling the impact of changing sewer flows on wastewater treatment worksrsquo performance and costs Consider combined impact of different catchments on a single or linked water body (eg an inland river bathing water or shell fishery)
UPM3 guidance discusses approaches to understanding these interactions and applying more complex water quality impact models
5 Establish systems and apply methods to predict how interventions can reduce risks eg how a targeted and pro‐active maintenance can reduce the occurrence of sewer blockage and flooding from lsquoother causesrsquo eg how reducing infiltration can reduce CSO spills eg how reducing connected impermeable area can reduce sewer flooding
205240txt012|May 2013
23
Drainage Strategy Framework
232 Good practice example ndash United Utilities risk assessment
United Utilities has demonstrated a robust risk based approach in the development of sewerage management plans used for long term planning across their area of operations
Hydraulic models were applied in 235 catchments and configured to look at future performance and to evaluate the consequences of inadequate capacity Starting from a baseline of 2010 versions of the models were built for 2020 and 2036 epochs The following model input parameters were adjusted population water consumption infiltration planned development known sewerage improvement projects urban creep rainfall (for climate change)
Two‐dimensional (2D) modelling was used to consider the consequences of sewer flooding resulting from the changes made to reflect the future operating environments As well as the impact on homes and business (from internal and external flooding) the flood risk to critical infrastructure was also considered The operation of CSOs was considered by computing the annual spill volume duration and frequency
Finally predictions of the likelihood and consequence of sewer failure were added taking account of sewer material age and the incident records relating to similar assets
All these data were combined and weighted to generate a Sewer Management Plan (SMP) Risk Score for each length of sewer The process is illustrated in Figure 9
Figure 9 United Utilitiesrsquo process for calculating risk score in sewerage catchments
205240txt012|May 2013
24
Drainage Strategy Framework
Risk scores were summed spatially and monetised so that high priority locations could be identified Mapping and visualisation were used to communicate the results of this assessment priority areas for further investigation and how risks change through time (Figure 10)
Figure 10 Visualisation of sewerage risks
233 Good practice example ndash Northumbrian Water risk assessment
Northumbrian Water completes an annual assessment of hydraulic capacity in its sewerage network at the drainage area scale Its approach does not require hydraulic models to have been completed and yet can reliably highlight areas of under‐capacity in need of further investigation through more detailed analysis including hydraulic modelling New and emerging risk areas can also be identified by applying data for population growth which occurs through development lsquoWhat ifrsquo scenarios can be run to test when capacity limits may be overcome and flood risks potentially set to increase It demonstrates good lsquorisk basedrsquo planning principles because it shows the drainage planner where more detailed analysis is warranted
The approach uses the following data from company records population connected to sewer P water consumption rate G (lhd) trade discharge E (ls) pipe diameter and gradient pipe connectivity CSO consent pass forward rate (ls) pumping station rate (ls) sewage treatment flow rate (ls) A wastewater dry weather capacity map calculates pipe full capacity dry weather flow (PG+E+I) and Formula A flow for fully combined (1360P+2E+DWF) and separate (4PG+3I+E) areas of the network Infiltration (I) is assumed to be 50 PG +E
205240txt012|May 2013
25
Drainage Strategy Framework
A theoretical assessment of network capacity is then calculated by comparing Formula A with pipe full capacity flow consent values at CSOs and wastewater treatment works and pumping rates This determines areas of the network with a capacity shortfall with a potential capacity shortfall and with no capacity shortfall
When run across the whole company area approximately 100 out of 500 drainage areas were found to be under capacity Over 60 of these areas had recorded sewer flooding incidents In over 300 drainage areas there was no forecast capacity shortfall Only 7 of these drainage areas had recorded sewer flooding incidents Overall the system proved to be very reliable at predicting drainage areas likely to have sewer flooding problems because of sewer under‐capacity
In under capacity drainage areas an intermediate (hydraulic model based) assessment is then carried out Figure 11 shows the results thematically mapped for an example drainage area Red areas are predicted to have a very high risk of sewer flooding Yellow and green areas are predicted to have a low risk of sewer flooding
Figure 11 Example of a drainage area capacity map
205240txt012|May 2013
26
24
Drainage Strategy Framework
Principle Four Whole Life Costs and Benefits
Strategies should be informed by consideration of whole life costs and benefits They should promote a series of interventions which in view of the quantified uncertainties are most likely to result in performance indicators which demonstrate the achievement of outcomes at lowest cost to customers and the community more widely
Costs relate to capital and operational expenditure to deliver interventions and the monetised impacts of drainage failures such as flooding and pollution
Benefits relate to the reduction in risks from drainage failures such as flooding and pollution but should also include wider societal impacts such as those calculated using a lsquoPayments for Ecosystems Servicesrsquo approach
When considering the lsquowhole lifersquo the strategy should consider climate population and asset deterioration trends These are likely to increase risks over the long term if no interventions are made The strategy should state lsquowhatrsquo should be done but also broadly lsquowhenrsquo and in what sequence interventions should happen
241 Recommended good practice
No Good practice Example references
1 Predict risks into the future for at least two epochs le10 years (to understand what the company needs to do now and how this fits with longer term outcomes) and ge30 years to understand long term needs in light of changing population and other pressures
Account for the following changes in demand
bull Growth ‐ new homes and businesses
bull Urban creep ndash uncontrolled addition of connected impermeable area
bull Climate change ndash affecting design events (flood predictions) time‐series (CSO and treated effluent quantities) river flows and temperatures
bull Infiltrationexfiltration ndash through deteriorating sewer condition
bull Dry weather flows ndash through changes in water consumption rates
2 Combining monetised risks (associated with sewerage failures) determine whole life costs for a lsquodo nothingrsquo scenario (ie no interventions)
Include costs associated with electricity consumption (in the network and at the wastewater treatment works) and CO2 emissions
UKWIR will publish in 2014 a revision to their Long Term Least Cost Planning for Wastewater Supply‐Demand
guidance This may provide tools and methods for expressing costs and benefits to support the development of a Drainage Strategy
205240txt012|May 2013
27
Drainage Strategy Framework
No Good practice Example references
3 Test intervention strategies which keep performance indicators on track to deliver outcomes by adding capacity (supply) reducing flows (demand) or altering operational regimes
Include the costs of interventions and the benefits of reduced risks to inform selection of the most cost beneficial strategy over the whole life
Have regard to the timing of interventions recognising that uncertainty may require low‐regrets (insensitive to uncertainty) solutions and that delaying major interventions may be more affordable and attractive in the short term Discounting should be used to compare the costs and benefits of interventions occurring at different times
Recognise that some interventions will be obligatory and defined (eg maintenance of a spill frequency standard at a CSO) whilst others will be more discretionary focused on achieving outcomes rather than specific outputs
SRM5 (Section 8) defines and contrasts cost benefit analysis cost effectiveness analysis whole life cost analysis and risk cost benefit analysis
HM Treasury Green Book39
sets out a framework for the appraisal of long term projects which can be applied to the development of a Drainage Strategy
4 Donrsquot at first be concerned with the distribution of costs and benefits between partners who may be sharing costs Identify the most cost beneficial solution first and then debate and agree an equitable sharing of costs
Give equal weighting to OPEX (operating expenditure) and CAPEX (capital expenditure) costs so not to cause bias towards capital intensive solutions Properly consider the costs and benefits of pro‐active maintenance regimes and campaigns to influence customers to reduce fats oils and greases (FOG) build‐ups and the misuse of sewers
Consider the affordability of solutions the impact on customersrsquo bills and the resources of other organisations to play their part
UKWIR research outputs40 in 2013 (SW01) will provide a framework for making a business case for separating storm water from combined sewers
5 Where interventions include the provision of green space public amenity and improved habitats then Payment for Ecosystem Services approaches should be used to identify further monetised benefits in the appraisal Customers should be consulted to help value these benefits
Supplementary Green Book41
guidance describes methods for accounting for environmental impacts including the ecosystems approach
39 httpwwwhm‐treasurygovukdata_greenbook_indexhtm 40 httpwwwukwirorgpublishorsystemcomponent_viewaspLogDocId=96116 41 httpwwwhm‐treasurygovukdaccounting_environmental_impactspdf
205240txt012|May 2013
28
Drainage Strategy Framework
242 Good practice example ndash Severn Trent Water making the case for surface water separation in Stoke-on-Trent
In this example42 Severn Trent Water compared alternative ways of addressing sewer flooding problems by looking at a range of costs and benefits not all of which were directly associated with its specific responsibilities as a water and sewerage company Whilst the example does not express a monetised value for all costs and benefits over the whole life it does illustrate the types of factors which could be included in an appraisal of this type scaled to address problems at a catchment level It also demonstrates how working collaboratively can help identify solutions which are cost‐beneficial for the community at large
In an area of Stoke served by a combined sewer system five properties were at risk from sewer flooding in cellars for events equal to and less frequent than the 1 in 10 year probability A conventional sewer pumping station based solution was presented as the standard option
However a nearby former hospital site was also undergoing re‐development which would result in reduced runoff to the combined sewer The new drainage regime in the redevelopment site was sufficient to remove the flood risk at the five properties (this was a do nothing strategy)
A third option completely separated the development site runoff from the combined sewer and also addressed local flood risk issues nearby The solution required a new storm sewer and a network of swales and other SuDS features connecting with an ordinary watercourse
Table 1 illustrates how costs and benefits were compared across the three alternative strategies Each provided the same benefit in terms of the number of homes (5) relieved from sewer flooding The novel SuDS and surface water management solution additionally gave local flood risk relief to 3 further properties The separationSuDS strategy came at a higher capital cost but delivered greater social cost benefits savings in annual operating costs and a bonus improvement water quality (because of reduced CSO spill volume) Severn Trent selected the separation SuDS solution because the higher capital costs were offset by other benefits
Table 1 Costs and benefits of drainage improvements in part of Stoke-on-Trent
Do nothing Standard option
SuDS
Sewer flooding benefits 5 5 5
Other flooding benefits 0 0 3
Change in runoff to combined sewer (m3year) 0 0 ‐40000
Estimated cost (pound) 0 168000 419000
42httpwwwciwemorgmedia695460Paper203_Creating20Sewer20Capacity_Presentation2 0by20Mike20Woodpdf
205240txt012|May 2013
29
Drainage Strategy Framework
Do nothing Standard option
SuDS
Social Cost Benefit (pound) 16000 5000 51000
Change in electricity costs (poundyear) 0 +75 ‐525
Programme impact (years to deliver solution) + 4 0 +4
CSO spill volume (m3 in 1year event) +298 0 ‐397
243 Good practice example ndash New York City comparison of grey and green infrastructure drainage strategies
This example is taken from New York in the United States of America Itrsquos an illustration of how whole life costs have been compared for alternative strategies to solve urban drainage issues on a mega‐city scale The key data are summarised in Table 2
Table 2 Comparing drainage strategies in New York
Grey Strategy
Green Strategy
CSO spill volume reduction (billion gallons year)
101 122
Wider benefits over 20 years ($ million) 0 139 to 418
Whole life costs over 20 years ($ billion) 68 53
The information is taken from the New York City Green Infrastructure Plan43 produced by the Mayorrsquos Office in 2010 The Plan (and recent updates) provides a comprehensive evidence base around costs and benefits of different approaches to address the cityrsquos drainage problems It is therefore an excellent example of how drainage strategies can be described in plain language for a non‐specialist audience concerned with their environment and the cost of providing infrastructure to enhance it
It is becoming commonplace for North American cities (eg Portland and Philadelphia) to address the issue of frequent combined sewer overflow (CSO) operation by using a combination of grey infrastructure (sewers) and green infrastructure (sustainable drainage systems) The wider health
43 httpwwwnycgovhtmldephtmlstormwaternyc_green_infrastructure_planshtml
205240txt012|May 2013
30
25
Drainage Strategy Framework
and ecological benefits of green infrastructure approaches and the reduced reliance on materials and energy are attractive to utility planners and cities alike
New York has 422 CSOs and an agreed Long Term Control Strategy to significantly reduce the impact wet weather discharges have on aquatic systems throughout the city Annual discharges are currently (2010) estimated to be 30 billion gallons (114 million cubic meters) per year Building on existing and committed new sewer plans an agreed grey infrastructure based strategy to this problem is set to reduce these discharges to 198 billion gallons per year (a 34 reduction) by the 2030s An alternative green infrastructure approach based around intercepting the first inch (25mm) of rainfall across 10 of the impermeable city area by 2030 is predicted to reduce CSO spills to 179 billion gallons per year
Planners have calculated that the whole life costs after 20 years of the grey infrastructure solution will be $68 billion (2010 prices) compared to the green infrastructure whole life costs of $53 billion The green infrastructure strategy reduces CSO spills by more than the grey alternative for $15 billion less in terms of whole life cost Further planners have calculated that New Yorkers will benefit by up to $41844 million (accumulated over 20 years) in additional benefits associated with lower energy bills from control of urban heating increased property values and improved health
Based on this analysis New York City has committed itself to an aggressive green infrastructure based runoff control strategy to provide long term reductions in CSO spills The plan is to achieve interception of 15 of impermeable area by 2015 4 by 2020 7 by 2025 and 10 by 2030
Principle Five Live Process
The Strategy should be adaptable and periodically reviewed Whilst outcomes are expected to be relatively stable over time the pace at which the Strategy delivers outcomes will be linked to volatile influences (like climate and population change) and to the decisions made at each price review about the priorities for the following period The Strategy should be reviewed at regular intervals to reflect investments already made the changing priorities of the water and sewerage company and partners and the presence of emerging risks The review is also an opportunity to report drainage catchment performance relative to performance measures designed to monitor progress towards achieving outcomes
44 Estimated using methods from the New York Municipal Forest Resource Analysis (MFRA) prepared by the US Dept of Agriculture
205240txt012|May 2013
31
Drainage Strategy Framework
251 Recommended good practice
No Good practice Example references
1 Regularly repeat screening exercise to determine catchments requiring a Drainage Strategy and modify programme of Strategy development accordingly
Check for changes in measured rates of flooding and pollution incidents blockages collapses pumping station failures etc
Check for changes in extent and location of new development
Check for activities being undertaken by partners (eg redevelopment urban realm improvements and flooding and pollution management activities)
SRM5 illustrates how improved and updated knowledge of system performance should be applied to establish Strategies
2 In lsquolive Strategiesrsquo repeat risk assessment when data and models improve and adjust confidence scores accordingly
Confirm that Strategy will still achieve performance indicators and outcomes at least cost Revise Strategy as necessary
3 Periodically refresh Strategy accommodating impact of interventions already delivered using re‐verified predictive tools as appropriate
Confirm that Strategy will still achieve performance indicators and outcomes at least cost Revise Strategy as necessary
Triggers for a wholesale review of the Strategy are likely to be significant changes to the location or extent of planned development
4 Monitor report and share (with partners) the measures used to demonstrate delivery of outcomes Example measures may include the number of properties which experience sewer flooding the number of properties at risk of flooding the number of properties at risk from sewerage asset failure risk indices that capture both the probability and consequence of failure customer satisfaction with regards to clean rivers and beaches the number of pollution incidents the frequency of combined sewer overflow operation and compliance with discharge permit conditions
252 Good practice example ndash Thames Water live DAP
Thames Water has initiated a DAP (drainage area plan) Live approach Itrsquos a good example of how companies are continuously monitoring and updating the status of drainage area risks It provides a lsquoliversquo snapshot of the current health of all drainage areas in Thames Waterrsquos region allowing real time planning as part of a strategic approach It enables drainage planners to view the effectiveness
205240txt012|May 2013
32
Drainage Strategy Framework
of intervention strategies and compare incident rates across varying geographies and development types in the Thames Valley
DAP Live will be available for all catchments in the Thames Water area thus enabling
bull high level monitoring of risks across the business bull a live and strategic review of catchment performance bull prioritisation of catchments based on risk and bull an ability to share data with partners collaborating in drainage planning and improvements
Figure 12 illustrates the types of data managed through the DAP Live system These include asset data political and drainage boundaries environmental data operational data property amp growth data and modelling data As new data become available the DAP Live system is updated so that drainage planners have the most current view on emerging risks and issues
Asset data
Operational data
Property and growth data
Modelling data
Environmental data
Boundaries (SDACs operational political)
Figure 12 Data types held in the DAP Live system
Figure 13 illustrates how the system can provide analysis at a variety of scales from local authority boundaries sewage treatment works catchments drainage areas or a regular grid
205240txt012|May 2013
33
Drainage Strategy Framework
NE PROVINCES
WESTERN PROVINCES
NE LONDON bull Ops areas local W LONDON
SE LONDON authorities Large TIDWORTH SE PROVINCES
bull STW Catchments
bull Drainage areas(SDACs)
bull Regular grid Small
Figure 13 DAP Live reporting performance at different scales
205240txt012|May 2013
34
Drainage Strategy Framework
253 Good practice example ndash Wessex Water Water live data
Wessex Water is regularly using data geospatially to proactively identify and respond to risk Theirs is a good example of how data can be used to provide an adaptable approach that is regularly reviewed to plan investment
The risk‐based and live approach uses a set of likelihood and consequence models which are built up from all currently available data asset data (eg CCTV data material age) operational data (eg flooding and pollutions incidents) and information (eg locality near hospital or downstream of an overflow) All these data are collated for the entire Wessex region updated regularly and analysed geospatially
Figure 14 Sewer risk scores presented in a risk matrix and geospatially
This allows a risk score (Figure 14) to be calculated for each mapped sewer length which directs investigation more efficiently by allocating each mapped sewer a planned CCTV inspection date
This risk‐based approach has been successful in targeting problematic sewers increasing identification rates threefold Density analysis is performed using asset failure and operational information which allows planning of both proactive structural and operational investment
Proactively found structural issues are far more cost effective to repair before failure and can also prevent serviceability issues
205240txt012|May 2013
35
f
DDrainage Strateegy Frameworrk
Figgure 15 Hotsppot analysis
Thhe hotspot annalysis (Figuure 15) showss where operrational clustters have beeen calculatedd This hootspot analyssis is made aavailable on tthe Wessex WWater corporrate GIS to a llow operati onal staff to target their effforts to mitiggate against ffurther repeaat incidents AAdditional innformation ffrom asset annd operationnal activities ccan be addedd regularly too the databasses which drrive the mod els enabling rissk scores to bbe kept as livve as require d
226 Prrinciple Sixx Innovativve and Susstainable SSolutions
Thhe Drainage Strategy Fraamework proomotes the fuull evaluationn of alternatiives to tradit ionally enngineered sewwerage soluttions to test wwhether thesse offer loweer whole life ccost options or better reesponses to uuncertainty It is anticipaated that draainage solutioons of the futture will be ddifferent froom the ones we are usedd to
Thhese should iinclude (at leeast at a highh level) real ttime control storm waterr retrofit techhniques edducation to eenable custommers to changge behaviou r enhancingg incentives for customerss to reduce suurface water flowing to seewers and innnovative pe rmitting arraangements a cross drainagge networks annd sewage tr eatment worrks Water annd sewerage companies sshould continnue to revieww and deevelop other innovative ssolutions
Foor example wwhere a commpany may hiistorically haave preferredd to tackle seewer floodingg or coombined sewwer overflow pollution byy increasing iits undergrouund equipmment to store mmore rainfalll duuring stormss it might connsider other options in fuuture ndash such as working wwith custommers to mmanage the raainfall close tt eventing it foorm enteringg the sewer syystem o source pre
2205240txt012|Mayy 2013
36
Drainage Strategy Framework
261 Recommended good practice
No Good practice Example references
1 Use cost‐benefit methods to demonstrate that innovative and sustainable solution types provide best value for customers and the wider community
UKWIR will publish new research and guidance in 2013 addressing active control and storm water removal demonstrating how these technologies can be justified and included within Drainage Strategies
2 Consider integrated water resource management Work with partners (especially developers and local authorities) to examine whether use of stored stormwater reduces potable water consumption AND need for capacity in sewers
CIRIA has published a scoping study for water sensitive urban design45 in the UK
3 Consider a mix of conventional and new technologies using more adaptive approaches as low‐regrets responses to uncertainty eg prevent current sewer flooding with underground tank storage but address future risks (worsened by climate change) with retrofit SuDS implemented progressively
CIRIA has published lsquoRetrofitting to manage surface waterrsquo46 a comprehensive guide to planning and delivering this type of project
4 Use carbon accounting methods to compare embodied and emitted carbon in alternative intervention strategies so that these impacts are accounted for in whole life costs
Consider the benefits of surface water removal on the costs (including carbon) of pumping and sewage treatment
UKWIR47 has and continues to publish detailed guidance on carbon accounting for water and sewerage company use
45httpwwwciriaorgserviceresearch_informationAMContentManagerNet ContentDisplayaspxSection=research_informationampContentID=23581 46httpwwwciriaorgSERVICEHomecoreordersproductaspxcatid=5ampprodid=1909 47httpukwirforefront‐librarycomreports08‐cl‐01‐6923419000190269902659465890269
205240txt012|May 2013
37
Drainage Strategy Framework
No Good practice Example references
5 Where interventions include the provision of green space public amenity and improved habitats then Payment for Ecosystem Services approaches can be used to claim further monetised benefits in the appraisal Customers should be consulted to help value these benefits
The Environment Agency will publish data in 2013 on costs and benefits of retrofit stormwater projects to promote understanding and uptake
6 Share data within the industry on innovative solutions to increase knowledge of new technology and SuDs approaches
EA retrofitting SuDs costs and benefits database48
accommodating data from Ofwat AMP5 SuDS pilot initiative and other examples
262 Good practice example ndash Welsh Water surface water reduction and removal strategy for Gowerton and Llanelli
Dŵr Cymru Welsh Water and partners are applying innovative storm water removal methods to address capacity problems in the sewer network in Gowerton and Llanelli49 (population 140000) Current under capacity leads to localised sewer flooding and excessive combined sewer overflow (CSO) spill to the Burry Inlet a protected shellfish water and special area of conservation The capacity problems in the system were a concern for the Environment Agency (Wales) and there was a risk of widespread restrictions to economic development being imposed Dŵr Cymru Welsh Water Carmarthenshire County Council City and County of Swansea Consumer Council for Water Environment Agency Wales and the Welsh Government all worked in partnership to resolve the situation
A brand new hydraulic model was built for the entire sewerage network with particular attention paid to accurately representing the sources of storm run‐off and infiltration The model was verified against data from flow monitors and observed CSO spill frequencies into the Burry Inlet
To begin with a traditional sewer storage solution was proposed that would result in an average 10 spills a year into the shellfish water from all 90 CSOs in the two catchments Although this reduced spills and dealt with some of the flooding and growth issues the storage requirements would have been unaffordable provide no protection against long term climate change and would not tackle the fundamental problem of too much surface water getting into the combined network
An alternative approach based on the reduction and removal of storm water from the combined sewer system was also developed This was in accordance with Dŵr Cymru Welsh Waterrsquos Rainscape50 (surface water elimination and reduction) strategy To identify areas with the most
48httpevidenceenvironment‐agencygovukfcermenDefaultHomeAndLeisureFloodsWhatWereDoingIntoTheFutureScience ProgrammeResearchAndDevelopmentFCRMProjectaspxProjectID=15515be8‐bbed‐4204‐ae56‐3e810ba47694ampPageID=56bad68e‐dcb1‐4bf8‐84cc‐cbfd03ab63a2 49 httpwwwciwemorgmedia674511Paper20820Stephen20Ollierpdf 50httpwwwdwrcymrucom_libraryleaflets_publications_english
205240txt012|May 2013
38
Drainage Strategy Framework
potential for effective storm water removal a flowareaflooding thematic map was developed This was used to focus attention on areas which would deliver the most benefit if storm water removal was carried out These areas are coloured red in Figure 16
Figure 16 Thematic map showing areas of maximum potential for storm water removal
The following interventions (181 in total) were combined into single strategy to be delivered in phases by 2015 2020 and afterwards
bull The management of surface water through swales basins and soakaways rather than through combined sewers resulting in new amenity and ecological areas within the built‐up environment
bull Implementing smarter flow control to better use existing storage and conveyance assets bull Relining of sewers to prevent groundwater ingress bull Removal of land drainage connections to sewers bull Household rainwater harvesting retrofit schemes
surface_water_management_strategypdf
205240txt012|May 2013
39
Drainage Strategy Framework
Figure 17 is an artistrsquos impression of what one of the sustainable urban drainage system solutions may look like
Figure 17 Example retrofit SuDS solution proposed for Gowerton and Llanelli
Modelling has demonstrated that the alternative strategy will achieve the same CSO reduction benefit as the storage strategy together with flooding improvements and additional less tangible benefits at significantly lower cost than the traditional sewer storage solution
Figure 18 illustrates the dispersed nature of solutions identified for central Llanelli
Figure 18 Water sensitive urban design interventions planned for central Llanelli
205240txt012|May 2013
40
Drainage Strategy Framework
Appendix A
Glossary
205240txt012|May 2013
Drainage Strategy Framework
Appendix A Glossary
CAPEX Capital expenditure Appointed water and sewerage companiesrsquo spending on new replacement or refurbished capital assets such as construction or buying machinery
CIWEM Urban Drainage Group (WaPUG) A group of the Chartered Institution of Water and Environmental Management supporting professionals working in urban drainage
Combined Sewer Overflow (CSO) The discharge of untreated sewage diluted with storm water into rivers and the sea CSOs occur during heavy rain and are necessary to reduce the risk of sewer flooding The physical overflow structure is also called a CSO
Common Framework for Capital A planning approach developed for the water and Maintenance Planning sewerage companies in 2002 which provides a robust basis
for assessing future capital maintenance needs The approach is consistent with the needs of Ofwat
Defra The Department for Environment Food and Rural Affairs The Government Department with responsibility for water flooding and water quality in England
Drainage Area Plan (DAP) A detailed plan for a drainage catchment that prioritises a list of interventions based on risk using an approach established in the WRc Sewerage Rehabilitation Manual This approach has been succeeded by Sewerage Risk Management which guides the preparation of Sewerage Management Plans (SMP) Companies vary in how they prepare DAPs or SMPs (or their equivalents) following the general principles that have been established
Drainage Strategy Developed by water and sewerage companies to demonstrate how outcomes will be delivered in drainage catchments over the long term Drainage Strategies will use the information developed in producing a DAPSMP and if a drainage strategy has been produced this should be the starting point in producing a more detailed DAPSMP should this be required It is likely that the activities required to prepare DAPSMP and Drainage Strategies may overlap Drainage Strategies might not refer to specific interventions but instead outline a general approach
Drainage Strategy Framework Guidance to describe the contents and intention of Drainage Strategies
205240txt012|May 2013
Drainage Strategy Framework
Flood Risk Management Plans Required by the Flood Risk Regulations in Flood Risk Areas by December 2015
Flood Risk Regulations The legislative instrument used to implement the requirements of the Floods Directive in England and Wales
Floods Directive DIRECTIVE 200760EC of the European Parliament and of the Council of 23 October 2007 on the assessment and management of flood risks
Lead Local Flood Authority (LLFA) The Shire County or unitary authority with responsibility for managing local flood risk
Local development plans Developed by planning authorities to explain where and what type of development (new homes and businesses) will occur within their area They are required to explain water infrastructure needs to support this development
Local Flood Risk Management Strategy Developed by the Lead Local Flood Authority to explain (LFRMS) how local flood risk will be managed by the Authority and
in partnership with others
Natural Resources Wales From 1 April 2013 Natural Resources Wales (NRW) a new body formed by the Welsh Government will take over the functions previously carried out by the Environment Agency (EA) in Wales alongside those of the Forestry Commission Wales and the Countryside Council for Wales
Ofwat The Water Services Regulation Authority ndash the economic regulator of the water and sewerage companies of England and Wales
OPEX Operating expenditure Appointed water and sewerage companiesrsquo day‐to‐day spending on running the services for example staff costs and power This is likely to include investment in joint projects that do not create or relate to an asset that the company solely or jointly owns
Outcomes Outcomes are the higher level objectives that a companyrsquos actions are intended to deliver A companyrsquos outcome should reflect its customersrsquo priorities identified through appropriate customer engagement and deliver the best long‐term sustainable solution for customers and the environment An outcome may not be bound by a single price control period and should be set in the context of customersrsquo and the environmentrsquos long‐term needs
205240txt012|May 2013
Drainage Strategy Framework
Price Review The process of setting appointed water and sewerage companiesrsquo price limits The next price review will take place in 2014 for the period 2015‐20 Ofwat currently sets price limits every five years
Real Time Control (RTC) Using actuated pumps gates and weirs to actively control flow in sewers Better use can be made of existing infrastructure and links can be made between network treatment and receiving water systems for operational benefits Sometimes referred to as Active Management
River Basin Management (Plans) River Basin Management is a continuous process of planning (to develop River Basin Management Plans) and delivery The Water Framework Directive introduces a formal series of 6 year cycles The first cycle will end in 2015 when following further planning and consultation the River Basin Management Plans will be updated and reissued
Sewerage Management Plan A risk based approach to indentifying investment needs in sewerage systems as described in the Sewerage Risk Management (SRM) approach developed by WRc plc
Storm water retrofit Releasing capacity in sewers by controlling stormwater at the surface using disconnection swales and other sustainable drainage systems (SuDS)
205240txt012|May 2013
We are the Environment Agency We protect and improve the environment and make it a better place for people and wildlife We operate at the place where environmental change has its greatest impact on peoplersquos lives We reduce the risks to people and properties from flooding make sure there is enough water for people and wildlife protect and improve air land and water quality and apply the environmental standards within which industry can operate Acting to reduce climate change and helping people and wildlife adapt to its consequences are at the heart of all that we do We cannot do this alone We work closely with a wide range of partners including government business local authorities other agencies civil society groups and the communities we serve
wwwenvironment‐agencygovuk
Environment Agency National Customer Contact Centre
Telephone 03708 506 506 enquiriesenvironment‐agencygovuk
Ofwat (The Water Services Regulation Authority) is a non‐ministerial government department We are responsible for making sure that the water and sewerage sectors in England and Wales provide consumers with a good quality and efficient service at a fair price
wwwofwatgovuk
Telephone 0121 644 7500 mailboxofwatgsigovuk
Halcrow Group Limited Burderop Park Swindon Wiltshire SN4 0QD
tel 01793 812479 fax 01793 812089 halcrowcom
Halcrow Group Limited is a CH2M HILL company Halcrow Group Limited has prepared this report in accordance with
the instructions of The Environment Agency for the clientrsquos sole and specific use Any other persons who use any information contained herein do so at their own risk
12
Drainage Strategy Framework
Framework principles and developing Drainage Strategies water and sewerage companies will be better able to provide greater confidence to all stakeholders that outcomes can be achieved in the long term
A Drainage Strategy should help customers and other stakeholders understand how a water and sewerage company intends to deliver its statutory functions over the long term within a particular area in a sustainable and economic manner The Drainage Strategy should explain how a water and sewerage company will do this in conjunction with other organisations (eg The Environment Agency Natural Resources Wales local authorities highways authorities housing developers)4 and how the company in turn will support these organisations in delivering their own responsibilities as well For example the Drainage Strategy should signal to housing developers and other interested parties how sewerage infrastructure will develop so that they are able to plan accordingly and contribute to economic growth
The Environment Agency Natural Resources Wales and Ofwat expect that Drainage Strategies will be developed (following a risk based approach) in accordance with the six principles in a way that suits local circumstances and customersrsquo expectations In England Defra has described5 the requirement for companies to continue their investment in Drainage Area Plans for the period 2015 to 2020 and subsequent planning cycles so that these can be used as the basis for the development of Drainage Strategies The Environment Agency Natural Resources Wales and Ofwat believe that companies completing Drainage Strategies will be well placed to deliver their long term outcomes
Attributes of a Drainage Strategy
A Drainage Strategy should be accessible and understandable to customers local authorities developers the Environment Agency (in England) Natural Resources Wales and other stakeholders that may be interested in what the water and sewerage company intends to do in the future It will give confidence to all stakeholders that the water and sewerage company will deliver their duty of providing a public sewerage system that will deliver stated outcomes The Drainage Strategy will encourage a more strategic approach that is less reactive and more proactive in providing what customers and environment requires
A Drainage Strategy should normally cover the drainage area containing public sewers serving a single wastewater treatment works although in large cities it may be prudent to sub‐divide into smaller areas Adjacent drainage catchments impacting on the same receiving water ought to be considered together When planning to accommodate growth allow for climate change and maintain or improve water quality (in rivers and the sea) it will often be necessary to consider the interaction of public sewers and wastewater treatment works
A Drainage Strategy should be developed by the water and sewerage company with a primary focus on its network of foul combined and surface water sewers However the company should work with other organisations so that their role in controlling the demand on sewers is confirmed and the company plays its part in the resolution of wider drainage surface water flooding and water pollution issues in the catchment
4 The Environment Agency and Natural Resources Wales already collaborate with local authorities to undertake strategic planning for flood risk management from rivers and the sea (eg through the control of development in floodplains) 5 httpwwwdefragovukpublications20121005pb13829‐statement‐obligations
205240txt012|May 2013
2
13
Drainage Strategy Framework
The following section (13) is provided as a generic illustration of how companies might choose to communicate the process of developing selecting and delivering a Drainage Strategy in a location Full technical analysis and documentation demonstrating how the six principles have been followed neednrsquot be made publically available as this may contain confidential complex and sensitive information It is envisaged that a Drainage Strategy could be communicated within up to 20 written pages depending on size and complexity
Suggested Elements of a Drainage Strategy for Sharing with Partners and the Public
The following is provided as an example of the type of information that could be shared publically to communicate the Drainage Strategy for a catchment
1 Provide a catchment description and map illustrating principal drainage and related water infrastructure (eg larger sewers combined sewer overflows wastewater treatment works rivers and ordinary water courses) Explain how wastewater and stormwater are collected and treated
2 Describe company aims and outcomes and how these relate to the drainage system Indicate the performance measures that will be used to monitor progress towards the achievement of outcomes Report on current and historical patterns in performance measures for the catchment (eg number of flooded properties number of pollution incidents and frequency of combined sewer overflow operation)
3 Summarise the wider drainage issues in the catchment their relation to the companyrsquos assets and the organisations consulted in the development of the Drainage Strategy (eg describe areas of significant surface water flooding)
4 Describe and quantify any pressures in the catchment that will affect the achievement of outcomes ndash eg population change urban creep new development climate change asset deterioration water consumption and environmental legislation
5 Describe how the pressures identified will influence predicted future performance measures (a do nothing scenario) Show the rate of change over time and discuss any uncertainties
6 Describe a short‐list of alternative strategies that are technically feasible and result in the achievement of outcomes for the catchment Explain the strengths weaknesses opportunities and threats of alternative strategies considering societal benefits whole life costs programming uncertainties and the role of other organisations Consider the perspectives of customers and other organisations (eg with reference to Local Flood Risk Management Strategies or River Basin Management Plans)
7 Explain the selection of a preferred strategy (with reference to SWOT analysis) and illustrate this in more detail with plans timelines and images so that stakeholders understand what might be involved and how it will impact on them A full disclosure of strategy appraisal is not necessary The roles of other organisations should be agreed and described
8 Explain how progress towards delivery of the Drainage Strategy and the achievement of outcomes will be monitored and reported
205240txt012|May 2013
3
Drainage Strategy Framework
Figure 1 Water and sewerage company Drainage Strategy interactions with other strategies plans and processes relating to flood and water quality management
Figure 1 illustrates how a water and sewerage company produced Drainage Strategy relates to the strategies plans and processes of other partner organisations in flood and water quality management The principal external (to water and sewerage company) relationships are between Drainage Strategies and
205240txt012|May 2013
4
14
Drainage Strategy Framework
bull Local Development Plans (of planning authorities) bull Flood Risk Management Plans bull Local Flood Risk Management Strategies (of Lead Local Flood Authorities) and bull River Basin Management Plans (led by the Environment Agency)
A Drainage Strategy should be risk and evidence based and should lead to companies minimising whole life costs whilst still delivering outcomes for customers and the environment It should recognise that population growth new development urban creep climate change and changing customer behaviour all exert new pressures and demands on drainage systems
A Drainage Strategy is there to facilitate both long and short term planning While relatively few Strategies are likely to be complete in advance of 2015 we expect companies to adopt a risk based prioritisation approach to develop further Strategies in the coming years Once complete more detailed planning should be consistent with the long term Strategy both up to and beyond future price reviews (although it is recognised that competing priorities may affect the pace at which outcomes are delivered)
A Drainage Strategy is likely to contain a mixture of responding to current problems pro‐actively reducing risks for predicted problems improving operational responses and acting to improve data and reduce uncertainty An example structure for a Drainage Strategy is included in Section 13
Links with Established Drainage Planning Processes
The Drainage Strategy framework encompasses and supplements established planning processes and technical guidance which have been applied selectively and adapted by water and sewerage companies (and Lead Local Flood Authorities) in recent years when planning for drainage systems
These include
bull Common Framework for Capital Maintenance Planning6
bull Sewerage Management Plans (Sewerage Risk Management 5)7
bull Urban Pollution Management 38
bull Surface Water Management Plan technical guidance9
bull Local Government Association Framework to assist the development of the Local Strategy for Flood Risk Management10
bull Long Term Least Cost Planning for Wastewater Supply‐Demand (to be superseded in 2013)11
bull Water Cycle Study Guidance (2013 revision in print) 12
These CIWEM13 Urban Drainage Group (WaPUG) published technical guides are also in widespread use
6httpwwwukwirorgukwirlibrary80474 (poundpound‐ indicating that a charge is made to access this content) 7 httpsrmwrcplccouk (poundpound) 8 httpwwwfwrorgUPM3 9 httpwwwdefragovukpublications20110610pb13546‐surface‐water‐guidance 10httpwwwlocalgovukwebguestlocal‐flood‐risk‐management‐journal_content56101713618366ARTICLE‐TEMPLATE 11 httpukwirforefront‐librarycomreports07‐rg‐08‐291714 (poundpound) 12 httpwwwenvironment‐agencygovukresearchplanning33368aspx
205240txt012|May 2013
5
Drainage Strategy Framework
bull WaPUG code of practice for the hydraulic modelling of sewers (3rd edition) bull WaPUG guide to quality modelling of sewer systems bull WaPUG integrated drainage modelling guide
The sewerage risk management and surface water management methodologies in particular share a common phased approach to understanding drainage problems and developing cost effective solutions These phases are central to good practice in drainage planning and are central to the development of a Drainage Strategy
Generically these phases include
bull Initialisation Preparation phase where data are collated to understand current issues in the system and necessary partners are consulted with to agree success measures and objectives
bull Risk assessment phase where predictive tools are used to quantify current problems and predict how these problems will change in the future
bull Options appraisal phase where the costs and benefits of alternative remedies that meet agreed objectives are considered This informs the selection of a preferred solution or solutions
bull Implementation phase where drainage improvements are financed and delivered and the effectiveness of improvements monitored
The process is cyclical indicating that it is periodically revisited to confirm previous decisions address uncertainties and adapt to a changing environment Figure 2 and Figure 3 illustrate the Sewerage Risk Management and Surface Water Management Plan planning processes
Figure 2 Sewerage Risk Management Approach (Copyright WRc plc httpsrmwrcplccouk used with permission)
13 httpwwwciwemorgknowledge‐networksgroupsurban‐drainagepublicationsmodelling‐guidesaspx
205240txt012|May 2013
6
Drainage Strategy Framework
Figure 3 Surface Water Management Plan Approach
Ofwat has previously commissioned research14 on current practice in sewerage planning and drainage area plans concluding that traditional drainage area plans are no longer widely undertaken but that these activities are generally undertaken under different guises
14httpwwwofwatgovukfuturesustainabledrainagerpt_com20111208drainagepdf
205240txt012|May 2013
7
15
Drainage Strategy Framework
Statutory Obligations and Regulatory Drivers
151 Government
Drainage planning is undertaken within a context established by a variety of Government policies and instruments These are succinctly detailed in Defrarsquos October 2012 Statement of Obligations15
(for England) which is to be referenced by water and sewerage companies in the preparation of business plans for the 2015‐2020 price review period More specific guidance over priorities for 2015‐2020 is provided in Defrarsquos16 strategic policy statement for Ofwat A Water Strategy for Wales17 will be consulted on in 2013
The key legislative drivers and Government priorities relevant to drainage planning are summarised here
bull Section 94 of the Water Industry Act 199118 describes how every water and sewerage company is under a duty to lsquoprovide improve and extend hellip a system of public sewers hellip as to ensure that the area is and continues to be effectually drainedrsquo This is relevant to drainage planning because it explicitly indicates that the sewerage system should be improved to keep pace with growing pressures over the long term this requirement is assured if a long term Drainage Strategy is in place and implemented
bull The Urban Wastewater Treatment Directive19 provides a further requirement to provide sufficient capacity in wastewater collection systems
bull The Governments in England and Wales are committed to taking an ecosystems approach to environmental management which accounts for the environmental economic and social benefits that result from an improved water environment Water and sewerage companies are encouraged to invest in natural as well as built infrastructure to deliver their desired outcomes The Natural Choice 20 demonstrated how this type of investment can deliver a wide range of positive social environmental and economic outcomes Benefits can be determined using lsquopayments for ecosystem servicesrsquo 21 methods Water and sewerage companies are encouraged to consider these approaches where they can deliver cost beneficial outcomes for their customers This is relevant to drainage planning because it encourages the use of retrofit sustainable drainage systems in place of more traditional sewer upsizing and storage Ofwat has supported water and sewerage companies to investigate these approaches through pilot studies22 in the 2010 to 2015 price review period
bull Water and sewerage companies may work in partnership with other organisations to jointly invest in shared outcomes and to discuss with customers their willingness to pay for wider
15 httpwwwdefragovukpublications20121005pb13829‐statement‐obligations 16 httpwwwdefragovukpublications20130307pb13884‐sps‐seg‐ofwat 17httpwalesgovuktopicsenvironmentcountrysideepqwaterfloodingpublicationswater‐strategyjsessionid=235D11ADCC6EEC8EE88886DD69CE0784lang=en 18 httpwwwlegislationgovukukpga199156partIVchapterI 19 httparchivedefragovukenvironmentqualitywaterwaterqualitysewageuwwtdindexhtm 20 httpwwwdefragovukenvironmentnaturalwhitepaper 21 httpwwwdefragovukenvironmentnaturalecosystems‐services 22 httpwwwofwatgovukfuturesustainabledrainage
205240txt012|May 2013
8
Drainage Strategy Framework
benefits This is relevant to sewerage planning because it encourages water and sewerage companies to partner with local authorities to resolve complex storm water management problems (for flooding or pollution control) through the use of retrofit sustainable drainage systems The wider benefits to citizens outside of the water and sewerage companyrsquos customer base can be accounted for
bull The governments of England and Wales are promoting a catchment‐based approach23 to River Basin Management Planning to meet the water quality requirements of the Water Framework Directive (WFD)24 The important aspect of the approach is that all interested parties should work together to build consensus about the best way to improve water quality and habitats Water and sewerage companies should expect to be involved in the process of agreeing objectives and the apportionment of responsibility for delivering those objectives within the river basin districts they operate The central requirements of the Water Framework Directive are to prevent deterioration in water quality aim to achieve good chemical status and aim to achieve good ecological status It additionally seeks to limit the discharge of priority substances River Basin Management Plans will undergo consultation in the second half of 2014 and be published in December 2015 thereafter the programmes of measures included become statutory requirements and the Environment Agency (in England) and Natural Resources Wales will use permit and license conditions to ensure that water and sewerage companies deliver their agreed contributions This is relevant to drainage planning because misconnections blockages mechanical failure sewer flooding and combined sewer overflows (CSOs) can all contribute to the deterioration of water quality and the failure to achieve good ecological status or meet environmental quality standards for priority substances Climate change and growth may increase these risks but water and sewerage companies are not the only polluters and need to partner to ensure that outcomes are met Defra is consulting (closing February 2013) on developing its policies with respect to the control of diffuse urban pollution25
bull A revised Bathing Water Directive (20067EC)26 applies from 2015 and by then the Governmentrsquos aim is for all bathing waters to achieve at least lsquosufficient classrsquo this is approximately twice as stringent as requirements for the current Directive Subsequent planning should aim to achieve lsquogoodrsquo or lsquoexcellentrsquo classifications This is relevant to drainage planning because CSOs other wet weather intermittent discharges final effluent discharges and misconnections can all contribute to bathing water failures Climate change and growth may increase these risks but water and sewerage companies are not the only polluters and need to partner to ensure that outcomes are met
bull Under the Flood and Water Management Act (2010)27 water and sewerage companies (in England and Wales) must act in a manner consistent with the National Flood and Coastal Erosion Risk Management (NFCERM) Strategies28 for England and Wales and have regard to
23httpwwwdefragovukenvironmentqualitywaterlegislationcatchment‐approach 24httpwwwdefragovukenvironmentqualitywaterlegislationwater‐framework‐directive 25 httpwwwdefragovukconsult20121120water‐pollution 26 httpwwwenvironment‐agencygovukbusinessregulation107017aspx 27 httpwwwdefragovukenvironmentfloodinglegislation 28 httpwwwenvironment‐agencygovukresearchpolicy130073aspx
205240txt012|May 2013
9
16
Drainage Strategy Framework
Local Flood Risk Management Strategies29 NFCERM is based around six principles community amp partnership catchment based approach sustainability risk based planning beneficiary investment and delivering multiple benefits Companies should also co‐operate with local authorities and the Environment Agency in the exercise of their functions in relation to surface water management and combined sewers under section 94 of the Water Industry Act 1991 The Flood Risk Regulations 200930 implement the Floods Directive and give particular responsibilities to Lead Local Flood Authorities In lsquoFlood Risk Areasrsquo Lead Local Flood Authorities and the Environment Agency are expected to prepare Flood Risk Management Plans that set out flood risk management objectives and measures to manage risk from local flooding The Environment Agency is required to prepare Flood Risk Management Plans for the whole of England and Wales that cover flooding from main rivers the sea and reservoirs It is important for all risk management authorities to work in an effective way to plan to manage flood risk from all sources in a way that is well coordinated across catchments and coastal cells These duties are relevant to drainage planning because of the vital (but not unlimited) role surface water and combined sewers play in reducing flood risk in urban areas The Act also makes provision for the compulsory drainage of new developments through sustainable drainage systems (SuDS) and the lsquoright to connectrsquo being conditional on SuDS being approved by the SuDS Approval Body of the Lead Local Flood Authority
bull The Climate Change Act 200831 created a legal framework to cut greenhouse gas emissions and build the UKrsquos ability to adapt to a changing climate Water and sewerage companies are expected to reduce carbon emissions and adapt to the impact of climate change over the next decades The Government published its first UK climate change risk assessment in January 2012 and this will be updated every 5 years This is relevant to drainage planning because of the carbon embodied in new drainage infrastructure the carbon emitted during the pumping and treatment of sewage and the increase in flooding and pollution that will occur if climate change adaptations are not made The Government expects Ofwat to work towards the targets of its Adaptation Report and to ensure that its regulatory approach explicitly supports companies in adapting to climate change
bull From October 2011 the Water Industry (Schemes for Adoption of Private Sewers) Regulations 201132 transferred responsibility for existing private sewers and lateral drains to water and sewerage companies Pumping stations will be transferred by October 2016 This is relevant to drainage planning because of the significant increase in assets now within the responsibility of the water and sewerage company and the need to understand and respond to risks therein
Six Guiding Principles for a Drainage Strategy
This Drainage Strategy Framework describes good practice themed around six guiding principles Adherence to these principles will help ensure a Drainage Strategy which meets the expectations of Defra the Welsh Government the Environment Agency Natural Resources Wales and Ofwat and
29 The Local Government Association has published guidance on Local Flood Risk Management Strategies httpwwwlocalgovukcdocument_libraryget_fileuuid=a2538b94‐d3c1‐4cec‐81b0‐8aefd2996c5eampgroupId=10171 30 httpwwwenvironment‐agencygovukresearchplanning125459aspx 31 httpwwwdeccgovukencontentcmslegislationcc_act_08cc_act_08aspx 32 httpwwwlegislationgovukukdsi20119780111510933contents
205240txt012|May 2013
10
Drainage Strategy Framework
will be an essential means of communicating with customers and other partners Further details on each principle are described in Section 2 of this document along with examples of good practice
The six principles are
161 Partnership
Water and sewerage companies cannot develop optimal Drainage Strategies on their own and therefore partnership is key to developing and defining objectives performance indicators and the milestones that will need to be achieved in order to achieve measures that will demonstrate the delivery of outcomes Strategies should be developed and implemented in partnership with customers developers Lead Local Flood Authorities planning authorities the Environment Agency and Natural Resources Wales Strategies should align with (informing and informed by) River Basin Management Plans Local Flood Risk Management Strategies Flood Risk Management Plans and local plans (from planning authorities)
162 Uncertainty
Strategies should explain the reliability of data and knowledge about current and future performance of drainage systems They should explain what steps are planned to improve this understanding and how this will benefit customers Where future performance is uncertain (eg because of sensitivity to climate change) they should explain how adaptive approaches will be used to ensure outcomes are met The uncertainty in predictions of future risks should be recognised and accommodated within decision making
163 Risk based
Strategies should be risk based This means that planning operational and investment activities should be based on consideration of the probability and consequence of inadequate drainage function (risks) as these relate to the achievement of measures that demonstrate delivery of outcomes A risk based strategy ensures that investment is made where risks are the greatest
To aid communication risks should be visualised through maps and plans (Figure 10 is an example) To aid risk assessment risks should be monetised combined and predicted into the future To aid options appraisal the impact of interventions on the level of risk should be predicted
The approach to Drainage Strategy development should be risk based itself The degree of detail included should be related to an understanding of the overall level of risks in the catchment now and in the future
164 Whole life costs and benefits
Strategies should be informed by consideration of whole life costs and benefits They should promote a series of interventions which in view of the quantified uncertainties are most likely to result in performance indicators which demonstrate the achievement of outcomes at lowest cost to customers and the community more widely
Costs relate to capital and operational expenditure to deliver interventions and the monetised impacts of drainage failures such as flooding and pollution
Benefits relate to the reduction in risks from drainage failures such as flooding and pollution but should also include wider societal impacts such as those calculated using a lsquoPayments for Ecosystems Servicesrsquo approach
205240txt012|May 2013
11
17
Drainage Strategy Framework
When considering the lsquowhole lifersquo the strategy should consider climate population and asset deterioration trends These are likely to increase risks over the long term if no interventions are made The strategy should state lsquowhatrsquo should be done but also broadly lsquowhenrsquo and in what sequence interventions should happen
165 Live process
The Strategy should be adaptable and periodically reviewed Whilst outcomes are expected to be relatively stable over time the pace at which the strategy delivers outcomes will be linked to volatile influences (like climate and population change) and the decisions made at each price review about the priorities for the following period The strategy should be reviewed at regular intervals to reflect investments already made the changing priorities of the water and sewerage company and partners and the presence of emerging risks The review is also an opportunity to report drainage catchment performance relative to performance measures designed to monitor progress towards achieving outcomes
166 Innovative and sustainable
The framework promotes the full evaluation of alternatives to traditionally engineered sewerage solutions to test whether these offer lower whole life cost options or better responses to uncertainty It is anticipated that drainage solutions of the future will be different from the ones we are used to
These should include (at least at a high level) real time control or active management storm water retrofit techniques education to enable customers to change behaviour enhancing incentives for customers to reduce surface water flowing to sewers and innovative permitting arrangements across drainage networks and wastewater treatment works Water and sewerage companies should continue to review and develop other innovative solutions
For example where a company may historically have preferred to tackle sewer flooding or combined sewer overflow pollution by increasing its underground equipment to store more rainfall during storms it might consider other options in future such as working with customers to manage the rainfall close to source preventing it from entering the sewer system
Mapping the Framework to Current Planning Processes
We assume that practitioners will be following a broad and generic four‐stage planning process common to the Sewerage Risk Management (SRM5) and Surface Water Management Plan (SWMP) processes when preparing Drainage Strategies
Figure 4 is provided to guide water and sewerage companies in the development of Drainage Strategies It identifies each stage of the drainage planning process and highlights the good practice principles (colour coded by theme) in the locations through the process where it is most important that they are adopted
205240txt012|May 2013
12
e
u
t
v
b
DDrainage Strateegy Frameworrk
Initializepre
Establish partne and consultat
process
Define uncertai
Prepare risk d
Partnership
epare
rship ion
nties
ata
Ris
Co
Uncertainty
k assessmen
onsultation on risk issues
Quantify uncertainties
Quantify risks
Risk based
nt Options
Consult
Plan for
Demons life cost
Whole lif costs amp benefits
s appraisal
on options
uncertainties
strate whole and benefit
fe
s Live pro
Intervent
Aligned deliv collaborat solution
Innovative sustainab
Live and vis
cess Innova sustai
tion
ery amp ive s
and le
sible
ative amp nable
Figgure 4 Draina ge Strategy frramework prinnciples mappe d to the drainaage planning pprocess
118 WWho will bennefit from tthe Framewwork
Thhe Drainage Strategy Fraamework willl benefit
bull Water andd sewerage coompanies loooking to impprove their coompany speccific drainagge planning approach and make it fit for purpoose for the deelivery of lonng term outcoomes over mmultiple pricee review cyccles It will ppoint them toowards good practice andd provide exaamples as innspiration andd to promott ne innovation
bull Organisatiions and inddividuals lookking to enga ge with the ddevelopmen t of Drainagee Strategies and scruti nise progresss towards thhe achievemeent of outcommes associateed with enabbling growth adapting tto climate chhange managging floodingg and managging water poollution
22 DDrainagee Strateegy Frammeworkk Thhis section deescribes recoommended ggood practicee against eachh of the six kkey principle s necessary too develop a DDrainage Straategy For refference linkss are made too relevant annd establisheed planning prrocesses and emerging guuidance whicch drainage planners maay find usefuul These exammples are prrovided for innformation aand referenc e only
WWater and sewwerage comppanies shouldd work towaards developiing Drainagee Strategies wwhich apply thhese approachhes in a wayy that is consiistent with thheir needs annd those of thheir customeers and paartners Partnners should ttake note of tthis advice aand prepare tto engage wiith water andd sewerage coompanies on this basis
Thhe recommennded good ppractice is orgganised withhin each prinnciple as it wwould be appproached chhronologicallly in developping a Drainaage Strategy following thhe planning pprocesses alrready esstablished in the Seweragge Risk Manaagement anddor Surface WWater Managgement Plann mmethodologiess
2205240txt012|Mayy 2013
13
21
Drainage Strategy Framework
Principle One Partnership
Water and sewerage companies cannot develop optimal Drainage Strategies on their own and therefore partnership is key to developing and defining objectives performance indicators and the milestones that will need to be achieved in order to achieve measures that will demonstrate the delivery of outcomes Strategies should be developed and implemented in partnership with customers developers Lead Local Flood Authorities planning authorities the Environment Agency and Natural Resources Wales Strategies should align (informing and informed by) with River Basin Management Plans Local Flood Risk Management Strategies Flood Risk Management Plans and local plans (from planning authorities)
205240txt012|May 2013
14
Drainage Strategy Framework
211 Recommended good practice
No Good practice Example references
1 Engage with partners in a drainage catchment to bull Explain the purpose of developing a Drainage Strategy
and partnersrsquo roles in its success amp how each party will benefit from establishing a long term Drainage Strategy
bull Explain what outcomes are and how progress towards achieving them will be measured
bull Share data and information so that a shared understanding of risks and opportunities is developed
bull Explain what current drainage system performance is and how this is expected to change in the future Use risk visualisation tools to do this
bull Explain significant uncertainties and how these affect how interventions are delivered
Thames Water has demonstrated good practice through the development of its Counters Creek sewer flooding proposals This website describes the engagement process and how customers have been kept informed
2 Engage with the following partners in the development of the Drainage Strategy
bull Lead Local Flood Authority (the drainage area may include more than one) because of its responsibilities for local flood risk management and SuDS approval
bull Planning authority (the drainage area may include more than one) because of its role in determining the location and pace of housing development
bull Highways Authority because of the connection of highway runoff to public sewer systems
bull The Environment Agency (in England) because of its responsibilities for flood risk management (strategic overview) and ensuring good ecological quality is met in water bodies
bull Natural Resources Wales (in Wales) because of its responsibilities for flood risk management (strategic oversight) and ensuing good ecological quality is met in water bodies
bull Regional Flood and Coastal Committees who help develop a mutual understanding of flood and coastal erosion risks in an area
bull Bodies representing customers (eg Consumer Council for Water large local businesses flood action groups faith communities)
bull Bodies representing local environmental concerns (eg Wildlife Trusts Rivers Trusts)
bull Water only companies and water and sewerage company departments planning and operating water supply systems Water demand management practice can have an important impact on sewerage headroom
SWMP guidance (Chapter 2) advises on the establishment of partnerships for urban flood management and how to agree and align local objectives
3 Understand alignment of planning cycles and what this means locally (eg periodic review River Basin Management Plan Local Flood Risk Management Strategy Flood Risk Management Plan local plan)
205240txt012|May 2013
15
Drainage Strategy Framework
No Good practice Example references
4 Be alert to opportunities for joint solutions andor shared funding by understanding local plans for new development re‐development improving street furniture and public open space improving parks and green infrastructure Understand Lead Local Flood Authority and Environment Agency programmes for the management of flood and pollution risks
A guide to joint funding of local flood risk management intervention has been published by Defra33 and provides relevant advice to water and sewerage companies and other partners
5 Consider water and sewerage company funded solutions which deliver third‐party non‐sewerage assets that result in the long term least cost delivery of outcomes (eg water and sewerage company funding of household rain barrels and rain gardens to prevent surface water entering sewers)
6 Use data and mapping from the Environment Agency and Natural Resources Wales to understand exposure of drainage infrastructure to extreme events (eg coastal fluvial and surface water flood maps) so that network resilience can be understood and improved if this is cost beneficial
UKWIR has completed a project in 2013 lsquoResilience building a business case for PR14 and beyondrsquo
7 Work with LLFAs and the Environment Agency (or Natural Resources Wales) to understand the effectiveness of interventions at reducing risk and use this information to improve intervention planning
The UPM3 manual (section 7) advises on post project monitoring needs for water quality driven improvements
8 Share Drainage Strategies with partners and stakeholders so that there is transparency around challenges opportunities and the roles expected of different organisations
212 Good practice example ndash South West Water working with local authorities
These examples from South West Water illustrate how the company has worked with local authorities to coordinate investments and to share resources and skills in the development of integrated urban drainage management studies and Surface Water Management Plans
bull South West Water approached Devon County Council (DCC) to pool resources in delivering two (of five) pilot integrated urban drainage management studies (IUDMs) for Exeter and Exmouth South West Water took the lead role for Exmouth but DCC led in Exeter This engagement shared costs across organisations and has facilitated the production of full Surface Water Management Plans The collaboration has resulted in a shared understanding of the urban drainage challenges faced by both organisations and has opened dialogue around investment priorities
bull In Lyme Regis South West Water supported extensive coastal erosion defence works being carried out by West Dorset District Council by accelerating a programme of sewer rehabilitation and targeting renovation of sewers in vulnerable areas
bull In partnership with Cornwall County Council (CCC) and the Environment Agency South West Water has been working on a number of key drainage issues identified by CCC in its Preliminary Flood Risk Assessment (PFRA)
33 httprandddefragovukDefaultaspxMenu=MenuampModule=MoreampLocation=NoneampCompleted=0ampProjectID=17085
205240txt012|May 2013
16
Drainage Strategy Framework
bull In Camborne South West Water has taken the opportunity to invest in sewer separation works which align with the aims of the Camborne Pool Redruth urban regeneration group supported by Cornwall Council and to promote sustainable development economic growth and a strategic aim of lsquosewers for sewagersquo
213 Good practice example ndash Northumbrian Water partnership working in Tyneside
Northumbrian Water has led a sustainable sewerage study for Tyneside34 between 2010 and 2012 It is a good example of how partner organisations can collaborate to understand and resolve drainage issues in their urban area
Its approach was informed by the fact that a shared urban drainage problem around flooding and pollution was best addressed by a shared response from all the relevant organisations The project steering group involved representatives of Northumbrian Water the Consumer Council for Water the Environment Agency and five Lead Local Flood Authorities The urban drainage system collects wastewater for a single wastewater treatment works serving a population of over 900000
Working together the group studied the impact of growth urban creep and climate change on future urban drainage issues Figure 5 illustrates how a city‐wide map of potential problem areas was generated by the project team sharing data on sewer capacity (from Northumbrian Water) population change (from the local authorities) and river flooding (the Environment Agency) It was predicted that future problems were more likely to occur in the darker shaded areas These became focus areas for the project where a range of traditional and novel drainage solutions were tested
Figure 5 Future drainage problem areas indentified through data sharing
34httpcommunicatoremailcomINfNLOjNRayfOA1rfrfYcdK‐S7UwRcYcNoWebViewaspx
205240txt012|May 2013
17
22
Drainage Strategy Framework
The project team was keen to promote its work to customers and the community and prepared a series of newsletters updating interested parties on progress and issues An example is illustrated in Figure 6
C lic k here if y ou are hav in g d if f ic u lties v iew ing th is new s letter
Ho m e A b o u t u s M e d ia ce n tre C o n tact
Issue 2
Ap ril 2012
In th is ed ition U n d e rs tan d in g th e fu tu re
S u s tain ab le d ra ina g e o p tio ns
F ind ou t more about Th e 2 0 1 1 an n ua l re po rt
Ou r e n viro n m e n ta l p o licy
Ou r co rp o ra te re sp o nsib il i ty s tra te g y
W e lcom e to th e s e con d e ditio n o f S u sta inab le se we ra g e a s ix-m on th ly n e ws le tte r p ro d u ce d to b ring yo u th e la te s t n e ws on o u r m a jo r s tud ye xp lo rin g s us tain ab le s ew e ra ge o p tions in th e Tyn e s id e a rea I h o p e yo u fin d th e in fo rm a tio n o f in te res t a n d wo u ld w e lcom e fe e db a ck o n an y o f th e issu es ra ise d
Ric ha rd W a rne ford W a s te wa te r Dire c tor
U nderstand ing the fu tu re W e a ll kn o w th e difficu lties o f a ccu ra tely p re d ic tin g th e fu tu re h ow e ve r ifw e a re to p re pa re fo r i t th e n it is s om e thin g we m us t a tte m p t As p a rt o f th is s tu d y w e a re co ns id e rin g w ha t d em a nds w ill b e p la ce d on th e d ra ina g e s ys tem s a t 2 0 20 a n d a t 2 0 50 in co rpo ra ting g ro w th u rba n cre e p a nd c lim a te cha n ge B y w o rk in g close ly w ith o u r p a rtn e rs an d u s in g th e la tes t te ch n ical res e a rch we h a ve d e ve lo p ed a n d com p u te rm od e lle d a num b e r o f s ce na rios to id en tify a n d d e fin e fu tu re ris ks Th es e ris ks in c lud e p red ic tions o f p o te n tia l floo d in g p o llu tion o r b a rrie rs to g ro w th N o w th a t w e be tte r u n d e rs ta nd th e iss u es we a re a ble to p re pa re p la ns p rom o ting o p po rtu n ities fo r s us ta in a ble d rain ag e s ys tem s in o rde r to d e live r th e b es t p oss ible s e rvice fo r o u r cu s tom e rs b a la n ced a g ains te n viro nm e n tal n e eds a n d cos ts
S usta inab le d ra inage op tions W e b e lie ve o u r a pp ro a ch re p res en ts go o d p ra ctice fo r th e m a n ag em en t o f s u rfa ce wa te r w h ich is to d ea l w ith th e s u rfa ce wa te r as c los e to s ou rce as p oss ib le A w id e ra n g e o f p o te n tial o p po rtu n ities a re b ein g id e n tifie d in c lu d in g lo ca l a n d s tra te gic o p tions
S tra te g ic o p tions a re typ ica lly la rg e r th a n th e lo ca l on es a nd in c lu d e fe a tu res s u ch as a re as o f la nd w h ich w o uld b e a llo we d to flo o d d u rin g he a vy ra in (s a crific ial s to ra g e ) a n d p e rm a n en t w e tla nd fe a tu res
L o ca l op tio ns d esp ite b ein g sm a lle r th a n th e s tra te gic o n es w ill s til l p la y a ke y ro le in th e p ro vis io n o f s us tain ab le d ra ina g e Th e ir n a tu re m e a ns de p lo ym e n t co u ld be m o re w id es p re a d th a n s tra te gic o p tions fe a tu res su ch as w a te r b u tts ra in g a rde ns a nd p e rm e ab le pa vin g co u ld b e re la tive ly e a s y to fi t in to
Figure 6 Newsletter promoting urban drainage partnership working
Principle Two Uncertainty
Strategies should explain the reliability of data and knowledge about current and future performance of drainage systems They should explain what steps are planned to improve this understanding and how this will benefit customers Where future performance is uncertain (eg because of sensitivity to climate change) they should explain how adaptive approaches will be used to ensure outcomes are met The uncertainty in predictions of future risks should be recognised and accommodated within decision making
205240txt012|May 2013
18
Drainage Strategy Framework
221 Recommended good practice
No Good practice Example references
1 Data analysed and used in the development of the strategy related to asset location dimensions condition failure and flood and pollution incidents should be assigned a confidence grading The confidence grading should be related to its accuracy completeness compatibility credibility and currency
Models used to predict blockages and collapses flooding locations polluting discharges and water quality impacts should be assigned a confidence grading based on their accuracy completeness compatibility credibility and currency
Model predictions should be assigned a confidence grading depending on the confidence in the model and whether it is being applied outside of its verification range (eg for extreme events or for atypical geographies)
The purpose of confidence grading data and model results used in strategy setting is to understand the likelihood that outcomes will be achieved in a cost efficient manner Where the outcomes remain uncertain knowledge of data confidence can be used to target improvement programmes
SRM5 (S3‐03‐17) refers to Ofwatrsquos method for recording the reliability and accuracy of regulatory data in bands A to D
The SWMP guidance (Section 319) describes an alternative system of grading data and model results
2 Use the Drainage Strategy to justify data and model improvement programmes This should be focussed on areas where risks are currently (or predicted to be) high and uncertainty in data or models reduces the ability to determine robust operational or capital solutions Poor model verification in high risk areas would be an indicator that model improvements were required
CIWEMrsquos urban drainage group has published a series of guides on hydraulic and water quality modelling They discuss model calibration verification and uses
SRM5 (S3‐04) describes how to determine where the current assessment of risk is sufficient to proceed or whether data and models should be improved
3 Improve understanding of network performance (and improve models) by using long term flow and level monitoring on sewers and CSOs
Yorkshire Water discusses its CSO
monitoring programme here
4 Demonstrate how the uncertainty in both the underlying datamodels and in the future projections is addressed in options appraisal Consider if this should be done implicitly (eg through choosing conservative assumptions) or explicitly through the use of sensitivity analysis or scenario testing
Treasury Green Book supplementary guidance illustrates how to accommodate climate change uncertainties
205240txt012|May 2013
19
Drainage Strategy Framework
No Good practice Example references
5 Population growth new homes and businesses climate change and urban creep combine to make the future highly uncertain but will almost certainly increase flooding and pollution risks from drainage systems Use the Drainage Strategy to explore different scenarios (combining the impact of these drivers) for a near term (le 10 years) and future (ge 30 years) epoch
For example combine modest growth and slight climate change (a low impact case) and contrast with high growth and significant climate change (a high impact case) Where the location of significant new development is unknown include scenarios accommodating different possibilities
Running multiple scenarios is time consuming and costly A risk based approach should be adopted to focus efforts where flooding and pollution risks are especially sensitive to changes in demand
UKWIR has published research on accounting for climate change35 and urban creep36 in sewerage planning together with more general advice on accommodating climate change in water asset management planning37
Ofwat has published research38
predicting the combined impacts of climate change urban creep and development on a national basis
6 In the face of significant uncertainties about future demands on the drainage system and their consequences the Drainage Strategy should identify low‐regrets interventions (ie ones that are robust no matter what the future holds) and ensure that solutions can be adapted if greater certainty is achieved For example through quickening the pace of SuDS retrofit activities or using (previously identified and secured) land to extend underground storage facilities Strategies which remove surface water from sewerage networks provide lsquoheadroomrsquo for unpredictable increases in demand from population and climate change
Designing Resilient Cities A guide to good practice DR Lomardi et al HIS BRE Press
7 Post project appraisal and cost monitoring should be used to capture real costs and performance so that Strategies can be updated and improved with latest information It is especially important to collate and understand the whole life costs of new technologies where industry understanding is currently poor
35httpwwwukwirorgreports03‐cl‐10‐09042794658901799019890198 (poundpound) 36httpukwirforefront‐librarycomreports10‐wm‐07‐1493273 (poundpound) 37httpukwirforefront‐librarycomreports12‐cl‐01‐1694816900019015590145901409465890155 (poundpound) 38httpwwwofwatgovuksustainabilityclimatechangerpt_com201106mottmacsewerpdf
205240txt012|May 2013
20
Drainage Strategy Framework
222 Good practice example ndash Severn Trent Waterrsquos MICAS
Severn Trent Water has developed a process to measure confidence in hydraulic models of sewer systems Modelling Investment Confidence Assessment Scoring (MICAS) was developed to provide an objective evaluation of model confidence It uses information stored in the hydraulic model about the provenance of each data element and the quality of model verification Before the approach was developed the assessment of lsquofitness for purposersquo of models was subjective and based on modellers judgment This was not always reliable and certainly not repeatable and transparent MICAS provides an objective assessment of hydraulic model quality which can be used to inform its use and prioritise improvements to input data and model verification
Figure 7 and Figure 8 illustrate how an understanding of model confidence from the MICAS assessment (right hand side images) can be used to interpret predictions of flooding (left hand side images) In Figure 7 areas at predicted high risk of flooding (red in the left hand side image) are shown to be in high confidence areas of the hydraulic model (green in the right hand side image) In contrast in Figure 8 areas at predicted high risk of flooding (red in the left hand side image) are shown to be in poor confidence areas of the hydraulic models (orange in the right hand side image) In the latter case this information is used to identify where further model improvements would be beneficial
Flood Risk MICAS
Figure 7 Modelled flood risk and MICAS confidence scores (high model confidence)
Flood Risk MICAS
Figure 8 Modelled flood risk and MICAS confidence scores (lower model confidence)
205240txt012|May 2013
21
23
Drainage Strategy Framework
Principle Three Risk Based
Strategies should be risk based This means that planning operational and investment activities should be based on consideration of the probability and consequence of inadequate drainage function (risks) as these relate to the achievement of measures that demonstrate delivery of outcomes A risk based Strategy ensures that investment is made where risks are the greatest
To aid communication risks should be visualised through maps and plans (Figure 10 is an example) To aid risk assessment risks should be monetised combined and predicted into the future To aid options appraisal the impact of interventions on the level of risk should be predicted
The approach to Drainage Strategy development should be risk based itself The degree of detail included should be related to an understanding of the overall level of risks in the catchment now and in the future
231 Recommended good practice
No Good practice Example references
1 Determine where a Drainage Strategy is required by combining current performance with external influences likely to result in deteriorating performance This stage requires no modelling or detailed assessment On a catchment‐by‐catchment (drainage area) basis understand current risks by collating data on current performance eg blockages collapses pumping station failures pollution incidents CSO spills storm tank spills internal flooding incidents external flooding incidents and infiltration rates Relate these risks to performance indicators and the achievement of outcomes Combine with information about known growth rates predictions of urban creep quantity of newly adopted lsquoprivatersquo sewers surface water flooding risks (eg from flood map for surface water) WFD water body status and bathing water status Prioritise catchments with high current risks andor factors suggesting that risks are likely to worsen significantly in the future Consider normalising scoring method for size of catchment (eg by unit area or unit length of sewer) Consult with stakeholders to confirm correct prioritisation Commence with development of Drainage Strategies for the highest ranked catchments Periodically revisit prioritisation (updating with new data) to check that priorities are still correct
The initialisation stage of a Sewer Management Plan (SMP) (described in SRM5) considers how a risk assessment can be used to prioritise which spatial units (eg catchments) should be prioritised for a SMP study
2 Visualise catchment risks (from 1) to illustrate and explain to partners the reasons for prioritisation Accommodate their views amp consider changing prioritisation to aid wider drainage planning requirements (eg increase prioritisation of a catchment with significant surface water flooding problems where close collaboration between water and sewerage company and LLFA will benefit the community)
205240txt012|May 2013
22
Drainage Strategy Framework
No Good practice Example references
3 Clearly relate sewerage risks to the performance indicators that will be used to measure progress towards achieving outcomes eg relate blockage rates to flooding and pollution incidents eg relate increase in flows to increased CSO frequency breaches of permit conditions and deterioration in receiving water quality Adopt a sourcendashpathway‐receptor model and workshop techniques to ensure that cause effect and consequences are fully captured Use performance indicators as the basis for a comprehensive risk assessment that considers likelihood (frequency) and consequence (extent degree and duration of impact) of failure expressed as risk scores Monetise risks in GBP (pound) to align with principle four (whole life costs amp benefits) Use (verified) predictive models to understand near term (lt10 years) and long term (gt30 years) risks The latter to align with principle four (whole life costs amp benefits) Align complexity of method with level of risk recognising the needs of partners eg use complex 2D flood routing models to ascertain (with greater certainty) flood mechanisms and damages where the quantity and frequency of flooding is high and interventions will be complex and costly Elsewhere more simple approaches are appropriate eg use complex UPM3 water quality modelling methods where compliance with river standards or discharge consents is already failing or is expected to do so Elsewhere more simple approaches are appropriate Combine risk scores from different risks to describe the total level of risk in a catchment Use visualisation techniques to communicate combined level of risk Combine analysis from hydraulic blockage and asset deterioration models on a catchment basis In hydraulic analysis consider flooding performance for rainfall events beyond the usually provided standard of protection to understand performance in extreme events in support of partners (especially LLFAs) and in search of cost beneficial interventions at a higher standard than normal
SRM 5 (S3‐03) details approaches to simple and more complex approaches to risk assessment that are consistent with CMPCF guidelines
4 Be alert to interactions between sewer networks and wastewater treatment plans eg by modelling the impact of changing sewer flows on wastewater treatment worksrsquo performance and costs Consider combined impact of different catchments on a single or linked water body (eg an inland river bathing water or shell fishery)
UPM3 guidance discusses approaches to understanding these interactions and applying more complex water quality impact models
5 Establish systems and apply methods to predict how interventions can reduce risks eg how a targeted and pro‐active maintenance can reduce the occurrence of sewer blockage and flooding from lsquoother causesrsquo eg how reducing infiltration can reduce CSO spills eg how reducing connected impermeable area can reduce sewer flooding
205240txt012|May 2013
23
Drainage Strategy Framework
232 Good practice example ndash United Utilities risk assessment
United Utilities has demonstrated a robust risk based approach in the development of sewerage management plans used for long term planning across their area of operations
Hydraulic models were applied in 235 catchments and configured to look at future performance and to evaluate the consequences of inadequate capacity Starting from a baseline of 2010 versions of the models were built for 2020 and 2036 epochs The following model input parameters were adjusted population water consumption infiltration planned development known sewerage improvement projects urban creep rainfall (for climate change)
Two‐dimensional (2D) modelling was used to consider the consequences of sewer flooding resulting from the changes made to reflect the future operating environments As well as the impact on homes and business (from internal and external flooding) the flood risk to critical infrastructure was also considered The operation of CSOs was considered by computing the annual spill volume duration and frequency
Finally predictions of the likelihood and consequence of sewer failure were added taking account of sewer material age and the incident records relating to similar assets
All these data were combined and weighted to generate a Sewer Management Plan (SMP) Risk Score for each length of sewer The process is illustrated in Figure 9
Figure 9 United Utilitiesrsquo process for calculating risk score in sewerage catchments
205240txt012|May 2013
24
Drainage Strategy Framework
Risk scores were summed spatially and monetised so that high priority locations could be identified Mapping and visualisation were used to communicate the results of this assessment priority areas for further investigation and how risks change through time (Figure 10)
Figure 10 Visualisation of sewerage risks
233 Good practice example ndash Northumbrian Water risk assessment
Northumbrian Water completes an annual assessment of hydraulic capacity in its sewerage network at the drainage area scale Its approach does not require hydraulic models to have been completed and yet can reliably highlight areas of under‐capacity in need of further investigation through more detailed analysis including hydraulic modelling New and emerging risk areas can also be identified by applying data for population growth which occurs through development lsquoWhat ifrsquo scenarios can be run to test when capacity limits may be overcome and flood risks potentially set to increase It demonstrates good lsquorisk basedrsquo planning principles because it shows the drainage planner where more detailed analysis is warranted
The approach uses the following data from company records population connected to sewer P water consumption rate G (lhd) trade discharge E (ls) pipe diameter and gradient pipe connectivity CSO consent pass forward rate (ls) pumping station rate (ls) sewage treatment flow rate (ls) A wastewater dry weather capacity map calculates pipe full capacity dry weather flow (PG+E+I) and Formula A flow for fully combined (1360P+2E+DWF) and separate (4PG+3I+E) areas of the network Infiltration (I) is assumed to be 50 PG +E
205240txt012|May 2013
25
Drainage Strategy Framework
A theoretical assessment of network capacity is then calculated by comparing Formula A with pipe full capacity flow consent values at CSOs and wastewater treatment works and pumping rates This determines areas of the network with a capacity shortfall with a potential capacity shortfall and with no capacity shortfall
When run across the whole company area approximately 100 out of 500 drainage areas were found to be under capacity Over 60 of these areas had recorded sewer flooding incidents In over 300 drainage areas there was no forecast capacity shortfall Only 7 of these drainage areas had recorded sewer flooding incidents Overall the system proved to be very reliable at predicting drainage areas likely to have sewer flooding problems because of sewer under‐capacity
In under capacity drainage areas an intermediate (hydraulic model based) assessment is then carried out Figure 11 shows the results thematically mapped for an example drainage area Red areas are predicted to have a very high risk of sewer flooding Yellow and green areas are predicted to have a low risk of sewer flooding
Figure 11 Example of a drainage area capacity map
205240txt012|May 2013
26
24
Drainage Strategy Framework
Principle Four Whole Life Costs and Benefits
Strategies should be informed by consideration of whole life costs and benefits They should promote a series of interventions which in view of the quantified uncertainties are most likely to result in performance indicators which demonstrate the achievement of outcomes at lowest cost to customers and the community more widely
Costs relate to capital and operational expenditure to deliver interventions and the monetised impacts of drainage failures such as flooding and pollution
Benefits relate to the reduction in risks from drainage failures such as flooding and pollution but should also include wider societal impacts such as those calculated using a lsquoPayments for Ecosystems Servicesrsquo approach
When considering the lsquowhole lifersquo the strategy should consider climate population and asset deterioration trends These are likely to increase risks over the long term if no interventions are made The strategy should state lsquowhatrsquo should be done but also broadly lsquowhenrsquo and in what sequence interventions should happen
241 Recommended good practice
No Good practice Example references
1 Predict risks into the future for at least two epochs le10 years (to understand what the company needs to do now and how this fits with longer term outcomes) and ge30 years to understand long term needs in light of changing population and other pressures
Account for the following changes in demand
bull Growth ‐ new homes and businesses
bull Urban creep ndash uncontrolled addition of connected impermeable area
bull Climate change ndash affecting design events (flood predictions) time‐series (CSO and treated effluent quantities) river flows and temperatures
bull Infiltrationexfiltration ndash through deteriorating sewer condition
bull Dry weather flows ndash through changes in water consumption rates
2 Combining monetised risks (associated with sewerage failures) determine whole life costs for a lsquodo nothingrsquo scenario (ie no interventions)
Include costs associated with electricity consumption (in the network and at the wastewater treatment works) and CO2 emissions
UKWIR will publish in 2014 a revision to their Long Term Least Cost Planning for Wastewater Supply‐Demand
guidance This may provide tools and methods for expressing costs and benefits to support the development of a Drainage Strategy
205240txt012|May 2013
27
Drainage Strategy Framework
No Good practice Example references
3 Test intervention strategies which keep performance indicators on track to deliver outcomes by adding capacity (supply) reducing flows (demand) or altering operational regimes
Include the costs of interventions and the benefits of reduced risks to inform selection of the most cost beneficial strategy over the whole life
Have regard to the timing of interventions recognising that uncertainty may require low‐regrets (insensitive to uncertainty) solutions and that delaying major interventions may be more affordable and attractive in the short term Discounting should be used to compare the costs and benefits of interventions occurring at different times
Recognise that some interventions will be obligatory and defined (eg maintenance of a spill frequency standard at a CSO) whilst others will be more discretionary focused on achieving outcomes rather than specific outputs
SRM5 (Section 8) defines and contrasts cost benefit analysis cost effectiveness analysis whole life cost analysis and risk cost benefit analysis
HM Treasury Green Book39
sets out a framework for the appraisal of long term projects which can be applied to the development of a Drainage Strategy
4 Donrsquot at first be concerned with the distribution of costs and benefits between partners who may be sharing costs Identify the most cost beneficial solution first and then debate and agree an equitable sharing of costs
Give equal weighting to OPEX (operating expenditure) and CAPEX (capital expenditure) costs so not to cause bias towards capital intensive solutions Properly consider the costs and benefits of pro‐active maintenance regimes and campaigns to influence customers to reduce fats oils and greases (FOG) build‐ups and the misuse of sewers
Consider the affordability of solutions the impact on customersrsquo bills and the resources of other organisations to play their part
UKWIR research outputs40 in 2013 (SW01) will provide a framework for making a business case for separating storm water from combined sewers
5 Where interventions include the provision of green space public amenity and improved habitats then Payment for Ecosystem Services approaches should be used to identify further monetised benefits in the appraisal Customers should be consulted to help value these benefits
Supplementary Green Book41
guidance describes methods for accounting for environmental impacts including the ecosystems approach
39 httpwwwhm‐treasurygovukdata_greenbook_indexhtm 40 httpwwwukwirorgpublishorsystemcomponent_viewaspLogDocId=96116 41 httpwwwhm‐treasurygovukdaccounting_environmental_impactspdf
205240txt012|May 2013
28
Drainage Strategy Framework
242 Good practice example ndash Severn Trent Water making the case for surface water separation in Stoke-on-Trent
In this example42 Severn Trent Water compared alternative ways of addressing sewer flooding problems by looking at a range of costs and benefits not all of which were directly associated with its specific responsibilities as a water and sewerage company Whilst the example does not express a monetised value for all costs and benefits over the whole life it does illustrate the types of factors which could be included in an appraisal of this type scaled to address problems at a catchment level It also demonstrates how working collaboratively can help identify solutions which are cost‐beneficial for the community at large
In an area of Stoke served by a combined sewer system five properties were at risk from sewer flooding in cellars for events equal to and less frequent than the 1 in 10 year probability A conventional sewer pumping station based solution was presented as the standard option
However a nearby former hospital site was also undergoing re‐development which would result in reduced runoff to the combined sewer The new drainage regime in the redevelopment site was sufficient to remove the flood risk at the five properties (this was a do nothing strategy)
A third option completely separated the development site runoff from the combined sewer and also addressed local flood risk issues nearby The solution required a new storm sewer and a network of swales and other SuDS features connecting with an ordinary watercourse
Table 1 illustrates how costs and benefits were compared across the three alternative strategies Each provided the same benefit in terms of the number of homes (5) relieved from sewer flooding The novel SuDS and surface water management solution additionally gave local flood risk relief to 3 further properties The separationSuDS strategy came at a higher capital cost but delivered greater social cost benefits savings in annual operating costs and a bonus improvement water quality (because of reduced CSO spill volume) Severn Trent selected the separation SuDS solution because the higher capital costs were offset by other benefits
Table 1 Costs and benefits of drainage improvements in part of Stoke-on-Trent
Do nothing Standard option
SuDS
Sewer flooding benefits 5 5 5
Other flooding benefits 0 0 3
Change in runoff to combined sewer (m3year) 0 0 ‐40000
Estimated cost (pound) 0 168000 419000
42httpwwwciwemorgmedia695460Paper203_Creating20Sewer20Capacity_Presentation2 0by20Mike20Woodpdf
205240txt012|May 2013
29
Drainage Strategy Framework
Do nothing Standard option
SuDS
Social Cost Benefit (pound) 16000 5000 51000
Change in electricity costs (poundyear) 0 +75 ‐525
Programme impact (years to deliver solution) + 4 0 +4
CSO spill volume (m3 in 1year event) +298 0 ‐397
243 Good practice example ndash New York City comparison of grey and green infrastructure drainage strategies
This example is taken from New York in the United States of America Itrsquos an illustration of how whole life costs have been compared for alternative strategies to solve urban drainage issues on a mega‐city scale The key data are summarised in Table 2
Table 2 Comparing drainage strategies in New York
Grey Strategy
Green Strategy
CSO spill volume reduction (billion gallons year)
101 122
Wider benefits over 20 years ($ million) 0 139 to 418
Whole life costs over 20 years ($ billion) 68 53
The information is taken from the New York City Green Infrastructure Plan43 produced by the Mayorrsquos Office in 2010 The Plan (and recent updates) provides a comprehensive evidence base around costs and benefits of different approaches to address the cityrsquos drainage problems It is therefore an excellent example of how drainage strategies can be described in plain language for a non‐specialist audience concerned with their environment and the cost of providing infrastructure to enhance it
It is becoming commonplace for North American cities (eg Portland and Philadelphia) to address the issue of frequent combined sewer overflow (CSO) operation by using a combination of grey infrastructure (sewers) and green infrastructure (sustainable drainage systems) The wider health
43 httpwwwnycgovhtmldephtmlstormwaternyc_green_infrastructure_planshtml
205240txt012|May 2013
30
25
Drainage Strategy Framework
and ecological benefits of green infrastructure approaches and the reduced reliance on materials and energy are attractive to utility planners and cities alike
New York has 422 CSOs and an agreed Long Term Control Strategy to significantly reduce the impact wet weather discharges have on aquatic systems throughout the city Annual discharges are currently (2010) estimated to be 30 billion gallons (114 million cubic meters) per year Building on existing and committed new sewer plans an agreed grey infrastructure based strategy to this problem is set to reduce these discharges to 198 billion gallons per year (a 34 reduction) by the 2030s An alternative green infrastructure approach based around intercepting the first inch (25mm) of rainfall across 10 of the impermeable city area by 2030 is predicted to reduce CSO spills to 179 billion gallons per year
Planners have calculated that the whole life costs after 20 years of the grey infrastructure solution will be $68 billion (2010 prices) compared to the green infrastructure whole life costs of $53 billion The green infrastructure strategy reduces CSO spills by more than the grey alternative for $15 billion less in terms of whole life cost Further planners have calculated that New Yorkers will benefit by up to $41844 million (accumulated over 20 years) in additional benefits associated with lower energy bills from control of urban heating increased property values and improved health
Based on this analysis New York City has committed itself to an aggressive green infrastructure based runoff control strategy to provide long term reductions in CSO spills The plan is to achieve interception of 15 of impermeable area by 2015 4 by 2020 7 by 2025 and 10 by 2030
Principle Five Live Process
The Strategy should be adaptable and periodically reviewed Whilst outcomes are expected to be relatively stable over time the pace at which the Strategy delivers outcomes will be linked to volatile influences (like climate and population change) and to the decisions made at each price review about the priorities for the following period The Strategy should be reviewed at regular intervals to reflect investments already made the changing priorities of the water and sewerage company and partners and the presence of emerging risks The review is also an opportunity to report drainage catchment performance relative to performance measures designed to monitor progress towards achieving outcomes
44 Estimated using methods from the New York Municipal Forest Resource Analysis (MFRA) prepared by the US Dept of Agriculture
205240txt012|May 2013
31
Drainage Strategy Framework
251 Recommended good practice
No Good practice Example references
1 Regularly repeat screening exercise to determine catchments requiring a Drainage Strategy and modify programme of Strategy development accordingly
Check for changes in measured rates of flooding and pollution incidents blockages collapses pumping station failures etc
Check for changes in extent and location of new development
Check for activities being undertaken by partners (eg redevelopment urban realm improvements and flooding and pollution management activities)
SRM5 illustrates how improved and updated knowledge of system performance should be applied to establish Strategies
2 In lsquolive Strategiesrsquo repeat risk assessment when data and models improve and adjust confidence scores accordingly
Confirm that Strategy will still achieve performance indicators and outcomes at least cost Revise Strategy as necessary
3 Periodically refresh Strategy accommodating impact of interventions already delivered using re‐verified predictive tools as appropriate
Confirm that Strategy will still achieve performance indicators and outcomes at least cost Revise Strategy as necessary
Triggers for a wholesale review of the Strategy are likely to be significant changes to the location or extent of planned development
4 Monitor report and share (with partners) the measures used to demonstrate delivery of outcomes Example measures may include the number of properties which experience sewer flooding the number of properties at risk of flooding the number of properties at risk from sewerage asset failure risk indices that capture both the probability and consequence of failure customer satisfaction with regards to clean rivers and beaches the number of pollution incidents the frequency of combined sewer overflow operation and compliance with discharge permit conditions
252 Good practice example ndash Thames Water live DAP
Thames Water has initiated a DAP (drainage area plan) Live approach Itrsquos a good example of how companies are continuously monitoring and updating the status of drainage area risks It provides a lsquoliversquo snapshot of the current health of all drainage areas in Thames Waterrsquos region allowing real time planning as part of a strategic approach It enables drainage planners to view the effectiveness
205240txt012|May 2013
32
Drainage Strategy Framework
of intervention strategies and compare incident rates across varying geographies and development types in the Thames Valley
DAP Live will be available for all catchments in the Thames Water area thus enabling
bull high level monitoring of risks across the business bull a live and strategic review of catchment performance bull prioritisation of catchments based on risk and bull an ability to share data with partners collaborating in drainage planning and improvements
Figure 12 illustrates the types of data managed through the DAP Live system These include asset data political and drainage boundaries environmental data operational data property amp growth data and modelling data As new data become available the DAP Live system is updated so that drainage planners have the most current view on emerging risks and issues
Asset data
Operational data
Property and growth data
Modelling data
Environmental data
Boundaries (SDACs operational political)
Figure 12 Data types held in the DAP Live system
Figure 13 illustrates how the system can provide analysis at a variety of scales from local authority boundaries sewage treatment works catchments drainage areas or a regular grid
205240txt012|May 2013
33
Drainage Strategy Framework
NE PROVINCES
WESTERN PROVINCES
NE LONDON bull Ops areas local W LONDON
SE LONDON authorities Large TIDWORTH SE PROVINCES
bull STW Catchments
bull Drainage areas(SDACs)
bull Regular grid Small
Figure 13 DAP Live reporting performance at different scales
205240txt012|May 2013
34
Drainage Strategy Framework
253 Good practice example ndash Wessex Water Water live data
Wessex Water is regularly using data geospatially to proactively identify and respond to risk Theirs is a good example of how data can be used to provide an adaptable approach that is regularly reviewed to plan investment
The risk‐based and live approach uses a set of likelihood and consequence models which are built up from all currently available data asset data (eg CCTV data material age) operational data (eg flooding and pollutions incidents) and information (eg locality near hospital or downstream of an overflow) All these data are collated for the entire Wessex region updated regularly and analysed geospatially
Figure 14 Sewer risk scores presented in a risk matrix and geospatially
This allows a risk score (Figure 14) to be calculated for each mapped sewer length which directs investigation more efficiently by allocating each mapped sewer a planned CCTV inspection date
This risk‐based approach has been successful in targeting problematic sewers increasing identification rates threefold Density analysis is performed using asset failure and operational information which allows planning of both proactive structural and operational investment
Proactively found structural issues are far more cost effective to repair before failure and can also prevent serviceability issues
205240txt012|May 2013
35
f
DDrainage Strateegy Frameworrk
Figgure 15 Hotsppot analysis
Thhe hotspot annalysis (Figuure 15) showss where operrational clustters have beeen calculatedd This hootspot analyssis is made aavailable on tthe Wessex WWater corporrate GIS to a llow operati onal staff to target their effforts to mitiggate against ffurther repeaat incidents AAdditional innformation ffrom asset annd operationnal activities ccan be addedd regularly too the databasses which drrive the mod els enabling rissk scores to bbe kept as livve as require d
226 Prrinciple Sixx Innovativve and Susstainable SSolutions
Thhe Drainage Strategy Fraamework proomotes the fuull evaluationn of alternatiives to tradit ionally enngineered sewwerage soluttions to test wwhether thesse offer loweer whole life ccost options or better reesponses to uuncertainty It is anticipaated that draainage solutioons of the futture will be ddifferent froom the ones we are usedd to
Thhese should iinclude (at leeast at a highh level) real ttime control storm waterr retrofit techhniques edducation to eenable custommers to changge behaviou r enhancingg incentives for customerss to reduce suurface water flowing to seewers and innnovative pe rmitting arraangements a cross drainagge networks annd sewage tr eatment worrks Water annd sewerage companies sshould continnue to revieww and deevelop other innovative ssolutions
Foor example wwhere a commpany may hiistorically haave preferredd to tackle seewer floodingg or coombined sewwer overflow pollution byy increasing iits undergrouund equipmment to store mmore rainfalll duuring stormss it might connsider other options in fuuture ndash such as working wwith custommers to mmanage the raainfall close tt eventing it foorm enteringg the sewer syystem o source pre
2205240txt012|Mayy 2013
36
Drainage Strategy Framework
261 Recommended good practice
No Good practice Example references
1 Use cost‐benefit methods to demonstrate that innovative and sustainable solution types provide best value for customers and the wider community
UKWIR will publish new research and guidance in 2013 addressing active control and storm water removal demonstrating how these technologies can be justified and included within Drainage Strategies
2 Consider integrated water resource management Work with partners (especially developers and local authorities) to examine whether use of stored stormwater reduces potable water consumption AND need for capacity in sewers
CIRIA has published a scoping study for water sensitive urban design45 in the UK
3 Consider a mix of conventional and new technologies using more adaptive approaches as low‐regrets responses to uncertainty eg prevent current sewer flooding with underground tank storage but address future risks (worsened by climate change) with retrofit SuDS implemented progressively
CIRIA has published lsquoRetrofitting to manage surface waterrsquo46 a comprehensive guide to planning and delivering this type of project
4 Use carbon accounting methods to compare embodied and emitted carbon in alternative intervention strategies so that these impacts are accounted for in whole life costs
Consider the benefits of surface water removal on the costs (including carbon) of pumping and sewage treatment
UKWIR47 has and continues to publish detailed guidance on carbon accounting for water and sewerage company use
45httpwwwciriaorgserviceresearch_informationAMContentManagerNet ContentDisplayaspxSection=research_informationampContentID=23581 46httpwwwciriaorgSERVICEHomecoreordersproductaspxcatid=5ampprodid=1909 47httpukwirforefront‐librarycomreports08‐cl‐01‐6923419000190269902659465890269
205240txt012|May 2013
37
Drainage Strategy Framework
No Good practice Example references
5 Where interventions include the provision of green space public amenity and improved habitats then Payment for Ecosystem Services approaches can be used to claim further monetised benefits in the appraisal Customers should be consulted to help value these benefits
The Environment Agency will publish data in 2013 on costs and benefits of retrofit stormwater projects to promote understanding and uptake
6 Share data within the industry on innovative solutions to increase knowledge of new technology and SuDs approaches
EA retrofitting SuDs costs and benefits database48
accommodating data from Ofwat AMP5 SuDS pilot initiative and other examples
262 Good practice example ndash Welsh Water surface water reduction and removal strategy for Gowerton and Llanelli
Dŵr Cymru Welsh Water and partners are applying innovative storm water removal methods to address capacity problems in the sewer network in Gowerton and Llanelli49 (population 140000) Current under capacity leads to localised sewer flooding and excessive combined sewer overflow (CSO) spill to the Burry Inlet a protected shellfish water and special area of conservation The capacity problems in the system were a concern for the Environment Agency (Wales) and there was a risk of widespread restrictions to economic development being imposed Dŵr Cymru Welsh Water Carmarthenshire County Council City and County of Swansea Consumer Council for Water Environment Agency Wales and the Welsh Government all worked in partnership to resolve the situation
A brand new hydraulic model was built for the entire sewerage network with particular attention paid to accurately representing the sources of storm run‐off and infiltration The model was verified against data from flow monitors and observed CSO spill frequencies into the Burry Inlet
To begin with a traditional sewer storage solution was proposed that would result in an average 10 spills a year into the shellfish water from all 90 CSOs in the two catchments Although this reduced spills and dealt with some of the flooding and growth issues the storage requirements would have been unaffordable provide no protection against long term climate change and would not tackle the fundamental problem of too much surface water getting into the combined network
An alternative approach based on the reduction and removal of storm water from the combined sewer system was also developed This was in accordance with Dŵr Cymru Welsh Waterrsquos Rainscape50 (surface water elimination and reduction) strategy To identify areas with the most
48httpevidenceenvironment‐agencygovukfcermenDefaultHomeAndLeisureFloodsWhatWereDoingIntoTheFutureScience ProgrammeResearchAndDevelopmentFCRMProjectaspxProjectID=15515be8‐bbed‐4204‐ae56‐3e810ba47694ampPageID=56bad68e‐dcb1‐4bf8‐84cc‐cbfd03ab63a2 49 httpwwwciwemorgmedia674511Paper20820Stephen20Ollierpdf 50httpwwwdwrcymrucom_libraryleaflets_publications_english
205240txt012|May 2013
38
Drainage Strategy Framework
potential for effective storm water removal a flowareaflooding thematic map was developed This was used to focus attention on areas which would deliver the most benefit if storm water removal was carried out These areas are coloured red in Figure 16
Figure 16 Thematic map showing areas of maximum potential for storm water removal
The following interventions (181 in total) were combined into single strategy to be delivered in phases by 2015 2020 and afterwards
bull The management of surface water through swales basins and soakaways rather than through combined sewers resulting in new amenity and ecological areas within the built‐up environment
bull Implementing smarter flow control to better use existing storage and conveyance assets bull Relining of sewers to prevent groundwater ingress bull Removal of land drainage connections to sewers bull Household rainwater harvesting retrofit schemes
surface_water_management_strategypdf
205240txt012|May 2013
39
Drainage Strategy Framework
Figure 17 is an artistrsquos impression of what one of the sustainable urban drainage system solutions may look like
Figure 17 Example retrofit SuDS solution proposed for Gowerton and Llanelli
Modelling has demonstrated that the alternative strategy will achieve the same CSO reduction benefit as the storage strategy together with flooding improvements and additional less tangible benefits at significantly lower cost than the traditional sewer storage solution
Figure 18 illustrates the dispersed nature of solutions identified for central Llanelli
Figure 18 Water sensitive urban design interventions planned for central Llanelli
205240txt012|May 2013
40
Drainage Strategy Framework
Appendix A
Glossary
205240txt012|May 2013
Drainage Strategy Framework
Appendix A Glossary
CAPEX Capital expenditure Appointed water and sewerage companiesrsquo spending on new replacement or refurbished capital assets such as construction or buying machinery
CIWEM Urban Drainage Group (WaPUG) A group of the Chartered Institution of Water and Environmental Management supporting professionals working in urban drainage
Combined Sewer Overflow (CSO) The discharge of untreated sewage diluted with storm water into rivers and the sea CSOs occur during heavy rain and are necessary to reduce the risk of sewer flooding The physical overflow structure is also called a CSO
Common Framework for Capital A planning approach developed for the water and Maintenance Planning sewerage companies in 2002 which provides a robust basis
for assessing future capital maintenance needs The approach is consistent with the needs of Ofwat
Defra The Department for Environment Food and Rural Affairs The Government Department with responsibility for water flooding and water quality in England
Drainage Area Plan (DAP) A detailed plan for a drainage catchment that prioritises a list of interventions based on risk using an approach established in the WRc Sewerage Rehabilitation Manual This approach has been succeeded by Sewerage Risk Management which guides the preparation of Sewerage Management Plans (SMP) Companies vary in how they prepare DAPs or SMPs (or their equivalents) following the general principles that have been established
Drainage Strategy Developed by water and sewerage companies to demonstrate how outcomes will be delivered in drainage catchments over the long term Drainage Strategies will use the information developed in producing a DAPSMP and if a drainage strategy has been produced this should be the starting point in producing a more detailed DAPSMP should this be required It is likely that the activities required to prepare DAPSMP and Drainage Strategies may overlap Drainage Strategies might not refer to specific interventions but instead outline a general approach
Drainage Strategy Framework Guidance to describe the contents and intention of Drainage Strategies
205240txt012|May 2013
Drainage Strategy Framework
Flood Risk Management Plans Required by the Flood Risk Regulations in Flood Risk Areas by December 2015
Flood Risk Regulations The legislative instrument used to implement the requirements of the Floods Directive in England and Wales
Floods Directive DIRECTIVE 200760EC of the European Parliament and of the Council of 23 October 2007 on the assessment and management of flood risks
Lead Local Flood Authority (LLFA) The Shire County or unitary authority with responsibility for managing local flood risk
Local development plans Developed by planning authorities to explain where and what type of development (new homes and businesses) will occur within their area They are required to explain water infrastructure needs to support this development
Local Flood Risk Management Strategy Developed by the Lead Local Flood Authority to explain (LFRMS) how local flood risk will be managed by the Authority and
in partnership with others
Natural Resources Wales From 1 April 2013 Natural Resources Wales (NRW) a new body formed by the Welsh Government will take over the functions previously carried out by the Environment Agency (EA) in Wales alongside those of the Forestry Commission Wales and the Countryside Council for Wales
Ofwat The Water Services Regulation Authority ndash the economic regulator of the water and sewerage companies of England and Wales
OPEX Operating expenditure Appointed water and sewerage companiesrsquo day‐to‐day spending on running the services for example staff costs and power This is likely to include investment in joint projects that do not create or relate to an asset that the company solely or jointly owns
Outcomes Outcomes are the higher level objectives that a companyrsquos actions are intended to deliver A companyrsquos outcome should reflect its customersrsquo priorities identified through appropriate customer engagement and deliver the best long‐term sustainable solution for customers and the environment An outcome may not be bound by a single price control period and should be set in the context of customersrsquo and the environmentrsquos long‐term needs
205240txt012|May 2013
Drainage Strategy Framework
Price Review The process of setting appointed water and sewerage companiesrsquo price limits The next price review will take place in 2014 for the period 2015‐20 Ofwat currently sets price limits every five years
Real Time Control (RTC) Using actuated pumps gates and weirs to actively control flow in sewers Better use can be made of existing infrastructure and links can be made between network treatment and receiving water systems for operational benefits Sometimes referred to as Active Management
River Basin Management (Plans) River Basin Management is a continuous process of planning (to develop River Basin Management Plans) and delivery The Water Framework Directive introduces a formal series of 6 year cycles The first cycle will end in 2015 when following further planning and consultation the River Basin Management Plans will be updated and reissued
Sewerage Management Plan A risk based approach to indentifying investment needs in sewerage systems as described in the Sewerage Risk Management (SRM) approach developed by WRc plc
Storm water retrofit Releasing capacity in sewers by controlling stormwater at the surface using disconnection swales and other sustainable drainage systems (SuDS)
205240txt012|May 2013
We are the Environment Agency We protect and improve the environment and make it a better place for people and wildlife We operate at the place where environmental change has its greatest impact on peoplersquos lives We reduce the risks to people and properties from flooding make sure there is enough water for people and wildlife protect and improve air land and water quality and apply the environmental standards within which industry can operate Acting to reduce climate change and helping people and wildlife adapt to its consequences are at the heart of all that we do We cannot do this alone We work closely with a wide range of partners including government business local authorities other agencies civil society groups and the communities we serve
wwwenvironment‐agencygovuk
Environment Agency National Customer Contact Centre
Telephone 03708 506 506 enquiriesenvironment‐agencygovuk
Ofwat (The Water Services Regulation Authority) is a non‐ministerial government department We are responsible for making sure that the water and sewerage sectors in England and Wales provide consumers with a good quality and efficient service at a fair price
wwwofwatgovuk
Telephone 0121 644 7500 mailboxofwatgsigovuk
Halcrow Group Limited Burderop Park Swindon Wiltshire SN4 0QD
tel 01793 812479 fax 01793 812089 halcrowcom
Halcrow Group Limited is a CH2M HILL company Halcrow Group Limited has prepared this report in accordance with
the instructions of The Environment Agency for the clientrsquos sole and specific use Any other persons who use any information contained herein do so at their own risk

13
Drainage Strategy Framework
The following section (13) is provided as a generic illustration of how companies might choose to communicate the process of developing selecting and delivering a Drainage Strategy in a location Full technical analysis and documentation demonstrating how the six principles have been followed neednrsquot be made publically available as this may contain confidential complex and sensitive information It is envisaged that a Drainage Strategy could be communicated within up to 20 written pages depending on size and complexity
Suggested Elements of a Drainage Strategy for Sharing with Partners and the Public
The following is provided as an example of the type of information that could be shared publically to communicate the Drainage Strategy for a catchment
1 Provide a catchment description and map illustrating principal drainage and related water infrastructure (eg larger sewers combined sewer overflows wastewater treatment works rivers and ordinary water courses) Explain how wastewater and stormwater are collected and treated
2 Describe company aims and outcomes and how these relate to the drainage system Indicate the performance measures that will be used to monitor progress towards the achievement of outcomes Report on current and historical patterns in performance measures for the catchment (eg number of flooded properties number of pollution incidents and frequency of combined sewer overflow operation)
3 Summarise the wider drainage issues in the catchment their relation to the companyrsquos assets and the organisations consulted in the development of the Drainage Strategy (eg describe areas of significant surface water flooding)
4 Describe and quantify any pressures in the catchment that will affect the achievement of outcomes ndash eg population change urban creep new development climate change asset deterioration water consumption and environmental legislation
5 Describe how the pressures identified will influence predicted future performance measures (a do nothing scenario) Show the rate of change over time and discuss any uncertainties
6 Describe a short‐list of alternative strategies that are technically feasible and result in the achievement of outcomes for the catchment Explain the strengths weaknesses opportunities and threats of alternative strategies considering societal benefits whole life costs programming uncertainties and the role of other organisations Consider the perspectives of customers and other organisations (eg with reference to Local Flood Risk Management Strategies or River Basin Management Plans)
7 Explain the selection of a preferred strategy (with reference to SWOT analysis) and illustrate this in more detail with plans timelines and images so that stakeholders understand what might be involved and how it will impact on them A full disclosure of strategy appraisal is not necessary The roles of other organisations should be agreed and described
8 Explain how progress towards delivery of the Drainage Strategy and the achievement of outcomes will be monitored and reported
205240txt012|May 2013
3
Drainage Strategy Framework
Figure 1 Water and sewerage company Drainage Strategy interactions with other strategies plans and processes relating to flood and water quality management
Figure 1 illustrates how a water and sewerage company produced Drainage Strategy relates to the strategies plans and processes of other partner organisations in flood and water quality management The principal external (to water and sewerage company) relationships are between Drainage Strategies and
205240txt012|May 2013
4
14
Drainage Strategy Framework
bull Local Development Plans (of planning authorities) bull Flood Risk Management Plans bull Local Flood Risk Management Strategies (of Lead Local Flood Authorities) and bull River Basin Management Plans (led by the Environment Agency)
A Drainage Strategy should be risk and evidence based and should lead to companies minimising whole life costs whilst still delivering outcomes for customers and the environment It should recognise that population growth new development urban creep climate change and changing customer behaviour all exert new pressures and demands on drainage systems
A Drainage Strategy is there to facilitate both long and short term planning While relatively few Strategies are likely to be complete in advance of 2015 we expect companies to adopt a risk based prioritisation approach to develop further Strategies in the coming years Once complete more detailed planning should be consistent with the long term Strategy both up to and beyond future price reviews (although it is recognised that competing priorities may affect the pace at which outcomes are delivered)
A Drainage Strategy is likely to contain a mixture of responding to current problems pro‐actively reducing risks for predicted problems improving operational responses and acting to improve data and reduce uncertainty An example structure for a Drainage Strategy is included in Section 13
Links with Established Drainage Planning Processes
The Drainage Strategy framework encompasses and supplements established planning processes and technical guidance which have been applied selectively and adapted by water and sewerage companies (and Lead Local Flood Authorities) in recent years when planning for drainage systems
These include
bull Common Framework for Capital Maintenance Planning6
bull Sewerage Management Plans (Sewerage Risk Management 5)7
bull Urban Pollution Management 38
bull Surface Water Management Plan technical guidance9
bull Local Government Association Framework to assist the development of the Local Strategy for Flood Risk Management10
bull Long Term Least Cost Planning for Wastewater Supply‐Demand (to be superseded in 2013)11
bull Water Cycle Study Guidance (2013 revision in print) 12
These CIWEM13 Urban Drainage Group (WaPUG) published technical guides are also in widespread use
6httpwwwukwirorgukwirlibrary80474 (poundpound‐ indicating that a charge is made to access this content) 7 httpsrmwrcplccouk (poundpound) 8 httpwwwfwrorgUPM3 9 httpwwwdefragovukpublications20110610pb13546‐surface‐water‐guidance 10httpwwwlocalgovukwebguestlocal‐flood‐risk‐management‐journal_content56101713618366ARTICLE‐TEMPLATE 11 httpukwirforefront‐librarycomreports07‐rg‐08‐291714 (poundpound) 12 httpwwwenvironment‐agencygovukresearchplanning33368aspx
205240txt012|May 2013
5
Drainage Strategy Framework
bull WaPUG code of practice for the hydraulic modelling of sewers (3rd edition) bull WaPUG guide to quality modelling of sewer systems bull WaPUG integrated drainage modelling guide
The sewerage risk management and surface water management methodologies in particular share a common phased approach to understanding drainage problems and developing cost effective solutions These phases are central to good practice in drainage planning and are central to the development of a Drainage Strategy
Generically these phases include
bull Initialisation Preparation phase where data are collated to understand current issues in the system and necessary partners are consulted with to agree success measures and objectives
bull Risk assessment phase where predictive tools are used to quantify current problems and predict how these problems will change in the future
bull Options appraisal phase where the costs and benefits of alternative remedies that meet agreed objectives are considered This informs the selection of a preferred solution or solutions
bull Implementation phase where drainage improvements are financed and delivered and the effectiveness of improvements monitored
The process is cyclical indicating that it is periodically revisited to confirm previous decisions address uncertainties and adapt to a changing environment Figure 2 and Figure 3 illustrate the Sewerage Risk Management and Surface Water Management Plan planning processes
Figure 2 Sewerage Risk Management Approach (Copyright WRc plc httpsrmwrcplccouk used with permission)
13 httpwwwciwemorgknowledge‐networksgroupsurban‐drainagepublicationsmodelling‐guidesaspx
205240txt012|May 2013
6
Drainage Strategy Framework
Figure 3 Surface Water Management Plan Approach
Ofwat has previously commissioned research14 on current practice in sewerage planning and drainage area plans concluding that traditional drainage area plans are no longer widely undertaken but that these activities are generally undertaken under different guises
14httpwwwofwatgovukfuturesustainabledrainagerpt_com20111208drainagepdf
205240txt012|May 2013
7
15
Drainage Strategy Framework
Statutory Obligations and Regulatory Drivers
151 Government
Drainage planning is undertaken within a context established by a variety of Government policies and instruments These are succinctly detailed in Defrarsquos October 2012 Statement of Obligations15
(for England) which is to be referenced by water and sewerage companies in the preparation of business plans for the 2015‐2020 price review period More specific guidance over priorities for 2015‐2020 is provided in Defrarsquos16 strategic policy statement for Ofwat A Water Strategy for Wales17 will be consulted on in 2013
The key legislative drivers and Government priorities relevant to drainage planning are summarised here
bull Section 94 of the Water Industry Act 199118 describes how every water and sewerage company is under a duty to lsquoprovide improve and extend hellip a system of public sewers hellip as to ensure that the area is and continues to be effectually drainedrsquo This is relevant to drainage planning because it explicitly indicates that the sewerage system should be improved to keep pace with growing pressures over the long term this requirement is assured if a long term Drainage Strategy is in place and implemented
bull The Urban Wastewater Treatment Directive19 provides a further requirement to provide sufficient capacity in wastewater collection systems
bull The Governments in England and Wales are committed to taking an ecosystems approach to environmental management which accounts for the environmental economic and social benefits that result from an improved water environment Water and sewerage companies are encouraged to invest in natural as well as built infrastructure to deliver their desired outcomes The Natural Choice 20 demonstrated how this type of investment can deliver a wide range of positive social environmental and economic outcomes Benefits can be determined using lsquopayments for ecosystem servicesrsquo 21 methods Water and sewerage companies are encouraged to consider these approaches where they can deliver cost beneficial outcomes for their customers This is relevant to drainage planning because it encourages the use of retrofit sustainable drainage systems in place of more traditional sewer upsizing and storage Ofwat has supported water and sewerage companies to investigate these approaches through pilot studies22 in the 2010 to 2015 price review period
bull Water and sewerage companies may work in partnership with other organisations to jointly invest in shared outcomes and to discuss with customers their willingness to pay for wider
15 httpwwwdefragovukpublications20121005pb13829‐statement‐obligations 16 httpwwwdefragovukpublications20130307pb13884‐sps‐seg‐ofwat 17httpwalesgovuktopicsenvironmentcountrysideepqwaterfloodingpublicationswater‐strategyjsessionid=235D11ADCC6EEC8EE88886DD69CE0784lang=en 18 httpwwwlegislationgovukukpga199156partIVchapterI 19 httparchivedefragovukenvironmentqualitywaterwaterqualitysewageuwwtdindexhtm 20 httpwwwdefragovukenvironmentnaturalwhitepaper 21 httpwwwdefragovukenvironmentnaturalecosystems‐services 22 httpwwwofwatgovukfuturesustainabledrainage
205240txt012|May 2013
8
Drainage Strategy Framework
benefits This is relevant to sewerage planning because it encourages water and sewerage companies to partner with local authorities to resolve complex storm water management problems (for flooding or pollution control) through the use of retrofit sustainable drainage systems The wider benefits to citizens outside of the water and sewerage companyrsquos customer base can be accounted for
bull The governments of England and Wales are promoting a catchment‐based approach23 to River Basin Management Planning to meet the water quality requirements of the Water Framework Directive (WFD)24 The important aspect of the approach is that all interested parties should work together to build consensus about the best way to improve water quality and habitats Water and sewerage companies should expect to be involved in the process of agreeing objectives and the apportionment of responsibility for delivering those objectives within the river basin districts they operate The central requirements of the Water Framework Directive are to prevent deterioration in water quality aim to achieve good chemical status and aim to achieve good ecological status It additionally seeks to limit the discharge of priority substances River Basin Management Plans will undergo consultation in the second half of 2014 and be published in December 2015 thereafter the programmes of measures included become statutory requirements and the Environment Agency (in England) and Natural Resources Wales will use permit and license conditions to ensure that water and sewerage companies deliver their agreed contributions This is relevant to drainage planning because misconnections blockages mechanical failure sewer flooding and combined sewer overflows (CSOs) can all contribute to the deterioration of water quality and the failure to achieve good ecological status or meet environmental quality standards for priority substances Climate change and growth may increase these risks but water and sewerage companies are not the only polluters and need to partner to ensure that outcomes are met Defra is consulting (closing February 2013) on developing its policies with respect to the control of diffuse urban pollution25
bull A revised Bathing Water Directive (20067EC)26 applies from 2015 and by then the Governmentrsquos aim is for all bathing waters to achieve at least lsquosufficient classrsquo this is approximately twice as stringent as requirements for the current Directive Subsequent planning should aim to achieve lsquogoodrsquo or lsquoexcellentrsquo classifications This is relevant to drainage planning because CSOs other wet weather intermittent discharges final effluent discharges and misconnections can all contribute to bathing water failures Climate change and growth may increase these risks but water and sewerage companies are not the only polluters and need to partner to ensure that outcomes are met
bull Under the Flood and Water Management Act (2010)27 water and sewerage companies (in England and Wales) must act in a manner consistent with the National Flood and Coastal Erosion Risk Management (NFCERM) Strategies28 for England and Wales and have regard to
23httpwwwdefragovukenvironmentqualitywaterlegislationcatchment‐approach 24httpwwwdefragovukenvironmentqualitywaterlegislationwater‐framework‐directive 25 httpwwwdefragovukconsult20121120water‐pollution 26 httpwwwenvironment‐agencygovukbusinessregulation107017aspx 27 httpwwwdefragovukenvironmentfloodinglegislation 28 httpwwwenvironment‐agencygovukresearchpolicy130073aspx
205240txt012|May 2013
9
16
Drainage Strategy Framework
Local Flood Risk Management Strategies29 NFCERM is based around six principles community amp partnership catchment based approach sustainability risk based planning beneficiary investment and delivering multiple benefits Companies should also co‐operate with local authorities and the Environment Agency in the exercise of their functions in relation to surface water management and combined sewers under section 94 of the Water Industry Act 1991 The Flood Risk Regulations 200930 implement the Floods Directive and give particular responsibilities to Lead Local Flood Authorities In lsquoFlood Risk Areasrsquo Lead Local Flood Authorities and the Environment Agency are expected to prepare Flood Risk Management Plans that set out flood risk management objectives and measures to manage risk from local flooding The Environment Agency is required to prepare Flood Risk Management Plans for the whole of England and Wales that cover flooding from main rivers the sea and reservoirs It is important for all risk management authorities to work in an effective way to plan to manage flood risk from all sources in a way that is well coordinated across catchments and coastal cells These duties are relevant to drainage planning because of the vital (but not unlimited) role surface water and combined sewers play in reducing flood risk in urban areas The Act also makes provision for the compulsory drainage of new developments through sustainable drainage systems (SuDS) and the lsquoright to connectrsquo being conditional on SuDS being approved by the SuDS Approval Body of the Lead Local Flood Authority
bull The Climate Change Act 200831 created a legal framework to cut greenhouse gas emissions and build the UKrsquos ability to adapt to a changing climate Water and sewerage companies are expected to reduce carbon emissions and adapt to the impact of climate change over the next decades The Government published its first UK climate change risk assessment in January 2012 and this will be updated every 5 years This is relevant to drainage planning because of the carbon embodied in new drainage infrastructure the carbon emitted during the pumping and treatment of sewage and the increase in flooding and pollution that will occur if climate change adaptations are not made The Government expects Ofwat to work towards the targets of its Adaptation Report and to ensure that its regulatory approach explicitly supports companies in adapting to climate change
bull From October 2011 the Water Industry (Schemes for Adoption of Private Sewers) Regulations 201132 transferred responsibility for existing private sewers and lateral drains to water and sewerage companies Pumping stations will be transferred by October 2016 This is relevant to drainage planning because of the significant increase in assets now within the responsibility of the water and sewerage company and the need to understand and respond to risks therein
Six Guiding Principles for a Drainage Strategy
This Drainage Strategy Framework describes good practice themed around six guiding principles Adherence to these principles will help ensure a Drainage Strategy which meets the expectations of Defra the Welsh Government the Environment Agency Natural Resources Wales and Ofwat and
29 The Local Government Association has published guidance on Local Flood Risk Management Strategies httpwwwlocalgovukcdocument_libraryget_fileuuid=a2538b94‐d3c1‐4cec‐81b0‐8aefd2996c5eampgroupId=10171 30 httpwwwenvironment‐agencygovukresearchplanning125459aspx 31 httpwwwdeccgovukencontentcmslegislationcc_act_08cc_act_08aspx 32 httpwwwlegislationgovukukdsi20119780111510933contents
205240txt012|May 2013
10
Drainage Strategy Framework
will be an essential means of communicating with customers and other partners Further details on each principle are described in Section 2 of this document along with examples of good practice
The six principles are
161 Partnership
Water and sewerage companies cannot develop optimal Drainage Strategies on their own and therefore partnership is key to developing and defining objectives performance indicators and the milestones that will need to be achieved in order to achieve measures that will demonstrate the delivery of outcomes Strategies should be developed and implemented in partnership with customers developers Lead Local Flood Authorities planning authorities the Environment Agency and Natural Resources Wales Strategies should align with (informing and informed by) River Basin Management Plans Local Flood Risk Management Strategies Flood Risk Management Plans and local plans (from planning authorities)
162 Uncertainty
Strategies should explain the reliability of data and knowledge about current and future performance of drainage systems They should explain what steps are planned to improve this understanding and how this will benefit customers Where future performance is uncertain (eg because of sensitivity to climate change) they should explain how adaptive approaches will be used to ensure outcomes are met The uncertainty in predictions of future risks should be recognised and accommodated within decision making
163 Risk based
Strategies should be risk based This means that planning operational and investment activities should be based on consideration of the probability and consequence of inadequate drainage function (risks) as these relate to the achievement of measures that demonstrate delivery of outcomes A risk based strategy ensures that investment is made where risks are the greatest
To aid communication risks should be visualised through maps and plans (Figure 10 is an example) To aid risk assessment risks should be monetised combined and predicted into the future To aid options appraisal the impact of interventions on the level of risk should be predicted
The approach to Drainage Strategy development should be risk based itself The degree of detail included should be related to an understanding of the overall level of risks in the catchment now and in the future
164 Whole life costs and benefits
Strategies should be informed by consideration of whole life costs and benefits They should promote a series of interventions which in view of the quantified uncertainties are most likely to result in performance indicators which demonstrate the achievement of outcomes at lowest cost to customers and the community more widely
Costs relate to capital and operational expenditure to deliver interventions and the monetised impacts of drainage failures such as flooding and pollution
Benefits relate to the reduction in risks from drainage failures such as flooding and pollution but should also include wider societal impacts such as those calculated using a lsquoPayments for Ecosystems Servicesrsquo approach
205240txt012|May 2013
11
17
Drainage Strategy Framework
When considering the lsquowhole lifersquo the strategy should consider climate population and asset deterioration trends These are likely to increase risks over the long term if no interventions are made The strategy should state lsquowhatrsquo should be done but also broadly lsquowhenrsquo and in what sequence interventions should happen
165 Live process
The Strategy should be adaptable and periodically reviewed Whilst outcomes are expected to be relatively stable over time the pace at which the strategy delivers outcomes will be linked to volatile influences (like climate and population change) and the decisions made at each price review about the priorities for the following period The strategy should be reviewed at regular intervals to reflect investments already made the changing priorities of the water and sewerage company and partners and the presence of emerging risks The review is also an opportunity to report drainage catchment performance relative to performance measures designed to monitor progress towards achieving outcomes
166 Innovative and sustainable
The framework promotes the full evaluation of alternatives to traditionally engineered sewerage solutions to test whether these offer lower whole life cost options or better responses to uncertainty It is anticipated that drainage solutions of the future will be different from the ones we are used to
These should include (at least at a high level) real time control or active management storm water retrofit techniques education to enable customers to change behaviour enhancing incentives for customers to reduce surface water flowing to sewers and innovative permitting arrangements across drainage networks and wastewater treatment works Water and sewerage companies should continue to review and develop other innovative solutions
For example where a company may historically have preferred to tackle sewer flooding or combined sewer overflow pollution by increasing its underground equipment to store more rainfall during storms it might consider other options in future such as working with customers to manage the rainfall close to source preventing it from entering the sewer system
Mapping the Framework to Current Planning Processes
We assume that practitioners will be following a broad and generic four‐stage planning process common to the Sewerage Risk Management (SRM5) and Surface Water Management Plan (SWMP) processes when preparing Drainage Strategies
Figure 4 is provided to guide water and sewerage companies in the development of Drainage Strategies It identifies each stage of the drainage planning process and highlights the good practice principles (colour coded by theme) in the locations through the process where it is most important that they are adopted
205240txt012|May 2013
12
e
u
t
v
b
DDrainage Strateegy Frameworrk
Initializepre
Establish partne and consultat
process
Define uncertai
Prepare risk d
Partnership
epare
rship ion
nties
ata
Ris
Co
Uncertainty
k assessmen
onsultation on risk issues
Quantify uncertainties
Quantify risks
Risk based
nt Options
Consult
Plan for
Demons life cost
Whole lif costs amp benefits
s appraisal
on options
uncertainties
strate whole and benefit
fe
s Live pro
Intervent
Aligned deliv collaborat solution
Innovative sustainab
Live and vis
cess Innova sustai
tion
ery amp ive s
and le
sible
ative amp nable
Figgure 4 Draina ge Strategy frramework prinnciples mappe d to the drainaage planning pprocess
118 WWho will bennefit from tthe Framewwork
Thhe Drainage Strategy Fraamework willl benefit
bull Water andd sewerage coompanies loooking to impprove their coompany speccific drainagge planning approach and make it fit for purpoose for the deelivery of lonng term outcoomes over mmultiple pricee review cyccles It will ppoint them toowards good practice andd provide exaamples as innspiration andd to promott ne innovation
bull Organisatiions and inddividuals lookking to enga ge with the ddevelopmen t of Drainagee Strategies and scruti nise progresss towards thhe achievemeent of outcommes associateed with enabbling growth adapting tto climate chhange managging floodingg and managging water poollution
22 DDrainagee Strateegy Frammeworkk Thhis section deescribes recoommended ggood practicee against eachh of the six kkey principle s necessary too develop a DDrainage Straategy For refference linkss are made too relevant annd establisheed planning prrocesses and emerging guuidance whicch drainage planners maay find usefuul These exammples are prrovided for innformation aand referenc e only
WWater and sewwerage comppanies shouldd work towaards developiing Drainagee Strategies wwhich apply thhese approachhes in a wayy that is consiistent with thheir needs annd those of thheir customeers and paartners Partnners should ttake note of tthis advice aand prepare tto engage wiith water andd sewerage coompanies on this basis
Thhe recommennded good ppractice is orgganised withhin each prinnciple as it wwould be appproached chhronologicallly in developping a Drainaage Strategy following thhe planning pprocesses alrready esstablished in the Seweragge Risk Manaagement anddor Surface WWater Managgement Plann mmethodologiess
2205240txt012|Mayy 2013
13
21
Drainage Strategy Framework
Principle One Partnership
Water and sewerage companies cannot develop optimal Drainage Strategies on their own and therefore partnership is key to developing and defining objectives performance indicators and the milestones that will need to be achieved in order to achieve measures that will demonstrate the delivery of outcomes Strategies should be developed and implemented in partnership with customers developers Lead Local Flood Authorities planning authorities the Environment Agency and Natural Resources Wales Strategies should align (informing and informed by) with River Basin Management Plans Local Flood Risk Management Strategies Flood Risk Management Plans and local plans (from planning authorities)
205240txt012|May 2013
14
Drainage Strategy Framework
211 Recommended good practice
No Good practice Example references
1 Engage with partners in a drainage catchment to bull Explain the purpose of developing a Drainage Strategy
and partnersrsquo roles in its success amp how each party will benefit from establishing a long term Drainage Strategy
bull Explain what outcomes are and how progress towards achieving them will be measured
bull Share data and information so that a shared understanding of risks and opportunities is developed
bull Explain what current drainage system performance is and how this is expected to change in the future Use risk visualisation tools to do this
bull Explain significant uncertainties and how these affect how interventions are delivered
Thames Water has demonstrated good practice through the development of its Counters Creek sewer flooding proposals This website describes the engagement process and how customers have been kept informed
2 Engage with the following partners in the development of the Drainage Strategy
bull Lead Local Flood Authority (the drainage area may include more than one) because of its responsibilities for local flood risk management and SuDS approval
bull Planning authority (the drainage area may include more than one) because of its role in determining the location and pace of housing development
bull Highways Authority because of the connection of highway runoff to public sewer systems
bull The Environment Agency (in England) because of its responsibilities for flood risk management (strategic overview) and ensuring good ecological quality is met in water bodies
bull Natural Resources Wales (in Wales) because of its responsibilities for flood risk management (strategic oversight) and ensuing good ecological quality is met in water bodies
bull Regional Flood and Coastal Committees who help develop a mutual understanding of flood and coastal erosion risks in an area
bull Bodies representing customers (eg Consumer Council for Water large local businesses flood action groups faith communities)
bull Bodies representing local environmental concerns (eg Wildlife Trusts Rivers Trusts)
bull Water only companies and water and sewerage company departments planning and operating water supply systems Water demand management practice can have an important impact on sewerage headroom
SWMP guidance (Chapter 2) advises on the establishment of partnerships for urban flood management and how to agree and align local objectives
3 Understand alignment of planning cycles and what this means locally (eg periodic review River Basin Management Plan Local Flood Risk Management Strategy Flood Risk Management Plan local plan)
205240txt012|May 2013
15
Drainage Strategy Framework
No Good practice Example references
4 Be alert to opportunities for joint solutions andor shared funding by understanding local plans for new development re‐development improving street furniture and public open space improving parks and green infrastructure Understand Lead Local Flood Authority and Environment Agency programmes for the management of flood and pollution risks
A guide to joint funding of local flood risk management intervention has been published by Defra33 and provides relevant advice to water and sewerage companies and other partners
5 Consider water and sewerage company funded solutions which deliver third‐party non‐sewerage assets that result in the long term least cost delivery of outcomes (eg water and sewerage company funding of household rain barrels and rain gardens to prevent surface water entering sewers)
6 Use data and mapping from the Environment Agency and Natural Resources Wales to understand exposure of drainage infrastructure to extreme events (eg coastal fluvial and surface water flood maps) so that network resilience can be understood and improved if this is cost beneficial
UKWIR has completed a project in 2013 lsquoResilience building a business case for PR14 and beyondrsquo
7 Work with LLFAs and the Environment Agency (or Natural Resources Wales) to understand the effectiveness of interventions at reducing risk and use this information to improve intervention planning
The UPM3 manual (section 7) advises on post project monitoring needs for water quality driven improvements
8 Share Drainage Strategies with partners and stakeholders so that there is transparency around challenges opportunities and the roles expected of different organisations
212 Good practice example ndash South West Water working with local authorities
These examples from South West Water illustrate how the company has worked with local authorities to coordinate investments and to share resources and skills in the development of integrated urban drainage management studies and Surface Water Management Plans
bull South West Water approached Devon County Council (DCC) to pool resources in delivering two (of five) pilot integrated urban drainage management studies (IUDMs) for Exeter and Exmouth South West Water took the lead role for Exmouth but DCC led in Exeter This engagement shared costs across organisations and has facilitated the production of full Surface Water Management Plans The collaboration has resulted in a shared understanding of the urban drainage challenges faced by both organisations and has opened dialogue around investment priorities
bull In Lyme Regis South West Water supported extensive coastal erosion defence works being carried out by West Dorset District Council by accelerating a programme of sewer rehabilitation and targeting renovation of sewers in vulnerable areas
bull In partnership with Cornwall County Council (CCC) and the Environment Agency South West Water has been working on a number of key drainage issues identified by CCC in its Preliminary Flood Risk Assessment (PFRA)
33 httprandddefragovukDefaultaspxMenu=MenuampModule=MoreampLocation=NoneampCompleted=0ampProjectID=17085
205240txt012|May 2013
16
Drainage Strategy Framework
bull In Camborne South West Water has taken the opportunity to invest in sewer separation works which align with the aims of the Camborne Pool Redruth urban regeneration group supported by Cornwall Council and to promote sustainable development economic growth and a strategic aim of lsquosewers for sewagersquo
213 Good practice example ndash Northumbrian Water partnership working in Tyneside
Northumbrian Water has led a sustainable sewerage study for Tyneside34 between 2010 and 2012 It is a good example of how partner organisations can collaborate to understand and resolve drainage issues in their urban area
Its approach was informed by the fact that a shared urban drainage problem around flooding and pollution was best addressed by a shared response from all the relevant organisations The project steering group involved representatives of Northumbrian Water the Consumer Council for Water the Environment Agency and five Lead Local Flood Authorities The urban drainage system collects wastewater for a single wastewater treatment works serving a population of over 900000
Working together the group studied the impact of growth urban creep and climate change on future urban drainage issues Figure 5 illustrates how a city‐wide map of potential problem areas was generated by the project team sharing data on sewer capacity (from Northumbrian Water) population change (from the local authorities) and river flooding (the Environment Agency) It was predicted that future problems were more likely to occur in the darker shaded areas These became focus areas for the project where a range of traditional and novel drainage solutions were tested
Figure 5 Future drainage problem areas indentified through data sharing
34httpcommunicatoremailcomINfNLOjNRayfOA1rfrfYcdK‐S7UwRcYcNoWebViewaspx
205240txt012|May 2013
17
22
Drainage Strategy Framework
The project team was keen to promote its work to customers and the community and prepared a series of newsletters updating interested parties on progress and issues An example is illustrated in Figure 6
C lic k here if y ou are hav in g d if f ic u lties v iew ing th is new s letter
Ho m e A b o u t u s M e d ia ce n tre C o n tact
Issue 2
Ap ril 2012
In th is ed ition U n d e rs tan d in g th e fu tu re
S u s tain ab le d ra ina g e o p tio ns
F ind ou t more about Th e 2 0 1 1 an n ua l re po rt
Ou r e n viro n m e n ta l p o licy
Ou r co rp o ra te re sp o nsib il i ty s tra te g y
W e lcom e to th e s e con d e ditio n o f S u sta inab le se we ra g e a s ix-m on th ly n e ws le tte r p ro d u ce d to b ring yo u th e la te s t n e ws on o u r m a jo r s tud ye xp lo rin g s us tain ab le s ew e ra ge o p tions in th e Tyn e s id e a rea I h o p e yo u fin d th e in fo rm a tio n o f in te res t a n d wo u ld w e lcom e fe e db a ck o n an y o f th e issu es ra ise d
Ric ha rd W a rne ford W a s te wa te r Dire c tor
U nderstand ing the fu tu re W e a ll kn o w th e difficu lties o f a ccu ra tely p re d ic tin g th e fu tu re h ow e ve r ifw e a re to p re pa re fo r i t th e n it is s om e thin g we m us t a tte m p t As p a rt o f th is s tu d y w e a re co ns id e rin g w ha t d em a nds w ill b e p la ce d on th e d ra ina g e s ys tem s a t 2 0 20 a n d a t 2 0 50 in co rpo ra ting g ro w th u rba n cre e p a nd c lim a te cha n ge B y w o rk in g close ly w ith o u r p a rtn e rs an d u s in g th e la tes t te ch n ical res e a rch we h a ve d e ve lo p ed a n d com p u te rm od e lle d a num b e r o f s ce na rios to id en tify a n d d e fin e fu tu re ris ks Th es e ris ks in c lud e p red ic tions o f p o te n tia l floo d in g p o llu tion o r b a rrie rs to g ro w th N o w th a t w e be tte r u n d e rs ta nd th e iss u es we a re a ble to p re pa re p la ns p rom o ting o p po rtu n ities fo r s us ta in a ble d rain ag e s ys tem s in o rde r to d e live r th e b es t p oss ible s e rvice fo r o u r cu s tom e rs b a la n ced a g ains te n viro nm e n tal n e eds a n d cos ts
S usta inab le d ra inage op tions W e b e lie ve o u r a pp ro a ch re p res en ts go o d p ra ctice fo r th e m a n ag em en t o f s u rfa ce wa te r w h ich is to d ea l w ith th e s u rfa ce wa te r as c los e to s ou rce as p oss ib le A w id e ra n g e o f p o te n tial o p po rtu n ities a re b ein g id e n tifie d in c lu d in g lo ca l a n d s tra te gic o p tions
S tra te g ic o p tions a re typ ica lly la rg e r th a n th e lo ca l on es a nd in c lu d e fe a tu res s u ch as a re as o f la nd w h ich w o uld b e a llo we d to flo o d d u rin g he a vy ra in (s a crific ial s to ra g e ) a n d p e rm a n en t w e tla nd fe a tu res
L o ca l op tio ns d esp ite b ein g sm a lle r th a n th e s tra te gic o n es w ill s til l p la y a ke y ro le in th e p ro vis io n o f s us tain ab le d ra ina g e Th e ir n a tu re m e a ns de p lo ym e n t co u ld be m o re w id es p re a d th a n s tra te gic o p tions fe a tu res su ch as w a te r b u tts ra in g a rde ns a nd p e rm e ab le pa vin g co u ld b e re la tive ly e a s y to fi t in to
Figure 6 Newsletter promoting urban drainage partnership working
Principle Two Uncertainty
Strategies should explain the reliability of data and knowledge about current and future performance of drainage systems They should explain what steps are planned to improve this understanding and how this will benefit customers Where future performance is uncertain (eg because of sensitivity to climate change) they should explain how adaptive approaches will be used to ensure outcomes are met The uncertainty in predictions of future risks should be recognised and accommodated within decision making
205240txt012|May 2013
18
Drainage Strategy Framework
221 Recommended good practice
No Good practice Example references
1 Data analysed and used in the development of the strategy related to asset location dimensions condition failure and flood and pollution incidents should be assigned a confidence grading The confidence grading should be related to its accuracy completeness compatibility credibility and currency
Models used to predict blockages and collapses flooding locations polluting discharges and water quality impacts should be assigned a confidence grading based on their accuracy completeness compatibility credibility and currency
Model predictions should be assigned a confidence grading depending on the confidence in the model and whether it is being applied outside of its verification range (eg for extreme events or for atypical geographies)
The purpose of confidence grading data and model results used in strategy setting is to understand the likelihood that outcomes will be achieved in a cost efficient manner Where the outcomes remain uncertain knowledge of data confidence can be used to target improvement programmes
SRM5 (S3‐03‐17) refers to Ofwatrsquos method for recording the reliability and accuracy of regulatory data in bands A to D
The SWMP guidance (Section 319) describes an alternative system of grading data and model results
2 Use the Drainage Strategy to justify data and model improvement programmes This should be focussed on areas where risks are currently (or predicted to be) high and uncertainty in data or models reduces the ability to determine robust operational or capital solutions Poor model verification in high risk areas would be an indicator that model improvements were required
CIWEMrsquos urban drainage group has published a series of guides on hydraulic and water quality modelling They discuss model calibration verification and uses
SRM5 (S3‐04) describes how to determine where the current assessment of risk is sufficient to proceed or whether data and models should be improved
3 Improve understanding of network performance (and improve models) by using long term flow and level monitoring on sewers and CSOs
Yorkshire Water discusses its CSO
monitoring programme here
4 Demonstrate how the uncertainty in both the underlying datamodels and in the future projections is addressed in options appraisal Consider if this should be done implicitly (eg through choosing conservative assumptions) or explicitly through the use of sensitivity analysis or scenario testing
Treasury Green Book supplementary guidance illustrates how to accommodate climate change uncertainties
205240txt012|May 2013
19
Drainage Strategy Framework
No Good practice Example references
5 Population growth new homes and businesses climate change and urban creep combine to make the future highly uncertain but will almost certainly increase flooding and pollution risks from drainage systems Use the Drainage Strategy to explore different scenarios (combining the impact of these drivers) for a near term (le 10 years) and future (ge 30 years) epoch
For example combine modest growth and slight climate change (a low impact case) and contrast with high growth and significant climate change (a high impact case) Where the location of significant new development is unknown include scenarios accommodating different possibilities
Running multiple scenarios is time consuming and costly A risk based approach should be adopted to focus efforts where flooding and pollution risks are especially sensitive to changes in demand
UKWIR has published research on accounting for climate change35 and urban creep36 in sewerage planning together with more general advice on accommodating climate change in water asset management planning37
Ofwat has published research38
predicting the combined impacts of climate change urban creep and development on a national basis
6 In the face of significant uncertainties about future demands on the drainage system and their consequences the Drainage Strategy should identify low‐regrets interventions (ie ones that are robust no matter what the future holds) and ensure that solutions can be adapted if greater certainty is achieved For example through quickening the pace of SuDS retrofit activities or using (previously identified and secured) land to extend underground storage facilities Strategies which remove surface water from sewerage networks provide lsquoheadroomrsquo for unpredictable increases in demand from population and climate change
Designing Resilient Cities A guide to good practice DR Lomardi et al HIS BRE Press
7 Post project appraisal and cost monitoring should be used to capture real costs and performance so that Strategies can be updated and improved with latest information It is especially important to collate and understand the whole life costs of new technologies where industry understanding is currently poor
35httpwwwukwirorgreports03‐cl‐10‐09042794658901799019890198 (poundpound) 36httpukwirforefront‐librarycomreports10‐wm‐07‐1493273 (poundpound) 37httpukwirforefront‐librarycomreports12‐cl‐01‐1694816900019015590145901409465890155 (poundpound) 38httpwwwofwatgovuksustainabilityclimatechangerpt_com201106mottmacsewerpdf
205240txt012|May 2013
20
Drainage Strategy Framework
222 Good practice example ndash Severn Trent Waterrsquos MICAS
Severn Trent Water has developed a process to measure confidence in hydraulic models of sewer systems Modelling Investment Confidence Assessment Scoring (MICAS) was developed to provide an objective evaluation of model confidence It uses information stored in the hydraulic model about the provenance of each data element and the quality of model verification Before the approach was developed the assessment of lsquofitness for purposersquo of models was subjective and based on modellers judgment This was not always reliable and certainly not repeatable and transparent MICAS provides an objective assessment of hydraulic model quality which can be used to inform its use and prioritise improvements to input data and model verification
Figure 7 and Figure 8 illustrate how an understanding of model confidence from the MICAS assessment (right hand side images) can be used to interpret predictions of flooding (left hand side images) In Figure 7 areas at predicted high risk of flooding (red in the left hand side image) are shown to be in high confidence areas of the hydraulic model (green in the right hand side image) In contrast in Figure 8 areas at predicted high risk of flooding (red in the left hand side image) are shown to be in poor confidence areas of the hydraulic models (orange in the right hand side image) In the latter case this information is used to identify where further model improvements would be beneficial
Flood Risk MICAS
Figure 7 Modelled flood risk and MICAS confidence scores (high model confidence)
Flood Risk MICAS
Figure 8 Modelled flood risk and MICAS confidence scores (lower model confidence)
205240txt012|May 2013
21
23
Drainage Strategy Framework
Principle Three Risk Based
Strategies should be risk based This means that planning operational and investment activities should be based on consideration of the probability and consequence of inadequate drainage function (risks) as these relate to the achievement of measures that demonstrate delivery of outcomes A risk based Strategy ensures that investment is made where risks are the greatest
To aid communication risks should be visualised through maps and plans (Figure 10 is an example) To aid risk assessment risks should be monetised combined and predicted into the future To aid options appraisal the impact of interventions on the level of risk should be predicted
The approach to Drainage Strategy development should be risk based itself The degree of detail included should be related to an understanding of the overall level of risks in the catchment now and in the future
231 Recommended good practice
No Good practice Example references
1 Determine where a Drainage Strategy is required by combining current performance with external influences likely to result in deteriorating performance This stage requires no modelling or detailed assessment On a catchment‐by‐catchment (drainage area) basis understand current risks by collating data on current performance eg blockages collapses pumping station failures pollution incidents CSO spills storm tank spills internal flooding incidents external flooding incidents and infiltration rates Relate these risks to performance indicators and the achievement of outcomes Combine with information about known growth rates predictions of urban creep quantity of newly adopted lsquoprivatersquo sewers surface water flooding risks (eg from flood map for surface water) WFD water body status and bathing water status Prioritise catchments with high current risks andor factors suggesting that risks are likely to worsen significantly in the future Consider normalising scoring method for size of catchment (eg by unit area or unit length of sewer) Consult with stakeholders to confirm correct prioritisation Commence with development of Drainage Strategies for the highest ranked catchments Periodically revisit prioritisation (updating with new data) to check that priorities are still correct
The initialisation stage of a Sewer Management Plan (SMP) (described in SRM5) considers how a risk assessment can be used to prioritise which spatial units (eg catchments) should be prioritised for a SMP study
2 Visualise catchment risks (from 1) to illustrate and explain to partners the reasons for prioritisation Accommodate their views amp consider changing prioritisation to aid wider drainage planning requirements (eg increase prioritisation of a catchment with significant surface water flooding problems where close collaboration between water and sewerage company and LLFA will benefit the community)
205240txt012|May 2013
22
Drainage Strategy Framework
No Good practice Example references
3 Clearly relate sewerage risks to the performance indicators that will be used to measure progress towards achieving outcomes eg relate blockage rates to flooding and pollution incidents eg relate increase in flows to increased CSO frequency breaches of permit conditions and deterioration in receiving water quality Adopt a sourcendashpathway‐receptor model and workshop techniques to ensure that cause effect and consequences are fully captured Use performance indicators as the basis for a comprehensive risk assessment that considers likelihood (frequency) and consequence (extent degree and duration of impact) of failure expressed as risk scores Monetise risks in GBP (pound) to align with principle four (whole life costs amp benefits) Use (verified) predictive models to understand near term (lt10 years) and long term (gt30 years) risks The latter to align with principle four (whole life costs amp benefits) Align complexity of method with level of risk recognising the needs of partners eg use complex 2D flood routing models to ascertain (with greater certainty) flood mechanisms and damages where the quantity and frequency of flooding is high and interventions will be complex and costly Elsewhere more simple approaches are appropriate eg use complex UPM3 water quality modelling methods where compliance with river standards or discharge consents is already failing or is expected to do so Elsewhere more simple approaches are appropriate Combine risk scores from different risks to describe the total level of risk in a catchment Use visualisation techniques to communicate combined level of risk Combine analysis from hydraulic blockage and asset deterioration models on a catchment basis In hydraulic analysis consider flooding performance for rainfall events beyond the usually provided standard of protection to understand performance in extreme events in support of partners (especially LLFAs) and in search of cost beneficial interventions at a higher standard than normal
SRM 5 (S3‐03) details approaches to simple and more complex approaches to risk assessment that are consistent with CMPCF guidelines
4 Be alert to interactions between sewer networks and wastewater treatment plans eg by modelling the impact of changing sewer flows on wastewater treatment worksrsquo performance and costs Consider combined impact of different catchments on a single or linked water body (eg an inland river bathing water or shell fishery)
UPM3 guidance discusses approaches to understanding these interactions and applying more complex water quality impact models
5 Establish systems and apply methods to predict how interventions can reduce risks eg how a targeted and pro‐active maintenance can reduce the occurrence of sewer blockage and flooding from lsquoother causesrsquo eg how reducing infiltration can reduce CSO spills eg how reducing connected impermeable area can reduce sewer flooding
205240txt012|May 2013
23
Drainage Strategy Framework
232 Good practice example ndash United Utilities risk assessment
United Utilities has demonstrated a robust risk based approach in the development of sewerage management plans used for long term planning across their area of operations
Hydraulic models were applied in 235 catchments and configured to look at future performance and to evaluate the consequences of inadequate capacity Starting from a baseline of 2010 versions of the models were built for 2020 and 2036 epochs The following model input parameters were adjusted population water consumption infiltration planned development known sewerage improvement projects urban creep rainfall (for climate change)
Two‐dimensional (2D) modelling was used to consider the consequences of sewer flooding resulting from the changes made to reflect the future operating environments As well as the impact on homes and business (from internal and external flooding) the flood risk to critical infrastructure was also considered The operation of CSOs was considered by computing the annual spill volume duration and frequency
Finally predictions of the likelihood and consequence of sewer failure were added taking account of sewer material age and the incident records relating to similar assets
All these data were combined and weighted to generate a Sewer Management Plan (SMP) Risk Score for each length of sewer The process is illustrated in Figure 9
Figure 9 United Utilitiesrsquo process for calculating risk score in sewerage catchments
205240txt012|May 2013
24
Drainage Strategy Framework
Risk scores were summed spatially and monetised so that high priority locations could be identified Mapping and visualisation were used to communicate the results of this assessment priority areas for further investigation and how risks change through time (Figure 10)
Figure 10 Visualisation of sewerage risks
233 Good practice example ndash Northumbrian Water risk assessment
Northumbrian Water completes an annual assessment of hydraulic capacity in its sewerage network at the drainage area scale Its approach does not require hydraulic models to have been completed and yet can reliably highlight areas of under‐capacity in need of further investigation through more detailed analysis including hydraulic modelling New and emerging risk areas can also be identified by applying data for population growth which occurs through development lsquoWhat ifrsquo scenarios can be run to test when capacity limits may be overcome and flood risks potentially set to increase It demonstrates good lsquorisk basedrsquo planning principles because it shows the drainage planner where more detailed analysis is warranted
The approach uses the following data from company records population connected to sewer P water consumption rate G (lhd) trade discharge E (ls) pipe diameter and gradient pipe connectivity CSO consent pass forward rate (ls) pumping station rate (ls) sewage treatment flow rate (ls) A wastewater dry weather capacity map calculates pipe full capacity dry weather flow (PG+E+I) and Formula A flow for fully combined (1360P+2E+DWF) and separate (4PG+3I+E) areas of the network Infiltration (I) is assumed to be 50 PG +E
205240txt012|May 2013
25
Drainage Strategy Framework
A theoretical assessment of network capacity is then calculated by comparing Formula A with pipe full capacity flow consent values at CSOs and wastewater treatment works and pumping rates This determines areas of the network with a capacity shortfall with a potential capacity shortfall and with no capacity shortfall
When run across the whole company area approximately 100 out of 500 drainage areas were found to be under capacity Over 60 of these areas had recorded sewer flooding incidents In over 300 drainage areas there was no forecast capacity shortfall Only 7 of these drainage areas had recorded sewer flooding incidents Overall the system proved to be very reliable at predicting drainage areas likely to have sewer flooding problems because of sewer under‐capacity
In under capacity drainage areas an intermediate (hydraulic model based) assessment is then carried out Figure 11 shows the results thematically mapped for an example drainage area Red areas are predicted to have a very high risk of sewer flooding Yellow and green areas are predicted to have a low risk of sewer flooding
Figure 11 Example of a drainage area capacity map
205240txt012|May 2013
26
24
Drainage Strategy Framework
Principle Four Whole Life Costs and Benefits
Strategies should be informed by consideration of whole life costs and benefits They should promote a series of interventions which in view of the quantified uncertainties are most likely to result in performance indicators which demonstrate the achievement of outcomes at lowest cost to customers and the community more widely
Costs relate to capital and operational expenditure to deliver interventions and the monetised impacts of drainage failures such as flooding and pollution
Benefits relate to the reduction in risks from drainage failures such as flooding and pollution but should also include wider societal impacts such as those calculated using a lsquoPayments for Ecosystems Servicesrsquo approach
When considering the lsquowhole lifersquo the strategy should consider climate population and asset deterioration trends These are likely to increase risks over the long term if no interventions are made The strategy should state lsquowhatrsquo should be done but also broadly lsquowhenrsquo and in what sequence interventions should happen
241 Recommended good practice
No Good practice Example references
1 Predict risks into the future for at least two epochs le10 years (to understand what the company needs to do now and how this fits with longer term outcomes) and ge30 years to understand long term needs in light of changing population and other pressures
Account for the following changes in demand
bull Growth ‐ new homes and businesses
bull Urban creep ndash uncontrolled addition of connected impermeable area
bull Climate change ndash affecting design events (flood predictions) time‐series (CSO and treated effluent quantities) river flows and temperatures
bull Infiltrationexfiltration ndash through deteriorating sewer condition
bull Dry weather flows ndash through changes in water consumption rates
2 Combining monetised risks (associated with sewerage failures) determine whole life costs for a lsquodo nothingrsquo scenario (ie no interventions)
Include costs associated with electricity consumption (in the network and at the wastewater treatment works) and CO2 emissions
UKWIR will publish in 2014 a revision to their Long Term Least Cost Planning for Wastewater Supply‐Demand
guidance This may provide tools and methods for expressing costs and benefits to support the development of a Drainage Strategy
205240txt012|May 2013
27
Drainage Strategy Framework
No Good practice Example references
3 Test intervention strategies which keep performance indicators on track to deliver outcomes by adding capacity (supply) reducing flows (demand) or altering operational regimes
Include the costs of interventions and the benefits of reduced risks to inform selection of the most cost beneficial strategy over the whole life
Have regard to the timing of interventions recognising that uncertainty may require low‐regrets (insensitive to uncertainty) solutions and that delaying major interventions may be more affordable and attractive in the short term Discounting should be used to compare the costs and benefits of interventions occurring at different times
Recognise that some interventions will be obligatory and defined (eg maintenance of a spill frequency standard at a CSO) whilst others will be more discretionary focused on achieving outcomes rather than specific outputs
SRM5 (Section 8) defines and contrasts cost benefit analysis cost effectiveness analysis whole life cost analysis and risk cost benefit analysis
HM Treasury Green Book39
sets out a framework for the appraisal of long term projects which can be applied to the development of a Drainage Strategy
4 Donrsquot at first be concerned with the distribution of costs and benefits between partners who may be sharing costs Identify the most cost beneficial solution first and then debate and agree an equitable sharing of costs
Give equal weighting to OPEX (operating expenditure) and CAPEX (capital expenditure) costs so not to cause bias towards capital intensive solutions Properly consider the costs and benefits of pro‐active maintenance regimes and campaigns to influence customers to reduce fats oils and greases (FOG) build‐ups and the misuse of sewers
Consider the affordability of solutions the impact on customersrsquo bills and the resources of other organisations to play their part
UKWIR research outputs40 in 2013 (SW01) will provide a framework for making a business case for separating storm water from combined sewers
5 Where interventions include the provision of green space public amenity and improved habitats then Payment for Ecosystem Services approaches should be used to identify further monetised benefits in the appraisal Customers should be consulted to help value these benefits
Supplementary Green Book41
guidance describes methods for accounting for environmental impacts including the ecosystems approach
39 httpwwwhm‐treasurygovukdata_greenbook_indexhtm 40 httpwwwukwirorgpublishorsystemcomponent_viewaspLogDocId=96116 41 httpwwwhm‐treasurygovukdaccounting_environmental_impactspdf
205240txt012|May 2013
28
Drainage Strategy Framework
242 Good practice example ndash Severn Trent Water making the case for surface water separation in Stoke-on-Trent
In this example42 Severn Trent Water compared alternative ways of addressing sewer flooding problems by looking at a range of costs and benefits not all of which were directly associated with its specific responsibilities as a water and sewerage company Whilst the example does not express a monetised value for all costs and benefits over the whole life it does illustrate the types of factors which could be included in an appraisal of this type scaled to address problems at a catchment level It also demonstrates how working collaboratively can help identify solutions which are cost‐beneficial for the community at large
In an area of Stoke served by a combined sewer system five properties were at risk from sewer flooding in cellars for events equal to and less frequent than the 1 in 10 year probability A conventional sewer pumping station based solution was presented as the standard option
However a nearby former hospital site was also undergoing re‐development which would result in reduced runoff to the combined sewer The new drainage regime in the redevelopment site was sufficient to remove the flood risk at the five properties (this was a do nothing strategy)
A third option completely separated the development site runoff from the combined sewer and also addressed local flood risk issues nearby The solution required a new storm sewer and a network of swales and other SuDS features connecting with an ordinary watercourse
Table 1 illustrates how costs and benefits were compared across the three alternative strategies Each provided the same benefit in terms of the number of homes (5) relieved from sewer flooding The novel SuDS and surface water management solution additionally gave local flood risk relief to 3 further properties The separationSuDS strategy came at a higher capital cost but delivered greater social cost benefits savings in annual operating costs and a bonus improvement water quality (because of reduced CSO spill volume) Severn Trent selected the separation SuDS solution because the higher capital costs were offset by other benefits
Table 1 Costs and benefits of drainage improvements in part of Stoke-on-Trent
Do nothing Standard option
SuDS
Sewer flooding benefits 5 5 5
Other flooding benefits 0 0 3
Change in runoff to combined sewer (m3year) 0 0 ‐40000
Estimated cost (pound) 0 168000 419000
42httpwwwciwemorgmedia695460Paper203_Creating20Sewer20Capacity_Presentation2 0by20Mike20Woodpdf
205240txt012|May 2013
29
Drainage Strategy Framework
Do nothing Standard option
SuDS
Social Cost Benefit (pound) 16000 5000 51000
Change in electricity costs (poundyear) 0 +75 ‐525
Programme impact (years to deliver solution) + 4 0 +4
CSO spill volume (m3 in 1year event) +298 0 ‐397
243 Good practice example ndash New York City comparison of grey and green infrastructure drainage strategies
This example is taken from New York in the United States of America Itrsquos an illustration of how whole life costs have been compared for alternative strategies to solve urban drainage issues on a mega‐city scale The key data are summarised in Table 2
Table 2 Comparing drainage strategies in New York
Grey Strategy
Green Strategy
CSO spill volume reduction (billion gallons year)
101 122
Wider benefits over 20 years ($ million) 0 139 to 418
Whole life costs over 20 years ($ billion) 68 53
The information is taken from the New York City Green Infrastructure Plan43 produced by the Mayorrsquos Office in 2010 The Plan (and recent updates) provides a comprehensive evidence base around costs and benefits of different approaches to address the cityrsquos drainage problems It is therefore an excellent example of how drainage strategies can be described in plain language for a non‐specialist audience concerned with their environment and the cost of providing infrastructure to enhance it
It is becoming commonplace for North American cities (eg Portland and Philadelphia) to address the issue of frequent combined sewer overflow (CSO) operation by using a combination of grey infrastructure (sewers) and green infrastructure (sustainable drainage systems) The wider health
43 httpwwwnycgovhtmldephtmlstormwaternyc_green_infrastructure_planshtml
205240txt012|May 2013
30
25
Drainage Strategy Framework
and ecological benefits of green infrastructure approaches and the reduced reliance on materials and energy are attractive to utility planners and cities alike
New York has 422 CSOs and an agreed Long Term Control Strategy to significantly reduce the impact wet weather discharges have on aquatic systems throughout the city Annual discharges are currently (2010) estimated to be 30 billion gallons (114 million cubic meters) per year Building on existing and committed new sewer plans an agreed grey infrastructure based strategy to this problem is set to reduce these discharges to 198 billion gallons per year (a 34 reduction) by the 2030s An alternative green infrastructure approach based around intercepting the first inch (25mm) of rainfall across 10 of the impermeable city area by 2030 is predicted to reduce CSO spills to 179 billion gallons per year
Planners have calculated that the whole life costs after 20 years of the grey infrastructure solution will be $68 billion (2010 prices) compared to the green infrastructure whole life costs of $53 billion The green infrastructure strategy reduces CSO spills by more than the grey alternative for $15 billion less in terms of whole life cost Further planners have calculated that New Yorkers will benefit by up to $41844 million (accumulated over 20 years) in additional benefits associated with lower energy bills from control of urban heating increased property values and improved health
Based on this analysis New York City has committed itself to an aggressive green infrastructure based runoff control strategy to provide long term reductions in CSO spills The plan is to achieve interception of 15 of impermeable area by 2015 4 by 2020 7 by 2025 and 10 by 2030
Principle Five Live Process
The Strategy should be adaptable and periodically reviewed Whilst outcomes are expected to be relatively stable over time the pace at which the Strategy delivers outcomes will be linked to volatile influences (like climate and population change) and to the decisions made at each price review about the priorities for the following period The Strategy should be reviewed at regular intervals to reflect investments already made the changing priorities of the water and sewerage company and partners and the presence of emerging risks The review is also an opportunity to report drainage catchment performance relative to performance measures designed to monitor progress towards achieving outcomes
44 Estimated using methods from the New York Municipal Forest Resource Analysis (MFRA) prepared by the US Dept of Agriculture
205240txt012|May 2013
31
Drainage Strategy Framework
251 Recommended good practice
No Good practice Example references
1 Regularly repeat screening exercise to determine catchments requiring a Drainage Strategy and modify programme of Strategy development accordingly
Check for changes in measured rates of flooding and pollution incidents blockages collapses pumping station failures etc
Check for changes in extent and location of new development
Check for activities being undertaken by partners (eg redevelopment urban realm improvements and flooding and pollution management activities)
SRM5 illustrates how improved and updated knowledge of system performance should be applied to establish Strategies
2 In lsquolive Strategiesrsquo repeat risk assessment when data and models improve and adjust confidence scores accordingly
Confirm that Strategy will still achieve performance indicators and outcomes at least cost Revise Strategy as necessary
3 Periodically refresh Strategy accommodating impact of interventions already delivered using re‐verified predictive tools as appropriate
Confirm that Strategy will still achieve performance indicators and outcomes at least cost Revise Strategy as necessary
Triggers for a wholesale review of the Strategy are likely to be significant changes to the location or extent of planned development
4 Monitor report and share (with partners) the measures used to demonstrate delivery of outcomes Example measures may include the number of properties which experience sewer flooding the number of properties at risk of flooding the number of properties at risk from sewerage asset failure risk indices that capture both the probability and consequence of failure customer satisfaction with regards to clean rivers and beaches the number of pollution incidents the frequency of combined sewer overflow operation and compliance with discharge permit conditions
252 Good practice example ndash Thames Water live DAP
Thames Water has initiated a DAP (drainage area plan) Live approach Itrsquos a good example of how companies are continuously monitoring and updating the status of drainage area risks It provides a lsquoliversquo snapshot of the current health of all drainage areas in Thames Waterrsquos region allowing real time planning as part of a strategic approach It enables drainage planners to view the effectiveness
205240txt012|May 2013
32
Drainage Strategy Framework
of intervention strategies and compare incident rates across varying geographies and development types in the Thames Valley
DAP Live will be available for all catchments in the Thames Water area thus enabling
bull high level monitoring of risks across the business bull a live and strategic review of catchment performance bull prioritisation of catchments based on risk and bull an ability to share data with partners collaborating in drainage planning and improvements
Figure 12 illustrates the types of data managed through the DAP Live system These include asset data political and drainage boundaries environmental data operational data property amp growth data and modelling data As new data become available the DAP Live system is updated so that drainage planners have the most current view on emerging risks and issues
Asset data
Operational data
Property and growth data
Modelling data
Environmental data
Boundaries (SDACs operational political)
Figure 12 Data types held in the DAP Live system
Figure 13 illustrates how the system can provide analysis at a variety of scales from local authority boundaries sewage treatment works catchments drainage areas or a regular grid
205240txt012|May 2013
33
Drainage Strategy Framework
NE PROVINCES
WESTERN PROVINCES
NE LONDON bull Ops areas local W LONDON
SE LONDON authorities Large TIDWORTH SE PROVINCES
bull STW Catchments
bull Drainage areas(SDACs)
bull Regular grid Small
Figure 13 DAP Live reporting performance at different scales
205240txt012|May 2013
34
Drainage Strategy Framework
253 Good practice example ndash Wessex Water Water live data
Wessex Water is regularly using data geospatially to proactively identify and respond to risk Theirs is a good example of how data can be used to provide an adaptable approach that is regularly reviewed to plan investment
The risk‐based and live approach uses a set of likelihood and consequence models which are built up from all currently available data asset data (eg CCTV data material age) operational data (eg flooding and pollutions incidents) and information (eg locality near hospital or downstream of an overflow) All these data are collated for the entire Wessex region updated regularly and analysed geospatially
Figure 14 Sewer risk scores presented in a risk matrix and geospatially
This allows a risk score (Figure 14) to be calculated for each mapped sewer length which directs investigation more efficiently by allocating each mapped sewer a planned CCTV inspection date
This risk‐based approach has been successful in targeting problematic sewers increasing identification rates threefold Density analysis is performed using asset failure and operational information which allows planning of both proactive structural and operational investment
Proactively found structural issues are far more cost effective to repair before failure and can also prevent serviceability issues
205240txt012|May 2013
35
f
DDrainage Strateegy Frameworrk
Figgure 15 Hotsppot analysis
Thhe hotspot annalysis (Figuure 15) showss where operrational clustters have beeen calculatedd This hootspot analyssis is made aavailable on tthe Wessex WWater corporrate GIS to a llow operati onal staff to target their effforts to mitiggate against ffurther repeaat incidents AAdditional innformation ffrom asset annd operationnal activities ccan be addedd regularly too the databasses which drrive the mod els enabling rissk scores to bbe kept as livve as require d
226 Prrinciple Sixx Innovativve and Susstainable SSolutions
Thhe Drainage Strategy Fraamework proomotes the fuull evaluationn of alternatiives to tradit ionally enngineered sewwerage soluttions to test wwhether thesse offer loweer whole life ccost options or better reesponses to uuncertainty It is anticipaated that draainage solutioons of the futture will be ddifferent froom the ones we are usedd to
Thhese should iinclude (at leeast at a highh level) real ttime control storm waterr retrofit techhniques edducation to eenable custommers to changge behaviou r enhancingg incentives for customerss to reduce suurface water flowing to seewers and innnovative pe rmitting arraangements a cross drainagge networks annd sewage tr eatment worrks Water annd sewerage companies sshould continnue to revieww and deevelop other innovative ssolutions
Foor example wwhere a commpany may hiistorically haave preferredd to tackle seewer floodingg or coombined sewwer overflow pollution byy increasing iits undergrouund equipmment to store mmore rainfalll duuring stormss it might connsider other options in fuuture ndash such as working wwith custommers to mmanage the raainfall close tt eventing it foorm enteringg the sewer syystem o source pre
2205240txt012|Mayy 2013
36
Drainage Strategy Framework
261 Recommended good practice
No Good practice Example references
1 Use cost‐benefit methods to demonstrate that innovative and sustainable solution types provide best value for customers and the wider community
UKWIR will publish new research and guidance in 2013 addressing active control and storm water removal demonstrating how these technologies can be justified and included within Drainage Strategies
2 Consider integrated water resource management Work with partners (especially developers and local authorities) to examine whether use of stored stormwater reduces potable water consumption AND need for capacity in sewers
CIRIA has published a scoping study for water sensitive urban design45 in the UK
3 Consider a mix of conventional and new technologies using more adaptive approaches as low‐regrets responses to uncertainty eg prevent current sewer flooding with underground tank storage but address future risks (worsened by climate change) with retrofit SuDS implemented progressively
CIRIA has published lsquoRetrofitting to manage surface waterrsquo46 a comprehensive guide to planning and delivering this type of project
4 Use carbon accounting methods to compare embodied and emitted carbon in alternative intervention strategies so that these impacts are accounted for in whole life costs
Consider the benefits of surface water removal on the costs (including carbon) of pumping and sewage treatment
UKWIR47 has and continues to publish detailed guidance on carbon accounting for water and sewerage company use
45httpwwwciriaorgserviceresearch_informationAMContentManagerNet ContentDisplayaspxSection=research_informationampContentID=23581 46httpwwwciriaorgSERVICEHomecoreordersproductaspxcatid=5ampprodid=1909 47httpukwirforefront‐librarycomreports08‐cl‐01‐6923419000190269902659465890269
205240txt012|May 2013
37
Drainage Strategy Framework
No Good practice Example references
5 Where interventions include the provision of green space public amenity and improved habitats then Payment for Ecosystem Services approaches can be used to claim further monetised benefits in the appraisal Customers should be consulted to help value these benefits
The Environment Agency will publish data in 2013 on costs and benefits of retrofit stormwater projects to promote understanding and uptake
6 Share data within the industry on innovative solutions to increase knowledge of new technology and SuDs approaches
EA retrofitting SuDs costs and benefits database48
accommodating data from Ofwat AMP5 SuDS pilot initiative and other examples
262 Good practice example ndash Welsh Water surface water reduction and removal strategy for Gowerton and Llanelli
Dŵr Cymru Welsh Water and partners are applying innovative storm water removal methods to address capacity problems in the sewer network in Gowerton and Llanelli49 (population 140000) Current under capacity leads to localised sewer flooding and excessive combined sewer overflow (CSO) spill to the Burry Inlet a protected shellfish water and special area of conservation The capacity problems in the system were a concern for the Environment Agency (Wales) and there was a risk of widespread restrictions to economic development being imposed Dŵr Cymru Welsh Water Carmarthenshire County Council City and County of Swansea Consumer Council for Water Environment Agency Wales and the Welsh Government all worked in partnership to resolve the situation
A brand new hydraulic model was built for the entire sewerage network with particular attention paid to accurately representing the sources of storm run‐off and infiltration The model was verified against data from flow monitors and observed CSO spill frequencies into the Burry Inlet
To begin with a traditional sewer storage solution was proposed that would result in an average 10 spills a year into the shellfish water from all 90 CSOs in the two catchments Although this reduced spills and dealt with some of the flooding and growth issues the storage requirements would have been unaffordable provide no protection against long term climate change and would not tackle the fundamental problem of too much surface water getting into the combined network
An alternative approach based on the reduction and removal of storm water from the combined sewer system was also developed This was in accordance with Dŵr Cymru Welsh Waterrsquos Rainscape50 (surface water elimination and reduction) strategy To identify areas with the most
48httpevidenceenvironment‐agencygovukfcermenDefaultHomeAndLeisureFloodsWhatWereDoingIntoTheFutureScience ProgrammeResearchAndDevelopmentFCRMProjectaspxProjectID=15515be8‐bbed‐4204‐ae56‐3e810ba47694ampPageID=56bad68e‐dcb1‐4bf8‐84cc‐cbfd03ab63a2 49 httpwwwciwemorgmedia674511Paper20820Stephen20Ollierpdf 50httpwwwdwrcymrucom_libraryleaflets_publications_english
205240txt012|May 2013
38
Drainage Strategy Framework
potential for effective storm water removal a flowareaflooding thematic map was developed This was used to focus attention on areas which would deliver the most benefit if storm water removal was carried out These areas are coloured red in Figure 16
Figure 16 Thematic map showing areas of maximum potential for storm water removal
The following interventions (181 in total) were combined into single strategy to be delivered in phases by 2015 2020 and afterwards
bull The management of surface water through swales basins and soakaways rather than through combined sewers resulting in new amenity and ecological areas within the built‐up environment
bull Implementing smarter flow control to better use existing storage and conveyance assets bull Relining of sewers to prevent groundwater ingress bull Removal of land drainage connections to sewers bull Household rainwater harvesting retrofit schemes
surface_water_management_strategypdf
205240txt012|May 2013
39
Drainage Strategy Framework
Figure 17 is an artistrsquos impression of what one of the sustainable urban drainage system solutions may look like
Figure 17 Example retrofit SuDS solution proposed for Gowerton and Llanelli
Modelling has demonstrated that the alternative strategy will achieve the same CSO reduction benefit as the storage strategy together with flooding improvements and additional less tangible benefits at significantly lower cost than the traditional sewer storage solution
Figure 18 illustrates the dispersed nature of solutions identified for central Llanelli
Figure 18 Water sensitive urban design interventions planned for central Llanelli
205240txt012|May 2013
40
Drainage Strategy Framework
Appendix A
Glossary
205240txt012|May 2013
Drainage Strategy Framework
Appendix A Glossary
CAPEX Capital expenditure Appointed water and sewerage companiesrsquo spending on new replacement or refurbished capital assets such as construction or buying machinery
CIWEM Urban Drainage Group (WaPUG) A group of the Chartered Institution of Water and Environmental Management supporting professionals working in urban drainage
Combined Sewer Overflow (CSO) The discharge of untreated sewage diluted with storm water into rivers and the sea CSOs occur during heavy rain and are necessary to reduce the risk of sewer flooding The physical overflow structure is also called a CSO
Common Framework for Capital A planning approach developed for the water and Maintenance Planning sewerage companies in 2002 which provides a robust basis
for assessing future capital maintenance needs The approach is consistent with the needs of Ofwat
Defra The Department for Environment Food and Rural Affairs The Government Department with responsibility for water flooding and water quality in England
Drainage Area Plan (DAP) A detailed plan for a drainage catchment that prioritises a list of interventions based on risk using an approach established in the WRc Sewerage Rehabilitation Manual This approach has been succeeded by Sewerage Risk Management which guides the preparation of Sewerage Management Plans (SMP) Companies vary in how they prepare DAPs or SMPs (or their equivalents) following the general principles that have been established
Drainage Strategy Developed by water and sewerage companies to demonstrate how outcomes will be delivered in drainage catchments over the long term Drainage Strategies will use the information developed in producing a DAPSMP and if a drainage strategy has been produced this should be the starting point in producing a more detailed DAPSMP should this be required It is likely that the activities required to prepare DAPSMP and Drainage Strategies may overlap Drainage Strategies might not refer to specific interventions but instead outline a general approach
Drainage Strategy Framework Guidance to describe the contents and intention of Drainage Strategies
205240txt012|May 2013
Drainage Strategy Framework
Flood Risk Management Plans Required by the Flood Risk Regulations in Flood Risk Areas by December 2015
Flood Risk Regulations The legislative instrument used to implement the requirements of the Floods Directive in England and Wales
Floods Directive DIRECTIVE 200760EC of the European Parliament and of the Council of 23 October 2007 on the assessment and management of flood risks
Lead Local Flood Authority (LLFA) The Shire County or unitary authority with responsibility for managing local flood risk
Local development plans Developed by planning authorities to explain where and what type of development (new homes and businesses) will occur within their area They are required to explain water infrastructure needs to support this development
Local Flood Risk Management Strategy Developed by the Lead Local Flood Authority to explain (LFRMS) how local flood risk will be managed by the Authority and
in partnership with others
Natural Resources Wales From 1 April 2013 Natural Resources Wales (NRW) a new body formed by the Welsh Government will take over the functions previously carried out by the Environment Agency (EA) in Wales alongside those of the Forestry Commission Wales and the Countryside Council for Wales
Ofwat The Water Services Regulation Authority ndash the economic regulator of the water and sewerage companies of England and Wales
OPEX Operating expenditure Appointed water and sewerage companiesrsquo day‐to‐day spending on running the services for example staff costs and power This is likely to include investment in joint projects that do not create or relate to an asset that the company solely or jointly owns
Outcomes Outcomes are the higher level objectives that a companyrsquos actions are intended to deliver A companyrsquos outcome should reflect its customersrsquo priorities identified through appropriate customer engagement and deliver the best long‐term sustainable solution for customers and the environment An outcome may not be bound by a single price control period and should be set in the context of customersrsquo and the environmentrsquos long‐term needs
205240txt012|May 2013
Drainage Strategy Framework
Price Review The process of setting appointed water and sewerage companiesrsquo price limits The next price review will take place in 2014 for the period 2015‐20 Ofwat currently sets price limits every five years
Real Time Control (RTC) Using actuated pumps gates and weirs to actively control flow in sewers Better use can be made of existing infrastructure and links can be made between network treatment and receiving water systems for operational benefits Sometimes referred to as Active Management
River Basin Management (Plans) River Basin Management is a continuous process of planning (to develop River Basin Management Plans) and delivery The Water Framework Directive introduces a formal series of 6 year cycles The first cycle will end in 2015 when following further planning and consultation the River Basin Management Plans will be updated and reissued
Sewerage Management Plan A risk based approach to indentifying investment needs in sewerage systems as described in the Sewerage Risk Management (SRM) approach developed by WRc plc
Storm water retrofit Releasing capacity in sewers by controlling stormwater at the surface using disconnection swales and other sustainable drainage systems (SuDS)
205240txt012|May 2013
We are the Environment Agency We protect and improve the environment and make it a better place for people and wildlife We operate at the place where environmental change has its greatest impact on peoplersquos lives We reduce the risks to people and properties from flooding make sure there is enough water for people and wildlife protect and improve air land and water quality and apply the environmental standards within which industry can operate Acting to reduce climate change and helping people and wildlife adapt to its consequences are at the heart of all that we do We cannot do this alone We work closely with a wide range of partners including government business local authorities other agencies civil society groups and the communities we serve
wwwenvironment‐agencygovuk
Environment Agency National Customer Contact Centre
Telephone 03708 506 506 enquiriesenvironment‐agencygovuk
Ofwat (The Water Services Regulation Authority) is a non‐ministerial government department We are responsible for making sure that the water and sewerage sectors in England and Wales provide consumers with a good quality and efficient service at a fair price
wwwofwatgovuk
Telephone 0121 644 7500 mailboxofwatgsigovuk
Halcrow Group Limited Burderop Park Swindon Wiltshire SN4 0QD
tel 01793 812479 fax 01793 812089 halcrowcom
Halcrow Group Limited is a CH2M HILL company Halcrow Group Limited has prepared this report in accordance with
the instructions of The Environment Agency for the clientrsquos sole and specific use Any other persons who use any information contained herein do so at their own risk

Drainage Strategy Framework
Figure 1 Water and sewerage company Drainage Strategy interactions with other strategies plans and processes relating to flood and water quality management
Figure 1 illustrates how a water and sewerage company produced Drainage Strategy relates to the strategies plans and processes of other partner organisations in flood and water quality management The principal external (to water and sewerage company) relationships are between Drainage Strategies and
205240txt012|May 2013
4
14
Drainage Strategy Framework
bull Local Development Plans (of planning authorities) bull Flood Risk Management Plans bull Local Flood Risk Management Strategies (of Lead Local Flood Authorities) and bull River Basin Management Plans (led by the Environment Agency)
A Drainage Strategy should be risk and evidence based and should lead to companies minimising whole life costs whilst still delivering outcomes for customers and the environment It should recognise that population growth new development urban creep climate change and changing customer behaviour all exert new pressures and demands on drainage systems
A Drainage Strategy is there to facilitate both long and short term planning While relatively few Strategies are likely to be complete in advance of 2015 we expect companies to adopt a risk based prioritisation approach to develop further Strategies in the coming years Once complete more detailed planning should be consistent with the long term Strategy both up to and beyond future price reviews (although it is recognised that competing priorities may affect the pace at which outcomes are delivered)
A Drainage Strategy is likely to contain a mixture of responding to current problems pro‐actively reducing risks for predicted problems improving operational responses and acting to improve data and reduce uncertainty An example structure for a Drainage Strategy is included in Section 13
Links with Established Drainage Planning Processes
The Drainage Strategy framework encompasses and supplements established planning processes and technical guidance which have been applied selectively and adapted by water and sewerage companies (and Lead Local Flood Authorities) in recent years when planning for drainage systems
These include
bull Common Framework for Capital Maintenance Planning6
bull Sewerage Management Plans (Sewerage Risk Management 5)7
bull Urban Pollution Management 38
bull Surface Water Management Plan technical guidance9
bull Local Government Association Framework to assist the development of the Local Strategy for Flood Risk Management10
bull Long Term Least Cost Planning for Wastewater Supply‐Demand (to be superseded in 2013)11
bull Water Cycle Study Guidance (2013 revision in print) 12
These CIWEM13 Urban Drainage Group (WaPUG) published technical guides are also in widespread use
6httpwwwukwirorgukwirlibrary80474 (poundpound‐ indicating that a charge is made to access this content) 7 httpsrmwrcplccouk (poundpound) 8 httpwwwfwrorgUPM3 9 httpwwwdefragovukpublications20110610pb13546‐surface‐water‐guidance 10httpwwwlocalgovukwebguestlocal‐flood‐risk‐management‐journal_content56101713618366ARTICLE‐TEMPLATE 11 httpukwirforefront‐librarycomreports07‐rg‐08‐291714 (poundpound) 12 httpwwwenvironment‐agencygovukresearchplanning33368aspx
205240txt012|May 2013
5
Drainage Strategy Framework
bull WaPUG code of practice for the hydraulic modelling of sewers (3rd edition) bull WaPUG guide to quality modelling of sewer systems bull WaPUG integrated drainage modelling guide
The sewerage risk management and surface water management methodologies in particular share a common phased approach to understanding drainage problems and developing cost effective solutions These phases are central to good practice in drainage planning and are central to the development of a Drainage Strategy
Generically these phases include
bull Initialisation Preparation phase where data are collated to understand current issues in the system and necessary partners are consulted with to agree success measures and objectives
bull Risk assessment phase where predictive tools are used to quantify current problems and predict how these problems will change in the future
bull Options appraisal phase where the costs and benefits of alternative remedies that meet agreed objectives are considered This informs the selection of a preferred solution or solutions
bull Implementation phase where drainage improvements are financed and delivered and the effectiveness of improvements monitored
The process is cyclical indicating that it is periodically revisited to confirm previous decisions address uncertainties and adapt to a changing environment Figure 2 and Figure 3 illustrate the Sewerage Risk Management and Surface Water Management Plan planning processes
Figure 2 Sewerage Risk Management Approach (Copyright WRc plc httpsrmwrcplccouk used with permission)
13 httpwwwciwemorgknowledge‐networksgroupsurban‐drainagepublicationsmodelling‐guidesaspx
205240txt012|May 2013
6
Drainage Strategy Framework
Figure 3 Surface Water Management Plan Approach
Ofwat has previously commissioned research14 on current practice in sewerage planning and drainage area plans concluding that traditional drainage area plans are no longer widely undertaken but that these activities are generally undertaken under different guises
14httpwwwofwatgovukfuturesustainabledrainagerpt_com20111208drainagepdf
205240txt012|May 2013
7
15
Drainage Strategy Framework
Statutory Obligations and Regulatory Drivers
151 Government
Drainage planning is undertaken within a context established by a variety of Government policies and instruments These are succinctly detailed in Defrarsquos October 2012 Statement of Obligations15
(for England) which is to be referenced by water and sewerage companies in the preparation of business plans for the 2015‐2020 price review period More specific guidance over priorities for 2015‐2020 is provided in Defrarsquos16 strategic policy statement for Ofwat A Water Strategy for Wales17 will be consulted on in 2013
The key legislative drivers and Government priorities relevant to drainage planning are summarised here
bull Section 94 of the Water Industry Act 199118 describes how every water and sewerage company is under a duty to lsquoprovide improve and extend hellip a system of public sewers hellip as to ensure that the area is and continues to be effectually drainedrsquo This is relevant to drainage planning because it explicitly indicates that the sewerage system should be improved to keep pace with growing pressures over the long term this requirement is assured if a long term Drainage Strategy is in place and implemented
bull The Urban Wastewater Treatment Directive19 provides a further requirement to provide sufficient capacity in wastewater collection systems
bull The Governments in England and Wales are committed to taking an ecosystems approach to environmental management which accounts for the environmental economic and social benefits that result from an improved water environment Water and sewerage companies are encouraged to invest in natural as well as built infrastructure to deliver their desired outcomes The Natural Choice 20 demonstrated how this type of investment can deliver a wide range of positive social environmental and economic outcomes Benefits can be determined using lsquopayments for ecosystem servicesrsquo 21 methods Water and sewerage companies are encouraged to consider these approaches where they can deliver cost beneficial outcomes for their customers This is relevant to drainage planning because it encourages the use of retrofit sustainable drainage systems in place of more traditional sewer upsizing and storage Ofwat has supported water and sewerage companies to investigate these approaches through pilot studies22 in the 2010 to 2015 price review period
bull Water and sewerage companies may work in partnership with other organisations to jointly invest in shared outcomes and to discuss with customers their willingness to pay for wider
15 httpwwwdefragovukpublications20121005pb13829‐statement‐obligations 16 httpwwwdefragovukpublications20130307pb13884‐sps‐seg‐ofwat 17httpwalesgovuktopicsenvironmentcountrysideepqwaterfloodingpublicationswater‐strategyjsessionid=235D11ADCC6EEC8EE88886DD69CE0784lang=en 18 httpwwwlegislationgovukukpga199156partIVchapterI 19 httparchivedefragovukenvironmentqualitywaterwaterqualitysewageuwwtdindexhtm 20 httpwwwdefragovukenvironmentnaturalwhitepaper 21 httpwwwdefragovukenvironmentnaturalecosystems‐services 22 httpwwwofwatgovukfuturesustainabledrainage
205240txt012|May 2013
8
Drainage Strategy Framework
benefits This is relevant to sewerage planning because it encourages water and sewerage companies to partner with local authorities to resolve complex storm water management problems (for flooding or pollution control) through the use of retrofit sustainable drainage systems The wider benefits to citizens outside of the water and sewerage companyrsquos customer base can be accounted for
bull The governments of England and Wales are promoting a catchment‐based approach23 to River Basin Management Planning to meet the water quality requirements of the Water Framework Directive (WFD)24 The important aspect of the approach is that all interested parties should work together to build consensus about the best way to improve water quality and habitats Water and sewerage companies should expect to be involved in the process of agreeing objectives and the apportionment of responsibility for delivering those objectives within the river basin districts they operate The central requirements of the Water Framework Directive are to prevent deterioration in water quality aim to achieve good chemical status and aim to achieve good ecological status It additionally seeks to limit the discharge of priority substances River Basin Management Plans will undergo consultation in the second half of 2014 and be published in December 2015 thereafter the programmes of measures included become statutory requirements and the Environment Agency (in England) and Natural Resources Wales will use permit and license conditions to ensure that water and sewerage companies deliver their agreed contributions This is relevant to drainage planning because misconnections blockages mechanical failure sewer flooding and combined sewer overflows (CSOs) can all contribute to the deterioration of water quality and the failure to achieve good ecological status or meet environmental quality standards for priority substances Climate change and growth may increase these risks but water and sewerage companies are not the only polluters and need to partner to ensure that outcomes are met Defra is consulting (closing February 2013) on developing its policies with respect to the control of diffuse urban pollution25
bull A revised Bathing Water Directive (20067EC)26 applies from 2015 and by then the Governmentrsquos aim is for all bathing waters to achieve at least lsquosufficient classrsquo this is approximately twice as stringent as requirements for the current Directive Subsequent planning should aim to achieve lsquogoodrsquo or lsquoexcellentrsquo classifications This is relevant to drainage planning because CSOs other wet weather intermittent discharges final effluent discharges and misconnections can all contribute to bathing water failures Climate change and growth may increase these risks but water and sewerage companies are not the only polluters and need to partner to ensure that outcomes are met
bull Under the Flood and Water Management Act (2010)27 water and sewerage companies (in England and Wales) must act in a manner consistent with the National Flood and Coastal Erosion Risk Management (NFCERM) Strategies28 for England and Wales and have regard to
23httpwwwdefragovukenvironmentqualitywaterlegislationcatchment‐approach 24httpwwwdefragovukenvironmentqualitywaterlegislationwater‐framework‐directive 25 httpwwwdefragovukconsult20121120water‐pollution 26 httpwwwenvironment‐agencygovukbusinessregulation107017aspx 27 httpwwwdefragovukenvironmentfloodinglegislation 28 httpwwwenvironment‐agencygovukresearchpolicy130073aspx
205240txt012|May 2013
9
16
Drainage Strategy Framework
Local Flood Risk Management Strategies29 NFCERM is based around six principles community amp partnership catchment based approach sustainability risk based planning beneficiary investment and delivering multiple benefits Companies should also co‐operate with local authorities and the Environment Agency in the exercise of their functions in relation to surface water management and combined sewers under section 94 of the Water Industry Act 1991 The Flood Risk Regulations 200930 implement the Floods Directive and give particular responsibilities to Lead Local Flood Authorities In lsquoFlood Risk Areasrsquo Lead Local Flood Authorities and the Environment Agency are expected to prepare Flood Risk Management Plans that set out flood risk management objectives and measures to manage risk from local flooding The Environment Agency is required to prepare Flood Risk Management Plans for the whole of England and Wales that cover flooding from main rivers the sea and reservoirs It is important for all risk management authorities to work in an effective way to plan to manage flood risk from all sources in a way that is well coordinated across catchments and coastal cells These duties are relevant to drainage planning because of the vital (but not unlimited) role surface water and combined sewers play in reducing flood risk in urban areas The Act also makes provision for the compulsory drainage of new developments through sustainable drainage systems (SuDS) and the lsquoright to connectrsquo being conditional on SuDS being approved by the SuDS Approval Body of the Lead Local Flood Authority
bull The Climate Change Act 200831 created a legal framework to cut greenhouse gas emissions and build the UKrsquos ability to adapt to a changing climate Water and sewerage companies are expected to reduce carbon emissions and adapt to the impact of climate change over the next decades The Government published its first UK climate change risk assessment in January 2012 and this will be updated every 5 years This is relevant to drainage planning because of the carbon embodied in new drainage infrastructure the carbon emitted during the pumping and treatment of sewage and the increase in flooding and pollution that will occur if climate change adaptations are not made The Government expects Ofwat to work towards the targets of its Adaptation Report and to ensure that its regulatory approach explicitly supports companies in adapting to climate change
bull From October 2011 the Water Industry (Schemes for Adoption of Private Sewers) Regulations 201132 transferred responsibility for existing private sewers and lateral drains to water and sewerage companies Pumping stations will be transferred by October 2016 This is relevant to drainage planning because of the significant increase in assets now within the responsibility of the water and sewerage company and the need to understand and respond to risks therein
Six Guiding Principles for a Drainage Strategy
This Drainage Strategy Framework describes good practice themed around six guiding principles Adherence to these principles will help ensure a Drainage Strategy which meets the expectations of Defra the Welsh Government the Environment Agency Natural Resources Wales and Ofwat and
29 The Local Government Association has published guidance on Local Flood Risk Management Strategies httpwwwlocalgovukcdocument_libraryget_fileuuid=a2538b94‐d3c1‐4cec‐81b0‐8aefd2996c5eampgroupId=10171 30 httpwwwenvironment‐agencygovukresearchplanning125459aspx 31 httpwwwdeccgovukencontentcmslegislationcc_act_08cc_act_08aspx 32 httpwwwlegislationgovukukdsi20119780111510933contents
205240txt012|May 2013
10
Drainage Strategy Framework
will be an essential means of communicating with customers and other partners Further details on each principle are described in Section 2 of this document along with examples of good practice
The six principles are
161 Partnership
Water and sewerage companies cannot develop optimal Drainage Strategies on their own and therefore partnership is key to developing and defining objectives performance indicators and the milestones that will need to be achieved in order to achieve measures that will demonstrate the delivery of outcomes Strategies should be developed and implemented in partnership with customers developers Lead Local Flood Authorities planning authorities the Environment Agency and Natural Resources Wales Strategies should align with (informing and informed by) River Basin Management Plans Local Flood Risk Management Strategies Flood Risk Management Plans and local plans (from planning authorities)
162 Uncertainty
Strategies should explain the reliability of data and knowledge about current and future performance of drainage systems They should explain what steps are planned to improve this understanding and how this will benefit customers Where future performance is uncertain (eg because of sensitivity to climate change) they should explain how adaptive approaches will be used to ensure outcomes are met The uncertainty in predictions of future risks should be recognised and accommodated within decision making
163 Risk based
Strategies should be risk based This means that planning operational and investment activities should be based on consideration of the probability and consequence of inadequate drainage function (risks) as these relate to the achievement of measures that demonstrate delivery of outcomes A risk based strategy ensures that investment is made where risks are the greatest
To aid communication risks should be visualised through maps and plans (Figure 10 is an example) To aid risk assessment risks should be monetised combined and predicted into the future To aid options appraisal the impact of interventions on the level of risk should be predicted
The approach to Drainage Strategy development should be risk based itself The degree of detail included should be related to an understanding of the overall level of risks in the catchment now and in the future
164 Whole life costs and benefits
Strategies should be informed by consideration of whole life costs and benefits They should promote a series of interventions which in view of the quantified uncertainties are most likely to result in performance indicators which demonstrate the achievement of outcomes at lowest cost to customers and the community more widely
Costs relate to capital and operational expenditure to deliver interventions and the monetised impacts of drainage failures such as flooding and pollution
Benefits relate to the reduction in risks from drainage failures such as flooding and pollution but should also include wider societal impacts such as those calculated using a lsquoPayments for Ecosystems Servicesrsquo approach
205240txt012|May 2013
11
17
Drainage Strategy Framework
When considering the lsquowhole lifersquo the strategy should consider climate population and asset deterioration trends These are likely to increase risks over the long term if no interventions are made The strategy should state lsquowhatrsquo should be done but also broadly lsquowhenrsquo and in what sequence interventions should happen
165 Live process
The Strategy should be adaptable and periodically reviewed Whilst outcomes are expected to be relatively stable over time the pace at which the strategy delivers outcomes will be linked to volatile influences (like climate and population change) and the decisions made at each price review about the priorities for the following period The strategy should be reviewed at regular intervals to reflect investments already made the changing priorities of the water and sewerage company and partners and the presence of emerging risks The review is also an opportunity to report drainage catchment performance relative to performance measures designed to monitor progress towards achieving outcomes
166 Innovative and sustainable
The framework promotes the full evaluation of alternatives to traditionally engineered sewerage solutions to test whether these offer lower whole life cost options or better responses to uncertainty It is anticipated that drainage solutions of the future will be different from the ones we are used to
These should include (at least at a high level) real time control or active management storm water retrofit techniques education to enable customers to change behaviour enhancing incentives for customers to reduce surface water flowing to sewers and innovative permitting arrangements across drainage networks and wastewater treatment works Water and sewerage companies should continue to review and develop other innovative solutions
For example where a company may historically have preferred to tackle sewer flooding or combined sewer overflow pollution by increasing its underground equipment to store more rainfall during storms it might consider other options in future such as working with customers to manage the rainfall close to source preventing it from entering the sewer system
Mapping the Framework to Current Planning Processes
We assume that practitioners will be following a broad and generic four‐stage planning process common to the Sewerage Risk Management (SRM5) and Surface Water Management Plan (SWMP) processes when preparing Drainage Strategies
Figure 4 is provided to guide water and sewerage companies in the development of Drainage Strategies It identifies each stage of the drainage planning process and highlights the good practice principles (colour coded by theme) in the locations through the process where it is most important that they are adopted
205240txt012|May 2013
12
e
u
t
v
b
DDrainage Strateegy Frameworrk
Initializepre
Establish partne and consultat
process
Define uncertai
Prepare risk d
Partnership
epare
rship ion
nties
ata
Ris
Co
Uncertainty
k assessmen
onsultation on risk issues
Quantify uncertainties
Quantify risks
Risk based
nt Options
Consult
Plan for
Demons life cost
Whole lif costs amp benefits
s appraisal
on options
uncertainties
strate whole and benefit
fe
s Live pro
Intervent
Aligned deliv collaborat solution
Innovative sustainab
Live and vis
cess Innova sustai
tion
ery amp ive s
and le
sible
ative amp nable
Figgure 4 Draina ge Strategy frramework prinnciples mappe d to the drainaage planning pprocess
118 WWho will bennefit from tthe Framewwork
Thhe Drainage Strategy Fraamework willl benefit
bull Water andd sewerage coompanies loooking to impprove their coompany speccific drainagge planning approach and make it fit for purpoose for the deelivery of lonng term outcoomes over mmultiple pricee review cyccles It will ppoint them toowards good practice andd provide exaamples as innspiration andd to promott ne innovation
bull Organisatiions and inddividuals lookking to enga ge with the ddevelopmen t of Drainagee Strategies and scruti nise progresss towards thhe achievemeent of outcommes associateed with enabbling growth adapting tto climate chhange managging floodingg and managging water poollution
22 DDrainagee Strateegy Frammeworkk Thhis section deescribes recoommended ggood practicee against eachh of the six kkey principle s necessary too develop a DDrainage Straategy For refference linkss are made too relevant annd establisheed planning prrocesses and emerging guuidance whicch drainage planners maay find usefuul These exammples are prrovided for innformation aand referenc e only
WWater and sewwerage comppanies shouldd work towaards developiing Drainagee Strategies wwhich apply thhese approachhes in a wayy that is consiistent with thheir needs annd those of thheir customeers and paartners Partnners should ttake note of tthis advice aand prepare tto engage wiith water andd sewerage coompanies on this basis
Thhe recommennded good ppractice is orgganised withhin each prinnciple as it wwould be appproached chhronologicallly in developping a Drainaage Strategy following thhe planning pprocesses alrready esstablished in the Seweragge Risk Manaagement anddor Surface WWater Managgement Plann mmethodologiess
2205240txt012|Mayy 2013
13
21
Drainage Strategy Framework
Principle One Partnership
Water and sewerage companies cannot develop optimal Drainage Strategies on their own and therefore partnership is key to developing and defining objectives performance indicators and the milestones that will need to be achieved in order to achieve measures that will demonstrate the delivery of outcomes Strategies should be developed and implemented in partnership with customers developers Lead Local Flood Authorities planning authorities the Environment Agency and Natural Resources Wales Strategies should align (informing and informed by) with River Basin Management Plans Local Flood Risk Management Strategies Flood Risk Management Plans and local plans (from planning authorities)
205240txt012|May 2013
14
Drainage Strategy Framework
211 Recommended good practice
No Good practice Example references
1 Engage with partners in a drainage catchment to bull Explain the purpose of developing a Drainage Strategy
and partnersrsquo roles in its success amp how each party will benefit from establishing a long term Drainage Strategy
bull Explain what outcomes are and how progress towards achieving them will be measured
bull Share data and information so that a shared understanding of risks and opportunities is developed
bull Explain what current drainage system performance is and how this is expected to change in the future Use risk visualisation tools to do this
bull Explain significant uncertainties and how these affect how interventions are delivered
Thames Water has demonstrated good practice through the development of its Counters Creek sewer flooding proposals This website describes the engagement process and how customers have been kept informed
2 Engage with the following partners in the development of the Drainage Strategy
bull Lead Local Flood Authority (the drainage area may include more than one) because of its responsibilities for local flood risk management and SuDS approval
bull Planning authority (the drainage area may include more than one) because of its role in determining the location and pace of housing development
bull Highways Authority because of the connection of highway runoff to public sewer systems
bull The Environment Agency (in England) because of its responsibilities for flood risk management (strategic overview) and ensuring good ecological quality is met in water bodies
bull Natural Resources Wales (in Wales) because of its responsibilities for flood risk management (strategic oversight) and ensuing good ecological quality is met in water bodies
bull Regional Flood and Coastal Committees who help develop a mutual understanding of flood and coastal erosion risks in an area
bull Bodies representing customers (eg Consumer Council for Water large local businesses flood action groups faith communities)
bull Bodies representing local environmental concerns (eg Wildlife Trusts Rivers Trusts)
bull Water only companies and water and sewerage company departments planning and operating water supply systems Water demand management practice can have an important impact on sewerage headroom
SWMP guidance (Chapter 2) advises on the establishment of partnerships for urban flood management and how to agree and align local objectives
3 Understand alignment of planning cycles and what this means locally (eg periodic review River Basin Management Plan Local Flood Risk Management Strategy Flood Risk Management Plan local plan)
205240txt012|May 2013
15
Drainage Strategy Framework
No Good practice Example references
4 Be alert to opportunities for joint solutions andor shared funding by understanding local plans for new development re‐development improving street furniture and public open space improving parks and green infrastructure Understand Lead Local Flood Authority and Environment Agency programmes for the management of flood and pollution risks
A guide to joint funding of local flood risk management intervention has been published by Defra33 and provides relevant advice to water and sewerage companies and other partners
5 Consider water and sewerage company funded solutions which deliver third‐party non‐sewerage assets that result in the long term least cost delivery of outcomes (eg water and sewerage company funding of household rain barrels and rain gardens to prevent surface water entering sewers)
6 Use data and mapping from the Environment Agency and Natural Resources Wales to understand exposure of drainage infrastructure to extreme events (eg coastal fluvial and surface water flood maps) so that network resilience can be understood and improved if this is cost beneficial
UKWIR has completed a project in 2013 lsquoResilience building a business case for PR14 and beyondrsquo
7 Work with LLFAs and the Environment Agency (or Natural Resources Wales) to understand the effectiveness of interventions at reducing risk and use this information to improve intervention planning
The UPM3 manual (section 7) advises on post project monitoring needs for water quality driven improvements
8 Share Drainage Strategies with partners and stakeholders so that there is transparency around challenges opportunities and the roles expected of different organisations
212 Good practice example ndash South West Water working with local authorities
These examples from South West Water illustrate how the company has worked with local authorities to coordinate investments and to share resources and skills in the development of integrated urban drainage management studies and Surface Water Management Plans
bull South West Water approached Devon County Council (DCC) to pool resources in delivering two (of five) pilot integrated urban drainage management studies (IUDMs) for Exeter and Exmouth South West Water took the lead role for Exmouth but DCC led in Exeter This engagement shared costs across organisations and has facilitated the production of full Surface Water Management Plans The collaboration has resulted in a shared understanding of the urban drainage challenges faced by both organisations and has opened dialogue around investment priorities
bull In Lyme Regis South West Water supported extensive coastal erosion defence works being carried out by West Dorset District Council by accelerating a programme of sewer rehabilitation and targeting renovation of sewers in vulnerable areas
bull In partnership with Cornwall County Council (CCC) and the Environment Agency South West Water has been working on a number of key drainage issues identified by CCC in its Preliminary Flood Risk Assessment (PFRA)
33 httprandddefragovukDefaultaspxMenu=MenuampModule=MoreampLocation=NoneampCompleted=0ampProjectID=17085
205240txt012|May 2013
16
Drainage Strategy Framework
bull In Camborne South West Water has taken the opportunity to invest in sewer separation works which align with the aims of the Camborne Pool Redruth urban regeneration group supported by Cornwall Council and to promote sustainable development economic growth and a strategic aim of lsquosewers for sewagersquo
213 Good practice example ndash Northumbrian Water partnership working in Tyneside
Northumbrian Water has led a sustainable sewerage study for Tyneside34 between 2010 and 2012 It is a good example of how partner organisations can collaborate to understand and resolve drainage issues in their urban area
Its approach was informed by the fact that a shared urban drainage problem around flooding and pollution was best addressed by a shared response from all the relevant organisations The project steering group involved representatives of Northumbrian Water the Consumer Council for Water the Environment Agency and five Lead Local Flood Authorities The urban drainage system collects wastewater for a single wastewater treatment works serving a population of over 900000
Working together the group studied the impact of growth urban creep and climate change on future urban drainage issues Figure 5 illustrates how a city‐wide map of potential problem areas was generated by the project team sharing data on sewer capacity (from Northumbrian Water) population change (from the local authorities) and river flooding (the Environment Agency) It was predicted that future problems were more likely to occur in the darker shaded areas These became focus areas for the project where a range of traditional and novel drainage solutions were tested
Figure 5 Future drainage problem areas indentified through data sharing
34httpcommunicatoremailcomINfNLOjNRayfOA1rfrfYcdK‐S7UwRcYcNoWebViewaspx
205240txt012|May 2013
17
22
Drainage Strategy Framework
The project team was keen to promote its work to customers and the community and prepared a series of newsletters updating interested parties on progress and issues An example is illustrated in Figure 6
C lic k here if y ou are hav in g d if f ic u lties v iew ing th is new s letter
Ho m e A b o u t u s M e d ia ce n tre C o n tact
Issue 2
Ap ril 2012
In th is ed ition U n d e rs tan d in g th e fu tu re
S u s tain ab le d ra ina g e o p tio ns
F ind ou t more about Th e 2 0 1 1 an n ua l re po rt
Ou r e n viro n m e n ta l p o licy
Ou r co rp o ra te re sp o nsib il i ty s tra te g y
W e lcom e to th e s e con d e ditio n o f S u sta inab le se we ra g e a s ix-m on th ly n e ws le tte r p ro d u ce d to b ring yo u th e la te s t n e ws on o u r m a jo r s tud ye xp lo rin g s us tain ab le s ew e ra ge o p tions in th e Tyn e s id e a rea I h o p e yo u fin d th e in fo rm a tio n o f in te res t a n d wo u ld w e lcom e fe e db a ck o n an y o f th e issu es ra ise d
Ric ha rd W a rne ford W a s te wa te r Dire c tor
U nderstand ing the fu tu re W e a ll kn o w th e difficu lties o f a ccu ra tely p re d ic tin g th e fu tu re h ow e ve r ifw e a re to p re pa re fo r i t th e n it is s om e thin g we m us t a tte m p t As p a rt o f th is s tu d y w e a re co ns id e rin g w ha t d em a nds w ill b e p la ce d on th e d ra ina g e s ys tem s a t 2 0 20 a n d a t 2 0 50 in co rpo ra ting g ro w th u rba n cre e p a nd c lim a te cha n ge B y w o rk in g close ly w ith o u r p a rtn e rs an d u s in g th e la tes t te ch n ical res e a rch we h a ve d e ve lo p ed a n d com p u te rm od e lle d a num b e r o f s ce na rios to id en tify a n d d e fin e fu tu re ris ks Th es e ris ks in c lud e p red ic tions o f p o te n tia l floo d in g p o llu tion o r b a rrie rs to g ro w th N o w th a t w e be tte r u n d e rs ta nd th e iss u es we a re a ble to p re pa re p la ns p rom o ting o p po rtu n ities fo r s us ta in a ble d rain ag e s ys tem s in o rde r to d e live r th e b es t p oss ible s e rvice fo r o u r cu s tom e rs b a la n ced a g ains te n viro nm e n tal n e eds a n d cos ts
S usta inab le d ra inage op tions W e b e lie ve o u r a pp ro a ch re p res en ts go o d p ra ctice fo r th e m a n ag em en t o f s u rfa ce wa te r w h ich is to d ea l w ith th e s u rfa ce wa te r as c los e to s ou rce as p oss ib le A w id e ra n g e o f p o te n tial o p po rtu n ities a re b ein g id e n tifie d in c lu d in g lo ca l a n d s tra te gic o p tions
S tra te g ic o p tions a re typ ica lly la rg e r th a n th e lo ca l on es a nd in c lu d e fe a tu res s u ch as a re as o f la nd w h ich w o uld b e a llo we d to flo o d d u rin g he a vy ra in (s a crific ial s to ra g e ) a n d p e rm a n en t w e tla nd fe a tu res
L o ca l op tio ns d esp ite b ein g sm a lle r th a n th e s tra te gic o n es w ill s til l p la y a ke y ro le in th e p ro vis io n o f s us tain ab le d ra ina g e Th e ir n a tu re m e a ns de p lo ym e n t co u ld be m o re w id es p re a d th a n s tra te gic o p tions fe a tu res su ch as w a te r b u tts ra in g a rde ns a nd p e rm e ab le pa vin g co u ld b e re la tive ly e a s y to fi t in to
Figure 6 Newsletter promoting urban drainage partnership working
Principle Two Uncertainty
Strategies should explain the reliability of data and knowledge about current and future performance of drainage systems They should explain what steps are planned to improve this understanding and how this will benefit customers Where future performance is uncertain (eg because of sensitivity to climate change) they should explain how adaptive approaches will be used to ensure outcomes are met The uncertainty in predictions of future risks should be recognised and accommodated within decision making
205240txt012|May 2013
18
Drainage Strategy Framework
221 Recommended good practice
No Good practice Example references
1 Data analysed and used in the development of the strategy related to asset location dimensions condition failure and flood and pollution incidents should be assigned a confidence grading The confidence grading should be related to its accuracy completeness compatibility credibility and currency
Models used to predict blockages and collapses flooding locations polluting discharges and water quality impacts should be assigned a confidence grading based on their accuracy completeness compatibility credibility and currency
Model predictions should be assigned a confidence grading depending on the confidence in the model and whether it is being applied outside of its verification range (eg for extreme events or for atypical geographies)
The purpose of confidence grading data and model results used in strategy setting is to understand the likelihood that outcomes will be achieved in a cost efficient manner Where the outcomes remain uncertain knowledge of data confidence can be used to target improvement programmes
SRM5 (S3‐03‐17) refers to Ofwatrsquos method for recording the reliability and accuracy of regulatory data in bands A to D
The SWMP guidance (Section 319) describes an alternative system of grading data and model results
2 Use the Drainage Strategy to justify data and model improvement programmes This should be focussed on areas where risks are currently (or predicted to be) high and uncertainty in data or models reduces the ability to determine robust operational or capital solutions Poor model verification in high risk areas would be an indicator that model improvements were required
CIWEMrsquos urban drainage group has published a series of guides on hydraulic and water quality modelling They discuss model calibration verification and uses
SRM5 (S3‐04) describes how to determine where the current assessment of risk is sufficient to proceed or whether data and models should be improved
3 Improve understanding of network performance (and improve models) by using long term flow and level monitoring on sewers and CSOs
Yorkshire Water discusses its CSO
monitoring programme here
4 Demonstrate how the uncertainty in both the underlying datamodels and in the future projections is addressed in options appraisal Consider if this should be done implicitly (eg through choosing conservative assumptions) or explicitly through the use of sensitivity analysis or scenario testing
Treasury Green Book supplementary guidance illustrates how to accommodate climate change uncertainties
205240txt012|May 2013
19
Drainage Strategy Framework
No Good practice Example references
5 Population growth new homes and businesses climate change and urban creep combine to make the future highly uncertain but will almost certainly increase flooding and pollution risks from drainage systems Use the Drainage Strategy to explore different scenarios (combining the impact of these drivers) for a near term (le 10 years) and future (ge 30 years) epoch
For example combine modest growth and slight climate change (a low impact case) and contrast with high growth and significant climate change (a high impact case) Where the location of significant new development is unknown include scenarios accommodating different possibilities
Running multiple scenarios is time consuming and costly A risk based approach should be adopted to focus efforts where flooding and pollution risks are especially sensitive to changes in demand
UKWIR has published research on accounting for climate change35 and urban creep36 in sewerage planning together with more general advice on accommodating climate change in water asset management planning37
Ofwat has published research38
predicting the combined impacts of climate change urban creep and development on a national basis
6 In the face of significant uncertainties about future demands on the drainage system and their consequences the Drainage Strategy should identify low‐regrets interventions (ie ones that are robust no matter what the future holds) and ensure that solutions can be adapted if greater certainty is achieved For example through quickening the pace of SuDS retrofit activities or using (previously identified and secured) land to extend underground storage facilities Strategies which remove surface water from sewerage networks provide lsquoheadroomrsquo for unpredictable increases in demand from population and climate change
Designing Resilient Cities A guide to good practice DR Lomardi et al HIS BRE Press
7 Post project appraisal and cost monitoring should be used to capture real costs and performance so that Strategies can be updated and improved with latest information It is especially important to collate and understand the whole life costs of new technologies where industry understanding is currently poor
35httpwwwukwirorgreports03‐cl‐10‐09042794658901799019890198 (poundpound) 36httpukwirforefront‐librarycomreports10‐wm‐07‐1493273 (poundpound) 37httpukwirforefront‐librarycomreports12‐cl‐01‐1694816900019015590145901409465890155 (poundpound) 38httpwwwofwatgovuksustainabilityclimatechangerpt_com201106mottmacsewerpdf
205240txt012|May 2013
20
Drainage Strategy Framework
222 Good practice example ndash Severn Trent Waterrsquos MICAS
Severn Trent Water has developed a process to measure confidence in hydraulic models of sewer systems Modelling Investment Confidence Assessment Scoring (MICAS) was developed to provide an objective evaluation of model confidence It uses information stored in the hydraulic model about the provenance of each data element and the quality of model verification Before the approach was developed the assessment of lsquofitness for purposersquo of models was subjective and based on modellers judgment This was not always reliable and certainly not repeatable and transparent MICAS provides an objective assessment of hydraulic model quality which can be used to inform its use and prioritise improvements to input data and model verification
Figure 7 and Figure 8 illustrate how an understanding of model confidence from the MICAS assessment (right hand side images) can be used to interpret predictions of flooding (left hand side images) In Figure 7 areas at predicted high risk of flooding (red in the left hand side image) are shown to be in high confidence areas of the hydraulic model (green in the right hand side image) In contrast in Figure 8 areas at predicted high risk of flooding (red in the left hand side image) are shown to be in poor confidence areas of the hydraulic models (orange in the right hand side image) In the latter case this information is used to identify where further model improvements would be beneficial
Flood Risk MICAS
Figure 7 Modelled flood risk and MICAS confidence scores (high model confidence)
Flood Risk MICAS
Figure 8 Modelled flood risk and MICAS confidence scores (lower model confidence)
205240txt012|May 2013
21
23
Drainage Strategy Framework
Principle Three Risk Based
Strategies should be risk based This means that planning operational and investment activities should be based on consideration of the probability and consequence of inadequate drainage function (risks) as these relate to the achievement of measures that demonstrate delivery of outcomes A risk based Strategy ensures that investment is made where risks are the greatest
To aid communication risks should be visualised through maps and plans (Figure 10 is an example) To aid risk assessment risks should be monetised combined and predicted into the future To aid options appraisal the impact of interventions on the level of risk should be predicted
The approach to Drainage Strategy development should be risk based itself The degree of detail included should be related to an understanding of the overall level of risks in the catchment now and in the future
231 Recommended good practice
No Good practice Example references
1 Determine where a Drainage Strategy is required by combining current performance with external influences likely to result in deteriorating performance This stage requires no modelling or detailed assessment On a catchment‐by‐catchment (drainage area) basis understand current risks by collating data on current performance eg blockages collapses pumping station failures pollution incidents CSO spills storm tank spills internal flooding incidents external flooding incidents and infiltration rates Relate these risks to performance indicators and the achievement of outcomes Combine with information about known growth rates predictions of urban creep quantity of newly adopted lsquoprivatersquo sewers surface water flooding risks (eg from flood map for surface water) WFD water body status and bathing water status Prioritise catchments with high current risks andor factors suggesting that risks are likely to worsen significantly in the future Consider normalising scoring method for size of catchment (eg by unit area or unit length of sewer) Consult with stakeholders to confirm correct prioritisation Commence with development of Drainage Strategies for the highest ranked catchments Periodically revisit prioritisation (updating with new data) to check that priorities are still correct
The initialisation stage of a Sewer Management Plan (SMP) (described in SRM5) considers how a risk assessment can be used to prioritise which spatial units (eg catchments) should be prioritised for a SMP study
2 Visualise catchment risks (from 1) to illustrate and explain to partners the reasons for prioritisation Accommodate their views amp consider changing prioritisation to aid wider drainage planning requirements (eg increase prioritisation of a catchment with significant surface water flooding problems where close collaboration between water and sewerage company and LLFA will benefit the community)
205240txt012|May 2013
22
Drainage Strategy Framework
No Good practice Example references
3 Clearly relate sewerage risks to the performance indicators that will be used to measure progress towards achieving outcomes eg relate blockage rates to flooding and pollution incidents eg relate increase in flows to increased CSO frequency breaches of permit conditions and deterioration in receiving water quality Adopt a sourcendashpathway‐receptor model and workshop techniques to ensure that cause effect and consequences are fully captured Use performance indicators as the basis for a comprehensive risk assessment that considers likelihood (frequency) and consequence (extent degree and duration of impact) of failure expressed as risk scores Monetise risks in GBP (pound) to align with principle four (whole life costs amp benefits) Use (verified) predictive models to understand near term (lt10 years) and long term (gt30 years) risks The latter to align with principle four (whole life costs amp benefits) Align complexity of method with level of risk recognising the needs of partners eg use complex 2D flood routing models to ascertain (with greater certainty) flood mechanisms and damages where the quantity and frequency of flooding is high and interventions will be complex and costly Elsewhere more simple approaches are appropriate eg use complex UPM3 water quality modelling methods where compliance with river standards or discharge consents is already failing or is expected to do so Elsewhere more simple approaches are appropriate Combine risk scores from different risks to describe the total level of risk in a catchment Use visualisation techniques to communicate combined level of risk Combine analysis from hydraulic blockage and asset deterioration models on a catchment basis In hydraulic analysis consider flooding performance for rainfall events beyond the usually provided standard of protection to understand performance in extreme events in support of partners (especially LLFAs) and in search of cost beneficial interventions at a higher standard than normal
SRM 5 (S3‐03) details approaches to simple and more complex approaches to risk assessment that are consistent with CMPCF guidelines
4 Be alert to interactions between sewer networks and wastewater treatment plans eg by modelling the impact of changing sewer flows on wastewater treatment worksrsquo performance and costs Consider combined impact of different catchments on a single or linked water body (eg an inland river bathing water or shell fishery)
UPM3 guidance discusses approaches to understanding these interactions and applying more complex water quality impact models
5 Establish systems and apply methods to predict how interventions can reduce risks eg how a targeted and pro‐active maintenance can reduce the occurrence of sewer blockage and flooding from lsquoother causesrsquo eg how reducing infiltration can reduce CSO spills eg how reducing connected impermeable area can reduce sewer flooding
205240txt012|May 2013
23
Drainage Strategy Framework
232 Good practice example ndash United Utilities risk assessment
United Utilities has demonstrated a robust risk based approach in the development of sewerage management plans used for long term planning across their area of operations
Hydraulic models were applied in 235 catchments and configured to look at future performance and to evaluate the consequences of inadequate capacity Starting from a baseline of 2010 versions of the models were built for 2020 and 2036 epochs The following model input parameters were adjusted population water consumption infiltration planned development known sewerage improvement projects urban creep rainfall (for climate change)
Two‐dimensional (2D) modelling was used to consider the consequences of sewer flooding resulting from the changes made to reflect the future operating environments As well as the impact on homes and business (from internal and external flooding) the flood risk to critical infrastructure was also considered The operation of CSOs was considered by computing the annual spill volume duration and frequency
Finally predictions of the likelihood and consequence of sewer failure were added taking account of sewer material age and the incident records relating to similar assets
All these data were combined and weighted to generate a Sewer Management Plan (SMP) Risk Score for each length of sewer The process is illustrated in Figure 9
Figure 9 United Utilitiesrsquo process for calculating risk score in sewerage catchments
205240txt012|May 2013
24
Drainage Strategy Framework
Risk scores were summed spatially and monetised so that high priority locations could be identified Mapping and visualisation were used to communicate the results of this assessment priority areas for further investigation and how risks change through time (Figure 10)
Figure 10 Visualisation of sewerage risks
233 Good practice example ndash Northumbrian Water risk assessment
Northumbrian Water completes an annual assessment of hydraulic capacity in its sewerage network at the drainage area scale Its approach does not require hydraulic models to have been completed and yet can reliably highlight areas of under‐capacity in need of further investigation through more detailed analysis including hydraulic modelling New and emerging risk areas can also be identified by applying data for population growth which occurs through development lsquoWhat ifrsquo scenarios can be run to test when capacity limits may be overcome and flood risks potentially set to increase It demonstrates good lsquorisk basedrsquo planning principles because it shows the drainage planner where more detailed analysis is warranted
The approach uses the following data from company records population connected to sewer P water consumption rate G (lhd) trade discharge E (ls) pipe diameter and gradient pipe connectivity CSO consent pass forward rate (ls) pumping station rate (ls) sewage treatment flow rate (ls) A wastewater dry weather capacity map calculates pipe full capacity dry weather flow (PG+E+I) and Formula A flow for fully combined (1360P+2E+DWF) and separate (4PG+3I+E) areas of the network Infiltration (I) is assumed to be 50 PG +E
205240txt012|May 2013
25
Drainage Strategy Framework
A theoretical assessment of network capacity is then calculated by comparing Formula A with pipe full capacity flow consent values at CSOs and wastewater treatment works and pumping rates This determines areas of the network with a capacity shortfall with a potential capacity shortfall and with no capacity shortfall
When run across the whole company area approximately 100 out of 500 drainage areas were found to be under capacity Over 60 of these areas had recorded sewer flooding incidents In over 300 drainage areas there was no forecast capacity shortfall Only 7 of these drainage areas had recorded sewer flooding incidents Overall the system proved to be very reliable at predicting drainage areas likely to have sewer flooding problems because of sewer under‐capacity
In under capacity drainage areas an intermediate (hydraulic model based) assessment is then carried out Figure 11 shows the results thematically mapped for an example drainage area Red areas are predicted to have a very high risk of sewer flooding Yellow and green areas are predicted to have a low risk of sewer flooding
Figure 11 Example of a drainage area capacity map
205240txt012|May 2013
26
24
Drainage Strategy Framework
Principle Four Whole Life Costs and Benefits
Strategies should be informed by consideration of whole life costs and benefits They should promote a series of interventions which in view of the quantified uncertainties are most likely to result in performance indicators which demonstrate the achievement of outcomes at lowest cost to customers and the community more widely
Costs relate to capital and operational expenditure to deliver interventions and the monetised impacts of drainage failures such as flooding and pollution
Benefits relate to the reduction in risks from drainage failures such as flooding and pollution but should also include wider societal impacts such as those calculated using a lsquoPayments for Ecosystems Servicesrsquo approach
When considering the lsquowhole lifersquo the strategy should consider climate population and asset deterioration trends These are likely to increase risks over the long term if no interventions are made The strategy should state lsquowhatrsquo should be done but also broadly lsquowhenrsquo and in what sequence interventions should happen
241 Recommended good practice
No Good practice Example references
1 Predict risks into the future for at least two epochs le10 years (to understand what the company needs to do now and how this fits with longer term outcomes) and ge30 years to understand long term needs in light of changing population and other pressures
Account for the following changes in demand
bull Growth ‐ new homes and businesses
bull Urban creep ndash uncontrolled addition of connected impermeable area
bull Climate change ndash affecting design events (flood predictions) time‐series (CSO and treated effluent quantities) river flows and temperatures
bull Infiltrationexfiltration ndash through deteriorating sewer condition
bull Dry weather flows ndash through changes in water consumption rates
2 Combining monetised risks (associated with sewerage failures) determine whole life costs for a lsquodo nothingrsquo scenario (ie no interventions)
Include costs associated with electricity consumption (in the network and at the wastewater treatment works) and CO2 emissions
UKWIR will publish in 2014 a revision to their Long Term Least Cost Planning for Wastewater Supply‐Demand
guidance This may provide tools and methods for expressing costs and benefits to support the development of a Drainage Strategy
205240txt012|May 2013
27
Drainage Strategy Framework
No Good practice Example references
3 Test intervention strategies which keep performance indicators on track to deliver outcomes by adding capacity (supply) reducing flows (demand) or altering operational regimes
Include the costs of interventions and the benefits of reduced risks to inform selection of the most cost beneficial strategy over the whole life
Have regard to the timing of interventions recognising that uncertainty may require low‐regrets (insensitive to uncertainty) solutions and that delaying major interventions may be more affordable and attractive in the short term Discounting should be used to compare the costs and benefits of interventions occurring at different times
Recognise that some interventions will be obligatory and defined (eg maintenance of a spill frequency standard at a CSO) whilst others will be more discretionary focused on achieving outcomes rather than specific outputs
SRM5 (Section 8) defines and contrasts cost benefit analysis cost effectiveness analysis whole life cost analysis and risk cost benefit analysis
HM Treasury Green Book39
sets out a framework for the appraisal of long term projects which can be applied to the development of a Drainage Strategy
4 Donrsquot at first be concerned with the distribution of costs and benefits between partners who may be sharing costs Identify the most cost beneficial solution first and then debate and agree an equitable sharing of costs
Give equal weighting to OPEX (operating expenditure) and CAPEX (capital expenditure) costs so not to cause bias towards capital intensive solutions Properly consider the costs and benefits of pro‐active maintenance regimes and campaigns to influence customers to reduce fats oils and greases (FOG) build‐ups and the misuse of sewers
Consider the affordability of solutions the impact on customersrsquo bills and the resources of other organisations to play their part
UKWIR research outputs40 in 2013 (SW01) will provide a framework for making a business case for separating storm water from combined sewers
5 Where interventions include the provision of green space public amenity and improved habitats then Payment for Ecosystem Services approaches should be used to identify further monetised benefits in the appraisal Customers should be consulted to help value these benefits
Supplementary Green Book41
guidance describes methods for accounting for environmental impacts including the ecosystems approach
39 httpwwwhm‐treasurygovukdata_greenbook_indexhtm 40 httpwwwukwirorgpublishorsystemcomponent_viewaspLogDocId=96116 41 httpwwwhm‐treasurygovukdaccounting_environmental_impactspdf
205240txt012|May 2013
28
Drainage Strategy Framework
242 Good practice example ndash Severn Trent Water making the case for surface water separation in Stoke-on-Trent
In this example42 Severn Trent Water compared alternative ways of addressing sewer flooding problems by looking at a range of costs and benefits not all of which were directly associated with its specific responsibilities as a water and sewerage company Whilst the example does not express a monetised value for all costs and benefits over the whole life it does illustrate the types of factors which could be included in an appraisal of this type scaled to address problems at a catchment level It also demonstrates how working collaboratively can help identify solutions which are cost‐beneficial for the community at large
In an area of Stoke served by a combined sewer system five properties were at risk from sewer flooding in cellars for events equal to and less frequent than the 1 in 10 year probability A conventional sewer pumping station based solution was presented as the standard option
However a nearby former hospital site was also undergoing re‐development which would result in reduced runoff to the combined sewer The new drainage regime in the redevelopment site was sufficient to remove the flood risk at the five properties (this was a do nothing strategy)
A third option completely separated the development site runoff from the combined sewer and also addressed local flood risk issues nearby The solution required a new storm sewer and a network of swales and other SuDS features connecting with an ordinary watercourse
Table 1 illustrates how costs and benefits were compared across the three alternative strategies Each provided the same benefit in terms of the number of homes (5) relieved from sewer flooding The novel SuDS and surface water management solution additionally gave local flood risk relief to 3 further properties The separationSuDS strategy came at a higher capital cost but delivered greater social cost benefits savings in annual operating costs and a bonus improvement water quality (because of reduced CSO spill volume) Severn Trent selected the separation SuDS solution because the higher capital costs were offset by other benefits
Table 1 Costs and benefits of drainage improvements in part of Stoke-on-Trent
Do nothing Standard option
SuDS
Sewer flooding benefits 5 5 5
Other flooding benefits 0 0 3
Change in runoff to combined sewer (m3year) 0 0 ‐40000
Estimated cost (pound) 0 168000 419000
42httpwwwciwemorgmedia695460Paper203_Creating20Sewer20Capacity_Presentation2 0by20Mike20Woodpdf
205240txt012|May 2013
29
Drainage Strategy Framework
Do nothing Standard option
SuDS
Social Cost Benefit (pound) 16000 5000 51000
Change in electricity costs (poundyear) 0 +75 ‐525
Programme impact (years to deliver solution) + 4 0 +4
CSO spill volume (m3 in 1year event) +298 0 ‐397
243 Good practice example ndash New York City comparison of grey and green infrastructure drainage strategies
This example is taken from New York in the United States of America Itrsquos an illustration of how whole life costs have been compared for alternative strategies to solve urban drainage issues on a mega‐city scale The key data are summarised in Table 2
Table 2 Comparing drainage strategies in New York
Grey Strategy
Green Strategy
CSO spill volume reduction (billion gallons year)
101 122
Wider benefits over 20 years ($ million) 0 139 to 418
Whole life costs over 20 years ($ billion) 68 53
The information is taken from the New York City Green Infrastructure Plan43 produced by the Mayorrsquos Office in 2010 The Plan (and recent updates) provides a comprehensive evidence base around costs and benefits of different approaches to address the cityrsquos drainage problems It is therefore an excellent example of how drainage strategies can be described in plain language for a non‐specialist audience concerned with their environment and the cost of providing infrastructure to enhance it
It is becoming commonplace for North American cities (eg Portland and Philadelphia) to address the issue of frequent combined sewer overflow (CSO) operation by using a combination of grey infrastructure (sewers) and green infrastructure (sustainable drainage systems) The wider health
43 httpwwwnycgovhtmldephtmlstormwaternyc_green_infrastructure_planshtml
205240txt012|May 2013
30
25
Drainage Strategy Framework
and ecological benefits of green infrastructure approaches and the reduced reliance on materials and energy are attractive to utility planners and cities alike
New York has 422 CSOs and an agreed Long Term Control Strategy to significantly reduce the impact wet weather discharges have on aquatic systems throughout the city Annual discharges are currently (2010) estimated to be 30 billion gallons (114 million cubic meters) per year Building on existing and committed new sewer plans an agreed grey infrastructure based strategy to this problem is set to reduce these discharges to 198 billion gallons per year (a 34 reduction) by the 2030s An alternative green infrastructure approach based around intercepting the first inch (25mm) of rainfall across 10 of the impermeable city area by 2030 is predicted to reduce CSO spills to 179 billion gallons per year
Planners have calculated that the whole life costs after 20 years of the grey infrastructure solution will be $68 billion (2010 prices) compared to the green infrastructure whole life costs of $53 billion The green infrastructure strategy reduces CSO spills by more than the grey alternative for $15 billion less in terms of whole life cost Further planners have calculated that New Yorkers will benefit by up to $41844 million (accumulated over 20 years) in additional benefits associated with lower energy bills from control of urban heating increased property values and improved health
Based on this analysis New York City has committed itself to an aggressive green infrastructure based runoff control strategy to provide long term reductions in CSO spills The plan is to achieve interception of 15 of impermeable area by 2015 4 by 2020 7 by 2025 and 10 by 2030
Principle Five Live Process
The Strategy should be adaptable and periodically reviewed Whilst outcomes are expected to be relatively stable over time the pace at which the Strategy delivers outcomes will be linked to volatile influences (like climate and population change) and to the decisions made at each price review about the priorities for the following period The Strategy should be reviewed at regular intervals to reflect investments already made the changing priorities of the water and sewerage company and partners and the presence of emerging risks The review is also an opportunity to report drainage catchment performance relative to performance measures designed to monitor progress towards achieving outcomes
44 Estimated using methods from the New York Municipal Forest Resource Analysis (MFRA) prepared by the US Dept of Agriculture
205240txt012|May 2013
31
Drainage Strategy Framework
251 Recommended good practice
No Good practice Example references
1 Regularly repeat screening exercise to determine catchments requiring a Drainage Strategy and modify programme of Strategy development accordingly
Check for changes in measured rates of flooding and pollution incidents blockages collapses pumping station failures etc
Check for changes in extent and location of new development
Check for activities being undertaken by partners (eg redevelopment urban realm improvements and flooding and pollution management activities)
SRM5 illustrates how improved and updated knowledge of system performance should be applied to establish Strategies
2 In lsquolive Strategiesrsquo repeat risk assessment when data and models improve and adjust confidence scores accordingly
Confirm that Strategy will still achieve performance indicators and outcomes at least cost Revise Strategy as necessary
3 Periodically refresh Strategy accommodating impact of interventions already delivered using re‐verified predictive tools as appropriate
Confirm that Strategy will still achieve performance indicators and outcomes at least cost Revise Strategy as necessary
Triggers for a wholesale review of the Strategy are likely to be significant changes to the location or extent of planned development
4 Monitor report and share (with partners) the measures used to demonstrate delivery of outcomes Example measures may include the number of properties which experience sewer flooding the number of properties at risk of flooding the number of properties at risk from sewerage asset failure risk indices that capture both the probability and consequence of failure customer satisfaction with regards to clean rivers and beaches the number of pollution incidents the frequency of combined sewer overflow operation and compliance with discharge permit conditions
252 Good practice example ndash Thames Water live DAP
Thames Water has initiated a DAP (drainage area plan) Live approach Itrsquos a good example of how companies are continuously monitoring and updating the status of drainage area risks It provides a lsquoliversquo snapshot of the current health of all drainage areas in Thames Waterrsquos region allowing real time planning as part of a strategic approach It enables drainage planners to view the effectiveness
205240txt012|May 2013
32
Drainage Strategy Framework
of intervention strategies and compare incident rates across varying geographies and development types in the Thames Valley
DAP Live will be available for all catchments in the Thames Water area thus enabling
bull high level monitoring of risks across the business bull a live and strategic review of catchment performance bull prioritisation of catchments based on risk and bull an ability to share data with partners collaborating in drainage planning and improvements
Figure 12 illustrates the types of data managed through the DAP Live system These include asset data political and drainage boundaries environmental data operational data property amp growth data and modelling data As new data become available the DAP Live system is updated so that drainage planners have the most current view on emerging risks and issues
Asset data
Operational data
Property and growth data
Modelling data
Environmental data
Boundaries (SDACs operational political)
Figure 12 Data types held in the DAP Live system
Figure 13 illustrates how the system can provide analysis at a variety of scales from local authority boundaries sewage treatment works catchments drainage areas or a regular grid
205240txt012|May 2013
33
Drainage Strategy Framework
NE PROVINCES
WESTERN PROVINCES
NE LONDON bull Ops areas local W LONDON
SE LONDON authorities Large TIDWORTH SE PROVINCES
bull STW Catchments
bull Drainage areas(SDACs)
bull Regular grid Small
Figure 13 DAP Live reporting performance at different scales
205240txt012|May 2013
34
Drainage Strategy Framework
253 Good practice example ndash Wessex Water Water live data
Wessex Water is regularly using data geospatially to proactively identify and respond to risk Theirs is a good example of how data can be used to provide an adaptable approach that is regularly reviewed to plan investment
The risk‐based and live approach uses a set of likelihood and consequence models which are built up from all currently available data asset data (eg CCTV data material age) operational data (eg flooding and pollutions incidents) and information (eg locality near hospital or downstream of an overflow) All these data are collated for the entire Wessex region updated regularly and analysed geospatially
Figure 14 Sewer risk scores presented in a risk matrix and geospatially
This allows a risk score (Figure 14) to be calculated for each mapped sewer length which directs investigation more efficiently by allocating each mapped sewer a planned CCTV inspection date
This risk‐based approach has been successful in targeting problematic sewers increasing identification rates threefold Density analysis is performed using asset failure and operational information which allows planning of both proactive structural and operational investment
Proactively found structural issues are far more cost effective to repair before failure and can also prevent serviceability issues
205240txt012|May 2013
35
f
DDrainage Strateegy Frameworrk
Figgure 15 Hotsppot analysis
Thhe hotspot annalysis (Figuure 15) showss where operrational clustters have beeen calculatedd This hootspot analyssis is made aavailable on tthe Wessex WWater corporrate GIS to a llow operati onal staff to target their effforts to mitiggate against ffurther repeaat incidents AAdditional innformation ffrom asset annd operationnal activities ccan be addedd regularly too the databasses which drrive the mod els enabling rissk scores to bbe kept as livve as require d
226 Prrinciple Sixx Innovativve and Susstainable SSolutions
Thhe Drainage Strategy Fraamework proomotes the fuull evaluationn of alternatiives to tradit ionally enngineered sewwerage soluttions to test wwhether thesse offer loweer whole life ccost options or better reesponses to uuncertainty It is anticipaated that draainage solutioons of the futture will be ddifferent froom the ones we are usedd to
Thhese should iinclude (at leeast at a highh level) real ttime control storm waterr retrofit techhniques edducation to eenable custommers to changge behaviou r enhancingg incentives for customerss to reduce suurface water flowing to seewers and innnovative pe rmitting arraangements a cross drainagge networks annd sewage tr eatment worrks Water annd sewerage companies sshould continnue to revieww and deevelop other innovative ssolutions
Foor example wwhere a commpany may hiistorically haave preferredd to tackle seewer floodingg or coombined sewwer overflow pollution byy increasing iits undergrouund equipmment to store mmore rainfalll duuring stormss it might connsider other options in fuuture ndash such as working wwith custommers to mmanage the raainfall close tt eventing it foorm enteringg the sewer syystem o source pre
2205240txt012|Mayy 2013
36
Drainage Strategy Framework
261 Recommended good practice
No Good practice Example references
1 Use cost‐benefit methods to demonstrate that innovative and sustainable solution types provide best value for customers and the wider community
UKWIR will publish new research and guidance in 2013 addressing active control and storm water removal demonstrating how these technologies can be justified and included within Drainage Strategies
2 Consider integrated water resource management Work with partners (especially developers and local authorities) to examine whether use of stored stormwater reduces potable water consumption AND need for capacity in sewers
CIRIA has published a scoping study for water sensitive urban design45 in the UK
3 Consider a mix of conventional and new technologies using more adaptive approaches as low‐regrets responses to uncertainty eg prevent current sewer flooding with underground tank storage but address future risks (worsened by climate change) with retrofit SuDS implemented progressively
CIRIA has published lsquoRetrofitting to manage surface waterrsquo46 a comprehensive guide to planning and delivering this type of project
4 Use carbon accounting methods to compare embodied and emitted carbon in alternative intervention strategies so that these impacts are accounted for in whole life costs
Consider the benefits of surface water removal on the costs (including carbon) of pumping and sewage treatment
UKWIR47 has and continues to publish detailed guidance on carbon accounting for water and sewerage company use
45httpwwwciriaorgserviceresearch_informationAMContentManagerNet ContentDisplayaspxSection=research_informationampContentID=23581 46httpwwwciriaorgSERVICEHomecoreordersproductaspxcatid=5ampprodid=1909 47httpukwirforefront‐librarycomreports08‐cl‐01‐6923419000190269902659465890269
205240txt012|May 2013
37
Drainage Strategy Framework
No Good practice Example references
5 Where interventions include the provision of green space public amenity and improved habitats then Payment for Ecosystem Services approaches can be used to claim further monetised benefits in the appraisal Customers should be consulted to help value these benefits
The Environment Agency will publish data in 2013 on costs and benefits of retrofit stormwater projects to promote understanding and uptake
6 Share data within the industry on innovative solutions to increase knowledge of new technology and SuDs approaches
EA retrofitting SuDs costs and benefits database48
accommodating data from Ofwat AMP5 SuDS pilot initiative and other examples
262 Good practice example ndash Welsh Water surface water reduction and removal strategy for Gowerton and Llanelli
Dŵr Cymru Welsh Water and partners are applying innovative storm water removal methods to address capacity problems in the sewer network in Gowerton and Llanelli49 (population 140000) Current under capacity leads to localised sewer flooding and excessive combined sewer overflow (CSO) spill to the Burry Inlet a protected shellfish water and special area of conservation The capacity problems in the system were a concern for the Environment Agency (Wales) and there was a risk of widespread restrictions to economic development being imposed Dŵr Cymru Welsh Water Carmarthenshire County Council City and County of Swansea Consumer Council for Water Environment Agency Wales and the Welsh Government all worked in partnership to resolve the situation
A brand new hydraulic model was built for the entire sewerage network with particular attention paid to accurately representing the sources of storm run‐off and infiltration The model was verified against data from flow monitors and observed CSO spill frequencies into the Burry Inlet
To begin with a traditional sewer storage solution was proposed that would result in an average 10 spills a year into the shellfish water from all 90 CSOs in the two catchments Although this reduced spills and dealt with some of the flooding and growth issues the storage requirements would have been unaffordable provide no protection against long term climate change and would not tackle the fundamental problem of too much surface water getting into the combined network
An alternative approach based on the reduction and removal of storm water from the combined sewer system was also developed This was in accordance with Dŵr Cymru Welsh Waterrsquos Rainscape50 (surface water elimination and reduction) strategy To identify areas with the most
48httpevidenceenvironment‐agencygovukfcermenDefaultHomeAndLeisureFloodsWhatWereDoingIntoTheFutureScience ProgrammeResearchAndDevelopmentFCRMProjectaspxProjectID=15515be8‐bbed‐4204‐ae56‐3e810ba47694ampPageID=56bad68e‐dcb1‐4bf8‐84cc‐cbfd03ab63a2 49 httpwwwciwemorgmedia674511Paper20820Stephen20Ollierpdf 50httpwwwdwrcymrucom_libraryleaflets_publications_english
205240txt012|May 2013
38
Drainage Strategy Framework
potential for effective storm water removal a flowareaflooding thematic map was developed This was used to focus attention on areas which would deliver the most benefit if storm water removal was carried out These areas are coloured red in Figure 16
Figure 16 Thematic map showing areas of maximum potential for storm water removal
The following interventions (181 in total) were combined into single strategy to be delivered in phases by 2015 2020 and afterwards
bull The management of surface water through swales basins and soakaways rather than through combined sewers resulting in new amenity and ecological areas within the built‐up environment
bull Implementing smarter flow control to better use existing storage and conveyance assets bull Relining of sewers to prevent groundwater ingress bull Removal of land drainage connections to sewers bull Household rainwater harvesting retrofit schemes
surface_water_management_strategypdf
205240txt012|May 2013
39
Drainage Strategy Framework
Figure 17 is an artistrsquos impression of what one of the sustainable urban drainage system solutions may look like
Figure 17 Example retrofit SuDS solution proposed for Gowerton and Llanelli
Modelling has demonstrated that the alternative strategy will achieve the same CSO reduction benefit as the storage strategy together with flooding improvements and additional less tangible benefits at significantly lower cost than the traditional sewer storage solution
Figure 18 illustrates the dispersed nature of solutions identified for central Llanelli
Figure 18 Water sensitive urban design interventions planned for central Llanelli
205240txt012|May 2013
40
Drainage Strategy Framework
Appendix A
Glossary
205240txt012|May 2013
Drainage Strategy Framework
Appendix A Glossary
CAPEX Capital expenditure Appointed water and sewerage companiesrsquo spending on new replacement or refurbished capital assets such as construction or buying machinery
CIWEM Urban Drainage Group (WaPUG) A group of the Chartered Institution of Water and Environmental Management supporting professionals working in urban drainage
Combined Sewer Overflow (CSO) The discharge of untreated sewage diluted with storm water into rivers and the sea CSOs occur during heavy rain and are necessary to reduce the risk of sewer flooding The physical overflow structure is also called a CSO
Common Framework for Capital A planning approach developed for the water and Maintenance Planning sewerage companies in 2002 which provides a robust basis
for assessing future capital maintenance needs The approach is consistent with the needs of Ofwat
Defra The Department for Environment Food and Rural Affairs The Government Department with responsibility for water flooding and water quality in England
Drainage Area Plan (DAP) A detailed plan for a drainage catchment that prioritises a list of interventions based on risk using an approach established in the WRc Sewerage Rehabilitation Manual This approach has been succeeded by Sewerage Risk Management which guides the preparation of Sewerage Management Plans (SMP) Companies vary in how they prepare DAPs or SMPs (or their equivalents) following the general principles that have been established
Drainage Strategy Developed by water and sewerage companies to demonstrate how outcomes will be delivered in drainage catchments over the long term Drainage Strategies will use the information developed in producing a DAPSMP and if a drainage strategy has been produced this should be the starting point in producing a more detailed DAPSMP should this be required It is likely that the activities required to prepare DAPSMP and Drainage Strategies may overlap Drainage Strategies might not refer to specific interventions but instead outline a general approach
Drainage Strategy Framework Guidance to describe the contents and intention of Drainage Strategies
205240txt012|May 2013
Drainage Strategy Framework
Flood Risk Management Plans Required by the Flood Risk Regulations in Flood Risk Areas by December 2015
Flood Risk Regulations The legislative instrument used to implement the requirements of the Floods Directive in England and Wales
Floods Directive DIRECTIVE 200760EC of the European Parliament and of the Council of 23 October 2007 on the assessment and management of flood risks
Lead Local Flood Authority (LLFA) The Shire County or unitary authority with responsibility for managing local flood risk
Local development plans Developed by planning authorities to explain where and what type of development (new homes and businesses) will occur within their area They are required to explain water infrastructure needs to support this development
Local Flood Risk Management Strategy Developed by the Lead Local Flood Authority to explain (LFRMS) how local flood risk will be managed by the Authority and
in partnership with others
Natural Resources Wales From 1 April 2013 Natural Resources Wales (NRW) a new body formed by the Welsh Government will take over the functions previously carried out by the Environment Agency (EA) in Wales alongside those of the Forestry Commission Wales and the Countryside Council for Wales
Ofwat The Water Services Regulation Authority ndash the economic regulator of the water and sewerage companies of England and Wales
OPEX Operating expenditure Appointed water and sewerage companiesrsquo day‐to‐day spending on running the services for example staff costs and power This is likely to include investment in joint projects that do not create or relate to an asset that the company solely or jointly owns
Outcomes Outcomes are the higher level objectives that a companyrsquos actions are intended to deliver A companyrsquos outcome should reflect its customersrsquo priorities identified through appropriate customer engagement and deliver the best long‐term sustainable solution for customers and the environment An outcome may not be bound by a single price control period and should be set in the context of customersrsquo and the environmentrsquos long‐term needs
205240txt012|May 2013
Drainage Strategy Framework
Price Review The process of setting appointed water and sewerage companiesrsquo price limits The next price review will take place in 2014 for the period 2015‐20 Ofwat currently sets price limits every five years
Real Time Control (RTC) Using actuated pumps gates and weirs to actively control flow in sewers Better use can be made of existing infrastructure and links can be made between network treatment and receiving water systems for operational benefits Sometimes referred to as Active Management
River Basin Management (Plans) River Basin Management is a continuous process of planning (to develop River Basin Management Plans) and delivery The Water Framework Directive introduces a formal series of 6 year cycles The first cycle will end in 2015 when following further planning and consultation the River Basin Management Plans will be updated and reissued
Sewerage Management Plan A risk based approach to indentifying investment needs in sewerage systems as described in the Sewerage Risk Management (SRM) approach developed by WRc plc
Storm water retrofit Releasing capacity in sewers by controlling stormwater at the surface using disconnection swales and other sustainable drainage systems (SuDS)
205240txt012|May 2013
We are the Environment Agency We protect and improve the environment and make it a better place for people and wildlife We operate at the place where environmental change has its greatest impact on peoplersquos lives We reduce the risks to people and properties from flooding make sure there is enough water for people and wildlife protect and improve air land and water quality and apply the environmental standards within which industry can operate Acting to reduce climate change and helping people and wildlife adapt to its consequences are at the heart of all that we do We cannot do this alone We work closely with a wide range of partners including government business local authorities other agencies civil society groups and the communities we serve
wwwenvironment‐agencygovuk
Environment Agency National Customer Contact Centre
Telephone 03708 506 506 enquiriesenvironment‐agencygovuk
Ofwat (The Water Services Regulation Authority) is a non‐ministerial government department We are responsible for making sure that the water and sewerage sectors in England and Wales provide consumers with a good quality and efficient service at a fair price
wwwofwatgovuk
Telephone 0121 644 7500 mailboxofwatgsigovuk
Halcrow Group Limited Burderop Park Swindon Wiltshire SN4 0QD
tel 01793 812479 fax 01793 812089 halcrowcom
Halcrow Group Limited is a CH2M HILL company Halcrow Group Limited has prepared this report in accordance with
the instructions of The Environment Agency for the clientrsquos sole and specific use Any other persons who use any information contained herein do so at their own risk

14
Drainage Strategy Framework
bull Local Development Plans (of planning authorities) bull Flood Risk Management Plans bull Local Flood Risk Management Strategies (of Lead Local Flood Authorities) and bull River Basin Management Plans (led by the Environment Agency)
A Drainage Strategy should be risk and evidence based and should lead to companies minimising whole life costs whilst still delivering outcomes for customers and the environment It should recognise that population growth new development urban creep climate change and changing customer behaviour all exert new pressures and demands on drainage systems
A Drainage Strategy is there to facilitate both long and short term planning While relatively few Strategies are likely to be complete in advance of 2015 we expect companies to adopt a risk based prioritisation approach to develop further Strategies in the coming years Once complete more detailed planning should be consistent with the long term Strategy both up to and beyond future price reviews (although it is recognised that competing priorities may affect the pace at which outcomes are delivered)
A Drainage Strategy is likely to contain a mixture of responding to current problems pro‐actively reducing risks for predicted problems improving operational responses and acting to improve data and reduce uncertainty An example structure for a Drainage Strategy is included in Section 13
Links with Established Drainage Planning Processes
The Drainage Strategy framework encompasses and supplements established planning processes and technical guidance which have been applied selectively and adapted by water and sewerage companies (and Lead Local Flood Authorities) in recent years when planning for drainage systems
These include
bull Common Framework for Capital Maintenance Planning6
bull Sewerage Management Plans (Sewerage Risk Management 5)7
bull Urban Pollution Management 38
bull Surface Water Management Plan technical guidance9
bull Local Government Association Framework to assist the development of the Local Strategy for Flood Risk Management10
bull Long Term Least Cost Planning for Wastewater Supply‐Demand (to be superseded in 2013)11
bull Water Cycle Study Guidance (2013 revision in print) 12
These CIWEM13 Urban Drainage Group (WaPUG) published technical guides are also in widespread use
6httpwwwukwirorgukwirlibrary80474 (poundpound‐ indicating that a charge is made to access this content) 7 httpsrmwrcplccouk (poundpound) 8 httpwwwfwrorgUPM3 9 httpwwwdefragovukpublications20110610pb13546‐surface‐water‐guidance 10httpwwwlocalgovukwebguestlocal‐flood‐risk‐management‐journal_content56101713618366ARTICLE‐TEMPLATE 11 httpukwirforefront‐librarycomreports07‐rg‐08‐291714 (poundpound) 12 httpwwwenvironment‐agencygovukresearchplanning33368aspx
205240txt012|May 2013
5
Drainage Strategy Framework
bull WaPUG code of practice for the hydraulic modelling of sewers (3rd edition) bull WaPUG guide to quality modelling of sewer systems bull WaPUG integrated drainage modelling guide
The sewerage risk management and surface water management methodologies in particular share a common phased approach to understanding drainage problems and developing cost effective solutions These phases are central to good practice in drainage planning and are central to the development of a Drainage Strategy
Generically these phases include
bull Initialisation Preparation phase where data are collated to understand current issues in the system and necessary partners are consulted with to agree success measures and objectives
bull Risk assessment phase where predictive tools are used to quantify current problems and predict how these problems will change in the future
bull Options appraisal phase where the costs and benefits of alternative remedies that meet agreed objectives are considered This informs the selection of a preferred solution or solutions
bull Implementation phase where drainage improvements are financed and delivered and the effectiveness of improvements monitored
The process is cyclical indicating that it is periodically revisited to confirm previous decisions address uncertainties and adapt to a changing environment Figure 2 and Figure 3 illustrate the Sewerage Risk Management and Surface Water Management Plan planning processes
Figure 2 Sewerage Risk Management Approach (Copyright WRc plc httpsrmwrcplccouk used with permission)
13 httpwwwciwemorgknowledge‐networksgroupsurban‐drainagepublicationsmodelling‐guidesaspx
205240txt012|May 2013
6
Drainage Strategy Framework
Figure 3 Surface Water Management Plan Approach
Ofwat has previously commissioned research14 on current practice in sewerage planning and drainage area plans concluding that traditional drainage area plans are no longer widely undertaken but that these activities are generally undertaken under different guises
14httpwwwofwatgovukfuturesustainabledrainagerpt_com20111208drainagepdf
205240txt012|May 2013
7
15
Drainage Strategy Framework
Statutory Obligations and Regulatory Drivers
151 Government
Drainage planning is undertaken within a context established by a variety of Government policies and instruments These are succinctly detailed in Defrarsquos October 2012 Statement of Obligations15
(for England) which is to be referenced by water and sewerage companies in the preparation of business plans for the 2015‐2020 price review period More specific guidance over priorities for 2015‐2020 is provided in Defrarsquos16 strategic policy statement for Ofwat A Water Strategy for Wales17 will be consulted on in 2013
The key legislative drivers and Government priorities relevant to drainage planning are summarised here
bull Section 94 of the Water Industry Act 199118 describes how every water and sewerage company is under a duty to lsquoprovide improve and extend hellip a system of public sewers hellip as to ensure that the area is and continues to be effectually drainedrsquo This is relevant to drainage planning because it explicitly indicates that the sewerage system should be improved to keep pace with growing pressures over the long term this requirement is assured if a long term Drainage Strategy is in place and implemented
bull The Urban Wastewater Treatment Directive19 provides a further requirement to provide sufficient capacity in wastewater collection systems
bull The Governments in England and Wales are committed to taking an ecosystems approach to environmental management which accounts for the environmental economic and social benefits that result from an improved water environment Water and sewerage companies are encouraged to invest in natural as well as built infrastructure to deliver their desired outcomes The Natural Choice 20 demonstrated how this type of investment can deliver a wide range of positive social environmental and economic outcomes Benefits can be determined using lsquopayments for ecosystem servicesrsquo 21 methods Water and sewerage companies are encouraged to consider these approaches where they can deliver cost beneficial outcomes for their customers This is relevant to drainage planning because it encourages the use of retrofit sustainable drainage systems in place of more traditional sewer upsizing and storage Ofwat has supported water and sewerage companies to investigate these approaches through pilot studies22 in the 2010 to 2015 price review period
bull Water and sewerage companies may work in partnership with other organisations to jointly invest in shared outcomes and to discuss with customers their willingness to pay for wider
15 httpwwwdefragovukpublications20121005pb13829‐statement‐obligations 16 httpwwwdefragovukpublications20130307pb13884‐sps‐seg‐ofwat 17httpwalesgovuktopicsenvironmentcountrysideepqwaterfloodingpublicationswater‐strategyjsessionid=235D11ADCC6EEC8EE88886DD69CE0784lang=en 18 httpwwwlegislationgovukukpga199156partIVchapterI 19 httparchivedefragovukenvironmentqualitywaterwaterqualitysewageuwwtdindexhtm 20 httpwwwdefragovukenvironmentnaturalwhitepaper 21 httpwwwdefragovukenvironmentnaturalecosystems‐services 22 httpwwwofwatgovukfuturesustainabledrainage
205240txt012|May 2013
8
Drainage Strategy Framework
benefits This is relevant to sewerage planning because it encourages water and sewerage companies to partner with local authorities to resolve complex storm water management problems (for flooding or pollution control) through the use of retrofit sustainable drainage systems The wider benefits to citizens outside of the water and sewerage companyrsquos customer base can be accounted for
bull The governments of England and Wales are promoting a catchment‐based approach23 to River Basin Management Planning to meet the water quality requirements of the Water Framework Directive (WFD)24 The important aspect of the approach is that all interested parties should work together to build consensus about the best way to improve water quality and habitats Water and sewerage companies should expect to be involved in the process of agreeing objectives and the apportionment of responsibility for delivering those objectives within the river basin districts they operate The central requirements of the Water Framework Directive are to prevent deterioration in water quality aim to achieve good chemical status and aim to achieve good ecological status It additionally seeks to limit the discharge of priority substances River Basin Management Plans will undergo consultation in the second half of 2014 and be published in December 2015 thereafter the programmes of measures included become statutory requirements and the Environment Agency (in England) and Natural Resources Wales will use permit and license conditions to ensure that water and sewerage companies deliver their agreed contributions This is relevant to drainage planning because misconnections blockages mechanical failure sewer flooding and combined sewer overflows (CSOs) can all contribute to the deterioration of water quality and the failure to achieve good ecological status or meet environmental quality standards for priority substances Climate change and growth may increase these risks but water and sewerage companies are not the only polluters and need to partner to ensure that outcomes are met Defra is consulting (closing February 2013) on developing its policies with respect to the control of diffuse urban pollution25
bull A revised Bathing Water Directive (20067EC)26 applies from 2015 and by then the Governmentrsquos aim is for all bathing waters to achieve at least lsquosufficient classrsquo this is approximately twice as stringent as requirements for the current Directive Subsequent planning should aim to achieve lsquogoodrsquo or lsquoexcellentrsquo classifications This is relevant to drainage planning because CSOs other wet weather intermittent discharges final effluent discharges and misconnections can all contribute to bathing water failures Climate change and growth may increase these risks but water and sewerage companies are not the only polluters and need to partner to ensure that outcomes are met
bull Under the Flood and Water Management Act (2010)27 water and sewerage companies (in England and Wales) must act in a manner consistent with the National Flood and Coastal Erosion Risk Management (NFCERM) Strategies28 for England and Wales and have regard to
23httpwwwdefragovukenvironmentqualitywaterlegislationcatchment‐approach 24httpwwwdefragovukenvironmentqualitywaterlegislationwater‐framework‐directive 25 httpwwwdefragovukconsult20121120water‐pollution 26 httpwwwenvironment‐agencygovukbusinessregulation107017aspx 27 httpwwwdefragovukenvironmentfloodinglegislation 28 httpwwwenvironment‐agencygovukresearchpolicy130073aspx
205240txt012|May 2013
9
16
Drainage Strategy Framework
Local Flood Risk Management Strategies29 NFCERM is based around six principles community amp partnership catchment based approach sustainability risk based planning beneficiary investment and delivering multiple benefits Companies should also co‐operate with local authorities and the Environment Agency in the exercise of their functions in relation to surface water management and combined sewers under section 94 of the Water Industry Act 1991 The Flood Risk Regulations 200930 implement the Floods Directive and give particular responsibilities to Lead Local Flood Authorities In lsquoFlood Risk Areasrsquo Lead Local Flood Authorities and the Environment Agency are expected to prepare Flood Risk Management Plans that set out flood risk management objectives and measures to manage risk from local flooding The Environment Agency is required to prepare Flood Risk Management Plans for the whole of England and Wales that cover flooding from main rivers the sea and reservoirs It is important for all risk management authorities to work in an effective way to plan to manage flood risk from all sources in a way that is well coordinated across catchments and coastal cells These duties are relevant to drainage planning because of the vital (but not unlimited) role surface water and combined sewers play in reducing flood risk in urban areas The Act also makes provision for the compulsory drainage of new developments through sustainable drainage systems (SuDS) and the lsquoright to connectrsquo being conditional on SuDS being approved by the SuDS Approval Body of the Lead Local Flood Authority
bull The Climate Change Act 200831 created a legal framework to cut greenhouse gas emissions and build the UKrsquos ability to adapt to a changing climate Water and sewerage companies are expected to reduce carbon emissions and adapt to the impact of climate change over the next decades The Government published its first UK climate change risk assessment in January 2012 and this will be updated every 5 years This is relevant to drainage planning because of the carbon embodied in new drainage infrastructure the carbon emitted during the pumping and treatment of sewage and the increase in flooding and pollution that will occur if climate change adaptations are not made The Government expects Ofwat to work towards the targets of its Adaptation Report and to ensure that its regulatory approach explicitly supports companies in adapting to climate change
bull From October 2011 the Water Industry (Schemes for Adoption of Private Sewers) Regulations 201132 transferred responsibility for existing private sewers and lateral drains to water and sewerage companies Pumping stations will be transferred by October 2016 This is relevant to drainage planning because of the significant increase in assets now within the responsibility of the water and sewerage company and the need to understand and respond to risks therein
Six Guiding Principles for a Drainage Strategy
This Drainage Strategy Framework describes good practice themed around six guiding principles Adherence to these principles will help ensure a Drainage Strategy which meets the expectations of Defra the Welsh Government the Environment Agency Natural Resources Wales and Ofwat and
29 The Local Government Association has published guidance on Local Flood Risk Management Strategies httpwwwlocalgovukcdocument_libraryget_fileuuid=a2538b94‐d3c1‐4cec‐81b0‐8aefd2996c5eampgroupId=10171 30 httpwwwenvironment‐agencygovukresearchplanning125459aspx 31 httpwwwdeccgovukencontentcmslegislationcc_act_08cc_act_08aspx 32 httpwwwlegislationgovukukdsi20119780111510933contents
205240txt012|May 2013
10
Drainage Strategy Framework
will be an essential means of communicating with customers and other partners Further details on each principle are described in Section 2 of this document along with examples of good practice
The six principles are
161 Partnership
Water and sewerage companies cannot develop optimal Drainage Strategies on their own and therefore partnership is key to developing and defining objectives performance indicators and the milestones that will need to be achieved in order to achieve measures that will demonstrate the delivery of outcomes Strategies should be developed and implemented in partnership with customers developers Lead Local Flood Authorities planning authorities the Environment Agency and Natural Resources Wales Strategies should align with (informing and informed by) River Basin Management Plans Local Flood Risk Management Strategies Flood Risk Management Plans and local plans (from planning authorities)
162 Uncertainty
Strategies should explain the reliability of data and knowledge about current and future performance of drainage systems They should explain what steps are planned to improve this understanding and how this will benefit customers Where future performance is uncertain (eg because of sensitivity to climate change) they should explain how adaptive approaches will be used to ensure outcomes are met The uncertainty in predictions of future risks should be recognised and accommodated within decision making
163 Risk based
Strategies should be risk based This means that planning operational and investment activities should be based on consideration of the probability and consequence of inadequate drainage function (risks) as these relate to the achievement of measures that demonstrate delivery of outcomes A risk based strategy ensures that investment is made where risks are the greatest
To aid communication risks should be visualised through maps and plans (Figure 10 is an example) To aid risk assessment risks should be monetised combined and predicted into the future To aid options appraisal the impact of interventions on the level of risk should be predicted
The approach to Drainage Strategy development should be risk based itself The degree of detail included should be related to an understanding of the overall level of risks in the catchment now and in the future
164 Whole life costs and benefits
Strategies should be informed by consideration of whole life costs and benefits They should promote a series of interventions which in view of the quantified uncertainties are most likely to result in performance indicators which demonstrate the achievement of outcomes at lowest cost to customers and the community more widely
Costs relate to capital and operational expenditure to deliver interventions and the monetised impacts of drainage failures such as flooding and pollution
Benefits relate to the reduction in risks from drainage failures such as flooding and pollution but should also include wider societal impacts such as those calculated using a lsquoPayments for Ecosystems Servicesrsquo approach
205240txt012|May 2013
11
17
Drainage Strategy Framework
When considering the lsquowhole lifersquo the strategy should consider climate population and asset deterioration trends These are likely to increase risks over the long term if no interventions are made The strategy should state lsquowhatrsquo should be done but also broadly lsquowhenrsquo and in what sequence interventions should happen
165 Live process
The Strategy should be adaptable and periodically reviewed Whilst outcomes are expected to be relatively stable over time the pace at which the strategy delivers outcomes will be linked to volatile influences (like climate and population change) and the decisions made at each price review about the priorities for the following period The strategy should be reviewed at regular intervals to reflect investments already made the changing priorities of the water and sewerage company and partners and the presence of emerging risks The review is also an opportunity to report drainage catchment performance relative to performance measures designed to monitor progress towards achieving outcomes
166 Innovative and sustainable
The framework promotes the full evaluation of alternatives to traditionally engineered sewerage solutions to test whether these offer lower whole life cost options or better responses to uncertainty It is anticipated that drainage solutions of the future will be different from the ones we are used to
These should include (at least at a high level) real time control or active management storm water retrofit techniques education to enable customers to change behaviour enhancing incentives for customers to reduce surface water flowing to sewers and innovative permitting arrangements across drainage networks and wastewater treatment works Water and sewerage companies should continue to review and develop other innovative solutions
For example where a company may historically have preferred to tackle sewer flooding or combined sewer overflow pollution by increasing its underground equipment to store more rainfall during storms it might consider other options in future such as working with customers to manage the rainfall close to source preventing it from entering the sewer system
Mapping the Framework to Current Planning Processes
We assume that practitioners will be following a broad and generic four‐stage planning process common to the Sewerage Risk Management (SRM5) and Surface Water Management Plan (SWMP) processes when preparing Drainage Strategies
Figure 4 is provided to guide water and sewerage companies in the development of Drainage Strategies It identifies each stage of the drainage planning process and highlights the good practice principles (colour coded by theme) in the locations through the process where it is most important that they are adopted
205240txt012|May 2013
12
e
u
t
v
b
DDrainage Strateegy Frameworrk
Initializepre
Establish partne and consultat
process
Define uncertai
Prepare risk d
Partnership
epare
rship ion
nties
ata
Ris
Co
Uncertainty
k assessmen
onsultation on risk issues
Quantify uncertainties
Quantify risks
Risk based
nt Options
Consult
Plan for
Demons life cost
Whole lif costs amp benefits
s appraisal
on options
uncertainties
strate whole and benefit
fe
s Live pro
Intervent
Aligned deliv collaborat solution
Innovative sustainab
Live and vis
cess Innova sustai
tion
ery amp ive s
and le
sible
ative amp nable
Figgure 4 Draina ge Strategy frramework prinnciples mappe d to the drainaage planning pprocess
118 WWho will bennefit from tthe Framewwork
Thhe Drainage Strategy Fraamework willl benefit
bull Water andd sewerage coompanies loooking to impprove their coompany speccific drainagge planning approach and make it fit for purpoose for the deelivery of lonng term outcoomes over mmultiple pricee review cyccles It will ppoint them toowards good practice andd provide exaamples as innspiration andd to promott ne innovation
bull Organisatiions and inddividuals lookking to enga ge with the ddevelopmen t of Drainagee Strategies and scruti nise progresss towards thhe achievemeent of outcommes associateed with enabbling growth adapting tto climate chhange managging floodingg and managging water poollution
22 DDrainagee Strateegy Frammeworkk Thhis section deescribes recoommended ggood practicee against eachh of the six kkey principle s necessary too develop a DDrainage Straategy For refference linkss are made too relevant annd establisheed planning prrocesses and emerging guuidance whicch drainage planners maay find usefuul These exammples are prrovided for innformation aand referenc e only
WWater and sewwerage comppanies shouldd work towaards developiing Drainagee Strategies wwhich apply thhese approachhes in a wayy that is consiistent with thheir needs annd those of thheir customeers and paartners Partnners should ttake note of tthis advice aand prepare tto engage wiith water andd sewerage coompanies on this basis
Thhe recommennded good ppractice is orgganised withhin each prinnciple as it wwould be appproached chhronologicallly in developping a Drainaage Strategy following thhe planning pprocesses alrready esstablished in the Seweragge Risk Manaagement anddor Surface WWater Managgement Plann mmethodologiess
2205240txt012|Mayy 2013
13
21
Drainage Strategy Framework
Principle One Partnership
Water and sewerage companies cannot develop optimal Drainage Strategies on their own and therefore partnership is key to developing and defining objectives performance indicators and the milestones that will need to be achieved in order to achieve measures that will demonstrate the delivery of outcomes Strategies should be developed and implemented in partnership with customers developers Lead Local Flood Authorities planning authorities the Environment Agency and Natural Resources Wales Strategies should align (informing and informed by) with River Basin Management Plans Local Flood Risk Management Strategies Flood Risk Management Plans and local plans (from planning authorities)
205240txt012|May 2013
14
Drainage Strategy Framework
211 Recommended good practice
No Good practice Example references
1 Engage with partners in a drainage catchment to bull Explain the purpose of developing a Drainage Strategy
and partnersrsquo roles in its success amp how each party will benefit from establishing a long term Drainage Strategy
bull Explain what outcomes are and how progress towards achieving them will be measured
bull Share data and information so that a shared understanding of risks and opportunities is developed
bull Explain what current drainage system performance is and how this is expected to change in the future Use risk visualisation tools to do this
bull Explain significant uncertainties and how these affect how interventions are delivered
Thames Water has demonstrated good practice through the development of its Counters Creek sewer flooding proposals This website describes the engagement process and how customers have been kept informed
2 Engage with the following partners in the development of the Drainage Strategy
bull Lead Local Flood Authority (the drainage area may include more than one) because of its responsibilities for local flood risk management and SuDS approval
bull Planning authority (the drainage area may include more than one) because of its role in determining the location and pace of housing development
bull Highways Authority because of the connection of highway runoff to public sewer systems
bull The Environment Agency (in England) because of its responsibilities for flood risk management (strategic overview) and ensuring good ecological quality is met in water bodies
bull Natural Resources Wales (in Wales) because of its responsibilities for flood risk management (strategic oversight) and ensuing good ecological quality is met in water bodies
bull Regional Flood and Coastal Committees who help develop a mutual understanding of flood and coastal erosion risks in an area
bull Bodies representing customers (eg Consumer Council for Water large local businesses flood action groups faith communities)
bull Bodies representing local environmental concerns (eg Wildlife Trusts Rivers Trusts)
bull Water only companies and water and sewerage company departments planning and operating water supply systems Water demand management practice can have an important impact on sewerage headroom
SWMP guidance (Chapter 2) advises on the establishment of partnerships for urban flood management and how to agree and align local objectives
3 Understand alignment of planning cycles and what this means locally (eg periodic review River Basin Management Plan Local Flood Risk Management Strategy Flood Risk Management Plan local plan)
205240txt012|May 2013
15
Drainage Strategy Framework
No Good practice Example references
4 Be alert to opportunities for joint solutions andor shared funding by understanding local plans for new development re‐development improving street furniture and public open space improving parks and green infrastructure Understand Lead Local Flood Authority and Environment Agency programmes for the management of flood and pollution risks
A guide to joint funding of local flood risk management intervention has been published by Defra33 and provides relevant advice to water and sewerage companies and other partners
5 Consider water and sewerage company funded solutions which deliver third‐party non‐sewerage assets that result in the long term least cost delivery of outcomes (eg water and sewerage company funding of household rain barrels and rain gardens to prevent surface water entering sewers)
6 Use data and mapping from the Environment Agency and Natural Resources Wales to understand exposure of drainage infrastructure to extreme events (eg coastal fluvial and surface water flood maps) so that network resilience can be understood and improved if this is cost beneficial
UKWIR has completed a project in 2013 lsquoResilience building a business case for PR14 and beyondrsquo
7 Work with LLFAs and the Environment Agency (or Natural Resources Wales) to understand the effectiveness of interventions at reducing risk and use this information to improve intervention planning
The UPM3 manual (section 7) advises on post project monitoring needs for water quality driven improvements
8 Share Drainage Strategies with partners and stakeholders so that there is transparency around challenges opportunities and the roles expected of different organisations
212 Good practice example ndash South West Water working with local authorities
These examples from South West Water illustrate how the company has worked with local authorities to coordinate investments and to share resources and skills in the development of integrated urban drainage management studies and Surface Water Management Plans
bull South West Water approached Devon County Council (DCC) to pool resources in delivering two (of five) pilot integrated urban drainage management studies (IUDMs) for Exeter and Exmouth South West Water took the lead role for Exmouth but DCC led in Exeter This engagement shared costs across organisations and has facilitated the production of full Surface Water Management Plans The collaboration has resulted in a shared understanding of the urban drainage challenges faced by both organisations and has opened dialogue around investment priorities
bull In Lyme Regis South West Water supported extensive coastal erosion defence works being carried out by West Dorset District Council by accelerating a programme of sewer rehabilitation and targeting renovation of sewers in vulnerable areas
bull In partnership with Cornwall County Council (CCC) and the Environment Agency South West Water has been working on a number of key drainage issues identified by CCC in its Preliminary Flood Risk Assessment (PFRA)
33 httprandddefragovukDefaultaspxMenu=MenuampModule=MoreampLocation=NoneampCompleted=0ampProjectID=17085
205240txt012|May 2013
16
Drainage Strategy Framework
bull In Camborne South West Water has taken the opportunity to invest in sewer separation works which align with the aims of the Camborne Pool Redruth urban regeneration group supported by Cornwall Council and to promote sustainable development economic growth and a strategic aim of lsquosewers for sewagersquo
213 Good practice example ndash Northumbrian Water partnership working in Tyneside
Northumbrian Water has led a sustainable sewerage study for Tyneside34 between 2010 and 2012 It is a good example of how partner organisations can collaborate to understand and resolve drainage issues in their urban area
Its approach was informed by the fact that a shared urban drainage problem around flooding and pollution was best addressed by a shared response from all the relevant organisations The project steering group involved representatives of Northumbrian Water the Consumer Council for Water the Environment Agency and five Lead Local Flood Authorities The urban drainage system collects wastewater for a single wastewater treatment works serving a population of over 900000
Working together the group studied the impact of growth urban creep and climate change on future urban drainage issues Figure 5 illustrates how a city‐wide map of potential problem areas was generated by the project team sharing data on sewer capacity (from Northumbrian Water) population change (from the local authorities) and river flooding (the Environment Agency) It was predicted that future problems were more likely to occur in the darker shaded areas These became focus areas for the project where a range of traditional and novel drainage solutions were tested
Figure 5 Future drainage problem areas indentified through data sharing
34httpcommunicatoremailcomINfNLOjNRayfOA1rfrfYcdK‐S7UwRcYcNoWebViewaspx
205240txt012|May 2013
17
22
Drainage Strategy Framework
The project team was keen to promote its work to customers and the community and prepared a series of newsletters updating interested parties on progress and issues An example is illustrated in Figure 6
C lic k here if y ou are hav in g d if f ic u lties v iew ing th is new s letter
Ho m e A b o u t u s M e d ia ce n tre C o n tact
Issue 2
Ap ril 2012
In th is ed ition U n d e rs tan d in g th e fu tu re
S u s tain ab le d ra ina g e o p tio ns
F ind ou t more about Th e 2 0 1 1 an n ua l re po rt
Ou r e n viro n m e n ta l p o licy
Ou r co rp o ra te re sp o nsib il i ty s tra te g y
W e lcom e to th e s e con d e ditio n o f S u sta inab le se we ra g e a s ix-m on th ly n e ws le tte r p ro d u ce d to b ring yo u th e la te s t n e ws on o u r m a jo r s tud ye xp lo rin g s us tain ab le s ew e ra ge o p tions in th e Tyn e s id e a rea I h o p e yo u fin d th e in fo rm a tio n o f in te res t a n d wo u ld w e lcom e fe e db a ck o n an y o f th e issu es ra ise d
Ric ha rd W a rne ford W a s te wa te r Dire c tor
U nderstand ing the fu tu re W e a ll kn o w th e difficu lties o f a ccu ra tely p re d ic tin g th e fu tu re h ow e ve r ifw e a re to p re pa re fo r i t th e n it is s om e thin g we m us t a tte m p t As p a rt o f th is s tu d y w e a re co ns id e rin g w ha t d em a nds w ill b e p la ce d on th e d ra ina g e s ys tem s a t 2 0 20 a n d a t 2 0 50 in co rpo ra ting g ro w th u rba n cre e p a nd c lim a te cha n ge B y w o rk in g close ly w ith o u r p a rtn e rs an d u s in g th e la tes t te ch n ical res e a rch we h a ve d e ve lo p ed a n d com p u te rm od e lle d a num b e r o f s ce na rios to id en tify a n d d e fin e fu tu re ris ks Th es e ris ks in c lud e p red ic tions o f p o te n tia l floo d in g p o llu tion o r b a rrie rs to g ro w th N o w th a t w e be tte r u n d e rs ta nd th e iss u es we a re a ble to p re pa re p la ns p rom o ting o p po rtu n ities fo r s us ta in a ble d rain ag e s ys tem s in o rde r to d e live r th e b es t p oss ible s e rvice fo r o u r cu s tom e rs b a la n ced a g ains te n viro nm e n tal n e eds a n d cos ts
S usta inab le d ra inage op tions W e b e lie ve o u r a pp ro a ch re p res en ts go o d p ra ctice fo r th e m a n ag em en t o f s u rfa ce wa te r w h ich is to d ea l w ith th e s u rfa ce wa te r as c los e to s ou rce as p oss ib le A w id e ra n g e o f p o te n tial o p po rtu n ities a re b ein g id e n tifie d in c lu d in g lo ca l a n d s tra te gic o p tions
S tra te g ic o p tions a re typ ica lly la rg e r th a n th e lo ca l on es a nd in c lu d e fe a tu res s u ch as a re as o f la nd w h ich w o uld b e a llo we d to flo o d d u rin g he a vy ra in (s a crific ial s to ra g e ) a n d p e rm a n en t w e tla nd fe a tu res
L o ca l op tio ns d esp ite b ein g sm a lle r th a n th e s tra te gic o n es w ill s til l p la y a ke y ro le in th e p ro vis io n o f s us tain ab le d ra ina g e Th e ir n a tu re m e a ns de p lo ym e n t co u ld be m o re w id es p re a d th a n s tra te gic o p tions fe a tu res su ch as w a te r b u tts ra in g a rde ns a nd p e rm e ab le pa vin g co u ld b e re la tive ly e a s y to fi t in to
Figure 6 Newsletter promoting urban drainage partnership working
Principle Two Uncertainty
Strategies should explain the reliability of data and knowledge about current and future performance of drainage systems They should explain what steps are planned to improve this understanding and how this will benefit customers Where future performance is uncertain (eg because of sensitivity to climate change) they should explain how adaptive approaches will be used to ensure outcomes are met The uncertainty in predictions of future risks should be recognised and accommodated within decision making
205240txt012|May 2013
18
Drainage Strategy Framework
221 Recommended good practice
No Good practice Example references
1 Data analysed and used in the development of the strategy related to asset location dimensions condition failure and flood and pollution incidents should be assigned a confidence grading The confidence grading should be related to its accuracy completeness compatibility credibility and currency
Models used to predict blockages and collapses flooding locations polluting discharges and water quality impacts should be assigned a confidence grading based on their accuracy completeness compatibility credibility and currency
Model predictions should be assigned a confidence grading depending on the confidence in the model and whether it is being applied outside of its verification range (eg for extreme events or for atypical geographies)
The purpose of confidence grading data and model results used in strategy setting is to understand the likelihood that outcomes will be achieved in a cost efficient manner Where the outcomes remain uncertain knowledge of data confidence can be used to target improvement programmes
SRM5 (S3‐03‐17) refers to Ofwatrsquos method for recording the reliability and accuracy of regulatory data in bands A to D
The SWMP guidance (Section 319) describes an alternative system of grading data and model results
2 Use the Drainage Strategy to justify data and model improvement programmes This should be focussed on areas where risks are currently (or predicted to be) high and uncertainty in data or models reduces the ability to determine robust operational or capital solutions Poor model verification in high risk areas would be an indicator that model improvements were required
CIWEMrsquos urban drainage group has published a series of guides on hydraulic and water quality modelling They discuss model calibration verification and uses
SRM5 (S3‐04) describes how to determine where the current assessment of risk is sufficient to proceed or whether data and models should be improved
3 Improve understanding of network performance (and improve models) by using long term flow and level monitoring on sewers and CSOs
Yorkshire Water discusses its CSO
monitoring programme here
4 Demonstrate how the uncertainty in both the underlying datamodels and in the future projections is addressed in options appraisal Consider if this should be done implicitly (eg through choosing conservative assumptions) or explicitly through the use of sensitivity analysis or scenario testing
Treasury Green Book supplementary guidance illustrates how to accommodate climate change uncertainties
205240txt012|May 2013
19
Drainage Strategy Framework
No Good practice Example references
5 Population growth new homes and businesses climate change and urban creep combine to make the future highly uncertain but will almost certainly increase flooding and pollution risks from drainage systems Use the Drainage Strategy to explore different scenarios (combining the impact of these drivers) for a near term (le 10 years) and future (ge 30 years) epoch
For example combine modest growth and slight climate change (a low impact case) and contrast with high growth and significant climate change (a high impact case) Where the location of significant new development is unknown include scenarios accommodating different possibilities
Running multiple scenarios is time consuming and costly A risk based approach should be adopted to focus efforts where flooding and pollution risks are especially sensitive to changes in demand
UKWIR has published research on accounting for climate change35 and urban creep36 in sewerage planning together with more general advice on accommodating climate change in water asset management planning37
Ofwat has published research38
predicting the combined impacts of climate change urban creep and development on a national basis
6 In the face of significant uncertainties about future demands on the drainage system and their consequences the Drainage Strategy should identify low‐regrets interventions (ie ones that are robust no matter what the future holds) and ensure that solutions can be adapted if greater certainty is achieved For example through quickening the pace of SuDS retrofit activities or using (previously identified and secured) land to extend underground storage facilities Strategies which remove surface water from sewerage networks provide lsquoheadroomrsquo for unpredictable increases in demand from population and climate change
Designing Resilient Cities A guide to good practice DR Lomardi et al HIS BRE Press
7 Post project appraisal and cost monitoring should be used to capture real costs and performance so that Strategies can be updated and improved with latest information It is especially important to collate and understand the whole life costs of new technologies where industry understanding is currently poor
35httpwwwukwirorgreports03‐cl‐10‐09042794658901799019890198 (poundpound) 36httpukwirforefront‐librarycomreports10‐wm‐07‐1493273 (poundpound) 37httpukwirforefront‐librarycomreports12‐cl‐01‐1694816900019015590145901409465890155 (poundpound) 38httpwwwofwatgovuksustainabilityclimatechangerpt_com201106mottmacsewerpdf
205240txt012|May 2013
20
Drainage Strategy Framework
222 Good practice example ndash Severn Trent Waterrsquos MICAS
Severn Trent Water has developed a process to measure confidence in hydraulic models of sewer systems Modelling Investment Confidence Assessment Scoring (MICAS) was developed to provide an objective evaluation of model confidence It uses information stored in the hydraulic model about the provenance of each data element and the quality of model verification Before the approach was developed the assessment of lsquofitness for purposersquo of models was subjective and based on modellers judgment This was not always reliable and certainly not repeatable and transparent MICAS provides an objective assessment of hydraulic model quality which can be used to inform its use and prioritise improvements to input data and model verification
Figure 7 and Figure 8 illustrate how an understanding of model confidence from the MICAS assessment (right hand side images) can be used to interpret predictions of flooding (left hand side images) In Figure 7 areas at predicted high risk of flooding (red in the left hand side image) are shown to be in high confidence areas of the hydraulic model (green in the right hand side image) In contrast in Figure 8 areas at predicted high risk of flooding (red in the left hand side image) are shown to be in poor confidence areas of the hydraulic models (orange in the right hand side image) In the latter case this information is used to identify where further model improvements would be beneficial
Flood Risk MICAS
Figure 7 Modelled flood risk and MICAS confidence scores (high model confidence)
Flood Risk MICAS
Figure 8 Modelled flood risk and MICAS confidence scores (lower model confidence)
205240txt012|May 2013
21
23
Drainage Strategy Framework
Principle Three Risk Based
Strategies should be risk based This means that planning operational and investment activities should be based on consideration of the probability and consequence of inadequate drainage function (risks) as these relate to the achievement of measures that demonstrate delivery of outcomes A risk based Strategy ensures that investment is made where risks are the greatest
To aid communication risks should be visualised through maps and plans (Figure 10 is an example) To aid risk assessment risks should be monetised combined and predicted into the future To aid options appraisal the impact of interventions on the level of risk should be predicted
The approach to Drainage Strategy development should be risk based itself The degree of detail included should be related to an understanding of the overall level of risks in the catchment now and in the future
231 Recommended good practice
No Good practice Example references
1 Determine where a Drainage Strategy is required by combining current performance with external influences likely to result in deteriorating performance This stage requires no modelling or detailed assessment On a catchment‐by‐catchment (drainage area) basis understand current risks by collating data on current performance eg blockages collapses pumping station failures pollution incidents CSO spills storm tank spills internal flooding incidents external flooding incidents and infiltration rates Relate these risks to performance indicators and the achievement of outcomes Combine with information about known growth rates predictions of urban creep quantity of newly adopted lsquoprivatersquo sewers surface water flooding risks (eg from flood map for surface water) WFD water body status and bathing water status Prioritise catchments with high current risks andor factors suggesting that risks are likely to worsen significantly in the future Consider normalising scoring method for size of catchment (eg by unit area or unit length of sewer) Consult with stakeholders to confirm correct prioritisation Commence with development of Drainage Strategies for the highest ranked catchments Periodically revisit prioritisation (updating with new data) to check that priorities are still correct
The initialisation stage of a Sewer Management Plan (SMP) (described in SRM5) considers how a risk assessment can be used to prioritise which spatial units (eg catchments) should be prioritised for a SMP study
2 Visualise catchment risks (from 1) to illustrate and explain to partners the reasons for prioritisation Accommodate their views amp consider changing prioritisation to aid wider drainage planning requirements (eg increase prioritisation of a catchment with significant surface water flooding problems where close collaboration between water and sewerage company and LLFA will benefit the community)
205240txt012|May 2013
22
Drainage Strategy Framework
No Good practice Example references
3 Clearly relate sewerage risks to the performance indicators that will be used to measure progress towards achieving outcomes eg relate blockage rates to flooding and pollution incidents eg relate increase in flows to increased CSO frequency breaches of permit conditions and deterioration in receiving water quality Adopt a sourcendashpathway‐receptor model and workshop techniques to ensure that cause effect and consequences are fully captured Use performance indicators as the basis for a comprehensive risk assessment that considers likelihood (frequency) and consequence (extent degree and duration of impact) of failure expressed as risk scores Monetise risks in GBP (pound) to align with principle four (whole life costs amp benefits) Use (verified) predictive models to understand near term (lt10 years) and long term (gt30 years) risks The latter to align with principle four (whole life costs amp benefits) Align complexity of method with level of risk recognising the needs of partners eg use complex 2D flood routing models to ascertain (with greater certainty) flood mechanisms and damages where the quantity and frequency of flooding is high and interventions will be complex and costly Elsewhere more simple approaches are appropriate eg use complex UPM3 water quality modelling methods where compliance with river standards or discharge consents is already failing or is expected to do so Elsewhere more simple approaches are appropriate Combine risk scores from different risks to describe the total level of risk in a catchment Use visualisation techniques to communicate combined level of risk Combine analysis from hydraulic blockage and asset deterioration models on a catchment basis In hydraulic analysis consider flooding performance for rainfall events beyond the usually provided standard of protection to understand performance in extreme events in support of partners (especially LLFAs) and in search of cost beneficial interventions at a higher standard than normal
SRM 5 (S3‐03) details approaches to simple and more complex approaches to risk assessment that are consistent with CMPCF guidelines
4 Be alert to interactions between sewer networks and wastewater treatment plans eg by modelling the impact of changing sewer flows on wastewater treatment worksrsquo performance and costs Consider combined impact of different catchments on a single or linked water body (eg an inland river bathing water or shell fishery)
UPM3 guidance discusses approaches to understanding these interactions and applying more complex water quality impact models
5 Establish systems and apply methods to predict how interventions can reduce risks eg how a targeted and pro‐active maintenance can reduce the occurrence of sewer blockage and flooding from lsquoother causesrsquo eg how reducing infiltration can reduce CSO spills eg how reducing connected impermeable area can reduce sewer flooding
205240txt012|May 2013
23
Drainage Strategy Framework
232 Good practice example ndash United Utilities risk assessment
United Utilities has demonstrated a robust risk based approach in the development of sewerage management plans used for long term planning across their area of operations
Hydraulic models were applied in 235 catchments and configured to look at future performance and to evaluate the consequences of inadequate capacity Starting from a baseline of 2010 versions of the models were built for 2020 and 2036 epochs The following model input parameters were adjusted population water consumption infiltration planned development known sewerage improvement projects urban creep rainfall (for climate change)
Two‐dimensional (2D) modelling was used to consider the consequences of sewer flooding resulting from the changes made to reflect the future operating environments As well as the impact on homes and business (from internal and external flooding) the flood risk to critical infrastructure was also considered The operation of CSOs was considered by computing the annual spill volume duration and frequency
Finally predictions of the likelihood and consequence of sewer failure were added taking account of sewer material age and the incident records relating to similar assets
All these data were combined and weighted to generate a Sewer Management Plan (SMP) Risk Score for each length of sewer The process is illustrated in Figure 9
Figure 9 United Utilitiesrsquo process for calculating risk score in sewerage catchments
205240txt012|May 2013
24
Drainage Strategy Framework
Risk scores were summed spatially and monetised so that high priority locations could be identified Mapping and visualisation were used to communicate the results of this assessment priority areas for further investigation and how risks change through time (Figure 10)
Figure 10 Visualisation of sewerage risks
233 Good practice example ndash Northumbrian Water risk assessment
Northumbrian Water completes an annual assessment of hydraulic capacity in its sewerage network at the drainage area scale Its approach does not require hydraulic models to have been completed and yet can reliably highlight areas of under‐capacity in need of further investigation through more detailed analysis including hydraulic modelling New and emerging risk areas can also be identified by applying data for population growth which occurs through development lsquoWhat ifrsquo scenarios can be run to test when capacity limits may be overcome and flood risks potentially set to increase It demonstrates good lsquorisk basedrsquo planning principles because it shows the drainage planner where more detailed analysis is warranted
The approach uses the following data from company records population connected to sewer P water consumption rate G (lhd) trade discharge E (ls) pipe diameter and gradient pipe connectivity CSO consent pass forward rate (ls) pumping station rate (ls) sewage treatment flow rate (ls) A wastewater dry weather capacity map calculates pipe full capacity dry weather flow (PG+E+I) and Formula A flow for fully combined (1360P+2E+DWF) and separate (4PG+3I+E) areas of the network Infiltration (I) is assumed to be 50 PG +E
205240txt012|May 2013
25
Drainage Strategy Framework
A theoretical assessment of network capacity is then calculated by comparing Formula A with pipe full capacity flow consent values at CSOs and wastewater treatment works and pumping rates This determines areas of the network with a capacity shortfall with a potential capacity shortfall and with no capacity shortfall
When run across the whole company area approximately 100 out of 500 drainage areas were found to be under capacity Over 60 of these areas had recorded sewer flooding incidents In over 300 drainage areas there was no forecast capacity shortfall Only 7 of these drainage areas had recorded sewer flooding incidents Overall the system proved to be very reliable at predicting drainage areas likely to have sewer flooding problems because of sewer under‐capacity
In under capacity drainage areas an intermediate (hydraulic model based) assessment is then carried out Figure 11 shows the results thematically mapped for an example drainage area Red areas are predicted to have a very high risk of sewer flooding Yellow and green areas are predicted to have a low risk of sewer flooding
Figure 11 Example of a drainage area capacity map
205240txt012|May 2013
26
24
Drainage Strategy Framework
Principle Four Whole Life Costs and Benefits
Strategies should be informed by consideration of whole life costs and benefits They should promote a series of interventions which in view of the quantified uncertainties are most likely to result in performance indicators which demonstrate the achievement of outcomes at lowest cost to customers and the community more widely
Costs relate to capital and operational expenditure to deliver interventions and the monetised impacts of drainage failures such as flooding and pollution
Benefits relate to the reduction in risks from drainage failures such as flooding and pollution but should also include wider societal impacts such as those calculated using a lsquoPayments for Ecosystems Servicesrsquo approach
When considering the lsquowhole lifersquo the strategy should consider climate population and asset deterioration trends These are likely to increase risks over the long term if no interventions are made The strategy should state lsquowhatrsquo should be done but also broadly lsquowhenrsquo and in what sequence interventions should happen
241 Recommended good practice
No Good practice Example references
1 Predict risks into the future for at least two epochs le10 years (to understand what the company needs to do now and how this fits with longer term outcomes) and ge30 years to understand long term needs in light of changing population and other pressures
Account for the following changes in demand
bull Growth ‐ new homes and businesses
bull Urban creep ndash uncontrolled addition of connected impermeable area
bull Climate change ndash affecting design events (flood predictions) time‐series (CSO and treated effluent quantities) river flows and temperatures
bull Infiltrationexfiltration ndash through deteriorating sewer condition
bull Dry weather flows ndash through changes in water consumption rates
2 Combining monetised risks (associated with sewerage failures) determine whole life costs for a lsquodo nothingrsquo scenario (ie no interventions)
Include costs associated with electricity consumption (in the network and at the wastewater treatment works) and CO2 emissions
UKWIR will publish in 2014 a revision to their Long Term Least Cost Planning for Wastewater Supply‐Demand
guidance This may provide tools and methods for expressing costs and benefits to support the development of a Drainage Strategy
205240txt012|May 2013
27
Drainage Strategy Framework
No Good practice Example references
3 Test intervention strategies which keep performance indicators on track to deliver outcomes by adding capacity (supply) reducing flows (demand) or altering operational regimes
Include the costs of interventions and the benefits of reduced risks to inform selection of the most cost beneficial strategy over the whole life
Have regard to the timing of interventions recognising that uncertainty may require low‐regrets (insensitive to uncertainty) solutions and that delaying major interventions may be more affordable and attractive in the short term Discounting should be used to compare the costs and benefits of interventions occurring at different times
Recognise that some interventions will be obligatory and defined (eg maintenance of a spill frequency standard at a CSO) whilst others will be more discretionary focused on achieving outcomes rather than specific outputs
SRM5 (Section 8) defines and contrasts cost benefit analysis cost effectiveness analysis whole life cost analysis and risk cost benefit analysis
HM Treasury Green Book39
sets out a framework for the appraisal of long term projects which can be applied to the development of a Drainage Strategy
4 Donrsquot at first be concerned with the distribution of costs and benefits between partners who may be sharing costs Identify the most cost beneficial solution first and then debate and agree an equitable sharing of costs
Give equal weighting to OPEX (operating expenditure) and CAPEX (capital expenditure) costs so not to cause bias towards capital intensive solutions Properly consider the costs and benefits of pro‐active maintenance regimes and campaigns to influence customers to reduce fats oils and greases (FOG) build‐ups and the misuse of sewers
Consider the affordability of solutions the impact on customersrsquo bills and the resources of other organisations to play their part
UKWIR research outputs40 in 2013 (SW01) will provide a framework for making a business case for separating storm water from combined sewers
5 Where interventions include the provision of green space public amenity and improved habitats then Payment for Ecosystem Services approaches should be used to identify further monetised benefits in the appraisal Customers should be consulted to help value these benefits
Supplementary Green Book41
guidance describes methods for accounting for environmental impacts including the ecosystems approach
39 httpwwwhm‐treasurygovukdata_greenbook_indexhtm 40 httpwwwukwirorgpublishorsystemcomponent_viewaspLogDocId=96116 41 httpwwwhm‐treasurygovukdaccounting_environmental_impactspdf
205240txt012|May 2013
28
Drainage Strategy Framework
242 Good practice example ndash Severn Trent Water making the case for surface water separation in Stoke-on-Trent
In this example42 Severn Trent Water compared alternative ways of addressing sewer flooding problems by looking at a range of costs and benefits not all of which were directly associated with its specific responsibilities as a water and sewerage company Whilst the example does not express a monetised value for all costs and benefits over the whole life it does illustrate the types of factors which could be included in an appraisal of this type scaled to address problems at a catchment level It also demonstrates how working collaboratively can help identify solutions which are cost‐beneficial for the community at large
In an area of Stoke served by a combined sewer system five properties were at risk from sewer flooding in cellars for events equal to and less frequent than the 1 in 10 year probability A conventional sewer pumping station based solution was presented as the standard option
However a nearby former hospital site was also undergoing re‐development which would result in reduced runoff to the combined sewer The new drainage regime in the redevelopment site was sufficient to remove the flood risk at the five properties (this was a do nothing strategy)
A third option completely separated the development site runoff from the combined sewer and also addressed local flood risk issues nearby The solution required a new storm sewer and a network of swales and other SuDS features connecting with an ordinary watercourse
Table 1 illustrates how costs and benefits were compared across the three alternative strategies Each provided the same benefit in terms of the number of homes (5) relieved from sewer flooding The novel SuDS and surface water management solution additionally gave local flood risk relief to 3 further properties The separationSuDS strategy came at a higher capital cost but delivered greater social cost benefits savings in annual operating costs and a bonus improvement water quality (because of reduced CSO spill volume) Severn Trent selected the separation SuDS solution because the higher capital costs were offset by other benefits
Table 1 Costs and benefits of drainage improvements in part of Stoke-on-Trent
Do nothing Standard option
SuDS
Sewer flooding benefits 5 5 5
Other flooding benefits 0 0 3
Change in runoff to combined sewer (m3year) 0 0 ‐40000
Estimated cost (pound) 0 168000 419000
42httpwwwciwemorgmedia695460Paper203_Creating20Sewer20Capacity_Presentation2 0by20Mike20Woodpdf
205240txt012|May 2013
29
Drainage Strategy Framework
Do nothing Standard option
SuDS
Social Cost Benefit (pound) 16000 5000 51000
Change in electricity costs (poundyear) 0 +75 ‐525
Programme impact (years to deliver solution) + 4 0 +4
CSO spill volume (m3 in 1year event) +298 0 ‐397
243 Good practice example ndash New York City comparison of grey and green infrastructure drainage strategies
This example is taken from New York in the United States of America Itrsquos an illustration of how whole life costs have been compared for alternative strategies to solve urban drainage issues on a mega‐city scale The key data are summarised in Table 2
Table 2 Comparing drainage strategies in New York
Grey Strategy
Green Strategy
CSO spill volume reduction (billion gallons year)
101 122
Wider benefits over 20 years ($ million) 0 139 to 418
Whole life costs over 20 years ($ billion) 68 53
The information is taken from the New York City Green Infrastructure Plan43 produced by the Mayorrsquos Office in 2010 The Plan (and recent updates) provides a comprehensive evidence base around costs and benefits of different approaches to address the cityrsquos drainage problems It is therefore an excellent example of how drainage strategies can be described in plain language for a non‐specialist audience concerned with their environment and the cost of providing infrastructure to enhance it
It is becoming commonplace for North American cities (eg Portland and Philadelphia) to address the issue of frequent combined sewer overflow (CSO) operation by using a combination of grey infrastructure (sewers) and green infrastructure (sustainable drainage systems) The wider health
43 httpwwwnycgovhtmldephtmlstormwaternyc_green_infrastructure_planshtml
205240txt012|May 2013
30
25
Drainage Strategy Framework
and ecological benefits of green infrastructure approaches and the reduced reliance on materials and energy are attractive to utility planners and cities alike
New York has 422 CSOs and an agreed Long Term Control Strategy to significantly reduce the impact wet weather discharges have on aquatic systems throughout the city Annual discharges are currently (2010) estimated to be 30 billion gallons (114 million cubic meters) per year Building on existing and committed new sewer plans an agreed grey infrastructure based strategy to this problem is set to reduce these discharges to 198 billion gallons per year (a 34 reduction) by the 2030s An alternative green infrastructure approach based around intercepting the first inch (25mm) of rainfall across 10 of the impermeable city area by 2030 is predicted to reduce CSO spills to 179 billion gallons per year
Planners have calculated that the whole life costs after 20 years of the grey infrastructure solution will be $68 billion (2010 prices) compared to the green infrastructure whole life costs of $53 billion The green infrastructure strategy reduces CSO spills by more than the grey alternative for $15 billion less in terms of whole life cost Further planners have calculated that New Yorkers will benefit by up to $41844 million (accumulated over 20 years) in additional benefits associated with lower energy bills from control of urban heating increased property values and improved health
Based on this analysis New York City has committed itself to an aggressive green infrastructure based runoff control strategy to provide long term reductions in CSO spills The plan is to achieve interception of 15 of impermeable area by 2015 4 by 2020 7 by 2025 and 10 by 2030
Principle Five Live Process
The Strategy should be adaptable and periodically reviewed Whilst outcomes are expected to be relatively stable over time the pace at which the Strategy delivers outcomes will be linked to volatile influences (like climate and population change) and to the decisions made at each price review about the priorities for the following period The Strategy should be reviewed at regular intervals to reflect investments already made the changing priorities of the water and sewerage company and partners and the presence of emerging risks The review is also an opportunity to report drainage catchment performance relative to performance measures designed to monitor progress towards achieving outcomes
44 Estimated using methods from the New York Municipal Forest Resource Analysis (MFRA) prepared by the US Dept of Agriculture
205240txt012|May 2013
31
Drainage Strategy Framework
251 Recommended good practice
No Good practice Example references
1 Regularly repeat screening exercise to determine catchments requiring a Drainage Strategy and modify programme of Strategy development accordingly
Check for changes in measured rates of flooding and pollution incidents blockages collapses pumping station failures etc
Check for changes in extent and location of new development
Check for activities being undertaken by partners (eg redevelopment urban realm improvements and flooding and pollution management activities)
SRM5 illustrates how improved and updated knowledge of system performance should be applied to establish Strategies
2 In lsquolive Strategiesrsquo repeat risk assessment when data and models improve and adjust confidence scores accordingly
Confirm that Strategy will still achieve performance indicators and outcomes at least cost Revise Strategy as necessary
3 Periodically refresh Strategy accommodating impact of interventions already delivered using re‐verified predictive tools as appropriate
Confirm that Strategy will still achieve performance indicators and outcomes at least cost Revise Strategy as necessary
Triggers for a wholesale review of the Strategy are likely to be significant changes to the location or extent of planned development
4 Monitor report and share (with partners) the measures used to demonstrate delivery of outcomes Example measures may include the number of properties which experience sewer flooding the number of properties at risk of flooding the number of properties at risk from sewerage asset failure risk indices that capture both the probability and consequence of failure customer satisfaction with regards to clean rivers and beaches the number of pollution incidents the frequency of combined sewer overflow operation and compliance with discharge permit conditions
252 Good practice example ndash Thames Water live DAP
Thames Water has initiated a DAP (drainage area plan) Live approach Itrsquos a good example of how companies are continuously monitoring and updating the status of drainage area risks It provides a lsquoliversquo snapshot of the current health of all drainage areas in Thames Waterrsquos region allowing real time planning as part of a strategic approach It enables drainage planners to view the effectiveness
205240txt012|May 2013
32
Drainage Strategy Framework
of intervention strategies and compare incident rates across varying geographies and development types in the Thames Valley
DAP Live will be available for all catchments in the Thames Water area thus enabling
bull high level monitoring of risks across the business bull a live and strategic review of catchment performance bull prioritisation of catchments based on risk and bull an ability to share data with partners collaborating in drainage planning and improvements
Figure 12 illustrates the types of data managed through the DAP Live system These include asset data political and drainage boundaries environmental data operational data property amp growth data and modelling data As new data become available the DAP Live system is updated so that drainage planners have the most current view on emerging risks and issues
Asset data
Operational data
Property and growth data
Modelling data
Environmental data
Boundaries (SDACs operational political)
Figure 12 Data types held in the DAP Live system
Figure 13 illustrates how the system can provide analysis at a variety of scales from local authority boundaries sewage treatment works catchments drainage areas or a regular grid
205240txt012|May 2013
33
Drainage Strategy Framework
NE PROVINCES
WESTERN PROVINCES
NE LONDON bull Ops areas local W LONDON
SE LONDON authorities Large TIDWORTH SE PROVINCES
bull STW Catchments
bull Drainage areas(SDACs)
bull Regular grid Small
Figure 13 DAP Live reporting performance at different scales
205240txt012|May 2013
34
Drainage Strategy Framework
253 Good practice example ndash Wessex Water Water live data
Wessex Water is regularly using data geospatially to proactively identify and respond to risk Theirs is a good example of how data can be used to provide an adaptable approach that is regularly reviewed to plan investment
The risk‐based and live approach uses a set of likelihood and consequence models which are built up from all currently available data asset data (eg CCTV data material age) operational data (eg flooding and pollutions incidents) and information (eg locality near hospital or downstream of an overflow) All these data are collated for the entire Wessex region updated regularly and analysed geospatially
Figure 14 Sewer risk scores presented in a risk matrix and geospatially
This allows a risk score (Figure 14) to be calculated for each mapped sewer length which directs investigation more efficiently by allocating each mapped sewer a planned CCTV inspection date
This risk‐based approach has been successful in targeting problematic sewers increasing identification rates threefold Density analysis is performed using asset failure and operational information which allows planning of both proactive structural and operational investment
Proactively found structural issues are far more cost effective to repair before failure and can also prevent serviceability issues
205240txt012|May 2013
35
f
DDrainage Strateegy Frameworrk
Figgure 15 Hotsppot analysis
Thhe hotspot annalysis (Figuure 15) showss where operrational clustters have beeen calculatedd This hootspot analyssis is made aavailable on tthe Wessex WWater corporrate GIS to a llow operati onal staff to target their effforts to mitiggate against ffurther repeaat incidents AAdditional innformation ffrom asset annd operationnal activities ccan be addedd regularly too the databasses which drrive the mod els enabling rissk scores to bbe kept as livve as require d
226 Prrinciple Sixx Innovativve and Susstainable SSolutions
Thhe Drainage Strategy Fraamework proomotes the fuull evaluationn of alternatiives to tradit ionally enngineered sewwerage soluttions to test wwhether thesse offer loweer whole life ccost options or better reesponses to uuncertainty It is anticipaated that draainage solutioons of the futture will be ddifferent froom the ones we are usedd to
Thhese should iinclude (at leeast at a highh level) real ttime control storm waterr retrofit techhniques edducation to eenable custommers to changge behaviou r enhancingg incentives for customerss to reduce suurface water flowing to seewers and innnovative pe rmitting arraangements a cross drainagge networks annd sewage tr eatment worrks Water annd sewerage companies sshould continnue to revieww and deevelop other innovative ssolutions
Foor example wwhere a commpany may hiistorically haave preferredd to tackle seewer floodingg or coombined sewwer overflow pollution byy increasing iits undergrouund equipmment to store mmore rainfalll duuring stormss it might connsider other options in fuuture ndash such as working wwith custommers to mmanage the raainfall close tt eventing it foorm enteringg the sewer syystem o source pre
2205240txt012|Mayy 2013
36
Drainage Strategy Framework
261 Recommended good practice
No Good practice Example references
1 Use cost‐benefit methods to demonstrate that innovative and sustainable solution types provide best value for customers and the wider community
UKWIR will publish new research and guidance in 2013 addressing active control and storm water removal demonstrating how these technologies can be justified and included within Drainage Strategies
2 Consider integrated water resource management Work with partners (especially developers and local authorities) to examine whether use of stored stormwater reduces potable water consumption AND need for capacity in sewers
CIRIA has published a scoping study for water sensitive urban design45 in the UK
3 Consider a mix of conventional and new technologies using more adaptive approaches as low‐regrets responses to uncertainty eg prevent current sewer flooding with underground tank storage but address future risks (worsened by climate change) with retrofit SuDS implemented progressively
CIRIA has published lsquoRetrofitting to manage surface waterrsquo46 a comprehensive guide to planning and delivering this type of project
4 Use carbon accounting methods to compare embodied and emitted carbon in alternative intervention strategies so that these impacts are accounted for in whole life costs
Consider the benefits of surface water removal on the costs (including carbon) of pumping and sewage treatment
UKWIR47 has and continues to publish detailed guidance on carbon accounting for water and sewerage company use
45httpwwwciriaorgserviceresearch_informationAMContentManagerNet ContentDisplayaspxSection=research_informationampContentID=23581 46httpwwwciriaorgSERVICEHomecoreordersproductaspxcatid=5ampprodid=1909 47httpukwirforefront‐librarycomreports08‐cl‐01‐6923419000190269902659465890269
205240txt012|May 2013
37
Drainage Strategy Framework
No Good practice Example references
5 Where interventions include the provision of green space public amenity and improved habitats then Payment for Ecosystem Services approaches can be used to claim further monetised benefits in the appraisal Customers should be consulted to help value these benefits
The Environment Agency will publish data in 2013 on costs and benefits of retrofit stormwater projects to promote understanding and uptake
6 Share data within the industry on innovative solutions to increase knowledge of new technology and SuDs approaches
EA retrofitting SuDs costs and benefits database48
accommodating data from Ofwat AMP5 SuDS pilot initiative and other examples
262 Good practice example ndash Welsh Water surface water reduction and removal strategy for Gowerton and Llanelli
Dŵr Cymru Welsh Water and partners are applying innovative storm water removal methods to address capacity problems in the sewer network in Gowerton and Llanelli49 (population 140000) Current under capacity leads to localised sewer flooding and excessive combined sewer overflow (CSO) spill to the Burry Inlet a protected shellfish water and special area of conservation The capacity problems in the system were a concern for the Environment Agency (Wales) and there was a risk of widespread restrictions to economic development being imposed Dŵr Cymru Welsh Water Carmarthenshire County Council City and County of Swansea Consumer Council for Water Environment Agency Wales and the Welsh Government all worked in partnership to resolve the situation
A brand new hydraulic model was built for the entire sewerage network with particular attention paid to accurately representing the sources of storm run‐off and infiltration The model was verified against data from flow monitors and observed CSO spill frequencies into the Burry Inlet
To begin with a traditional sewer storage solution was proposed that would result in an average 10 spills a year into the shellfish water from all 90 CSOs in the two catchments Although this reduced spills and dealt with some of the flooding and growth issues the storage requirements would have been unaffordable provide no protection against long term climate change and would not tackle the fundamental problem of too much surface water getting into the combined network
An alternative approach based on the reduction and removal of storm water from the combined sewer system was also developed This was in accordance with Dŵr Cymru Welsh Waterrsquos Rainscape50 (surface water elimination and reduction) strategy To identify areas with the most
48httpevidenceenvironment‐agencygovukfcermenDefaultHomeAndLeisureFloodsWhatWereDoingIntoTheFutureScience ProgrammeResearchAndDevelopmentFCRMProjectaspxProjectID=15515be8‐bbed‐4204‐ae56‐3e810ba47694ampPageID=56bad68e‐dcb1‐4bf8‐84cc‐cbfd03ab63a2 49 httpwwwciwemorgmedia674511Paper20820Stephen20Ollierpdf 50httpwwwdwrcymrucom_libraryleaflets_publications_english
205240txt012|May 2013
38
Drainage Strategy Framework
potential for effective storm water removal a flowareaflooding thematic map was developed This was used to focus attention on areas which would deliver the most benefit if storm water removal was carried out These areas are coloured red in Figure 16
Figure 16 Thematic map showing areas of maximum potential for storm water removal
The following interventions (181 in total) were combined into single strategy to be delivered in phases by 2015 2020 and afterwards
bull The management of surface water through swales basins and soakaways rather than through combined sewers resulting in new amenity and ecological areas within the built‐up environment
bull Implementing smarter flow control to better use existing storage and conveyance assets bull Relining of sewers to prevent groundwater ingress bull Removal of land drainage connections to sewers bull Household rainwater harvesting retrofit schemes
surface_water_management_strategypdf
205240txt012|May 2013
39
Drainage Strategy Framework
Figure 17 is an artistrsquos impression of what one of the sustainable urban drainage system solutions may look like
Figure 17 Example retrofit SuDS solution proposed for Gowerton and Llanelli
Modelling has demonstrated that the alternative strategy will achieve the same CSO reduction benefit as the storage strategy together with flooding improvements and additional less tangible benefits at significantly lower cost than the traditional sewer storage solution
Figure 18 illustrates the dispersed nature of solutions identified for central Llanelli
Figure 18 Water sensitive urban design interventions planned for central Llanelli
205240txt012|May 2013
40
Drainage Strategy Framework
Appendix A
Glossary
205240txt012|May 2013
Drainage Strategy Framework
Appendix A Glossary
CAPEX Capital expenditure Appointed water and sewerage companiesrsquo spending on new replacement or refurbished capital assets such as construction or buying machinery
CIWEM Urban Drainage Group (WaPUG) A group of the Chartered Institution of Water and Environmental Management supporting professionals working in urban drainage
Combined Sewer Overflow (CSO) The discharge of untreated sewage diluted with storm water into rivers and the sea CSOs occur during heavy rain and are necessary to reduce the risk of sewer flooding The physical overflow structure is also called a CSO
Common Framework for Capital A planning approach developed for the water and Maintenance Planning sewerage companies in 2002 which provides a robust basis
for assessing future capital maintenance needs The approach is consistent with the needs of Ofwat
Defra The Department for Environment Food and Rural Affairs The Government Department with responsibility for water flooding and water quality in England
Drainage Area Plan (DAP) A detailed plan for a drainage catchment that prioritises a list of interventions based on risk using an approach established in the WRc Sewerage Rehabilitation Manual This approach has been succeeded by Sewerage Risk Management which guides the preparation of Sewerage Management Plans (SMP) Companies vary in how they prepare DAPs or SMPs (or their equivalents) following the general principles that have been established
Drainage Strategy Developed by water and sewerage companies to demonstrate how outcomes will be delivered in drainage catchments over the long term Drainage Strategies will use the information developed in producing a DAPSMP and if a drainage strategy has been produced this should be the starting point in producing a more detailed DAPSMP should this be required It is likely that the activities required to prepare DAPSMP and Drainage Strategies may overlap Drainage Strategies might not refer to specific interventions but instead outline a general approach
Drainage Strategy Framework Guidance to describe the contents and intention of Drainage Strategies
205240txt012|May 2013
Drainage Strategy Framework
Flood Risk Management Plans Required by the Flood Risk Regulations in Flood Risk Areas by December 2015
Flood Risk Regulations The legislative instrument used to implement the requirements of the Floods Directive in England and Wales
Floods Directive DIRECTIVE 200760EC of the European Parliament and of the Council of 23 October 2007 on the assessment and management of flood risks
Lead Local Flood Authority (LLFA) The Shire County or unitary authority with responsibility for managing local flood risk
Local development plans Developed by planning authorities to explain where and what type of development (new homes and businesses) will occur within their area They are required to explain water infrastructure needs to support this development
Local Flood Risk Management Strategy Developed by the Lead Local Flood Authority to explain (LFRMS) how local flood risk will be managed by the Authority and
in partnership with others
Natural Resources Wales From 1 April 2013 Natural Resources Wales (NRW) a new body formed by the Welsh Government will take over the functions previously carried out by the Environment Agency (EA) in Wales alongside those of the Forestry Commission Wales and the Countryside Council for Wales
Ofwat The Water Services Regulation Authority ndash the economic regulator of the water and sewerage companies of England and Wales
OPEX Operating expenditure Appointed water and sewerage companiesrsquo day‐to‐day spending on running the services for example staff costs and power This is likely to include investment in joint projects that do not create or relate to an asset that the company solely or jointly owns
Outcomes Outcomes are the higher level objectives that a companyrsquos actions are intended to deliver A companyrsquos outcome should reflect its customersrsquo priorities identified through appropriate customer engagement and deliver the best long‐term sustainable solution for customers and the environment An outcome may not be bound by a single price control period and should be set in the context of customersrsquo and the environmentrsquos long‐term needs
205240txt012|May 2013
Drainage Strategy Framework
Price Review The process of setting appointed water and sewerage companiesrsquo price limits The next price review will take place in 2014 for the period 2015‐20 Ofwat currently sets price limits every five years
Real Time Control (RTC) Using actuated pumps gates and weirs to actively control flow in sewers Better use can be made of existing infrastructure and links can be made between network treatment and receiving water systems for operational benefits Sometimes referred to as Active Management
River Basin Management (Plans) River Basin Management is a continuous process of planning (to develop River Basin Management Plans) and delivery The Water Framework Directive introduces a formal series of 6 year cycles The first cycle will end in 2015 when following further planning and consultation the River Basin Management Plans will be updated and reissued
Sewerage Management Plan A risk based approach to indentifying investment needs in sewerage systems as described in the Sewerage Risk Management (SRM) approach developed by WRc plc
Storm water retrofit Releasing capacity in sewers by controlling stormwater at the surface using disconnection swales and other sustainable drainage systems (SuDS)
205240txt012|May 2013
We are the Environment Agency We protect and improve the environment and make it a better place for people and wildlife We operate at the place where environmental change has its greatest impact on peoplersquos lives We reduce the risks to people and properties from flooding make sure there is enough water for people and wildlife protect and improve air land and water quality and apply the environmental standards within which industry can operate Acting to reduce climate change and helping people and wildlife adapt to its consequences are at the heart of all that we do We cannot do this alone We work closely with a wide range of partners including government business local authorities other agencies civil society groups and the communities we serve
wwwenvironment‐agencygovuk
Environment Agency National Customer Contact Centre
Telephone 03708 506 506 enquiriesenvironment‐agencygovuk
Ofwat (The Water Services Regulation Authority) is a non‐ministerial government department We are responsible for making sure that the water and sewerage sectors in England and Wales provide consumers with a good quality and efficient service at a fair price
wwwofwatgovuk
Telephone 0121 644 7500 mailboxofwatgsigovuk
Halcrow Group Limited Burderop Park Swindon Wiltshire SN4 0QD
tel 01793 812479 fax 01793 812089 halcrowcom
Halcrow Group Limited is a CH2M HILL company Halcrow Group Limited has prepared this report in accordance with
the instructions of The Environment Agency for the clientrsquos sole and specific use Any other persons who use any information contained herein do so at their own risk
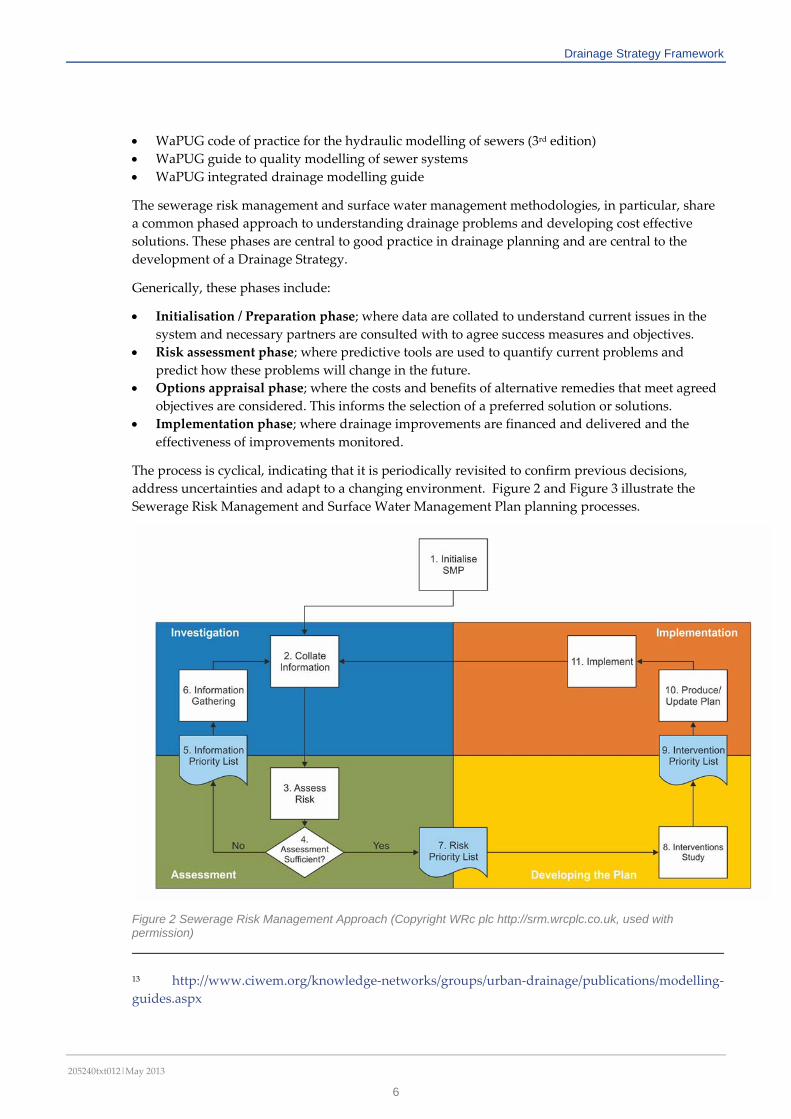
Drainage Strategy Framework
Figure 3 Surface Water Management Plan Approach
Ofwat has previously commissioned research14 on current practice in sewerage planning and drainage area plans concluding that traditional drainage area plans are no longer widely undertaken but that these activities are generally undertaken under different guises
14httpwwwofwatgovukfuturesustainabledrainagerpt_com20111208drainagepdf
205240txt012|May 2013
7
15
Drainage Strategy Framework
Statutory Obligations and Regulatory Drivers
151 Government
Drainage planning is undertaken within a context established by a variety of Government policies and instruments These are succinctly detailed in Defrarsquos October 2012 Statement of Obligations15
(for England) which is to be referenced by water and sewerage companies in the preparation of business plans for the 2015‐2020 price review period More specific guidance over priorities for 2015‐2020 is provided in Defrarsquos16 strategic policy statement for Ofwat A Water Strategy for Wales17 will be consulted on in 2013
The key legislative drivers and Government priorities relevant to drainage planning are summarised here
bull Section 94 of the Water Industry Act 199118 describes how every water and sewerage company is under a duty to lsquoprovide improve and extend hellip a system of public sewers hellip as to ensure that the area is and continues to be effectually drainedrsquo This is relevant to drainage planning because it explicitly indicates that the sewerage system should be improved to keep pace with growing pressures over the long term this requirement is assured if a long term Drainage Strategy is in place and implemented
bull The Urban Wastewater Treatment Directive19 provides a further requirement to provide sufficient capacity in wastewater collection systems
bull The Governments in England and Wales are committed to taking an ecosystems approach to environmental management which accounts for the environmental economic and social benefits that result from an improved water environment Water and sewerage companies are encouraged to invest in natural as well as built infrastructure to deliver their desired outcomes The Natural Choice 20 demonstrated how this type of investment can deliver a wide range of positive social environmental and economic outcomes Benefits can be determined using lsquopayments for ecosystem servicesrsquo 21 methods Water and sewerage companies are encouraged to consider these approaches where they can deliver cost beneficial outcomes for their customers This is relevant to drainage planning because it encourages the use of retrofit sustainable drainage systems in place of more traditional sewer upsizing and storage Ofwat has supported water and sewerage companies to investigate these approaches through pilot studies22 in the 2010 to 2015 price review period
bull Water and sewerage companies may work in partnership with other organisations to jointly invest in shared outcomes and to discuss with customers their willingness to pay for wider
15 httpwwwdefragovukpublications20121005pb13829‐statement‐obligations 16 httpwwwdefragovukpublications20130307pb13884‐sps‐seg‐ofwat 17httpwalesgovuktopicsenvironmentcountrysideepqwaterfloodingpublicationswater‐strategyjsessionid=235D11ADCC6EEC8EE88886DD69CE0784lang=en 18 httpwwwlegislationgovukukpga199156partIVchapterI 19 httparchivedefragovukenvironmentqualitywaterwaterqualitysewageuwwtdindexhtm 20 httpwwwdefragovukenvironmentnaturalwhitepaper 21 httpwwwdefragovukenvironmentnaturalecosystems‐services 22 httpwwwofwatgovukfuturesustainabledrainage
205240txt012|May 2013
8
Drainage Strategy Framework
benefits This is relevant to sewerage planning because it encourages water and sewerage companies to partner with local authorities to resolve complex storm water management problems (for flooding or pollution control) through the use of retrofit sustainable drainage systems The wider benefits to citizens outside of the water and sewerage companyrsquos customer base can be accounted for
bull The governments of England and Wales are promoting a catchment‐based approach23 to River Basin Management Planning to meet the water quality requirements of the Water Framework Directive (WFD)24 The important aspect of the approach is that all interested parties should work together to build consensus about the best way to improve water quality and habitats Water and sewerage companies should expect to be involved in the process of agreeing objectives and the apportionment of responsibility for delivering those objectives within the river basin districts they operate The central requirements of the Water Framework Directive are to prevent deterioration in water quality aim to achieve good chemical status and aim to achieve good ecological status It additionally seeks to limit the discharge of priority substances River Basin Management Plans will undergo consultation in the second half of 2014 and be published in December 2015 thereafter the programmes of measures included become statutory requirements and the Environment Agency (in England) and Natural Resources Wales will use permit and license conditions to ensure that water and sewerage companies deliver their agreed contributions This is relevant to drainage planning because misconnections blockages mechanical failure sewer flooding and combined sewer overflows (CSOs) can all contribute to the deterioration of water quality and the failure to achieve good ecological status or meet environmental quality standards for priority substances Climate change and growth may increase these risks but water and sewerage companies are not the only polluters and need to partner to ensure that outcomes are met Defra is consulting (closing February 2013) on developing its policies with respect to the control of diffuse urban pollution25
bull A revised Bathing Water Directive (20067EC)26 applies from 2015 and by then the Governmentrsquos aim is for all bathing waters to achieve at least lsquosufficient classrsquo this is approximately twice as stringent as requirements for the current Directive Subsequent planning should aim to achieve lsquogoodrsquo or lsquoexcellentrsquo classifications This is relevant to drainage planning because CSOs other wet weather intermittent discharges final effluent discharges and misconnections can all contribute to bathing water failures Climate change and growth may increase these risks but water and sewerage companies are not the only polluters and need to partner to ensure that outcomes are met
bull Under the Flood and Water Management Act (2010)27 water and sewerage companies (in England and Wales) must act in a manner consistent with the National Flood and Coastal Erosion Risk Management (NFCERM) Strategies28 for England and Wales and have regard to
23httpwwwdefragovukenvironmentqualitywaterlegislationcatchment‐approach 24httpwwwdefragovukenvironmentqualitywaterlegislationwater‐framework‐directive 25 httpwwwdefragovukconsult20121120water‐pollution 26 httpwwwenvironment‐agencygovukbusinessregulation107017aspx 27 httpwwwdefragovukenvironmentfloodinglegislation 28 httpwwwenvironment‐agencygovukresearchpolicy130073aspx
205240txt012|May 2013
9
16
Drainage Strategy Framework
Local Flood Risk Management Strategies29 NFCERM is based around six principles community amp partnership catchment based approach sustainability risk based planning beneficiary investment and delivering multiple benefits Companies should also co‐operate with local authorities and the Environment Agency in the exercise of their functions in relation to surface water management and combined sewers under section 94 of the Water Industry Act 1991 The Flood Risk Regulations 200930 implement the Floods Directive and give particular responsibilities to Lead Local Flood Authorities In lsquoFlood Risk Areasrsquo Lead Local Flood Authorities and the Environment Agency are expected to prepare Flood Risk Management Plans that set out flood risk management objectives and measures to manage risk from local flooding The Environment Agency is required to prepare Flood Risk Management Plans for the whole of England and Wales that cover flooding from main rivers the sea and reservoirs It is important for all risk management authorities to work in an effective way to plan to manage flood risk from all sources in a way that is well coordinated across catchments and coastal cells These duties are relevant to drainage planning because of the vital (but not unlimited) role surface water and combined sewers play in reducing flood risk in urban areas The Act also makes provision for the compulsory drainage of new developments through sustainable drainage systems (SuDS) and the lsquoright to connectrsquo being conditional on SuDS being approved by the SuDS Approval Body of the Lead Local Flood Authority
bull The Climate Change Act 200831 created a legal framework to cut greenhouse gas emissions and build the UKrsquos ability to adapt to a changing climate Water and sewerage companies are expected to reduce carbon emissions and adapt to the impact of climate change over the next decades The Government published its first UK climate change risk assessment in January 2012 and this will be updated every 5 years This is relevant to drainage planning because of the carbon embodied in new drainage infrastructure the carbon emitted during the pumping and treatment of sewage and the increase in flooding and pollution that will occur if climate change adaptations are not made The Government expects Ofwat to work towards the targets of its Adaptation Report and to ensure that its regulatory approach explicitly supports companies in adapting to climate change
bull From October 2011 the Water Industry (Schemes for Adoption of Private Sewers) Regulations 201132 transferred responsibility for existing private sewers and lateral drains to water and sewerage companies Pumping stations will be transferred by October 2016 This is relevant to drainage planning because of the significant increase in assets now within the responsibility of the water and sewerage company and the need to understand and respond to risks therein
Six Guiding Principles for a Drainage Strategy
This Drainage Strategy Framework describes good practice themed around six guiding principles Adherence to these principles will help ensure a Drainage Strategy which meets the expectations of Defra the Welsh Government the Environment Agency Natural Resources Wales and Ofwat and
29 The Local Government Association has published guidance on Local Flood Risk Management Strategies httpwwwlocalgovukcdocument_libraryget_fileuuid=a2538b94‐d3c1‐4cec‐81b0‐8aefd2996c5eampgroupId=10171 30 httpwwwenvironment‐agencygovukresearchplanning125459aspx 31 httpwwwdeccgovukencontentcmslegislationcc_act_08cc_act_08aspx 32 httpwwwlegislationgovukukdsi20119780111510933contents
205240txt012|May 2013
10
Drainage Strategy Framework
will be an essential means of communicating with customers and other partners Further details on each principle are described in Section 2 of this document along with examples of good practice
The six principles are
161 Partnership
Water and sewerage companies cannot develop optimal Drainage Strategies on their own and therefore partnership is key to developing and defining objectives performance indicators and the milestones that will need to be achieved in order to achieve measures that will demonstrate the delivery of outcomes Strategies should be developed and implemented in partnership with customers developers Lead Local Flood Authorities planning authorities the Environment Agency and Natural Resources Wales Strategies should align with (informing and informed by) River Basin Management Plans Local Flood Risk Management Strategies Flood Risk Management Plans and local plans (from planning authorities)
162 Uncertainty
Strategies should explain the reliability of data and knowledge about current and future performance of drainage systems They should explain what steps are planned to improve this understanding and how this will benefit customers Where future performance is uncertain (eg because of sensitivity to climate change) they should explain how adaptive approaches will be used to ensure outcomes are met The uncertainty in predictions of future risks should be recognised and accommodated within decision making
163 Risk based
Strategies should be risk based This means that planning operational and investment activities should be based on consideration of the probability and consequence of inadequate drainage function (risks) as these relate to the achievement of measures that demonstrate delivery of outcomes A risk based strategy ensures that investment is made where risks are the greatest
To aid communication risks should be visualised through maps and plans (Figure 10 is an example) To aid risk assessment risks should be monetised combined and predicted into the future To aid options appraisal the impact of interventions on the level of risk should be predicted
The approach to Drainage Strategy development should be risk based itself The degree of detail included should be related to an understanding of the overall level of risks in the catchment now and in the future
164 Whole life costs and benefits
Strategies should be informed by consideration of whole life costs and benefits They should promote a series of interventions which in view of the quantified uncertainties are most likely to result in performance indicators which demonstrate the achievement of outcomes at lowest cost to customers and the community more widely
Costs relate to capital and operational expenditure to deliver interventions and the monetised impacts of drainage failures such as flooding and pollution
Benefits relate to the reduction in risks from drainage failures such as flooding and pollution but should also include wider societal impacts such as those calculated using a lsquoPayments for Ecosystems Servicesrsquo approach
205240txt012|May 2013
11
17
Drainage Strategy Framework
When considering the lsquowhole lifersquo the strategy should consider climate population and asset deterioration trends These are likely to increase risks over the long term if no interventions are made The strategy should state lsquowhatrsquo should be done but also broadly lsquowhenrsquo and in what sequence interventions should happen
165 Live process
The Strategy should be adaptable and periodically reviewed Whilst outcomes are expected to be relatively stable over time the pace at which the strategy delivers outcomes will be linked to volatile influences (like climate and population change) and the decisions made at each price review about the priorities for the following period The strategy should be reviewed at regular intervals to reflect investments already made the changing priorities of the water and sewerage company and partners and the presence of emerging risks The review is also an opportunity to report drainage catchment performance relative to performance measures designed to monitor progress towards achieving outcomes
166 Innovative and sustainable
The framework promotes the full evaluation of alternatives to traditionally engineered sewerage solutions to test whether these offer lower whole life cost options or better responses to uncertainty It is anticipated that drainage solutions of the future will be different from the ones we are used to
These should include (at least at a high level) real time control or active management storm water retrofit techniques education to enable customers to change behaviour enhancing incentives for customers to reduce surface water flowing to sewers and innovative permitting arrangements across drainage networks and wastewater treatment works Water and sewerage companies should continue to review and develop other innovative solutions
For example where a company may historically have preferred to tackle sewer flooding or combined sewer overflow pollution by increasing its underground equipment to store more rainfall during storms it might consider other options in future such as working with customers to manage the rainfall close to source preventing it from entering the sewer system
Mapping the Framework to Current Planning Processes
We assume that practitioners will be following a broad and generic four‐stage planning process common to the Sewerage Risk Management (SRM5) and Surface Water Management Plan (SWMP) processes when preparing Drainage Strategies
Figure 4 is provided to guide water and sewerage companies in the development of Drainage Strategies It identifies each stage of the drainage planning process and highlights the good practice principles (colour coded by theme) in the locations through the process where it is most important that they are adopted
205240txt012|May 2013
12
e
u
t
v
b
DDrainage Strateegy Frameworrk
Initializepre
Establish partne and consultat
process
Define uncertai
Prepare risk d
Partnership
epare
rship ion
nties
ata
Ris
Co
Uncertainty
k assessmen
onsultation on risk issues
Quantify uncertainties
Quantify risks
Risk based
nt Options
Consult
Plan for
Demons life cost
Whole lif costs amp benefits
s appraisal
on options
uncertainties
strate whole and benefit
fe
s Live pro
Intervent
Aligned deliv collaborat solution
Innovative sustainab
Live and vis
cess Innova sustai
tion
ery amp ive s
and le
sible
ative amp nable
Figgure 4 Draina ge Strategy frramework prinnciples mappe d to the drainaage planning pprocess
118 WWho will bennefit from tthe Framewwork
Thhe Drainage Strategy Fraamework willl benefit
bull Water andd sewerage coompanies loooking to impprove their coompany speccific drainagge planning approach and make it fit for purpoose for the deelivery of lonng term outcoomes over mmultiple pricee review cyccles It will ppoint them toowards good practice andd provide exaamples as innspiration andd to promott ne innovation
bull Organisatiions and inddividuals lookking to enga ge with the ddevelopmen t of Drainagee Strategies and scruti nise progresss towards thhe achievemeent of outcommes associateed with enabbling growth adapting tto climate chhange managging floodingg and managging water poollution
22 DDrainagee Strateegy Frammeworkk Thhis section deescribes recoommended ggood practicee against eachh of the six kkey principle s necessary too develop a DDrainage Straategy For refference linkss are made too relevant annd establisheed planning prrocesses and emerging guuidance whicch drainage planners maay find usefuul These exammples are prrovided for innformation aand referenc e only
WWater and sewwerage comppanies shouldd work towaards developiing Drainagee Strategies wwhich apply thhese approachhes in a wayy that is consiistent with thheir needs annd those of thheir customeers and paartners Partnners should ttake note of tthis advice aand prepare tto engage wiith water andd sewerage coompanies on this basis
Thhe recommennded good ppractice is orgganised withhin each prinnciple as it wwould be appproached chhronologicallly in developping a Drainaage Strategy following thhe planning pprocesses alrready esstablished in the Seweragge Risk Manaagement anddor Surface WWater Managgement Plann mmethodologiess
2205240txt012|Mayy 2013
13
21
Drainage Strategy Framework
Principle One Partnership
Water and sewerage companies cannot develop optimal Drainage Strategies on their own and therefore partnership is key to developing and defining objectives performance indicators and the milestones that will need to be achieved in order to achieve measures that will demonstrate the delivery of outcomes Strategies should be developed and implemented in partnership with customers developers Lead Local Flood Authorities planning authorities the Environment Agency and Natural Resources Wales Strategies should align (informing and informed by) with River Basin Management Plans Local Flood Risk Management Strategies Flood Risk Management Plans and local plans (from planning authorities)
205240txt012|May 2013
14
Drainage Strategy Framework
211 Recommended good practice
No Good practice Example references
1 Engage with partners in a drainage catchment to bull Explain the purpose of developing a Drainage Strategy
and partnersrsquo roles in its success amp how each party will benefit from establishing a long term Drainage Strategy
bull Explain what outcomes are and how progress towards achieving them will be measured
bull Share data and information so that a shared understanding of risks and opportunities is developed
bull Explain what current drainage system performance is and how this is expected to change in the future Use risk visualisation tools to do this
bull Explain significant uncertainties and how these affect how interventions are delivered
Thames Water has demonstrated good practice through the development of its Counters Creek sewer flooding proposals This website describes the engagement process and how customers have been kept informed
2 Engage with the following partners in the development of the Drainage Strategy
bull Lead Local Flood Authority (the drainage area may include more than one) because of its responsibilities for local flood risk management and SuDS approval
bull Planning authority (the drainage area may include more than one) because of its role in determining the location and pace of housing development
bull Highways Authority because of the connection of highway runoff to public sewer systems
bull The Environment Agency (in England) because of its responsibilities for flood risk management (strategic overview) and ensuring good ecological quality is met in water bodies
bull Natural Resources Wales (in Wales) because of its responsibilities for flood risk management (strategic oversight) and ensuing good ecological quality is met in water bodies
bull Regional Flood and Coastal Committees who help develop a mutual understanding of flood and coastal erosion risks in an area
bull Bodies representing customers (eg Consumer Council for Water large local businesses flood action groups faith communities)
bull Bodies representing local environmental concerns (eg Wildlife Trusts Rivers Trusts)
bull Water only companies and water and sewerage company departments planning and operating water supply systems Water demand management practice can have an important impact on sewerage headroom
SWMP guidance (Chapter 2) advises on the establishment of partnerships for urban flood management and how to agree and align local objectives
3 Understand alignment of planning cycles and what this means locally (eg periodic review River Basin Management Plan Local Flood Risk Management Strategy Flood Risk Management Plan local plan)
205240txt012|May 2013
15
Drainage Strategy Framework
No Good practice Example references
4 Be alert to opportunities for joint solutions andor shared funding by understanding local plans for new development re‐development improving street furniture and public open space improving parks and green infrastructure Understand Lead Local Flood Authority and Environment Agency programmes for the management of flood and pollution risks
A guide to joint funding of local flood risk management intervention has been published by Defra33 and provides relevant advice to water and sewerage companies and other partners
5 Consider water and sewerage company funded solutions which deliver third‐party non‐sewerage assets that result in the long term least cost delivery of outcomes (eg water and sewerage company funding of household rain barrels and rain gardens to prevent surface water entering sewers)
6 Use data and mapping from the Environment Agency and Natural Resources Wales to understand exposure of drainage infrastructure to extreme events (eg coastal fluvial and surface water flood maps) so that network resilience can be understood and improved if this is cost beneficial
UKWIR has completed a project in 2013 lsquoResilience building a business case for PR14 and beyondrsquo
7 Work with LLFAs and the Environment Agency (or Natural Resources Wales) to understand the effectiveness of interventions at reducing risk and use this information to improve intervention planning
The UPM3 manual (section 7) advises on post project monitoring needs for water quality driven improvements
8 Share Drainage Strategies with partners and stakeholders so that there is transparency around challenges opportunities and the roles expected of different organisations
212 Good practice example ndash South West Water working with local authorities
These examples from South West Water illustrate how the company has worked with local authorities to coordinate investments and to share resources and skills in the development of integrated urban drainage management studies and Surface Water Management Plans
bull South West Water approached Devon County Council (DCC) to pool resources in delivering two (of five) pilot integrated urban drainage management studies (IUDMs) for Exeter and Exmouth South West Water took the lead role for Exmouth but DCC led in Exeter This engagement shared costs across organisations and has facilitated the production of full Surface Water Management Plans The collaboration has resulted in a shared understanding of the urban drainage challenges faced by both organisations and has opened dialogue around investment priorities
bull In Lyme Regis South West Water supported extensive coastal erosion defence works being carried out by West Dorset District Council by accelerating a programme of sewer rehabilitation and targeting renovation of sewers in vulnerable areas
bull In partnership with Cornwall County Council (CCC) and the Environment Agency South West Water has been working on a number of key drainage issues identified by CCC in its Preliminary Flood Risk Assessment (PFRA)
33 httprandddefragovukDefaultaspxMenu=MenuampModule=MoreampLocation=NoneampCompleted=0ampProjectID=17085
205240txt012|May 2013
16
Drainage Strategy Framework
bull In Camborne South West Water has taken the opportunity to invest in sewer separation works which align with the aims of the Camborne Pool Redruth urban regeneration group supported by Cornwall Council and to promote sustainable development economic growth and a strategic aim of lsquosewers for sewagersquo
213 Good practice example ndash Northumbrian Water partnership working in Tyneside
Northumbrian Water has led a sustainable sewerage study for Tyneside34 between 2010 and 2012 It is a good example of how partner organisations can collaborate to understand and resolve drainage issues in their urban area
Its approach was informed by the fact that a shared urban drainage problem around flooding and pollution was best addressed by a shared response from all the relevant organisations The project steering group involved representatives of Northumbrian Water the Consumer Council for Water the Environment Agency and five Lead Local Flood Authorities The urban drainage system collects wastewater for a single wastewater treatment works serving a population of over 900000
Working together the group studied the impact of growth urban creep and climate change on future urban drainage issues Figure 5 illustrates how a city‐wide map of potential problem areas was generated by the project team sharing data on sewer capacity (from Northumbrian Water) population change (from the local authorities) and river flooding (the Environment Agency) It was predicted that future problems were more likely to occur in the darker shaded areas These became focus areas for the project where a range of traditional and novel drainage solutions were tested
Figure 5 Future drainage problem areas indentified through data sharing
34httpcommunicatoremailcomINfNLOjNRayfOA1rfrfYcdK‐S7UwRcYcNoWebViewaspx
205240txt012|May 2013
17
22
Drainage Strategy Framework
The project team was keen to promote its work to customers and the community and prepared a series of newsletters updating interested parties on progress and issues An example is illustrated in Figure 6
C lic k here if y ou are hav in g d if f ic u lties v iew ing th is new s letter
Ho m e A b o u t u s M e d ia ce n tre C o n tact
Issue 2
Ap ril 2012
In th is ed ition U n d e rs tan d in g th e fu tu re
S u s tain ab le d ra ina g e o p tio ns
F ind ou t more about Th e 2 0 1 1 an n ua l re po rt
Ou r e n viro n m e n ta l p o licy
Ou r co rp o ra te re sp o nsib il i ty s tra te g y
W e lcom e to th e s e con d e ditio n o f S u sta inab le se we ra g e a s ix-m on th ly n e ws le tte r p ro d u ce d to b ring yo u th e la te s t n e ws on o u r m a jo r s tud ye xp lo rin g s us tain ab le s ew e ra ge o p tions in th e Tyn e s id e a rea I h o p e yo u fin d th e in fo rm a tio n o f in te res t a n d wo u ld w e lcom e fe e db a ck o n an y o f th e issu es ra ise d
Ric ha rd W a rne ford W a s te wa te r Dire c tor
U nderstand ing the fu tu re W e a ll kn o w th e difficu lties o f a ccu ra tely p re d ic tin g th e fu tu re h ow e ve r ifw e a re to p re pa re fo r i t th e n it is s om e thin g we m us t a tte m p t As p a rt o f th is s tu d y w e a re co ns id e rin g w ha t d em a nds w ill b e p la ce d on th e d ra ina g e s ys tem s a t 2 0 20 a n d a t 2 0 50 in co rpo ra ting g ro w th u rba n cre e p a nd c lim a te cha n ge B y w o rk in g close ly w ith o u r p a rtn e rs an d u s in g th e la tes t te ch n ical res e a rch we h a ve d e ve lo p ed a n d com p u te rm od e lle d a num b e r o f s ce na rios to id en tify a n d d e fin e fu tu re ris ks Th es e ris ks in c lud e p red ic tions o f p o te n tia l floo d in g p o llu tion o r b a rrie rs to g ro w th N o w th a t w e be tte r u n d e rs ta nd th e iss u es we a re a ble to p re pa re p la ns p rom o ting o p po rtu n ities fo r s us ta in a ble d rain ag e s ys tem s in o rde r to d e live r th e b es t p oss ible s e rvice fo r o u r cu s tom e rs b a la n ced a g ains te n viro nm e n tal n e eds a n d cos ts
S usta inab le d ra inage op tions W e b e lie ve o u r a pp ro a ch re p res en ts go o d p ra ctice fo r th e m a n ag em en t o f s u rfa ce wa te r w h ich is to d ea l w ith th e s u rfa ce wa te r as c los e to s ou rce as p oss ib le A w id e ra n g e o f p o te n tial o p po rtu n ities a re b ein g id e n tifie d in c lu d in g lo ca l a n d s tra te gic o p tions
S tra te g ic o p tions a re typ ica lly la rg e r th a n th e lo ca l on es a nd in c lu d e fe a tu res s u ch as a re as o f la nd w h ich w o uld b e a llo we d to flo o d d u rin g he a vy ra in (s a crific ial s to ra g e ) a n d p e rm a n en t w e tla nd fe a tu res
L o ca l op tio ns d esp ite b ein g sm a lle r th a n th e s tra te gic o n es w ill s til l p la y a ke y ro le in th e p ro vis io n o f s us tain ab le d ra ina g e Th e ir n a tu re m e a ns de p lo ym e n t co u ld be m o re w id es p re a d th a n s tra te gic o p tions fe a tu res su ch as w a te r b u tts ra in g a rde ns a nd p e rm e ab le pa vin g co u ld b e re la tive ly e a s y to fi t in to
Figure 6 Newsletter promoting urban drainage partnership working
Principle Two Uncertainty
Strategies should explain the reliability of data and knowledge about current and future performance of drainage systems They should explain what steps are planned to improve this understanding and how this will benefit customers Where future performance is uncertain (eg because of sensitivity to climate change) they should explain how adaptive approaches will be used to ensure outcomes are met The uncertainty in predictions of future risks should be recognised and accommodated within decision making
205240txt012|May 2013
18
Drainage Strategy Framework
221 Recommended good practice
No Good practice Example references
1 Data analysed and used in the development of the strategy related to asset location dimensions condition failure and flood and pollution incidents should be assigned a confidence grading The confidence grading should be related to its accuracy completeness compatibility credibility and currency
Models used to predict blockages and collapses flooding locations polluting discharges and water quality impacts should be assigned a confidence grading based on their accuracy completeness compatibility credibility and currency
Model predictions should be assigned a confidence grading depending on the confidence in the model and whether it is being applied outside of its verification range (eg for extreme events or for atypical geographies)
The purpose of confidence grading data and model results used in strategy setting is to understand the likelihood that outcomes will be achieved in a cost efficient manner Where the outcomes remain uncertain knowledge of data confidence can be used to target improvement programmes
SRM5 (S3‐03‐17) refers to Ofwatrsquos method for recording the reliability and accuracy of regulatory data in bands A to D
The SWMP guidance (Section 319) describes an alternative system of grading data and model results
2 Use the Drainage Strategy to justify data and model improvement programmes This should be focussed on areas where risks are currently (or predicted to be) high and uncertainty in data or models reduces the ability to determine robust operational or capital solutions Poor model verification in high risk areas would be an indicator that model improvements were required
CIWEMrsquos urban drainage group has published a series of guides on hydraulic and water quality modelling They discuss model calibration verification and uses
SRM5 (S3‐04) describes how to determine where the current assessment of risk is sufficient to proceed or whether data and models should be improved
3 Improve understanding of network performance (and improve models) by using long term flow and level monitoring on sewers and CSOs
Yorkshire Water discusses its CSO
monitoring programme here
4 Demonstrate how the uncertainty in both the underlying datamodels and in the future projections is addressed in options appraisal Consider if this should be done implicitly (eg through choosing conservative assumptions) or explicitly through the use of sensitivity analysis or scenario testing
Treasury Green Book supplementary guidance illustrates how to accommodate climate change uncertainties
205240txt012|May 2013
19
Drainage Strategy Framework
No Good practice Example references
5 Population growth new homes and businesses climate change and urban creep combine to make the future highly uncertain but will almost certainly increase flooding and pollution risks from drainage systems Use the Drainage Strategy to explore different scenarios (combining the impact of these drivers) for a near term (le 10 years) and future (ge 30 years) epoch
For example combine modest growth and slight climate change (a low impact case) and contrast with high growth and significant climate change (a high impact case) Where the location of significant new development is unknown include scenarios accommodating different possibilities
Running multiple scenarios is time consuming and costly A risk based approach should be adopted to focus efforts where flooding and pollution risks are especially sensitive to changes in demand
UKWIR has published research on accounting for climate change35 and urban creep36 in sewerage planning together with more general advice on accommodating climate change in water asset management planning37
Ofwat has published research38
predicting the combined impacts of climate change urban creep and development on a national basis
6 In the face of significant uncertainties about future demands on the drainage system and their consequences the Drainage Strategy should identify low‐regrets interventions (ie ones that are robust no matter what the future holds) and ensure that solutions can be adapted if greater certainty is achieved For example through quickening the pace of SuDS retrofit activities or using (previously identified and secured) land to extend underground storage facilities Strategies which remove surface water from sewerage networks provide lsquoheadroomrsquo for unpredictable increases in demand from population and climate change
Designing Resilient Cities A guide to good practice DR Lomardi et al HIS BRE Press
7 Post project appraisal and cost monitoring should be used to capture real costs and performance so that Strategies can be updated and improved with latest information It is especially important to collate and understand the whole life costs of new technologies where industry understanding is currently poor
35httpwwwukwirorgreports03‐cl‐10‐09042794658901799019890198 (poundpound) 36httpukwirforefront‐librarycomreports10‐wm‐07‐1493273 (poundpound) 37httpukwirforefront‐librarycomreports12‐cl‐01‐1694816900019015590145901409465890155 (poundpound) 38httpwwwofwatgovuksustainabilityclimatechangerpt_com201106mottmacsewerpdf
205240txt012|May 2013
20
Drainage Strategy Framework
222 Good practice example ndash Severn Trent Waterrsquos MICAS
Severn Trent Water has developed a process to measure confidence in hydraulic models of sewer systems Modelling Investment Confidence Assessment Scoring (MICAS) was developed to provide an objective evaluation of model confidence It uses information stored in the hydraulic model about the provenance of each data element and the quality of model verification Before the approach was developed the assessment of lsquofitness for purposersquo of models was subjective and based on modellers judgment This was not always reliable and certainly not repeatable and transparent MICAS provides an objective assessment of hydraulic model quality which can be used to inform its use and prioritise improvements to input data and model verification
Figure 7 and Figure 8 illustrate how an understanding of model confidence from the MICAS assessment (right hand side images) can be used to interpret predictions of flooding (left hand side images) In Figure 7 areas at predicted high risk of flooding (red in the left hand side image) are shown to be in high confidence areas of the hydraulic model (green in the right hand side image) In contrast in Figure 8 areas at predicted high risk of flooding (red in the left hand side image) are shown to be in poor confidence areas of the hydraulic models (orange in the right hand side image) In the latter case this information is used to identify where further model improvements would be beneficial
Flood Risk MICAS
Figure 7 Modelled flood risk and MICAS confidence scores (high model confidence)
Flood Risk MICAS
Figure 8 Modelled flood risk and MICAS confidence scores (lower model confidence)
205240txt012|May 2013
21
23
Drainage Strategy Framework
Principle Three Risk Based
Strategies should be risk based This means that planning operational and investment activities should be based on consideration of the probability and consequence of inadequate drainage function (risks) as these relate to the achievement of measures that demonstrate delivery of outcomes A risk based Strategy ensures that investment is made where risks are the greatest
To aid communication risks should be visualised through maps and plans (Figure 10 is an example) To aid risk assessment risks should be monetised combined and predicted into the future To aid options appraisal the impact of interventions on the level of risk should be predicted
The approach to Drainage Strategy development should be risk based itself The degree of detail included should be related to an understanding of the overall level of risks in the catchment now and in the future
231 Recommended good practice
No Good practice Example references
1 Determine where a Drainage Strategy is required by combining current performance with external influences likely to result in deteriorating performance This stage requires no modelling or detailed assessment On a catchment‐by‐catchment (drainage area) basis understand current risks by collating data on current performance eg blockages collapses pumping station failures pollution incidents CSO spills storm tank spills internal flooding incidents external flooding incidents and infiltration rates Relate these risks to performance indicators and the achievement of outcomes Combine with information about known growth rates predictions of urban creep quantity of newly adopted lsquoprivatersquo sewers surface water flooding risks (eg from flood map for surface water) WFD water body status and bathing water status Prioritise catchments with high current risks andor factors suggesting that risks are likely to worsen significantly in the future Consider normalising scoring method for size of catchment (eg by unit area or unit length of sewer) Consult with stakeholders to confirm correct prioritisation Commence with development of Drainage Strategies for the highest ranked catchments Periodically revisit prioritisation (updating with new data) to check that priorities are still correct
The initialisation stage of a Sewer Management Plan (SMP) (described in SRM5) considers how a risk assessment can be used to prioritise which spatial units (eg catchments) should be prioritised for a SMP study
2 Visualise catchment risks (from 1) to illustrate and explain to partners the reasons for prioritisation Accommodate their views amp consider changing prioritisation to aid wider drainage planning requirements (eg increase prioritisation of a catchment with significant surface water flooding problems where close collaboration between water and sewerage company and LLFA will benefit the community)
205240txt012|May 2013
22
Drainage Strategy Framework
No Good practice Example references
3 Clearly relate sewerage risks to the performance indicators that will be used to measure progress towards achieving outcomes eg relate blockage rates to flooding and pollution incidents eg relate increase in flows to increased CSO frequency breaches of permit conditions and deterioration in receiving water quality Adopt a sourcendashpathway‐receptor model and workshop techniques to ensure that cause effect and consequences are fully captured Use performance indicators as the basis for a comprehensive risk assessment that considers likelihood (frequency) and consequence (extent degree and duration of impact) of failure expressed as risk scores Monetise risks in GBP (pound) to align with principle four (whole life costs amp benefits) Use (verified) predictive models to understand near term (lt10 years) and long term (gt30 years) risks The latter to align with principle four (whole life costs amp benefits) Align complexity of method with level of risk recognising the needs of partners eg use complex 2D flood routing models to ascertain (with greater certainty) flood mechanisms and damages where the quantity and frequency of flooding is high and interventions will be complex and costly Elsewhere more simple approaches are appropriate eg use complex UPM3 water quality modelling methods where compliance with river standards or discharge consents is already failing or is expected to do so Elsewhere more simple approaches are appropriate Combine risk scores from different risks to describe the total level of risk in a catchment Use visualisation techniques to communicate combined level of risk Combine analysis from hydraulic blockage and asset deterioration models on a catchment basis In hydraulic analysis consider flooding performance for rainfall events beyond the usually provided standard of protection to understand performance in extreme events in support of partners (especially LLFAs) and in search of cost beneficial interventions at a higher standard than normal
SRM 5 (S3‐03) details approaches to simple and more complex approaches to risk assessment that are consistent with CMPCF guidelines
4 Be alert to interactions between sewer networks and wastewater treatment plans eg by modelling the impact of changing sewer flows on wastewater treatment worksrsquo performance and costs Consider combined impact of different catchments on a single or linked water body (eg an inland river bathing water or shell fishery)
UPM3 guidance discusses approaches to understanding these interactions and applying more complex water quality impact models
5 Establish systems and apply methods to predict how interventions can reduce risks eg how a targeted and pro‐active maintenance can reduce the occurrence of sewer blockage and flooding from lsquoother causesrsquo eg how reducing infiltration can reduce CSO spills eg how reducing connected impermeable area can reduce sewer flooding
205240txt012|May 2013
23
Drainage Strategy Framework
232 Good practice example ndash United Utilities risk assessment
United Utilities has demonstrated a robust risk based approach in the development of sewerage management plans used for long term planning across their area of operations
Hydraulic models were applied in 235 catchments and configured to look at future performance and to evaluate the consequences of inadequate capacity Starting from a baseline of 2010 versions of the models were built for 2020 and 2036 epochs The following model input parameters were adjusted population water consumption infiltration planned development known sewerage improvement projects urban creep rainfall (for climate change)
Two‐dimensional (2D) modelling was used to consider the consequences of sewer flooding resulting from the changes made to reflect the future operating environments As well as the impact on homes and business (from internal and external flooding) the flood risk to critical infrastructure was also considered The operation of CSOs was considered by computing the annual spill volume duration and frequency
Finally predictions of the likelihood and consequence of sewer failure were added taking account of sewer material age and the incident records relating to similar assets
All these data were combined and weighted to generate a Sewer Management Plan (SMP) Risk Score for each length of sewer The process is illustrated in Figure 9
Figure 9 United Utilitiesrsquo process for calculating risk score in sewerage catchments
205240txt012|May 2013
24
Drainage Strategy Framework
Risk scores were summed spatially and monetised so that high priority locations could be identified Mapping and visualisation were used to communicate the results of this assessment priority areas for further investigation and how risks change through time (Figure 10)
Figure 10 Visualisation of sewerage risks
233 Good practice example ndash Northumbrian Water risk assessment
Northumbrian Water completes an annual assessment of hydraulic capacity in its sewerage network at the drainage area scale Its approach does not require hydraulic models to have been completed and yet can reliably highlight areas of under‐capacity in need of further investigation through more detailed analysis including hydraulic modelling New and emerging risk areas can also be identified by applying data for population growth which occurs through development lsquoWhat ifrsquo scenarios can be run to test when capacity limits may be overcome and flood risks potentially set to increase It demonstrates good lsquorisk basedrsquo planning principles because it shows the drainage planner where more detailed analysis is warranted
The approach uses the following data from company records population connected to sewer P water consumption rate G (lhd) trade discharge E (ls) pipe diameter and gradient pipe connectivity CSO consent pass forward rate (ls) pumping station rate (ls) sewage treatment flow rate (ls) A wastewater dry weather capacity map calculates pipe full capacity dry weather flow (PG+E+I) and Formula A flow for fully combined (1360P+2E+DWF) and separate (4PG+3I+E) areas of the network Infiltration (I) is assumed to be 50 PG +E
205240txt012|May 2013
25
Drainage Strategy Framework
A theoretical assessment of network capacity is then calculated by comparing Formula A with pipe full capacity flow consent values at CSOs and wastewater treatment works and pumping rates This determines areas of the network with a capacity shortfall with a potential capacity shortfall and with no capacity shortfall
When run across the whole company area approximately 100 out of 500 drainage areas were found to be under capacity Over 60 of these areas had recorded sewer flooding incidents In over 300 drainage areas there was no forecast capacity shortfall Only 7 of these drainage areas had recorded sewer flooding incidents Overall the system proved to be very reliable at predicting drainage areas likely to have sewer flooding problems because of sewer under‐capacity
In under capacity drainage areas an intermediate (hydraulic model based) assessment is then carried out Figure 11 shows the results thematically mapped for an example drainage area Red areas are predicted to have a very high risk of sewer flooding Yellow and green areas are predicted to have a low risk of sewer flooding
Figure 11 Example of a drainage area capacity map
205240txt012|May 2013
26
24
Drainage Strategy Framework
Principle Four Whole Life Costs and Benefits
Strategies should be informed by consideration of whole life costs and benefits They should promote a series of interventions which in view of the quantified uncertainties are most likely to result in performance indicators which demonstrate the achievement of outcomes at lowest cost to customers and the community more widely
Costs relate to capital and operational expenditure to deliver interventions and the monetised impacts of drainage failures such as flooding and pollution
Benefits relate to the reduction in risks from drainage failures such as flooding and pollution but should also include wider societal impacts such as those calculated using a lsquoPayments for Ecosystems Servicesrsquo approach
When considering the lsquowhole lifersquo the strategy should consider climate population and asset deterioration trends These are likely to increase risks over the long term if no interventions are made The strategy should state lsquowhatrsquo should be done but also broadly lsquowhenrsquo and in what sequence interventions should happen
241 Recommended good practice
No Good practice Example references
1 Predict risks into the future for at least two epochs le10 years (to understand what the company needs to do now and how this fits with longer term outcomes) and ge30 years to understand long term needs in light of changing population and other pressures
Account for the following changes in demand
bull Growth ‐ new homes and businesses
bull Urban creep ndash uncontrolled addition of connected impermeable area
bull Climate change ndash affecting design events (flood predictions) time‐series (CSO and treated effluent quantities) river flows and temperatures
bull Infiltrationexfiltration ndash through deteriorating sewer condition
bull Dry weather flows ndash through changes in water consumption rates
2 Combining monetised risks (associated with sewerage failures) determine whole life costs for a lsquodo nothingrsquo scenario (ie no interventions)
Include costs associated with electricity consumption (in the network and at the wastewater treatment works) and CO2 emissions
UKWIR will publish in 2014 a revision to their Long Term Least Cost Planning for Wastewater Supply‐Demand
guidance This may provide tools and methods for expressing costs and benefits to support the development of a Drainage Strategy
205240txt012|May 2013
27
Drainage Strategy Framework
No Good practice Example references
3 Test intervention strategies which keep performance indicators on track to deliver outcomes by adding capacity (supply) reducing flows (demand) or altering operational regimes
Include the costs of interventions and the benefits of reduced risks to inform selection of the most cost beneficial strategy over the whole life
Have regard to the timing of interventions recognising that uncertainty may require low‐regrets (insensitive to uncertainty) solutions and that delaying major interventions may be more affordable and attractive in the short term Discounting should be used to compare the costs and benefits of interventions occurring at different times
Recognise that some interventions will be obligatory and defined (eg maintenance of a spill frequency standard at a CSO) whilst others will be more discretionary focused on achieving outcomes rather than specific outputs
SRM5 (Section 8) defines and contrasts cost benefit analysis cost effectiveness analysis whole life cost analysis and risk cost benefit analysis
HM Treasury Green Book39
sets out a framework for the appraisal of long term projects which can be applied to the development of a Drainage Strategy
4 Donrsquot at first be concerned with the distribution of costs and benefits between partners who may be sharing costs Identify the most cost beneficial solution first and then debate and agree an equitable sharing of costs
Give equal weighting to OPEX (operating expenditure) and CAPEX (capital expenditure) costs so not to cause bias towards capital intensive solutions Properly consider the costs and benefits of pro‐active maintenance regimes and campaigns to influence customers to reduce fats oils and greases (FOG) build‐ups and the misuse of sewers
Consider the affordability of solutions the impact on customersrsquo bills and the resources of other organisations to play their part
UKWIR research outputs40 in 2013 (SW01) will provide a framework for making a business case for separating storm water from combined sewers
5 Where interventions include the provision of green space public amenity and improved habitats then Payment for Ecosystem Services approaches should be used to identify further monetised benefits in the appraisal Customers should be consulted to help value these benefits
Supplementary Green Book41
guidance describes methods for accounting for environmental impacts including the ecosystems approach
39 httpwwwhm‐treasurygovukdata_greenbook_indexhtm 40 httpwwwukwirorgpublishorsystemcomponent_viewaspLogDocId=96116 41 httpwwwhm‐treasurygovukdaccounting_environmental_impactspdf
205240txt012|May 2013
28
Drainage Strategy Framework
242 Good practice example ndash Severn Trent Water making the case for surface water separation in Stoke-on-Trent
In this example42 Severn Trent Water compared alternative ways of addressing sewer flooding problems by looking at a range of costs and benefits not all of which were directly associated with its specific responsibilities as a water and sewerage company Whilst the example does not express a monetised value for all costs and benefits over the whole life it does illustrate the types of factors which could be included in an appraisal of this type scaled to address problems at a catchment level It also demonstrates how working collaboratively can help identify solutions which are cost‐beneficial for the community at large
In an area of Stoke served by a combined sewer system five properties were at risk from sewer flooding in cellars for events equal to and less frequent than the 1 in 10 year probability A conventional sewer pumping station based solution was presented as the standard option
However a nearby former hospital site was also undergoing re‐development which would result in reduced runoff to the combined sewer The new drainage regime in the redevelopment site was sufficient to remove the flood risk at the five properties (this was a do nothing strategy)
A third option completely separated the development site runoff from the combined sewer and also addressed local flood risk issues nearby The solution required a new storm sewer and a network of swales and other SuDS features connecting with an ordinary watercourse
Table 1 illustrates how costs and benefits were compared across the three alternative strategies Each provided the same benefit in terms of the number of homes (5) relieved from sewer flooding The novel SuDS and surface water management solution additionally gave local flood risk relief to 3 further properties The separationSuDS strategy came at a higher capital cost but delivered greater social cost benefits savings in annual operating costs and a bonus improvement water quality (because of reduced CSO spill volume) Severn Trent selected the separation SuDS solution because the higher capital costs were offset by other benefits
Table 1 Costs and benefits of drainage improvements in part of Stoke-on-Trent
Do nothing Standard option
SuDS
Sewer flooding benefits 5 5 5
Other flooding benefits 0 0 3
Change in runoff to combined sewer (m3year) 0 0 ‐40000
Estimated cost (pound) 0 168000 419000
42httpwwwciwemorgmedia695460Paper203_Creating20Sewer20Capacity_Presentation2 0by20Mike20Woodpdf
205240txt012|May 2013
29
Drainage Strategy Framework
Do nothing Standard option
SuDS
Social Cost Benefit (pound) 16000 5000 51000
Change in electricity costs (poundyear) 0 +75 ‐525
Programme impact (years to deliver solution) + 4 0 +4
CSO spill volume (m3 in 1year event) +298 0 ‐397
243 Good practice example ndash New York City comparison of grey and green infrastructure drainage strategies
This example is taken from New York in the United States of America Itrsquos an illustration of how whole life costs have been compared for alternative strategies to solve urban drainage issues on a mega‐city scale The key data are summarised in Table 2
Table 2 Comparing drainage strategies in New York
Grey Strategy
Green Strategy
CSO spill volume reduction (billion gallons year)
101 122
Wider benefits over 20 years ($ million) 0 139 to 418
Whole life costs over 20 years ($ billion) 68 53
The information is taken from the New York City Green Infrastructure Plan43 produced by the Mayorrsquos Office in 2010 The Plan (and recent updates) provides a comprehensive evidence base around costs and benefits of different approaches to address the cityrsquos drainage problems It is therefore an excellent example of how drainage strategies can be described in plain language for a non‐specialist audience concerned with their environment and the cost of providing infrastructure to enhance it
It is becoming commonplace for North American cities (eg Portland and Philadelphia) to address the issue of frequent combined sewer overflow (CSO) operation by using a combination of grey infrastructure (sewers) and green infrastructure (sustainable drainage systems) The wider health
43 httpwwwnycgovhtmldephtmlstormwaternyc_green_infrastructure_planshtml
205240txt012|May 2013
30
25
Drainage Strategy Framework
and ecological benefits of green infrastructure approaches and the reduced reliance on materials and energy are attractive to utility planners and cities alike
New York has 422 CSOs and an agreed Long Term Control Strategy to significantly reduce the impact wet weather discharges have on aquatic systems throughout the city Annual discharges are currently (2010) estimated to be 30 billion gallons (114 million cubic meters) per year Building on existing and committed new sewer plans an agreed grey infrastructure based strategy to this problem is set to reduce these discharges to 198 billion gallons per year (a 34 reduction) by the 2030s An alternative green infrastructure approach based around intercepting the first inch (25mm) of rainfall across 10 of the impermeable city area by 2030 is predicted to reduce CSO spills to 179 billion gallons per year
Planners have calculated that the whole life costs after 20 years of the grey infrastructure solution will be $68 billion (2010 prices) compared to the green infrastructure whole life costs of $53 billion The green infrastructure strategy reduces CSO spills by more than the grey alternative for $15 billion less in terms of whole life cost Further planners have calculated that New Yorkers will benefit by up to $41844 million (accumulated over 20 years) in additional benefits associated with lower energy bills from control of urban heating increased property values and improved health
Based on this analysis New York City has committed itself to an aggressive green infrastructure based runoff control strategy to provide long term reductions in CSO spills The plan is to achieve interception of 15 of impermeable area by 2015 4 by 2020 7 by 2025 and 10 by 2030
Principle Five Live Process
The Strategy should be adaptable and periodically reviewed Whilst outcomes are expected to be relatively stable over time the pace at which the Strategy delivers outcomes will be linked to volatile influences (like climate and population change) and to the decisions made at each price review about the priorities for the following period The Strategy should be reviewed at regular intervals to reflect investments already made the changing priorities of the water and sewerage company and partners and the presence of emerging risks The review is also an opportunity to report drainage catchment performance relative to performance measures designed to monitor progress towards achieving outcomes
44 Estimated using methods from the New York Municipal Forest Resource Analysis (MFRA) prepared by the US Dept of Agriculture
205240txt012|May 2013
31
Drainage Strategy Framework
251 Recommended good practice
No Good practice Example references
1 Regularly repeat screening exercise to determine catchments requiring a Drainage Strategy and modify programme of Strategy development accordingly
Check for changes in measured rates of flooding and pollution incidents blockages collapses pumping station failures etc
Check for changes in extent and location of new development
Check for activities being undertaken by partners (eg redevelopment urban realm improvements and flooding and pollution management activities)
SRM5 illustrates how improved and updated knowledge of system performance should be applied to establish Strategies
2 In lsquolive Strategiesrsquo repeat risk assessment when data and models improve and adjust confidence scores accordingly
Confirm that Strategy will still achieve performance indicators and outcomes at least cost Revise Strategy as necessary
3 Periodically refresh Strategy accommodating impact of interventions already delivered using re‐verified predictive tools as appropriate
Confirm that Strategy will still achieve performance indicators and outcomes at least cost Revise Strategy as necessary
Triggers for a wholesale review of the Strategy are likely to be significant changes to the location or extent of planned development
4 Monitor report and share (with partners) the measures used to demonstrate delivery of outcomes Example measures may include the number of properties which experience sewer flooding the number of properties at risk of flooding the number of properties at risk from sewerage asset failure risk indices that capture both the probability and consequence of failure customer satisfaction with regards to clean rivers and beaches the number of pollution incidents the frequency of combined sewer overflow operation and compliance with discharge permit conditions
252 Good practice example ndash Thames Water live DAP
Thames Water has initiated a DAP (drainage area plan) Live approach Itrsquos a good example of how companies are continuously monitoring and updating the status of drainage area risks It provides a lsquoliversquo snapshot of the current health of all drainage areas in Thames Waterrsquos region allowing real time planning as part of a strategic approach It enables drainage planners to view the effectiveness
205240txt012|May 2013
32
Drainage Strategy Framework
of intervention strategies and compare incident rates across varying geographies and development types in the Thames Valley
DAP Live will be available for all catchments in the Thames Water area thus enabling
bull high level monitoring of risks across the business bull a live and strategic review of catchment performance bull prioritisation of catchments based on risk and bull an ability to share data with partners collaborating in drainage planning and improvements
Figure 12 illustrates the types of data managed through the DAP Live system These include asset data political and drainage boundaries environmental data operational data property amp growth data and modelling data As new data become available the DAP Live system is updated so that drainage planners have the most current view on emerging risks and issues
Asset data
Operational data
Property and growth data
Modelling data
Environmental data
Boundaries (SDACs operational political)
Figure 12 Data types held in the DAP Live system
Figure 13 illustrates how the system can provide analysis at a variety of scales from local authority boundaries sewage treatment works catchments drainage areas or a regular grid
205240txt012|May 2013
33
Drainage Strategy Framework
NE PROVINCES
WESTERN PROVINCES
NE LONDON bull Ops areas local W LONDON
SE LONDON authorities Large TIDWORTH SE PROVINCES
bull STW Catchments
bull Drainage areas(SDACs)
bull Regular grid Small
Figure 13 DAP Live reporting performance at different scales
205240txt012|May 2013
34
Drainage Strategy Framework
253 Good practice example ndash Wessex Water Water live data
Wessex Water is regularly using data geospatially to proactively identify and respond to risk Theirs is a good example of how data can be used to provide an adaptable approach that is regularly reviewed to plan investment
The risk‐based and live approach uses a set of likelihood and consequence models which are built up from all currently available data asset data (eg CCTV data material age) operational data (eg flooding and pollutions incidents) and information (eg locality near hospital or downstream of an overflow) All these data are collated for the entire Wessex region updated regularly and analysed geospatially
Figure 14 Sewer risk scores presented in a risk matrix and geospatially
This allows a risk score (Figure 14) to be calculated for each mapped sewer length which directs investigation more efficiently by allocating each mapped sewer a planned CCTV inspection date
This risk‐based approach has been successful in targeting problematic sewers increasing identification rates threefold Density analysis is performed using asset failure and operational information which allows planning of both proactive structural and operational investment
Proactively found structural issues are far more cost effective to repair before failure and can also prevent serviceability issues
205240txt012|May 2013
35
f
DDrainage Strateegy Frameworrk
Figgure 15 Hotsppot analysis
Thhe hotspot annalysis (Figuure 15) showss where operrational clustters have beeen calculatedd This hootspot analyssis is made aavailable on tthe Wessex WWater corporrate GIS to a llow operati onal staff to target their effforts to mitiggate against ffurther repeaat incidents AAdditional innformation ffrom asset annd operationnal activities ccan be addedd regularly too the databasses which drrive the mod els enabling rissk scores to bbe kept as livve as require d
226 Prrinciple Sixx Innovativve and Susstainable SSolutions
Thhe Drainage Strategy Fraamework proomotes the fuull evaluationn of alternatiives to tradit ionally enngineered sewwerage soluttions to test wwhether thesse offer loweer whole life ccost options or better reesponses to uuncertainty It is anticipaated that draainage solutioons of the futture will be ddifferent froom the ones we are usedd to
Thhese should iinclude (at leeast at a highh level) real ttime control storm waterr retrofit techhniques edducation to eenable custommers to changge behaviou r enhancingg incentives for customerss to reduce suurface water flowing to seewers and innnovative pe rmitting arraangements a cross drainagge networks annd sewage tr eatment worrks Water annd sewerage companies sshould continnue to revieww and deevelop other innovative ssolutions
Foor example wwhere a commpany may hiistorically haave preferredd to tackle seewer floodingg or coombined sewwer overflow pollution byy increasing iits undergrouund equipmment to store mmore rainfalll duuring stormss it might connsider other options in fuuture ndash such as working wwith custommers to mmanage the raainfall close tt eventing it foorm enteringg the sewer syystem o source pre
2205240txt012|Mayy 2013
36
Drainage Strategy Framework
261 Recommended good practice
No Good practice Example references
1 Use cost‐benefit methods to demonstrate that innovative and sustainable solution types provide best value for customers and the wider community
UKWIR will publish new research and guidance in 2013 addressing active control and storm water removal demonstrating how these technologies can be justified and included within Drainage Strategies
2 Consider integrated water resource management Work with partners (especially developers and local authorities) to examine whether use of stored stormwater reduces potable water consumption AND need for capacity in sewers
CIRIA has published a scoping study for water sensitive urban design45 in the UK
3 Consider a mix of conventional and new technologies using more adaptive approaches as low‐regrets responses to uncertainty eg prevent current sewer flooding with underground tank storage but address future risks (worsened by climate change) with retrofit SuDS implemented progressively
CIRIA has published lsquoRetrofitting to manage surface waterrsquo46 a comprehensive guide to planning and delivering this type of project
4 Use carbon accounting methods to compare embodied and emitted carbon in alternative intervention strategies so that these impacts are accounted for in whole life costs
Consider the benefits of surface water removal on the costs (including carbon) of pumping and sewage treatment
UKWIR47 has and continues to publish detailed guidance on carbon accounting for water and sewerage company use
45httpwwwciriaorgserviceresearch_informationAMContentManagerNet ContentDisplayaspxSection=research_informationampContentID=23581 46httpwwwciriaorgSERVICEHomecoreordersproductaspxcatid=5ampprodid=1909 47httpukwirforefront‐librarycomreports08‐cl‐01‐6923419000190269902659465890269
205240txt012|May 2013
37
Drainage Strategy Framework
No Good practice Example references
5 Where interventions include the provision of green space public amenity and improved habitats then Payment for Ecosystem Services approaches can be used to claim further monetised benefits in the appraisal Customers should be consulted to help value these benefits
The Environment Agency will publish data in 2013 on costs and benefits of retrofit stormwater projects to promote understanding and uptake
6 Share data within the industry on innovative solutions to increase knowledge of new technology and SuDs approaches
EA retrofitting SuDs costs and benefits database48
accommodating data from Ofwat AMP5 SuDS pilot initiative and other examples
262 Good practice example ndash Welsh Water surface water reduction and removal strategy for Gowerton and Llanelli
Dŵr Cymru Welsh Water and partners are applying innovative storm water removal methods to address capacity problems in the sewer network in Gowerton and Llanelli49 (population 140000) Current under capacity leads to localised sewer flooding and excessive combined sewer overflow (CSO) spill to the Burry Inlet a protected shellfish water and special area of conservation The capacity problems in the system were a concern for the Environment Agency (Wales) and there was a risk of widespread restrictions to economic development being imposed Dŵr Cymru Welsh Water Carmarthenshire County Council City and County of Swansea Consumer Council for Water Environment Agency Wales and the Welsh Government all worked in partnership to resolve the situation
A brand new hydraulic model was built for the entire sewerage network with particular attention paid to accurately representing the sources of storm run‐off and infiltration The model was verified against data from flow monitors and observed CSO spill frequencies into the Burry Inlet
To begin with a traditional sewer storage solution was proposed that would result in an average 10 spills a year into the shellfish water from all 90 CSOs in the two catchments Although this reduced spills and dealt with some of the flooding and growth issues the storage requirements would have been unaffordable provide no protection against long term climate change and would not tackle the fundamental problem of too much surface water getting into the combined network
An alternative approach based on the reduction and removal of storm water from the combined sewer system was also developed This was in accordance with Dŵr Cymru Welsh Waterrsquos Rainscape50 (surface water elimination and reduction) strategy To identify areas with the most
48httpevidenceenvironment‐agencygovukfcermenDefaultHomeAndLeisureFloodsWhatWereDoingIntoTheFutureScience ProgrammeResearchAndDevelopmentFCRMProjectaspxProjectID=15515be8‐bbed‐4204‐ae56‐3e810ba47694ampPageID=56bad68e‐dcb1‐4bf8‐84cc‐cbfd03ab63a2 49 httpwwwciwemorgmedia674511Paper20820Stephen20Ollierpdf 50httpwwwdwrcymrucom_libraryleaflets_publications_english
205240txt012|May 2013
38
Drainage Strategy Framework
potential for effective storm water removal a flowareaflooding thematic map was developed This was used to focus attention on areas which would deliver the most benefit if storm water removal was carried out These areas are coloured red in Figure 16
Figure 16 Thematic map showing areas of maximum potential for storm water removal
The following interventions (181 in total) were combined into single strategy to be delivered in phases by 2015 2020 and afterwards
bull The management of surface water through swales basins and soakaways rather than through combined sewers resulting in new amenity and ecological areas within the built‐up environment
bull Implementing smarter flow control to better use existing storage and conveyance assets bull Relining of sewers to prevent groundwater ingress bull Removal of land drainage connections to sewers bull Household rainwater harvesting retrofit schemes
surface_water_management_strategypdf
205240txt012|May 2013
39
Drainage Strategy Framework
Figure 17 is an artistrsquos impression of what one of the sustainable urban drainage system solutions may look like
Figure 17 Example retrofit SuDS solution proposed for Gowerton and Llanelli
Modelling has demonstrated that the alternative strategy will achieve the same CSO reduction benefit as the storage strategy together with flooding improvements and additional less tangible benefits at significantly lower cost than the traditional sewer storage solution
Figure 18 illustrates the dispersed nature of solutions identified for central Llanelli
Figure 18 Water sensitive urban design interventions planned for central Llanelli
205240txt012|May 2013
40
Drainage Strategy Framework
Appendix A
Glossary
205240txt012|May 2013
Drainage Strategy Framework
Appendix A Glossary
CAPEX Capital expenditure Appointed water and sewerage companiesrsquo spending on new replacement or refurbished capital assets such as construction or buying machinery
CIWEM Urban Drainage Group (WaPUG) A group of the Chartered Institution of Water and Environmental Management supporting professionals working in urban drainage
Combined Sewer Overflow (CSO) The discharge of untreated sewage diluted with storm water into rivers and the sea CSOs occur during heavy rain and are necessary to reduce the risk of sewer flooding The physical overflow structure is also called a CSO
Common Framework for Capital A planning approach developed for the water and Maintenance Planning sewerage companies in 2002 which provides a robust basis
for assessing future capital maintenance needs The approach is consistent with the needs of Ofwat
Defra The Department for Environment Food and Rural Affairs The Government Department with responsibility for water flooding and water quality in England
Drainage Area Plan (DAP) A detailed plan for a drainage catchment that prioritises a list of interventions based on risk using an approach established in the WRc Sewerage Rehabilitation Manual This approach has been succeeded by Sewerage Risk Management which guides the preparation of Sewerage Management Plans (SMP) Companies vary in how they prepare DAPs or SMPs (or their equivalents) following the general principles that have been established
Drainage Strategy Developed by water and sewerage companies to demonstrate how outcomes will be delivered in drainage catchments over the long term Drainage Strategies will use the information developed in producing a DAPSMP and if a drainage strategy has been produced this should be the starting point in producing a more detailed DAPSMP should this be required It is likely that the activities required to prepare DAPSMP and Drainage Strategies may overlap Drainage Strategies might not refer to specific interventions but instead outline a general approach
Drainage Strategy Framework Guidance to describe the contents and intention of Drainage Strategies
205240txt012|May 2013
Drainage Strategy Framework
Flood Risk Management Plans Required by the Flood Risk Regulations in Flood Risk Areas by December 2015
Flood Risk Regulations The legislative instrument used to implement the requirements of the Floods Directive in England and Wales
Floods Directive DIRECTIVE 200760EC of the European Parliament and of the Council of 23 October 2007 on the assessment and management of flood risks
Lead Local Flood Authority (LLFA) The Shire County or unitary authority with responsibility for managing local flood risk
Local development plans Developed by planning authorities to explain where and what type of development (new homes and businesses) will occur within their area They are required to explain water infrastructure needs to support this development
Local Flood Risk Management Strategy Developed by the Lead Local Flood Authority to explain (LFRMS) how local flood risk will be managed by the Authority and
in partnership with others
Natural Resources Wales From 1 April 2013 Natural Resources Wales (NRW) a new body formed by the Welsh Government will take over the functions previously carried out by the Environment Agency (EA) in Wales alongside those of the Forestry Commission Wales and the Countryside Council for Wales
Ofwat The Water Services Regulation Authority ndash the economic regulator of the water and sewerage companies of England and Wales
OPEX Operating expenditure Appointed water and sewerage companiesrsquo day‐to‐day spending on running the services for example staff costs and power This is likely to include investment in joint projects that do not create or relate to an asset that the company solely or jointly owns
Outcomes Outcomes are the higher level objectives that a companyrsquos actions are intended to deliver A companyrsquos outcome should reflect its customersrsquo priorities identified through appropriate customer engagement and deliver the best long‐term sustainable solution for customers and the environment An outcome may not be bound by a single price control period and should be set in the context of customersrsquo and the environmentrsquos long‐term needs
205240txt012|May 2013
Drainage Strategy Framework
Price Review The process of setting appointed water and sewerage companiesrsquo price limits The next price review will take place in 2014 for the period 2015‐20 Ofwat currently sets price limits every five years
Real Time Control (RTC) Using actuated pumps gates and weirs to actively control flow in sewers Better use can be made of existing infrastructure and links can be made between network treatment and receiving water systems for operational benefits Sometimes referred to as Active Management
River Basin Management (Plans) River Basin Management is a continuous process of planning (to develop River Basin Management Plans) and delivery The Water Framework Directive introduces a formal series of 6 year cycles The first cycle will end in 2015 when following further planning and consultation the River Basin Management Plans will be updated and reissued
Sewerage Management Plan A risk based approach to indentifying investment needs in sewerage systems as described in the Sewerage Risk Management (SRM) approach developed by WRc plc
Storm water retrofit Releasing capacity in sewers by controlling stormwater at the surface using disconnection swales and other sustainable drainage systems (SuDS)
205240txt012|May 2013
We are the Environment Agency We protect and improve the environment and make it a better place for people and wildlife We operate at the place where environmental change has its greatest impact on peoplersquos lives We reduce the risks to people and properties from flooding make sure there is enough water for people and wildlife protect and improve air land and water quality and apply the environmental standards within which industry can operate Acting to reduce climate change and helping people and wildlife adapt to its consequences are at the heart of all that we do We cannot do this alone We work closely with a wide range of partners including government business local authorities other agencies civil society groups and the communities we serve
wwwenvironment‐agencygovuk
Environment Agency National Customer Contact Centre
Telephone 03708 506 506 enquiriesenvironment‐agencygovuk
Ofwat (The Water Services Regulation Authority) is a non‐ministerial government department We are responsible for making sure that the water and sewerage sectors in England and Wales provide consumers with a good quality and efficient service at a fair price
wwwofwatgovuk
Telephone 0121 644 7500 mailboxofwatgsigovuk
Halcrow Group Limited Burderop Park Swindon Wiltshire SN4 0QD
tel 01793 812479 fax 01793 812089 halcrowcom
Halcrow Group Limited is a CH2M HILL company Halcrow Group Limited has prepared this report in accordance with
the instructions of The Environment Agency for the clientrsquos sole and specific use Any other persons who use any information contained herein do so at their own risk
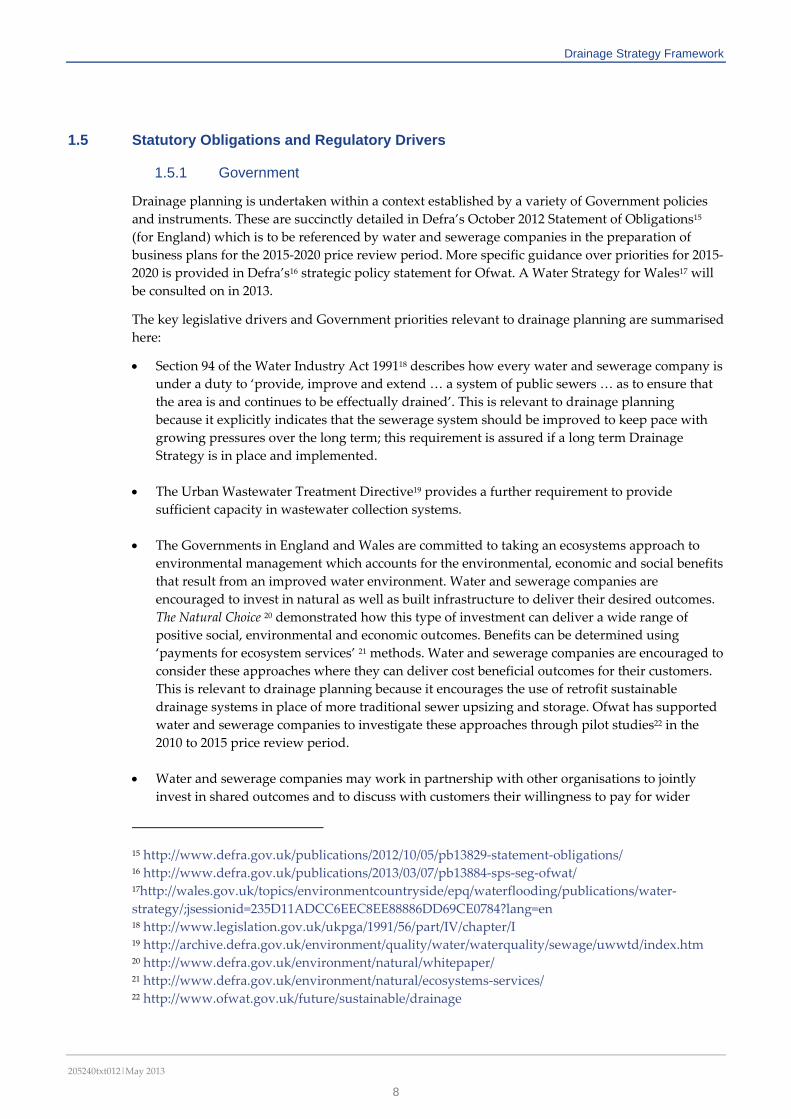
15
Drainage Strategy Framework
Statutory Obligations and Regulatory Drivers
151 Government
Drainage planning is undertaken within a context established by a variety of Government policies and instruments These are succinctly detailed in Defrarsquos October 2012 Statement of Obligations15
(for England) which is to be referenced by water and sewerage companies in the preparation of business plans for the 2015‐2020 price review period More specific guidance over priorities for 2015‐2020 is provided in Defrarsquos16 strategic policy statement for Ofwat A Water Strategy for Wales17 will be consulted on in 2013
The key legislative drivers and Government priorities relevant to drainage planning are summarised here
bull Section 94 of the Water Industry Act 199118 describes how every water and sewerage company is under a duty to lsquoprovide improve and extend hellip a system of public sewers hellip as to ensure that the area is and continues to be effectually drainedrsquo This is relevant to drainage planning because it explicitly indicates that the sewerage system should be improved to keep pace with growing pressures over the long term this requirement is assured if a long term Drainage Strategy is in place and implemented
bull The Urban Wastewater Treatment Directive19 provides a further requirement to provide sufficient capacity in wastewater collection systems
bull The Governments in England and Wales are committed to taking an ecosystems approach to environmental management which accounts for the environmental economic and social benefits that result from an improved water environment Water and sewerage companies are encouraged to invest in natural as well as built infrastructure to deliver their desired outcomes The Natural Choice 20 demonstrated how this type of investment can deliver a wide range of positive social environmental and economic outcomes Benefits can be determined using lsquopayments for ecosystem servicesrsquo 21 methods Water and sewerage companies are encouraged to consider these approaches where they can deliver cost beneficial outcomes for their customers This is relevant to drainage planning because it encourages the use of retrofit sustainable drainage systems in place of more traditional sewer upsizing and storage Ofwat has supported water and sewerage companies to investigate these approaches through pilot studies22 in the 2010 to 2015 price review period
bull Water and sewerage companies may work in partnership with other organisations to jointly invest in shared outcomes and to discuss with customers their willingness to pay for wider
15 httpwwwdefragovukpublications20121005pb13829‐statement‐obligations 16 httpwwwdefragovukpublications20130307pb13884‐sps‐seg‐ofwat 17httpwalesgovuktopicsenvironmentcountrysideepqwaterfloodingpublicationswater‐strategyjsessionid=235D11ADCC6EEC8EE88886DD69CE0784lang=en 18 httpwwwlegislationgovukukpga199156partIVchapterI 19 httparchivedefragovukenvironmentqualitywaterwaterqualitysewageuwwtdindexhtm 20 httpwwwdefragovukenvironmentnaturalwhitepaper 21 httpwwwdefragovukenvironmentnaturalecosystems‐services 22 httpwwwofwatgovukfuturesustainabledrainage
205240txt012|May 2013
8
Drainage Strategy Framework
benefits This is relevant to sewerage planning because it encourages water and sewerage companies to partner with local authorities to resolve complex storm water management problems (for flooding or pollution control) through the use of retrofit sustainable drainage systems The wider benefits to citizens outside of the water and sewerage companyrsquos customer base can be accounted for
bull The governments of England and Wales are promoting a catchment‐based approach23 to River Basin Management Planning to meet the water quality requirements of the Water Framework Directive (WFD)24 The important aspect of the approach is that all interested parties should work together to build consensus about the best way to improve water quality and habitats Water and sewerage companies should expect to be involved in the process of agreeing objectives and the apportionment of responsibility for delivering those objectives within the river basin districts they operate The central requirements of the Water Framework Directive are to prevent deterioration in water quality aim to achieve good chemical status and aim to achieve good ecological status It additionally seeks to limit the discharge of priority substances River Basin Management Plans will undergo consultation in the second half of 2014 and be published in December 2015 thereafter the programmes of measures included become statutory requirements and the Environment Agency (in England) and Natural Resources Wales will use permit and license conditions to ensure that water and sewerage companies deliver their agreed contributions This is relevant to drainage planning because misconnections blockages mechanical failure sewer flooding and combined sewer overflows (CSOs) can all contribute to the deterioration of water quality and the failure to achieve good ecological status or meet environmental quality standards for priority substances Climate change and growth may increase these risks but water and sewerage companies are not the only polluters and need to partner to ensure that outcomes are met Defra is consulting (closing February 2013) on developing its policies with respect to the control of diffuse urban pollution25
bull A revised Bathing Water Directive (20067EC)26 applies from 2015 and by then the Governmentrsquos aim is for all bathing waters to achieve at least lsquosufficient classrsquo this is approximately twice as stringent as requirements for the current Directive Subsequent planning should aim to achieve lsquogoodrsquo or lsquoexcellentrsquo classifications This is relevant to drainage planning because CSOs other wet weather intermittent discharges final effluent discharges and misconnections can all contribute to bathing water failures Climate change and growth may increase these risks but water and sewerage companies are not the only polluters and need to partner to ensure that outcomes are met
bull Under the Flood and Water Management Act (2010)27 water and sewerage companies (in England and Wales) must act in a manner consistent with the National Flood and Coastal Erosion Risk Management (NFCERM) Strategies28 for England and Wales and have regard to
23httpwwwdefragovukenvironmentqualitywaterlegislationcatchment‐approach 24httpwwwdefragovukenvironmentqualitywaterlegislationwater‐framework‐directive 25 httpwwwdefragovukconsult20121120water‐pollution 26 httpwwwenvironment‐agencygovukbusinessregulation107017aspx 27 httpwwwdefragovukenvironmentfloodinglegislation 28 httpwwwenvironment‐agencygovukresearchpolicy130073aspx
205240txt012|May 2013
9
16
Drainage Strategy Framework
Local Flood Risk Management Strategies29 NFCERM is based around six principles community amp partnership catchment based approach sustainability risk based planning beneficiary investment and delivering multiple benefits Companies should also co‐operate with local authorities and the Environment Agency in the exercise of their functions in relation to surface water management and combined sewers under section 94 of the Water Industry Act 1991 The Flood Risk Regulations 200930 implement the Floods Directive and give particular responsibilities to Lead Local Flood Authorities In lsquoFlood Risk Areasrsquo Lead Local Flood Authorities and the Environment Agency are expected to prepare Flood Risk Management Plans that set out flood risk management objectives and measures to manage risk from local flooding The Environment Agency is required to prepare Flood Risk Management Plans for the whole of England and Wales that cover flooding from main rivers the sea and reservoirs It is important for all risk management authorities to work in an effective way to plan to manage flood risk from all sources in a way that is well coordinated across catchments and coastal cells These duties are relevant to drainage planning because of the vital (but not unlimited) role surface water and combined sewers play in reducing flood risk in urban areas The Act also makes provision for the compulsory drainage of new developments through sustainable drainage systems (SuDS) and the lsquoright to connectrsquo being conditional on SuDS being approved by the SuDS Approval Body of the Lead Local Flood Authority
bull The Climate Change Act 200831 created a legal framework to cut greenhouse gas emissions and build the UKrsquos ability to adapt to a changing climate Water and sewerage companies are expected to reduce carbon emissions and adapt to the impact of climate change over the next decades The Government published its first UK climate change risk assessment in January 2012 and this will be updated every 5 years This is relevant to drainage planning because of the carbon embodied in new drainage infrastructure the carbon emitted during the pumping and treatment of sewage and the increase in flooding and pollution that will occur if climate change adaptations are not made The Government expects Ofwat to work towards the targets of its Adaptation Report and to ensure that its regulatory approach explicitly supports companies in adapting to climate change
bull From October 2011 the Water Industry (Schemes for Adoption of Private Sewers) Regulations 201132 transferred responsibility for existing private sewers and lateral drains to water and sewerage companies Pumping stations will be transferred by October 2016 This is relevant to drainage planning because of the significant increase in assets now within the responsibility of the water and sewerage company and the need to understand and respond to risks therein
Six Guiding Principles for a Drainage Strategy
This Drainage Strategy Framework describes good practice themed around six guiding principles Adherence to these principles will help ensure a Drainage Strategy which meets the expectations of Defra the Welsh Government the Environment Agency Natural Resources Wales and Ofwat and
29 The Local Government Association has published guidance on Local Flood Risk Management Strategies httpwwwlocalgovukcdocument_libraryget_fileuuid=a2538b94‐d3c1‐4cec‐81b0‐8aefd2996c5eampgroupId=10171 30 httpwwwenvironment‐agencygovukresearchplanning125459aspx 31 httpwwwdeccgovukencontentcmslegislationcc_act_08cc_act_08aspx 32 httpwwwlegislationgovukukdsi20119780111510933contents
205240txt012|May 2013
10
Drainage Strategy Framework
will be an essential means of communicating with customers and other partners Further details on each principle are described in Section 2 of this document along with examples of good practice
The six principles are
161 Partnership
Water and sewerage companies cannot develop optimal Drainage Strategies on their own and therefore partnership is key to developing and defining objectives performance indicators and the milestones that will need to be achieved in order to achieve measures that will demonstrate the delivery of outcomes Strategies should be developed and implemented in partnership with customers developers Lead Local Flood Authorities planning authorities the Environment Agency and Natural Resources Wales Strategies should align with (informing and informed by) River Basin Management Plans Local Flood Risk Management Strategies Flood Risk Management Plans and local plans (from planning authorities)
162 Uncertainty
Strategies should explain the reliability of data and knowledge about current and future performance of drainage systems They should explain what steps are planned to improve this understanding and how this will benefit customers Where future performance is uncertain (eg because of sensitivity to climate change) they should explain how adaptive approaches will be used to ensure outcomes are met The uncertainty in predictions of future risks should be recognised and accommodated within decision making
163 Risk based
Strategies should be risk based This means that planning operational and investment activities should be based on consideration of the probability and consequence of inadequate drainage function (risks) as these relate to the achievement of measures that demonstrate delivery of outcomes A risk based strategy ensures that investment is made where risks are the greatest
To aid communication risks should be visualised through maps and plans (Figure 10 is an example) To aid risk assessment risks should be monetised combined and predicted into the future To aid options appraisal the impact of interventions on the level of risk should be predicted
The approach to Drainage Strategy development should be risk based itself The degree of detail included should be related to an understanding of the overall level of risks in the catchment now and in the future
164 Whole life costs and benefits
Strategies should be informed by consideration of whole life costs and benefits They should promote a series of interventions which in view of the quantified uncertainties are most likely to result in performance indicators which demonstrate the achievement of outcomes at lowest cost to customers and the community more widely
Costs relate to capital and operational expenditure to deliver interventions and the monetised impacts of drainage failures such as flooding and pollution
Benefits relate to the reduction in risks from drainage failures such as flooding and pollution but should also include wider societal impacts such as those calculated using a lsquoPayments for Ecosystems Servicesrsquo approach
205240txt012|May 2013
11
17
Drainage Strategy Framework
When considering the lsquowhole lifersquo the strategy should consider climate population and asset deterioration trends These are likely to increase risks over the long term if no interventions are made The strategy should state lsquowhatrsquo should be done but also broadly lsquowhenrsquo and in what sequence interventions should happen
165 Live process
The Strategy should be adaptable and periodically reviewed Whilst outcomes are expected to be relatively stable over time the pace at which the strategy delivers outcomes will be linked to volatile influences (like climate and population change) and the decisions made at each price review about the priorities for the following period The strategy should be reviewed at regular intervals to reflect investments already made the changing priorities of the water and sewerage company and partners and the presence of emerging risks The review is also an opportunity to report drainage catchment performance relative to performance measures designed to monitor progress towards achieving outcomes
166 Innovative and sustainable
The framework promotes the full evaluation of alternatives to traditionally engineered sewerage solutions to test whether these offer lower whole life cost options or better responses to uncertainty It is anticipated that drainage solutions of the future will be different from the ones we are used to
These should include (at least at a high level) real time control or active management storm water retrofit techniques education to enable customers to change behaviour enhancing incentives for customers to reduce surface water flowing to sewers and innovative permitting arrangements across drainage networks and wastewater treatment works Water and sewerage companies should continue to review and develop other innovative solutions
For example where a company may historically have preferred to tackle sewer flooding or combined sewer overflow pollution by increasing its underground equipment to store more rainfall during storms it might consider other options in future such as working with customers to manage the rainfall close to source preventing it from entering the sewer system
Mapping the Framework to Current Planning Processes
We assume that practitioners will be following a broad and generic four‐stage planning process common to the Sewerage Risk Management (SRM5) and Surface Water Management Plan (SWMP) processes when preparing Drainage Strategies
Figure 4 is provided to guide water and sewerage companies in the development of Drainage Strategies It identifies each stage of the drainage planning process and highlights the good practice principles (colour coded by theme) in the locations through the process where it is most important that they are adopted
205240txt012|May 2013
12
e
u
t
v
b
DDrainage Strateegy Frameworrk
Initializepre
Establish partne and consultat
process
Define uncertai
Prepare risk d
Partnership
epare
rship ion
nties
ata
Ris
Co
Uncertainty
k assessmen
onsultation on risk issues
Quantify uncertainties
Quantify risks
Risk based
nt Options
Consult
Plan for
Demons life cost
Whole lif costs amp benefits
s appraisal
on options
uncertainties
strate whole and benefit
fe
s Live pro
Intervent
Aligned deliv collaborat solution
Innovative sustainab
Live and vis
cess Innova sustai
tion
ery amp ive s
and le
sible
ative amp nable
Figgure 4 Draina ge Strategy frramework prinnciples mappe d to the drainaage planning pprocess
118 WWho will bennefit from tthe Framewwork
Thhe Drainage Strategy Fraamework willl benefit
bull Water andd sewerage coompanies loooking to impprove their coompany speccific drainagge planning approach and make it fit for purpoose for the deelivery of lonng term outcoomes over mmultiple pricee review cyccles It will ppoint them toowards good practice andd provide exaamples as innspiration andd to promott ne innovation
bull Organisatiions and inddividuals lookking to enga ge with the ddevelopmen t of Drainagee Strategies and scruti nise progresss towards thhe achievemeent of outcommes associateed with enabbling growth adapting tto climate chhange managging floodingg and managging water poollution
22 DDrainagee Strateegy Frammeworkk Thhis section deescribes recoommended ggood practicee against eachh of the six kkey principle s necessary too develop a DDrainage Straategy For refference linkss are made too relevant annd establisheed planning prrocesses and emerging guuidance whicch drainage planners maay find usefuul These exammples are prrovided for innformation aand referenc e only
WWater and sewwerage comppanies shouldd work towaards developiing Drainagee Strategies wwhich apply thhese approachhes in a wayy that is consiistent with thheir needs annd those of thheir customeers and paartners Partnners should ttake note of tthis advice aand prepare tto engage wiith water andd sewerage coompanies on this basis
Thhe recommennded good ppractice is orgganised withhin each prinnciple as it wwould be appproached chhronologicallly in developping a Drainaage Strategy following thhe planning pprocesses alrready esstablished in the Seweragge Risk Manaagement anddor Surface WWater Managgement Plann mmethodologiess
2205240txt012|Mayy 2013
13
21
Drainage Strategy Framework
Principle One Partnership
Water and sewerage companies cannot develop optimal Drainage Strategies on their own and therefore partnership is key to developing and defining objectives performance indicators and the milestones that will need to be achieved in order to achieve measures that will demonstrate the delivery of outcomes Strategies should be developed and implemented in partnership with customers developers Lead Local Flood Authorities planning authorities the Environment Agency and Natural Resources Wales Strategies should align (informing and informed by) with River Basin Management Plans Local Flood Risk Management Strategies Flood Risk Management Plans and local plans (from planning authorities)
205240txt012|May 2013
14
Drainage Strategy Framework
211 Recommended good practice
No Good practice Example references
1 Engage with partners in a drainage catchment to bull Explain the purpose of developing a Drainage Strategy
and partnersrsquo roles in its success amp how each party will benefit from establishing a long term Drainage Strategy
bull Explain what outcomes are and how progress towards achieving them will be measured
bull Share data and information so that a shared understanding of risks and opportunities is developed
bull Explain what current drainage system performance is and how this is expected to change in the future Use risk visualisation tools to do this
bull Explain significant uncertainties and how these affect how interventions are delivered
Thames Water has demonstrated good practice through the development of its Counters Creek sewer flooding proposals This website describes the engagement process and how customers have been kept informed
2 Engage with the following partners in the development of the Drainage Strategy
bull Lead Local Flood Authority (the drainage area may include more than one) because of its responsibilities for local flood risk management and SuDS approval
bull Planning authority (the drainage area may include more than one) because of its role in determining the location and pace of housing development
bull Highways Authority because of the connection of highway runoff to public sewer systems
bull The Environment Agency (in England) because of its responsibilities for flood risk management (strategic overview) and ensuring good ecological quality is met in water bodies
bull Natural Resources Wales (in Wales) because of its responsibilities for flood risk management (strategic oversight) and ensuing good ecological quality is met in water bodies
bull Regional Flood and Coastal Committees who help develop a mutual understanding of flood and coastal erosion risks in an area
bull Bodies representing customers (eg Consumer Council for Water large local businesses flood action groups faith communities)
bull Bodies representing local environmental concerns (eg Wildlife Trusts Rivers Trusts)
bull Water only companies and water and sewerage company departments planning and operating water supply systems Water demand management practice can have an important impact on sewerage headroom
SWMP guidance (Chapter 2) advises on the establishment of partnerships for urban flood management and how to agree and align local objectives
3 Understand alignment of planning cycles and what this means locally (eg periodic review River Basin Management Plan Local Flood Risk Management Strategy Flood Risk Management Plan local plan)
205240txt012|May 2013
15
Drainage Strategy Framework
No Good practice Example references
4 Be alert to opportunities for joint solutions andor shared funding by understanding local plans for new development re‐development improving street furniture and public open space improving parks and green infrastructure Understand Lead Local Flood Authority and Environment Agency programmes for the management of flood and pollution risks
A guide to joint funding of local flood risk management intervention has been published by Defra33 and provides relevant advice to water and sewerage companies and other partners
5 Consider water and sewerage company funded solutions which deliver third‐party non‐sewerage assets that result in the long term least cost delivery of outcomes (eg water and sewerage company funding of household rain barrels and rain gardens to prevent surface water entering sewers)
6 Use data and mapping from the Environment Agency and Natural Resources Wales to understand exposure of drainage infrastructure to extreme events (eg coastal fluvial and surface water flood maps) so that network resilience can be understood and improved if this is cost beneficial
UKWIR has completed a project in 2013 lsquoResilience building a business case for PR14 and beyondrsquo
7 Work with LLFAs and the Environment Agency (or Natural Resources Wales) to understand the effectiveness of interventions at reducing risk and use this information to improve intervention planning
The UPM3 manual (section 7) advises on post project monitoring needs for water quality driven improvements
8 Share Drainage Strategies with partners and stakeholders so that there is transparency around challenges opportunities and the roles expected of different organisations
212 Good practice example ndash South West Water working with local authorities
These examples from South West Water illustrate how the company has worked with local authorities to coordinate investments and to share resources and skills in the development of integrated urban drainage management studies and Surface Water Management Plans
bull South West Water approached Devon County Council (DCC) to pool resources in delivering two (of five) pilot integrated urban drainage management studies (IUDMs) for Exeter and Exmouth South West Water took the lead role for Exmouth but DCC led in Exeter This engagement shared costs across organisations and has facilitated the production of full Surface Water Management Plans The collaboration has resulted in a shared understanding of the urban drainage challenges faced by both organisations and has opened dialogue around investment priorities
bull In Lyme Regis South West Water supported extensive coastal erosion defence works being carried out by West Dorset District Council by accelerating a programme of sewer rehabilitation and targeting renovation of sewers in vulnerable areas
bull In partnership with Cornwall County Council (CCC) and the Environment Agency South West Water has been working on a number of key drainage issues identified by CCC in its Preliminary Flood Risk Assessment (PFRA)
33 httprandddefragovukDefaultaspxMenu=MenuampModule=MoreampLocation=NoneampCompleted=0ampProjectID=17085
205240txt012|May 2013
16
Drainage Strategy Framework
bull In Camborne South West Water has taken the opportunity to invest in sewer separation works which align with the aims of the Camborne Pool Redruth urban regeneration group supported by Cornwall Council and to promote sustainable development economic growth and a strategic aim of lsquosewers for sewagersquo
213 Good practice example ndash Northumbrian Water partnership working in Tyneside
Northumbrian Water has led a sustainable sewerage study for Tyneside34 between 2010 and 2012 It is a good example of how partner organisations can collaborate to understand and resolve drainage issues in their urban area
Its approach was informed by the fact that a shared urban drainage problem around flooding and pollution was best addressed by a shared response from all the relevant organisations The project steering group involved representatives of Northumbrian Water the Consumer Council for Water the Environment Agency and five Lead Local Flood Authorities The urban drainage system collects wastewater for a single wastewater treatment works serving a population of over 900000
Working together the group studied the impact of growth urban creep and climate change on future urban drainage issues Figure 5 illustrates how a city‐wide map of potential problem areas was generated by the project team sharing data on sewer capacity (from Northumbrian Water) population change (from the local authorities) and river flooding (the Environment Agency) It was predicted that future problems were more likely to occur in the darker shaded areas These became focus areas for the project where a range of traditional and novel drainage solutions were tested
Figure 5 Future drainage problem areas indentified through data sharing
34httpcommunicatoremailcomINfNLOjNRayfOA1rfrfYcdK‐S7UwRcYcNoWebViewaspx
205240txt012|May 2013
17
22
Drainage Strategy Framework
The project team was keen to promote its work to customers and the community and prepared a series of newsletters updating interested parties on progress and issues An example is illustrated in Figure 6
C lic k here if y ou are hav in g d if f ic u lties v iew ing th is new s letter
Ho m e A b o u t u s M e d ia ce n tre C o n tact
Issue 2
Ap ril 2012
In th is ed ition U n d e rs tan d in g th e fu tu re
S u s tain ab le d ra ina g e o p tio ns
F ind ou t more about Th e 2 0 1 1 an n ua l re po rt
Ou r e n viro n m e n ta l p o licy
Ou r co rp o ra te re sp o nsib il i ty s tra te g y
W e lcom e to th e s e con d e ditio n o f S u sta inab le se we ra g e a s ix-m on th ly n e ws le tte r p ro d u ce d to b ring yo u th e la te s t n e ws on o u r m a jo r s tud ye xp lo rin g s us tain ab le s ew e ra ge o p tions in th e Tyn e s id e a rea I h o p e yo u fin d th e in fo rm a tio n o f in te res t a n d wo u ld w e lcom e fe e db a ck o n an y o f th e issu es ra ise d
Ric ha rd W a rne ford W a s te wa te r Dire c tor
U nderstand ing the fu tu re W e a ll kn o w th e difficu lties o f a ccu ra tely p re d ic tin g th e fu tu re h ow e ve r ifw e a re to p re pa re fo r i t th e n it is s om e thin g we m us t a tte m p t As p a rt o f th is s tu d y w e a re co ns id e rin g w ha t d em a nds w ill b e p la ce d on th e d ra ina g e s ys tem s a t 2 0 20 a n d a t 2 0 50 in co rpo ra ting g ro w th u rba n cre e p a nd c lim a te cha n ge B y w o rk in g close ly w ith o u r p a rtn e rs an d u s in g th e la tes t te ch n ical res e a rch we h a ve d e ve lo p ed a n d com p u te rm od e lle d a num b e r o f s ce na rios to id en tify a n d d e fin e fu tu re ris ks Th es e ris ks in c lud e p red ic tions o f p o te n tia l floo d in g p o llu tion o r b a rrie rs to g ro w th N o w th a t w e be tte r u n d e rs ta nd th e iss u es we a re a ble to p re pa re p la ns p rom o ting o p po rtu n ities fo r s us ta in a ble d rain ag e s ys tem s in o rde r to d e live r th e b es t p oss ible s e rvice fo r o u r cu s tom e rs b a la n ced a g ains te n viro nm e n tal n e eds a n d cos ts
S usta inab le d ra inage op tions W e b e lie ve o u r a pp ro a ch re p res en ts go o d p ra ctice fo r th e m a n ag em en t o f s u rfa ce wa te r w h ich is to d ea l w ith th e s u rfa ce wa te r as c los e to s ou rce as p oss ib le A w id e ra n g e o f p o te n tial o p po rtu n ities a re b ein g id e n tifie d in c lu d in g lo ca l a n d s tra te gic o p tions
S tra te g ic o p tions a re typ ica lly la rg e r th a n th e lo ca l on es a nd in c lu d e fe a tu res s u ch as a re as o f la nd w h ich w o uld b e a llo we d to flo o d d u rin g he a vy ra in (s a crific ial s to ra g e ) a n d p e rm a n en t w e tla nd fe a tu res
L o ca l op tio ns d esp ite b ein g sm a lle r th a n th e s tra te gic o n es w ill s til l p la y a ke y ro le in th e p ro vis io n o f s us tain ab le d ra ina g e Th e ir n a tu re m e a ns de p lo ym e n t co u ld be m o re w id es p re a d th a n s tra te gic o p tions fe a tu res su ch as w a te r b u tts ra in g a rde ns a nd p e rm e ab le pa vin g co u ld b e re la tive ly e a s y to fi t in to
Figure 6 Newsletter promoting urban drainage partnership working
Principle Two Uncertainty
Strategies should explain the reliability of data and knowledge about current and future performance of drainage systems They should explain what steps are planned to improve this understanding and how this will benefit customers Where future performance is uncertain (eg because of sensitivity to climate change) they should explain how adaptive approaches will be used to ensure outcomes are met The uncertainty in predictions of future risks should be recognised and accommodated within decision making
205240txt012|May 2013
18
Drainage Strategy Framework
221 Recommended good practice
No Good practice Example references
1 Data analysed and used in the development of the strategy related to asset location dimensions condition failure and flood and pollution incidents should be assigned a confidence grading The confidence grading should be related to its accuracy completeness compatibility credibility and currency
Models used to predict blockages and collapses flooding locations polluting discharges and water quality impacts should be assigned a confidence grading based on their accuracy completeness compatibility credibility and currency
Model predictions should be assigned a confidence grading depending on the confidence in the model and whether it is being applied outside of its verification range (eg for extreme events or for atypical geographies)
The purpose of confidence grading data and model results used in strategy setting is to understand the likelihood that outcomes will be achieved in a cost efficient manner Where the outcomes remain uncertain knowledge of data confidence can be used to target improvement programmes
SRM5 (S3‐03‐17) refers to Ofwatrsquos method for recording the reliability and accuracy of regulatory data in bands A to D
The SWMP guidance (Section 319) describes an alternative system of grading data and model results
2 Use the Drainage Strategy to justify data and model improvement programmes This should be focussed on areas where risks are currently (or predicted to be) high and uncertainty in data or models reduces the ability to determine robust operational or capital solutions Poor model verification in high risk areas would be an indicator that model improvements were required
CIWEMrsquos urban drainage group has published a series of guides on hydraulic and water quality modelling They discuss model calibration verification and uses
SRM5 (S3‐04) describes how to determine where the current assessment of risk is sufficient to proceed or whether data and models should be improved
3 Improve understanding of network performance (and improve models) by using long term flow and level monitoring on sewers and CSOs
Yorkshire Water discusses its CSO
monitoring programme here
4 Demonstrate how the uncertainty in both the underlying datamodels and in the future projections is addressed in options appraisal Consider if this should be done implicitly (eg through choosing conservative assumptions) or explicitly through the use of sensitivity analysis or scenario testing
Treasury Green Book supplementary guidance illustrates how to accommodate climate change uncertainties
205240txt012|May 2013
19
Drainage Strategy Framework
No Good practice Example references
5 Population growth new homes and businesses climate change and urban creep combine to make the future highly uncertain but will almost certainly increase flooding and pollution risks from drainage systems Use the Drainage Strategy to explore different scenarios (combining the impact of these drivers) for a near term (le 10 years) and future (ge 30 years) epoch
For example combine modest growth and slight climate change (a low impact case) and contrast with high growth and significant climate change (a high impact case) Where the location of significant new development is unknown include scenarios accommodating different possibilities
Running multiple scenarios is time consuming and costly A risk based approach should be adopted to focus efforts where flooding and pollution risks are especially sensitive to changes in demand
UKWIR has published research on accounting for climate change35 and urban creep36 in sewerage planning together with more general advice on accommodating climate change in water asset management planning37
Ofwat has published research38
predicting the combined impacts of climate change urban creep and development on a national basis
6 In the face of significant uncertainties about future demands on the drainage system and their consequences the Drainage Strategy should identify low‐regrets interventions (ie ones that are robust no matter what the future holds) and ensure that solutions can be adapted if greater certainty is achieved For example through quickening the pace of SuDS retrofit activities or using (previously identified and secured) land to extend underground storage facilities Strategies which remove surface water from sewerage networks provide lsquoheadroomrsquo for unpredictable increases in demand from population and climate change
Designing Resilient Cities A guide to good practice DR Lomardi et al HIS BRE Press
7 Post project appraisal and cost monitoring should be used to capture real costs and performance so that Strategies can be updated and improved with latest information It is especially important to collate and understand the whole life costs of new technologies where industry understanding is currently poor
35httpwwwukwirorgreports03‐cl‐10‐09042794658901799019890198 (poundpound) 36httpukwirforefront‐librarycomreports10‐wm‐07‐1493273 (poundpound) 37httpukwirforefront‐librarycomreports12‐cl‐01‐1694816900019015590145901409465890155 (poundpound) 38httpwwwofwatgovuksustainabilityclimatechangerpt_com201106mottmacsewerpdf
205240txt012|May 2013
20
Drainage Strategy Framework
222 Good practice example ndash Severn Trent Waterrsquos MICAS
Severn Trent Water has developed a process to measure confidence in hydraulic models of sewer systems Modelling Investment Confidence Assessment Scoring (MICAS) was developed to provide an objective evaluation of model confidence It uses information stored in the hydraulic model about the provenance of each data element and the quality of model verification Before the approach was developed the assessment of lsquofitness for purposersquo of models was subjective and based on modellers judgment This was not always reliable and certainly not repeatable and transparent MICAS provides an objective assessment of hydraulic model quality which can be used to inform its use and prioritise improvements to input data and model verification
Figure 7 and Figure 8 illustrate how an understanding of model confidence from the MICAS assessment (right hand side images) can be used to interpret predictions of flooding (left hand side images) In Figure 7 areas at predicted high risk of flooding (red in the left hand side image) are shown to be in high confidence areas of the hydraulic model (green in the right hand side image) In contrast in Figure 8 areas at predicted high risk of flooding (red in the left hand side image) are shown to be in poor confidence areas of the hydraulic models (orange in the right hand side image) In the latter case this information is used to identify where further model improvements would be beneficial
Flood Risk MICAS
Figure 7 Modelled flood risk and MICAS confidence scores (high model confidence)
Flood Risk MICAS
Figure 8 Modelled flood risk and MICAS confidence scores (lower model confidence)
205240txt012|May 2013
21
23
Drainage Strategy Framework
Principle Three Risk Based
Strategies should be risk based This means that planning operational and investment activities should be based on consideration of the probability and consequence of inadequate drainage function (risks) as these relate to the achievement of measures that demonstrate delivery of outcomes A risk based Strategy ensures that investment is made where risks are the greatest
To aid communication risks should be visualised through maps and plans (Figure 10 is an example) To aid risk assessment risks should be monetised combined and predicted into the future To aid options appraisal the impact of interventions on the level of risk should be predicted
The approach to Drainage Strategy development should be risk based itself The degree of detail included should be related to an understanding of the overall level of risks in the catchment now and in the future
231 Recommended good practice
No Good practice Example references
1 Determine where a Drainage Strategy is required by combining current performance with external influences likely to result in deteriorating performance This stage requires no modelling or detailed assessment On a catchment‐by‐catchment (drainage area) basis understand current risks by collating data on current performance eg blockages collapses pumping station failures pollution incidents CSO spills storm tank spills internal flooding incidents external flooding incidents and infiltration rates Relate these risks to performance indicators and the achievement of outcomes Combine with information about known growth rates predictions of urban creep quantity of newly adopted lsquoprivatersquo sewers surface water flooding risks (eg from flood map for surface water) WFD water body status and bathing water status Prioritise catchments with high current risks andor factors suggesting that risks are likely to worsen significantly in the future Consider normalising scoring method for size of catchment (eg by unit area or unit length of sewer) Consult with stakeholders to confirm correct prioritisation Commence with development of Drainage Strategies for the highest ranked catchments Periodically revisit prioritisation (updating with new data) to check that priorities are still correct
The initialisation stage of a Sewer Management Plan (SMP) (described in SRM5) considers how a risk assessment can be used to prioritise which spatial units (eg catchments) should be prioritised for a SMP study
2 Visualise catchment risks (from 1) to illustrate and explain to partners the reasons for prioritisation Accommodate their views amp consider changing prioritisation to aid wider drainage planning requirements (eg increase prioritisation of a catchment with significant surface water flooding problems where close collaboration between water and sewerage company and LLFA will benefit the community)
205240txt012|May 2013
22
Drainage Strategy Framework
No Good practice Example references
3 Clearly relate sewerage risks to the performance indicators that will be used to measure progress towards achieving outcomes eg relate blockage rates to flooding and pollution incidents eg relate increase in flows to increased CSO frequency breaches of permit conditions and deterioration in receiving water quality Adopt a sourcendashpathway‐receptor model and workshop techniques to ensure that cause effect and consequences are fully captured Use performance indicators as the basis for a comprehensive risk assessment that considers likelihood (frequency) and consequence (extent degree and duration of impact) of failure expressed as risk scores Monetise risks in GBP (pound) to align with principle four (whole life costs amp benefits) Use (verified) predictive models to understand near term (lt10 years) and long term (gt30 years) risks The latter to align with principle four (whole life costs amp benefits) Align complexity of method with level of risk recognising the needs of partners eg use complex 2D flood routing models to ascertain (with greater certainty) flood mechanisms and damages where the quantity and frequency of flooding is high and interventions will be complex and costly Elsewhere more simple approaches are appropriate eg use complex UPM3 water quality modelling methods where compliance with river standards or discharge consents is already failing or is expected to do so Elsewhere more simple approaches are appropriate Combine risk scores from different risks to describe the total level of risk in a catchment Use visualisation techniques to communicate combined level of risk Combine analysis from hydraulic blockage and asset deterioration models on a catchment basis In hydraulic analysis consider flooding performance for rainfall events beyond the usually provided standard of protection to understand performance in extreme events in support of partners (especially LLFAs) and in search of cost beneficial interventions at a higher standard than normal
SRM 5 (S3‐03) details approaches to simple and more complex approaches to risk assessment that are consistent with CMPCF guidelines
4 Be alert to interactions between sewer networks and wastewater treatment plans eg by modelling the impact of changing sewer flows on wastewater treatment worksrsquo performance and costs Consider combined impact of different catchments on a single or linked water body (eg an inland river bathing water or shell fishery)
UPM3 guidance discusses approaches to understanding these interactions and applying more complex water quality impact models
5 Establish systems and apply methods to predict how interventions can reduce risks eg how a targeted and pro‐active maintenance can reduce the occurrence of sewer blockage and flooding from lsquoother causesrsquo eg how reducing infiltration can reduce CSO spills eg how reducing connected impermeable area can reduce sewer flooding
205240txt012|May 2013
23
Drainage Strategy Framework
232 Good practice example ndash United Utilities risk assessment
United Utilities has demonstrated a robust risk based approach in the development of sewerage management plans used for long term planning across their area of operations
Hydraulic models were applied in 235 catchments and configured to look at future performance and to evaluate the consequences of inadequate capacity Starting from a baseline of 2010 versions of the models were built for 2020 and 2036 epochs The following model input parameters were adjusted population water consumption infiltration planned development known sewerage improvement projects urban creep rainfall (for climate change)
Two‐dimensional (2D) modelling was used to consider the consequences of sewer flooding resulting from the changes made to reflect the future operating environments As well as the impact on homes and business (from internal and external flooding) the flood risk to critical infrastructure was also considered The operation of CSOs was considered by computing the annual spill volume duration and frequency
Finally predictions of the likelihood and consequence of sewer failure were added taking account of sewer material age and the incident records relating to similar assets
All these data were combined and weighted to generate a Sewer Management Plan (SMP) Risk Score for each length of sewer The process is illustrated in Figure 9
Figure 9 United Utilitiesrsquo process for calculating risk score in sewerage catchments
205240txt012|May 2013
24
Drainage Strategy Framework
Risk scores were summed spatially and monetised so that high priority locations could be identified Mapping and visualisation were used to communicate the results of this assessment priority areas for further investigation and how risks change through time (Figure 10)
Figure 10 Visualisation of sewerage risks
233 Good practice example ndash Northumbrian Water risk assessment
Northumbrian Water completes an annual assessment of hydraulic capacity in its sewerage network at the drainage area scale Its approach does not require hydraulic models to have been completed and yet can reliably highlight areas of under‐capacity in need of further investigation through more detailed analysis including hydraulic modelling New and emerging risk areas can also be identified by applying data for population growth which occurs through development lsquoWhat ifrsquo scenarios can be run to test when capacity limits may be overcome and flood risks potentially set to increase It demonstrates good lsquorisk basedrsquo planning principles because it shows the drainage planner where more detailed analysis is warranted
The approach uses the following data from company records population connected to sewer P water consumption rate G (lhd) trade discharge E (ls) pipe diameter and gradient pipe connectivity CSO consent pass forward rate (ls) pumping station rate (ls) sewage treatment flow rate (ls) A wastewater dry weather capacity map calculates pipe full capacity dry weather flow (PG+E+I) and Formula A flow for fully combined (1360P+2E+DWF) and separate (4PG+3I+E) areas of the network Infiltration (I) is assumed to be 50 PG +E
205240txt012|May 2013
25
Drainage Strategy Framework
A theoretical assessment of network capacity is then calculated by comparing Formula A with pipe full capacity flow consent values at CSOs and wastewater treatment works and pumping rates This determines areas of the network with a capacity shortfall with a potential capacity shortfall and with no capacity shortfall
When run across the whole company area approximately 100 out of 500 drainage areas were found to be under capacity Over 60 of these areas had recorded sewer flooding incidents In over 300 drainage areas there was no forecast capacity shortfall Only 7 of these drainage areas had recorded sewer flooding incidents Overall the system proved to be very reliable at predicting drainage areas likely to have sewer flooding problems because of sewer under‐capacity
In under capacity drainage areas an intermediate (hydraulic model based) assessment is then carried out Figure 11 shows the results thematically mapped for an example drainage area Red areas are predicted to have a very high risk of sewer flooding Yellow and green areas are predicted to have a low risk of sewer flooding
Figure 11 Example of a drainage area capacity map
205240txt012|May 2013
26
24
Drainage Strategy Framework
Principle Four Whole Life Costs and Benefits
Strategies should be informed by consideration of whole life costs and benefits They should promote a series of interventions which in view of the quantified uncertainties are most likely to result in performance indicators which demonstrate the achievement of outcomes at lowest cost to customers and the community more widely
Costs relate to capital and operational expenditure to deliver interventions and the monetised impacts of drainage failures such as flooding and pollution
Benefits relate to the reduction in risks from drainage failures such as flooding and pollution but should also include wider societal impacts such as those calculated using a lsquoPayments for Ecosystems Servicesrsquo approach
When considering the lsquowhole lifersquo the strategy should consider climate population and asset deterioration trends These are likely to increase risks over the long term if no interventions are made The strategy should state lsquowhatrsquo should be done but also broadly lsquowhenrsquo and in what sequence interventions should happen
241 Recommended good practice
No Good practice Example references
1 Predict risks into the future for at least two epochs le10 years (to understand what the company needs to do now and how this fits with longer term outcomes) and ge30 years to understand long term needs in light of changing population and other pressures
Account for the following changes in demand
bull Growth ‐ new homes and businesses
bull Urban creep ndash uncontrolled addition of connected impermeable area
bull Climate change ndash affecting design events (flood predictions) time‐series (CSO and treated effluent quantities) river flows and temperatures
bull Infiltrationexfiltration ndash through deteriorating sewer condition
bull Dry weather flows ndash through changes in water consumption rates
2 Combining monetised risks (associated with sewerage failures) determine whole life costs for a lsquodo nothingrsquo scenario (ie no interventions)
Include costs associated with electricity consumption (in the network and at the wastewater treatment works) and CO2 emissions
UKWIR will publish in 2014 a revision to their Long Term Least Cost Planning for Wastewater Supply‐Demand
guidance This may provide tools and methods for expressing costs and benefits to support the development of a Drainage Strategy
205240txt012|May 2013
27
Drainage Strategy Framework
No Good practice Example references
3 Test intervention strategies which keep performance indicators on track to deliver outcomes by adding capacity (supply) reducing flows (demand) or altering operational regimes
Include the costs of interventions and the benefits of reduced risks to inform selection of the most cost beneficial strategy over the whole life
Have regard to the timing of interventions recognising that uncertainty may require low‐regrets (insensitive to uncertainty) solutions and that delaying major interventions may be more affordable and attractive in the short term Discounting should be used to compare the costs and benefits of interventions occurring at different times
Recognise that some interventions will be obligatory and defined (eg maintenance of a spill frequency standard at a CSO) whilst others will be more discretionary focused on achieving outcomes rather than specific outputs
SRM5 (Section 8) defines and contrasts cost benefit analysis cost effectiveness analysis whole life cost analysis and risk cost benefit analysis
HM Treasury Green Book39
sets out a framework for the appraisal of long term projects which can be applied to the development of a Drainage Strategy
4 Donrsquot at first be concerned with the distribution of costs and benefits between partners who may be sharing costs Identify the most cost beneficial solution first and then debate and agree an equitable sharing of costs
Give equal weighting to OPEX (operating expenditure) and CAPEX (capital expenditure) costs so not to cause bias towards capital intensive solutions Properly consider the costs and benefits of pro‐active maintenance regimes and campaigns to influence customers to reduce fats oils and greases (FOG) build‐ups and the misuse of sewers
Consider the affordability of solutions the impact on customersrsquo bills and the resources of other organisations to play their part
UKWIR research outputs40 in 2013 (SW01) will provide a framework for making a business case for separating storm water from combined sewers
5 Where interventions include the provision of green space public amenity and improved habitats then Payment for Ecosystem Services approaches should be used to identify further monetised benefits in the appraisal Customers should be consulted to help value these benefits
Supplementary Green Book41
guidance describes methods for accounting for environmental impacts including the ecosystems approach
39 httpwwwhm‐treasurygovukdata_greenbook_indexhtm 40 httpwwwukwirorgpublishorsystemcomponent_viewaspLogDocId=96116 41 httpwwwhm‐treasurygovukdaccounting_environmental_impactspdf
205240txt012|May 2013
28
Drainage Strategy Framework
242 Good practice example ndash Severn Trent Water making the case for surface water separation in Stoke-on-Trent
In this example42 Severn Trent Water compared alternative ways of addressing sewer flooding problems by looking at a range of costs and benefits not all of which were directly associated with its specific responsibilities as a water and sewerage company Whilst the example does not express a monetised value for all costs and benefits over the whole life it does illustrate the types of factors which could be included in an appraisal of this type scaled to address problems at a catchment level It also demonstrates how working collaboratively can help identify solutions which are cost‐beneficial for the community at large
In an area of Stoke served by a combined sewer system five properties were at risk from sewer flooding in cellars for events equal to and less frequent than the 1 in 10 year probability A conventional sewer pumping station based solution was presented as the standard option
However a nearby former hospital site was also undergoing re‐development which would result in reduced runoff to the combined sewer The new drainage regime in the redevelopment site was sufficient to remove the flood risk at the five properties (this was a do nothing strategy)
A third option completely separated the development site runoff from the combined sewer and also addressed local flood risk issues nearby The solution required a new storm sewer and a network of swales and other SuDS features connecting with an ordinary watercourse
Table 1 illustrates how costs and benefits were compared across the three alternative strategies Each provided the same benefit in terms of the number of homes (5) relieved from sewer flooding The novel SuDS and surface water management solution additionally gave local flood risk relief to 3 further properties The separationSuDS strategy came at a higher capital cost but delivered greater social cost benefits savings in annual operating costs and a bonus improvement water quality (because of reduced CSO spill volume) Severn Trent selected the separation SuDS solution because the higher capital costs were offset by other benefits
Table 1 Costs and benefits of drainage improvements in part of Stoke-on-Trent
Do nothing Standard option
SuDS
Sewer flooding benefits 5 5 5
Other flooding benefits 0 0 3
Change in runoff to combined sewer (m3year) 0 0 ‐40000
Estimated cost (pound) 0 168000 419000
42httpwwwciwemorgmedia695460Paper203_Creating20Sewer20Capacity_Presentation2 0by20Mike20Woodpdf
205240txt012|May 2013
29
Drainage Strategy Framework
Do nothing Standard option
SuDS
Social Cost Benefit (pound) 16000 5000 51000
Change in electricity costs (poundyear) 0 +75 ‐525
Programme impact (years to deliver solution) + 4 0 +4
CSO spill volume (m3 in 1year event) +298 0 ‐397
243 Good practice example ndash New York City comparison of grey and green infrastructure drainage strategies
This example is taken from New York in the United States of America Itrsquos an illustration of how whole life costs have been compared for alternative strategies to solve urban drainage issues on a mega‐city scale The key data are summarised in Table 2
Table 2 Comparing drainage strategies in New York
Grey Strategy
Green Strategy
CSO spill volume reduction (billion gallons year)
101 122
Wider benefits over 20 years ($ million) 0 139 to 418
Whole life costs over 20 years ($ billion) 68 53
The information is taken from the New York City Green Infrastructure Plan43 produced by the Mayorrsquos Office in 2010 The Plan (and recent updates) provides a comprehensive evidence base around costs and benefits of different approaches to address the cityrsquos drainage problems It is therefore an excellent example of how drainage strategies can be described in plain language for a non‐specialist audience concerned with their environment and the cost of providing infrastructure to enhance it
It is becoming commonplace for North American cities (eg Portland and Philadelphia) to address the issue of frequent combined sewer overflow (CSO) operation by using a combination of grey infrastructure (sewers) and green infrastructure (sustainable drainage systems) The wider health
43 httpwwwnycgovhtmldephtmlstormwaternyc_green_infrastructure_planshtml
205240txt012|May 2013
30
25
Drainage Strategy Framework
and ecological benefits of green infrastructure approaches and the reduced reliance on materials and energy are attractive to utility planners and cities alike
New York has 422 CSOs and an agreed Long Term Control Strategy to significantly reduce the impact wet weather discharges have on aquatic systems throughout the city Annual discharges are currently (2010) estimated to be 30 billion gallons (114 million cubic meters) per year Building on existing and committed new sewer plans an agreed grey infrastructure based strategy to this problem is set to reduce these discharges to 198 billion gallons per year (a 34 reduction) by the 2030s An alternative green infrastructure approach based around intercepting the first inch (25mm) of rainfall across 10 of the impermeable city area by 2030 is predicted to reduce CSO spills to 179 billion gallons per year
Planners have calculated that the whole life costs after 20 years of the grey infrastructure solution will be $68 billion (2010 prices) compared to the green infrastructure whole life costs of $53 billion The green infrastructure strategy reduces CSO spills by more than the grey alternative for $15 billion less in terms of whole life cost Further planners have calculated that New Yorkers will benefit by up to $41844 million (accumulated over 20 years) in additional benefits associated with lower energy bills from control of urban heating increased property values and improved health
Based on this analysis New York City has committed itself to an aggressive green infrastructure based runoff control strategy to provide long term reductions in CSO spills The plan is to achieve interception of 15 of impermeable area by 2015 4 by 2020 7 by 2025 and 10 by 2030
Principle Five Live Process
The Strategy should be adaptable and periodically reviewed Whilst outcomes are expected to be relatively stable over time the pace at which the Strategy delivers outcomes will be linked to volatile influences (like climate and population change) and to the decisions made at each price review about the priorities for the following period The Strategy should be reviewed at regular intervals to reflect investments already made the changing priorities of the water and sewerage company and partners and the presence of emerging risks The review is also an opportunity to report drainage catchment performance relative to performance measures designed to monitor progress towards achieving outcomes
44 Estimated using methods from the New York Municipal Forest Resource Analysis (MFRA) prepared by the US Dept of Agriculture
205240txt012|May 2013
31
Drainage Strategy Framework
251 Recommended good practice
No Good practice Example references
1 Regularly repeat screening exercise to determine catchments requiring a Drainage Strategy and modify programme of Strategy development accordingly
Check for changes in measured rates of flooding and pollution incidents blockages collapses pumping station failures etc
Check for changes in extent and location of new development
Check for activities being undertaken by partners (eg redevelopment urban realm improvements and flooding and pollution management activities)
SRM5 illustrates how improved and updated knowledge of system performance should be applied to establish Strategies
2 In lsquolive Strategiesrsquo repeat risk assessment when data and models improve and adjust confidence scores accordingly
Confirm that Strategy will still achieve performance indicators and outcomes at least cost Revise Strategy as necessary
3 Periodically refresh Strategy accommodating impact of interventions already delivered using re‐verified predictive tools as appropriate
Confirm that Strategy will still achieve performance indicators and outcomes at least cost Revise Strategy as necessary
Triggers for a wholesale review of the Strategy are likely to be significant changes to the location or extent of planned development
4 Monitor report and share (with partners) the measures used to demonstrate delivery of outcomes Example measures may include the number of properties which experience sewer flooding the number of properties at risk of flooding the number of properties at risk from sewerage asset failure risk indices that capture both the probability and consequence of failure customer satisfaction with regards to clean rivers and beaches the number of pollution incidents the frequency of combined sewer overflow operation and compliance with discharge permit conditions
252 Good practice example ndash Thames Water live DAP
Thames Water has initiated a DAP (drainage area plan) Live approach Itrsquos a good example of how companies are continuously monitoring and updating the status of drainage area risks It provides a lsquoliversquo snapshot of the current health of all drainage areas in Thames Waterrsquos region allowing real time planning as part of a strategic approach It enables drainage planners to view the effectiveness
205240txt012|May 2013
32
Drainage Strategy Framework
of intervention strategies and compare incident rates across varying geographies and development types in the Thames Valley
DAP Live will be available for all catchments in the Thames Water area thus enabling
bull high level monitoring of risks across the business bull a live and strategic review of catchment performance bull prioritisation of catchments based on risk and bull an ability to share data with partners collaborating in drainage planning and improvements
Figure 12 illustrates the types of data managed through the DAP Live system These include asset data political and drainage boundaries environmental data operational data property amp growth data and modelling data As new data become available the DAP Live system is updated so that drainage planners have the most current view on emerging risks and issues
Asset data
Operational data
Property and growth data
Modelling data
Environmental data
Boundaries (SDACs operational political)
Figure 12 Data types held in the DAP Live system
Figure 13 illustrates how the system can provide analysis at a variety of scales from local authority boundaries sewage treatment works catchments drainage areas or a regular grid
205240txt012|May 2013
33
Drainage Strategy Framework
NE PROVINCES
WESTERN PROVINCES
NE LONDON bull Ops areas local W LONDON
SE LONDON authorities Large TIDWORTH SE PROVINCES
bull STW Catchments
bull Drainage areas(SDACs)
bull Regular grid Small
Figure 13 DAP Live reporting performance at different scales
205240txt012|May 2013
34
Drainage Strategy Framework
253 Good practice example ndash Wessex Water Water live data
Wessex Water is regularly using data geospatially to proactively identify and respond to risk Theirs is a good example of how data can be used to provide an adaptable approach that is regularly reviewed to plan investment
The risk‐based and live approach uses a set of likelihood and consequence models which are built up from all currently available data asset data (eg CCTV data material age) operational data (eg flooding and pollutions incidents) and information (eg locality near hospital or downstream of an overflow) All these data are collated for the entire Wessex region updated regularly and analysed geospatially
Figure 14 Sewer risk scores presented in a risk matrix and geospatially
This allows a risk score (Figure 14) to be calculated for each mapped sewer length which directs investigation more efficiently by allocating each mapped sewer a planned CCTV inspection date
This risk‐based approach has been successful in targeting problematic sewers increasing identification rates threefold Density analysis is performed using asset failure and operational information which allows planning of both proactive structural and operational investment
Proactively found structural issues are far more cost effective to repair before failure and can also prevent serviceability issues
205240txt012|May 2013
35
f
DDrainage Strateegy Frameworrk
Figgure 15 Hotsppot analysis
Thhe hotspot annalysis (Figuure 15) showss where operrational clustters have beeen calculatedd This hootspot analyssis is made aavailable on tthe Wessex WWater corporrate GIS to a llow operati onal staff to target their effforts to mitiggate against ffurther repeaat incidents AAdditional innformation ffrom asset annd operationnal activities ccan be addedd regularly too the databasses which drrive the mod els enabling rissk scores to bbe kept as livve as require d
226 Prrinciple Sixx Innovativve and Susstainable SSolutions
Thhe Drainage Strategy Fraamework proomotes the fuull evaluationn of alternatiives to tradit ionally enngineered sewwerage soluttions to test wwhether thesse offer loweer whole life ccost options or better reesponses to uuncertainty It is anticipaated that draainage solutioons of the futture will be ddifferent froom the ones we are usedd to
Thhese should iinclude (at leeast at a highh level) real ttime control storm waterr retrofit techhniques edducation to eenable custommers to changge behaviou r enhancingg incentives for customerss to reduce suurface water flowing to seewers and innnovative pe rmitting arraangements a cross drainagge networks annd sewage tr eatment worrks Water annd sewerage companies sshould continnue to revieww and deevelop other innovative ssolutions
Foor example wwhere a commpany may hiistorically haave preferredd to tackle seewer floodingg or coombined sewwer overflow pollution byy increasing iits undergrouund equipmment to store mmore rainfalll duuring stormss it might connsider other options in fuuture ndash such as working wwith custommers to mmanage the raainfall close tt eventing it foorm enteringg the sewer syystem o source pre
2205240txt012|Mayy 2013
36
Drainage Strategy Framework
261 Recommended good practice
No Good practice Example references
1 Use cost‐benefit methods to demonstrate that innovative and sustainable solution types provide best value for customers and the wider community
UKWIR will publish new research and guidance in 2013 addressing active control and storm water removal demonstrating how these technologies can be justified and included within Drainage Strategies
2 Consider integrated water resource management Work with partners (especially developers and local authorities) to examine whether use of stored stormwater reduces potable water consumption AND need for capacity in sewers
CIRIA has published a scoping study for water sensitive urban design45 in the UK
3 Consider a mix of conventional and new technologies using more adaptive approaches as low‐regrets responses to uncertainty eg prevent current sewer flooding with underground tank storage but address future risks (worsened by climate change) with retrofit SuDS implemented progressively
CIRIA has published lsquoRetrofitting to manage surface waterrsquo46 a comprehensive guide to planning and delivering this type of project
4 Use carbon accounting methods to compare embodied and emitted carbon in alternative intervention strategies so that these impacts are accounted for in whole life costs
Consider the benefits of surface water removal on the costs (including carbon) of pumping and sewage treatment
UKWIR47 has and continues to publish detailed guidance on carbon accounting for water and sewerage company use
45httpwwwciriaorgserviceresearch_informationAMContentManagerNet ContentDisplayaspxSection=research_informationampContentID=23581 46httpwwwciriaorgSERVICEHomecoreordersproductaspxcatid=5ampprodid=1909 47httpukwirforefront‐librarycomreports08‐cl‐01‐6923419000190269902659465890269
205240txt012|May 2013
37
Drainage Strategy Framework
No Good practice Example references
5 Where interventions include the provision of green space public amenity and improved habitats then Payment for Ecosystem Services approaches can be used to claim further monetised benefits in the appraisal Customers should be consulted to help value these benefits
The Environment Agency will publish data in 2013 on costs and benefits of retrofit stormwater projects to promote understanding and uptake
6 Share data within the industry on innovative solutions to increase knowledge of new technology and SuDs approaches
EA retrofitting SuDs costs and benefits database48
accommodating data from Ofwat AMP5 SuDS pilot initiative and other examples
262 Good practice example ndash Welsh Water surface water reduction and removal strategy for Gowerton and Llanelli
Dŵr Cymru Welsh Water and partners are applying innovative storm water removal methods to address capacity problems in the sewer network in Gowerton and Llanelli49 (population 140000) Current under capacity leads to localised sewer flooding and excessive combined sewer overflow (CSO) spill to the Burry Inlet a protected shellfish water and special area of conservation The capacity problems in the system were a concern for the Environment Agency (Wales) and there was a risk of widespread restrictions to economic development being imposed Dŵr Cymru Welsh Water Carmarthenshire County Council City and County of Swansea Consumer Council for Water Environment Agency Wales and the Welsh Government all worked in partnership to resolve the situation
A brand new hydraulic model was built for the entire sewerage network with particular attention paid to accurately representing the sources of storm run‐off and infiltration The model was verified against data from flow monitors and observed CSO spill frequencies into the Burry Inlet
To begin with a traditional sewer storage solution was proposed that would result in an average 10 spills a year into the shellfish water from all 90 CSOs in the two catchments Although this reduced spills and dealt with some of the flooding and growth issues the storage requirements would have been unaffordable provide no protection against long term climate change and would not tackle the fundamental problem of too much surface water getting into the combined network
An alternative approach based on the reduction and removal of storm water from the combined sewer system was also developed This was in accordance with Dŵr Cymru Welsh Waterrsquos Rainscape50 (surface water elimination and reduction) strategy To identify areas with the most
48httpevidenceenvironment‐agencygovukfcermenDefaultHomeAndLeisureFloodsWhatWereDoingIntoTheFutureScience ProgrammeResearchAndDevelopmentFCRMProjectaspxProjectID=15515be8‐bbed‐4204‐ae56‐3e810ba47694ampPageID=56bad68e‐dcb1‐4bf8‐84cc‐cbfd03ab63a2 49 httpwwwciwemorgmedia674511Paper20820Stephen20Ollierpdf 50httpwwwdwrcymrucom_libraryleaflets_publications_english
205240txt012|May 2013
38
Drainage Strategy Framework
potential for effective storm water removal a flowareaflooding thematic map was developed This was used to focus attention on areas which would deliver the most benefit if storm water removal was carried out These areas are coloured red in Figure 16
Figure 16 Thematic map showing areas of maximum potential for storm water removal
The following interventions (181 in total) were combined into single strategy to be delivered in phases by 2015 2020 and afterwards
bull The management of surface water through swales basins and soakaways rather than through combined sewers resulting in new amenity and ecological areas within the built‐up environment
bull Implementing smarter flow control to better use existing storage and conveyance assets bull Relining of sewers to prevent groundwater ingress bull Removal of land drainage connections to sewers bull Household rainwater harvesting retrofit schemes
surface_water_management_strategypdf
205240txt012|May 2013
39
Drainage Strategy Framework
Figure 17 is an artistrsquos impression of what one of the sustainable urban drainage system solutions may look like
Figure 17 Example retrofit SuDS solution proposed for Gowerton and Llanelli
Modelling has demonstrated that the alternative strategy will achieve the same CSO reduction benefit as the storage strategy together with flooding improvements and additional less tangible benefits at significantly lower cost than the traditional sewer storage solution
Figure 18 illustrates the dispersed nature of solutions identified for central Llanelli
Figure 18 Water sensitive urban design interventions planned for central Llanelli
205240txt012|May 2013
40
Drainage Strategy Framework
Appendix A
Glossary
205240txt012|May 2013
Drainage Strategy Framework
Appendix A Glossary
CAPEX Capital expenditure Appointed water and sewerage companiesrsquo spending on new replacement or refurbished capital assets such as construction or buying machinery
CIWEM Urban Drainage Group (WaPUG) A group of the Chartered Institution of Water and Environmental Management supporting professionals working in urban drainage
Combined Sewer Overflow (CSO) The discharge of untreated sewage diluted with storm water into rivers and the sea CSOs occur during heavy rain and are necessary to reduce the risk of sewer flooding The physical overflow structure is also called a CSO
Common Framework for Capital A planning approach developed for the water and Maintenance Planning sewerage companies in 2002 which provides a robust basis
for assessing future capital maintenance needs The approach is consistent with the needs of Ofwat
Defra The Department for Environment Food and Rural Affairs The Government Department with responsibility for water flooding and water quality in England
Drainage Area Plan (DAP) A detailed plan for a drainage catchment that prioritises a list of interventions based on risk using an approach established in the WRc Sewerage Rehabilitation Manual This approach has been succeeded by Sewerage Risk Management which guides the preparation of Sewerage Management Plans (SMP) Companies vary in how they prepare DAPs or SMPs (or their equivalents) following the general principles that have been established
Drainage Strategy Developed by water and sewerage companies to demonstrate how outcomes will be delivered in drainage catchments over the long term Drainage Strategies will use the information developed in producing a DAPSMP and if a drainage strategy has been produced this should be the starting point in producing a more detailed DAPSMP should this be required It is likely that the activities required to prepare DAPSMP and Drainage Strategies may overlap Drainage Strategies might not refer to specific interventions but instead outline a general approach
Drainage Strategy Framework Guidance to describe the contents and intention of Drainage Strategies
205240txt012|May 2013
Drainage Strategy Framework
Flood Risk Management Plans Required by the Flood Risk Regulations in Flood Risk Areas by December 2015
Flood Risk Regulations The legislative instrument used to implement the requirements of the Floods Directive in England and Wales
Floods Directive DIRECTIVE 200760EC of the European Parliament and of the Council of 23 October 2007 on the assessment and management of flood risks
Lead Local Flood Authority (LLFA) The Shire County or unitary authority with responsibility for managing local flood risk
Local development plans Developed by planning authorities to explain where and what type of development (new homes and businesses) will occur within their area They are required to explain water infrastructure needs to support this development
Local Flood Risk Management Strategy Developed by the Lead Local Flood Authority to explain (LFRMS) how local flood risk will be managed by the Authority and
in partnership with others
Natural Resources Wales From 1 April 2013 Natural Resources Wales (NRW) a new body formed by the Welsh Government will take over the functions previously carried out by the Environment Agency (EA) in Wales alongside those of the Forestry Commission Wales and the Countryside Council for Wales
Ofwat The Water Services Regulation Authority ndash the economic regulator of the water and sewerage companies of England and Wales
OPEX Operating expenditure Appointed water and sewerage companiesrsquo day‐to‐day spending on running the services for example staff costs and power This is likely to include investment in joint projects that do not create or relate to an asset that the company solely or jointly owns
Outcomes Outcomes are the higher level objectives that a companyrsquos actions are intended to deliver A companyrsquos outcome should reflect its customersrsquo priorities identified through appropriate customer engagement and deliver the best long‐term sustainable solution for customers and the environment An outcome may not be bound by a single price control period and should be set in the context of customersrsquo and the environmentrsquos long‐term needs
205240txt012|May 2013
Drainage Strategy Framework
Price Review The process of setting appointed water and sewerage companiesrsquo price limits The next price review will take place in 2014 for the period 2015‐20 Ofwat currently sets price limits every five years
Real Time Control (RTC) Using actuated pumps gates and weirs to actively control flow in sewers Better use can be made of existing infrastructure and links can be made between network treatment and receiving water systems for operational benefits Sometimes referred to as Active Management
River Basin Management (Plans) River Basin Management is a continuous process of planning (to develop River Basin Management Plans) and delivery The Water Framework Directive introduces a formal series of 6 year cycles The first cycle will end in 2015 when following further planning and consultation the River Basin Management Plans will be updated and reissued
Sewerage Management Plan A risk based approach to indentifying investment needs in sewerage systems as described in the Sewerage Risk Management (SRM) approach developed by WRc plc
Storm water retrofit Releasing capacity in sewers by controlling stormwater at the surface using disconnection swales and other sustainable drainage systems (SuDS)
205240txt012|May 2013
We are the Environment Agency We protect and improve the environment and make it a better place for people and wildlife We operate at the place where environmental change has its greatest impact on peoplersquos lives We reduce the risks to people and properties from flooding make sure there is enough water for people and wildlife protect and improve air land and water quality and apply the environmental standards within which industry can operate Acting to reduce climate change and helping people and wildlife adapt to its consequences are at the heart of all that we do We cannot do this alone We work closely with a wide range of partners including government business local authorities other agencies civil society groups and the communities we serve
wwwenvironment‐agencygovuk
Environment Agency National Customer Contact Centre
Telephone 03708 506 506 enquiriesenvironment‐agencygovuk
Ofwat (The Water Services Regulation Authority) is a non‐ministerial government department We are responsible for making sure that the water and sewerage sectors in England and Wales provide consumers with a good quality and efficient service at a fair price
wwwofwatgovuk
Telephone 0121 644 7500 mailboxofwatgsigovuk
Halcrow Group Limited Burderop Park Swindon Wiltshire SN4 0QD
tel 01793 812479 fax 01793 812089 halcrowcom
Halcrow Group Limited is a CH2M HILL company Halcrow Group Limited has prepared this report in accordance with
the instructions of The Environment Agency for the clientrsquos sole and specific use Any other persons who use any information contained herein do so at their own risk

Drainage Strategy Framework
benefits This is relevant to sewerage planning because it encourages water and sewerage companies to partner with local authorities to resolve complex storm water management problems (for flooding or pollution control) through the use of retrofit sustainable drainage systems The wider benefits to citizens outside of the water and sewerage companyrsquos customer base can be accounted for
bull The governments of England and Wales are promoting a catchment‐based approach23 to River Basin Management Planning to meet the water quality requirements of the Water Framework Directive (WFD)24 The important aspect of the approach is that all interested parties should work together to build consensus about the best way to improve water quality and habitats Water and sewerage companies should expect to be involved in the process of agreeing objectives and the apportionment of responsibility for delivering those objectives within the river basin districts they operate The central requirements of the Water Framework Directive are to prevent deterioration in water quality aim to achieve good chemical status and aim to achieve good ecological status It additionally seeks to limit the discharge of priority substances River Basin Management Plans will undergo consultation in the second half of 2014 and be published in December 2015 thereafter the programmes of measures included become statutory requirements and the Environment Agency (in England) and Natural Resources Wales will use permit and license conditions to ensure that water and sewerage companies deliver their agreed contributions This is relevant to drainage planning because misconnections blockages mechanical failure sewer flooding and combined sewer overflows (CSOs) can all contribute to the deterioration of water quality and the failure to achieve good ecological status or meet environmental quality standards for priority substances Climate change and growth may increase these risks but water and sewerage companies are not the only polluters and need to partner to ensure that outcomes are met Defra is consulting (closing February 2013) on developing its policies with respect to the control of diffuse urban pollution25
bull A revised Bathing Water Directive (20067EC)26 applies from 2015 and by then the Governmentrsquos aim is for all bathing waters to achieve at least lsquosufficient classrsquo this is approximately twice as stringent as requirements for the current Directive Subsequent planning should aim to achieve lsquogoodrsquo or lsquoexcellentrsquo classifications This is relevant to drainage planning because CSOs other wet weather intermittent discharges final effluent discharges and misconnections can all contribute to bathing water failures Climate change and growth may increase these risks but water and sewerage companies are not the only polluters and need to partner to ensure that outcomes are met
bull Under the Flood and Water Management Act (2010)27 water and sewerage companies (in England and Wales) must act in a manner consistent with the National Flood and Coastal Erosion Risk Management (NFCERM) Strategies28 for England and Wales and have regard to
23httpwwwdefragovukenvironmentqualitywaterlegislationcatchment‐approach 24httpwwwdefragovukenvironmentqualitywaterlegislationwater‐framework‐directive 25 httpwwwdefragovukconsult20121120water‐pollution 26 httpwwwenvironment‐agencygovukbusinessregulation107017aspx 27 httpwwwdefragovukenvironmentfloodinglegislation 28 httpwwwenvironment‐agencygovukresearchpolicy130073aspx
205240txt012|May 2013
9
16
Drainage Strategy Framework
Local Flood Risk Management Strategies29 NFCERM is based around six principles community amp partnership catchment based approach sustainability risk based planning beneficiary investment and delivering multiple benefits Companies should also co‐operate with local authorities and the Environment Agency in the exercise of their functions in relation to surface water management and combined sewers under section 94 of the Water Industry Act 1991 The Flood Risk Regulations 200930 implement the Floods Directive and give particular responsibilities to Lead Local Flood Authorities In lsquoFlood Risk Areasrsquo Lead Local Flood Authorities and the Environment Agency are expected to prepare Flood Risk Management Plans that set out flood risk management objectives and measures to manage risk from local flooding The Environment Agency is required to prepare Flood Risk Management Plans for the whole of England and Wales that cover flooding from main rivers the sea and reservoirs It is important for all risk management authorities to work in an effective way to plan to manage flood risk from all sources in a way that is well coordinated across catchments and coastal cells These duties are relevant to drainage planning because of the vital (but not unlimited) role surface water and combined sewers play in reducing flood risk in urban areas The Act also makes provision for the compulsory drainage of new developments through sustainable drainage systems (SuDS) and the lsquoright to connectrsquo being conditional on SuDS being approved by the SuDS Approval Body of the Lead Local Flood Authority
bull The Climate Change Act 200831 created a legal framework to cut greenhouse gas emissions and build the UKrsquos ability to adapt to a changing climate Water and sewerage companies are expected to reduce carbon emissions and adapt to the impact of climate change over the next decades The Government published its first UK climate change risk assessment in January 2012 and this will be updated every 5 years This is relevant to drainage planning because of the carbon embodied in new drainage infrastructure the carbon emitted during the pumping and treatment of sewage and the increase in flooding and pollution that will occur if climate change adaptations are not made The Government expects Ofwat to work towards the targets of its Adaptation Report and to ensure that its regulatory approach explicitly supports companies in adapting to climate change
bull From October 2011 the Water Industry (Schemes for Adoption of Private Sewers) Regulations 201132 transferred responsibility for existing private sewers and lateral drains to water and sewerage companies Pumping stations will be transferred by October 2016 This is relevant to drainage planning because of the significant increase in assets now within the responsibility of the water and sewerage company and the need to understand and respond to risks therein
Six Guiding Principles for a Drainage Strategy
This Drainage Strategy Framework describes good practice themed around six guiding principles Adherence to these principles will help ensure a Drainage Strategy which meets the expectations of Defra the Welsh Government the Environment Agency Natural Resources Wales and Ofwat and
29 The Local Government Association has published guidance on Local Flood Risk Management Strategies httpwwwlocalgovukcdocument_libraryget_fileuuid=a2538b94‐d3c1‐4cec‐81b0‐8aefd2996c5eampgroupId=10171 30 httpwwwenvironment‐agencygovukresearchplanning125459aspx 31 httpwwwdeccgovukencontentcmslegislationcc_act_08cc_act_08aspx 32 httpwwwlegislationgovukukdsi20119780111510933contents
205240txt012|May 2013
10
Drainage Strategy Framework
will be an essential means of communicating with customers and other partners Further details on each principle are described in Section 2 of this document along with examples of good practice
The six principles are
161 Partnership
Water and sewerage companies cannot develop optimal Drainage Strategies on their own and therefore partnership is key to developing and defining objectives performance indicators and the milestones that will need to be achieved in order to achieve measures that will demonstrate the delivery of outcomes Strategies should be developed and implemented in partnership with customers developers Lead Local Flood Authorities planning authorities the Environment Agency and Natural Resources Wales Strategies should align with (informing and informed by) River Basin Management Plans Local Flood Risk Management Strategies Flood Risk Management Plans and local plans (from planning authorities)
162 Uncertainty
Strategies should explain the reliability of data and knowledge about current and future performance of drainage systems They should explain what steps are planned to improve this understanding and how this will benefit customers Where future performance is uncertain (eg because of sensitivity to climate change) they should explain how adaptive approaches will be used to ensure outcomes are met The uncertainty in predictions of future risks should be recognised and accommodated within decision making
163 Risk based
Strategies should be risk based This means that planning operational and investment activities should be based on consideration of the probability and consequence of inadequate drainage function (risks) as these relate to the achievement of measures that demonstrate delivery of outcomes A risk based strategy ensures that investment is made where risks are the greatest
To aid communication risks should be visualised through maps and plans (Figure 10 is an example) To aid risk assessment risks should be monetised combined and predicted into the future To aid options appraisal the impact of interventions on the level of risk should be predicted
The approach to Drainage Strategy development should be risk based itself The degree of detail included should be related to an understanding of the overall level of risks in the catchment now and in the future
164 Whole life costs and benefits
Strategies should be informed by consideration of whole life costs and benefits They should promote a series of interventions which in view of the quantified uncertainties are most likely to result in performance indicators which demonstrate the achievement of outcomes at lowest cost to customers and the community more widely
Costs relate to capital and operational expenditure to deliver interventions and the monetised impacts of drainage failures such as flooding and pollution
Benefits relate to the reduction in risks from drainage failures such as flooding and pollution but should also include wider societal impacts such as those calculated using a lsquoPayments for Ecosystems Servicesrsquo approach
205240txt012|May 2013
11
17
Drainage Strategy Framework
When considering the lsquowhole lifersquo the strategy should consider climate population and asset deterioration trends These are likely to increase risks over the long term if no interventions are made The strategy should state lsquowhatrsquo should be done but also broadly lsquowhenrsquo and in what sequence interventions should happen
165 Live process
The Strategy should be adaptable and periodically reviewed Whilst outcomes are expected to be relatively stable over time the pace at which the strategy delivers outcomes will be linked to volatile influences (like climate and population change) and the decisions made at each price review about the priorities for the following period The strategy should be reviewed at regular intervals to reflect investments already made the changing priorities of the water and sewerage company and partners and the presence of emerging risks The review is also an opportunity to report drainage catchment performance relative to performance measures designed to monitor progress towards achieving outcomes
166 Innovative and sustainable
The framework promotes the full evaluation of alternatives to traditionally engineered sewerage solutions to test whether these offer lower whole life cost options or better responses to uncertainty It is anticipated that drainage solutions of the future will be different from the ones we are used to
These should include (at least at a high level) real time control or active management storm water retrofit techniques education to enable customers to change behaviour enhancing incentives for customers to reduce surface water flowing to sewers and innovative permitting arrangements across drainage networks and wastewater treatment works Water and sewerage companies should continue to review and develop other innovative solutions
For example where a company may historically have preferred to tackle sewer flooding or combined sewer overflow pollution by increasing its underground equipment to store more rainfall during storms it might consider other options in future such as working with customers to manage the rainfall close to source preventing it from entering the sewer system
Mapping the Framework to Current Planning Processes
We assume that practitioners will be following a broad and generic four‐stage planning process common to the Sewerage Risk Management (SRM5) and Surface Water Management Plan (SWMP) processes when preparing Drainage Strategies
Figure 4 is provided to guide water and sewerage companies in the development of Drainage Strategies It identifies each stage of the drainage planning process and highlights the good practice principles (colour coded by theme) in the locations through the process where it is most important that they are adopted
205240txt012|May 2013
12
e
u
t
v
b
DDrainage Strateegy Frameworrk
Initializepre
Establish partne and consultat
process
Define uncertai
Prepare risk d
Partnership
epare
rship ion
nties
ata
Ris
Co
Uncertainty
k assessmen
onsultation on risk issues
Quantify uncertainties
Quantify risks
Risk based
nt Options
Consult
Plan for
Demons life cost
Whole lif costs amp benefits
s appraisal
on options
uncertainties
strate whole and benefit
fe
s Live pro
Intervent
Aligned deliv collaborat solution
Innovative sustainab
Live and vis
cess Innova sustai
tion
ery amp ive s
and le
sible
ative amp nable
Figgure 4 Draina ge Strategy frramework prinnciples mappe d to the drainaage planning pprocess
118 WWho will bennefit from tthe Framewwork
Thhe Drainage Strategy Fraamework willl benefit
bull Water andd sewerage coompanies loooking to impprove their coompany speccific drainagge planning approach and make it fit for purpoose for the deelivery of lonng term outcoomes over mmultiple pricee review cyccles It will ppoint them toowards good practice andd provide exaamples as innspiration andd to promott ne innovation
bull Organisatiions and inddividuals lookking to enga ge with the ddevelopmen t of Drainagee Strategies and scruti nise progresss towards thhe achievemeent of outcommes associateed with enabbling growth adapting tto climate chhange managging floodingg and managging water poollution
22 DDrainagee Strateegy Frammeworkk Thhis section deescribes recoommended ggood practicee against eachh of the six kkey principle s necessary too develop a DDrainage Straategy For refference linkss are made too relevant annd establisheed planning prrocesses and emerging guuidance whicch drainage planners maay find usefuul These exammples are prrovided for innformation aand referenc e only
WWater and sewwerage comppanies shouldd work towaards developiing Drainagee Strategies wwhich apply thhese approachhes in a wayy that is consiistent with thheir needs annd those of thheir customeers and paartners Partnners should ttake note of tthis advice aand prepare tto engage wiith water andd sewerage coompanies on this basis
Thhe recommennded good ppractice is orgganised withhin each prinnciple as it wwould be appproached chhronologicallly in developping a Drainaage Strategy following thhe planning pprocesses alrready esstablished in the Seweragge Risk Manaagement anddor Surface WWater Managgement Plann mmethodologiess
2205240txt012|Mayy 2013
13
21
Drainage Strategy Framework
Principle One Partnership
Water and sewerage companies cannot develop optimal Drainage Strategies on their own and therefore partnership is key to developing and defining objectives performance indicators and the milestones that will need to be achieved in order to achieve measures that will demonstrate the delivery of outcomes Strategies should be developed and implemented in partnership with customers developers Lead Local Flood Authorities planning authorities the Environment Agency and Natural Resources Wales Strategies should align (informing and informed by) with River Basin Management Plans Local Flood Risk Management Strategies Flood Risk Management Plans and local plans (from planning authorities)
205240txt012|May 2013
14
Drainage Strategy Framework
211 Recommended good practice
No Good practice Example references
1 Engage with partners in a drainage catchment to bull Explain the purpose of developing a Drainage Strategy
and partnersrsquo roles in its success amp how each party will benefit from establishing a long term Drainage Strategy
bull Explain what outcomes are and how progress towards achieving them will be measured
bull Share data and information so that a shared understanding of risks and opportunities is developed
bull Explain what current drainage system performance is and how this is expected to change in the future Use risk visualisation tools to do this
bull Explain significant uncertainties and how these affect how interventions are delivered
Thames Water has demonstrated good practice through the development of its Counters Creek sewer flooding proposals This website describes the engagement process and how customers have been kept informed
2 Engage with the following partners in the development of the Drainage Strategy
bull Lead Local Flood Authority (the drainage area may include more than one) because of its responsibilities for local flood risk management and SuDS approval
bull Planning authority (the drainage area may include more than one) because of its role in determining the location and pace of housing development
bull Highways Authority because of the connection of highway runoff to public sewer systems
bull The Environment Agency (in England) because of its responsibilities for flood risk management (strategic overview) and ensuring good ecological quality is met in water bodies
bull Natural Resources Wales (in Wales) because of its responsibilities for flood risk management (strategic oversight) and ensuing good ecological quality is met in water bodies
bull Regional Flood and Coastal Committees who help develop a mutual understanding of flood and coastal erosion risks in an area
bull Bodies representing customers (eg Consumer Council for Water large local businesses flood action groups faith communities)
bull Bodies representing local environmental concerns (eg Wildlife Trusts Rivers Trusts)
bull Water only companies and water and sewerage company departments planning and operating water supply systems Water demand management practice can have an important impact on sewerage headroom
SWMP guidance (Chapter 2) advises on the establishment of partnerships for urban flood management and how to agree and align local objectives
3 Understand alignment of planning cycles and what this means locally (eg periodic review River Basin Management Plan Local Flood Risk Management Strategy Flood Risk Management Plan local plan)
205240txt012|May 2013
15
Drainage Strategy Framework
No Good practice Example references
4 Be alert to opportunities for joint solutions andor shared funding by understanding local plans for new development re‐development improving street furniture and public open space improving parks and green infrastructure Understand Lead Local Flood Authority and Environment Agency programmes for the management of flood and pollution risks
A guide to joint funding of local flood risk management intervention has been published by Defra33 and provides relevant advice to water and sewerage companies and other partners
5 Consider water and sewerage company funded solutions which deliver third‐party non‐sewerage assets that result in the long term least cost delivery of outcomes (eg water and sewerage company funding of household rain barrels and rain gardens to prevent surface water entering sewers)
6 Use data and mapping from the Environment Agency and Natural Resources Wales to understand exposure of drainage infrastructure to extreme events (eg coastal fluvial and surface water flood maps) so that network resilience can be understood and improved if this is cost beneficial
UKWIR has completed a project in 2013 lsquoResilience building a business case for PR14 and beyondrsquo
7 Work with LLFAs and the Environment Agency (or Natural Resources Wales) to understand the effectiveness of interventions at reducing risk and use this information to improve intervention planning
The UPM3 manual (section 7) advises on post project monitoring needs for water quality driven improvements
8 Share Drainage Strategies with partners and stakeholders so that there is transparency around challenges opportunities and the roles expected of different organisations
212 Good practice example ndash South West Water working with local authorities
These examples from South West Water illustrate how the company has worked with local authorities to coordinate investments and to share resources and skills in the development of integrated urban drainage management studies and Surface Water Management Plans
bull South West Water approached Devon County Council (DCC) to pool resources in delivering two (of five) pilot integrated urban drainage management studies (IUDMs) for Exeter and Exmouth South West Water took the lead role for Exmouth but DCC led in Exeter This engagement shared costs across organisations and has facilitated the production of full Surface Water Management Plans The collaboration has resulted in a shared understanding of the urban drainage challenges faced by both organisations and has opened dialogue around investment priorities
bull In Lyme Regis South West Water supported extensive coastal erosion defence works being carried out by West Dorset District Council by accelerating a programme of sewer rehabilitation and targeting renovation of sewers in vulnerable areas
bull In partnership with Cornwall County Council (CCC) and the Environment Agency South West Water has been working on a number of key drainage issues identified by CCC in its Preliminary Flood Risk Assessment (PFRA)
33 httprandddefragovukDefaultaspxMenu=MenuampModule=MoreampLocation=NoneampCompleted=0ampProjectID=17085
205240txt012|May 2013
16
Drainage Strategy Framework
bull In Camborne South West Water has taken the opportunity to invest in sewer separation works which align with the aims of the Camborne Pool Redruth urban regeneration group supported by Cornwall Council and to promote sustainable development economic growth and a strategic aim of lsquosewers for sewagersquo
213 Good practice example ndash Northumbrian Water partnership working in Tyneside
Northumbrian Water has led a sustainable sewerage study for Tyneside34 between 2010 and 2012 It is a good example of how partner organisations can collaborate to understand and resolve drainage issues in their urban area
Its approach was informed by the fact that a shared urban drainage problem around flooding and pollution was best addressed by a shared response from all the relevant organisations The project steering group involved representatives of Northumbrian Water the Consumer Council for Water the Environment Agency and five Lead Local Flood Authorities The urban drainage system collects wastewater for a single wastewater treatment works serving a population of over 900000
Working together the group studied the impact of growth urban creep and climate change on future urban drainage issues Figure 5 illustrates how a city‐wide map of potential problem areas was generated by the project team sharing data on sewer capacity (from Northumbrian Water) population change (from the local authorities) and river flooding (the Environment Agency) It was predicted that future problems were more likely to occur in the darker shaded areas These became focus areas for the project where a range of traditional and novel drainage solutions were tested
Figure 5 Future drainage problem areas indentified through data sharing
34httpcommunicatoremailcomINfNLOjNRayfOA1rfrfYcdK‐S7UwRcYcNoWebViewaspx
205240txt012|May 2013
17
22
Drainage Strategy Framework
The project team was keen to promote its work to customers and the community and prepared a series of newsletters updating interested parties on progress and issues An example is illustrated in Figure 6
C lic k here if y ou are hav in g d if f ic u lties v iew ing th is new s letter
Ho m e A b o u t u s M e d ia ce n tre C o n tact
Issue 2
Ap ril 2012
In th is ed ition U n d e rs tan d in g th e fu tu re
S u s tain ab le d ra ina g e o p tio ns
F ind ou t more about Th e 2 0 1 1 an n ua l re po rt
Ou r e n viro n m e n ta l p o licy
Ou r co rp o ra te re sp o nsib il i ty s tra te g y
W e lcom e to th e s e con d e ditio n o f S u sta inab le se we ra g e a s ix-m on th ly n e ws le tte r p ro d u ce d to b ring yo u th e la te s t n e ws on o u r m a jo r s tud ye xp lo rin g s us tain ab le s ew e ra ge o p tions in th e Tyn e s id e a rea I h o p e yo u fin d th e in fo rm a tio n o f in te res t a n d wo u ld w e lcom e fe e db a ck o n an y o f th e issu es ra ise d
Ric ha rd W a rne ford W a s te wa te r Dire c tor
U nderstand ing the fu tu re W e a ll kn o w th e difficu lties o f a ccu ra tely p re d ic tin g th e fu tu re h ow e ve r ifw e a re to p re pa re fo r i t th e n it is s om e thin g we m us t a tte m p t As p a rt o f th is s tu d y w e a re co ns id e rin g w ha t d em a nds w ill b e p la ce d on th e d ra ina g e s ys tem s a t 2 0 20 a n d a t 2 0 50 in co rpo ra ting g ro w th u rba n cre e p a nd c lim a te cha n ge B y w o rk in g close ly w ith o u r p a rtn e rs an d u s in g th e la tes t te ch n ical res e a rch we h a ve d e ve lo p ed a n d com p u te rm od e lle d a num b e r o f s ce na rios to id en tify a n d d e fin e fu tu re ris ks Th es e ris ks in c lud e p red ic tions o f p o te n tia l floo d in g p o llu tion o r b a rrie rs to g ro w th N o w th a t w e be tte r u n d e rs ta nd th e iss u es we a re a ble to p re pa re p la ns p rom o ting o p po rtu n ities fo r s us ta in a ble d rain ag e s ys tem s in o rde r to d e live r th e b es t p oss ible s e rvice fo r o u r cu s tom e rs b a la n ced a g ains te n viro nm e n tal n e eds a n d cos ts
S usta inab le d ra inage op tions W e b e lie ve o u r a pp ro a ch re p res en ts go o d p ra ctice fo r th e m a n ag em en t o f s u rfa ce wa te r w h ich is to d ea l w ith th e s u rfa ce wa te r as c los e to s ou rce as p oss ib le A w id e ra n g e o f p o te n tial o p po rtu n ities a re b ein g id e n tifie d in c lu d in g lo ca l a n d s tra te gic o p tions
S tra te g ic o p tions a re typ ica lly la rg e r th a n th e lo ca l on es a nd in c lu d e fe a tu res s u ch as a re as o f la nd w h ich w o uld b e a llo we d to flo o d d u rin g he a vy ra in (s a crific ial s to ra g e ) a n d p e rm a n en t w e tla nd fe a tu res
L o ca l op tio ns d esp ite b ein g sm a lle r th a n th e s tra te gic o n es w ill s til l p la y a ke y ro le in th e p ro vis io n o f s us tain ab le d ra ina g e Th e ir n a tu re m e a ns de p lo ym e n t co u ld be m o re w id es p re a d th a n s tra te gic o p tions fe a tu res su ch as w a te r b u tts ra in g a rde ns a nd p e rm e ab le pa vin g co u ld b e re la tive ly e a s y to fi t in to
Figure 6 Newsletter promoting urban drainage partnership working
Principle Two Uncertainty
Strategies should explain the reliability of data and knowledge about current and future performance of drainage systems They should explain what steps are planned to improve this understanding and how this will benefit customers Where future performance is uncertain (eg because of sensitivity to climate change) they should explain how adaptive approaches will be used to ensure outcomes are met The uncertainty in predictions of future risks should be recognised and accommodated within decision making
205240txt012|May 2013
18
Drainage Strategy Framework
221 Recommended good practice
No Good practice Example references
1 Data analysed and used in the development of the strategy related to asset location dimensions condition failure and flood and pollution incidents should be assigned a confidence grading The confidence grading should be related to its accuracy completeness compatibility credibility and currency
Models used to predict blockages and collapses flooding locations polluting discharges and water quality impacts should be assigned a confidence grading based on their accuracy completeness compatibility credibility and currency
Model predictions should be assigned a confidence grading depending on the confidence in the model and whether it is being applied outside of its verification range (eg for extreme events or for atypical geographies)
The purpose of confidence grading data and model results used in strategy setting is to understand the likelihood that outcomes will be achieved in a cost efficient manner Where the outcomes remain uncertain knowledge of data confidence can be used to target improvement programmes
SRM5 (S3‐03‐17) refers to Ofwatrsquos method for recording the reliability and accuracy of regulatory data in bands A to D
The SWMP guidance (Section 319) describes an alternative system of grading data and model results
2 Use the Drainage Strategy to justify data and model improvement programmes This should be focussed on areas where risks are currently (or predicted to be) high and uncertainty in data or models reduces the ability to determine robust operational or capital solutions Poor model verification in high risk areas would be an indicator that model improvements were required
CIWEMrsquos urban drainage group has published a series of guides on hydraulic and water quality modelling They discuss model calibration verification and uses
SRM5 (S3‐04) describes how to determine where the current assessment of risk is sufficient to proceed or whether data and models should be improved
3 Improve understanding of network performance (and improve models) by using long term flow and level monitoring on sewers and CSOs
Yorkshire Water discusses its CSO
monitoring programme here
4 Demonstrate how the uncertainty in both the underlying datamodels and in the future projections is addressed in options appraisal Consider if this should be done implicitly (eg through choosing conservative assumptions) or explicitly through the use of sensitivity analysis or scenario testing
Treasury Green Book supplementary guidance illustrates how to accommodate climate change uncertainties
205240txt012|May 2013
19
Drainage Strategy Framework
No Good practice Example references
5 Population growth new homes and businesses climate change and urban creep combine to make the future highly uncertain but will almost certainly increase flooding and pollution risks from drainage systems Use the Drainage Strategy to explore different scenarios (combining the impact of these drivers) for a near term (le 10 years) and future (ge 30 years) epoch
For example combine modest growth and slight climate change (a low impact case) and contrast with high growth and significant climate change (a high impact case) Where the location of significant new development is unknown include scenarios accommodating different possibilities
Running multiple scenarios is time consuming and costly A risk based approach should be adopted to focus efforts where flooding and pollution risks are especially sensitive to changes in demand
UKWIR has published research on accounting for climate change35 and urban creep36 in sewerage planning together with more general advice on accommodating climate change in water asset management planning37
Ofwat has published research38
predicting the combined impacts of climate change urban creep and development on a national basis
6 In the face of significant uncertainties about future demands on the drainage system and their consequences the Drainage Strategy should identify low‐regrets interventions (ie ones that are robust no matter what the future holds) and ensure that solutions can be adapted if greater certainty is achieved For example through quickening the pace of SuDS retrofit activities or using (previously identified and secured) land to extend underground storage facilities Strategies which remove surface water from sewerage networks provide lsquoheadroomrsquo for unpredictable increases in demand from population and climate change
Designing Resilient Cities A guide to good practice DR Lomardi et al HIS BRE Press
7 Post project appraisal and cost monitoring should be used to capture real costs and performance so that Strategies can be updated and improved with latest information It is especially important to collate and understand the whole life costs of new technologies where industry understanding is currently poor
35httpwwwukwirorgreports03‐cl‐10‐09042794658901799019890198 (poundpound) 36httpukwirforefront‐librarycomreports10‐wm‐07‐1493273 (poundpound) 37httpukwirforefront‐librarycomreports12‐cl‐01‐1694816900019015590145901409465890155 (poundpound) 38httpwwwofwatgovuksustainabilityclimatechangerpt_com201106mottmacsewerpdf
205240txt012|May 2013
20
Drainage Strategy Framework
222 Good practice example ndash Severn Trent Waterrsquos MICAS
Severn Trent Water has developed a process to measure confidence in hydraulic models of sewer systems Modelling Investment Confidence Assessment Scoring (MICAS) was developed to provide an objective evaluation of model confidence It uses information stored in the hydraulic model about the provenance of each data element and the quality of model verification Before the approach was developed the assessment of lsquofitness for purposersquo of models was subjective and based on modellers judgment This was not always reliable and certainly not repeatable and transparent MICAS provides an objective assessment of hydraulic model quality which can be used to inform its use and prioritise improvements to input data and model verification
Figure 7 and Figure 8 illustrate how an understanding of model confidence from the MICAS assessment (right hand side images) can be used to interpret predictions of flooding (left hand side images) In Figure 7 areas at predicted high risk of flooding (red in the left hand side image) are shown to be in high confidence areas of the hydraulic model (green in the right hand side image) In contrast in Figure 8 areas at predicted high risk of flooding (red in the left hand side image) are shown to be in poor confidence areas of the hydraulic models (orange in the right hand side image) In the latter case this information is used to identify where further model improvements would be beneficial
Flood Risk MICAS
Figure 7 Modelled flood risk and MICAS confidence scores (high model confidence)
Flood Risk MICAS
Figure 8 Modelled flood risk and MICAS confidence scores (lower model confidence)
205240txt012|May 2013
21
23
Drainage Strategy Framework
Principle Three Risk Based
Strategies should be risk based This means that planning operational and investment activities should be based on consideration of the probability and consequence of inadequate drainage function (risks) as these relate to the achievement of measures that demonstrate delivery of outcomes A risk based Strategy ensures that investment is made where risks are the greatest
To aid communication risks should be visualised through maps and plans (Figure 10 is an example) To aid risk assessment risks should be monetised combined and predicted into the future To aid options appraisal the impact of interventions on the level of risk should be predicted
The approach to Drainage Strategy development should be risk based itself The degree of detail included should be related to an understanding of the overall level of risks in the catchment now and in the future
231 Recommended good practice
No Good practice Example references
1 Determine where a Drainage Strategy is required by combining current performance with external influences likely to result in deteriorating performance This stage requires no modelling or detailed assessment On a catchment‐by‐catchment (drainage area) basis understand current risks by collating data on current performance eg blockages collapses pumping station failures pollution incidents CSO spills storm tank spills internal flooding incidents external flooding incidents and infiltration rates Relate these risks to performance indicators and the achievement of outcomes Combine with information about known growth rates predictions of urban creep quantity of newly adopted lsquoprivatersquo sewers surface water flooding risks (eg from flood map for surface water) WFD water body status and bathing water status Prioritise catchments with high current risks andor factors suggesting that risks are likely to worsen significantly in the future Consider normalising scoring method for size of catchment (eg by unit area or unit length of sewer) Consult with stakeholders to confirm correct prioritisation Commence with development of Drainage Strategies for the highest ranked catchments Periodically revisit prioritisation (updating with new data) to check that priorities are still correct
The initialisation stage of a Sewer Management Plan (SMP) (described in SRM5) considers how a risk assessment can be used to prioritise which spatial units (eg catchments) should be prioritised for a SMP study
2 Visualise catchment risks (from 1) to illustrate and explain to partners the reasons for prioritisation Accommodate their views amp consider changing prioritisation to aid wider drainage planning requirements (eg increase prioritisation of a catchment with significant surface water flooding problems where close collaboration between water and sewerage company and LLFA will benefit the community)
205240txt012|May 2013
22
Drainage Strategy Framework
No Good practice Example references
3 Clearly relate sewerage risks to the performance indicators that will be used to measure progress towards achieving outcomes eg relate blockage rates to flooding and pollution incidents eg relate increase in flows to increased CSO frequency breaches of permit conditions and deterioration in receiving water quality Adopt a sourcendashpathway‐receptor model and workshop techniques to ensure that cause effect and consequences are fully captured Use performance indicators as the basis for a comprehensive risk assessment that considers likelihood (frequency) and consequence (extent degree and duration of impact) of failure expressed as risk scores Monetise risks in GBP (pound) to align with principle four (whole life costs amp benefits) Use (verified) predictive models to understand near term (lt10 years) and long term (gt30 years) risks The latter to align with principle four (whole life costs amp benefits) Align complexity of method with level of risk recognising the needs of partners eg use complex 2D flood routing models to ascertain (with greater certainty) flood mechanisms and damages where the quantity and frequency of flooding is high and interventions will be complex and costly Elsewhere more simple approaches are appropriate eg use complex UPM3 water quality modelling methods where compliance with river standards or discharge consents is already failing or is expected to do so Elsewhere more simple approaches are appropriate Combine risk scores from different risks to describe the total level of risk in a catchment Use visualisation techniques to communicate combined level of risk Combine analysis from hydraulic blockage and asset deterioration models on a catchment basis In hydraulic analysis consider flooding performance for rainfall events beyond the usually provided standard of protection to understand performance in extreme events in support of partners (especially LLFAs) and in search of cost beneficial interventions at a higher standard than normal
SRM 5 (S3‐03) details approaches to simple and more complex approaches to risk assessment that are consistent with CMPCF guidelines
4 Be alert to interactions between sewer networks and wastewater treatment plans eg by modelling the impact of changing sewer flows on wastewater treatment worksrsquo performance and costs Consider combined impact of different catchments on a single or linked water body (eg an inland river bathing water or shell fishery)
UPM3 guidance discusses approaches to understanding these interactions and applying more complex water quality impact models
5 Establish systems and apply methods to predict how interventions can reduce risks eg how a targeted and pro‐active maintenance can reduce the occurrence of sewer blockage and flooding from lsquoother causesrsquo eg how reducing infiltration can reduce CSO spills eg how reducing connected impermeable area can reduce sewer flooding
205240txt012|May 2013
23
Drainage Strategy Framework
232 Good practice example ndash United Utilities risk assessment
United Utilities has demonstrated a robust risk based approach in the development of sewerage management plans used for long term planning across their area of operations
Hydraulic models were applied in 235 catchments and configured to look at future performance and to evaluate the consequences of inadequate capacity Starting from a baseline of 2010 versions of the models were built for 2020 and 2036 epochs The following model input parameters were adjusted population water consumption infiltration planned development known sewerage improvement projects urban creep rainfall (for climate change)
Two‐dimensional (2D) modelling was used to consider the consequences of sewer flooding resulting from the changes made to reflect the future operating environments As well as the impact on homes and business (from internal and external flooding) the flood risk to critical infrastructure was also considered The operation of CSOs was considered by computing the annual spill volume duration and frequency
Finally predictions of the likelihood and consequence of sewer failure were added taking account of sewer material age and the incident records relating to similar assets
All these data were combined and weighted to generate a Sewer Management Plan (SMP) Risk Score for each length of sewer The process is illustrated in Figure 9
Figure 9 United Utilitiesrsquo process for calculating risk score in sewerage catchments
205240txt012|May 2013
24
Drainage Strategy Framework
Risk scores were summed spatially and monetised so that high priority locations could be identified Mapping and visualisation were used to communicate the results of this assessment priority areas for further investigation and how risks change through time (Figure 10)
Figure 10 Visualisation of sewerage risks
233 Good practice example ndash Northumbrian Water risk assessment
Northumbrian Water completes an annual assessment of hydraulic capacity in its sewerage network at the drainage area scale Its approach does not require hydraulic models to have been completed and yet can reliably highlight areas of under‐capacity in need of further investigation through more detailed analysis including hydraulic modelling New and emerging risk areas can also be identified by applying data for population growth which occurs through development lsquoWhat ifrsquo scenarios can be run to test when capacity limits may be overcome and flood risks potentially set to increase It demonstrates good lsquorisk basedrsquo planning principles because it shows the drainage planner where more detailed analysis is warranted
The approach uses the following data from company records population connected to sewer P water consumption rate G (lhd) trade discharge E (ls) pipe diameter and gradient pipe connectivity CSO consent pass forward rate (ls) pumping station rate (ls) sewage treatment flow rate (ls) A wastewater dry weather capacity map calculates pipe full capacity dry weather flow (PG+E+I) and Formula A flow for fully combined (1360P+2E+DWF) and separate (4PG+3I+E) areas of the network Infiltration (I) is assumed to be 50 PG +E
205240txt012|May 2013
25
Drainage Strategy Framework
A theoretical assessment of network capacity is then calculated by comparing Formula A with pipe full capacity flow consent values at CSOs and wastewater treatment works and pumping rates This determines areas of the network with a capacity shortfall with a potential capacity shortfall and with no capacity shortfall
When run across the whole company area approximately 100 out of 500 drainage areas were found to be under capacity Over 60 of these areas had recorded sewer flooding incidents In over 300 drainage areas there was no forecast capacity shortfall Only 7 of these drainage areas had recorded sewer flooding incidents Overall the system proved to be very reliable at predicting drainage areas likely to have sewer flooding problems because of sewer under‐capacity
In under capacity drainage areas an intermediate (hydraulic model based) assessment is then carried out Figure 11 shows the results thematically mapped for an example drainage area Red areas are predicted to have a very high risk of sewer flooding Yellow and green areas are predicted to have a low risk of sewer flooding
Figure 11 Example of a drainage area capacity map
205240txt012|May 2013
26
24
Drainage Strategy Framework
Principle Four Whole Life Costs and Benefits
Strategies should be informed by consideration of whole life costs and benefits They should promote a series of interventions which in view of the quantified uncertainties are most likely to result in performance indicators which demonstrate the achievement of outcomes at lowest cost to customers and the community more widely
Costs relate to capital and operational expenditure to deliver interventions and the monetised impacts of drainage failures such as flooding and pollution
Benefits relate to the reduction in risks from drainage failures such as flooding and pollution but should also include wider societal impacts such as those calculated using a lsquoPayments for Ecosystems Servicesrsquo approach
When considering the lsquowhole lifersquo the strategy should consider climate population and asset deterioration trends These are likely to increase risks over the long term if no interventions are made The strategy should state lsquowhatrsquo should be done but also broadly lsquowhenrsquo and in what sequence interventions should happen
241 Recommended good practice
No Good practice Example references
1 Predict risks into the future for at least two epochs le10 years (to understand what the company needs to do now and how this fits with longer term outcomes) and ge30 years to understand long term needs in light of changing population and other pressures
Account for the following changes in demand
bull Growth ‐ new homes and businesses
bull Urban creep ndash uncontrolled addition of connected impermeable area
bull Climate change ndash affecting design events (flood predictions) time‐series (CSO and treated effluent quantities) river flows and temperatures
bull Infiltrationexfiltration ndash through deteriorating sewer condition
bull Dry weather flows ndash through changes in water consumption rates
2 Combining monetised risks (associated with sewerage failures) determine whole life costs for a lsquodo nothingrsquo scenario (ie no interventions)
Include costs associated with electricity consumption (in the network and at the wastewater treatment works) and CO2 emissions
UKWIR will publish in 2014 a revision to their Long Term Least Cost Planning for Wastewater Supply‐Demand
guidance This may provide tools and methods for expressing costs and benefits to support the development of a Drainage Strategy
205240txt012|May 2013
27
Drainage Strategy Framework
No Good practice Example references
3 Test intervention strategies which keep performance indicators on track to deliver outcomes by adding capacity (supply) reducing flows (demand) or altering operational regimes
Include the costs of interventions and the benefits of reduced risks to inform selection of the most cost beneficial strategy over the whole life
Have regard to the timing of interventions recognising that uncertainty may require low‐regrets (insensitive to uncertainty) solutions and that delaying major interventions may be more affordable and attractive in the short term Discounting should be used to compare the costs and benefits of interventions occurring at different times
Recognise that some interventions will be obligatory and defined (eg maintenance of a spill frequency standard at a CSO) whilst others will be more discretionary focused on achieving outcomes rather than specific outputs
SRM5 (Section 8) defines and contrasts cost benefit analysis cost effectiveness analysis whole life cost analysis and risk cost benefit analysis
HM Treasury Green Book39
sets out a framework for the appraisal of long term projects which can be applied to the development of a Drainage Strategy
4 Donrsquot at first be concerned with the distribution of costs and benefits between partners who may be sharing costs Identify the most cost beneficial solution first and then debate and agree an equitable sharing of costs
Give equal weighting to OPEX (operating expenditure) and CAPEX (capital expenditure) costs so not to cause bias towards capital intensive solutions Properly consider the costs and benefits of pro‐active maintenance regimes and campaigns to influence customers to reduce fats oils and greases (FOG) build‐ups and the misuse of sewers
Consider the affordability of solutions the impact on customersrsquo bills and the resources of other organisations to play their part
UKWIR research outputs40 in 2013 (SW01) will provide a framework for making a business case for separating storm water from combined sewers
5 Where interventions include the provision of green space public amenity and improved habitats then Payment for Ecosystem Services approaches should be used to identify further monetised benefits in the appraisal Customers should be consulted to help value these benefits
Supplementary Green Book41
guidance describes methods for accounting for environmental impacts including the ecosystems approach
39 httpwwwhm‐treasurygovukdata_greenbook_indexhtm 40 httpwwwukwirorgpublishorsystemcomponent_viewaspLogDocId=96116 41 httpwwwhm‐treasurygovukdaccounting_environmental_impactspdf
205240txt012|May 2013
28
Drainage Strategy Framework
242 Good practice example ndash Severn Trent Water making the case for surface water separation in Stoke-on-Trent
In this example42 Severn Trent Water compared alternative ways of addressing sewer flooding problems by looking at a range of costs and benefits not all of which were directly associated with its specific responsibilities as a water and sewerage company Whilst the example does not express a monetised value for all costs and benefits over the whole life it does illustrate the types of factors which could be included in an appraisal of this type scaled to address problems at a catchment level It also demonstrates how working collaboratively can help identify solutions which are cost‐beneficial for the community at large
In an area of Stoke served by a combined sewer system five properties were at risk from sewer flooding in cellars for events equal to and less frequent than the 1 in 10 year probability A conventional sewer pumping station based solution was presented as the standard option
However a nearby former hospital site was also undergoing re‐development which would result in reduced runoff to the combined sewer The new drainage regime in the redevelopment site was sufficient to remove the flood risk at the five properties (this was a do nothing strategy)
A third option completely separated the development site runoff from the combined sewer and also addressed local flood risk issues nearby The solution required a new storm sewer and a network of swales and other SuDS features connecting with an ordinary watercourse
Table 1 illustrates how costs and benefits were compared across the three alternative strategies Each provided the same benefit in terms of the number of homes (5) relieved from sewer flooding The novel SuDS and surface water management solution additionally gave local flood risk relief to 3 further properties The separationSuDS strategy came at a higher capital cost but delivered greater social cost benefits savings in annual operating costs and a bonus improvement water quality (because of reduced CSO spill volume) Severn Trent selected the separation SuDS solution because the higher capital costs were offset by other benefits
Table 1 Costs and benefits of drainage improvements in part of Stoke-on-Trent
Do nothing Standard option
SuDS
Sewer flooding benefits 5 5 5
Other flooding benefits 0 0 3
Change in runoff to combined sewer (m3year) 0 0 ‐40000
Estimated cost (pound) 0 168000 419000
42httpwwwciwemorgmedia695460Paper203_Creating20Sewer20Capacity_Presentation2 0by20Mike20Woodpdf
205240txt012|May 2013
29
Drainage Strategy Framework
Do nothing Standard option
SuDS
Social Cost Benefit (pound) 16000 5000 51000
Change in electricity costs (poundyear) 0 +75 ‐525
Programme impact (years to deliver solution) + 4 0 +4
CSO spill volume (m3 in 1year event) +298 0 ‐397
243 Good practice example ndash New York City comparison of grey and green infrastructure drainage strategies
This example is taken from New York in the United States of America Itrsquos an illustration of how whole life costs have been compared for alternative strategies to solve urban drainage issues on a mega‐city scale The key data are summarised in Table 2
Table 2 Comparing drainage strategies in New York
Grey Strategy
Green Strategy
CSO spill volume reduction (billion gallons year)
101 122
Wider benefits over 20 years ($ million) 0 139 to 418
Whole life costs over 20 years ($ billion) 68 53
The information is taken from the New York City Green Infrastructure Plan43 produced by the Mayorrsquos Office in 2010 The Plan (and recent updates) provides a comprehensive evidence base around costs and benefits of different approaches to address the cityrsquos drainage problems It is therefore an excellent example of how drainage strategies can be described in plain language for a non‐specialist audience concerned with their environment and the cost of providing infrastructure to enhance it
It is becoming commonplace for North American cities (eg Portland and Philadelphia) to address the issue of frequent combined sewer overflow (CSO) operation by using a combination of grey infrastructure (sewers) and green infrastructure (sustainable drainage systems) The wider health
43 httpwwwnycgovhtmldephtmlstormwaternyc_green_infrastructure_planshtml
205240txt012|May 2013
30
25
Drainage Strategy Framework
and ecological benefits of green infrastructure approaches and the reduced reliance on materials and energy are attractive to utility planners and cities alike
New York has 422 CSOs and an agreed Long Term Control Strategy to significantly reduce the impact wet weather discharges have on aquatic systems throughout the city Annual discharges are currently (2010) estimated to be 30 billion gallons (114 million cubic meters) per year Building on existing and committed new sewer plans an agreed grey infrastructure based strategy to this problem is set to reduce these discharges to 198 billion gallons per year (a 34 reduction) by the 2030s An alternative green infrastructure approach based around intercepting the first inch (25mm) of rainfall across 10 of the impermeable city area by 2030 is predicted to reduce CSO spills to 179 billion gallons per year
Planners have calculated that the whole life costs after 20 years of the grey infrastructure solution will be $68 billion (2010 prices) compared to the green infrastructure whole life costs of $53 billion The green infrastructure strategy reduces CSO spills by more than the grey alternative for $15 billion less in terms of whole life cost Further planners have calculated that New Yorkers will benefit by up to $41844 million (accumulated over 20 years) in additional benefits associated with lower energy bills from control of urban heating increased property values and improved health
Based on this analysis New York City has committed itself to an aggressive green infrastructure based runoff control strategy to provide long term reductions in CSO spills The plan is to achieve interception of 15 of impermeable area by 2015 4 by 2020 7 by 2025 and 10 by 2030
Principle Five Live Process
The Strategy should be adaptable and periodically reviewed Whilst outcomes are expected to be relatively stable over time the pace at which the Strategy delivers outcomes will be linked to volatile influences (like climate and population change) and to the decisions made at each price review about the priorities for the following period The Strategy should be reviewed at regular intervals to reflect investments already made the changing priorities of the water and sewerage company and partners and the presence of emerging risks The review is also an opportunity to report drainage catchment performance relative to performance measures designed to monitor progress towards achieving outcomes
44 Estimated using methods from the New York Municipal Forest Resource Analysis (MFRA) prepared by the US Dept of Agriculture
205240txt012|May 2013
31
Drainage Strategy Framework
251 Recommended good practice
No Good practice Example references
1 Regularly repeat screening exercise to determine catchments requiring a Drainage Strategy and modify programme of Strategy development accordingly
Check for changes in measured rates of flooding and pollution incidents blockages collapses pumping station failures etc
Check for changes in extent and location of new development
Check for activities being undertaken by partners (eg redevelopment urban realm improvements and flooding and pollution management activities)
SRM5 illustrates how improved and updated knowledge of system performance should be applied to establish Strategies
2 In lsquolive Strategiesrsquo repeat risk assessment when data and models improve and adjust confidence scores accordingly
Confirm that Strategy will still achieve performance indicators and outcomes at least cost Revise Strategy as necessary
3 Periodically refresh Strategy accommodating impact of interventions already delivered using re‐verified predictive tools as appropriate
Confirm that Strategy will still achieve performance indicators and outcomes at least cost Revise Strategy as necessary
Triggers for a wholesale review of the Strategy are likely to be significant changes to the location or extent of planned development
4 Monitor report and share (with partners) the measures used to demonstrate delivery of outcomes Example measures may include the number of properties which experience sewer flooding the number of properties at risk of flooding the number of properties at risk from sewerage asset failure risk indices that capture both the probability and consequence of failure customer satisfaction with regards to clean rivers and beaches the number of pollution incidents the frequency of combined sewer overflow operation and compliance with discharge permit conditions
252 Good practice example ndash Thames Water live DAP
Thames Water has initiated a DAP (drainage area plan) Live approach Itrsquos a good example of how companies are continuously monitoring and updating the status of drainage area risks It provides a lsquoliversquo snapshot of the current health of all drainage areas in Thames Waterrsquos region allowing real time planning as part of a strategic approach It enables drainage planners to view the effectiveness
205240txt012|May 2013
32
Drainage Strategy Framework
of intervention strategies and compare incident rates across varying geographies and development types in the Thames Valley
DAP Live will be available for all catchments in the Thames Water area thus enabling
bull high level monitoring of risks across the business bull a live and strategic review of catchment performance bull prioritisation of catchments based on risk and bull an ability to share data with partners collaborating in drainage planning and improvements
Figure 12 illustrates the types of data managed through the DAP Live system These include asset data political and drainage boundaries environmental data operational data property amp growth data and modelling data As new data become available the DAP Live system is updated so that drainage planners have the most current view on emerging risks and issues
Asset data
Operational data
Property and growth data
Modelling data
Environmental data
Boundaries (SDACs operational political)
Figure 12 Data types held in the DAP Live system
Figure 13 illustrates how the system can provide analysis at a variety of scales from local authority boundaries sewage treatment works catchments drainage areas or a regular grid
205240txt012|May 2013
33
Drainage Strategy Framework
NE PROVINCES
WESTERN PROVINCES
NE LONDON bull Ops areas local W LONDON
SE LONDON authorities Large TIDWORTH SE PROVINCES
bull STW Catchments
bull Drainage areas(SDACs)
bull Regular grid Small
Figure 13 DAP Live reporting performance at different scales
205240txt012|May 2013
34
Drainage Strategy Framework
253 Good practice example ndash Wessex Water Water live data
Wessex Water is regularly using data geospatially to proactively identify and respond to risk Theirs is a good example of how data can be used to provide an adaptable approach that is regularly reviewed to plan investment
The risk‐based and live approach uses a set of likelihood and consequence models which are built up from all currently available data asset data (eg CCTV data material age) operational data (eg flooding and pollutions incidents) and information (eg locality near hospital or downstream of an overflow) All these data are collated for the entire Wessex region updated regularly and analysed geospatially
Figure 14 Sewer risk scores presented in a risk matrix and geospatially
This allows a risk score (Figure 14) to be calculated for each mapped sewer length which directs investigation more efficiently by allocating each mapped sewer a planned CCTV inspection date
This risk‐based approach has been successful in targeting problematic sewers increasing identification rates threefold Density analysis is performed using asset failure and operational information which allows planning of both proactive structural and operational investment
Proactively found structural issues are far more cost effective to repair before failure and can also prevent serviceability issues
205240txt012|May 2013
35
f
DDrainage Strateegy Frameworrk
Figgure 15 Hotsppot analysis
Thhe hotspot annalysis (Figuure 15) showss where operrational clustters have beeen calculatedd This hootspot analyssis is made aavailable on tthe Wessex WWater corporrate GIS to a llow operati onal staff to target their effforts to mitiggate against ffurther repeaat incidents AAdditional innformation ffrom asset annd operationnal activities ccan be addedd regularly too the databasses which drrive the mod els enabling rissk scores to bbe kept as livve as require d
226 Prrinciple Sixx Innovativve and Susstainable SSolutions
Thhe Drainage Strategy Fraamework proomotes the fuull evaluationn of alternatiives to tradit ionally enngineered sewwerage soluttions to test wwhether thesse offer loweer whole life ccost options or better reesponses to uuncertainty It is anticipaated that draainage solutioons of the futture will be ddifferent froom the ones we are usedd to
Thhese should iinclude (at leeast at a highh level) real ttime control storm waterr retrofit techhniques edducation to eenable custommers to changge behaviou r enhancingg incentives for customerss to reduce suurface water flowing to seewers and innnovative pe rmitting arraangements a cross drainagge networks annd sewage tr eatment worrks Water annd sewerage companies sshould continnue to revieww and deevelop other innovative ssolutions
Foor example wwhere a commpany may hiistorically haave preferredd to tackle seewer floodingg or coombined sewwer overflow pollution byy increasing iits undergrouund equipmment to store mmore rainfalll duuring stormss it might connsider other options in fuuture ndash such as working wwith custommers to mmanage the raainfall close tt eventing it foorm enteringg the sewer syystem o source pre
2205240txt012|Mayy 2013
36
Drainage Strategy Framework
261 Recommended good practice
No Good practice Example references
1 Use cost‐benefit methods to demonstrate that innovative and sustainable solution types provide best value for customers and the wider community
UKWIR will publish new research and guidance in 2013 addressing active control and storm water removal demonstrating how these technologies can be justified and included within Drainage Strategies
2 Consider integrated water resource management Work with partners (especially developers and local authorities) to examine whether use of stored stormwater reduces potable water consumption AND need for capacity in sewers
CIRIA has published a scoping study for water sensitive urban design45 in the UK
3 Consider a mix of conventional and new technologies using more adaptive approaches as low‐regrets responses to uncertainty eg prevent current sewer flooding with underground tank storage but address future risks (worsened by climate change) with retrofit SuDS implemented progressively
CIRIA has published lsquoRetrofitting to manage surface waterrsquo46 a comprehensive guide to planning and delivering this type of project
4 Use carbon accounting methods to compare embodied and emitted carbon in alternative intervention strategies so that these impacts are accounted for in whole life costs
Consider the benefits of surface water removal on the costs (including carbon) of pumping and sewage treatment
UKWIR47 has and continues to publish detailed guidance on carbon accounting for water and sewerage company use
45httpwwwciriaorgserviceresearch_informationAMContentManagerNet ContentDisplayaspxSection=research_informationampContentID=23581 46httpwwwciriaorgSERVICEHomecoreordersproductaspxcatid=5ampprodid=1909 47httpukwirforefront‐librarycomreports08‐cl‐01‐6923419000190269902659465890269
205240txt012|May 2013
37
Drainage Strategy Framework
No Good practice Example references
5 Where interventions include the provision of green space public amenity and improved habitats then Payment for Ecosystem Services approaches can be used to claim further monetised benefits in the appraisal Customers should be consulted to help value these benefits
The Environment Agency will publish data in 2013 on costs and benefits of retrofit stormwater projects to promote understanding and uptake
6 Share data within the industry on innovative solutions to increase knowledge of new technology and SuDs approaches
EA retrofitting SuDs costs and benefits database48
accommodating data from Ofwat AMP5 SuDS pilot initiative and other examples
262 Good practice example ndash Welsh Water surface water reduction and removal strategy for Gowerton and Llanelli
Dŵr Cymru Welsh Water and partners are applying innovative storm water removal methods to address capacity problems in the sewer network in Gowerton and Llanelli49 (population 140000) Current under capacity leads to localised sewer flooding and excessive combined sewer overflow (CSO) spill to the Burry Inlet a protected shellfish water and special area of conservation The capacity problems in the system were a concern for the Environment Agency (Wales) and there was a risk of widespread restrictions to economic development being imposed Dŵr Cymru Welsh Water Carmarthenshire County Council City and County of Swansea Consumer Council for Water Environment Agency Wales and the Welsh Government all worked in partnership to resolve the situation
A brand new hydraulic model was built for the entire sewerage network with particular attention paid to accurately representing the sources of storm run‐off and infiltration The model was verified against data from flow monitors and observed CSO spill frequencies into the Burry Inlet
To begin with a traditional sewer storage solution was proposed that would result in an average 10 spills a year into the shellfish water from all 90 CSOs in the two catchments Although this reduced spills and dealt with some of the flooding and growth issues the storage requirements would have been unaffordable provide no protection against long term climate change and would not tackle the fundamental problem of too much surface water getting into the combined network
An alternative approach based on the reduction and removal of storm water from the combined sewer system was also developed This was in accordance with Dŵr Cymru Welsh Waterrsquos Rainscape50 (surface water elimination and reduction) strategy To identify areas with the most
48httpevidenceenvironment‐agencygovukfcermenDefaultHomeAndLeisureFloodsWhatWereDoingIntoTheFutureScience ProgrammeResearchAndDevelopmentFCRMProjectaspxProjectID=15515be8‐bbed‐4204‐ae56‐3e810ba47694ampPageID=56bad68e‐dcb1‐4bf8‐84cc‐cbfd03ab63a2 49 httpwwwciwemorgmedia674511Paper20820Stephen20Ollierpdf 50httpwwwdwrcymrucom_libraryleaflets_publications_english
205240txt012|May 2013
38
Drainage Strategy Framework
potential for effective storm water removal a flowareaflooding thematic map was developed This was used to focus attention on areas which would deliver the most benefit if storm water removal was carried out These areas are coloured red in Figure 16
Figure 16 Thematic map showing areas of maximum potential for storm water removal
The following interventions (181 in total) were combined into single strategy to be delivered in phases by 2015 2020 and afterwards
bull The management of surface water through swales basins and soakaways rather than through combined sewers resulting in new amenity and ecological areas within the built‐up environment
bull Implementing smarter flow control to better use existing storage and conveyance assets bull Relining of sewers to prevent groundwater ingress bull Removal of land drainage connections to sewers bull Household rainwater harvesting retrofit schemes
surface_water_management_strategypdf
205240txt012|May 2013
39
Drainage Strategy Framework
Figure 17 is an artistrsquos impression of what one of the sustainable urban drainage system solutions may look like
Figure 17 Example retrofit SuDS solution proposed for Gowerton and Llanelli
Modelling has demonstrated that the alternative strategy will achieve the same CSO reduction benefit as the storage strategy together with flooding improvements and additional less tangible benefits at significantly lower cost than the traditional sewer storage solution
Figure 18 illustrates the dispersed nature of solutions identified for central Llanelli
Figure 18 Water sensitive urban design interventions planned for central Llanelli
205240txt012|May 2013
40
Drainage Strategy Framework
Appendix A
Glossary
205240txt012|May 2013
Drainage Strategy Framework
Appendix A Glossary
CAPEX Capital expenditure Appointed water and sewerage companiesrsquo spending on new replacement or refurbished capital assets such as construction or buying machinery
CIWEM Urban Drainage Group (WaPUG) A group of the Chartered Institution of Water and Environmental Management supporting professionals working in urban drainage
Combined Sewer Overflow (CSO) The discharge of untreated sewage diluted with storm water into rivers and the sea CSOs occur during heavy rain and are necessary to reduce the risk of sewer flooding The physical overflow structure is also called a CSO
Common Framework for Capital A planning approach developed for the water and Maintenance Planning sewerage companies in 2002 which provides a robust basis
for assessing future capital maintenance needs The approach is consistent with the needs of Ofwat
Defra The Department for Environment Food and Rural Affairs The Government Department with responsibility for water flooding and water quality in England
Drainage Area Plan (DAP) A detailed plan for a drainage catchment that prioritises a list of interventions based on risk using an approach established in the WRc Sewerage Rehabilitation Manual This approach has been succeeded by Sewerage Risk Management which guides the preparation of Sewerage Management Plans (SMP) Companies vary in how they prepare DAPs or SMPs (or their equivalents) following the general principles that have been established
Drainage Strategy Developed by water and sewerage companies to demonstrate how outcomes will be delivered in drainage catchments over the long term Drainage Strategies will use the information developed in producing a DAPSMP and if a drainage strategy has been produced this should be the starting point in producing a more detailed DAPSMP should this be required It is likely that the activities required to prepare DAPSMP and Drainage Strategies may overlap Drainage Strategies might not refer to specific interventions but instead outline a general approach
Drainage Strategy Framework Guidance to describe the contents and intention of Drainage Strategies
205240txt012|May 2013
Drainage Strategy Framework
Flood Risk Management Plans Required by the Flood Risk Regulations in Flood Risk Areas by December 2015
Flood Risk Regulations The legislative instrument used to implement the requirements of the Floods Directive in England and Wales
Floods Directive DIRECTIVE 200760EC of the European Parliament and of the Council of 23 October 2007 on the assessment and management of flood risks
Lead Local Flood Authority (LLFA) The Shire County or unitary authority with responsibility for managing local flood risk
Local development plans Developed by planning authorities to explain where and what type of development (new homes and businesses) will occur within their area They are required to explain water infrastructure needs to support this development
Local Flood Risk Management Strategy Developed by the Lead Local Flood Authority to explain (LFRMS) how local flood risk will be managed by the Authority and
in partnership with others
Natural Resources Wales From 1 April 2013 Natural Resources Wales (NRW) a new body formed by the Welsh Government will take over the functions previously carried out by the Environment Agency (EA) in Wales alongside those of the Forestry Commission Wales and the Countryside Council for Wales
Ofwat The Water Services Regulation Authority ndash the economic regulator of the water and sewerage companies of England and Wales
OPEX Operating expenditure Appointed water and sewerage companiesrsquo day‐to‐day spending on running the services for example staff costs and power This is likely to include investment in joint projects that do not create or relate to an asset that the company solely or jointly owns
Outcomes Outcomes are the higher level objectives that a companyrsquos actions are intended to deliver A companyrsquos outcome should reflect its customersrsquo priorities identified through appropriate customer engagement and deliver the best long‐term sustainable solution for customers and the environment An outcome may not be bound by a single price control period and should be set in the context of customersrsquo and the environmentrsquos long‐term needs
205240txt012|May 2013
Drainage Strategy Framework
Price Review The process of setting appointed water and sewerage companiesrsquo price limits The next price review will take place in 2014 for the period 2015‐20 Ofwat currently sets price limits every five years
Real Time Control (RTC) Using actuated pumps gates and weirs to actively control flow in sewers Better use can be made of existing infrastructure and links can be made between network treatment and receiving water systems for operational benefits Sometimes referred to as Active Management
River Basin Management (Plans) River Basin Management is a continuous process of planning (to develop River Basin Management Plans) and delivery The Water Framework Directive introduces a formal series of 6 year cycles The first cycle will end in 2015 when following further planning and consultation the River Basin Management Plans will be updated and reissued
Sewerage Management Plan A risk based approach to indentifying investment needs in sewerage systems as described in the Sewerage Risk Management (SRM) approach developed by WRc plc
Storm water retrofit Releasing capacity in sewers by controlling stormwater at the surface using disconnection swales and other sustainable drainage systems (SuDS)
205240txt012|May 2013
We are the Environment Agency We protect and improve the environment and make it a better place for people and wildlife We operate at the place where environmental change has its greatest impact on peoplersquos lives We reduce the risks to people and properties from flooding make sure there is enough water for people and wildlife protect and improve air land and water quality and apply the environmental standards within which industry can operate Acting to reduce climate change and helping people and wildlife adapt to its consequences are at the heart of all that we do We cannot do this alone We work closely with a wide range of partners including government business local authorities other agencies civil society groups and the communities we serve
wwwenvironment‐agencygovuk
Environment Agency National Customer Contact Centre
Telephone 03708 506 506 enquiriesenvironment‐agencygovuk
Ofwat (The Water Services Regulation Authority) is a non‐ministerial government department We are responsible for making sure that the water and sewerage sectors in England and Wales provide consumers with a good quality and efficient service at a fair price
wwwofwatgovuk
Telephone 0121 644 7500 mailboxofwatgsigovuk
Halcrow Group Limited Burderop Park Swindon Wiltshire SN4 0QD
tel 01793 812479 fax 01793 812089 halcrowcom
Halcrow Group Limited is a CH2M HILL company Halcrow Group Limited has prepared this report in accordance with
the instructions of The Environment Agency for the clientrsquos sole and specific use Any other persons who use any information contained herein do so at their own risk

16
Drainage Strategy Framework
Local Flood Risk Management Strategies29 NFCERM is based around six principles community amp partnership catchment based approach sustainability risk based planning beneficiary investment and delivering multiple benefits Companies should also co‐operate with local authorities and the Environment Agency in the exercise of their functions in relation to surface water management and combined sewers under section 94 of the Water Industry Act 1991 The Flood Risk Regulations 200930 implement the Floods Directive and give particular responsibilities to Lead Local Flood Authorities In lsquoFlood Risk Areasrsquo Lead Local Flood Authorities and the Environment Agency are expected to prepare Flood Risk Management Plans that set out flood risk management objectives and measures to manage risk from local flooding The Environment Agency is required to prepare Flood Risk Management Plans for the whole of England and Wales that cover flooding from main rivers the sea and reservoirs It is important for all risk management authorities to work in an effective way to plan to manage flood risk from all sources in a way that is well coordinated across catchments and coastal cells These duties are relevant to drainage planning because of the vital (but not unlimited) role surface water and combined sewers play in reducing flood risk in urban areas The Act also makes provision for the compulsory drainage of new developments through sustainable drainage systems (SuDS) and the lsquoright to connectrsquo being conditional on SuDS being approved by the SuDS Approval Body of the Lead Local Flood Authority
bull The Climate Change Act 200831 created a legal framework to cut greenhouse gas emissions and build the UKrsquos ability to adapt to a changing climate Water and sewerage companies are expected to reduce carbon emissions and adapt to the impact of climate change over the next decades The Government published its first UK climate change risk assessment in January 2012 and this will be updated every 5 years This is relevant to drainage planning because of the carbon embodied in new drainage infrastructure the carbon emitted during the pumping and treatment of sewage and the increase in flooding and pollution that will occur if climate change adaptations are not made The Government expects Ofwat to work towards the targets of its Adaptation Report and to ensure that its regulatory approach explicitly supports companies in adapting to climate change
bull From October 2011 the Water Industry (Schemes for Adoption of Private Sewers) Regulations 201132 transferred responsibility for existing private sewers and lateral drains to water and sewerage companies Pumping stations will be transferred by October 2016 This is relevant to drainage planning because of the significant increase in assets now within the responsibility of the water and sewerage company and the need to understand and respond to risks therein
Six Guiding Principles for a Drainage Strategy
This Drainage Strategy Framework describes good practice themed around six guiding principles Adherence to these principles will help ensure a Drainage Strategy which meets the expectations of Defra the Welsh Government the Environment Agency Natural Resources Wales and Ofwat and
29 The Local Government Association has published guidance on Local Flood Risk Management Strategies httpwwwlocalgovukcdocument_libraryget_fileuuid=a2538b94‐d3c1‐4cec‐81b0‐8aefd2996c5eampgroupId=10171 30 httpwwwenvironment‐agencygovukresearchplanning125459aspx 31 httpwwwdeccgovukencontentcmslegislationcc_act_08cc_act_08aspx 32 httpwwwlegislationgovukukdsi20119780111510933contents
205240txt012|May 2013
10
Drainage Strategy Framework
will be an essential means of communicating with customers and other partners Further details on each principle are described in Section 2 of this document along with examples of good practice
The six principles are
161 Partnership
Water and sewerage companies cannot develop optimal Drainage Strategies on their own and therefore partnership is key to developing and defining objectives performance indicators and the milestones that will need to be achieved in order to achieve measures that will demonstrate the delivery of outcomes Strategies should be developed and implemented in partnership with customers developers Lead Local Flood Authorities planning authorities the Environment Agency and Natural Resources Wales Strategies should align with (informing and informed by) River Basin Management Plans Local Flood Risk Management Strategies Flood Risk Management Plans and local plans (from planning authorities)
162 Uncertainty
Strategies should explain the reliability of data and knowledge about current and future performance of drainage systems They should explain what steps are planned to improve this understanding and how this will benefit customers Where future performance is uncertain (eg because of sensitivity to climate change) they should explain how adaptive approaches will be used to ensure outcomes are met The uncertainty in predictions of future risks should be recognised and accommodated within decision making
163 Risk based
Strategies should be risk based This means that planning operational and investment activities should be based on consideration of the probability and consequence of inadequate drainage function (risks) as these relate to the achievement of measures that demonstrate delivery of outcomes A risk based strategy ensures that investment is made where risks are the greatest
To aid communication risks should be visualised through maps and plans (Figure 10 is an example) To aid risk assessment risks should be monetised combined and predicted into the future To aid options appraisal the impact of interventions on the level of risk should be predicted
The approach to Drainage Strategy development should be risk based itself The degree of detail included should be related to an understanding of the overall level of risks in the catchment now and in the future
164 Whole life costs and benefits
Strategies should be informed by consideration of whole life costs and benefits They should promote a series of interventions which in view of the quantified uncertainties are most likely to result in performance indicators which demonstrate the achievement of outcomes at lowest cost to customers and the community more widely
Costs relate to capital and operational expenditure to deliver interventions and the monetised impacts of drainage failures such as flooding and pollution
Benefits relate to the reduction in risks from drainage failures such as flooding and pollution but should also include wider societal impacts such as those calculated using a lsquoPayments for Ecosystems Servicesrsquo approach
205240txt012|May 2013
11
17
Drainage Strategy Framework
When considering the lsquowhole lifersquo the strategy should consider climate population and asset deterioration trends These are likely to increase risks over the long term if no interventions are made The strategy should state lsquowhatrsquo should be done but also broadly lsquowhenrsquo and in what sequence interventions should happen
165 Live process
The Strategy should be adaptable and periodically reviewed Whilst outcomes are expected to be relatively stable over time the pace at which the strategy delivers outcomes will be linked to volatile influences (like climate and population change) and the decisions made at each price review about the priorities for the following period The strategy should be reviewed at regular intervals to reflect investments already made the changing priorities of the water and sewerage company and partners and the presence of emerging risks The review is also an opportunity to report drainage catchment performance relative to performance measures designed to monitor progress towards achieving outcomes
166 Innovative and sustainable
The framework promotes the full evaluation of alternatives to traditionally engineered sewerage solutions to test whether these offer lower whole life cost options or better responses to uncertainty It is anticipated that drainage solutions of the future will be different from the ones we are used to
These should include (at least at a high level) real time control or active management storm water retrofit techniques education to enable customers to change behaviour enhancing incentives for customers to reduce surface water flowing to sewers and innovative permitting arrangements across drainage networks and wastewater treatment works Water and sewerage companies should continue to review and develop other innovative solutions
For example where a company may historically have preferred to tackle sewer flooding or combined sewer overflow pollution by increasing its underground equipment to store more rainfall during storms it might consider other options in future such as working with customers to manage the rainfall close to source preventing it from entering the sewer system
Mapping the Framework to Current Planning Processes
We assume that practitioners will be following a broad and generic four‐stage planning process common to the Sewerage Risk Management (SRM5) and Surface Water Management Plan (SWMP) processes when preparing Drainage Strategies
Figure 4 is provided to guide water and sewerage companies in the development of Drainage Strategies It identifies each stage of the drainage planning process and highlights the good practice principles (colour coded by theme) in the locations through the process where it is most important that they are adopted
205240txt012|May 2013
12
e
u
t
v
b
DDrainage Strateegy Frameworrk
Initializepre
Establish partne and consultat
process
Define uncertai
Prepare risk d
Partnership
epare
rship ion
nties
ata
Ris
Co
Uncertainty
k assessmen
onsultation on risk issues
Quantify uncertainties
Quantify risks
Risk based
nt Options
Consult
Plan for
Demons life cost
Whole lif costs amp benefits
s appraisal
on options
uncertainties
strate whole and benefit
fe
s Live pro
Intervent
Aligned deliv collaborat solution
Innovative sustainab
Live and vis
cess Innova sustai
tion
ery amp ive s
and le
sible
ative amp nable
Figgure 4 Draina ge Strategy frramework prinnciples mappe d to the drainaage planning pprocess
118 WWho will bennefit from tthe Framewwork
Thhe Drainage Strategy Fraamework willl benefit
bull Water andd sewerage coompanies loooking to impprove their coompany speccific drainagge planning approach and make it fit for purpoose for the deelivery of lonng term outcoomes over mmultiple pricee review cyccles It will ppoint them toowards good practice andd provide exaamples as innspiration andd to promott ne innovation
bull Organisatiions and inddividuals lookking to enga ge with the ddevelopmen t of Drainagee Strategies and scruti nise progresss towards thhe achievemeent of outcommes associateed with enabbling growth adapting tto climate chhange managging floodingg and managging water poollution
22 DDrainagee Strateegy Frammeworkk Thhis section deescribes recoommended ggood practicee against eachh of the six kkey principle s necessary too develop a DDrainage Straategy For refference linkss are made too relevant annd establisheed planning prrocesses and emerging guuidance whicch drainage planners maay find usefuul These exammples are prrovided for innformation aand referenc e only
WWater and sewwerage comppanies shouldd work towaards developiing Drainagee Strategies wwhich apply thhese approachhes in a wayy that is consiistent with thheir needs annd those of thheir customeers and paartners Partnners should ttake note of tthis advice aand prepare tto engage wiith water andd sewerage coompanies on this basis
Thhe recommennded good ppractice is orgganised withhin each prinnciple as it wwould be appproached chhronologicallly in developping a Drainaage Strategy following thhe planning pprocesses alrready esstablished in the Seweragge Risk Manaagement anddor Surface WWater Managgement Plann mmethodologiess
2205240txt012|Mayy 2013
13
21
Drainage Strategy Framework
Principle One Partnership
Water and sewerage companies cannot develop optimal Drainage Strategies on their own and therefore partnership is key to developing and defining objectives performance indicators and the milestones that will need to be achieved in order to achieve measures that will demonstrate the delivery of outcomes Strategies should be developed and implemented in partnership with customers developers Lead Local Flood Authorities planning authorities the Environment Agency and Natural Resources Wales Strategies should align (informing and informed by) with River Basin Management Plans Local Flood Risk Management Strategies Flood Risk Management Plans and local plans (from planning authorities)
205240txt012|May 2013
14
Drainage Strategy Framework
211 Recommended good practice
No Good practice Example references
1 Engage with partners in a drainage catchment to bull Explain the purpose of developing a Drainage Strategy
and partnersrsquo roles in its success amp how each party will benefit from establishing a long term Drainage Strategy
bull Explain what outcomes are and how progress towards achieving them will be measured
bull Share data and information so that a shared understanding of risks and opportunities is developed
bull Explain what current drainage system performance is and how this is expected to change in the future Use risk visualisation tools to do this
bull Explain significant uncertainties and how these affect how interventions are delivered
Thames Water has demonstrated good practice through the development of its Counters Creek sewer flooding proposals This website describes the engagement process and how customers have been kept informed
2 Engage with the following partners in the development of the Drainage Strategy
bull Lead Local Flood Authority (the drainage area may include more than one) because of its responsibilities for local flood risk management and SuDS approval
bull Planning authority (the drainage area may include more than one) because of its role in determining the location and pace of housing development
bull Highways Authority because of the connection of highway runoff to public sewer systems
bull The Environment Agency (in England) because of its responsibilities for flood risk management (strategic overview) and ensuring good ecological quality is met in water bodies
bull Natural Resources Wales (in Wales) because of its responsibilities for flood risk management (strategic oversight) and ensuing good ecological quality is met in water bodies
bull Regional Flood and Coastal Committees who help develop a mutual understanding of flood and coastal erosion risks in an area
bull Bodies representing customers (eg Consumer Council for Water large local businesses flood action groups faith communities)
bull Bodies representing local environmental concerns (eg Wildlife Trusts Rivers Trusts)
bull Water only companies and water and sewerage company departments planning and operating water supply systems Water demand management practice can have an important impact on sewerage headroom
SWMP guidance (Chapter 2) advises on the establishment of partnerships for urban flood management and how to agree and align local objectives
3 Understand alignment of planning cycles and what this means locally (eg periodic review River Basin Management Plan Local Flood Risk Management Strategy Flood Risk Management Plan local plan)
205240txt012|May 2013
15
Drainage Strategy Framework
No Good practice Example references
4 Be alert to opportunities for joint solutions andor shared funding by understanding local plans for new development re‐development improving street furniture and public open space improving parks and green infrastructure Understand Lead Local Flood Authority and Environment Agency programmes for the management of flood and pollution risks
A guide to joint funding of local flood risk management intervention has been published by Defra33 and provides relevant advice to water and sewerage companies and other partners
5 Consider water and sewerage company funded solutions which deliver third‐party non‐sewerage assets that result in the long term least cost delivery of outcomes (eg water and sewerage company funding of household rain barrels and rain gardens to prevent surface water entering sewers)
6 Use data and mapping from the Environment Agency and Natural Resources Wales to understand exposure of drainage infrastructure to extreme events (eg coastal fluvial and surface water flood maps) so that network resilience can be understood and improved if this is cost beneficial
UKWIR has completed a project in 2013 lsquoResilience building a business case for PR14 and beyondrsquo
7 Work with LLFAs and the Environment Agency (or Natural Resources Wales) to understand the effectiveness of interventions at reducing risk and use this information to improve intervention planning
The UPM3 manual (section 7) advises on post project monitoring needs for water quality driven improvements
8 Share Drainage Strategies with partners and stakeholders so that there is transparency around challenges opportunities and the roles expected of different organisations
212 Good practice example ndash South West Water working with local authorities
These examples from South West Water illustrate how the company has worked with local authorities to coordinate investments and to share resources and skills in the development of integrated urban drainage management studies and Surface Water Management Plans
bull South West Water approached Devon County Council (DCC) to pool resources in delivering two (of five) pilot integrated urban drainage management studies (IUDMs) for Exeter and Exmouth South West Water took the lead role for Exmouth but DCC led in Exeter This engagement shared costs across organisations and has facilitated the production of full Surface Water Management Plans The collaboration has resulted in a shared understanding of the urban drainage challenges faced by both organisations and has opened dialogue around investment priorities
bull In Lyme Regis South West Water supported extensive coastal erosion defence works being carried out by West Dorset District Council by accelerating a programme of sewer rehabilitation and targeting renovation of sewers in vulnerable areas
bull In partnership with Cornwall County Council (CCC) and the Environment Agency South West Water has been working on a number of key drainage issues identified by CCC in its Preliminary Flood Risk Assessment (PFRA)
33 httprandddefragovukDefaultaspxMenu=MenuampModule=MoreampLocation=NoneampCompleted=0ampProjectID=17085
205240txt012|May 2013
16
Drainage Strategy Framework
bull In Camborne South West Water has taken the opportunity to invest in sewer separation works which align with the aims of the Camborne Pool Redruth urban regeneration group supported by Cornwall Council and to promote sustainable development economic growth and a strategic aim of lsquosewers for sewagersquo
213 Good practice example ndash Northumbrian Water partnership working in Tyneside
Northumbrian Water has led a sustainable sewerage study for Tyneside34 between 2010 and 2012 It is a good example of how partner organisations can collaborate to understand and resolve drainage issues in their urban area
Its approach was informed by the fact that a shared urban drainage problem around flooding and pollution was best addressed by a shared response from all the relevant organisations The project steering group involved representatives of Northumbrian Water the Consumer Council for Water the Environment Agency and five Lead Local Flood Authorities The urban drainage system collects wastewater for a single wastewater treatment works serving a population of over 900000
Working together the group studied the impact of growth urban creep and climate change on future urban drainage issues Figure 5 illustrates how a city‐wide map of potential problem areas was generated by the project team sharing data on sewer capacity (from Northumbrian Water) population change (from the local authorities) and river flooding (the Environment Agency) It was predicted that future problems were more likely to occur in the darker shaded areas These became focus areas for the project where a range of traditional and novel drainage solutions were tested
Figure 5 Future drainage problem areas indentified through data sharing
34httpcommunicatoremailcomINfNLOjNRayfOA1rfrfYcdK‐S7UwRcYcNoWebViewaspx
205240txt012|May 2013
17
22
Drainage Strategy Framework
The project team was keen to promote its work to customers and the community and prepared a series of newsletters updating interested parties on progress and issues An example is illustrated in Figure 6
C lic k here if y ou are hav in g d if f ic u lties v iew ing th is new s letter
Ho m e A b o u t u s M e d ia ce n tre C o n tact
Issue 2
Ap ril 2012
In th is ed ition U n d e rs tan d in g th e fu tu re
S u s tain ab le d ra ina g e o p tio ns
F ind ou t more about Th e 2 0 1 1 an n ua l re po rt
Ou r e n viro n m e n ta l p o licy
Ou r co rp o ra te re sp o nsib il i ty s tra te g y
W e lcom e to th e s e con d e ditio n o f S u sta inab le se we ra g e a s ix-m on th ly n e ws le tte r p ro d u ce d to b ring yo u th e la te s t n e ws on o u r m a jo r s tud ye xp lo rin g s us tain ab le s ew e ra ge o p tions in th e Tyn e s id e a rea I h o p e yo u fin d th e in fo rm a tio n o f in te res t a n d wo u ld w e lcom e fe e db a ck o n an y o f th e issu es ra ise d
Ric ha rd W a rne ford W a s te wa te r Dire c tor
U nderstand ing the fu tu re W e a ll kn o w th e difficu lties o f a ccu ra tely p re d ic tin g th e fu tu re h ow e ve r ifw e a re to p re pa re fo r i t th e n it is s om e thin g we m us t a tte m p t As p a rt o f th is s tu d y w e a re co ns id e rin g w ha t d em a nds w ill b e p la ce d on th e d ra ina g e s ys tem s a t 2 0 20 a n d a t 2 0 50 in co rpo ra ting g ro w th u rba n cre e p a nd c lim a te cha n ge B y w o rk in g close ly w ith o u r p a rtn e rs an d u s in g th e la tes t te ch n ical res e a rch we h a ve d e ve lo p ed a n d com p u te rm od e lle d a num b e r o f s ce na rios to id en tify a n d d e fin e fu tu re ris ks Th es e ris ks in c lud e p red ic tions o f p o te n tia l floo d in g p o llu tion o r b a rrie rs to g ro w th N o w th a t w e be tte r u n d e rs ta nd th e iss u es we a re a ble to p re pa re p la ns p rom o ting o p po rtu n ities fo r s us ta in a ble d rain ag e s ys tem s in o rde r to d e live r th e b es t p oss ible s e rvice fo r o u r cu s tom e rs b a la n ced a g ains te n viro nm e n tal n e eds a n d cos ts
S usta inab le d ra inage op tions W e b e lie ve o u r a pp ro a ch re p res en ts go o d p ra ctice fo r th e m a n ag em en t o f s u rfa ce wa te r w h ich is to d ea l w ith th e s u rfa ce wa te r as c los e to s ou rce as p oss ib le A w id e ra n g e o f p o te n tial o p po rtu n ities a re b ein g id e n tifie d in c lu d in g lo ca l a n d s tra te gic o p tions
S tra te g ic o p tions a re typ ica lly la rg e r th a n th e lo ca l on es a nd in c lu d e fe a tu res s u ch as a re as o f la nd w h ich w o uld b e a llo we d to flo o d d u rin g he a vy ra in (s a crific ial s to ra g e ) a n d p e rm a n en t w e tla nd fe a tu res
L o ca l op tio ns d esp ite b ein g sm a lle r th a n th e s tra te gic o n es w ill s til l p la y a ke y ro le in th e p ro vis io n o f s us tain ab le d ra ina g e Th e ir n a tu re m e a ns de p lo ym e n t co u ld be m o re w id es p re a d th a n s tra te gic o p tions fe a tu res su ch as w a te r b u tts ra in g a rde ns a nd p e rm e ab le pa vin g co u ld b e re la tive ly e a s y to fi t in to
Figure 6 Newsletter promoting urban drainage partnership working
Principle Two Uncertainty
Strategies should explain the reliability of data and knowledge about current and future performance of drainage systems They should explain what steps are planned to improve this understanding and how this will benefit customers Where future performance is uncertain (eg because of sensitivity to climate change) they should explain how adaptive approaches will be used to ensure outcomes are met The uncertainty in predictions of future risks should be recognised and accommodated within decision making
205240txt012|May 2013
18
Drainage Strategy Framework
221 Recommended good practice
No Good practice Example references
1 Data analysed and used in the development of the strategy related to asset location dimensions condition failure and flood and pollution incidents should be assigned a confidence grading The confidence grading should be related to its accuracy completeness compatibility credibility and currency
Models used to predict blockages and collapses flooding locations polluting discharges and water quality impacts should be assigned a confidence grading based on their accuracy completeness compatibility credibility and currency
Model predictions should be assigned a confidence grading depending on the confidence in the model and whether it is being applied outside of its verification range (eg for extreme events or for atypical geographies)
The purpose of confidence grading data and model results used in strategy setting is to understand the likelihood that outcomes will be achieved in a cost efficient manner Where the outcomes remain uncertain knowledge of data confidence can be used to target improvement programmes
SRM5 (S3‐03‐17) refers to Ofwatrsquos method for recording the reliability and accuracy of regulatory data in bands A to D
The SWMP guidance (Section 319) describes an alternative system of grading data and model results
2 Use the Drainage Strategy to justify data and model improvement programmes This should be focussed on areas where risks are currently (or predicted to be) high and uncertainty in data or models reduces the ability to determine robust operational or capital solutions Poor model verification in high risk areas would be an indicator that model improvements were required
CIWEMrsquos urban drainage group has published a series of guides on hydraulic and water quality modelling They discuss model calibration verification and uses
SRM5 (S3‐04) describes how to determine where the current assessment of risk is sufficient to proceed or whether data and models should be improved
3 Improve understanding of network performance (and improve models) by using long term flow and level monitoring on sewers and CSOs
Yorkshire Water discusses its CSO
monitoring programme here
4 Demonstrate how the uncertainty in both the underlying datamodels and in the future projections is addressed in options appraisal Consider if this should be done implicitly (eg through choosing conservative assumptions) or explicitly through the use of sensitivity analysis or scenario testing
Treasury Green Book supplementary guidance illustrates how to accommodate climate change uncertainties
205240txt012|May 2013
19
Drainage Strategy Framework
No Good practice Example references
5 Population growth new homes and businesses climate change and urban creep combine to make the future highly uncertain but will almost certainly increase flooding and pollution risks from drainage systems Use the Drainage Strategy to explore different scenarios (combining the impact of these drivers) for a near term (le 10 years) and future (ge 30 years) epoch
For example combine modest growth and slight climate change (a low impact case) and contrast with high growth and significant climate change (a high impact case) Where the location of significant new development is unknown include scenarios accommodating different possibilities
Running multiple scenarios is time consuming and costly A risk based approach should be adopted to focus efforts where flooding and pollution risks are especially sensitive to changes in demand
UKWIR has published research on accounting for climate change35 and urban creep36 in sewerage planning together with more general advice on accommodating climate change in water asset management planning37
Ofwat has published research38
predicting the combined impacts of climate change urban creep and development on a national basis
6 In the face of significant uncertainties about future demands on the drainage system and their consequences the Drainage Strategy should identify low‐regrets interventions (ie ones that are robust no matter what the future holds) and ensure that solutions can be adapted if greater certainty is achieved For example through quickening the pace of SuDS retrofit activities or using (previously identified and secured) land to extend underground storage facilities Strategies which remove surface water from sewerage networks provide lsquoheadroomrsquo for unpredictable increases in demand from population and climate change
Designing Resilient Cities A guide to good practice DR Lomardi et al HIS BRE Press
7 Post project appraisal and cost monitoring should be used to capture real costs and performance so that Strategies can be updated and improved with latest information It is especially important to collate and understand the whole life costs of new technologies where industry understanding is currently poor
35httpwwwukwirorgreports03‐cl‐10‐09042794658901799019890198 (poundpound) 36httpukwirforefront‐librarycomreports10‐wm‐07‐1493273 (poundpound) 37httpukwirforefront‐librarycomreports12‐cl‐01‐1694816900019015590145901409465890155 (poundpound) 38httpwwwofwatgovuksustainabilityclimatechangerpt_com201106mottmacsewerpdf
205240txt012|May 2013
20
Drainage Strategy Framework
222 Good practice example ndash Severn Trent Waterrsquos MICAS
Severn Trent Water has developed a process to measure confidence in hydraulic models of sewer systems Modelling Investment Confidence Assessment Scoring (MICAS) was developed to provide an objective evaluation of model confidence It uses information stored in the hydraulic model about the provenance of each data element and the quality of model verification Before the approach was developed the assessment of lsquofitness for purposersquo of models was subjective and based on modellers judgment This was not always reliable and certainly not repeatable and transparent MICAS provides an objective assessment of hydraulic model quality which can be used to inform its use and prioritise improvements to input data and model verification
Figure 7 and Figure 8 illustrate how an understanding of model confidence from the MICAS assessment (right hand side images) can be used to interpret predictions of flooding (left hand side images) In Figure 7 areas at predicted high risk of flooding (red in the left hand side image) are shown to be in high confidence areas of the hydraulic model (green in the right hand side image) In contrast in Figure 8 areas at predicted high risk of flooding (red in the left hand side image) are shown to be in poor confidence areas of the hydraulic models (orange in the right hand side image) In the latter case this information is used to identify where further model improvements would be beneficial
Flood Risk MICAS
Figure 7 Modelled flood risk and MICAS confidence scores (high model confidence)
Flood Risk MICAS
Figure 8 Modelled flood risk and MICAS confidence scores (lower model confidence)
205240txt012|May 2013
21
23
Drainage Strategy Framework
Principle Three Risk Based
Strategies should be risk based This means that planning operational and investment activities should be based on consideration of the probability and consequence of inadequate drainage function (risks) as these relate to the achievement of measures that demonstrate delivery of outcomes A risk based Strategy ensures that investment is made where risks are the greatest
To aid communication risks should be visualised through maps and plans (Figure 10 is an example) To aid risk assessment risks should be monetised combined and predicted into the future To aid options appraisal the impact of interventions on the level of risk should be predicted
The approach to Drainage Strategy development should be risk based itself The degree of detail included should be related to an understanding of the overall level of risks in the catchment now and in the future
231 Recommended good practice
No Good practice Example references
1 Determine where a Drainage Strategy is required by combining current performance with external influences likely to result in deteriorating performance This stage requires no modelling or detailed assessment On a catchment‐by‐catchment (drainage area) basis understand current risks by collating data on current performance eg blockages collapses pumping station failures pollution incidents CSO spills storm tank spills internal flooding incidents external flooding incidents and infiltration rates Relate these risks to performance indicators and the achievement of outcomes Combine with information about known growth rates predictions of urban creep quantity of newly adopted lsquoprivatersquo sewers surface water flooding risks (eg from flood map for surface water) WFD water body status and bathing water status Prioritise catchments with high current risks andor factors suggesting that risks are likely to worsen significantly in the future Consider normalising scoring method for size of catchment (eg by unit area or unit length of sewer) Consult with stakeholders to confirm correct prioritisation Commence with development of Drainage Strategies for the highest ranked catchments Periodically revisit prioritisation (updating with new data) to check that priorities are still correct
The initialisation stage of a Sewer Management Plan (SMP) (described in SRM5) considers how a risk assessment can be used to prioritise which spatial units (eg catchments) should be prioritised for a SMP study
2 Visualise catchment risks (from 1) to illustrate and explain to partners the reasons for prioritisation Accommodate their views amp consider changing prioritisation to aid wider drainage planning requirements (eg increase prioritisation of a catchment with significant surface water flooding problems where close collaboration between water and sewerage company and LLFA will benefit the community)
205240txt012|May 2013
22
Drainage Strategy Framework
No Good practice Example references
3 Clearly relate sewerage risks to the performance indicators that will be used to measure progress towards achieving outcomes eg relate blockage rates to flooding and pollution incidents eg relate increase in flows to increased CSO frequency breaches of permit conditions and deterioration in receiving water quality Adopt a sourcendashpathway‐receptor model and workshop techniques to ensure that cause effect and consequences are fully captured Use performance indicators as the basis for a comprehensive risk assessment that considers likelihood (frequency) and consequence (extent degree and duration of impact) of failure expressed as risk scores Monetise risks in GBP (pound) to align with principle four (whole life costs amp benefits) Use (verified) predictive models to understand near term (lt10 years) and long term (gt30 years) risks The latter to align with principle four (whole life costs amp benefits) Align complexity of method with level of risk recognising the needs of partners eg use complex 2D flood routing models to ascertain (with greater certainty) flood mechanisms and damages where the quantity and frequency of flooding is high and interventions will be complex and costly Elsewhere more simple approaches are appropriate eg use complex UPM3 water quality modelling methods where compliance with river standards or discharge consents is already failing or is expected to do so Elsewhere more simple approaches are appropriate Combine risk scores from different risks to describe the total level of risk in a catchment Use visualisation techniques to communicate combined level of risk Combine analysis from hydraulic blockage and asset deterioration models on a catchment basis In hydraulic analysis consider flooding performance for rainfall events beyond the usually provided standard of protection to understand performance in extreme events in support of partners (especially LLFAs) and in search of cost beneficial interventions at a higher standard than normal
SRM 5 (S3‐03) details approaches to simple and more complex approaches to risk assessment that are consistent with CMPCF guidelines
4 Be alert to interactions between sewer networks and wastewater treatment plans eg by modelling the impact of changing sewer flows on wastewater treatment worksrsquo performance and costs Consider combined impact of different catchments on a single or linked water body (eg an inland river bathing water or shell fishery)
UPM3 guidance discusses approaches to understanding these interactions and applying more complex water quality impact models
5 Establish systems and apply methods to predict how interventions can reduce risks eg how a targeted and pro‐active maintenance can reduce the occurrence of sewer blockage and flooding from lsquoother causesrsquo eg how reducing infiltration can reduce CSO spills eg how reducing connected impermeable area can reduce sewer flooding
205240txt012|May 2013
23
Drainage Strategy Framework
232 Good practice example ndash United Utilities risk assessment
United Utilities has demonstrated a robust risk based approach in the development of sewerage management plans used for long term planning across their area of operations
Hydraulic models were applied in 235 catchments and configured to look at future performance and to evaluate the consequences of inadequate capacity Starting from a baseline of 2010 versions of the models were built for 2020 and 2036 epochs The following model input parameters were adjusted population water consumption infiltration planned development known sewerage improvement projects urban creep rainfall (for climate change)
Two‐dimensional (2D) modelling was used to consider the consequences of sewer flooding resulting from the changes made to reflect the future operating environments As well as the impact on homes and business (from internal and external flooding) the flood risk to critical infrastructure was also considered The operation of CSOs was considered by computing the annual spill volume duration and frequency
Finally predictions of the likelihood and consequence of sewer failure were added taking account of sewer material age and the incident records relating to similar assets
All these data were combined and weighted to generate a Sewer Management Plan (SMP) Risk Score for each length of sewer The process is illustrated in Figure 9
Figure 9 United Utilitiesrsquo process for calculating risk score in sewerage catchments
205240txt012|May 2013
24
Drainage Strategy Framework
Risk scores were summed spatially and monetised so that high priority locations could be identified Mapping and visualisation were used to communicate the results of this assessment priority areas for further investigation and how risks change through time (Figure 10)
Figure 10 Visualisation of sewerage risks
233 Good practice example ndash Northumbrian Water risk assessment
Northumbrian Water completes an annual assessment of hydraulic capacity in its sewerage network at the drainage area scale Its approach does not require hydraulic models to have been completed and yet can reliably highlight areas of under‐capacity in need of further investigation through more detailed analysis including hydraulic modelling New and emerging risk areas can also be identified by applying data for population growth which occurs through development lsquoWhat ifrsquo scenarios can be run to test when capacity limits may be overcome and flood risks potentially set to increase It demonstrates good lsquorisk basedrsquo planning principles because it shows the drainage planner where more detailed analysis is warranted
The approach uses the following data from company records population connected to sewer P water consumption rate G (lhd) trade discharge E (ls) pipe diameter and gradient pipe connectivity CSO consent pass forward rate (ls) pumping station rate (ls) sewage treatment flow rate (ls) A wastewater dry weather capacity map calculates pipe full capacity dry weather flow (PG+E+I) and Formula A flow for fully combined (1360P+2E+DWF) and separate (4PG+3I+E) areas of the network Infiltration (I) is assumed to be 50 PG +E
205240txt012|May 2013
25
Drainage Strategy Framework
A theoretical assessment of network capacity is then calculated by comparing Formula A with pipe full capacity flow consent values at CSOs and wastewater treatment works and pumping rates This determines areas of the network with a capacity shortfall with a potential capacity shortfall and with no capacity shortfall
When run across the whole company area approximately 100 out of 500 drainage areas were found to be under capacity Over 60 of these areas had recorded sewer flooding incidents In over 300 drainage areas there was no forecast capacity shortfall Only 7 of these drainage areas had recorded sewer flooding incidents Overall the system proved to be very reliable at predicting drainage areas likely to have sewer flooding problems because of sewer under‐capacity
In under capacity drainage areas an intermediate (hydraulic model based) assessment is then carried out Figure 11 shows the results thematically mapped for an example drainage area Red areas are predicted to have a very high risk of sewer flooding Yellow and green areas are predicted to have a low risk of sewer flooding
Figure 11 Example of a drainage area capacity map
205240txt012|May 2013
26
24
Drainage Strategy Framework
Principle Four Whole Life Costs and Benefits
Strategies should be informed by consideration of whole life costs and benefits They should promote a series of interventions which in view of the quantified uncertainties are most likely to result in performance indicators which demonstrate the achievement of outcomes at lowest cost to customers and the community more widely
Costs relate to capital and operational expenditure to deliver interventions and the monetised impacts of drainage failures such as flooding and pollution
Benefits relate to the reduction in risks from drainage failures such as flooding and pollution but should also include wider societal impacts such as those calculated using a lsquoPayments for Ecosystems Servicesrsquo approach
When considering the lsquowhole lifersquo the strategy should consider climate population and asset deterioration trends These are likely to increase risks over the long term if no interventions are made The strategy should state lsquowhatrsquo should be done but also broadly lsquowhenrsquo and in what sequence interventions should happen
241 Recommended good practice
No Good practice Example references
1 Predict risks into the future for at least two epochs le10 years (to understand what the company needs to do now and how this fits with longer term outcomes) and ge30 years to understand long term needs in light of changing population and other pressures
Account for the following changes in demand
bull Growth ‐ new homes and businesses
bull Urban creep ndash uncontrolled addition of connected impermeable area
bull Climate change ndash affecting design events (flood predictions) time‐series (CSO and treated effluent quantities) river flows and temperatures
bull Infiltrationexfiltration ndash through deteriorating sewer condition
bull Dry weather flows ndash through changes in water consumption rates
2 Combining monetised risks (associated with sewerage failures) determine whole life costs for a lsquodo nothingrsquo scenario (ie no interventions)
Include costs associated with electricity consumption (in the network and at the wastewater treatment works) and CO2 emissions
UKWIR will publish in 2014 a revision to their Long Term Least Cost Planning for Wastewater Supply‐Demand
guidance This may provide tools and methods for expressing costs and benefits to support the development of a Drainage Strategy
205240txt012|May 2013
27
Drainage Strategy Framework
No Good practice Example references
3 Test intervention strategies which keep performance indicators on track to deliver outcomes by adding capacity (supply) reducing flows (demand) or altering operational regimes
Include the costs of interventions and the benefits of reduced risks to inform selection of the most cost beneficial strategy over the whole life
Have regard to the timing of interventions recognising that uncertainty may require low‐regrets (insensitive to uncertainty) solutions and that delaying major interventions may be more affordable and attractive in the short term Discounting should be used to compare the costs and benefits of interventions occurring at different times
Recognise that some interventions will be obligatory and defined (eg maintenance of a spill frequency standard at a CSO) whilst others will be more discretionary focused on achieving outcomes rather than specific outputs
SRM5 (Section 8) defines and contrasts cost benefit analysis cost effectiveness analysis whole life cost analysis and risk cost benefit analysis
HM Treasury Green Book39
sets out a framework for the appraisal of long term projects which can be applied to the development of a Drainage Strategy
4 Donrsquot at first be concerned with the distribution of costs and benefits between partners who may be sharing costs Identify the most cost beneficial solution first and then debate and agree an equitable sharing of costs
Give equal weighting to OPEX (operating expenditure) and CAPEX (capital expenditure) costs so not to cause bias towards capital intensive solutions Properly consider the costs and benefits of pro‐active maintenance regimes and campaigns to influence customers to reduce fats oils and greases (FOG) build‐ups and the misuse of sewers
Consider the affordability of solutions the impact on customersrsquo bills and the resources of other organisations to play their part
UKWIR research outputs40 in 2013 (SW01) will provide a framework for making a business case for separating storm water from combined sewers
5 Where interventions include the provision of green space public amenity and improved habitats then Payment for Ecosystem Services approaches should be used to identify further monetised benefits in the appraisal Customers should be consulted to help value these benefits
Supplementary Green Book41
guidance describes methods for accounting for environmental impacts including the ecosystems approach
39 httpwwwhm‐treasurygovukdata_greenbook_indexhtm 40 httpwwwukwirorgpublishorsystemcomponent_viewaspLogDocId=96116 41 httpwwwhm‐treasurygovukdaccounting_environmental_impactspdf
205240txt012|May 2013
28
Drainage Strategy Framework
242 Good practice example ndash Severn Trent Water making the case for surface water separation in Stoke-on-Trent
In this example42 Severn Trent Water compared alternative ways of addressing sewer flooding problems by looking at a range of costs and benefits not all of which were directly associated with its specific responsibilities as a water and sewerage company Whilst the example does not express a monetised value for all costs and benefits over the whole life it does illustrate the types of factors which could be included in an appraisal of this type scaled to address problems at a catchment level It also demonstrates how working collaboratively can help identify solutions which are cost‐beneficial for the community at large
In an area of Stoke served by a combined sewer system five properties were at risk from sewer flooding in cellars for events equal to and less frequent than the 1 in 10 year probability A conventional sewer pumping station based solution was presented as the standard option
However a nearby former hospital site was also undergoing re‐development which would result in reduced runoff to the combined sewer The new drainage regime in the redevelopment site was sufficient to remove the flood risk at the five properties (this was a do nothing strategy)
A third option completely separated the development site runoff from the combined sewer and also addressed local flood risk issues nearby The solution required a new storm sewer and a network of swales and other SuDS features connecting with an ordinary watercourse
Table 1 illustrates how costs and benefits were compared across the three alternative strategies Each provided the same benefit in terms of the number of homes (5) relieved from sewer flooding The novel SuDS and surface water management solution additionally gave local flood risk relief to 3 further properties The separationSuDS strategy came at a higher capital cost but delivered greater social cost benefits savings in annual operating costs and a bonus improvement water quality (because of reduced CSO spill volume) Severn Trent selected the separation SuDS solution because the higher capital costs were offset by other benefits
Table 1 Costs and benefits of drainage improvements in part of Stoke-on-Trent
Do nothing Standard option
SuDS
Sewer flooding benefits 5 5 5
Other flooding benefits 0 0 3
Change in runoff to combined sewer (m3year) 0 0 ‐40000
Estimated cost (pound) 0 168000 419000
42httpwwwciwemorgmedia695460Paper203_Creating20Sewer20Capacity_Presentation2 0by20Mike20Woodpdf
205240txt012|May 2013
29
Drainage Strategy Framework
Do nothing Standard option
SuDS
Social Cost Benefit (pound) 16000 5000 51000
Change in electricity costs (poundyear) 0 +75 ‐525
Programme impact (years to deliver solution) + 4 0 +4
CSO spill volume (m3 in 1year event) +298 0 ‐397
243 Good practice example ndash New York City comparison of grey and green infrastructure drainage strategies
This example is taken from New York in the United States of America Itrsquos an illustration of how whole life costs have been compared for alternative strategies to solve urban drainage issues on a mega‐city scale The key data are summarised in Table 2
Table 2 Comparing drainage strategies in New York
Grey Strategy
Green Strategy
CSO spill volume reduction (billion gallons year)
101 122
Wider benefits over 20 years ($ million) 0 139 to 418
Whole life costs over 20 years ($ billion) 68 53
The information is taken from the New York City Green Infrastructure Plan43 produced by the Mayorrsquos Office in 2010 The Plan (and recent updates) provides a comprehensive evidence base around costs and benefits of different approaches to address the cityrsquos drainage problems It is therefore an excellent example of how drainage strategies can be described in plain language for a non‐specialist audience concerned with their environment and the cost of providing infrastructure to enhance it
It is becoming commonplace for North American cities (eg Portland and Philadelphia) to address the issue of frequent combined sewer overflow (CSO) operation by using a combination of grey infrastructure (sewers) and green infrastructure (sustainable drainage systems) The wider health
43 httpwwwnycgovhtmldephtmlstormwaternyc_green_infrastructure_planshtml
205240txt012|May 2013
30
25
Drainage Strategy Framework
and ecological benefits of green infrastructure approaches and the reduced reliance on materials and energy are attractive to utility planners and cities alike
New York has 422 CSOs and an agreed Long Term Control Strategy to significantly reduce the impact wet weather discharges have on aquatic systems throughout the city Annual discharges are currently (2010) estimated to be 30 billion gallons (114 million cubic meters) per year Building on existing and committed new sewer plans an agreed grey infrastructure based strategy to this problem is set to reduce these discharges to 198 billion gallons per year (a 34 reduction) by the 2030s An alternative green infrastructure approach based around intercepting the first inch (25mm) of rainfall across 10 of the impermeable city area by 2030 is predicted to reduce CSO spills to 179 billion gallons per year
Planners have calculated that the whole life costs after 20 years of the grey infrastructure solution will be $68 billion (2010 prices) compared to the green infrastructure whole life costs of $53 billion The green infrastructure strategy reduces CSO spills by more than the grey alternative for $15 billion less in terms of whole life cost Further planners have calculated that New Yorkers will benefit by up to $41844 million (accumulated over 20 years) in additional benefits associated with lower energy bills from control of urban heating increased property values and improved health
Based on this analysis New York City has committed itself to an aggressive green infrastructure based runoff control strategy to provide long term reductions in CSO spills The plan is to achieve interception of 15 of impermeable area by 2015 4 by 2020 7 by 2025 and 10 by 2030
Principle Five Live Process
The Strategy should be adaptable and periodically reviewed Whilst outcomes are expected to be relatively stable over time the pace at which the Strategy delivers outcomes will be linked to volatile influences (like climate and population change) and to the decisions made at each price review about the priorities for the following period The Strategy should be reviewed at regular intervals to reflect investments already made the changing priorities of the water and sewerage company and partners and the presence of emerging risks The review is also an opportunity to report drainage catchment performance relative to performance measures designed to monitor progress towards achieving outcomes
44 Estimated using methods from the New York Municipal Forest Resource Analysis (MFRA) prepared by the US Dept of Agriculture
205240txt012|May 2013
31
Drainage Strategy Framework
251 Recommended good practice
No Good practice Example references
1 Regularly repeat screening exercise to determine catchments requiring a Drainage Strategy and modify programme of Strategy development accordingly
Check for changes in measured rates of flooding and pollution incidents blockages collapses pumping station failures etc
Check for changes in extent and location of new development
Check for activities being undertaken by partners (eg redevelopment urban realm improvements and flooding and pollution management activities)
SRM5 illustrates how improved and updated knowledge of system performance should be applied to establish Strategies
2 In lsquolive Strategiesrsquo repeat risk assessment when data and models improve and adjust confidence scores accordingly
Confirm that Strategy will still achieve performance indicators and outcomes at least cost Revise Strategy as necessary
3 Periodically refresh Strategy accommodating impact of interventions already delivered using re‐verified predictive tools as appropriate
Confirm that Strategy will still achieve performance indicators and outcomes at least cost Revise Strategy as necessary
Triggers for a wholesale review of the Strategy are likely to be significant changes to the location or extent of planned development
4 Monitor report and share (with partners) the measures used to demonstrate delivery of outcomes Example measures may include the number of properties which experience sewer flooding the number of properties at risk of flooding the number of properties at risk from sewerage asset failure risk indices that capture both the probability and consequence of failure customer satisfaction with regards to clean rivers and beaches the number of pollution incidents the frequency of combined sewer overflow operation and compliance with discharge permit conditions
252 Good practice example ndash Thames Water live DAP
Thames Water has initiated a DAP (drainage area plan) Live approach Itrsquos a good example of how companies are continuously monitoring and updating the status of drainage area risks It provides a lsquoliversquo snapshot of the current health of all drainage areas in Thames Waterrsquos region allowing real time planning as part of a strategic approach It enables drainage planners to view the effectiveness
205240txt012|May 2013
32
Drainage Strategy Framework
of intervention strategies and compare incident rates across varying geographies and development types in the Thames Valley
DAP Live will be available for all catchments in the Thames Water area thus enabling
bull high level monitoring of risks across the business bull a live and strategic review of catchment performance bull prioritisation of catchments based on risk and bull an ability to share data with partners collaborating in drainage planning and improvements
Figure 12 illustrates the types of data managed through the DAP Live system These include asset data political and drainage boundaries environmental data operational data property amp growth data and modelling data As new data become available the DAP Live system is updated so that drainage planners have the most current view on emerging risks and issues
Asset data
Operational data
Property and growth data
Modelling data
Environmental data
Boundaries (SDACs operational political)
Figure 12 Data types held in the DAP Live system
Figure 13 illustrates how the system can provide analysis at a variety of scales from local authority boundaries sewage treatment works catchments drainage areas or a regular grid
205240txt012|May 2013
33
Drainage Strategy Framework
NE PROVINCES
WESTERN PROVINCES
NE LONDON bull Ops areas local W LONDON
SE LONDON authorities Large TIDWORTH SE PROVINCES
bull STW Catchments
bull Drainage areas(SDACs)
bull Regular grid Small
Figure 13 DAP Live reporting performance at different scales
205240txt012|May 2013
34
Drainage Strategy Framework
253 Good practice example ndash Wessex Water Water live data
Wessex Water is regularly using data geospatially to proactively identify and respond to risk Theirs is a good example of how data can be used to provide an adaptable approach that is regularly reviewed to plan investment
The risk‐based and live approach uses a set of likelihood and consequence models which are built up from all currently available data asset data (eg CCTV data material age) operational data (eg flooding and pollutions incidents) and information (eg locality near hospital or downstream of an overflow) All these data are collated for the entire Wessex region updated regularly and analysed geospatially
Figure 14 Sewer risk scores presented in a risk matrix and geospatially
This allows a risk score (Figure 14) to be calculated for each mapped sewer length which directs investigation more efficiently by allocating each mapped sewer a planned CCTV inspection date
This risk‐based approach has been successful in targeting problematic sewers increasing identification rates threefold Density analysis is performed using asset failure and operational information which allows planning of both proactive structural and operational investment
Proactively found structural issues are far more cost effective to repair before failure and can also prevent serviceability issues
205240txt012|May 2013
35
f
DDrainage Strateegy Frameworrk
Figgure 15 Hotsppot analysis
Thhe hotspot annalysis (Figuure 15) showss where operrational clustters have beeen calculatedd This hootspot analyssis is made aavailable on tthe Wessex WWater corporrate GIS to a llow operati onal staff to target their effforts to mitiggate against ffurther repeaat incidents AAdditional innformation ffrom asset annd operationnal activities ccan be addedd regularly too the databasses which drrive the mod els enabling rissk scores to bbe kept as livve as require d
226 Prrinciple Sixx Innovativve and Susstainable SSolutions
Thhe Drainage Strategy Fraamework proomotes the fuull evaluationn of alternatiives to tradit ionally enngineered sewwerage soluttions to test wwhether thesse offer loweer whole life ccost options or better reesponses to uuncertainty It is anticipaated that draainage solutioons of the futture will be ddifferent froom the ones we are usedd to
Thhese should iinclude (at leeast at a highh level) real ttime control storm waterr retrofit techhniques edducation to eenable custommers to changge behaviou r enhancingg incentives for customerss to reduce suurface water flowing to seewers and innnovative pe rmitting arraangements a cross drainagge networks annd sewage tr eatment worrks Water annd sewerage companies sshould continnue to revieww and deevelop other innovative ssolutions
Foor example wwhere a commpany may hiistorically haave preferredd to tackle seewer floodingg or coombined sewwer overflow pollution byy increasing iits undergrouund equipmment to store mmore rainfalll duuring stormss it might connsider other options in fuuture ndash such as working wwith custommers to mmanage the raainfall close tt eventing it foorm enteringg the sewer syystem o source pre
2205240txt012|Mayy 2013
36
Drainage Strategy Framework
261 Recommended good practice
No Good practice Example references
1 Use cost‐benefit methods to demonstrate that innovative and sustainable solution types provide best value for customers and the wider community
UKWIR will publish new research and guidance in 2013 addressing active control and storm water removal demonstrating how these technologies can be justified and included within Drainage Strategies
2 Consider integrated water resource management Work with partners (especially developers and local authorities) to examine whether use of stored stormwater reduces potable water consumption AND need for capacity in sewers
CIRIA has published a scoping study for water sensitive urban design45 in the UK
3 Consider a mix of conventional and new technologies using more adaptive approaches as low‐regrets responses to uncertainty eg prevent current sewer flooding with underground tank storage but address future risks (worsened by climate change) with retrofit SuDS implemented progressively
CIRIA has published lsquoRetrofitting to manage surface waterrsquo46 a comprehensive guide to planning and delivering this type of project
4 Use carbon accounting methods to compare embodied and emitted carbon in alternative intervention strategies so that these impacts are accounted for in whole life costs
Consider the benefits of surface water removal on the costs (including carbon) of pumping and sewage treatment
UKWIR47 has and continues to publish detailed guidance on carbon accounting for water and sewerage company use
45httpwwwciriaorgserviceresearch_informationAMContentManagerNet ContentDisplayaspxSection=research_informationampContentID=23581 46httpwwwciriaorgSERVICEHomecoreordersproductaspxcatid=5ampprodid=1909 47httpukwirforefront‐librarycomreports08‐cl‐01‐6923419000190269902659465890269
205240txt012|May 2013
37
Drainage Strategy Framework
No Good practice Example references
5 Where interventions include the provision of green space public amenity and improved habitats then Payment for Ecosystem Services approaches can be used to claim further monetised benefits in the appraisal Customers should be consulted to help value these benefits
The Environment Agency will publish data in 2013 on costs and benefits of retrofit stormwater projects to promote understanding and uptake
6 Share data within the industry on innovative solutions to increase knowledge of new technology and SuDs approaches
EA retrofitting SuDs costs and benefits database48
accommodating data from Ofwat AMP5 SuDS pilot initiative and other examples
262 Good practice example ndash Welsh Water surface water reduction and removal strategy for Gowerton and Llanelli
Dŵr Cymru Welsh Water and partners are applying innovative storm water removal methods to address capacity problems in the sewer network in Gowerton and Llanelli49 (population 140000) Current under capacity leads to localised sewer flooding and excessive combined sewer overflow (CSO) spill to the Burry Inlet a protected shellfish water and special area of conservation The capacity problems in the system were a concern for the Environment Agency (Wales) and there was a risk of widespread restrictions to economic development being imposed Dŵr Cymru Welsh Water Carmarthenshire County Council City and County of Swansea Consumer Council for Water Environment Agency Wales and the Welsh Government all worked in partnership to resolve the situation
A brand new hydraulic model was built for the entire sewerage network with particular attention paid to accurately representing the sources of storm run‐off and infiltration The model was verified against data from flow monitors and observed CSO spill frequencies into the Burry Inlet
To begin with a traditional sewer storage solution was proposed that would result in an average 10 spills a year into the shellfish water from all 90 CSOs in the two catchments Although this reduced spills and dealt with some of the flooding and growth issues the storage requirements would have been unaffordable provide no protection against long term climate change and would not tackle the fundamental problem of too much surface water getting into the combined network
An alternative approach based on the reduction and removal of storm water from the combined sewer system was also developed This was in accordance with Dŵr Cymru Welsh Waterrsquos Rainscape50 (surface water elimination and reduction) strategy To identify areas with the most
48httpevidenceenvironment‐agencygovukfcermenDefaultHomeAndLeisureFloodsWhatWereDoingIntoTheFutureScience ProgrammeResearchAndDevelopmentFCRMProjectaspxProjectID=15515be8‐bbed‐4204‐ae56‐3e810ba47694ampPageID=56bad68e‐dcb1‐4bf8‐84cc‐cbfd03ab63a2 49 httpwwwciwemorgmedia674511Paper20820Stephen20Ollierpdf 50httpwwwdwrcymrucom_libraryleaflets_publications_english
205240txt012|May 2013
38
Drainage Strategy Framework
potential for effective storm water removal a flowareaflooding thematic map was developed This was used to focus attention on areas which would deliver the most benefit if storm water removal was carried out These areas are coloured red in Figure 16
Figure 16 Thematic map showing areas of maximum potential for storm water removal
The following interventions (181 in total) were combined into single strategy to be delivered in phases by 2015 2020 and afterwards
bull The management of surface water through swales basins and soakaways rather than through combined sewers resulting in new amenity and ecological areas within the built‐up environment
bull Implementing smarter flow control to better use existing storage and conveyance assets bull Relining of sewers to prevent groundwater ingress bull Removal of land drainage connections to sewers bull Household rainwater harvesting retrofit schemes
surface_water_management_strategypdf
205240txt012|May 2013
39
Drainage Strategy Framework
Figure 17 is an artistrsquos impression of what one of the sustainable urban drainage system solutions may look like
Figure 17 Example retrofit SuDS solution proposed for Gowerton and Llanelli
Modelling has demonstrated that the alternative strategy will achieve the same CSO reduction benefit as the storage strategy together with flooding improvements and additional less tangible benefits at significantly lower cost than the traditional sewer storage solution
Figure 18 illustrates the dispersed nature of solutions identified for central Llanelli
Figure 18 Water sensitive urban design interventions planned for central Llanelli
205240txt012|May 2013
40
Drainage Strategy Framework
Appendix A
Glossary
205240txt012|May 2013
Drainage Strategy Framework
Appendix A Glossary
CAPEX Capital expenditure Appointed water and sewerage companiesrsquo spending on new replacement or refurbished capital assets such as construction or buying machinery
CIWEM Urban Drainage Group (WaPUG) A group of the Chartered Institution of Water and Environmental Management supporting professionals working in urban drainage
Combined Sewer Overflow (CSO) The discharge of untreated sewage diluted with storm water into rivers and the sea CSOs occur during heavy rain and are necessary to reduce the risk of sewer flooding The physical overflow structure is also called a CSO
Common Framework for Capital A planning approach developed for the water and Maintenance Planning sewerage companies in 2002 which provides a robust basis
for assessing future capital maintenance needs The approach is consistent with the needs of Ofwat
Defra The Department for Environment Food and Rural Affairs The Government Department with responsibility for water flooding and water quality in England
Drainage Area Plan (DAP) A detailed plan for a drainage catchment that prioritises a list of interventions based on risk using an approach established in the WRc Sewerage Rehabilitation Manual This approach has been succeeded by Sewerage Risk Management which guides the preparation of Sewerage Management Plans (SMP) Companies vary in how they prepare DAPs or SMPs (or their equivalents) following the general principles that have been established
Drainage Strategy Developed by water and sewerage companies to demonstrate how outcomes will be delivered in drainage catchments over the long term Drainage Strategies will use the information developed in producing a DAPSMP and if a drainage strategy has been produced this should be the starting point in producing a more detailed DAPSMP should this be required It is likely that the activities required to prepare DAPSMP and Drainage Strategies may overlap Drainage Strategies might not refer to specific interventions but instead outline a general approach
Drainage Strategy Framework Guidance to describe the contents and intention of Drainage Strategies
205240txt012|May 2013
Drainage Strategy Framework
Flood Risk Management Plans Required by the Flood Risk Regulations in Flood Risk Areas by December 2015
Flood Risk Regulations The legislative instrument used to implement the requirements of the Floods Directive in England and Wales
Floods Directive DIRECTIVE 200760EC of the European Parliament and of the Council of 23 October 2007 on the assessment and management of flood risks
Lead Local Flood Authority (LLFA) The Shire County or unitary authority with responsibility for managing local flood risk
Local development plans Developed by planning authorities to explain where and what type of development (new homes and businesses) will occur within their area They are required to explain water infrastructure needs to support this development
Local Flood Risk Management Strategy Developed by the Lead Local Flood Authority to explain (LFRMS) how local flood risk will be managed by the Authority and
in partnership with others
Natural Resources Wales From 1 April 2013 Natural Resources Wales (NRW) a new body formed by the Welsh Government will take over the functions previously carried out by the Environment Agency (EA) in Wales alongside those of the Forestry Commission Wales and the Countryside Council for Wales
Ofwat The Water Services Regulation Authority ndash the economic regulator of the water and sewerage companies of England and Wales
OPEX Operating expenditure Appointed water and sewerage companiesrsquo day‐to‐day spending on running the services for example staff costs and power This is likely to include investment in joint projects that do not create or relate to an asset that the company solely or jointly owns
Outcomes Outcomes are the higher level objectives that a companyrsquos actions are intended to deliver A companyrsquos outcome should reflect its customersrsquo priorities identified through appropriate customer engagement and deliver the best long‐term sustainable solution for customers and the environment An outcome may not be bound by a single price control period and should be set in the context of customersrsquo and the environmentrsquos long‐term needs
205240txt012|May 2013
Drainage Strategy Framework
Price Review The process of setting appointed water and sewerage companiesrsquo price limits The next price review will take place in 2014 for the period 2015‐20 Ofwat currently sets price limits every five years
Real Time Control (RTC) Using actuated pumps gates and weirs to actively control flow in sewers Better use can be made of existing infrastructure and links can be made between network treatment and receiving water systems for operational benefits Sometimes referred to as Active Management
River Basin Management (Plans) River Basin Management is a continuous process of planning (to develop River Basin Management Plans) and delivery The Water Framework Directive introduces a formal series of 6 year cycles The first cycle will end in 2015 when following further planning and consultation the River Basin Management Plans will be updated and reissued
Sewerage Management Plan A risk based approach to indentifying investment needs in sewerage systems as described in the Sewerage Risk Management (SRM) approach developed by WRc plc
Storm water retrofit Releasing capacity in sewers by controlling stormwater at the surface using disconnection swales and other sustainable drainage systems (SuDS)
205240txt012|May 2013
We are the Environment Agency We protect and improve the environment and make it a better place for people and wildlife We operate at the place where environmental change has its greatest impact on peoplersquos lives We reduce the risks to people and properties from flooding make sure there is enough water for people and wildlife protect and improve air land and water quality and apply the environmental standards within which industry can operate Acting to reduce climate change and helping people and wildlife adapt to its consequences are at the heart of all that we do We cannot do this alone We work closely with a wide range of partners including government business local authorities other agencies civil society groups and the communities we serve
wwwenvironment‐agencygovuk
Environment Agency National Customer Contact Centre
Telephone 03708 506 506 enquiriesenvironment‐agencygovuk
Ofwat (The Water Services Regulation Authority) is a non‐ministerial government department We are responsible for making sure that the water and sewerage sectors in England and Wales provide consumers with a good quality and efficient service at a fair price
wwwofwatgovuk
Telephone 0121 644 7500 mailboxofwatgsigovuk
Halcrow Group Limited Burderop Park Swindon Wiltshire SN4 0QD
tel 01793 812479 fax 01793 812089 halcrowcom
Halcrow Group Limited is a CH2M HILL company Halcrow Group Limited has prepared this report in accordance with
the instructions of The Environment Agency for the clientrsquos sole and specific use Any other persons who use any information contained herein do so at their own risk

Drainage Strategy Framework
will be an essential means of communicating with customers and other partners Further details on each principle are described in Section 2 of this document along with examples of good practice
The six principles are
161 Partnership
Water and sewerage companies cannot develop optimal Drainage Strategies on their own and therefore partnership is key to developing and defining objectives performance indicators and the milestones that will need to be achieved in order to achieve measures that will demonstrate the delivery of outcomes Strategies should be developed and implemented in partnership with customers developers Lead Local Flood Authorities planning authorities the Environment Agency and Natural Resources Wales Strategies should align with (informing and informed by) River Basin Management Plans Local Flood Risk Management Strategies Flood Risk Management Plans and local plans (from planning authorities)
162 Uncertainty
Strategies should explain the reliability of data and knowledge about current and future performance of drainage systems They should explain what steps are planned to improve this understanding and how this will benefit customers Where future performance is uncertain (eg because of sensitivity to climate change) they should explain how adaptive approaches will be used to ensure outcomes are met The uncertainty in predictions of future risks should be recognised and accommodated within decision making
163 Risk based
Strategies should be risk based This means that planning operational and investment activities should be based on consideration of the probability and consequence of inadequate drainage function (risks) as these relate to the achievement of measures that demonstrate delivery of outcomes A risk based strategy ensures that investment is made where risks are the greatest
To aid communication risks should be visualised through maps and plans (Figure 10 is an example) To aid risk assessment risks should be monetised combined and predicted into the future To aid options appraisal the impact of interventions on the level of risk should be predicted
The approach to Drainage Strategy development should be risk based itself The degree of detail included should be related to an understanding of the overall level of risks in the catchment now and in the future
164 Whole life costs and benefits
Strategies should be informed by consideration of whole life costs and benefits They should promote a series of interventions which in view of the quantified uncertainties are most likely to result in performance indicators which demonstrate the achievement of outcomes at lowest cost to customers and the community more widely
Costs relate to capital and operational expenditure to deliver interventions and the monetised impacts of drainage failures such as flooding and pollution
Benefits relate to the reduction in risks from drainage failures such as flooding and pollution but should also include wider societal impacts such as those calculated using a lsquoPayments for Ecosystems Servicesrsquo approach
205240txt012|May 2013
11
17
Drainage Strategy Framework
When considering the lsquowhole lifersquo the strategy should consider climate population and asset deterioration trends These are likely to increase risks over the long term if no interventions are made The strategy should state lsquowhatrsquo should be done but also broadly lsquowhenrsquo and in what sequence interventions should happen
165 Live process
The Strategy should be adaptable and periodically reviewed Whilst outcomes are expected to be relatively stable over time the pace at which the strategy delivers outcomes will be linked to volatile influences (like climate and population change) and the decisions made at each price review about the priorities for the following period The strategy should be reviewed at regular intervals to reflect investments already made the changing priorities of the water and sewerage company and partners and the presence of emerging risks The review is also an opportunity to report drainage catchment performance relative to performance measures designed to monitor progress towards achieving outcomes
166 Innovative and sustainable
The framework promotes the full evaluation of alternatives to traditionally engineered sewerage solutions to test whether these offer lower whole life cost options or better responses to uncertainty It is anticipated that drainage solutions of the future will be different from the ones we are used to
These should include (at least at a high level) real time control or active management storm water retrofit techniques education to enable customers to change behaviour enhancing incentives for customers to reduce surface water flowing to sewers and innovative permitting arrangements across drainage networks and wastewater treatment works Water and sewerage companies should continue to review and develop other innovative solutions
For example where a company may historically have preferred to tackle sewer flooding or combined sewer overflow pollution by increasing its underground equipment to store more rainfall during storms it might consider other options in future such as working with customers to manage the rainfall close to source preventing it from entering the sewer system
Mapping the Framework to Current Planning Processes
We assume that practitioners will be following a broad and generic four‐stage planning process common to the Sewerage Risk Management (SRM5) and Surface Water Management Plan (SWMP) processes when preparing Drainage Strategies
Figure 4 is provided to guide water and sewerage companies in the development of Drainage Strategies It identifies each stage of the drainage planning process and highlights the good practice principles (colour coded by theme) in the locations through the process where it is most important that they are adopted
205240txt012|May 2013
12
e
u
t
v
b
DDrainage Strateegy Frameworrk
Initializepre
Establish partne and consultat
process
Define uncertai
Prepare risk d
Partnership
epare
rship ion
nties
ata
Ris
Co
Uncertainty
k assessmen
onsultation on risk issues
Quantify uncertainties
Quantify risks
Risk based
nt Options
Consult
Plan for
Demons life cost
Whole lif costs amp benefits
s appraisal
on options
uncertainties
strate whole and benefit
fe
s Live pro
Intervent
Aligned deliv collaborat solution
Innovative sustainab
Live and vis
cess Innova sustai
tion
ery amp ive s
and le
sible
ative amp nable
Figgure 4 Draina ge Strategy frramework prinnciples mappe d to the drainaage planning pprocess
118 WWho will bennefit from tthe Framewwork
Thhe Drainage Strategy Fraamework willl benefit
bull Water andd sewerage coompanies loooking to impprove their coompany speccific drainagge planning approach and make it fit for purpoose for the deelivery of lonng term outcoomes over mmultiple pricee review cyccles It will ppoint them toowards good practice andd provide exaamples as innspiration andd to promott ne innovation
bull Organisatiions and inddividuals lookking to enga ge with the ddevelopmen t of Drainagee Strategies and scruti nise progresss towards thhe achievemeent of outcommes associateed with enabbling growth adapting tto climate chhange managging floodingg and managging water poollution
22 DDrainagee Strateegy Frammeworkk Thhis section deescribes recoommended ggood practicee against eachh of the six kkey principle s necessary too develop a DDrainage Straategy For refference linkss are made too relevant annd establisheed planning prrocesses and emerging guuidance whicch drainage planners maay find usefuul These exammples are prrovided for innformation aand referenc e only
WWater and sewwerage comppanies shouldd work towaards developiing Drainagee Strategies wwhich apply thhese approachhes in a wayy that is consiistent with thheir needs annd those of thheir customeers and paartners Partnners should ttake note of tthis advice aand prepare tto engage wiith water andd sewerage coompanies on this basis
Thhe recommennded good ppractice is orgganised withhin each prinnciple as it wwould be appproached chhronologicallly in developping a Drainaage Strategy following thhe planning pprocesses alrready esstablished in the Seweragge Risk Manaagement anddor Surface WWater Managgement Plann mmethodologiess
2205240txt012|Mayy 2013
13
21
Drainage Strategy Framework
Principle One Partnership
Water and sewerage companies cannot develop optimal Drainage Strategies on their own and therefore partnership is key to developing and defining objectives performance indicators and the milestones that will need to be achieved in order to achieve measures that will demonstrate the delivery of outcomes Strategies should be developed and implemented in partnership with customers developers Lead Local Flood Authorities planning authorities the Environment Agency and Natural Resources Wales Strategies should align (informing and informed by) with River Basin Management Plans Local Flood Risk Management Strategies Flood Risk Management Plans and local plans (from planning authorities)
205240txt012|May 2013
14
Drainage Strategy Framework
211 Recommended good practice
No Good practice Example references
1 Engage with partners in a drainage catchment to bull Explain the purpose of developing a Drainage Strategy
and partnersrsquo roles in its success amp how each party will benefit from establishing a long term Drainage Strategy
bull Explain what outcomes are and how progress towards achieving them will be measured
bull Share data and information so that a shared understanding of risks and opportunities is developed
bull Explain what current drainage system performance is and how this is expected to change in the future Use risk visualisation tools to do this
bull Explain significant uncertainties and how these affect how interventions are delivered
Thames Water has demonstrated good practice through the development of its Counters Creek sewer flooding proposals This website describes the engagement process and how customers have been kept informed
2 Engage with the following partners in the development of the Drainage Strategy
bull Lead Local Flood Authority (the drainage area may include more than one) because of its responsibilities for local flood risk management and SuDS approval
bull Planning authority (the drainage area may include more than one) because of its role in determining the location and pace of housing development
bull Highways Authority because of the connection of highway runoff to public sewer systems
bull The Environment Agency (in England) because of its responsibilities for flood risk management (strategic overview) and ensuring good ecological quality is met in water bodies
bull Natural Resources Wales (in Wales) because of its responsibilities for flood risk management (strategic oversight) and ensuing good ecological quality is met in water bodies
bull Regional Flood and Coastal Committees who help develop a mutual understanding of flood and coastal erosion risks in an area
bull Bodies representing customers (eg Consumer Council for Water large local businesses flood action groups faith communities)
bull Bodies representing local environmental concerns (eg Wildlife Trusts Rivers Trusts)
bull Water only companies and water and sewerage company departments planning and operating water supply systems Water demand management practice can have an important impact on sewerage headroom
SWMP guidance (Chapter 2) advises on the establishment of partnerships for urban flood management and how to agree and align local objectives
3 Understand alignment of planning cycles and what this means locally (eg periodic review River Basin Management Plan Local Flood Risk Management Strategy Flood Risk Management Plan local plan)
205240txt012|May 2013
15
Drainage Strategy Framework
No Good practice Example references
4 Be alert to opportunities for joint solutions andor shared funding by understanding local plans for new development re‐development improving street furniture and public open space improving parks and green infrastructure Understand Lead Local Flood Authority and Environment Agency programmes for the management of flood and pollution risks
A guide to joint funding of local flood risk management intervention has been published by Defra33 and provides relevant advice to water and sewerage companies and other partners
5 Consider water and sewerage company funded solutions which deliver third‐party non‐sewerage assets that result in the long term least cost delivery of outcomes (eg water and sewerage company funding of household rain barrels and rain gardens to prevent surface water entering sewers)
6 Use data and mapping from the Environment Agency and Natural Resources Wales to understand exposure of drainage infrastructure to extreme events (eg coastal fluvial and surface water flood maps) so that network resilience can be understood and improved if this is cost beneficial
UKWIR has completed a project in 2013 lsquoResilience building a business case for PR14 and beyondrsquo
7 Work with LLFAs and the Environment Agency (or Natural Resources Wales) to understand the effectiveness of interventions at reducing risk and use this information to improve intervention planning
The UPM3 manual (section 7) advises on post project monitoring needs for water quality driven improvements
8 Share Drainage Strategies with partners and stakeholders so that there is transparency around challenges opportunities and the roles expected of different organisations
212 Good practice example ndash South West Water working with local authorities
These examples from South West Water illustrate how the company has worked with local authorities to coordinate investments and to share resources and skills in the development of integrated urban drainage management studies and Surface Water Management Plans
bull South West Water approached Devon County Council (DCC) to pool resources in delivering two (of five) pilot integrated urban drainage management studies (IUDMs) for Exeter and Exmouth South West Water took the lead role for Exmouth but DCC led in Exeter This engagement shared costs across organisations and has facilitated the production of full Surface Water Management Plans The collaboration has resulted in a shared understanding of the urban drainage challenges faced by both organisations and has opened dialogue around investment priorities
bull In Lyme Regis South West Water supported extensive coastal erosion defence works being carried out by West Dorset District Council by accelerating a programme of sewer rehabilitation and targeting renovation of sewers in vulnerable areas
bull In partnership with Cornwall County Council (CCC) and the Environment Agency South West Water has been working on a number of key drainage issues identified by CCC in its Preliminary Flood Risk Assessment (PFRA)
33 httprandddefragovukDefaultaspxMenu=MenuampModule=MoreampLocation=NoneampCompleted=0ampProjectID=17085
205240txt012|May 2013
16
Drainage Strategy Framework
bull In Camborne South West Water has taken the opportunity to invest in sewer separation works which align with the aims of the Camborne Pool Redruth urban regeneration group supported by Cornwall Council and to promote sustainable development economic growth and a strategic aim of lsquosewers for sewagersquo
213 Good practice example ndash Northumbrian Water partnership working in Tyneside
Northumbrian Water has led a sustainable sewerage study for Tyneside34 between 2010 and 2012 It is a good example of how partner organisations can collaborate to understand and resolve drainage issues in their urban area
Its approach was informed by the fact that a shared urban drainage problem around flooding and pollution was best addressed by a shared response from all the relevant organisations The project steering group involved representatives of Northumbrian Water the Consumer Council for Water the Environment Agency and five Lead Local Flood Authorities The urban drainage system collects wastewater for a single wastewater treatment works serving a population of over 900000
Working together the group studied the impact of growth urban creep and climate change on future urban drainage issues Figure 5 illustrates how a city‐wide map of potential problem areas was generated by the project team sharing data on sewer capacity (from Northumbrian Water) population change (from the local authorities) and river flooding (the Environment Agency) It was predicted that future problems were more likely to occur in the darker shaded areas These became focus areas for the project where a range of traditional and novel drainage solutions were tested
Figure 5 Future drainage problem areas indentified through data sharing
34httpcommunicatoremailcomINfNLOjNRayfOA1rfrfYcdK‐S7UwRcYcNoWebViewaspx
205240txt012|May 2013
17
22
Drainage Strategy Framework
The project team was keen to promote its work to customers and the community and prepared a series of newsletters updating interested parties on progress and issues An example is illustrated in Figure 6
C lic k here if y ou are hav in g d if f ic u lties v iew ing th is new s letter
Ho m e A b o u t u s M e d ia ce n tre C o n tact
Issue 2
Ap ril 2012
In th is ed ition U n d e rs tan d in g th e fu tu re
S u s tain ab le d ra ina g e o p tio ns
F ind ou t more about Th e 2 0 1 1 an n ua l re po rt
Ou r e n viro n m e n ta l p o licy
Ou r co rp o ra te re sp o nsib il i ty s tra te g y
W e lcom e to th e s e con d e ditio n o f S u sta inab le se we ra g e a s ix-m on th ly n e ws le tte r p ro d u ce d to b ring yo u th e la te s t n e ws on o u r m a jo r s tud ye xp lo rin g s us tain ab le s ew e ra ge o p tions in th e Tyn e s id e a rea I h o p e yo u fin d th e in fo rm a tio n o f in te res t a n d wo u ld w e lcom e fe e db a ck o n an y o f th e issu es ra ise d
Ric ha rd W a rne ford W a s te wa te r Dire c tor
U nderstand ing the fu tu re W e a ll kn o w th e difficu lties o f a ccu ra tely p re d ic tin g th e fu tu re h ow e ve r ifw e a re to p re pa re fo r i t th e n it is s om e thin g we m us t a tte m p t As p a rt o f th is s tu d y w e a re co ns id e rin g w ha t d em a nds w ill b e p la ce d on th e d ra ina g e s ys tem s a t 2 0 20 a n d a t 2 0 50 in co rpo ra ting g ro w th u rba n cre e p a nd c lim a te cha n ge B y w o rk in g close ly w ith o u r p a rtn e rs an d u s in g th e la tes t te ch n ical res e a rch we h a ve d e ve lo p ed a n d com p u te rm od e lle d a num b e r o f s ce na rios to id en tify a n d d e fin e fu tu re ris ks Th es e ris ks in c lud e p red ic tions o f p o te n tia l floo d in g p o llu tion o r b a rrie rs to g ro w th N o w th a t w e be tte r u n d e rs ta nd th e iss u es we a re a ble to p re pa re p la ns p rom o ting o p po rtu n ities fo r s us ta in a ble d rain ag e s ys tem s in o rde r to d e live r th e b es t p oss ible s e rvice fo r o u r cu s tom e rs b a la n ced a g ains te n viro nm e n tal n e eds a n d cos ts
S usta inab le d ra inage op tions W e b e lie ve o u r a pp ro a ch re p res en ts go o d p ra ctice fo r th e m a n ag em en t o f s u rfa ce wa te r w h ich is to d ea l w ith th e s u rfa ce wa te r as c los e to s ou rce as p oss ib le A w id e ra n g e o f p o te n tial o p po rtu n ities a re b ein g id e n tifie d in c lu d in g lo ca l a n d s tra te gic o p tions
S tra te g ic o p tions a re typ ica lly la rg e r th a n th e lo ca l on es a nd in c lu d e fe a tu res s u ch as a re as o f la nd w h ich w o uld b e a llo we d to flo o d d u rin g he a vy ra in (s a crific ial s to ra g e ) a n d p e rm a n en t w e tla nd fe a tu res
L o ca l op tio ns d esp ite b ein g sm a lle r th a n th e s tra te gic o n es w ill s til l p la y a ke y ro le in th e p ro vis io n o f s us tain ab le d ra ina g e Th e ir n a tu re m e a ns de p lo ym e n t co u ld be m o re w id es p re a d th a n s tra te gic o p tions fe a tu res su ch as w a te r b u tts ra in g a rde ns a nd p e rm e ab le pa vin g co u ld b e re la tive ly e a s y to fi t in to
Figure 6 Newsletter promoting urban drainage partnership working
Principle Two Uncertainty
Strategies should explain the reliability of data and knowledge about current and future performance of drainage systems They should explain what steps are planned to improve this understanding and how this will benefit customers Where future performance is uncertain (eg because of sensitivity to climate change) they should explain how adaptive approaches will be used to ensure outcomes are met The uncertainty in predictions of future risks should be recognised and accommodated within decision making
205240txt012|May 2013
18
Drainage Strategy Framework
221 Recommended good practice
No Good practice Example references
1 Data analysed and used in the development of the strategy related to asset location dimensions condition failure and flood and pollution incidents should be assigned a confidence grading The confidence grading should be related to its accuracy completeness compatibility credibility and currency
Models used to predict blockages and collapses flooding locations polluting discharges and water quality impacts should be assigned a confidence grading based on their accuracy completeness compatibility credibility and currency
Model predictions should be assigned a confidence grading depending on the confidence in the model and whether it is being applied outside of its verification range (eg for extreme events or for atypical geographies)
The purpose of confidence grading data and model results used in strategy setting is to understand the likelihood that outcomes will be achieved in a cost efficient manner Where the outcomes remain uncertain knowledge of data confidence can be used to target improvement programmes
SRM5 (S3‐03‐17) refers to Ofwatrsquos method for recording the reliability and accuracy of regulatory data in bands A to D
The SWMP guidance (Section 319) describes an alternative system of grading data and model results
2 Use the Drainage Strategy to justify data and model improvement programmes This should be focussed on areas where risks are currently (or predicted to be) high and uncertainty in data or models reduces the ability to determine robust operational or capital solutions Poor model verification in high risk areas would be an indicator that model improvements were required
CIWEMrsquos urban drainage group has published a series of guides on hydraulic and water quality modelling They discuss model calibration verification and uses
SRM5 (S3‐04) describes how to determine where the current assessment of risk is sufficient to proceed or whether data and models should be improved
3 Improve understanding of network performance (and improve models) by using long term flow and level monitoring on sewers and CSOs
Yorkshire Water discusses its CSO
monitoring programme here
4 Demonstrate how the uncertainty in both the underlying datamodels and in the future projections is addressed in options appraisal Consider if this should be done implicitly (eg through choosing conservative assumptions) or explicitly through the use of sensitivity analysis or scenario testing
Treasury Green Book supplementary guidance illustrates how to accommodate climate change uncertainties
205240txt012|May 2013
19
Drainage Strategy Framework
No Good practice Example references
5 Population growth new homes and businesses climate change and urban creep combine to make the future highly uncertain but will almost certainly increase flooding and pollution risks from drainage systems Use the Drainage Strategy to explore different scenarios (combining the impact of these drivers) for a near term (le 10 years) and future (ge 30 years) epoch
For example combine modest growth and slight climate change (a low impact case) and contrast with high growth and significant climate change (a high impact case) Where the location of significant new development is unknown include scenarios accommodating different possibilities
Running multiple scenarios is time consuming and costly A risk based approach should be adopted to focus efforts where flooding and pollution risks are especially sensitive to changes in demand
UKWIR has published research on accounting for climate change35 and urban creep36 in sewerage planning together with more general advice on accommodating climate change in water asset management planning37
Ofwat has published research38
predicting the combined impacts of climate change urban creep and development on a national basis
6 In the face of significant uncertainties about future demands on the drainage system and their consequences the Drainage Strategy should identify low‐regrets interventions (ie ones that are robust no matter what the future holds) and ensure that solutions can be adapted if greater certainty is achieved For example through quickening the pace of SuDS retrofit activities or using (previously identified and secured) land to extend underground storage facilities Strategies which remove surface water from sewerage networks provide lsquoheadroomrsquo for unpredictable increases in demand from population and climate change
Designing Resilient Cities A guide to good practice DR Lomardi et al HIS BRE Press
7 Post project appraisal and cost monitoring should be used to capture real costs and performance so that Strategies can be updated and improved with latest information It is especially important to collate and understand the whole life costs of new technologies where industry understanding is currently poor
35httpwwwukwirorgreports03‐cl‐10‐09042794658901799019890198 (poundpound) 36httpukwirforefront‐librarycomreports10‐wm‐07‐1493273 (poundpound) 37httpukwirforefront‐librarycomreports12‐cl‐01‐1694816900019015590145901409465890155 (poundpound) 38httpwwwofwatgovuksustainabilityclimatechangerpt_com201106mottmacsewerpdf
205240txt012|May 2013
20
Drainage Strategy Framework
222 Good practice example ndash Severn Trent Waterrsquos MICAS
Severn Trent Water has developed a process to measure confidence in hydraulic models of sewer systems Modelling Investment Confidence Assessment Scoring (MICAS) was developed to provide an objective evaluation of model confidence It uses information stored in the hydraulic model about the provenance of each data element and the quality of model verification Before the approach was developed the assessment of lsquofitness for purposersquo of models was subjective and based on modellers judgment This was not always reliable and certainly not repeatable and transparent MICAS provides an objective assessment of hydraulic model quality which can be used to inform its use and prioritise improvements to input data and model verification
Figure 7 and Figure 8 illustrate how an understanding of model confidence from the MICAS assessment (right hand side images) can be used to interpret predictions of flooding (left hand side images) In Figure 7 areas at predicted high risk of flooding (red in the left hand side image) are shown to be in high confidence areas of the hydraulic model (green in the right hand side image) In contrast in Figure 8 areas at predicted high risk of flooding (red in the left hand side image) are shown to be in poor confidence areas of the hydraulic models (orange in the right hand side image) In the latter case this information is used to identify where further model improvements would be beneficial
Flood Risk MICAS
Figure 7 Modelled flood risk and MICAS confidence scores (high model confidence)
Flood Risk MICAS
Figure 8 Modelled flood risk and MICAS confidence scores (lower model confidence)
205240txt012|May 2013
21
23
Drainage Strategy Framework
Principle Three Risk Based
Strategies should be risk based This means that planning operational and investment activities should be based on consideration of the probability and consequence of inadequate drainage function (risks) as these relate to the achievement of measures that demonstrate delivery of outcomes A risk based Strategy ensures that investment is made where risks are the greatest
To aid communication risks should be visualised through maps and plans (Figure 10 is an example) To aid risk assessment risks should be monetised combined and predicted into the future To aid options appraisal the impact of interventions on the level of risk should be predicted
The approach to Drainage Strategy development should be risk based itself The degree of detail included should be related to an understanding of the overall level of risks in the catchment now and in the future
231 Recommended good practice
No Good practice Example references
1 Determine where a Drainage Strategy is required by combining current performance with external influences likely to result in deteriorating performance This stage requires no modelling or detailed assessment On a catchment‐by‐catchment (drainage area) basis understand current risks by collating data on current performance eg blockages collapses pumping station failures pollution incidents CSO spills storm tank spills internal flooding incidents external flooding incidents and infiltration rates Relate these risks to performance indicators and the achievement of outcomes Combine with information about known growth rates predictions of urban creep quantity of newly adopted lsquoprivatersquo sewers surface water flooding risks (eg from flood map for surface water) WFD water body status and bathing water status Prioritise catchments with high current risks andor factors suggesting that risks are likely to worsen significantly in the future Consider normalising scoring method for size of catchment (eg by unit area or unit length of sewer) Consult with stakeholders to confirm correct prioritisation Commence with development of Drainage Strategies for the highest ranked catchments Periodically revisit prioritisation (updating with new data) to check that priorities are still correct
The initialisation stage of a Sewer Management Plan (SMP) (described in SRM5) considers how a risk assessment can be used to prioritise which spatial units (eg catchments) should be prioritised for a SMP study
2 Visualise catchment risks (from 1) to illustrate and explain to partners the reasons for prioritisation Accommodate their views amp consider changing prioritisation to aid wider drainage planning requirements (eg increase prioritisation of a catchment with significant surface water flooding problems where close collaboration between water and sewerage company and LLFA will benefit the community)
205240txt012|May 2013
22
Drainage Strategy Framework
No Good practice Example references
3 Clearly relate sewerage risks to the performance indicators that will be used to measure progress towards achieving outcomes eg relate blockage rates to flooding and pollution incidents eg relate increase in flows to increased CSO frequency breaches of permit conditions and deterioration in receiving water quality Adopt a sourcendashpathway‐receptor model and workshop techniques to ensure that cause effect and consequences are fully captured Use performance indicators as the basis for a comprehensive risk assessment that considers likelihood (frequency) and consequence (extent degree and duration of impact) of failure expressed as risk scores Monetise risks in GBP (pound) to align with principle four (whole life costs amp benefits) Use (verified) predictive models to understand near term (lt10 years) and long term (gt30 years) risks The latter to align with principle four (whole life costs amp benefits) Align complexity of method with level of risk recognising the needs of partners eg use complex 2D flood routing models to ascertain (with greater certainty) flood mechanisms and damages where the quantity and frequency of flooding is high and interventions will be complex and costly Elsewhere more simple approaches are appropriate eg use complex UPM3 water quality modelling methods where compliance with river standards or discharge consents is already failing or is expected to do so Elsewhere more simple approaches are appropriate Combine risk scores from different risks to describe the total level of risk in a catchment Use visualisation techniques to communicate combined level of risk Combine analysis from hydraulic blockage and asset deterioration models on a catchment basis In hydraulic analysis consider flooding performance for rainfall events beyond the usually provided standard of protection to understand performance in extreme events in support of partners (especially LLFAs) and in search of cost beneficial interventions at a higher standard than normal
SRM 5 (S3‐03) details approaches to simple and more complex approaches to risk assessment that are consistent with CMPCF guidelines
4 Be alert to interactions between sewer networks and wastewater treatment plans eg by modelling the impact of changing sewer flows on wastewater treatment worksrsquo performance and costs Consider combined impact of different catchments on a single or linked water body (eg an inland river bathing water or shell fishery)
UPM3 guidance discusses approaches to understanding these interactions and applying more complex water quality impact models
5 Establish systems and apply methods to predict how interventions can reduce risks eg how a targeted and pro‐active maintenance can reduce the occurrence of sewer blockage and flooding from lsquoother causesrsquo eg how reducing infiltration can reduce CSO spills eg how reducing connected impermeable area can reduce sewer flooding
205240txt012|May 2013
23
Drainage Strategy Framework
232 Good practice example ndash United Utilities risk assessment
United Utilities has demonstrated a robust risk based approach in the development of sewerage management plans used for long term planning across their area of operations
Hydraulic models were applied in 235 catchments and configured to look at future performance and to evaluate the consequences of inadequate capacity Starting from a baseline of 2010 versions of the models were built for 2020 and 2036 epochs The following model input parameters were adjusted population water consumption infiltration planned development known sewerage improvement projects urban creep rainfall (for climate change)
Two‐dimensional (2D) modelling was used to consider the consequences of sewer flooding resulting from the changes made to reflect the future operating environments As well as the impact on homes and business (from internal and external flooding) the flood risk to critical infrastructure was also considered The operation of CSOs was considered by computing the annual spill volume duration and frequency
Finally predictions of the likelihood and consequence of sewer failure were added taking account of sewer material age and the incident records relating to similar assets
All these data were combined and weighted to generate a Sewer Management Plan (SMP) Risk Score for each length of sewer The process is illustrated in Figure 9
Figure 9 United Utilitiesrsquo process for calculating risk score in sewerage catchments
205240txt012|May 2013
24
Drainage Strategy Framework
Risk scores were summed spatially and monetised so that high priority locations could be identified Mapping and visualisation were used to communicate the results of this assessment priority areas for further investigation and how risks change through time (Figure 10)
Figure 10 Visualisation of sewerage risks
233 Good practice example ndash Northumbrian Water risk assessment
Northumbrian Water completes an annual assessment of hydraulic capacity in its sewerage network at the drainage area scale Its approach does not require hydraulic models to have been completed and yet can reliably highlight areas of under‐capacity in need of further investigation through more detailed analysis including hydraulic modelling New and emerging risk areas can also be identified by applying data for population growth which occurs through development lsquoWhat ifrsquo scenarios can be run to test when capacity limits may be overcome and flood risks potentially set to increase It demonstrates good lsquorisk basedrsquo planning principles because it shows the drainage planner where more detailed analysis is warranted
The approach uses the following data from company records population connected to sewer P water consumption rate G (lhd) trade discharge E (ls) pipe diameter and gradient pipe connectivity CSO consent pass forward rate (ls) pumping station rate (ls) sewage treatment flow rate (ls) A wastewater dry weather capacity map calculates pipe full capacity dry weather flow (PG+E+I) and Formula A flow for fully combined (1360P+2E+DWF) and separate (4PG+3I+E) areas of the network Infiltration (I) is assumed to be 50 PG +E
205240txt012|May 2013
25
Drainage Strategy Framework
A theoretical assessment of network capacity is then calculated by comparing Formula A with pipe full capacity flow consent values at CSOs and wastewater treatment works and pumping rates This determines areas of the network with a capacity shortfall with a potential capacity shortfall and with no capacity shortfall
When run across the whole company area approximately 100 out of 500 drainage areas were found to be under capacity Over 60 of these areas had recorded sewer flooding incidents In over 300 drainage areas there was no forecast capacity shortfall Only 7 of these drainage areas had recorded sewer flooding incidents Overall the system proved to be very reliable at predicting drainage areas likely to have sewer flooding problems because of sewer under‐capacity
In under capacity drainage areas an intermediate (hydraulic model based) assessment is then carried out Figure 11 shows the results thematically mapped for an example drainage area Red areas are predicted to have a very high risk of sewer flooding Yellow and green areas are predicted to have a low risk of sewer flooding
Figure 11 Example of a drainage area capacity map
205240txt012|May 2013
26
24
Drainage Strategy Framework
Principle Four Whole Life Costs and Benefits
Strategies should be informed by consideration of whole life costs and benefits They should promote a series of interventions which in view of the quantified uncertainties are most likely to result in performance indicators which demonstrate the achievement of outcomes at lowest cost to customers and the community more widely
Costs relate to capital and operational expenditure to deliver interventions and the monetised impacts of drainage failures such as flooding and pollution
Benefits relate to the reduction in risks from drainage failures such as flooding and pollution but should also include wider societal impacts such as those calculated using a lsquoPayments for Ecosystems Servicesrsquo approach
When considering the lsquowhole lifersquo the strategy should consider climate population and asset deterioration trends These are likely to increase risks over the long term if no interventions are made The strategy should state lsquowhatrsquo should be done but also broadly lsquowhenrsquo and in what sequence interventions should happen
241 Recommended good practice
No Good practice Example references
1 Predict risks into the future for at least two epochs le10 years (to understand what the company needs to do now and how this fits with longer term outcomes) and ge30 years to understand long term needs in light of changing population and other pressures
Account for the following changes in demand
bull Growth ‐ new homes and businesses
bull Urban creep ndash uncontrolled addition of connected impermeable area
bull Climate change ndash affecting design events (flood predictions) time‐series (CSO and treated effluent quantities) river flows and temperatures
bull Infiltrationexfiltration ndash through deteriorating sewer condition
bull Dry weather flows ndash through changes in water consumption rates
2 Combining monetised risks (associated with sewerage failures) determine whole life costs for a lsquodo nothingrsquo scenario (ie no interventions)
Include costs associated with electricity consumption (in the network and at the wastewater treatment works) and CO2 emissions
UKWIR will publish in 2014 a revision to their Long Term Least Cost Planning for Wastewater Supply‐Demand
guidance This may provide tools and methods for expressing costs and benefits to support the development of a Drainage Strategy
205240txt012|May 2013
27
Drainage Strategy Framework
No Good practice Example references
3 Test intervention strategies which keep performance indicators on track to deliver outcomes by adding capacity (supply) reducing flows (demand) or altering operational regimes
Include the costs of interventions and the benefits of reduced risks to inform selection of the most cost beneficial strategy over the whole life
Have regard to the timing of interventions recognising that uncertainty may require low‐regrets (insensitive to uncertainty) solutions and that delaying major interventions may be more affordable and attractive in the short term Discounting should be used to compare the costs and benefits of interventions occurring at different times
Recognise that some interventions will be obligatory and defined (eg maintenance of a spill frequency standard at a CSO) whilst others will be more discretionary focused on achieving outcomes rather than specific outputs
SRM5 (Section 8) defines and contrasts cost benefit analysis cost effectiveness analysis whole life cost analysis and risk cost benefit analysis
HM Treasury Green Book39
sets out a framework for the appraisal of long term projects which can be applied to the development of a Drainage Strategy
4 Donrsquot at first be concerned with the distribution of costs and benefits between partners who may be sharing costs Identify the most cost beneficial solution first and then debate and agree an equitable sharing of costs
Give equal weighting to OPEX (operating expenditure) and CAPEX (capital expenditure) costs so not to cause bias towards capital intensive solutions Properly consider the costs and benefits of pro‐active maintenance regimes and campaigns to influence customers to reduce fats oils and greases (FOG) build‐ups and the misuse of sewers
Consider the affordability of solutions the impact on customersrsquo bills and the resources of other organisations to play their part
UKWIR research outputs40 in 2013 (SW01) will provide a framework for making a business case for separating storm water from combined sewers
5 Where interventions include the provision of green space public amenity and improved habitats then Payment for Ecosystem Services approaches should be used to identify further monetised benefits in the appraisal Customers should be consulted to help value these benefits
Supplementary Green Book41
guidance describes methods for accounting for environmental impacts including the ecosystems approach
39 httpwwwhm‐treasurygovukdata_greenbook_indexhtm 40 httpwwwukwirorgpublishorsystemcomponent_viewaspLogDocId=96116 41 httpwwwhm‐treasurygovukdaccounting_environmental_impactspdf
205240txt012|May 2013
28
Drainage Strategy Framework
242 Good practice example ndash Severn Trent Water making the case for surface water separation in Stoke-on-Trent
In this example42 Severn Trent Water compared alternative ways of addressing sewer flooding problems by looking at a range of costs and benefits not all of which were directly associated with its specific responsibilities as a water and sewerage company Whilst the example does not express a monetised value for all costs and benefits over the whole life it does illustrate the types of factors which could be included in an appraisal of this type scaled to address problems at a catchment level It also demonstrates how working collaboratively can help identify solutions which are cost‐beneficial for the community at large
In an area of Stoke served by a combined sewer system five properties were at risk from sewer flooding in cellars for events equal to and less frequent than the 1 in 10 year probability A conventional sewer pumping station based solution was presented as the standard option
However a nearby former hospital site was also undergoing re‐development which would result in reduced runoff to the combined sewer The new drainage regime in the redevelopment site was sufficient to remove the flood risk at the five properties (this was a do nothing strategy)
A third option completely separated the development site runoff from the combined sewer and also addressed local flood risk issues nearby The solution required a new storm sewer and a network of swales and other SuDS features connecting with an ordinary watercourse
Table 1 illustrates how costs and benefits were compared across the three alternative strategies Each provided the same benefit in terms of the number of homes (5) relieved from sewer flooding The novel SuDS and surface water management solution additionally gave local flood risk relief to 3 further properties The separationSuDS strategy came at a higher capital cost but delivered greater social cost benefits savings in annual operating costs and a bonus improvement water quality (because of reduced CSO spill volume) Severn Trent selected the separation SuDS solution because the higher capital costs were offset by other benefits
Table 1 Costs and benefits of drainage improvements in part of Stoke-on-Trent
Do nothing Standard option
SuDS
Sewer flooding benefits 5 5 5
Other flooding benefits 0 0 3
Change in runoff to combined sewer (m3year) 0 0 ‐40000
Estimated cost (pound) 0 168000 419000
42httpwwwciwemorgmedia695460Paper203_Creating20Sewer20Capacity_Presentation2 0by20Mike20Woodpdf
205240txt012|May 2013
29
Drainage Strategy Framework
Do nothing Standard option
SuDS
Social Cost Benefit (pound) 16000 5000 51000
Change in electricity costs (poundyear) 0 +75 ‐525
Programme impact (years to deliver solution) + 4 0 +4
CSO spill volume (m3 in 1year event) +298 0 ‐397
243 Good practice example ndash New York City comparison of grey and green infrastructure drainage strategies
This example is taken from New York in the United States of America Itrsquos an illustration of how whole life costs have been compared for alternative strategies to solve urban drainage issues on a mega‐city scale The key data are summarised in Table 2
Table 2 Comparing drainage strategies in New York
Grey Strategy
Green Strategy
CSO spill volume reduction (billion gallons year)
101 122
Wider benefits over 20 years ($ million) 0 139 to 418
Whole life costs over 20 years ($ billion) 68 53
The information is taken from the New York City Green Infrastructure Plan43 produced by the Mayorrsquos Office in 2010 The Plan (and recent updates) provides a comprehensive evidence base around costs and benefits of different approaches to address the cityrsquos drainage problems It is therefore an excellent example of how drainage strategies can be described in plain language for a non‐specialist audience concerned with their environment and the cost of providing infrastructure to enhance it
It is becoming commonplace for North American cities (eg Portland and Philadelphia) to address the issue of frequent combined sewer overflow (CSO) operation by using a combination of grey infrastructure (sewers) and green infrastructure (sustainable drainage systems) The wider health
43 httpwwwnycgovhtmldephtmlstormwaternyc_green_infrastructure_planshtml
205240txt012|May 2013
30
25
Drainage Strategy Framework
and ecological benefits of green infrastructure approaches and the reduced reliance on materials and energy are attractive to utility planners and cities alike
New York has 422 CSOs and an agreed Long Term Control Strategy to significantly reduce the impact wet weather discharges have on aquatic systems throughout the city Annual discharges are currently (2010) estimated to be 30 billion gallons (114 million cubic meters) per year Building on existing and committed new sewer plans an agreed grey infrastructure based strategy to this problem is set to reduce these discharges to 198 billion gallons per year (a 34 reduction) by the 2030s An alternative green infrastructure approach based around intercepting the first inch (25mm) of rainfall across 10 of the impermeable city area by 2030 is predicted to reduce CSO spills to 179 billion gallons per year
Planners have calculated that the whole life costs after 20 years of the grey infrastructure solution will be $68 billion (2010 prices) compared to the green infrastructure whole life costs of $53 billion The green infrastructure strategy reduces CSO spills by more than the grey alternative for $15 billion less in terms of whole life cost Further planners have calculated that New Yorkers will benefit by up to $41844 million (accumulated over 20 years) in additional benefits associated with lower energy bills from control of urban heating increased property values and improved health
Based on this analysis New York City has committed itself to an aggressive green infrastructure based runoff control strategy to provide long term reductions in CSO spills The plan is to achieve interception of 15 of impermeable area by 2015 4 by 2020 7 by 2025 and 10 by 2030
Principle Five Live Process
The Strategy should be adaptable and periodically reviewed Whilst outcomes are expected to be relatively stable over time the pace at which the Strategy delivers outcomes will be linked to volatile influences (like climate and population change) and to the decisions made at each price review about the priorities for the following period The Strategy should be reviewed at regular intervals to reflect investments already made the changing priorities of the water and sewerage company and partners and the presence of emerging risks The review is also an opportunity to report drainage catchment performance relative to performance measures designed to monitor progress towards achieving outcomes
44 Estimated using methods from the New York Municipal Forest Resource Analysis (MFRA) prepared by the US Dept of Agriculture
205240txt012|May 2013
31
Drainage Strategy Framework
251 Recommended good practice
No Good practice Example references
1 Regularly repeat screening exercise to determine catchments requiring a Drainage Strategy and modify programme of Strategy development accordingly
Check for changes in measured rates of flooding and pollution incidents blockages collapses pumping station failures etc
Check for changes in extent and location of new development
Check for activities being undertaken by partners (eg redevelopment urban realm improvements and flooding and pollution management activities)
SRM5 illustrates how improved and updated knowledge of system performance should be applied to establish Strategies
2 In lsquolive Strategiesrsquo repeat risk assessment when data and models improve and adjust confidence scores accordingly
Confirm that Strategy will still achieve performance indicators and outcomes at least cost Revise Strategy as necessary
3 Periodically refresh Strategy accommodating impact of interventions already delivered using re‐verified predictive tools as appropriate
Confirm that Strategy will still achieve performance indicators and outcomes at least cost Revise Strategy as necessary
Triggers for a wholesale review of the Strategy are likely to be significant changes to the location or extent of planned development
4 Monitor report and share (with partners) the measures used to demonstrate delivery of outcomes Example measures may include the number of properties which experience sewer flooding the number of properties at risk of flooding the number of properties at risk from sewerage asset failure risk indices that capture both the probability and consequence of failure customer satisfaction with regards to clean rivers and beaches the number of pollution incidents the frequency of combined sewer overflow operation and compliance with discharge permit conditions
252 Good practice example ndash Thames Water live DAP
Thames Water has initiated a DAP (drainage area plan) Live approach Itrsquos a good example of how companies are continuously monitoring and updating the status of drainage area risks It provides a lsquoliversquo snapshot of the current health of all drainage areas in Thames Waterrsquos region allowing real time planning as part of a strategic approach It enables drainage planners to view the effectiveness
205240txt012|May 2013
32
Drainage Strategy Framework
of intervention strategies and compare incident rates across varying geographies and development types in the Thames Valley
DAP Live will be available for all catchments in the Thames Water area thus enabling
bull high level monitoring of risks across the business bull a live and strategic review of catchment performance bull prioritisation of catchments based on risk and bull an ability to share data with partners collaborating in drainage planning and improvements
Figure 12 illustrates the types of data managed through the DAP Live system These include asset data political and drainage boundaries environmental data operational data property amp growth data and modelling data As new data become available the DAP Live system is updated so that drainage planners have the most current view on emerging risks and issues
Asset data
Operational data
Property and growth data
Modelling data
Environmental data
Boundaries (SDACs operational political)
Figure 12 Data types held in the DAP Live system
Figure 13 illustrates how the system can provide analysis at a variety of scales from local authority boundaries sewage treatment works catchments drainage areas or a regular grid
205240txt012|May 2013
33
Drainage Strategy Framework
NE PROVINCES
WESTERN PROVINCES
NE LONDON bull Ops areas local W LONDON
SE LONDON authorities Large TIDWORTH SE PROVINCES
bull STW Catchments
bull Drainage areas(SDACs)
bull Regular grid Small
Figure 13 DAP Live reporting performance at different scales
205240txt012|May 2013
34
Drainage Strategy Framework
253 Good practice example ndash Wessex Water Water live data
Wessex Water is regularly using data geospatially to proactively identify and respond to risk Theirs is a good example of how data can be used to provide an adaptable approach that is regularly reviewed to plan investment
The risk‐based and live approach uses a set of likelihood and consequence models which are built up from all currently available data asset data (eg CCTV data material age) operational data (eg flooding and pollutions incidents) and information (eg locality near hospital or downstream of an overflow) All these data are collated for the entire Wessex region updated regularly and analysed geospatially
Figure 14 Sewer risk scores presented in a risk matrix and geospatially
This allows a risk score (Figure 14) to be calculated for each mapped sewer length which directs investigation more efficiently by allocating each mapped sewer a planned CCTV inspection date
This risk‐based approach has been successful in targeting problematic sewers increasing identification rates threefold Density analysis is performed using asset failure and operational information which allows planning of both proactive structural and operational investment
Proactively found structural issues are far more cost effective to repair before failure and can also prevent serviceability issues
205240txt012|May 2013
35
f
DDrainage Strateegy Frameworrk
Figgure 15 Hotsppot analysis
Thhe hotspot annalysis (Figuure 15) showss where operrational clustters have beeen calculatedd This hootspot analyssis is made aavailable on tthe Wessex WWater corporrate GIS to a llow operati onal staff to target their effforts to mitiggate against ffurther repeaat incidents AAdditional innformation ffrom asset annd operationnal activities ccan be addedd regularly too the databasses which drrive the mod els enabling rissk scores to bbe kept as livve as require d
226 Prrinciple Sixx Innovativve and Susstainable SSolutions
Thhe Drainage Strategy Fraamework proomotes the fuull evaluationn of alternatiives to tradit ionally enngineered sewwerage soluttions to test wwhether thesse offer loweer whole life ccost options or better reesponses to uuncertainty It is anticipaated that draainage solutioons of the futture will be ddifferent froom the ones we are usedd to
Thhese should iinclude (at leeast at a highh level) real ttime control storm waterr retrofit techhniques edducation to eenable custommers to changge behaviou r enhancingg incentives for customerss to reduce suurface water flowing to seewers and innnovative pe rmitting arraangements a cross drainagge networks annd sewage tr eatment worrks Water annd sewerage companies sshould continnue to revieww and deevelop other innovative ssolutions
Foor example wwhere a commpany may hiistorically haave preferredd to tackle seewer floodingg or coombined sewwer overflow pollution byy increasing iits undergrouund equipmment to store mmore rainfalll duuring stormss it might connsider other options in fuuture ndash such as working wwith custommers to mmanage the raainfall close tt eventing it foorm enteringg the sewer syystem o source pre
2205240txt012|Mayy 2013
36
Drainage Strategy Framework
261 Recommended good practice
No Good practice Example references
1 Use cost‐benefit methods to demonstrate that innovative and sustainable solution types provide best value for customers and the wider community
UKWIR will publish new research and guidance in 2013 addressing active control and storm water removal demonstrating how these technologies can be justified and included within Drainage Strategies
2 Consider integrated water resource management Work with partners (especially developers and local authorities) to examine whether use of stored stormwater reduces potable water consumption AND need for capacity in sewers
CIRIA has published a scoping study for water sensitive urban design45 in the UK
3 Consider a mix of conventional and new technologies using more adaptive approaches as low‐regrets responses to uncertainty eg prevent current sewer flooding with underground tank storage but address future risks (worsened by climate change) with retrofit SuDS implemented progressively
CIRIA has published lsquoRetrofitting to manage surface waterrsquo46 a comprehensive guide to planning and delivering this type of project
4 Use carbon accounting methods to compare embodied and emitted carbon in alternative intervention strategies so that these impacts are accounted for in whole life costs
Consider the benefits of surface water removal on the costs (including carbon) of pumping and sewage treatment
UKWIR47 has and continues to publish detailed guidance on carbon accounting for water and sewerage company use
45httpwwwciriaorgserviceresearch_informationAMContentManagerNet ContentDisplayaspxSection=research_informationampContentID=23581 46httpwwwciriaorgSERVICEHomecoreordersproductaspxcatid=5ampprodid=1909 47httpukwirforefront‐librarycomreports08‐cl‐01‐6923419000190269902659465890269
205240txt012|May 2013
37
Drainage Strategy Framework
No Good practice Example references
5 Where interventions include the provision of green space public amenity and improved habitats then Payment for Ecosystem Services approaches can be used to claim further monetised benefits in the appraisal Customers should be consulted to help value these benefits
The Environment Agency will publish data in 2013 on costs and benefits of retrofit stormwater projects to promote understanding and uptake
6 Share data within the industry on innovative solutions to increase knowledge of new technology and SuDs approaches
EA retrofitting SuDs costs and benefits database48
accommodating data from Ofwat AMP5 SuDS pilot initiative and other examples
262 Good practice example ndash Welsh Water surface water reduction and removal strategy for Gowerton and Llanelli
Dŵr Cymru Welsh Water and partners are applying innovative storm water removal methods to address capacity problems in the sewer network in Gowerton and Llanelli49 (population 140000) Current under capacity leads to localised sewer flooding and excessive combined sewer overflow (CSO) spill to the Burry Inlet a protected shellfish water and special area of conservation The capacity problems in the system were a concern for the Environment Agency (Wales) and there was a risk of widespread restrictions to economic development being imposed Dŵr Cymru Welsh Water Carmarthenshire County Council City and County of Swansea Consumer Council for Water Environment Agency Wales and the Welsh Government all worked in partnership to resolve the situation
A brand new hydraulic model was built for the entire sewerage network with particular attention paid to accurately representing the sources of storm run‐off and infiltration The model was verified against data from flow monitors and observed CSO spill frequencies into the Burry Inlet
To begin with a traditional sewer storage solution was proposed that would result in an average 10 spills a year into the shellfish water from all 90 CSOs in the two catchments Although this reduced spills and dealt with some of the flooding and growth issues the storage requirements would have been unaffordable provide no protection against long term climate change and would not tackle the fundamental problem of too much surface water getting into the combined network
An alternative approach based on the reduction and removal of storm water from the combined sewer system was also developed This was in accordance with Dŵr Cymru Welsh Waterrsquos Rainscape50 (surface water elimination and reduction) strategy To identify areas with the most
48httpevidenceenvironment‐agencygovukfcermenDefaultHomeAndLeisureFloodsWhatWereDoingIntoTheFutureScience ProgrammeResearchAndDevelopmentFCRMProjectaspxProjectID=15515be8‐bbed‐4204‐ae56‐3e810ba47694ampPageID=56bad68e‐dcb1‐4bf8‐84cc‐cbfd03ab63a2 49 httpwwwciwemorgmedia674511Paper20820Stephen20Ollierpdf 50httpwwwdwrcymrucom_libraryleaflets_publications_english
205240txt012|May 2013
38
Drainage Strategy Framework
potential for effective storm water removal a flowareaflooding thematic map was developed This was used to focus attention on areas which would deliver the most benefit if storm water removal was carried out These areas are coloured red in Figure 16
Figure 16 Thematic map showing areas of maximum potential for storm water removal
The following interventions (181 in total) were combined into single strategy to be delivered in phases by 2015 2020 and afterwards
bull The management of surface water through swales basins and soakaways rather than through combined sewers resulting in new amenity and ecological areas within the built‐up environment
bull Implementing smarter flow control to better use existing storage and conveyance assets bull Relining of sewers to prevent groundwater ingress bull Removal of land drainage connections to sewers bull Household rainwater harvesting retrofit schemes
surface_water_management_strategypdf
205240txt012|May 2013
39
Drainage Strategy Framework
Figure 17 is an artistrsquos impression of what one of the sustainable urban drainage system solutions may look like
Figure 17 Example retrofit SuDS solution proposed for Gowerton and Llanelli
Modelling has demonstrated that the alternative strategy will achieve the same CSO reduction benefit as the storage strategy together with flooding improvements and additional less tangible benefits at significantly lower cost than the traditional sewer storage solution
Figure 18 illustrates the dispersed nature of solutions identified for central Llanelli
Figure 18 Water sensitive urban design interventions planned for central Llanelli
205240txt012|May 2013
40
Drainage Strategy Framework
Appendix A
Glossary
205240txt012|May 2013
Drainage Strategy Framework
Appendix A Glossary
CAPEX Capital expenditure Appointed water and sewerage companiesrsquo spending on new replacement or refurbished capital assets such as construction or buying machinery
CIWEM Urban Drainage Group (WaPUG) A group of the Chartered Institution of Water and Environmental Management supporting professionals working in urban drainage
Combined Sewer Overflow (CSO) The discharge of untreated sewage diluted with storm water into rivers and the sea CSOs occur during heavy rain and are necessary to reduce the risk of sewer flooding The physical overflow structure is also called a CSO
Common Framework for Capital A planning approach developed for the water and Maintenance Planning sewerage companies in 2002 which provides a robust basis
for assessing future capital maintenance needs The approach is consistent with the needs of Ofwat
Defra The Department for Environment Food and Rural Affairs The Government Department with responsibility for water flooding and water quality in England
Drainage Area Plan (DAP) A detailed plan for a drainage catchment that prioritises a list of interventions based on risk using an approach established in the WRc Sewerage Rehabilitation Manual This approach has been succeeded by Sewerage Risk Management which guides the preparation of Sewerage Management Plans (SMP) Companies vary in how they prepare DAPs or SMPs (or their equivalents) following the general principles that have been established
Drainage Strategy Developed by water and sewerage companies to demonstrate how outcomes will be delivered in drainage catchments over the long term Drainage Strategies will use the information developed in producing a DAPSMP and if a drainage strategy has been produced this should be the starting point in producing a more detailed DAPSMP should this be required It is likely that the activities required to prepare DAPSMP and Drainage Strategies may overlap Drainage Strategies might not refer to specific interventions but instead outline a general approach
Drainage Strategy Framework Guidance to describe the contents and intention of Drainage Strategies
205240txt012|May 2013
Drainage Strategy Framework
Flood Risk Management Plans Required by the Flood Risk Regulations in Flood Risk Areas by December 2015
Flood Risk Regulations The legislative instrument used to implement the requirements of the Floods Directive in England and Wales
Floods Directive DIRECTIVE 200760EC of the European Parliament and of the Council of 23 October 2007 on the assessment and management of flood risks
Lead Local Flood Authority (LLFA) The Shire County or unitary authority with responsibility for managing local flood risk
Local development plans Developed by planning authorities to explain where and what type of development (new homes and businesses) will occur within their area They are required to explain water infrastructure needs to support this development
Local Flood Risk Management Strategy Developed by the Lead Local Flood Authority to explain (LFRMS) how local flood risk will be managed by the Authority and
in partnership with others
Natural Resources Wales From 1 April 2013 Natural Resources Wales (NRW) a new body formed by the Welsh Government will take over the functions previously carried out by the Environment Agency (EA) in Wales alongside those of the Forestry Commission Wales and the Countryside Council for Wales
Ofwat The Water Services Regulation Authority ndash the economic regulator of the water and sewerage companies of England and Wales
OPEX Operating expenditure Appointed water and sewerage companiesrsquo day‐to‐day spending on running the services for example staff costs and power This is likely to include investment in joint projects that do not create or relate to an asset that the company solely or jointly owns
Outcomes Outcomes are the higher level objectives that a companyrsquos actions are intended to deliver A companyrsquos outcome should reflect its customersrsquo priorities identified through appropriate customer engagement and deliver the best long‐term sustainable solution for customers and the environment An outcome may not be bound by a single price control period and should be set in the context of customersrsquo and the environmentrsquos long‐term needs
205240txt012|May 2013
Drainage Strategy Framework
Price Review The process of setting appointed water and sewerage companiesrsquo price limits The next price review will take place in 2014 for the period 2015‐20 Ofwat currently sets price limits every five years
Real Time Control (RTC) Using actuated pumps gates and weirs to actively control flow in sewers Better use can be made of existing infrastructure and links can be made between network treatment and receiving water systems for operational benefits Sometimes referred to as Active Management
River Basin Management (Plans) River Basin Management is a continuous process of planning (to develop River Basin Management Plans) and delivery The Water Framework Directive introduces a formal series of 6 year cycles The first cycle will end in 2015 when following further planning and consultation the River Basin Management Plans will be updated and reissued
Sewerage Management Plan A risk based approach to indentifying investment needs in sewerage systems as described in the Sewerage Risk Management (SRM) approach developed by WRc plc
Storm water retrofit Releasing capacity in sewers by controlling stormwater at the surface using disconnection swales and other sustainable drainage systems (SuDS)
205240txt012|May 2013
We are the Environment Agency We protect and improve the environment and make it a better place for people and wildlife We operate at the place where environmental change has its greatest impact on peoplersquos lives We reduce the risks to people and properties from flooding make sure there is enough water for people and wildlife protect and improve air land and water quality and apply the environmental standards within which industry can operate Acting to reduce climate change and helping people and wildlife adapt to its consequences are at the heart of all that we do We cannot do this alone We work closely with a wide range of partners including government business local authorities other agencies civil society groups and the communities we serve
wwwenvironment‐agencygovuk
Environment Agency National Customer Contact Centre
Telephone 03708 506 506 enquiriesenvironment‐agencygovuk
Ofwat (The Water Services Regulation Authority) is a non‐ministerial government department We are responsible for making sure that the water and sewerage sectors in England and Wales provide consumers with a good quality and efficient service at a fair price
wwwofwatgovuk
Telephone 0121 644 7500 mailboxofwatgsigovuk
Halcrow Group Limited Burderop Park Swindon Wiltshire SN4 0QD
tel 01793 812479 fax 01793 812089 halcrowcom
Halcrow Group Limited is a CH2M HILL company Halcrow Group Limited has prepared this report in accordance with
the instructions of The Environment Agency for the clientrsquos sole and specific use Any other persons who use any information contained herein do so at their own risk

17
Drainage Strategy Framework
When considering the lsquowhole lifersquo the strategy should consider climate population and asset deterioration trends These are likely to increase risks over the long term if no interventions are made The strategy should state lsquowhatrsquo should be done but also broadly lsquowhenrsquo and in what sequence interventions should happen
165 Live process
The Strategy should be adaptable and periodically reviewed Whilst outcomes are expected to be relatively stable over time the pace at which the strategy delivers outcomes will be linked to volatile influences (like climate and population change) and the decisions made at each price review about the priorities for the following period The strategy should be reviewed at regular intervals to reflect investments already made the changing priorities of the water and sewerage company and partners and the presence of emerging risks The review is also an opportunity to report drainage catchment performance relative to performance measures designed to monitor progress towards achieving outcomes
166 Innovative and sustainable
The framework promotes the full evaluation of alternatives to traditionally engineered sewerage solutions to test whether these offer lower whole life cost options or better responses to uncertainty It is anticipated that drainage solutions of the future will be different from the ones we are used to
These should include (at least at a high level) real time control or active management storm water retrofit techniques education to enable customers to change behaviour enhancing incentives for customers to reduce surface water flowing to sewers and innovative permitting arrangements across drainage networks and wastewater treatment works Water and sewerage companies should continue to review and develop other innovative solutions
For example where a company may historically have preferred to tackle sewer flooding or combined sewer overflow pollution by increasing its underground equipment to store more rainfall during storms it might consider other options in future such as working with customers to manage the rainfall close to source preventing it from entering the sewer system
Mapping the Framework to Current Planning Processes
We assume that practitioners will be following a broad and generic four‐stage planning process common to the Sewerage Risk Management (SRM5) and Surface Water Management Plan (SWMP) processes when preparing Drainage Strategies
Figure 4 is provided to guide water and sewerage companies in the development of Drainage Strategies It identifies each stage of the drainage planning process and highlights the good practice principles (colour coded by theme) in the locations through the process where it is most important that they are adopted
205240txt012|May 2013
12
e
u
t
v
b
DDrainage Strateegy Frameworrk
Initializepre
Establish partne and consultat
process
Define uncertai
Prepare risk d
Partnership
epare
rship ion
nties
ata
Ris
Co
Uncertainty
k assessmen
onsultation on risk issues
Quantify uncertainties
Quantify risks
Risk based
nt Options
Consult
Plan for
Demons life cost
Whole lif costs amp benefits
s appraisal
on options
uncertainties
strate whole and benefit
fe
s Live pro
Intervent
Aligned deliv collaborat solution
Innovative sustainab
Live and vis
cess Innova sustai
tion
ery amp ive s
and le
sible
ative amp nable
Figgure 4 Draina ge Strategy frramework prinnciples mappe d to the drainaage planning pprocess
118 WWho will bennefit from tthe Framewwork
Thhe Drainage Strategy Fraamework willl benefit
bull Water andd sewerage coompanies loooking to impprove their coompany speccific drainagge planning approach and make it fit for purpoose for the deelivery of lonng term outcoomes over mmultiple pricee review cyccles It will ppoint them toowards good practice andd provide exaamples as innspiration andd to promott ne innovation
bull Organisatiions and inddividuals lookking to enga ge with the ddevelopmen t of Drainagee Strategies and scruti nise progresss towards thhe achievemeent of outcommes associateed with enabbling growth adapting tto climate chhange managging floodingg and managging water poollution
22 DDrainagee Strateegy Frammeworkk Thhis section deescribes recoommended ggood practicee against eachh of the six kkey principle s necessary too develop a DDrainage Straategy For refference linkss are made too relevant annd establisheed planning prrocesses and emerging guuidance whicch drainage planners maay find usefuul These exammples are prrovided for innformation aand referenc e only
WWater and sewwerage comppanies shouldd work towaards developiing Drainagee Strategies wwhich apply thhese approachhes in a wayy that is consiistent with thheir needs annd those of thheir customeers and paartners Partnners should ttake note of tthis advice aand prepare tto engage wiith water andd sewerage coompanies on this basis
Thhe recommennded good ppractice is orgganised withhin each prinnciple as it wwould be appproached chhronologicallly in developping a Drainaage Strategy following thhe planning pprocesses alrready esstablished in the Seweragge Risk Manaagement anddor Surface WWater Managgement Plann mmethodologiess
2205240txt012|Mayy 2013
13
21
Drainage Strategy Framework
Principle One Partnership
Water and sewerage companies cannot develop optimal Drainage Strategies on their own and therefore partnership is key to developing and defining objectives performance indicators and the milestones that will need to be achieved in order to achieve measures that will demonstrate the delivery of outcomes Strategies should be developed and implemented in partnership with customers developers Lead Local Flood Authorities planning authorities the Environment Agency and Natural Resources Wales Strategies should align (informing and informed by) with River Basin Management Plans Local Flood Risk Management Strategies Flood Risk Management Plans and local plans (from planning authorities)
205240txt012|May 2013
14
Drainage Strategy Framework
211 Recommended good practice
No Good practice Example references
1 Engage with partners in a drainage catchment to bull Explain the purpose of developing a Drainage Strategy
and partnersrsquo roles in its success amp how each party will benefit from establishing a long term Drainage Strategy
bull Explain what outcomes are and how progress towards achieving them will be measured
bull Share data and information so that a shared understanding of risks and opportunities is developed
bull Explain what current drainage system performance is and how this is expected to change in the future Use risk visualisation tools to do this
bull Explain significant uncertainties and how these affect how interventions are delivered
Thames Water has demonstrated good practice through the development of its Counters Creek sewer flooding proposals This website describes the engagement process and how customers have been kept informed
2 Engage with the following partners in the development of the Drainage Strategy
bull Lead Local Flood Authority (the drainage area may include more than one) because of its responsibilities for local flood risk management and SuDS approval
bull Planning authority (the drainage area may include more than one) because of its role in determining the location and pace of housing development
bull Highways Authority because of the connection of highway runoff to public sewer systems
bull The Environment Agency (in England) because of its responsibilities for flood risk management (strategic overview) and ensuring good ecological quality is met in water bodies
bull Natural Resources Wales (in Wales) because of its responsibilities for flood risk management (strategic oversight) and ensuing good ecological quality is met in water bodies
bull Regional Flood and Coastal Committees who help develop a mutual understanding of flood and coastal erosion risks in an area
bull Bodies representing customers (eg Consumer Council for Water large local businesses flood action groups faith communities)
bull Bodies representing local environmental concerns (eg Wildlife Trusts Rivers Trusts)
bull Water only companies and water and sewerage company departments planning and operating water supply systems Water demand management practice can have an important impact on sewerage headroom
SWMP guidance (Chapter 2) advises on the establishment of partnerships for urban flood management and how to agree and align local objectives
3 Understand alignment of planning cycles and what this means locally (eg periodic review River Basin Management Plan Local Flood Risk Management Strategy Flood Risk Management Plan local plan)
205240txt012|May 2013
15
Drainage Strategy Framework
No Good practice Example references
4 Be alert to opportunities for joint solutions andor shared funding by understanding local plans for new development re‐development improving street furniture and public open space improving parks and green infrastructure Understand Lead Local Flood Authority and Environment Agency programmes for the management of flood and pollution risks
A guide to joint funding of local flood risk management intervention has been published by Defra33 and provides relevant advice to water and sewerage companies and other partners
5 Consider water and sewerage company funded solutions which deliver third‐party non‐sewerage assets that result in the long term least cost delivery of outcomes (eg water and sewerage company funding of household rain barrels and rain gardens to prevent surface water entering sewers)
6 Use data and mapping from the Environment Agency and Natural Resources Wales to understand exposure of drainage infrastructure to extreme events (eg coastal fluvial and surface water flood maps) so that network resilience can be understood and improved if this is cost beneficial
UKWIR has completed a project in 2013 lsquoResilience building a business case for PR14 and beyondrsquo
7 Work with LLFAs and the Environment Agency (or Natural Resources Wales) to understand the effectiveness of interventions at reducing risk and use this information to improve intervention planning
The UPM3 manual (section 7) advises on post project monitoring needs for water quality driven improvements
8 Share Drainage Strategies with partners and stakeholders so that there is transparency around challenges opportunities and the roles expected of different organisations
212 Good practice example ndash South West Water working with local authorities
These examples from South West Water illustrate how the company has worked with local authorities to coordinate investments and to share resources and skills in the development of integrated urban drainage management studies and Surface Water Management Plans
bull South West Water approached Devon County Council (DCC) to pool resources in delivering two (of five) pilot integrated urban drainage management studies (IUDMs) for Exeter and Exmouth South West Water took the lead role for Exmouth but DCC led in Exeter This engagement shared costs across organisations and has facilitated the production of full Surface Water Management Plans The collaboration has resulted in a shared understanding of the urban drainage challenges faced by both organisations and has opened dialogue around investment priorities
bull In Lyme Regis South West Water supported extensive coastal erosion defence works being carried out by West Dorset District Council by accelerating a programme of sewer rehabilitation and targeting renovation of sewers in vulnerable areas
bull In partnership with Cornwall County Council (CCC) and the Environment Agency South West Water has been working on a number of key drainage issues identified by CCC in its Preliminary Flood Risk Assessment (PFRA)
33 httprandddefragovukDefaultaspxMenu=MenuampModule=MoreampLocation=NoneampCompleted=0ampProjectID=17085
205240txt012|May 2013
16
Drainage Strategy Framework
bull In Camborne South West Water has taken the opportunity to invest in sewer separation works which align with the aims of the Camborne Pool Redruth urban regeneration group supported by Cornwall Council and to promote sustainable development economic growth and a strategic aim of lsquosewers for sewagersquo
213 Good practice example ndash Northumbrian Water partnership working in Tyneside
Northumbrian Water has led a sustainable sewerage study for Tyneside34 between 2010 and 2012 It is a good example of how partner organisations can collaborate to understand and resolve drainage issues in their urban area
Its approach was informed by the fact that a shared urban drainage problem around flooding and pollution was best addressed by a shared response from all the relevant organisations The project steering group involved representatives of Northumbrian Water the Consumer Council for Water the Environment Agency and five Lead Local Flood Authorities The urban drainage system collects wastewater for a single wastewater treatment works serving a population of over 900000
Working together the group studied the impact of growth urban creep and climate change on future urban drainage issues Figure 5 illustrates how a city‐wide map of potential problem areas was generated by the project team sharing data on sewer capacity (from Northumbrian Water) population change (from the local authorities) and river flooding (the Environment Agency) It was predicted that future problems were more likely to occur in the darker shaded areas These became focus areas for the project where a range of traditional and novel drainage solutions were tested
Figure 5 Future drainage problem areas indentified through data sharing
34httpcommunicatoremailcomINfNLOjNRayfOA1rfrfYcdK‐S7UwRcYcNoWebViewaspx
205240txt012|May 2013
17
22
Drainage Strategy Framework
The project team was keen to promote its work to customers and the community and prepared a series of newsletters updating interested parties on progress and issues An example is illustrated in Figure 6
C lic k here if y ou are hav in g d if f ic u lties v iew ing th is new s letter
Ho m e A b o u t u s M e d ia ce n tre C o n tact
Issue 2
Ap ril 2012
In th is ed ition U n d e rs tan d in g th e fu tu re
S u s tain ab le d ra ina g e o p tio ns
F ind ou t more about Th e 2 0 1 1 an n ua l re po rt
Ou r e n viro n m e n ta l p o licy
Ou r co rp o ra te re sp o nsib il i ty s tra te g y
W e lcom e to th e s e con d e ditio n o f S u sta inab le se we ra g e a s ix-m on th ly n e ws le tte r p ro d u ce d to b ring yo u th e la te s t n e ws on o u r m a jo r s tud ye xp lo rin g s us tain ab le s ew e ra ge o p tions in th e Tyn e s id e a rea I h o p e yo u fin d th e in fo rm a tio n o f in te res t a n d wo u ld w e lcom e fe e db a ck o n an y o f th e issu es ra ise d
Ric ha rd W a rne ford W a s te wa te r Dire c tor
U nderstand ing the fu tu re W e a ll kn o w th e difficu lties o f a ccu ra tely p re d ic tin g th e fu tu re h ow e ve r ifw e a re to p re pa re fo r i t th e n it is s om e thin g we m us t a tte m p t As p a rt o f th is s tu d y w e a re co ns id e rin g w ha t d em a nds w ill b e p la ce d on th e d ra ina g e s ys tem s a t 2 0 20 a n d a t 2 0 50 in co rpo ra ting g ro w th u rba n cre e p a nd c lim a te cha n ge B y w o rk in g close ly w ith o u r p a rtn e rs an d u s in g th e la tes t te ch n ical res e a rch we h a ve d e ve lo p ed a n d com p u te rm od e lle d a num b e r o f s ce na rios to id en tify a n d d e fin e fu tu re ris ks Th es e ris ks in c lud e p red ic tions o f p o te n tia l floo d in g p o llu tion o r b a rrie rs to g ro w th N o w th a t w e be tte r u n d e rs ta nd th e iss u es we a re a ble to p re pa re p la ns p rom o ting o p po rtu n ities fo r s us ta in a ble d rain ag e s ys tem s in o rde r to d e live r th e b es t p oss ible s e rvice fo r o u r cu s tom e rs b a la n ced a g ains te n viro nm e n tal n e eds a n d cos ts
S usta inab le d ra inage op tions W e b e lie ve o u r a pp ro a ch re p res en ts go o d p ra ctice fo r th e m a n ag em en t o f s u rfa ce wa te r w h ich is to d ea l w ith th e s u rfa ce wa te r as c los e to s ou rce as p oss ib le A w id e ra n g e o f p o te n tial o p po rtu n ities a re b ein g id e n tifie d in c lu d in g lo ca l a n d s tra te gic o p tions
S tra te g ic o p tions a re typ ica lly la rg e r th a n th e lo ca l on es a nd in c lu d e fe a tu res s u ch as a re as o f la nd w h ich w o uld b e a llo we d to flo o d d u rin g he a vy ra in (s a crific ial s to ra g e ) a n d p e rm a n en t w e tla nd fe a tu res
L o ca l op tio ns d esp ite b ein g sm a lle r th a n th e s tra te gic o n es w ill s til l p la y a ke y ro le in th e p ro vis io n o f s us tain ab le d ra ina g e Th e ir n a tu re m e a ns de p lo ym e n t co u ld be m o re w id es p re a d th a n s tra te gic o p tions fe a tu res su ch as w a te r b u tts ra in g a rde ns a nd p e rm e ab le pa vin g co u ld b e re la tive ly e a s y to fi t in to
Figure 6 Newsletter promoting urban drainage partnership working
Principle Two Uncertainty
Strategies should explain the reliability of data and knowledge about current and future performance of drainage systems They should explain what steps are planned to improve this understanding and how this will benefit customers Where future performance is uncertain (eg because of sensitivity to climate change) they should explain how adaptive approaches will be used to ensure outcomes are met The uncertainty in predictions of future risks should be recognised and accommodated within decision making
205240txt012|May 2013
18
Drainage Strategy Framework
221 Recommended good practice
No Good practice Example references
1 Data analysed and used in the development of the strategy related to asset location dimensions condition failure and flood and pollution incidents should be assigned a confidence grading The confidence grading should be related to its accuracy completeness compatibility credibility and currency
Models used to predict blockages and collapses flooding locations polluting discharges and water quality impacts should be assigned a confidence grading based on their accuracy completeness compatibility credibility and currency
Model predictions should be assigned a confidence grading depending on the confidence in the model and whether it is being applied outside of its verification range (eg for extreme events or for atypical geographies)
The purpose of confidence grading data and model results used in strategy setting is to understand the likelihood that outcomes will be achieved in a cost efficient manner Where the outcomes remain uncertain knowledge of data confidence can be used to target improvement programmes
SRM5 (S3‐03‐17) refers to Ofwatrsquos method for recording the reliability and accuracy of regulatory data in bands A to D
The SWMP guidance (Section 319) describes an alternative system of grading data and model results
2 Use the Drainage Strategy to justify data and model improvement programmes This should be focussed on areas where risks are currently (or predicted to be) high and uncertainty in data or models reduces the ability to determine robust operational or capital solutions Poor model verification in high risk areas would be an indicator that model improvements were required
CIWEMrsquos urban drainage group has published a series of guides on hydraulic and water quality modelling They discuss model calibration verification and uses
SRM5 (S3‐04) describes how to determine where the current assessment of risk is sufficient to proceed or whether data and models should be improved
3 Improve understanding of network performance (and improve models) by using long term flow and level monitoring on sewers and CSOs
Yorkshire Water discusses its CSO
monitoring programme here
4 Demonstrate how the uncertainty in both the underlying datamodels and in the future projections is addressed in options appraisal Consider if this should be done implicitly (eg through choosing conservative assumptions) or explicitly through the use of sensitivity analysis or scenario testing
Treasury Green Book supplementary guidance illustrates how to accommodate climate change uncertainties
205240txt012|May 2013
19
Drainage Strategy Framework
No Good practice Example references
5 Population growth new homes and businesses climate change and urban creep combine to make the future highly uncertain but will almost certainly increase flooding and pollution risks from drainage systems Use the Drainage Strategy to explore different scenarios (combining the impact of these drivers) for a near term (le 10 years) and future (ge 30 years) epoch
For example combine modest growth and slight climate change (a low impact case) and contrast with high growth and significant climate change (a high impact case) Where the location of significant new development is unknown include scenarios accommodating different possibilities
Running multiple scenarios is time consuming and costly A risk based approach should be adopted to focus efforts where flooding and pollution risks are especially sensitive to changes in demand
UKWIR has published research on accounting for climate change35 and urban creep36 in sewerage planning together with more general advice on accommodating climate change in water asset management planning37
Ofwat has published research38
predicting the combined impacts of climate change urban creep and development on a national basis
6 In the face of significant uncertainties about future demands on the drainage system and their consequences the Drainage Strategy should identify low‐regrets interventions (ie ones that are robust no matter what the future holds) and ensure that solutions can be adapted if greater certainty is achieved For example through quickening the pace of SuDS retrofit activities or using (previously identified and secured) land to extend underground storage facilities Strategies which remove surface water from sewerage networks provide lsquoheadroomrsquo for unpredictable increases in demand from population and climate change
Designing Resilient Cities A guide to good practice DR Lomardi et al HIS BRE Press
7 Post project appraisal and cost monitoring should be used to capture real costs and performance so that Strategies can be updated and improved with latest information It is especially important to collate and understand the whole life costs of new technologies where industry understanding is currently poor
35httpwwwukwirorgreports03‐cl‐10‐09042794658901799019890198 (poundpound) 36httpukwirforefront‐librarycomreports10‐wm‐07‐1493273 (poundpound) 37httpukwirforefront‐librarycomreports12‐cl‐01‐1694816900019015590145901409465890155 (poundpound) 38httpwwwofwatgovuksustainabilityclimatechangerpt_com201106mottmacsewerpdf
205240txt012|May 2013
20
Drainage Strategy Framework
222 Good practice example ndash Severn Trent Waterrsquos MICAS
Severn Trent Water has developed a process to measure confidence in hydraulic models of sewer systems Modelling Investment Confidence Assessment Scoring (MICAS) was developed to provide an objective evaluation of model confidence It uses information stored in the hydraulic model about the provenance of each data element and the quality of model verification Before the approach was developed the assessment of lsquofitness for purposersquo of models was subjective and based on modellers judgment This was not always reliable and certainly not repeatable and transparent MICAS provides an objective assessment of hydraulic model quality which can be used to inform its use and prioritise improvements to input data and model verification
Figure 7 and Figure 8 illustrate how an understanding of model confidence from the MICAS assessment (right hand side images) can be used to interpret predictions of flooding (left hand side images) In Figure 7 areas at predicted high risk of flooding (red in the left hand side image) are shown to be in high confidence areas of the hydraulic model (green in the right hand side image) In contrast in Figure 8 areas at predicted high risk of flooding (red in the left hand side image) are shown to be in poor confidence areas of the hydraulic models (orange in the right hand side image) In the latter case this information is used to identify where further model improvements would be beneficial
Flood Risk MICAS
Figure 7 Modelled flood risk and MICAS confidence scores (high model confidence)
Flood Risk MICAS
Figure 8 Modelled flood risk and MICAS confidence scores (lower model confidence)
205240txt012|May 2013
21
23
Drainage Strategy Framework
Principle Three Risk Based
Strategies should be risk based This means that planning operational and investment activities should be based on consideration of the probability and consequence of inadequate drainage function (risks) as these relate to the achievement of measures that demonstrate delivery of outcomes A risk based Strategy ensures that investment is made where risks are the greatest
To aid communication risks should be visualised through maps and plans (Figure 10 is an example) To aid risk assessment risks should be monetised combined and predicted into the future To aid options appraisal the impact of interventions on the level of risk should be predicted
The approach to Drainage Strategy development should be risk based itself The degree of detail included should be related to an understanding of the overall level of risks in the catchment now and in the future
231 Recommended good practice
No Good practice Example references
1 Determine where a Drainage Strategy is required by combining current performance with external influences likely to result in deteriorating performance This stage requires no modelling or detailed assessment On a catchment‐by‐catchment (drainage area) basis understand current risks by collating data on current performance eg blockages collapses pumping station failures pollution incidents CSO spills storm tank spills internal flooding incidents external flooding incidents and infiltration rates Relate these risks to performance indicators and the achievement of outcomes Combine with information about known growth rates predictions of urban creep quantity of newly adopted lsquoprivatersquo sewers surface water flooding risks (eg from flood map for surface water) WFD water body status and bathing water status Prioritise catchments with high current risks andor factors suggesting that risks are likely to worsen significantly in the future Consider normalising scoring method for size of catchment (eg by unit area or unit length of sewer) Consult with stakeholders to confirm correct prioritisation Commence with development of Drainage Strategies for the highest ranked catchments Periodically revisit prioritisation (updating with new data) to check that priorities are still correct
The initialisation stage of a Sewer Management Plan (SMP) (described in SRM5) considers how a risk assessment can be used to prioritise which spatial units (eg catchments) should be prioritised for a SMP study
2 Visualise catchment risks (from 1) to illustrate and explain to partners the reasons for prioritisation Accommodate their views amp consider changing prioritisation to aid wider drainage planning requirements (eg increase prioritisation of a catchment with significant surface water flooding problems where close collaboration between water and sewerage company and LLFA will benefit the community)
205240txt012|May 2013
22
Drainage Strategy Framework
No Good practice Example references
3 Clearly relate sewerage risks to the performance indicators that will be used to measure progress towards achieving outcomes eg relate blockage rates to flooding and pollution incidents eg relate increase in flows to increased CSO frequency breaches of permit conditions and deterioration in receiving water quality Adopt a sourcendashpathway‐receptor model and workshop techniques to ensure that cause effect and consequences are fully captured Use performance indicators as the basis for a comprehensive risk assessment that considers likelihood (frequency) and consequence (extent degree and duration of impact) of failure expressed as risk scores Monetise risks in GBP (pound) to align with principle four (whole life costs amp benefits) Use (verified) predictive models to understand near term (lt10 years) and long term (gt30 years) risks The latter to align with principle four (whole life costs amp benefits) Align complexity of method with level of risk recognising the needs of partners eg use complex 2D flood routing models to ascertain (with greater certainty) flood mechanisms and damages where the quantity and frequency of flooding is high and interventions will be complex and costly Elsewhere more simple approaches are appropriate eg use complex UPM3 water quality modelling methods where compliance with river standards or discharge consents is already failing or is expected to do so Elsewhere more simple approaches are appropriate Combine risk scores from different risks to describe the total level of risk in a catchment Use visualisation techniques to communicate combined level of risk Combine analysis from hydraulic blockage and asset deterioration models on a catchment basis In hydraulic analysis consider flooding performance for rainfall events beyond the usually provided standard of protection to understand performance in extreme events in support of partners (especially LLFAs) and in search of cost beneficial interventions at a higher standard than normal
SRM 5 (S3‐03) details approaches to simple and more complex approaches to risk assessment that are consistent with CMPCF guidelines
4 Be alert to interactions between sewer networks and wastewater treatment plans eg by modelling the impact of changing sewer flows on wastewater treatment worksrsquo performance and costs Consider combined impact of different catchments on a single or linked water body (eg an inland river bathing water or shell fishery)
UPM3 guidance discusses approaches to understanding these interactions and applying more complex water quality impact models
5 Establish systems and apply methods to predict how interventions can reduce risks eg how a targeted and pro‐active maintenance can reduce the occurrence of sewer blockage and flooding from lsquoother causesrsquo eg how reducing infiltration can reduce CSO spills eg how reducing connected impermeable area can reduce sewer flooding
205240txt012|May 2013
23
Drainage Strategy Framework
232 Good practice example ndash United Utilities risk assessment
United Utilities has demonstrated a robust risk based approach in the development of sewerage management plans used for long term planning across their area of operations
Hydraulic models were applied in 235 catchments and configured to look at future performance and to evaluate the consequences of inadequate capacity Starting from a baseline of 2010 versions of the models were built for 2020 and 2036 epochs The following model input parameters were adjusted population water consumption infiltration planned development known sewerage improvement projects urban creep rainfall (for climate change)
Two‐dimensional (2D) modelling was used to consider the consequences of sewer flooding resulting from the changes made to reflect the future operating environments As well as the impact on homes and business (from internal and external flooding) the flood risk to critical infrastructure was also considered The operation of CSOs was considered by computing the annual spill volume duration and frequency
Finally predictions of the likelihood and consequence of sewer failure were added taking account of sewer material age and the incident records relating to similar assets
All these data were combined and weighted to generate a Sewer Management Plan (SMP) Risk Score for each length of sewer The process is illustrated in Figure 9
Figure 9 United Utilitiesrsquo process for calculating risk score in sewerage catchments
205240txt012|May 2013
24
Drainage Strategy Framework
Risk scores were summed spatially and monetised so that high priority locations could be identified Mapping and visualisation were used to communicate the results of this assessment priority areas for further investigation and how risks change through time (Figure 10)
Figure 10 Visualisation of sewerage risks
233 Good practice example ndash Northumbrian Water risk assessment
Northumbrian Water completes an annual assessment of hydraulic capacity in its sewerage network at the drainage area scale Its approach does not require hydraulic models to have been completed and yet can reliably highlight areas of under‐capacity in need of further investigation through more detailed analysis including hydraulic modelling New and emerging risk areas can also be identified by applying data for population growth which occurs through development lsquoWhat ifrsquo scenarios can be run to test when capacity limits may be overcome and flood risks potentially set to increase It demonstrates good lsquorisk basedrsquo planning principles because it shows the drainage planner where more detailed analysis is warranted
The approach uses the following data from company records population connected to sewer P water consumption rate G (lhd) trade discharge E (ls) pipe diameter and gradient pipe connectivity CSO consent pass forward rate (ls) pumping station rate (ls) sewage treatment flow rate (ls) A wastewater dry weather capacity map calculates pipe full capacity dry weather flow (PG+E+I) and Formula A flow for fully combined (1360P+2E+DWF) and separate (4PG+3I+E) areas of the network Infiltration (I) is assumed to be 50 PG +E
205240txt012|May 2013
25
Drainage Strategy Framework
A theoretical assessment of network capacity is then calculated by comparing Formula A with pipe full capacity flow consent values at CSOs and wastewater treatment works and pumping rates This determines areas of the network with a capacity shortfall with a potential capacity shortfall and with no capacity shortfall
When run across the whole company area approximately 100 out of 500 drainage areas were found to be under capacity Over 60 of these areas had recorded sewer flooding incidents In over 300 drainage areas there was no forecast capacity shortfall Only 7 of these drainage areas had recorded sewer flooding incidents Overall the system proved to be very reliable at predicting drainage areas likely to have sewer flooding problems because of sewer under‐capacity
In under capacity drainage areas an intermediate (hydraulic model based) assessment is then carried out Figure 11 shows the results thematically mapped for an example drainage area Red areas are predicted to have a very high risk of sewer flooding Yellow and green areas are predicted to have a low risk of sewer flooding
Figure 11 Example of a drainage area capacity map
205240txt012|May 2013
26
24
Drainage Strategy Framework
Principle Four Whole Life Costs and Benefits
Strategies should be informed by consideration of whole life costs and benefits They should promote a series of interventions which in view of the quantified uncertainties are most likely to result in performance indicators which demonstrate the achievement of outcomes at lowest cost to customers and the community more widely
Costs relate to capital and operational expenditure to deliver interventions and the monetised impacts of drainage failures such as flooding and pollution
Benefits relate to the reduction in risks from drainage failures such as flooding and pollution but should also include wider societal impacts such as those calculated using a lsquoPayments for Ecosystems Servicesrsquo approach
When considering the lsquowhole lifersquo the strategy should consider climate population and asset deterioration trends These are likely to increase risks over the long term if no interventions are made The strategy should state lsquowhatrsquo should be done but also broadly lsquowhenrsquo and in what sequence interventions should happen
241 Recommended good practice
No Good practice Example references
1 Predict risks into the future for at least two epochs le10 years (to understand what the company needs to do now and how this fits with longer term outcomes) and ge30 years to understand long term needs in light of changing population and other pressures
Account for the following changes in demand
bull Growth ‐ new homes and businesses
bull Urban creep ndash uncontrolled addition of connected impermeable area
bull Climate change ndash affecting design events (flood predictions) time‐series (CSO and treated effluent quantities) river flows and temperatures
bull Infiltrationexfiltration ndash through deteriorating sewer condition
bull Dry weather flows ndash through changes in water consumption rates
2 Combining monetised risks (associated with sewerage failures) determine whole life costs for a lsquodo nothingrsquo scenario (ie no interventions)
Include costs associated with electricity consumption (in the network and at the wastewater treatment works) and CO2 emissions
UKWIR will publish in 2014 a revision to their Long Term Least Cost Planning for Wastewater Supply‐Demand
guidance This may provide tools and methods for expressing costs and benefits to support the development of a Drainage Strategy
205240txt012|May 2013
27
Drainage Strategy Framework
No Good practice Example references
3 Test intervention strategies which keep performance indicators on track to deliver outcomes by adding capacity (supply) reducing flows (demand) or altering operational regimes
Include the costs of interventions and the benefits of reduced risks to inform selection of the most cost beneficial strategy over the whole life
Have regard to the timing of interventions recognising that uncertainty may require low‐regrets (insensitive to uncertainty) solutions and that delaying major interventions may be more affordable and attractive in the short term Discounting should be used to compare the costs and benefits of interventions occurring at different times
Recognise that some interventions will be obligatory and defined (eg maintenance of a spill frequency standard at a CSO) whilst others will be more discretionary focused on achieving outcomes rather than specific outputs
SRM5 (Section 8) defines and contrasts cost benefit analysis cost effectiveness analysis whole life cost analysis and risk cost benefit analysis
HM Treasury Green Book39
sets out a framework for the appraisal of long term projects which can be applied to the development of a Drainage Strategy
4 Donrsquot at first be concerned with the distribution of costs and benefits between partners who may be sharing costs Identify the most cost beneficial solution first and then debate and agree an equitable sharing of costs
Give equal weighting to OPEX (operating expenditure) and CAPEX (capital expenditure) costs so not to cause bias towards capital intensive solutions Properly consider the costs and benefits of pro‐active maintenance regimes and campaigns to influence customers to reduce fats oils and greases (FOG) build‐ups and the misuse of sewers
Consider the affordability of solutions the impact on customersrsquo bills and the resources of other organisations to play their part
UKWIR research outputs40 in 2013 (SW01) will provide a framework for making a business case for separating storm water from combined sewers
5 Where interventions include the provision of green space public amenity and improved habitats then Payment for Ecosystem Services approaches should be used to identify further monetised benefits in the appraisal Customers should be consulted to help value these benefits
Supplementary Green Book41
guidance describes methods for accounting for environmental impacts including the ecosystems approach
39 httpwwwhm‐treasurygovukdata_greenbook_indexhtm 40 httpwwwukwirorgpublishorsystemcomponent_viewaspLogDocId=96116 41 httpwwwhm‐treasurygovukdaccounting_environmental_impactspdf
205240txt012|May 2013
28
Drainage Strategy Framework
242 Good practice example ndash Severn Trent Water making the case for surface water separation in Stoke-on-Trent
In this example42 Severn Trent Water compared alternative ways of addressing sewer flooding problems by looking at a range of costs and benefits not all of which were directly associated with its specific responsibilities as a water and sewerage company Whilst the example does not express a monetised value for all costs and benefits over the whole life it does illustrate the types of factors which could be included in an appraisal of this type scaled to address problems at a catchment level It also demonstrates how working collaboratively can help identify solutions which are cost‐beneficial for the community at large
In an area of Stoke served by a combined sewer system five properties were at risk from sewer flooding in cellars for events equal to and less frequent than the 1 in 10 year probability A conventional sewer pumping station based solution was presented as the standard option
However a nearby former hospital site was also undergoing re‐development which would result in reduced runoff to the combined sewer The new drainage regime in the redevelopment site was sufficient to remove the flood risk at the five properties (this was a do nothing strategy)
A third option completely separated the development site runoff from the combined sewer and also addressed local flood risk issues nearby The solution required a new storm sewer and a network of swales and other SuDS features connecting with an ordinary watercourse
Table 1 illustrates how costs and benefits were compared across the three alternative strategies Each provided the same benefit in terms of the number of homes (5) relieved from sewer flooding The novel SuDS and surface water management solution additionally gave local flood risk relief to 3 further properties The separationSuDS strategy came at a higher capital cost but delivered greater social cost benefits savings in annual operating costs and a bonus improvement water quality (because of reduced CSO spill volume) Severn Trent selected the separation SuDS solution because the higher capital costs were offset by other benefits
Table 1 Costs and benefits of drainage improvements in part of Stoke-on-Trent
Do nothing Standard option
SuDS
Sewer flooding benefits 5 5 5
Other flooding benefits 0 0 3
Change in runoff to combined sewer (m3year) 0 0 ‐40000
Estimated cost (pound) 0 168000 419000
42httpwwwciwemorgmedia695460Paper203_Creating20Sewer20Capacity_Presentation2 0by20Mike20Woodpdf
205240txt012|May 2013
29
Drainage Strategy Framework
Do nothing Standard option
SuDS
Social Cost Benefit (pound) 16000 5000 51000
Change in electricity costs (poundyear) 0 +75 ‐525
Programme impact (years to deliver solution) + 4 0 +4
CSO spill volume (m3 in 1year event) +298 0 ‐397
243 Good practice example ndash New York City comparison of grey and green infrastructure drainage strategies
This example is taken from New York in the United States of America Itrsquos an illustration of how whole life costs have been compared for alternative strategies to solve urban drainage issues on a mega‐city scale The key data are summarised in Table 2
Table 2 Comparing drainage strategies in New York
Grey Strategy
Green Strategy
CSO spill volume reduction (billion gallons year)
101 122
Wider benefits over 20 years ($ million) 0 139 to 418
Whole life costs over 20 years ($ billion) 68 53
The information is taken from the New York City Green Infrastructure Plan43 produced by the Mayorrsquos Office in 2010 The Plan (and recent updates) provides a comprehensive evidence base around costs and benefits of different approaches to address the cityrsquos drainage problems It is therefore an excellent example of how drainage strategies can be described in plain language for a non‐specialist audience concerned with their environment and the cost of providing infrastructure to enhance it
It is becoming commonplace for North American cities (eg Portland and Philadelphia) to address the issue of frequent combined sewer overflow (CSO) operation by using a combination of grey infrastructure (sewers) and green infrastructure (sustainable drainage systems) The wider health
43 httpwwwnycgovhtmldephtmlstormwaternyc_green_infrastructure_planshtml
205240txt012|May 2013
30
25
Drainage Strategy Framework
and ecological benefits of green infrastructure approaches and the reduced reliance on materials and energy are attractive to utility planners and cities alike
New York has 422 CSOs and an agreed Long Term Control Strategy to significantly reduce the impact wet weather discharges have on aquatic systems throughout the city Annual discharges are currently (2010) estimated to be 30 billion gallons (114 million cubic meters) per year Building on existing and committed new sewer plans an agreed grey infrastructure based strategy to this problem is set to reduce these discharges to 198 billion gallons per year (a 34 reduction) by the 2030s An alternative green infrastructure approach based around intercepting the first inch (25mm) of rainfall across 10 of the impermeable city area by 2030 is predicted to reduce CSO spills to 179 billion gallons per year
Planners have calculated that the whole life costs after 20 years of the grey infrastructure solution will be $68 billion (2010 prices) compared to the green infrastructure whole life costs of $53 billion The green infrastructure strategy reduces CSO spills by more than the grey alternative for $15 billion less in terms of whole life cost Further planners have calculated that New Yorkers will benefit by up to $41844 million (accumulated over 20 years) in additional benefits associated with lower energy bills from control of urban heating increased property values and improved health
Based on this analysis New York City has committed itself to an aggressive green infrastructure based runoff control strategy to provide long term reductions in CSO spills The plan is to achieve interception of 15 of impermeable area by 2015 4 by 2020 7 by 2025 and 10 by 2030
Principle Five Live Process
The Strategy should be adaptable and periodically reviewed Whilst outcomes are expected to be relatively stable over time the pace at which the Strategy delivers outcomes will be linked to volatile influences (like climate and population change) and to the decisions made at each price review about the priorities for the following period The Strategy should be reviewed at regular intervals to reflect investments already made the changing priorities of the water and sewerage company and partners and the presence of emerging risks The review is also an opportunity to report drainage catchment performance relative to performance measures designed to monitor progress towards achieving outcomes
44 Estimated using methods from the New York Municipal Forest Resource Analysis (MFRA) prepared by the US Dept of Agriculture
205240txt012|May 2013
31
Drainage Strategy Framework
251 Recommended good practice
No Good practice Example references
1 Regularly repeat screening exercise to determine catchments requiring a Drainage Strategy and modify programme of Strategy development accordingly
Check for changes in measured rates of flooding and pollution incidents blockages collapses pumping station failures etc
Check for changes in extent and location of new development
Check for activities being undertaken by partners (eg redevelopment urban realm improvements and flooding and pollution management activities)
SRM5 illustrates how improved and updated knowledge of system performance should be applied to establish Strategies
2 In lsquolive Strategiesrsquo repeat risk assessment when data and models improve and adjust confidence scores accordingly
Confirm that Strategy will still achieve performance indicators and outcomes at least cost Revise Strategy as necessary
3 Periodically refresh Strategy accommodating impact of interventions already delivered using re‐verified predictive tools as appropriate
Confirm that Strategy will still achieve performance indicators and outcomes at least cost Revise Strategy as necessary
Triggers for a wholesale review of the Strategy are likely to be significant changes to the location or extent of planned development
4 Monitor report and share (with partners) the measures used to demonstrate delivery of outcomes Example measures may include the number of properties which experience sewer flooding the number of properties at risk of flooding the number of properties at risk from sewerage asset failure risk indices that capture both the probability and consequence of failure customer satisfaction with regards to clean rivers and beaches the number of pollution incidents the frequency of combined sewer overflow operation and compliance with discharge permit conditions
252 Good practice example ndash Thames Water live DAP
Thames Water has initiated a DAP (drainage area plan) Live approach Itrsquos a good example of how companies are continuously monitoring and updating the status of drainage area risks It provides a lsquoliversquo snapshot of the current health of all drainage areas in Thames Waterrsquos region allowing real time planning as part of a strategic approach It enables drainage planners to view the effectiveness
205240txt012|May 2013
32
Drainage Strategy Framework
of intervention strategies and compare incident rates across varying geographies and development types in the Thames Valley
DAP Live will be available for all catchments in the Thames Water area thus enabling
bull high level monitoring of risks across the business bull a live and strategic review of catchment performance bull prioritisation of catchments based on risk and bull an ability to share data with partners collaborating in drainage planning and improvements
Figure 12 illustrates the types of data managed through the DAP Live system These include asset data political and drainage boundaries environmental data operational data property amp growth data and modelling data As new data become available the DAP Live system is updated so that drainage planners have the most current view on emerging risks and issues
Asset data
Operational data
Property and growth data
Modelling data
Environmental data
Boundaries (SDACs operational political)
Figure 12 Data types held in the DAP Live system
Figure 13 illustrates how the system can provide analysis at a variety of scales from local authority boundaries sewage treatment works catchments drainage areas or a regular grid
205240txt012|May 2013
33
Drainage Strategy Framework
NE PROVINCES
WESTERN PROVINCES
NE LONDON bull Ops areas local W LONDON
SE LONDON authorities Large TIDWORTH SE PROVINCES
bull STW Catchments
bull Drainage areas(SDACs)
bull Regular grid Small
Figure 13 DAP Live reporting performance at different scales
205240txt012|May 2013
34
Drainage Strategy Framework
253 Good practice example ndash Wessex Water Water live data
Wessex Water is regularly using data geospatially to proactively identify and respond to risk Theirs is a good example of how data can be used to provide an adaptable approach that is regularly reviewed to plan investment
The risk‐based and live approach uses a set of likelihood and consequence models which are built up from all currently available data asset data (eg CCTV data material age) operational data (eg flooding and pollutions incidents) and information (eg locality near hospital or downstream of an overflow) All these data are collated for the entire Wessex region updated regularly and analysed geospatially
Figure 14 Sewer risk scores presented in a risk matrix and geospatially
This allows a risk score (Figure 14) to be calculated for each mapped sewer length which directs investigation more efficiently by allocating each mapped sewer a planned CCTV inspection date
This risk‐based approach has been successful in targeting problematic sewers increasing identification rates threefold Density analysis is performed using asset failure and operational information which allows planning of both proactive structural and operational investment
Proactively found structural issues are far more cost effective to repair before failure and can also prevent serviceability issues
205240txt012|May 2013
35
f
DDrainage Strateegy Frameworrk
Figgure 15 Hotsppot analysis
Thhe hotspot annalysis (Figuure 15) showss where operrational clustters have beeen calculatedd This hootspot analyssis is made aavailable on tthe Wessex WWater corporrate GIS to a llow operati onal staff to target their effforts to mitiggate against ffurther repeaat incidents AAdditional innformation ffrom asset annd operationnal activities ccan be addedd regularly too the databasses which drrive the mod els enabling rissk scores to bbe kept as livve as require d
226 Prrinciple Sixx Innovativve and Susstainable SSolutions
Thhe Drainage Strategy Fraamework proomotes the fuull evaluationn of alternatiives to tradit ionally enngineered sewwerage soluttions to test wwhether thesse offer loweer whole life ccost options or better reesponses to uuncertainty It is anticipaated that draainage solutioons of the futture will be ddifferent froom the ones we are usedd to
Thhese should iinclude (at leeast at a highh level) real ttime control storm waterr retrofit techhniques edducation to eenable custommers to changge behaviou r enhancingg incentives for customerss to reduce suurface water flowing to seewers and innnovative pe rmitting arraangements a cross drainagge networks annd sewage tr eatment worrks Water annd sewerage companies sshould continnue to revieww and deevelop other innovative ssolutions
Foor example wwhere a commpany may hiistorically haave preferredd to tackle seewer floodingg or coombined sewwer overflow pollution byy increasing iits undergrouund equipmment to store mmore rainfalll duuring stormss it might connsider other options in fuuture ndash such as working wwith custommers to mmanage the raainfall close tt eventing it foorm enteringg the sewer syystem o source pre
2205240txt012|Mayy 2013
36
Drainage Strategy Framework
261 Recommended good practice
No Good practice Example references
1 Use cost‐benefit methods to demonstrate that innovative and sustainable solution types provide best value for customers and the wider community
UKWIR will publish new research and guidance in 2013 addressing active control and storm water removal demonstrating how these technologies can be justified and included within Drainage Strategies
2 Consider integrated water resource management Work with partners (especially developers and local authorities) to examine whether use of stored stormwater reduces potable water consumption AND need for capacity in sewers
CIRIA has published a scoping study for water sensitive urban design45 in the UK
3 Consider a mix of conventional and new technologies using more adaptive approaches as low‐regrets responses to uncertainty eg prevent current sewer flooding with underground tank storage but address future risks (worsened by climate change) with retrofit SuDS implemented progressively
CIRIA has published lsquoRetrofitting to manage surface waterrsquo46 a comprehensive guide to planning and delivering this type of project
4 Use carbon accounting methods to compare embodied and emitted carbon in alternative intervention strategies so that these impacts are accounted for in whole life costs
Consider the benefits of surface water removal on the costs (including carbon) of pumping and sewage treatment
UKWIR47 has and continues to publish detailed guidance on carbon accounting for water and sewerage company use
45httpwwwciriaorgserviceresearch_informationAMContentManagerNet ContentDisplayaspxSection=research_informationampContentID=23581 46httpwwwciriaorgSERVICEHomecoreordersproductaspxcatid=5ampprodid=1909 47httpukwirforefront‐librarycomreports08‐cl‐01‐6923419000190269902659465890269
205240txt012|May 2013
37
Drainage Strategy Framework
No Good practice Example references
5 Where interventions include the provision of green space public amenity and improved habitats then Payment for Ecosystem Services approaches can be used to claim further monetised benefits in the appraisal Customers should be consulted to help value these benefits
The Environment Agency will publish data in 2013 on costs and benefits of retrofit stormwater projects to promote understanding and uptake
6 Share data within the industry on innovative solutions to increase knowledge of new technology and SuDs approaches
EA retrofitting SuDs costs and benefits database48
accommodating data from Ofwat AMP5 SuDS pilot initiative and other examples
262 Good practice example ndash Welsh Water surface water reduction and removal strategy for Gowerton and Llanelli
Dŵr Cymru Welsh Water and partners are applying innovative storm water removal methods to address capacity problems in the sewer network in Gowerton and Llanelli49 (population 140000) Current under capacity leads to localised sewer flooding and excessive combined sewer overflow (CSO) spill to the Burry Inlet a protected shellfish water and special area of conservation The capacity problems in the system were a concern for the Environment Agency (Wales) and there was a risk of widespread restrictions to economic development being imposed Dŵr Cymru Welsh Water Carmarthenshire County Council City and County of Swansea Consumer Council for Water Environment Agency Wales and the Welsh Government all worked in partnership to resolve the situation
A brand new hydraulic model was built for the entire sewerage network with particular attention paid to accurately representing the sources of storm run‐off and infiltration The model was verified against data from flow monitors and observed CSO spill frequencies into the Burry Inlet
To begin with a traditional sewer storage solution was proposed that would result in an average 10 spills a year into the shellfish water from all 90 CSOs in the two catchments Although this reduced spills and dealt with some of the flooding and growth issues the storage requirements would have been unaffordable provide no protection against long term climate change and would not tackle the fundamental problem of too much surface water getting into the combined network
An alternative approach based on the reduction and removal of storm water from the combined sewer system was also developed This was in accordance with Dŵr Cymru Welsh Waterrsquos Rainscape50 (surface water elimination and reduction) strategy To identify areas with the most
48httpevidenceenvironment‐agencygovukfcermenDefaultHomeAndLeisureFloodsWhatWereDoingIntoTheFutureScience ProgrammeResearchAndDevelopmentFCRMProjectaspxProjectID=15515be8‐bbed‐4204‐ae56‐3e810ba47694ampPageID=56bad68e‐dcb1‐4bf8‐84cc‐cbfd03ab63a2 49 httpwwwciwemorgmedia674511Paper20820Stephen20Ollierpdf 50httpwwwdwrcymrucom_libraryleaflets_publications_english
205240txt012|May 2013
38
Drainage Strategy Framework
potential for effective storm water removal a flowareaflooding thematic map was developed This was used to focus attention on areas which would deliver the most benefit if storm water removal was carried out These areas are coloured red in Figure 16
Figure 16 Thematic map showing areas of maximum potential for storm water removal
The following interventions (181 in total) were combined into single strategy to be delivered in phases by 2015 2020 and afterwards
bull The management of surface water through swales basins and soakaways rather than through combined sewers resulting in new amenity and ecological areas within the built‐up environment
bull Implementing smarter flow control to better use existing storage and conveyance assets bull Relining of sewers to prevent groundwater ingress bull Removal of land drainage connections to sewers bull Household rainwater harvesting retrofit schemes
surface_water_management_strategypdf
205240txt012|May 2013
39
Drainage Strategy Framework
Figure 17 is an artistrsquos impression of what one of the sustainable urban drainage system solutions may look like
Figure 17 Example retrofit SuDS solution proposed for Gowerton and Llanelli
Modelling has demonstrated that the alternative strategy will achieve the same CSO reduction benefit as the storage strategy together with flooding improvements and additional less tangible benefits at significantly lower cost than the traditional sewer storage solution
Figure 18 illustrates the dispersed nature of solutions identified for central Llanelli
Figure 18 Water sensitive urban design interventions planned for central Llanelli
205240txt012|May 2013
40
Drainage Strategy Framework
Appendix A
Glossary
205240txt012|May 2013
Drainage Strategy Framework
Appendix A Glossary
CAPEX Capital expenditure Appointed water and sewerage companiesrsquo spending on new replacement or refurbished capital assets such as construction or buying machinery
CIWEM Urban Drainage Group (WaPUG) A group of the Chartered Institution of Water and Environmental Management supporting professionals working in urban drainage
Combined Sewer Overflow (CSO) The discharge of untreated sewage diluted with storm water into rivers and the sea CSOs occur during heavy rain and are necessary to reduce the risk of sewer flooding The physical overflow structure is also called a CSO
Common Framework for Capital A planning approach developed for the water and Maintenance Planning sewerage companies in 2002 which provides a robust basis
for assessing future capital maintenance needs The approach is consistent with the needs of Ofwat
Defra The Department for Environment Food and Rural Affairs The Government Department with responsibility for water flooding and water quality in England
Drainage Area Plan (DAP) A detailed plan for a drainage catchment that prioritises a list of interventions based on risk using an approach established in the WRc Sewerage Rehabilitation Manual This approach has been succeeded by Sewerage Risk Management which guides the preparation of Sewerage Management Plans (SMP) Companies vary in how they prepare DAPs or SMPs (or their equivalents) following the general principles that have been established
Drainage Strategy Developed by water and sewerage companies to demonstrate how outcomes will be delivered in drainage catchments over the long term Drainage Strategies will use the information developed in producing a DAPSMP and if a drainage strategy has been produced this should be the starting point in producing a more detailed DAPSMP should this be required It is likely that the activities required to prepare DAPSMP and Drainage Strategies may overlap Drainage Strategies might not refer to specific interventions but instead outline a general approach
Drainage Strategy Framework Guidance to describe the contents and intention of Drainage Strategies
205240txt012|May 2013
Drainage Strategy Framework
Flood Risk Management Plans Required by the Flood Risk Regulations in Flood Risk Areas by December 2015
Flood Risk Regulations The legislative instrument used to implement the requirements of the Floods Directive in England and Wales
Floods Directive DIRECTIVE 200760EC of the European Parliament and of the Council of 23 October 2007 on the assessment and management of flood risks
Lead Local Flood Authority (LLFA) The Shire County or unitary authority with responsibility for managing local flood risk
Local development plans Developed by planning authorities to explain where and what type of development (new homes and businesses) will occur within their area They are required to explain water infrastructure needs to support this development
Local Flood Risk Management Strategy Developed by the Lead Local Flood Authority to explain (LFRMS) how local flood risk will be managed by the Authority and
in partnership with others
Natural Resources Wales From 1 April 2013 Natural Resources Wales (NRW) a new body formed by the Welsh Government will take over the functions previously carried out by the Environment Agency (EA) in Wales alongside those of the Forestry Commission Wales and the Countryside Council for Wales
Ofwat The Water Services Regulation Authority ndash the economic regulator of the water and sewerage companies of England and Wales
OPEX Operating expenditure Appointed water and sewerage companiesrsquo day‐to‐day spending on running the services for example staff costs and power This is likely to include investment in joint projects that do not create or relate to an asset that the company solely or jointly owns
Outcomes Outcomes are the higher level objectives that a companyrsquos actions are intended to deliver A companyrsquos outcome should reflect its customersrsquo priorities identified through appropriate customer engagement and deliver the best long‐term sustainable solution for customers and the environment An outcome may not be bound by a single price control period and should be set in the context of customersrsquo and the environmentrsquos long‐term needs
205240txt012|May 2013
Drainage Strategy Framework
Price Review The process of setting appointed water and sewerage companiesrsquo price limits The next price review will take place in 2014 for the period 2015‐20 Ofwat currently sets price limits every five years
Real Time Control (RTC) Using actuated pumps gates and weirs to actively control flow in sewers Better use can be made of existing infrastructure and links can be made between network treatment and receiving water systems for operational benefits Sometimes referred to as Active Management
River Basin Management (Plans) River Basin Management is a continuous process of planning (to develop River Basin Management Plans) and delivery The Water Framework Directive introduces a formal series of 6 year cycles The first cycle will end in 2015 when following further planning and consultation the River Basin Management Plans will be updated and reissued
Sewerage Management Plan A risk based approach to indentifying investment needs in sewerage systems as described in the Sewerage Risk Management (SRM) approach developed by WRc plc
Storm water retrofit Releasing capacity in sewers by controlling stormwater at the surface using disconnection swales and other sustainable drainage systems (SuDS)
205240txt012|May 2013
We are the Environment Agency We protect and improve the environment and make it a better place for people and wildlife We operate at the place where environmental change has its greatest impact on peoplersquos lives We reduce the risks to people and properties from flooding make sure there is enough water for people and wildlife protect and improve air land and water quality and apply the environmental standards within which industry can operate Acting to reduce climate change and helping people and wildlife adapt to its consequences are at the heart of all that we do We cannot do this alone We work closely with a wide range of partners including government business local authorities other agencies civil society groups and the communities we serve
wwwenvironment‐agencygovuk
Environment Agency National Customer Contact Centre
Telephone 03708 506 506 enquiriesenvironment‐agencygovuk
Ofwat (The Water Services Regulation Authority) is a non‐ministerial government department We are responsible for making sure that the water and sewerage sectors in England and Wales provide consumers with a good quality and efficient service at a fair price
wwwofwatgovuk
Telephone 0121 644 7500 mailboxofwatgsigovuk
Halcrow Group Limited Burderop Park Swindon Wiltshire SN4 0QD
tel 01793 812479 fax 01793 812089 halcrowcom
Halcrow Group Limited is a CH2M HILL company Halcrow Group Limited has prepared this report in accordance with
the instructions of The Environment Agency for the clientrsquos sole and specific use Any other persons who use any information contained herein do so at their own risk

21
Drainage Strategy Framework
Principle One Partnership
Water and sewerage companies cannot develop optimal Drainage Strategies on their own and therefore partnership is key to developing and defining objectives performance indicators and the milestones that will need to be achieved in order to achieve measures that will demonstrate the delivery of outcomes Strategies should be developed and implemented in partnership with customers developers Lead Local Flood Authorities planning authorities the Environment Agency and Natural Resources Wales Strategies should align (informing and informed by) with River Basin Management Plans Local Flood Risk Management Strategies Flood Risk Management Plans and local plans (from planning authorities)
205240txt012|May 2013
14
Drainage Strategy Framework
211 Recommended good practice
No Good practice Example references
1 Engage with partners in a drainage catchment to bull Explain the purpose of developing a Drainage Strategy
and partnersrsquo roles in its success amp how each party will benefit from establishing a long term Drainage Strategy
bull Explain what outcomes are and how progress towards achieving them will be measured
bull Share data and information so that a shared understanding of risks and opportunities is developed
bull Explain what current drainage system performance is and how this is expected to change in the future Use risk visualisation tools to do this
bull Explain significant uncertainties and how these affect how interventions are delivered
Thames Water has demonstrated good practice through the development of its Counters Creek sewer flooding proposals This website describes the engagement process and how customers have been kept informed
2 Engage with the following partners in the development of the Drainage Strategy
bull Lead Local Flood Authority (the drainage area may include more than one) because of its responsibilities for local flood risk management and SuDS approval
bull Planning authority (the drainage area may include more than one) because of its role in determining the location and pace of housing development
bull Highways Authority because of the connection of highway runoff to public sewer systems
bull The Environment Agency (in England) because of its responsibilities for flood risk management (strategic overview) and ensuring good ecological quality is met in water bodies
bull Natural Resources Wales (in Wales) because of its responsibilities for flood risk management (strategic oversight) and ensuing good ecological quality is met in water bodies
bull Regional Flood and Coastal Committees who help develop a mutual understanding of flood and coastal erosion risks in an area
bull Bodies representing customers (eg Consumer Council for Water large local businesses flood action groups faith communities)
bull Bodies representing local environmental concerns (eg Wildlife Trusts Rivers Trusts)
bull Water only companies and water and sewerage company departments planning and operating water supply systems Water demand management practice can have an important impact on sewerage headroom
SWMP guidance (Chapter 2) advises on the establishment of partnerships for urban flood management and how to agree and align local objectives
3 Understand alignment of planning cycles and what this means locally (eg periodic review River Basin Management Plan Local Flood Risk Management Strategy Flood Risk Management Plan local plan)
205240txt012|May 2013
15
Drainage Strategy Framework
No Good practice Example references
4 Be alert to opportunities for joint solutions andor shared funding by understanding local plans for new development re‐development improving street furniture and public open space improving parks and green infrastructure Understand Lead Local Flood Authority and Environment Agency programmes for the management of flood and pollution risks
A guide to joint funding of local flood risk management intervention has been published by Defra33 and provides relevant advice to water and sewerage companies and other partners
5 Consider water and sewerage company funded solutions which deliver third‐party non‐sewerage assets that result in the long term least cost delivery of outcomes (eg water and sewerage company funding of household rain barrels and rain gardens to prevent surface water entering sewers)
6 Use data and mapping from the Environment Agency and Natural Resources Wales to understand exposure of drainage infrastructure to extreme events (eg coastal fluvial and surface water flood maps) so that network resilience can be understood and improved if this is cost beneficial
UKWIR has completed a project in 2013 lsquoResilience building a business case for PR14 and beyondrsquo
7 Work with LLFAs and the Environment Agency (or Natural Resources Wales) to understand the effectiveness of interventions at reducing risk and use this information to improve intervention planning
The UPM3 manual (section 7) advises on post project monitoring needs for water quality driven improvements
8 Share Drainage Strategies with partners and stakeholders so that there is transparency around challenges opportunities and the roles expected of different organisations
212 Good practice example ndash South West Water working with local authorities
These examples from South West Water illustrate how the company has worked with local authorities to coordinate investments and to share resources and skills in the development of integrated urban drainage management studies and Surface Water Management Plans
bull South West Water approached Devon County Council (DCC) to pool resources in delivering two (of five) pilot integrated urban drainage management studies (IUDMs) for Exeter and Exmouth South West Water took the lead role for Exmouth but DCC led in Exeter This engagement shared costs across organisations and has facilitated the production of full Surface Water Management Plans The collaboration has resulted in a shared understanding of the urban drainage challenges faced by both organisations and has opened dialogue around investment priorities
bull In Lyme Regis South West Water supported extensive coastal erosion defence works being carried out by West Dorset District Council by accelerating a programme of sewer rehabilitation and targeting renovation of sewers in vulnerable areas
bull In partnership with Cornwall County Council (CCC) and the Environment Agency South West Water has been working on a number of key drainage issues identified by CCC in its Preliminary Flood Risk Assessment (PFRA)
33 httprandddefragovukDefaultaspxMenu=MenuampModule=MoreampLocation=NoneampCompleted=0ampProjectID=17085
205240txt012|May 2013
16
Drainage Strategy Framework
bull In Camborne South West Water has taken the opportunity to invest in sewer separation works which align with the aims of the Camborne Pool Redruth urban regeneration group supported by Cornwall Council and to promote sustainable development economic growth and a strategic aim of lsquosewers for sewagersquo
213 Good practice example ndash Northumbrian Water partnership working in Tyneside
Northumbrian Water has led a sustainable sewerage study for Tyneside34 between 2010 and 2012 It is a good example of how partner organisations can collaborate to understand and resolve drainage issues in their urban area
Its approach was informed by the fact that a shared urban drainage problem around flooding and pollution was best addressed by a shared response from all the relevant organisations The project steering group involved representatives of Northumbrian Water the Consumer Council for Water the Environment Agency and five Lead Local Flood Authorities The urban drainage system collects wastewater for a single wastewater treatment works serving a population of over 900000
Working together the group studied the impact of growth urban creep and climate change on future urban drainage issues Figure 5 illustrates how a city‐wide map of potential problem areas was generated by the project team sharing data on sewer capacity (from Northumbrian Water) population change (from the local authorities) and river flooding (the Environment Agency) It was predicted that future problems were more likely to occur in the darker shaded areas These became focus areas for the project where a range of traditional and novel drainage solutions were tested
Figure 5 Future drainage problem areas indentified through data sharing
34httpcommunicatoremailcomINfNLOjNRayfOA1rfrfYcdK‐S7UwRcYcNoWebViewaspx
205240txt012|May 2013
17
22
Drainage Strategy Framework
The project team was keen to promote its work to customers and the community and prepared a series of newsletters updating interested parties on progress and issues An example is illustrated in Figure 6
C lic k here if y ou are hav in g d if f ic u lties v iew ing th is new s letter
Ho m e A b o u t u s M e d ia ce n tre C o n tact
Issue 2
Ap ril 2012
In th is ed ition U n d e rs tan d in g th e fu tu re
S u s tain ab le d ra ina g e o p tio ns
F ind ou t more about Th e 2 0 1 1 an n ua l re po rt
Ou r e n viro n m e n ta l p o licy
Ou r co rp o ra te re sp o nsib il i ty s tra te g y
W e lcom e to th e s e con d e ditio n o f S u sta inab le se we ra g e a s ix-m on th ly n e ws le tte r p ro d u ce d to b ring yo u th e la te s t n e ws on o u r m a jo r s tud ye xp lo rin g s us tain ab le s ew e ra ge o p tions in th e Tyn e s id e a rea I h o p e yo u fin d th e in fo rm a tio n o f in te res t a n d wo u ld w e lcom e fe e db a ck o n an y o f th e issu es ra ise d
Ric ha rd W a rne ford W a s te wa te r Dire c tor
U nderstand ing the fu tu re W e a ll kn o w th e difficu lties o f a ccu ra tely p re d ic tin g th e fu tu re h ow e ve r ifw e a re to p re pa re fo r i t th e n it is s om e thin g we m us t a tte m p t As p a rt o f th is s tu d y w e a re co ns id e rin g w ha t d em a nds w ill b e p la ce d on th e d ra ina g e s ys tem s a t 2 0 20 a n d a t 2 0 50 in co rpo ra ting g ro w th u rba n cre e p a nd c lim a te cha n ge B y w o rk in g close ly w ith o u r p a rtn e rs an d u s in g th e la tes t te ch n ical res e a rch we h a ve d e ve lo p ed a n d com p u te rm od e lle d a num b e r o f s ce na rios to id en tify a n d d e fin e fu tu re ris ks Th es e ris ks in c lud e p red ic tions o f p o te n tia l floo d in g p o llu tion o r b a rrie rs to g ro w th N o w th a t w e be tte r u n d e rs ta nd th e iss u es we a re a ble to p re pa re p la ns p rom o ting o p po rtu n ities fo r s us ta in a ble d rain ag e s ys tem s in o rde r to d e live r th e b es t p oss ible s e rvice fo r o u r cu s tom e rs b a la n ced a g ains te n viro nm e n tal n e eds a n d cos ts
S usta inab le d ra inage op tions W e b e lie ve o u r a pp ro a ch re p res en ts go o d p ra ctice fo r th e m a n ag em en t o f s u rfa ce wa te r w h ich is to d ea l w ith th e s u rfa ce wa te r as c los e to s ou rce as p oss ib le A w id e ra n g e o f p o te n tial o p po rtu n ities a re b ein g id e n tifie d in c lu d in g lo ca l a n d s tra te gic o p tions
S tra te g ic o p tions a re typ ica lly la rg e r th a n th e lo ca l on es a nd in c lu d e fe a tu res s u ch as a re as o f la nd w h ich w o uld b e a llo we d to flo o d d u rin g he a vy ra in (s a crific ial s to ra g e ) a n d p e rm a n en t w e tla nd fe a tu res
L o ca l op tio ns d esp ite b ein g sm a lle r th a n th e s tra te gic o n es w ill s til l p la y a ke y ro le in th e p ro vis io n o f s us tain ab le d ra ina g e Th e ir n a tu re m e a ns de p lo ym e n t co u ld be m o re w id es p re a d th a n s tra te gic o p tions fe a tu res su ch as w a te r b u tts ra in g a rde ns a nd p e rm e ab le pa vin g co u ld b e re la tive ly e a s y to fi t in to
Figure 6 Newsletter promoting urban drainage partnership working
Principle Two Uncertainty
Strategies should explain the reliability of data and knowledge about current and future performance of drainage systems They should explain what steps are planned to improve this understanding and how this will benefit customers Where future performance is uncertain (eg because of sensitivity to climate change) they should explain how adaptive approaches will be used to ensure outcomes are met The uncertainty in predictions of future risks should be recognised and accommodated within decision making
205240txt012|May 2013
18
Drainage Strategy Framework
221 Recommended good practice
No Good practice Example references
1 Data analysed and used in the development of the strategy related to asset location dimensions condition failure and flood and pollution incidents should be assigned a confidence grading The confidence grading should be related to its accuracy completeness compatibility credibility and currency
Models used to predict blockages and collapses flooding locations polluting discharges and water quality impacts should be assigned a confidence grading based on their accuracy completeness compatibility credibility and currency
Model predictions should be assigned a confidence grading depending on the confidence in the model and whether it is being applied outside of its verification range (eg for extreme events or for atypical geographies)
The purpose of confidence grading data and model results used in strategy setting is to understand the likelihood that outcomes will be achieved in a cost efficient manner Where the outcomes remain uncertain knowledge of data confidence can be used to target improvement programmes
SRM5 (S3‐03‐17) refers to Ofwatrsquos method for recording the reliability and accuracy of regulatory data in bands A to D
The SWMP guidance (Section 319) describes an alternative system of grading data and model results
2 Use the Drainage Strategy to justify data and model improvement programmes This should be focussed on areas where risks are currently (or predicted to be) high and uncertainty in data or models reduces the ability to determine robust operational or capital solutions Poor model verification in high risk areas would be an indicator that model improvements were required
CIWEMrsquos urban drainage group has published a series of guides on hydraulic and water quality modelling They discuss model calibration verification and uses
SRM5 (S3‐04) describes how to determine where the current assessment of risk is sufficient to proceed or whether data and models should be improved
3 Improve understanding of network performance (and improve models) by using long term flow and level monitoring on sewers and CSOs
Yorkshire Water discusses its CSO
monitoring programme here
4 Demonstrate how the uncertainty in both the underlying datamodels and in the future projections is addressed in options appraisal Consider if this should be done implicitly (eg through choosing conservative assumptions) or explicitly through the use of sensitivity analysis or scenario testing
Treasury Green Book supplementary guidance illustrates how to accommodate climate change uncertainties
205240txt012|May 2013
19
Drainage Strategy Framework
No Good practice Example references
5 Population growth new homes and businesses climate change and urban creep combine to make the future highly uncertain but will almost certainly increase flooding and pollution risks from drainage systems Use the Drainage Strategy to explore different scenarios (combining the impact of these drivers) for a near term (le 10 years) and future (ge 30 years) epoch
For example combine modest growth and slight climate change (a low impact case) and contrast with high growth and significant climate change (a high impact case) Where the location of significant new development is unknown include scenarios accommodating different possibilities
Running multiple scenarios is time consuming and costly A risk based approach should be adopted to focus efforts where flooding and pollution risks are especially sensitive to changes in demand
UKWIR has published research on accounting for climate change35 and urban creep36 in sewerage planning together with more general advice on accommodating climate change in water asset management planning37
Ofwat has published research38
predicting the combined impacts of climate change urban creep and development on a national basis
6 In the face of significant uncertainties about future demands on the drainage system and their consequences the Drainage Strategy should identify low‐regrets interventions (ie ones that are robust no matter what the future holds) and ensure that solutions can be adapted if greater certainty is achieved For example through quickening the pace of SuDS retrofit activities or using (previously identified and secured) land to extend underground storage facilities Strategies which remove surface water from sewerage networks provide lsquoheadroomrsquo for unpredictable increases in demand from population and climate change
Designing Resilient Cities A guide to good practice DR Lomardi et al HIS BRE Press
7 Post project appraisal and cost monitoring should be used to capture real costs and performance so that Strategies can be updated and improved with latest information It is especially important to collate and understand the whole life costs of new technologies where industry understanding is currently poor
35httpwwwukwirorgreports03‐cl‐10‐09042794658901799019890198 (poundpound) 36httpukwirforefront‐librarycomreports10‐wm‐07‐1493273 (poundpound) 37httpukwirforefront‐librarycomreports12‐cl‐01‐1694816900019015590145901409465890155 (poundpound) 38httpwwwofwatgovuksustainabilityclimatechangerpt_com201106mottmacsewerpdf
205240txt012|May 2013
20
Drainage Strategy Framework
222 Good practice example ndash Severn Trent Waterrsquos MICAS
Severn Trent Water has developed a process to measure confidence in hydraulic models of sewer systems Modelling Investment Confidence Assessment Scoring (MICAS) was developed to provide an objective evaluation of model confidence It uses information stored in the hydraulic model about the provenance of each data element and the quality of model verification Before the approach was developed the assessment of lsquofitness for purposersquo of models was subjective and based on modellers judgment This was not always reliable and certainly not repeatable and transparent MICAS provides an objective assessment of hydraulic model quality which can be used to inform its use and prioritise improvements to input data and model verification
Figure 7 and Figure 8 illustrate how an understanding of model confidence from the MICAS assessment (right hand side images) can be used to interpret predictions of flooding (left hand side images) In Figure 7 areas at predicted high risk of flooding (red in the left hand side image) are shown to be in high confidence areas of the hydraulic model (green in the right hand side image) In contrast in Figure 8 areas at predicted high risk of flooding (red in the left hand side image) are shown to be in poor confidence areas of the hydraulic models (orange in the right hand side image) In the latter case this information is used to identify where further model improvements would be beneficial
Flood Risk MICAS
Figure 7 Modelled flood risk and MICAS confidence scores (high model confidence)
Flood Risk MICAS
Figure 8 Modelled flood risk and MICAS confidence scores (lower model confidence)
205240txt012|May 2013
21
23
Drainage Strategy Framework
Principle Three Risk Based
Strategies should be risk based This means that planning operational and investment activities should be based on consideration of the probability and consequence of inadequate drainage function (risks) as these relate to the achievement of measures that demonstrate delivery of outcomes A risk based Strategy ensures that investment is made where risks are the greatest
To aid communication risks should be visualised through maps and plans (Figure 10 is an example) To aid risk assessment risks should be monetised combined and predicted into the future To aid options appraisal the impact of interventions on the level of risk should be predicted
The approach to Drainage Strategy development should be risk based itself The degree of detail included should be related to an understanding of the overall level of risks in the catchment now and in the future
231 Recommended good practice
No Good practice Example references
1 Determine where a Drainage Strategy is required by combining current performance with external influences likely to result in deteriorating performance This stage requires no modelling or detailed assessment On a catchment‐by‐catchment (drainage area) basis understand current risks by collating data on current performance eg blockages collapses pumping station failures pollution incidents CSO spills storm tank spills internal flooding incidents external flooding incidents and infiltration rates Relate these risks to performance indicators and the achievement of outcomes Combine with information about known growth rates predictions of urban creep quantity of newly adopted lsquoprivatersquo sewers surface water flooding risks (eg from flood map for surface water) WFD water body status and bathing water status Prioritise catchments with high current risks andor factors suggesting that risks are likely to worsen significantly in the future Consider normalising scoring method for size of catchment (eg by unit area or unit length of sewer) Consult with stakeholders to confirm correct prioritisation Commence with development of Drainage Strategies for the highest ranked catchments Periodically revisit prioritisation (updating with new data) to check that priorities are still correct
The initialisation stage of a Sewer Management Plan (SMP) (described in SRM5) considers how a risk assessment can be used to prioritise which spatial units (eg catchments) should be prioritised for a SMP study
2 Visualise catchment risks (from 1) to illustrate and explain to partners the reasons for prioritisation Accommodate their views amp consider changing prioritisation to aid wider drainage planning requirements (eg increase prioritisation of a catchment with significant surface water flooding problems where close collaboration between water and sewerage company and LLFA will benefit the community)
205240txt012|May 2013
22
Drainage Strategy Framework
No Good practice Example references
3 Clearly relate sewerage risks to the performance indicators that will be used to measure progress towards achieving outcomes eg relate blockage rates to flooding and pollution incidents eg relate increase in flows to increased CSO frequency breaches of permit conditions and deterioration in receiving water quality Adopt a sourcendashpathway‐receptor model and workshop techniques to ensure that cause effect and consequences are fully captured Use performance indicators as the basis for a comprehensive risk assessment that considers likelihood (frequency) and consequence (extent degree and duration of impact) of failure expressed as risk scores Monetise risks in GBP (pound) to align with principle four (whole life costs amp benefits) Use (verified) predictive models to understand near term (lt10 years) and long term (gt30 years) risks The latter to align with principle four (whole life costs amp benefits) Align complexity of method with level of risk recognising the needs of partners eg use complex 2D flood routing models to ascertain (with greater certainty) flood mechanisms and damages where the quantity and frequency of flooding is high and interventions will be complex and costly Elsewhere more simple approaches are appropriate eg use complex UPM3 water quality modelling methods where compliance with river standards or discharge consents is already failing or is expected to do so Elsewhere more simple approaches are appropriate Combine risk scores from different risks to describe the total level of risk in a catchment Use visualisation techniques to communicate combined level of risk Combine analysis from hydraulic blockage and asset deterioration models on a catchment basis In hydraulic analysis consider flooding performance for rainfall events beyond the usually provided standard of protection to understand performance in extreme events in support of partners (especially LLFAs) and in search of cost beneficial interventions at a higher standard than normal
SRM 5 (S3‐03) details approaches to simple and more complex approaches to risk assessment that are consistent with CMPCF guidelines
4 Be alert to interactions between sewer networks and wastewater treatment plans eg by modelling the impact of changing sewer flows on wastewater treatment worksrsquo performance and costs Consider combined impact of different catchments on a single or linked water body (eg an inland river bathing water or shell fishery)
UPM3 guidance discusses approaches to understanding these interactions and applying more complex water quality impact models
5 Establish systems and apply methods to predict how interventions can reduce risks eg how a targeted and pro‐active maintenance can reduce the occurrence of sewer blockage and flooding from lsquoother causesrsquo eg how reducing infiltration can reduce CSO spills eg how reducing connected impermeable area can reduce sewer flooding
205240txt012|May 2013
23
Drainage Strategy Framework
232 Good practice example ndash United Utilities risk assessment
United Utilities has demonstrated a robust risk based approach in the development of sewerage management plans used for long term planning across their area of operations
Hydraulic models were applied in 235 catchments and configured to look at future performance and to evaluate the consequences of inadequate capacity Starting from a baseline of 2010 versions of the models were built for 2020 and 2036 epochs The following model input parameters were adjusted population water consumption infiltration planned development known sewerage improvement projects urban creep rainfall (for climate change)
Two‐dimensional (2D) modelling was used to consider the consequences of sewer flooding resulting from the changes made to reflect the future operating environments As well as the impact on homes and business (from internal and external flooding) the flood risk to critical infrastructure was also considered The operation of CSOs was considered by computing the annual spill volume duration and frequency
Finally predictions of the likelihood and consequence of sewer failure were added taking account of sewer material age and the incident records relating to similar assets
All these data were combined and weighted to generate a Sewer Management Plan (SMP) Risk Score for each length of sewer The process is illustrated in Figure 9
Figure 9 United Utilitiesrsquo process for calculating risk score in sewerage catchments
205240txt012|May 2013
24
Drainage Strategy Framework
Risk scores were summed spatially and monetised so that high priority locations could be identified Mapping and visualisation were used to communicate the results of this assessment priority areas for further investigation and how risks change through time (Figure 10)
Figure 10 Visualisation of sewerage risks
233 Good practice example ndash Northumbrian Water risk assessment
Northumbrian Water completes an annual assessment of hydraulic capacity in its sewerage network at the drainage area scale Its approach does not require hydraulic models to have been completed and yet can reliably highlight areas of under‐capacity in need of further investigation through more detailed analysis including hydraulic modelling New and emerging risk areas can also be identified by applying data for population growth which occurs through development lsquoWhat ifrsquo scenarios can be run to test when capacity limits may be overcome and flood risks potentially set to increase It demonstrates good lsquorisk basedrsquo planning principles because it shows the drainage planner where more detailed analysis is warranted
The approach uses the following data from company records population connected to sewer P water consumption rate G (lhd) trade discharge E (ls) pipe diameter and gradient pipe connectivity CSO consent pass forward rate (ls) pumping station rate (ls) sewage treatment flow rate (ls) A wastewater dry weather capacity map calculates pipe full capacity dry weather flow (PG+E+I) and Formula A flow for fully combined (1360P+2E+DWF) and separate (4PG+3I+E) areas of the network Infiltration (I) is assumed to be 50 PG +E
205240txt012|May 2013
25
Drainage Strategy Framework
A theoretical assessment of network capacity is then calculated by comparing Formula A with pipe full capacity flow consent values at CSOs and wastewater treatment works and pumping rates This determines areas of the network with a capacity shortfall with a potential capacity shortfall and with no capacity shortfall
When run across the whole company area approximately 100 out of 500 drainage areas were found to be under capacity Over 60 of these areas had recorded sewer flooding incidents In over 300 drainage areas there was no forecast capacity shortfall Only 7 of these drainage areas had recorded sewer flooding incidents Overall the system proved to be very reliable at predicting drainage areas likely to have sewer flooding problems because of sewer under‐capacity
In under capacity drainage areas an intermediate (hydraulic model based) assessment is then carried out Figure 11 shows the results thematically mapped for an example drainage area Red areas are predicted to have a very high risk of sewer flooding Yellow and green areas are predicted to have a low risk of sewer flooding
Figure 11 Example of a drainage area capacity map
205240txt012|May 2013
26
24
Drainage Strategy Framework
Principle Four Whole Life Costs and Benefits
Strategies should be informed by consideration of whole life costs and benefits They should promote a series of interventions which in view of the quantified uncertainties are most likely to result in performance indicators which demonstrate the achievement of outcomes at lowest cost to customers and the community more widely
Costs relate to capital and operational expenditure to deliver interventions and the monetised impacts of drainage failures such as flooding and pollution
Benefits relate to the reduction in risks from drainage failures such as flooding and pollution but should also include wider societal impacts such as those calculated using a lsquoPayments for Ecosystems Servicesrsquo approach
When considering the lsquowhole lifersquo the strategy should consider climate population and asset deterioration trends These are likely to increase risks over the long term if no interventions are made The strategy should state lsquowhatrsquo should be done but also broadly lsquowhenrsquo and in what sequence interventions should happen
241 Recommended good practice
No Good practice Example references
1 Predict risks into the future for at least two epochs le10 years (to understand what the company needs to do now and how this fits with longer term outcomes) and ge30 years to understand long term needs in light of changing population and other pressures
Account for the following changes in demand
bull Growth ‐ new homes and businesses
bull Urban creep ndash uncontrolled addition of connected impermeable area
bull Climate change ndash affecting design events (flood predictions) time‐series (CSO and treated effluent quantities) river flows and temperatures
bull Infiltrationexfiltration ndash through deteriorating sewer condition
bull Dry weather flows ndash through changes in water consumption rates
2 Combining monetised risks (associated with sewerage failures) determine whole life costs for a lsquodo nothingrsquo scenario (ie no interventions)
Include costs associated with electricity consumption (in the network and at the wastewater treatment works) and CO2 emissions
UKWIR will publish in 2014 a revision to their Long Term Least Cost Planning for Wastewater Supply‐Demand
guidance This may provide tools and methods for expressing costs and benefits to support the development of a Drainage Strategy
205240txt012|May 2013
27
Drainage Strategy Framework
No Good practice Example references
3 Test intervention strategies which keep performance indicators on track to deliver outcomes by adding capacity (supply) reducing flows (demand) or altering operational regimes
Include the costs of interventions and the benefits of reduced risks to inform selection of the most cost beneficial strategy over the whole life
Have regard to the timing of interventions recognising that uncertainty may require low‐regrets (insensitive to uncertainty) solutions and that delaying major interventions may be more affordable and attractive in the short term Discounting should be used to compare the costs and benefits of interventions occurring at different times
Recognise that some interventions will be obligatory and defined (eg maintenance of a spill frequency standard at a CSO) whilst others will be more discretionary focused on achieving outcomes rather than specific outputs
SRM5 (Section 8) defines and contrasts cost benefit analysis cost effectiveness analysis whole life cost analysis and risk cost benefit analysis
HM Treasury Green Book39
sets out a framework for the appraisal of long term projects which can be applied to the development of a Drainage Strategy
4 Donrsquot at first be concerned with the distribution of costs and benefits between partners who may be sharing costs Identify the most cost beneficial solution first and then debate and agree an equitable sharing of costs
Give equal weighting to OPEX (operating expenditure) and CAPEX (capital expenditure) costs so not to cause bias towards capital intensive solutions Properly consider the costs and benefits of pro‐active maintenance regimes and campaigns to influence customers to reduce fats oils and greases (FOG) build‐ups and the misuse of sewers
Consider the affordability of solutions the impact on customersrsquo bills and the resources of other organisations to play their part
UKWIR research outputs40 in 2013 (SW01) will provide a framework for making a business case for separating storm water from combined sewers
5 Where interventions include the provision of green space public amenity and improved habitats then Payment for Ecosystem Services approaches should be used to identify further monetised benefits in the appraisal Customers should be consulted to help value these benefits
Supplementary Green Book41
guidance describes methods for accounting for environmental impacts including the ecosystems approach
39 httpwwwhm‐treasurygovukdata_greenbook_indexhtm 40 httpwwwukwirorgpublishorsystemcomponent_viewaspLogDocId=96116 41 httpwwwhm‐treasurygovukdaccounting_environmental_impactspdf
205240txt012|May 2013
28
Drainage Strategy Framework
242 Good practice example ndash Severn Trent Water making the case for surface water separation in Stoke-on-Trent
In this example42 Severn Trent Water compared alternative ways of addressing sewer flooding problems by looking at a range of costs and benefits not all of which were directly associated with its specific responsibilities as a water and sewerage company Whilst the example does not express a monetised value for all costs and benefits over the whole life it does illustrate the types of factors which could be included in an appraisal of this type scaled to address problems at a catchment level It also demonstrates how working collaboratively can help identify solutions which are cost‐beneficial for the community at large
In an area of Stoke served by a combined sewer system five properties were at risk from sewer flooding in cellars for events equal to and less frequent than the 1 in 10 year probability A conventional sewer pumping station based solution was presented as the standard option
However a nearby former hospital site was also undergoing re‐development which would result in reduced runoff to the combined sewer The new drainage regime in the redevelopment site was sufficient to remove the flood risk at the five properties (this was a do nothing strategy)
A third option completely separated the development site runoff from the combined sewer and also addressed local flood risk issues nearby The solution required a new storm sewer and a network of swales and other SuDS features connecting with an ordinary watercourse
Table 1 illustrates how costs and benefits were compared across the three alternative strategies Each provided the same benefit in terms of the number of homes (5) relieved from sewer flooding The novel SuDS and surface water management solution additionally gave local flood risk relief to 3 further properties The separationSuDS strategy came at a higher capital cost but delivered greater social cost benefits savings in annual operating costs and a bonus improvement water quality (because of reduced CSO spill volume) Severn Trent selected the separation SuDS solution because the higher capital costs were offset by other benefits
Table 1 Costs and benefits of drainage improvements in part of Stoke-on-Trent
Do nothing Standard option
SuDS
Sewer flooding benefits 5 5 5
Other flooding benefits 0 0 3
Change in runoff to combined sewer (m3year) 0 0 ‐40000
Estimated cost (pound) 0 168000 419000
42httpwwwciwemorgmedia695460Paper203_Creating20Sewer20Capacity_Presentation2 0by20Mike20Woodpdf
205240txt012|May 2013
29
Drainage Strategy Framework
Do nothing Standard option
SuDS
Social Cost Benefit (pound) 16000 5000 51000
Change in electricity costs (poundyear) 0 +75 ‐525
Programme impact (years to deliver solution) + 4 0 +4
CSO spill volume (m3 in 1year event) +298 0 ‐397
243 Good practice example ndash New York City comparison of grey and green infrastructure drainage strategies
This example is taken from New York in the United States of America Itrsquos an illustration of how whole life costs have been compared for alternative strategies to solve urban drainage issues on a mega‐city scale The key data are summarised in Table 2
Table 2 Comparing drainage strategies in New York
Grey Strategy
Green Strategy
CSO spill volume reduction (billion gallons year)
101 122
Wider benefits over 20 years ($ million) 0 139 to 418
Whole life costs over 20 years ($ billion) 68 53
The information is taken from the New York City Green Infrastructure Plan43 produced by the Mayorrsquos Office in 2010 The Plan (and recent updates) provides a comprehensive evidence base around costs and benefits of different approaches to address the cityrsquos drainage problems It is therefore an excellent example of how drainage strategies can be described in plain language for a non‐specialist audience concerned with their environment and the cost of providing infrastructure to enhance it
It is becoming commonplace for North American cities (eg Portland and Philadelphia) to address the issue of frequent combined sewer overflow (CSO) operation by using a combination of grey infrastructure (sewers) and green infrastructure (sustainable drainage systems) The wider health
43 httpwwwnycgovhtmldephtmlstormwaternyc_green_infrastructure_planshtml
205240txt012|May 2013
30
25
Drainage Strategy Framework
and ecological benefits of green infrastructure approaches and the reduced reliance on materials and energy are attractive to utility planners and cities alike
New York has 422 CSOs and an agreed Long Term Control Strategy to significantly reduce the impact wet weather discharges have on aquatic systems throughout the city Annual discharges are currently (2010) estimated to be 30 billion gallons (114 million cubic meters) per year Building on existing and committed new sewer plans an agreed grey infrastructure based strategy to this problem is set to reduce these discharges to 198 billion gallons per year (a 34 reduction) by the 2030s An alternative green infrastructure approach based around intercepting the first inch (25mm) of rainfall across 10 of the impermeable city area by 2030 is predicted to reduce CSO spills to 179 billion gallons per year
Planners have calculated that the whole life costs after 20 years of the grey infrastructure solution will be $68 billion (2010 prices) compared to the green infrastructure whole life costs of $53 billion The green infrastructure strategy reduces CSO spills by more than the grey alternative for $15 billion less in terms of whole life cost Further planners have calculated that New Yorkers will benefit by up to $41844 million (accumulated over 20 years) in additional benefits associated with lower energy bills from control of urban heating increased property values and improved health
Based on this analysis New York City has committed itself to an aggressive green infrastructure based runoff control strategy to provide long term reductions in CSO spills The plan is to achieve interception of 15 of impermeable area by 2015 4 by 2020 7 by 2025 and 10 by 2030
Principle Five Live Process
The Strategy should be adaptable and periodically reviewed Whilst outcomes are expected to be relatively stable over time the pace at which the Strategy delivers outcomes will be linked to volatile influences (like climate and population change) and to the decisions made at each price review about the priorities for the following period The Strategy should be reviewed at regular intervals to reflect investments already made the changing priorities of the water and sewerage company and partners and the presence of emerging risks The review is also an opportunity to report drainage catchment performance relative to performance measures designed to monitor progress towards achieving outcomes
44 Estimated using methods from the New York Municipal Forest Resource Analysis (MFRA) prepared by the US Dept of Agriculture
205240txt012|May 2013
31
Drainage Strategy Framework
251 Recommended good practice
No Good practice Example references
1 Regularly repeat screening exercise to determine catchments requiring a Drainage Strategy and modify programme of Strategy development accordingly
Check for changes in measured rates of flooding and pollution incidents blockages collapses pumping station failures etc
Check for changes in extent and location of new development
Check for activities being undertaken by partners (eg redevelopment urban realm improvements and flooding and pollution management activities)
SRM5 illustrates how improved and updated knowledge of system performance should be applied to establish Strategies
2 In lsquolive Strategiesrsquo repeat risk assessment when data and models improve and adjust confidence scores accordingly
Confirm that Strategy will still achieve performance indicators and outcomes at least cost Revise Strategy as necessary
3 Periodically refresh Strategy accommodating impact of interventions already delivered using re‐verified predictive tools as appropriate
Confirm that Strategy will still achieve performance indicators and outcomes at least cost Revise Strategy as necessary
Triggers for a wholesale review of the Strategy are likely to be significant changes to the location or extent of planned development
4 Monitor report and share (with partners) the measures used to demonstrate delivery of outcomes Example measures may include the number of properties which experience sewer flooding the number of properties at risk of flooding the number of properties at risk from sewerage asset failure risk indices that capture both the probability and consequence of failure customer satisfaction with regards to clean rivers and beaches the number of pollution incidents the frequency of combined sewer overflow operation and compliance with discharge permit conditions
252 Good practice example ndash Thames Water live DAP
Thames Water has initiated a DAP (drainage area plan) Live approach Itrsquos a good example of how companies are continuously monitoring and updating the status of drainage area risks It provides a lsquoliversquo snapshot of the current health of all drainage areas in Thames Waterrsquos region allowing real time planning as part of a strategic approach It enables drainage planners to view the effectiveness
205240txt012|May 2013
32
Drainage Strategy Framework
of intervention strategies and compare incident rates across varying geographies and development types in the Thames Valley
DAP Live will be available for all catchments in the Thames Water area thus enabling
bull high level monitoring of risks across the business bull a live and strategic review of catchment performance bull prioritisation of catchments based on risk and bull an ability to share data with partners collaborating in drainage planning and improvements
Figure 12 illustrates the types of data managed through the DAP Live system These include asset data political and drainage boundaries environmental data operational data property amp growth data and modelling data As new data become available the DAP Live system is updated so that drainage planners have the most current view on emerging risks and issues
Asset data
Operational data
Property and growth data
Modelling data
Environmental data
Boundaries (SDACs operational political)
Figure 12 Data types held in the DAP Live system
Figure 13 illustrates how the system can provide analysis at a variety of scales from local authority boundaries sewage treatment works catchments drainage areas or a regular grid
205240txt012|May 2013
33
Drainage Strategy Framework
NE PROVINCES
WESTERN PROVINCES
NE LONDON bull Ops areas local W LONDON
SE LONDON authorities Large TIDWORTH SE PROVINCES
bull STW Catchments
bull Drainage areas(SDACs)
bull Regular grid Small
Figure 13 DAP Live reporting performance at different scales
205240txt012|May 2013
34
Drainage Strategy Framework
253 Good practice example ndash Wessex Water Water live data
Wessex Water is regularly using data geospatially to proactively identify and respond to risk Theirs is a good example of how data can be used to provide an adaptable approach that is regularly reviewed to plan investment
The risk‐based and live approach uses a set of likelihood and consequence models which are built up from all currently available data asset data (eg CCTV data material age) operational data (eg flooding and pollutions incidents) and information (eg locality near hospital or downstream of an overflow) All these data are collated for the entire Wessex region updated regularly and analysed geospatially
Figure 14 Sewer risk scores presented in a risk matrix and geospatially
This allows a risk score (Figure 14) to be calculated for each mapped sewer length which directs investigation more efficiently by allocating each mapped sewer a planned CCTV inspection date
This risk‐based approach has been successful in targeting problematic sewers increasing identification rates threefold Density analysis is performed using asset failure and operational information which allows planning of both proactive structural and operational investment
Proactively found structural issues are far more cost effective to repair before failure and can also prevent serviceability issues
205240txt012|May 2013
35
f
DDrainage Strateegy Frameworrk
Figgure 15 Hotsppot analysis
Thhe hotspot annalysis (Figuure 15) showss where operrational clustters have beeen calculatedd This hootspot analyssis is made aavailable on tthe Wessex WWater corporrate GIS to a llow operati onal staff to target their effforts to mitiggate against ffurther repeaat incidents AAdditional innformation ffrom asset annd operationnal activities ccan be addedd regularly too the databasses which drrive the mod els enabling rissk scores to bbe kept as livve as require d
226 Prrinciple Sixx Innovativve and Susstainable SSolutions
Thhe Drainage Strategy Fraamework proomotes the fuull evaluationn of alternatiives to tradit ionally enngineered sewwerage soluttions to test wwhether thesse offer loweer whole life ccost options or better reesponses to uuncertainty It is anticipaated that draainage solutioons of the futture will be ddifferent froom the ones we are usedd to
Thhese should iinclude (at leeast at a highh level) real ttime control storm waterr retrofit techhniques edducation to eenable custommers to changge behaviou r enhancingg incentives for customerss to reduce suurface water flowing to seewers and innnovative pe rmitting arraangements a cross drainagge networks annd sewage tr eatment worrks Water annd sewerage companies sshould continnue to revieww and deevelop other innovative ssolutions
Foor example wwhere a commpany may hiistorically haave preferredd to tackle seewer floodingg or coombined sewwer overflow pollution byy increasing iits undergrouund equipmment to store mmore rainfalll duuring stormss it might connsider other options in fuuture ndash such as working wwith custommers to mmanage the raainfall close tt eventing it foorm enteringg the sewer syystem o source pre
2205240txt012|Mayy 2013
36
Drainage Strategy Framework
261 Recommended good practice
No Good practice Example references
1 Use cost‐benefit methods to demonstrate that innovative and sustainable solution types provide best value for customers and the wider community
UKWIR will publish new research and guidance in 2013 addressing active control and storm water removal demonstrating how these technologies can be justified and included within Drainage Strategies
2 Consider integrated water resource management Work with partners (especially developers and local authorities) to examine whether use of stored stormwater reduces potable water consumption AND need for capacity in sewers
CIRIA has published a scoping study for water sensitive urban design45 in the UK
3 Consider a mix of conventional and new technologies using more adaptive approaches as low‐regrets responses to uncertainty eg prevent current sewer flooding with underground tank storage but address future risks (worsened by climate change) with retrofit SuDS implemented progressively
CIRIA has published lsquoRetrofitting to manage surface waterrsquo46 a comprehensive guide to planning and delivering this type of project
4 Use carbon accounting methods to compare embodied and emitted carbon in alternative intervention strategies so that these impacts are accounted for in whole life costs
Consider the benefits of surface water removal on the costs (including carbon) of pumping and sewage treatment
UKWIR47 has and continues to publish detailed guidance on carbon accounting for water and sewerage company use
45httpwwwciriaorgserviceresearch_informationAMContentManagerNet ContentDisplayaspxSection=research_informationampContentID=23581 46httpwwwciriaorgSERVICEHomecoreordersproductaspxcatid=5ampprodid=1909 47httpukwirforefront‐librarycomreports08‐cl‐01‐6923419000190269902659465890269
205240txt012|May 2013
37
Drainage Strategy Framework
No Good practice Example references
5 Where interventions include the provision of green space public amenity and improved habitats then Payment for Ecosystem Services approaches can be used to claim further monetised benefits in the appraisal Customers should be consulted to help value these benefits
The Environment Agency will publish data in 2013 on costs and benefits of retrofit stormwater projects to promote understanding and uptake
6 Share data within the industry on innovative solutions to increase knowledge of new technology and SuDs approaches
EA retrofitting SuDs costs and benefits database48
accommodating data from Ofwat AMP5 SuDS pilot initiative and other examples
262 Good practice example ndash Welsh Water surface water reduction and removal strategy for Gowerton and Llanelli
Dŵr Cymru Welsh Water and partners are applying innovative storm water removal methods to address capacity problems in the sewer network in Gowerton and Llanelli49 (population 140000) Current under capacity leads to localised sewer flooding and excessive combined sewer overflow (CSO) spill to the Burry Inlet a protected shellfish water and special area of conservation The capacity problems in the system were a concern for the Environment Agency (Wales) and there was a risk of widespread restrictions to economic development being imposed Dŵr Cymru Welsh Water Carmarthenshire County Council City and County of Swansea Consumer Council for Water Environment Agency Wales and the Welsh Government all worked in partnership to resolve the situation
A brand new hydraulic model was built for the entire sewerage network with particular attention paid to accurately representing the sources of storm run‐off and infiltration The model was verified against data from flow monitors and observed CSO spill frequencies into the Burry Inlet
To begin with a traditional sewer storage solution was proposed that would result in an average 10 spills a year into the shellfish water from all 90 CSOs in the two catchments Although this reduced spills and dealt with some of the flooding and growth issues the storage requirements would have been unaffordable provide no protection against long term climate change and would not tackle the fundamental problem of too much surface water getting into the combined network
An alternative approach based on the reduction and removal of storm water from the combined sewer system was also developed This was in accordance with Dŵr Cymru Welsh Waterrsquos Rainscape50 (surface water elimination and reduction) strategy To identify areas with the most
48httpevidenceenvironment‐agencygovukfcermenDefaultHomeAndLeisureFloodsWhatWereDoingIntoTheFutureScience ProgrammeResearchAndDevelopmentFCRMProjectaspxProjectID=15515be8‐bbed‐4204‐ae56‐3e810ba47694ampPageID=56bad68e‐dcb1‐4bf8‐84cc‐cbfd03ab63a2 49 httpwwwciwemorgmedia674511Paper20820Stephen20Ollierpdf 50httpwwwdwrcymrucom_libraryleaflets_publications_english
205240txt012|May 2013
38
Drainage Strategy Framework
potential for effective storm water removal a flowareaflooding thematic map was developed This was used to focus attention on areas which would deliver the most benefit if storm water removal was carried out These areas are coloured red in Figure 16
Figure 16 Thematic map showing areas of maximum potential for storm water removal
The following interventions (181 in total) were combined into single strategy to be delivered in phases by 2015 2020 and afterwards
bull The management of surface water through swales basins and soakaways rather than through combined sewers resulting in new amenity and ecological areas within the built‐up environment
bull Implementing smarter flow control to better use existing storage and conveyance assets bull Relining of sewers to prevent groundwater ingress bull Removal of land drainage connections to sewers bull Household rainwater harvesting retrofit schemes
surface_water_management_strategypdf
205240txt012|May 2013
39
Drainage Strategy Framework
Figure 17 is an artistrsquos impression of what one of the sustainable urban drainage system solutions may look like
Figure 17 Example retrofit SuDS solution proposed for Gowerton and Llanelli
Modelling has demonstrated that the alternative strategy will achieve the same CSO reduction benefit as the storage strategy together with flooding improvements and additional less tangible benefits at significantly lower cost than the traditional sewer storage solution
Figure 18 illustrates the dispersed nature of solutions identified for central Llanelli
Figure 18 Water sensitive urban design interventions planned for central Llanelli
205240txt012|May 2013
40
Drainage Strategy Framework
Appendix A
Glossary
205240txt012|May 2013
Drainage Strategy Framework
Appendix A Glossary
CAPEX Capital expenditure Appointed water and sewerage companiesrsquo spending on new replacement or refurbished capital assets such as construction or buying machinery
CIWEM Urban Drainage Group (WaPUG) A group of the Chartered Institution of Water and Environmental Management supporting professionals working in urban drainage
Combined Sewer Overflow (CSO) The discharge of untreated sewage diluted with storm water into rivers and the sea CSOs occur during heavy rain and are necessary to reduce the risk of sewer flooding The physical overflow structure is also called a CSO
Common Framework for Capital A planning approach developed for the water and Maintenance Planning sewerage companies in 2002 which provides a robust basis
for assessing future capital maintenance needs The approach is consistent with the needs of Ofwat
Defra The Department for Environment Food and Rural Affairs The Government Department with responsibility for water flooding and water quality in England
Drainage Area Plan (DAP) A detailed plan for a drainage catchment that prioritises a list of interventions based on risk using an approach established in the WRc Sewerage Rehabilitation Manual This approach has been succeeded by Sewerage Risk Management which guides the preparation of Sewerage Management Plans (SMP) Companies vary in how they prepare DAPs or SMPs (or their equivalents) following the general principles that have been established
Drainage Strategy Developed by water and sewerage companies to demonstrate how outcomes will be delivered in drainage catchments over the long term Drainage Strategies will use the information developed in producing a DAPSMP and if a drainage strategy has been produced this should be the starting point in producing a more detailed DAPSMP should this be required It is likely that the activities required to prepare DAPSMP and Drainage Strategies may overlap Drainage Strategies might not refer to specific interventions but instead outline a general approach
Drainage Strategy Framework Guidance to describe the contents and intention of Drainage Strategies
205240txt012|May 2013
Drainage Strategy Framework
Flood Risk Management Plans Required by the Flood Risk Regulations in Flood Risk Areas by December 2015
Flood Risk Regulations The legislative instrument used to implement the requirements of the Floods Directive in England and Wales
Floods Directive DIRECTIVE 200760EC of the European Parliament and of the Council of 23 October 2007 on the assessment and management of flood risks
Lead Local Flood Authority (LLFA) The Shire County or unitary authority with responsibility for managing local flood risk
Local development plans Developed by planning authorities to explain where and what type of development (new homes and businesses) will occur within their area They are required to explain water infrastructure needs to support this development
Local Flood Risk Management Strategy Developed by the Lead Local Flood Authority to explain (LFRMS) how local flood risk will be managed by the Authority and
in partnership with others
Natural Resources Wales From 1 April 2013 Natural Resources Wales (NRW) a new body formed by the Welsh Government will take over the functions previously carried out by the Environment Agency (EA) in Wales alongside those of the Forestry Commission Wales and the Countryside Council for Wales
Ofwat The Water Services Regulation Authority ndash the economic regulator of the water and sewerage companies of England and Wales
OPEX Operating expenditure Appointed water and sewerage companiesrsquo day‐to‐day spending on running the services for example staff costs and power This is likely to include investment in joint projects that do not create or relate to an asset that the company solely or jointly owns
Outcomes Outcomes are the higher level objectives that a companyrsquos actions are intended to deliver A companyrsquos outcome should reflect its customersrsquo priorities identified through appropriate customer engagement and deliver the best long‐term sustainable solution for customers and the environment An outcome may not be bound by a single price control period and should be set in the context of customersrsquo and the environmentrsquos long‐term needs
205240txt012|May 2013
Drainage Strategy Framework
Price Review The process of setting appointed water and sewerage companiesrsquo price limits The next price review will take place in 2014 for the period 2015‐20 Ofwat currently sets price limits every five years
Real Time Control (RTC) Using actuated pumps gates and weirs to actively control flow in sewers Better use can be made of existing infrastructure and links can be made between network treatment and receiving water systems for operational benefits Sometimes referred to as Active Management
River Basin Management (Plans) River Basin Management is a continuous process of planning (to develop River Basin Management Plans) and delivery The Water Framework Directive introduces a formal series of 6 year cycles The first cycle will end in 2015 when following further planning and consultation the River Basin Management Plans will be updated and reissued
Sewerage Management Plan A risk based approach to indentifying investment needs in sewerage systems as described in the Sewerage Risk Management (SRM) approach developed by WRc plc
Storm water retrofit Releasing capacity in sewers by controlling stormwater at the surface using disconnection swales and other sustainable drainage systems (SuDS)
205240txt012|May 2013
We are the Environment Agency We protect and improve the environment and make it a better place for people and wildlife We operate at the place where environmental change has its greatest impact on peoplersquos lives We reduce the risks to people and properties from flooding make sure there is enough water for people and wildlife protect and improve air land and water quality and apply the environmental standards within which industry can operate Acting to reduce climate change and helping people and wildlife adapt to its consequences are at the heart of all that we do We cannot do this alone We work closely with a wide range of partners including government business local authorities other agencies civil society groups and the communities we serve
wwwenvironment‐agencygovuk
Environment Agency National Customer Contact Centre
Telephone 03708 506 506 enquiriesenvironment‐agencygovuk
Ofwat (The Water Services Regulation Authority) is a non‐ministerial government department We are responsible for making sure that the water and sewerage sectors in England and Wales provide consumers with a good quality and efficient service at a fair price
wwwofwatgovuk
Telephone 0121 644 7500 mailboxofwatgsigovuk
Halcrow Group Limited Burderop Park Swindon Wiltshire SN4 0QD
tel 01793 812479 fax 01793 812089 halcrowcom
Halcrow Group Limited is a CH2M HILL company Halcrow Group Limited has prepared this report in accordance with
the instructions of The Environment Agency for the clientrsquos sole and specific use Any other persons who use any information contained herein do so at their own risk
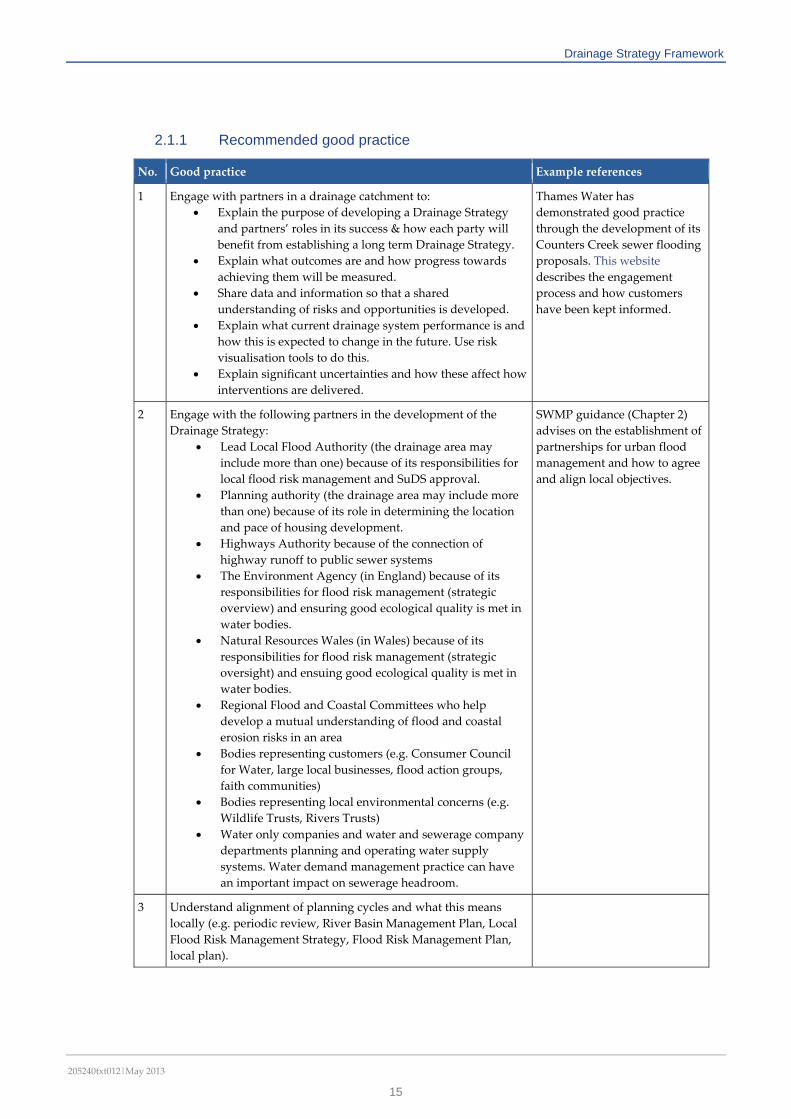
Drainage Strategy Framework
No Good practice Example references
4 Be alert to opportunities for joint solutions andor shared funding by understanding local plans for new development re‐development improving street furniture and public open space improving parks and green infrastructure Understand Lead Local Flood Authority and Environment Agency programmes for the management of flood and pollution risks
A guide to joint funding of local flood risk management intervention has been published by Defra33 and provides relevant advice to water and sewerage companies and other partners
5 Consider water and sewerage company funded solutions which deliver third‐party non‐sewerage assets that result in the long term least cost delivery of outcomes (eg water and sewerage company funding of household rain barrels and rain gardens to prevent surface water entering sewers)
6 Use data and mapping from the Environment Agency and Natural Resources Wales to understand exposure of drainage infrastructure to extreme events (eg coastal fluvial and surface water flood maps) so that network resilience can be understood and improved if this is cost beneficial
UKWIR has completed a project in 2013 lsquoResilience building a business case for PR14 and beyondrsquo
7 Work with LLFAs and the Environment Agency (or Natural Resources Wales) to understand the effectiveness of interventions at reducing risk and use this information to improve intervention planning
The UPM3 manual (section 7) advises on post project monitoring needs for water quality driven improvements
8 Share Drainage Strategies with partners and stakeholders so that there is transparency around challenges opportunities and the roles expected of different organisations
212 Good practice example ndash South West Water working with local authorities
These examples from South West Water illustrate how the company has worked with local authorities to coordinate investments and to share resources and skills in the development of integrated urban drainage management studies and Surface Water Management Plans
bull South West Water approached Devon County Council (DCC) to pool resources in delivering two (of five) pilot integrated urban drainage management studies (IUDMs) for Exeter and Exmouth South West Water took the lead role for Exmouth but DCC led in Exeter This engagement shared costs across organisations and has facilitated the production of full Surface Water Management Plans The collaboration has resulted in a shared understanding of the urban drainage challenges faced by both organisations and has opened dialogue around investment priorities
bull In Lyme Regis South West Water supported extensive coastal erosion defence works being carried out by West Dorset District Council by accelerating a programme of sewer rehabilitation and targeting renovation of sewers in vulnerable areas
bull In partnership with Cornwall County Council (CCC) and the Environment Agency South West Water has been working on a number of key drainage issues identified by CCC in its Preliminary Flood Risk Assessment (PFRA)
33 httprandddefragovukDefaultaspxMenu=MenuampModule=MoreampLocation=NoneampCompleted=0ampProjectID=17085
205240txt012|May 2013
16
Drainage Strategy Framework
bull In Camborne South West Water has taken the opportunity to invest in sewer separation works which align with the aims of the Camborne Pool Redruth urban regeneration group supported by Cornwall Council and to promote sustainable development economic growth and a strategic aim of lsquosewers for sewagersquo
213 Good practice example ndash Northumbrian Water partnership working in Tyneside
Northumbrian Water has led a sustainable sewerage study for Tyneside34 between 2010 and 2012 It is a good example of how partner organisations can collaborate to understand and resolve drainage issues in their urban area
Its approach was informed by the fact that a shared urban drainage problem around flooding and pollution was best addressed by a shared response from all the relevant organisations The project steering group involved representatives of Northumbrian Water the Consumer Council for Water the Environment Agency and five Lead Local Flood Authorities The urban drainage system collects wastewater for a single wastewater treatment works serving a population of over 900000
Working together the group studied the impact of growth urban creep and climate change on future urban drainage issues Figure 5 illustrates how a city‐wide map of potential problem areas was generated by the project team sharing data on sewer capacity (from Northumbrian Water) population change (from the local authorities) and river flooding (the Environment Agency) It was predicted that future problems were more likely to occur in the darker shaded areas These became focus areas for the project where a range of traditional and novel drainage solutions were tested
Figure 5 Future drainage problem areas indentified through data sharing
34httpcommunicatoremailcomINfNLOjNRayfOA1rfrfYcdK‐S7UwRcYcNoWebViewaspx
205240txt012|May 2013
17
22
Drainage Strategy Framework
The project team was keen to promote its work to customers and the community and prepared a series of newsletters updating interested parties on progress and issues An example is illustrated in Figure 6
C lic k here if y ou are hav in g d if f ic u lties v iew ing th is new s letter
Ho m e A b o u t u s M e d ia ce n tre C o n tact
Issue 2
Ap ril 2012
In th is ed ition U n d e rs tan d in g th e fu tu re
S u s tain ab le d ra ina g e o p tio ns
F ind ou t more about Th e 2 0 1 1 an n ua l re po rt
Ou r e n viro n m e n ta l p o licy
Ou r co rp o ra te re sp o nsib il i ty s tra te g y
W e lcom e to th e s e con d e ditio n o f S u sta inab le se we ra g e a s ix-m on th ly n e ws le tte r p ro d u ce d to b ring yo u th e la te s t n e ws on o u r m a jo r s tud ye xp lo rin g s us tain ab le s ew e ra ge o p tions in th e Tyn e s id e a rea I h o p e yo u fin d th e in fo rm a tio n o f in te res t a n d wo u ld w e lcom e fe e db a ck o n an y o f th e issu es ra ise d
Ric ha rd W a rne ford W a s te wa te r Dire c tor
U nderstand ing the fu tu re W e a ll kn o w th e difficu lties o f a ccu ra tely p re d ic tin g th e fu tu re h ow e ve r ifw e a re to p re pa re fo r i t th e n it is s om e thin g we m us t a tte m p t As p a rt o f th is s tu d y w e a re co ns id e rin g w ha t d em a nds w ill b e p la ce d on th e d ra ina g e s ys tem s a t 2 0 20 a n d a t 2 0 50 in co rpo ra ting g ro w th u rba n cre e p a nd c lim a te cha n ge B y w o rk in g close ly w ith o u r p a rtn e rs an d u s in g th e la tes t te ch n ical res e a rch we h a ve d e ve lo p ed a n d com p u te rm od e lle d a num b e r o f s ce na rios to id en tify a n d d e fin e fu tu re ris ks Th es e ris ks in c lud e p red ic tions o f p o te n tia l floo d in g p o llu tion o r b a rrie rs to g ro w th N o w th a t w e be tte r u n d e rs ta nd th e iss u es we a re a ble to p re pa re p la ns p rom o ting o p po rtu n ities fo r s us ta in a ble d rain ag e s ys tem s in o rde r to d e live r th e b es t p oss ible s e rvice fo r o u r cu s tom e rs b a la n ced a g ains te n viro nm e n tal n e eds a n d cos ts
S usta inab le d ra inage op tions W e b e lie ve o u r a pp ro a ch re p res en ts go o d p ra ctice fo r th e m a n ag em en t o f s u rfa ce wa te r w h ich is to d ea l w ith th e s u rfa ce wa te r as c los e to s ou rce as p oss ib le A w id e ra n g e o f p o te n tial o p po rtu n ities a re b ein g id e n tifie d in c lu d in g lo ca l a n d s tra te gic o p tions
S tra te g ic o p tions a re typ ica lly la rg e r th a n th e lo ca l on es a nd in c lu d e fe a tu res s u ch as a re as o f la nd w h ich w o uld b e a llo we d to flo o d d u rin g he a vy ra in (s a crific ial s to ra g e ) a n d p e rm a n en t w e tla nd fe a tu res
L o ca l op tio ns d esp ite b ein g sm a lle r th a n th e s tra te gic o n es w ill s til l p la y a ke y ro le in th e p ro vis io n o f s us tain ab le d ra ina g e Th e ir n a tu re m e a ns de p lo ym e n t co u ld be m o re w id es p re a d th a n s tra te gic o p tions fe a tu res su ch as w a te r b u tts ra in g a rde ns a nd p e rm e ab le pa vin g co u ld b e re la tive ly e a s y to fi t in to
Figure 6 Newsletter promoting urban drainage partnership working
Principle Two Uncertainty
Strategies should explain the reliability of data and knowledge about current and future performance of drainage systems They should explain what steps are planned to improve this understanding and how this will benefit customers Where future performance is uncertain (eg because of sensitivity to climate change) they should explain how adaptive approaches will be used to ensure outcomes are met The uncertainty in predictions of future risks should be recognised and accommodated within decision making
205240txt012|May 2013
18
Drainage Strategy Framework
221 Recommended good practice
No Good practice Example references
1 Data analysed and used in the development of the strategy related to asset location dimensions condition failure and flood and pollution incidents should be assigned a confidence grading The confidence grading should be related to its accuracy completeness compatibility credibility and currency
Models used to predict blockages and collapses flooding locations polluting discharges and water quality impacts should be assigned a confidence grading based on their accuracy completeness compatibility credibility and currency
Model predictions should be assigned a confidence grading depending on the confidence in the model and whether it is being applied outside of its verification range (eg for extreme events or for atypical geographies)
The purpose of confidence grading data and model results used in strategy setting is to understand the likelihood that outcomes will be achieved in a cost efficient manner Where the outcomes remain uncertain knowledge of data confidence can be used to target improvement programmes
SRM5 (S3‐03‐17) refers to Ofwatrsquos method for recording the reliability and accuracy of regulatory data in bands A to D
The SWMP guidance (Section 319) describes an alternative system of grading data and model results
2 Use the Drainage Strategy to justify data and model improvement programmes This should be focussed on areas where risks are currently (or predicted to be) high and uncertainty in data or models reduces the ability to determine robust operational or capital solutions Poor model verification in high risk areas would be an indicator that model improvements were required
CIWEMrsquos urban drainage group has published a series of guides on hydraulic and water quality modelling They discuss model calibration verification and uses
SRM5 (S3‐04) describes how to determine where the current assessment of risk is sufficient to proceed or whether data and models should be improved
3 Improve understanding of network performance (and improve models) by using long term flow and level monitoring on sewers and CSOs
Yorkshire Water discusses its CSO
monitoring programme here
4 Demonstrate how the uncertainty in both the underlying datamodels and in the future projections is addressed in options appraisal Consider if this should be done implicitly (eg through choosing conservative assumptions) or explicitly through the use of sensitivity analysis or scenario testing
Treasury Green Book supplementary guidance illustrates how to accommodate climate change uncertainties
205240txt012|May 2013
19
Drainage Strategy Framework
No Good practice Example references
5 Population growth new homes and businesses climate change and urban creep combine to make the future highly uncertain but will almost certainly increase flooding and pollution risks from drainage systems Use the Drainage Strategy to explore different scenarios (combining the impact of these drivers) for a near term (le 10 years) and future (ge 30 years) epoch
For example combine modest growth and slight climate change (a low impact case) and contrast with high growth and significant climate change (a high impact case) Where the location of significant new development is unknown include scenarios accommodating different possibilities
Running multiple scenarios is time consuming and costly A risk based approach should be adopted to focus efforts where flooding and pollution risks are especially sensitive to changes in demand
UKWIR has published research on accounting for climate change35 and urban creep36 in sewerage planning together with more general advice on accommodating climate change in water asset management planning37
Ofwat has published research38
predicting the combined impacts of climate change urban creep and development on a national basis
6 In the face of significant uncertainties about future demands on the drainage system and their consequences the Drainage Strategy should identify low‐regrets interventions (ie ones that are robust no matter what the future holds) and ensure that solutions can be adapted if greater certainty is achieved For example through quickening the pace of SuDS retrofit activities or using (previously identified and secured) land to extend underground storage facilities Strategies which remove surface water from sewerage networks provide lsquoheadroomrsquo for unpredictable increases in demand from population and climate change
Designing Resilient Cities A guide to good practice DR Lomardi et al HIS BRE Press
7 Post project appraisal and cost monitoring should be used to capture real costs and performance so that Strategies can be updated and improved with latest information It is especially important to collate and understand the whole life costs of new technologies where industry understanding is currently poor
35httpwwwukwirorgreports03‐cl‐10‐09042794658901799019890198 (poundpound) 36httpukwirforefront‐librarycomreports10‐wm‐07‐1493273 (poundpound) 37httpukwirforefront‐librarycomreports12‐cl‐01‐1694816900019015590145901409465890155 (poundpound) 38httpwwwofwatgovuksustainabilityclimatechangerpt_com201106mottmacsewerpdf
205240txt012|May 2013
20
Drainage Strategy Framework
222 Good practice example ndash Severn Trent Waterrsquos MICAS
Severn Trent Water has developed a process to measure confidence in hydraulic models of sewer systems Modelling Investment Confidence Assessment Scoring (MICAS) was developed to provide an objective evaluation of model confidence It uses information stored in the hydraulic model about the provenance of each data element and the quality of model verification Before the approach was developed the assessment of lsquofitness for purposersquo of models was subjective and based on modellers judgment This was not always reliable and certainly not repeatable and transparent MICAS provides an objective assessment of hydraulic model quality which can be used to inform its use and prioritise improvements to input data and model verification
Figure 7 and Figure 8 illustrate how an understanding of model confidence from the MICAS assessment (right hand side images) can be used to interpret predictions of flooding (left hand side images) In Figure 7 areas at predicted high risk of flooding (red in the left hand side image) are shown to be in high confidence areas of the hydraulic model (green in the right hand side image) In contrast in Figure 8 areas at predicted high risk of flooding (red in the left hand side image) are shown to be in poor confidence areas of the hydraulic models (orange in the right hand side image) In the latter case this information is used to identify where further model improvements would be beneficial
Flood Risk MICAS
Figure 7 Modelled flood risk and MICAS confidence scores (high model confidence)
Flood Risk MICAS
Figure 8 Modelled flood risk and MICAS confidence scores (lower model confidence)
205240txt012|May 2013
21
23
Drainage Strategy Framework
Principle Three Risk Based
Strategies should be risk based This means that planning operational and investment activities should be based on consideration of the probability and consequence of inadequate drainage function (risks) as these relate to the achievement of measures that demonstrate delivery of outcomes A risk based Strategy ensures that investment is made where risks are the greatest
To aid communication risks should be visualised through maps and plans (Figure 10 is an example) To aid risk assessment risks should be monetised combined and predicted into the future To aid options appraisal the impact of interventions on the level of risk should be predicted
The approach to Drainage Strategy development should be risk based itself The degree of detail included should be related to an understanding of the overall level of risks in the catchment now and in the future
231 Recommended good practice
No Good practice Example references
1 Determine where a Drainage Strategy is required by combining current performance with external influences likely to result in deteriorating performance This stage requires no modelling or detailed assessment On a catchment‐by‐catchment (drainage area) basis understand current risks by collating data on current performance eg blockages collapses pumping station failures pollution incidents CSO spills storm tank spills internal flooding incidents external flooding incidents and infiltration rates Relate these risks to performance indicators and the achievement of outcomes Combine with information about known growth rates predictions of urban creep quantity of newly adopted lsquoprivatersquo sewers surface water flooding risks (eg from flood map for surface water) WFD water body status and bathing water status Prioritise catchments with high current risks andor factors suggesting that risks are likely to worsen significantly in the future Consider normalising scoring method for size of catchment (eg by unit area or unit length of sewer) Consult with stakeholders to confirm correct prioritisation Commence with development of Drainage Strategies for the highest ranked catchments Periodically revisit prioritisation (updating with new data) to check that priorities are still correct
The initialisation stage of a Sewer Management Plan (SMP) (described in SRM5) considers how a risk assessment can be used to prioritise which spatial units (eg catchments) should be prioritised for a SMP study
2 Visualise catchment risks (from 1) to illustrate and explain to partners the reasons for prioritisation Accommodate their views amp consider changing prioritisation to aid wider drainage planning requirements (eg increase prioritisation of a catchment with significant surface water flooding problems where close collaboration between water and sewerage company and LLFA will benefit the community)
205240txt012|May 2013
22
Drainage Strategy Framework
No Good practice Example references
3 Clearly relate sewerage risks to the performance indicators that will be used to measure progress towards achieving outcomes eg relate blockage rates to flooding and pollution incidents eg relate increase in flows to increased CSO frequency breaches of permit conditions and deterioration in receiving water quality Adopt a sourcendashpathway‐receptor model and workshop techniques to ensure that cause effect and consequences are fully captured Use performance indicators as the basis for a comprehensive risk assessment that considers likelihood (frequency) and consequence (extent degree and duration of impact) of failure expressed as risk scores Monetise risks in GBP (pound) to align with principle four (whole life costs amp benefits) Use (verified) predictive models to understand near term (lt10 years) and long term (gt30 years) risks The latter to align with principle four (whole life costs amp benefits) Align complexity of method with level of risk recognising the needs of partners eg use complex 2D flood routing models to ascertain (with greater certainty) flood mechanisms and damages where the quantity and frequency of flooding is high and interventions will be complex and costly Elsewhere more simple approaches are appropriate eg use complex UPM3 water quality modelling methods where compliance with river standards or discharge consents is already failing or is expected to do so Elsewhere more simple approaches are appropriate Combine risk scores from different risks to describe the total level of risk in a catchment Use visualisation techniques to communicate combined level of risk Combine analysis from hydraulic blockage and asset deterioration models on a catchment basis In hydraulic analysis consider flooding performance for rainfall events beyond the usually provided standard of protection to understand performance in extreme events in support of partners (especially LLFAs) and in search of cost beneficial interventions at a higher standard than normal
SRM 5 (S3‐03) details approaches to simple and more complex approaches to risk assessment that are consistent with CMPCF guidelines
4 Be alert to interactions between sewer networks and wastewater treatment plans eg by modelling the impact of changing sewer flows on wastewater treatment worksrsquo performance and costs Consider combined impact of different catchments on a single or linked water body (eg an inland river bathing water or shell fishery)
UPM3 guidance discusses approaches to understanding these interactions and applying more complex water quality impact models
5 Establish systems and apply methods to predict how interventions can reduce risks eg how a targeted and pro‐active maintenance can reduce the occurrence of sewer blockage and flooding from lsquoother causesrsquo eg how reducing infiltration can reduce CSO spills eg how reducing connected impermeable area can reduce sewer flooding
205240txt012|May 2013
23
Drainage Strategy Framework
232 Good practice example ndash United Utilities risk assessment
United Utilities has demonstrated a robust risk based approach in the development of sewerage management plans used for long term planning across their area of operations
Hydraulic models were applied in 235 catchments and configured to look at future performance and to evaluate the consequences of inadequate capacity Starting from a baseline of 2010 versions of the models were built for 2020 and 2036 epochs The following model input parameters were adjusted population water consumption infiltration planned development known sewerage improvement projects urban creep rainfall (for climate change)
Two‐dimensional (2D) modelling was used to consider the consequences of sewer flooding resulting from the changes made to reflect the future operating environments As well as the impact on homes and business (from internal and external flooding) the flood risk to critical infrastructure was also considered The operation of CSOs was considered by computing the annual spill volume duration and frequency
Finally predictions of the likelihood and consequence of sewer failure were added taking account of sewer material age and the incident records relating to similar assets
All these data were combined and weighted to generate a Sewer Management Plan (SMP) Risk Score for each length of sewer The process is illustrated in Figure 9
Figure 9 United Utilitiesrsquo process for calculating risk score in sewerage catchments
205240txt012|May 2013
24
Drainage Strategy Framework
Risk scores were summed spatially and monetised so that high priority locations could be identified Mapping and visualisation were used to communicate the results of this assessment priority areas for further investigation and how risks change through time (Figure 10)
Figure 10 Visualisation of sewerage risks
233 Good practice example ndash Northumbrian Water risk assessment
Northumbrian Water completes an annual assessment of hydraulic capacity in its sewerage network at the drainage area scale Its approach does not require hydraulic models to have been completed and yet can reliably highlight areas of under‐capacity in need of further investigation through more detailed analysis including hydraulic modelling New and emerging risk areas can also be identified by applying data for population growth which occurs through development lsquoWhat ifrsquo scenarios can be run to test when capacity limits may be overcome and flood risks potentially set to increase It demonstrates good lsquorisk basedrsquo planning principles because it shows the drainage planner where more detailed analysis is warranted
The approach uses the following data from company records population connected to sewer P water consumption rate G (lhd) trade discharge E (ls) pipe diameter and gradient pipe connectivity CSO consent pass forward rate (ls) pumping station rate (ls) sewage treatment flow rate (ls) A wastewater dry weather capacity map calculates pipe full capacity dry weather flow (PG+E+I) and Formula A flow for fully combined (1360P+2E+DWF) and separate (4PG+3I+E) areas of the network Infiltration (I) is assumed to be 50 PG +E
205240txt012|May 2013
25
Drainage Strategy Framework
A theoretical assessment of network capacity is then calculated by comparing Formula A with pipe full capacity flow consent values at CSOs and wastewater treatment works and pumping rates This determines areas of the network with a capacity shortfall with a potential capacity shortfall and with no capacity shortfall
When run across the whole company area approximately 100 out of 500 drainage areas were found to be under capacity Over 60 of these areas had recorded sewer flooding incidents In over 300 drainage areas there was no forecast capacity shortfall Only 7 of these drainage areas had recorded sewer flooding incidents Overall the system proved to be very reliable at predicting drainage areas likely to have sewer flooding problems because of sewer under‐capacity
In under capacity drainage areas an intermediate (hydraulic model based) assessment is then carried out Figure 11 shows the results thematically mapped for an example drainage area Red areas are predicted to have a very high risk of sewer flooding Yellow and green areas are predicted to have a low risk of sewer flooding
Figure 11 Example of a drainage area capacity map
205240txt012|May 2013
26
24
Drainage Strategy Framework
Principle Four Whole Life Costs and Benefits
Strategies should be informed by consideration of whole life costs and benefits They should promote a series of interventions which in view of the quantified uncertainties are most likely to result in performance indicators which demonstrate the achievement of outcomes at lowest cost to customers and the community more widely
Costs relate to capital and operational expenditure to deliver interventions and the monetised impacts of drainage failures such as flooding and pollution
Benefits relate to the reduction in risks from drainage failures such as flooding and pollution but should also include wider societal impacts such as those calculated using a lsquoPayments for Ecosystems Servicesrsquo approach
When considering the lsquowhole lifersquo the strategy should consider climate population and asset deterioration trends These are likely to increase risks over the long term if no interventions are made The strategy should state lsquowhatrsquo should be done but also broadly lsquowhenrsquo and in what sequence interventions should happen
241 Recommended good practice
No Good practice Example references
1 Predict risks into the future for at least two epochs le10 years (to understand what the company needs to do now and how this fits with longer term outcomes) and ge30 years to understand long term needs in light of changing population and other pressures
Account for the following changes in demand
bull Growth ‐ new homes and businesses
bull Urban creep ndash uncontrolled addition of connected impermeable area
bull Climate change ndash affecting design events (flood predictions) time‐series (CSO and treated effluent quantities) river flows and temperatures
bull Infiltrationexfiltration ndash through deteriorating sewer condition
bull Dry weather flows ndash through changes in water consumption rates
2 Combining monetised risks (associated with sewerage failures) determine whole life costs for a lsquodo nothingrsquo scenario (ie no interventions)
Include costs associated with electricity consumption (in the network and at the wastewater treatment works) and CO2 emissions
UKWIR will publish in 2014 a revision to their Long Term Least Cost Planning for Wastewater Supply‐Demand
guidance This may provide tools and methods for expressing costs and benefits to support the development of a Drainage Strategy
205240txt012|May 2013
27
Drainage Strategy Framework
No Good practice Example references
3 Test intervention strategies which keep performance indicators on track to deliver outcomes by adding capacity (supply) reducing flows (demand) or altering operational regimes
Include the costs of interventions and the benefits of reduced risks to inform selection of the most cost beneficial strategy over the whole life
Have regard to the timing of interventions recognising that uncertainty may require low‐regrets (insensitive to uncertainty) solutions and that delaying major interventions may be more affordable and attractive in the short term Discounting should be used to compare the costs and benefits of interventions occurring at different times
Recognise that some interventions will be obligatory and defined (eg maintenance of a spill frequency standard at a CSO) whilst others will be more discretionary focused on achieving outcomes rather than specific outputs
SRM5 (Section 8) defines and contrasts cost benefit analysis cost effectiveness analysis whole life cost analysis and risk cost benefit analysis
HM Treasury Green Book39
sets out a framework for the appraisal of long term projects which can be applied to the development of a Drainage Strategy
4 Donrsquot at first be concerned with the distribution of costs and benefits between partners who may be sharing costs Identify the most cost beneficial solution first and then debate and agree an equitable sharing of costs
Give equal weighting to OPEX (operating expenditure) and CAPEX (capital expenditure) costs so not to cause bias towards capital intensive solutions Properly consider the costs and benefits of pro‐active maintenance regimes and campaigns to influence customers to reduce fats oils and greases (FOG) build‐ups and the misuse of sewers
Consider the affordability of solutions the impact on customersrsquo bills and the resources of other organisations to play their part
UKWIR research outputs40 in 2013 (SW01) will provide a framework for making a business case for separating storm water from combined sewers
5 Where interventions include the provision of green space public amenity and improved habitats then Payment for Ecosystem Services approaches should be used to identify further monetised benefits in the appraisal Customers should be consulted to help value these benefits
Supplementary Green Book41
guidance describes methods for accounting for environmental impacts including the ecosystems approach
39 httpwwwhm‐treasurygovukdata_greenbook_indexhtm 40 httpwwwukwirorgpublishorsystemcomponent_viewaspLogDocId=96116 41 httpwwwhm‐treasurygovukdaccounting_environmental_impactspdf
205240txt012|May 2013
28
Drainage Strategy Framework
242 Good practice example ndash Severn Trent Water making the case for surface water separation in Stoke-on-Trent
In this example42 Severn Trent Water compared alternative ways of addressing sewer flooding problems by looking at a range of costs and benefits not all of which were directly associated with its specific responsibilities as a water and sewerage company Whilst the example does not express a monetised value for all costs and benefits over the whole life it does illustrate the types of factors which could be included in an appraisal of this type scaled to address problems at a catchment level It also demonstrates how working collaboratively can help identify solutions which are cost‐beneficial for the community at large
In an area of Stoke served by a combined sewer system five properties were at risk from sewer flooding in cellars for events equal to and less frequent than the 1 in 10 year probability A conventional sewer pumping station based solution was presented as the standard option
However a nearby former hospital site was also undergoing re‐development which would result in reduced runoff to the combined sewer The new drainage regime in the redevelopment site was sufficient to remove the flood risk at the five properties (this was a do nothing strategy)
A third option completely separated the development site runoff from the combined sewer and also addressed local flood risk issues nearby The solution required a new storm sewer and a network of swales and other SuDS features connecting with an ordinary watercourse
Table 1 illustrates how costs and benefits were compared across the three alternative strategies Each provided the same benefit in terms of the number of homes (5) relieved from sewer flooding The novel SuDS and surface water management solution additionally gave local flood risk relief to 3 further properties The separationSuDS strategy came at a higher capital cost but delivered greater social cost benefits savings in annual operating costs and a bonus improvement water quality (because of reduced CSO spill volume) Severn Trent selected the separation SuDS solution because the higher capital costs were offset by other benefits
Table 1 Costs and benefits of drainage improvements in part of Stoke-on-Trent
Do nothing Standard option
SuDS
Sewer flooding benefits 5 5 5
Other flooding benefits 0 0 3
Change in runoff to combined sewer (m3year) 0 0 ‐40000
Estimated cost (pound) 0 168000 419000
42httpwwwciwemorgmedia695460Paper203_Creating20Sewer20Capacity_Presentation2 0by20Mike20Woodpdf
205240txt012|May 2013
29
Drainage Strategy Framework
Do nothing Standard option
SuDS
Social Cost Benefit (pound) 16000 5000 51000
Change in electricity costs (poundyear) 0 +75 ‐525
Programme impact (years to deliver solution) + 4 0 +4
CSO spill volume (m3 in 1year event) +298 0 ‐397
243 Good practice example ndash New York City comparison of grey and green infrastructure drainage strategies
This example is taken from New York in the United States of America Itrsquos an illustration of how whole life costs have been compared for alternative strategies to solve urban drainage issues on a mega‐city scale The key data are summarised in Table 2
Table 2 Comparing drainage strategies in New York
Grey Strategy
Green Strategy
CSO spill volume reduction (billion gallons year)
101 122
Wider benefits over 20 years ($ million) 0 139 to 418
Whole life costs over 20 years ($ billion) 68 53
The information is taken from the New York City Green Infrastructure Plan43 produced by the Mayorrsquos Office in 2010 The Plan (and recent updates) provides a comprehensive evidence base around costs and benefits of different approaches to address the cityrsquos drainage problems It is therefore an excellent example of how drainage strategies can be described in plain language for a non‐specialist audience concerned with their environment and the cost of providing infrastructure to enhance it
It is becoming commonplace for North American cities (eg Portland and Philadelphia) to address the issue of frequent combined sewer overflow (CSO) operation by using a combination of grey infrastructure (sewers) and green infrastructure (sustainable drainage systems) The wider health
43 httpwwwnycgovhtmldephtmlstormwaternyc_green_infrastructure_planshtml
205240txt012|May 2013
30
25
Drainage Strategy Framework
and ecological benefits of green infrastructure approaches and the reduced reliance on materials and energy are attractive to utility planners and cities alike
New York has 422 CSOs and an agreed Long Term Control Strategy to significantly reduce the impact wet weather discharges have on aquatic systems throughout the city Annual discharges are currently (2010) estimated to be 30 billion gallons (114 million cubic meters) per year Building on existing and committed new sewer plans an agreed grey infrastructure based strategy to this problem is set to reduce these discharges to 198 billion gallons per year (a 34 reduction) by the 2030s An alternative green infrastructure approach based around intercepting the first inch (25mm) of rainfall across 10 of the impermeable city area by 2030 is predicted to reduce CSO spills to 179 billion gallons per year
Planners have calculated that the whole life costs after 20 years of the grey infrastructure solution will be $68 billion (2010 prices) compared to the green infrastructure whole life costs of $53 billion The green infrastructure strategy reduces CSO spills by more than the grey alternative for $15 billion less in terms of whole life cost Further planners have calculated that New Yorkers will benefit by up to $41844 million (accumulated over 20 years) in additional benefits associated with lower energy bills from control of urban heating increased property values and improved health
Based on this analysis New York City has committed itself to an aggressive green infrastructure based runoff control strategy to provide long term reductions in CSO spills The plan is to achieve interception of 15 of impermeable area by 2015 4 by 2020 7 by 2025 and 10 by 2030
Principle Five Live Process
The Strategy should be adaptable and periodically reviewed Whilst outcomes are expected to be relatively stable over time the pace at which the Strategy delivers outcomes will be linked to volatile influences (like climate and population change) and to the decisions made at each price review about the priorities for the following period The Strategy should be reviewed at regular intervals to reflect investments already made the changing priorities of the water and sewerage company and partners and the presence of emerging risks The review is also an opportunity to report drainage catchment performance relative to performance measures designed to monitor progress towards achieving outcomes
44 Estimated using methods from the New York Municipal Forest Resource Analysis (MFRA) prepared by the US Dept of Agriculture
205240txt012|May 2013
31
Drainage Strategy Framework
251 Recommended good practice
No Good practice Example references
1 Regularly repeat screening exercise to determine catchments requiring a Drainage Strategy and modify programme of Strategy development accordingly
Check for changes in measured rates of flooding and pollution incidents blockages collapses pumping station failures etc
Check for changes in extent and location of new development
Check for activities being undertaken by partners (eg redevelopment urban realm improvements and flooding and pollution management activities)
SRM5 illustrates how improved and updated knowledge of system performance should be applied to establish Strategies
2 In lsquolive Strategiesrsquo repeat risk assessment when data and models improve and adjust confidence scores accordingly
Confirm that Strategy will still achieve performance indicators and outcomes at least cost Revise Strategy as necessary
3 Periodically refresh Strategy accommodating impact of interventions already delivered using re‐verified predictive tools as appropriate
Confirm that Strategy will still achieve performance indicators and outcomes at least cost Revise Strategy as necessary
Triggers for a wholesale review of the Strategy are likely to be significant changes to the location or extent of planned development
4 Monitor report and share (with partners) the measures used to demonstrate delivery of outcomes Example measures may include the number of properties which experience sewer flooding the number of properties at risk of flooding the number of properties at risk from sewerage asset failure risk indices that capture both the probability and consequence of failure customer satisfaction with regards to clean rivers and beaches the number of pollution incidents the frequency of combined sewer overflow operation and compliance with discharge permit conditions
252 Good practice example ndash Thames Water live DAP
Thames Water has initiated a DAP (drainage area plan) Live approach Itrsquos a good example of how companies are continuously monitoring and updating the status of drainage area risks It provides a lsquoliversquo snapshot of the current health of all drainage areas in Thames Waterrsquos region allowing real time planning as part of a strategic approach It enables drainage planners to view the effectiveness
205240txt012|May 2013
32
Drainage Strategy Framework
of intervention strategies and compare incident rates across varying geographies and development types in the Thames Valley
DAP Live will be available for all catchments in the Thames Water area thus enabling
bull high level monitoring of risks across the business bull a live and strategic review of catchment performance bull prioritisation of catchments based on risk and bull an ability to share data with partners collaborating in drainage planning and improvements
Figure 12 illustrates the types of data managed through the DAP Live system These include asset data political and drainage boundaries environmental data operational data property amp growth data and modelling data As new data become available the DAP Live system is updated so that drainage planners have the most current view on emerging risks and issues
Asset data
Operational data
Property and growth data
Modelling data
Environmental data
Boundaries (SDACs operational political)
Figure 12 Data types held in the DAP Live system
Figure 13 illustrates how the system can provide analysis at a variety of scales from local authority boundaries sewage treatment works catchments drainage areas or a regular grid
205240txt012|May 2013
33
Drainage Strategy Framework
NE PROVINCES
WESTERN PROVINCES
NE LONDON bull Ops areas local W LONDON
SE LONDON authorities Large TIDWORTH SE PROVINCES
bull STW Catchments
bull Drainage areas(SDACs)
bull Regular grid Small
Figure 13 DAP Live reporting performance at different scales
205240txt012|May 2013
34
Drainage Strategy Framework
253 Good practice example ndash Wessex Water Water live data
Wessex Water is regularly using data geospatially to proactively identify and respond to risk Theirs is a good example of how data can be used to provide an adaptable approach that is regularly reviewed to plan investment
The risk‐based and live approach uses a set of likelihood and consequence models which are built up from all currently available data asset data (eg CCTV data material age) operational data (eg flooding and pollutions incidents) and information (eg locality near hospital or downstream of an overflow) All these data are collated for the entire Wessex region updated regularly and analysed geospatially
Figure 14 Sewer risk scores presented in a risk matrix and geospatially
This allows a risk score (Figure 14) to be calculated for each mapped sewer length which directs investigation more efficiently by allocating each mapped sewer a planned CCTV inspection date
This risk‐based approach has been successful in targeting problematic sewers increasing identification rates threefold Density analysis is performed using asset failure and operational information which allows planning of both proactive structural and operational investment
Proactively found structural issues are far more cost effective to repair before failure and can also prevent serviceability issues
205240txt012|May 2013
35
f
DDrainage Strateegy Frameworrk
Figgure 15 Hotsppot analysis
Thhe hotspot annalysis (Figuure 15) showss where operrational clustters have beeen calculatedd This hootspot analyssis is made aavailable on tthe Wessex WWater corporrate GIS to a llow operati onal staff to target their effforts to mitiggate against ffurther repeaat incidents AAdditional innformation ffrom asset annd operationnal activities ccan be addedd regularly too the databasses which drrive the mod els enabling rissk scores to bbe kept as livve as require d
226 Prrinciple Sixx Innovativve and Susstainable SSolutions
Thhe Drainage Strategy Fraamework proomotes the fuull evaluationn of alternatiives to tradit ionally enngineered sewwerage soluttions to test wwhether thesse offer loweer whole life ccost options or better reesponses to uuncertainty It is anticipaated that draainage solutioons of the futture will be ddifferent froom the ones we are usedd to
Thhese should iinclude (at leeast at a highh level) real ttime control storm waterr retrofit techhniques edducation to eenable custommers to changge behaviou r enhancingg incentives for customerss to reduce suurface water flowing to seewers and innnovative pe rmitting arraangements a cross drainagge networks annd sewage tr eatment worrks Water annd sewerage companies sshould continnue to revieww and deevelop other innovative ssolutions
Foor example wwhere a commpany may hiistorically haave preferredd to tackle seewer floodingg or coombined sewwer overflow pollution byy increasing iits undergrouund equipmment to store mmore rainfalll duuring stormss it might connsider other options in fuuture ndash such as working wwith custommers to mmanage the raainfall close tt eventing it foorm enteringg the sewer syystem o source pre
2205240txt012|Mayy 2013
36
Drainage Strategy Framework
261 Recommended good practice
No Good practice Example references
1 Use cost‐benefit methods to demonstrate that innovative and sustainable solution types provide best value for customers and the wider community
UKWIR will publish new research and guidance in 2013 addressing active control and storm water removal demonstrating how these technologies can be justified and included within Drainage Strategies
2 Consider integrated water resource management Work with partners (especially developers and local authorities) to examine whether use of stored stormwater reduces potable water consumption AND need for capacity in sewers
CIRIA has published a scoping study for water sensitive urban design45 in the UK
3 Consider a mix of conventional and new technologies using more adaptive approaches as low‐regrets responses to uncertainty eg prevent current sewer flooding with underground tank storage but address future risks (worsened by climate change) with retrofit SuDS implemented progressively
CIRIA has published lsquoRetrofitting to manage surface waterrsquo46 a comprehensive guide to planning and delivering this type of project
4 Use carbon accounting methods to compare embodied and emitted carbon in alternative intervention strategies so that these impacts are accounted for in whole life costs
Consider the benefits of surface water removal on the costs (including carbon) of pumping and sewage treatment
UKWIR47 has and continues to publish detailed guidance on carbon accounting for water and sewerage company use
45httpwwwciriaorgserviceresearch_informationAMContentManagerNet ContentDisplayaspxSection=research_informationampContentID=23581 46httpwwwciriaorgSERVICEHomecoreordersproductaspxcatid=5ampprodid=1909 47httpukwirforefront‐librarycomreports08‐cl‐01‐6923419000190269902659465890269
205240txt012|May 2013
37
Drainage Strategy Framework
No Good practice Example references
5 Where interventions include the provision of green space public amenity and improved habitats then Payment for Ecosystem Services approaches can be used to claim further monetised benefits in the appraisal Customers should be consulted to help value these benefits
The Environment Agency will publish data in 2013 on costs and benefits of retrofit stormwater projects to promote understanding and uptake
6 Share data within the industry on innovative solutions to increase knowledge of new technology and SuDs approaches
EA retrofitting SuDs costs and benefits database48
accommodating data from Ofwat AMP5 SuDS pilot initiative and other examples
262 Good practice example ndash Welsh Water surface water reduction and removal strategy for Gowerton and Llanelli
Dŵr Cymru Welsh Water and partners are applying innovative storm water removal methods to address capacity problems in the sewer network in Gowerton and Llanelli49 (population 140000) Current under capacity leads to localised sewer flooding and excessive combined sewer overflow (CSO) spill to the Burry Inlet a protected shellfish water and special area of conservation The capacity problems in the system were a concern for the Environment Agency (Wales) and there was a risk of widespread restrictions to economic development being imposed Dŵr Cymru Welsh Water Carmarthenshire County Council City and County of Swansea Consumer Council for Water Environment Agency Wales and the Welsh Government all worked in partnership to resolve the situation
A brand new hydraulic model was built for the entire sewerage network with particular attention paid to accurately representing the sources of storm run‐off and infiltration The model was verified against data from flow monitors and observed CSO spill frequencies into the Burry Inlet
To begin with a traditional sewer storage solution was proposed that would result in an average 10 spills a year into the shellfish water from all 90 CSOs in the two catchments Although this reduced spills and dealt with some of the flooding and growth issues the storage requirements would have been unaffordable provide no protection against long term climate change and would not tackle the fundamental problem of too much surface water getting into the combined network
An alternative approach based on the reduction and removal of storm water from the combined sewer system was also developed This was in accordance with Dŵr Cymru Welsh Waterrsquos Rainscape50 (surface water elimination and reduction) strategy To identify areas with the most
48httpevidenceenvironment‐agencygovukfcermenDefaultHomeAndLeisureFloodsWhatWereDoingIntoTheFutureScience ProgrammeResearchAndDevelopmentFCRMProjectaspxProjectID=15515be8‐bbed‐4204‐ae56‐3e810ba47694ampPageID=56bad68e‐dcb1‐4bf8‐84cc‐cbfd03ab63a2 49 httpwwwciwemorgmedia674511Paper20820Stephen20Ollierpdf 50httpwwwdwrcymrucom_libraryleaflets_publications_english
205240txt012|May 2013
38
Drainage Strategy Framework
potential for effective storm water removal a flowareaflooding thematic map was developed This was used to focus attention on areas which would deliver the most benefit if storm water removal was carried out These areas are coloured red in Figure 16
Figure 16 Thematic map showing areas of maximum potential for storm water removal
The following interventions (181 in total) were combined into single strategy to be delivered in phases by 2015 2020 and afterwards
bull The management of surface water through swales basins and soakaways rather than through combined sewers resulting in new amenity and ecological areas within the built‐up environment
bull Implementing smarter flow control to better use existing storage and conveyance assets bull Relining of sewers to prevent groundwater ingress bull Removal of land drainage connections to sewers bull Household rainwater harvesting retrofit schemes
surface_water_management_strategypdf
205240txt012|May 2013
39
Drainage Strategy Framework
Figure 17 is an artistrsquos impression of what one of the sustainable urban drainage system solutions may look like
Figure 17 Example retrofit SuDS solution proposed for Gowerton and Llanelli
Modelling has demonstrated that the alternative strategy will achieve the same CSO reduction benefit as the storage strategy together with flooding improvements and additional less tangible benefits at significantly lower cost than the traditional sewer storage solution
Figure 18 illustrates the dispersed nature of solutions identified for central Llanelli
Figure 18 Water sensitive urban design interventions planned for central Llanelli
205240txt012|May 2013
40
Drainage Strategy Framework
Appendix A
Glossary
205240txt012|May 2013
Drainage Strategy Framework
Appendix A Glossary
CAPEX Capital expenditure Appointed water and sewerage companiesrsquo spending on new replacement or refurbished capital assets such as construction or buying machinery
CIWEM Urban Drainage Group (WaPUG) A group of the Chartered Institution of Water and Environmental Management supporting professionals working in urban drainage
Combined Sewer Overflow (CSO) The discharge of untreated sewage diluted with storm water into rivers and the sea CSOs occur during heavy rain and are necessary to reduce the risk of sewer flooding The physical overflow structure is also called a CSO
Common Framework for Capital A planning approach developed for the water and Maintenance Planning sewerage companies in 2002 which provides a robust basis
for assessing future capital maintenance needs The approach is consistent with the needs of Ofwat
Defra The Department for Environment Food and Rural Affairs The Government Department with responsibility for water flooding and water quality in England
Drainage Area Plan (DAP) A detailed plan for a drainage catchment that prioritises a list of interventions based on risk using an approach established in the WRc Sewerage Rehabilitation Manual This approach has been succeeded by Sewerage Risk Management which guides the preparation of Sewerage Management Plans (SMP) Companies vary in how they prepare DAPs or SMPs (or their equivalents) following the general principles that have been established
Drainage Strategy Developed by water and sewerage companies to demonstrate how outcomes will be delivered in drainage catchments over the long term Drainage Strategies will use the information developed in producing a DAPSMP and if a drainage strategy has been produced this should be the starting point in producing a more detailed DAPSMP should this be required It is likely that the activities required to prepare DAPSMP and Drainage Strategies may overlap Drainage Strategies might not refer to specific interventions but instead outline a general approach
Drainage Strategy Framework Guidance to describe the contents and intention of Drainage Strategies
205240txt012|May 2013
Drainage Strategy Framework
Flood Risk Management Plans Required by the Flood Risk Regulations in Flood Risk Areas by December 2015
Flood Risk Regulations The legislative instrument used to implement the requirements of the Floods Directive in England and Wales
Floods Directive DIRECTIVE 200760EC of the European Parliament and of the Council of 23 October 2007 on the assessment and management of flood risks
Lead Local Flood Authority (LLFA) The Shire County or unitary authority with responsibility for managing local flood risk
Local development plans Developed by planning authorities to explain where and what type of development (new homes and businesses) will occur within their area They are required to explain water infrastructure needs to support this development
Local Flood Risk Management Strategy Developed by the Lead Local Flood Authority to explain (LFRMS) how local flood risk will be managed by the Authority and
in partnership with others
Natural Resources Wales From 1 April 2013 Natural Resources Wales (NRW) a new body formed by the Welsh Government will take over the functions previously carried out by the Environment Agency (EA) in Wales alongside those of the Forestry Commission Wales and the Countryside Council for Wales
Ofwat The Water Services Regulation Authority ndash the economic regulator of the water and sewerage companies of England and Wales
OPEX Operating expenditure Appointed water and sewerage companiesrsquo day‐to‐day spending on running the services for example staff costs and power This is likely to include investment in joint projects that do not create or relate to an asset that the company solely or jointly owns
Outcomes Outcomes are the higher level objectives that a companyrsquos actions are intended to deliver A companyrsquos outcome should reflect its customersrsquo priorities identified through appropriate customer engagement and deliver the best long‐term sustainable solution for customers and the environment An outcome may not be bound by a single price control period and should be set in the context of customersrsquo and the environmentrsquos long‐term needs
205240txt012|May 2013
Drainage Strategy Framework
Price Review The process of setting appointed water and sewerage companiesrsquo price limits The next price review will take place in 2014 for the period 2015‐20 Ofwat currently sets price limits every five years
Real Time Control (RTC) Using actuated pumps gates and weirs to actively control flow in sewers Better use can be made of existing infrastructure and links can be made between network treatment and receiving water systems for operational benefits Sometimes referred to as Active Management
River Basin Management (Plans) River Basin Management is a continuous process of planning (to develop River Basin Management Plans) and delivery The Water Framework Directive introduces a formal series of 6 year cycles The first cycle will end in 2015 when following further planning and consultation the River Basin Management Plans will be updated and reissued
Sewerage Management Plan A risk based approach to indentifying investment needs in sewerage systems as described in the Sewerage Risk Management (SRM) approach developed by WRc plc
Storm water retrofit Releasing capacity in sewers by controlling stormwater at the surface using disconnection swales and other sustainable drainage systems (SuDS)
205240txt012|May 2013
We are the Environment Agency We protect and improve the environment and make it a better place for people and wildlife We operate at the place where environmental change has its greatest impact on peoplersquos lives We reduce the risks to people and properties from flooding make sure there is enough water for people and wildlife protect and improve air land and water quality and apply the environmental standards within which industry can operate Acting to reduce climate change and helping people and wildlife adapt to its consequences are at the heart of all that we do We cannot do this alone We work closely with a wide range of partners including government business local authorities other agencies civil society groups and the communities we serve
wwwenvironment‐agencygovuk
Environment Agency National Customer Contact Centre
Telephone 03708 506 506 enquiriesenvironment‐agencygovuk
Ofwat (The Water Services Regulation Authority) is a non‐ministerial government department We are responsible for making sure that the water and sewerage sectors in England and Wales provide consumers with a good quality and efficient service at a fair price
wwwofwatgovuk
Telephone 0121 644 7500 mailboxofwatgsigovuk
Halcrow Group Limited Burderop Park Swindon Wiltshire SN4 0QD
tel 01793 812479 fax 01793 812089 halcrowcom
Halcrow Group Limited is a CH2M HILL company Halcrow Group Limited has prepared this report in accordance with
the instructions of The Environment Agency for the clientrsquos sole and specific use Any other persons who use any information contained herein do so at their own risk

Drainage Strategy Framework
bull In Camborne South West Water has taken the opportunity to invest in sewer separation works which align with the aims of the Camborne Pool Redruth urban regeneration group supported by Cornwall Council and to promote sustainable development economic growth and a strategic aim of lsquosewers for sewagersquo
213 Good practice example ndash Northumbrian Water partnership working in Tyneside
Northumbrian Water has led a sustainable sewerage study for Tyneside34 between 2010 and 2012 It is a good example of how partner organisations can collaborate to understand and resolve drainage issues in their urban area
Its approach was informed by the fact that a shared urban drainage problem around flooding and pollution was best addressed by a shared response from all the relevant organisations The project steering group involved representatives of Northumbrian Water the Consumer Council for Water the Environment Agency and five Lead Local Flood Authorities The urban drainage system collects wastewater for a single wastewater treatment works serving a population of over 900000
Working together the group studied the impact of growth urban creep and climate change on future urban drainage issues Figure 5 illustrates how a city‐wide map of potential problem areas was generated by the project team sharing data on sewer capacity (from Northumbrian Water) population change (from the local authorities) and river flooding (the Environment Agency) It was predicted that future problems were more likely to occur in the darker shaded areas These became focus areas for the project where a range of traditional and novel drainage solutions were tested
Figure 5 Future drainage problem areas indentified through data sharing
34httpcommunicatoremailcomINfNLOjNRayfOA1rfrfYcdK‐S7UwRcYcNoWebViewaspx
205240txt012|May 2013
17
22
Drainage Strategy Framework
The project team was keen to promote its work to customers and the community and prepared a series of newsletters updating interested parties on progress and issues An example is illustrated in Figure 6
C lic k here if y ou are hav in g d if f ic u lties v iew ing th is new s letter
Ho m e A b o u t u s M e d ia ce n tre C o n tact
Issue 2
Ap ril 2012
In th is ed ition U n d e rs tan d in g th e fu tu re
S u s tain ab le d ra ina g e o p tio ns
F ind ou t more about Th e 2 0 1 1 an n ua l re po rt
Ou r e n viro n m e n ta l p o licy
Ou r co rp o ra te re sp o nsib il i ty s tra te g y
W e lcom e to th e s e con d e ditio n o f S u sta inab le se we ra g e a s ix-m on th ly n e ws le tte r p ro d u ce d to b ring yo u th e la te s t n e ws on o u r m a jo r s tud ye xp lo rin g s us tain ab le s ew e ra ge o p tions in th e Tyn e s id e a rea I h o p e yo u fin d th e in fo rm a tio n o f in te res t a n d wo u ld w e lcom e fe e db a ck o n an y o f th e issu es ra ise d
Ric ha rd W a rne ford W a s te wa te r Dire c tor
U nderstand ing the fu tu re W e a ll kn o w th e difficu lties o f a ccu ra tely p re d ic tin g th e fu tu re h ow e ve r ifw e a re to p re pa re fo r i t th e n it is s om e thin g we m us t a tte m p t As p a rt o f th is s tu d y w e a re co ns id e rin g w ha t d em a nds w ill b e p la ce d on th e d ra ina g e s ys tem s a t 2 0 20 a n d a t 2 0 50 in co rpo ra ting g ro w th u rba n cre e p a nd c lim a te cha n ge B y w o rk in g close ly w ith o u r p a rtn e rs an d u s in g th e la tes t te ch n ical res e a rch we h a ve d e ve lo p ed a n d com p u te rm od e lle d a num b e r o f s ce na rios to id en tify a n d d e fin e fu tu re ris ks Th es e ris ks in c lud e p red ic tions o f p o te n tia l floo d in g p o llu tion o r b a rrie rs to g ro w th N o w th a t w e be tte r u n d e rs ta nd th e iss u es we a re a ble to p re pa re p la ns p rom o ting o p po rtu n ities fo r s us ta in a ble d rain ag e s ys tem s in o rde r to d e live r th e b es t p oss ible s e rvice fo r o u r cu s tom e rs b a la n ced a g ains te n viro nm e n tal n e eds a n d cos ts
S usta inab le d ra inage op tions W e b e lie ve o u r a pp ro a ch re p res en ts go o d p ra ctice fo r th e m a n ag em en t o f s u rfa ce wa te r w h ich is to d ea l w ith th e s u rfa ce wa te r as c los e to s ou rce as p oss ib le A w id e ra n g e o f p o te n tial o p po rtu n ities a re b ein g id e n tifie d in c lu d in g lo ca l a n d s tra te gic o p tions
S tra te g ic o p tions a re typ ica lly la rg e r th a n th e lo ca l on es a nd in c lu d e fe a tu res s u ch as a re as o f la nd w h ich w o uld b e a llo we d to flo o d d u rin g he a vy ra in (s a crific ial s to ra g e ) a n d p e rm a n en t w e tla nd fe a tu res
L o ca l op tio ns d esp ite b ein g sm a lle r th a n th e s tra te gic o n es w ill s til l p la y a ke y ro le in th e p ro vis io n o f s us tain ab le d ra ina g e Th e ir n a tu re m e a ns de p lo ym e n t co u ld be m o re w id es p re a d th a n s tra te gic o p tions fe a tu res su ch as w a te r b u tts ra in g a rde ns a nd p e rm e ab le pa vin g co u ld b e re la tive ly e a s y to fi t in to
Figure 6 Newsletter promoting urban drainage partnership working
Principle Two Uncertainty
Strategies should explain the reliability of data and knowledge about current and future performance of drainage systems They should explain what steps are planned to improve this understanding and how this will benefit customers Where future performance is uncertain (eg because of sensitivity to climate change) they should explain how adaptive approaches will be used to ensure outcomes are met The uncertainty in predictions of future risks should be recognised and accommodated within decision making
205240txt012|May 2013
18
Drainage Strategy Framework
221 Recommended good practice
No Good practice Example references
1 Data analysed and used in the development of the strategy related to asset location dimensions condition failure and flood and pollution incidents should be assigned a confidence grading The confidence grading should be related to its accuracy completeness compatibility credibility and currency
Models used to predict blockages and collapses flooding locations polluting discharges and water quality impacts should be assigned a confidence grading based on their accuracy completeness compatibility credibility and currency
Model predictions should be assigned a confidence grading depending on the confidence in the model and whether it is being applied outside of its verification range (eg for extreme events or for atypical geographies)
The purpose of confidence grading data and model results used in strategy setting is to understand the likelihood that outcomes will be achieved in a cost efficient manner Where the outcomes remain uncertain knowledge of data confidence can be used to target improvement programmes
SRM5 (S3‐03‐17) refers to Ofwatrsquos method for recording the reliability and accuracy of regulatory data in bands A to D
The SWMP guidance (Section 319) describes an alternative system of grading data and model results
2 Use the Drainage Strategy to justify data and model improvement programmes This should be focussed on areas where risks are currently (or predicted to be) high and uncertainty in data or models reduces the ability to determine robust operational or capital solutions Poor model verification in high risk areas would be an indicator that model improvements were required
CIWEMrsquos urban drainage group has published a series of guides on hydraulic and water quality modelling They discuss model calibration verification and uses
SRM5 (S3‐04) describes how to determine where the current assessment of risk is sufficient to proceed or whether data and models should be improved
3 Improve understanding of network performance (and improve models) by using long term flow and level monitoring on sewers and CSOs
Yorkshire Water discusses its CSO
monitoring programme here
4 Demonstrate how the uncertainty in both the underlying datamodels and in the future projections is addressed in options appraisal Consider if this should be done implicitly (eg through choosing conservative assumptions) or explicitly through the use of sensitivity analysis or scenario testing
Treasury Green Book supplementary guidance illustrates how to accommodate climate change uncertainties
205240txt012|May 2013
19
Drainage Strategy Framework
No Good practice Example references
5 Population growth new homes and businesses climate change and urban creep combine to make the future highly uncertain but will almost certainly increase flooding and pollution risks from drainage systems Use the Drainage Strategy to explore different scenarios (combining the impact of these drivers) for a near term (le 10 years) and future (ge 30 years) epoch
For example combine modest growth and slight climate change (a low impact case) and contrast with high growth and significant climate change (a high impact case) Where the location of significant new development is unknown include scenarios accommodating different possibilities
Running multiple scenarios is time consuming and costly A risk based approach should be adopted to focus efforts where flooding and pollution risks are especially sensitive to changes in demand
UKWIR has published research on accounting for climate change35 and urban creep36 in sewerage planning together with more general advice on accommodating climate change in water asset management planning37
Ofwat has published research38
predicting the combined impacts of climate change urban creep and development on a national basis
6 In the face of significant uncertainties about future demands on the drainage system and their consequences the Drainage Strategy should identify low‐regrets interventions (ie ones that are robust no matter what the future holds) and ensure that solutions can be adapted if greater certainty is achieved For example through quickening the pace of SuDS retrofit activities or using (previously identified and secured) land to extend underground storage facilities Strategies which remove surface water from sewerage networks provide lsquoheadroomrsquo for unpredictable increases in demand from population and climate change
Designing Resilient Cities A guide to good practice DR Lomardi et al HIS BRE Press
7 Post project appraisal and cost monitoring should be used to capture real costs and performance so that Strategies can be updated and improved with latest information It is especially important to collate and understand the whole life costs of new technologies where industry understanding is currently poor
35httpwwwukwirorgreports03‐cl‐10‐09042794658901799019890198 (poundpound) 36httpukwirforefront‐librarycomreports10‐wm‐07‐1493273 (poundpound) 37httpukwirforefront‐librarycomreports12‐cl‐01‐1694816900019015590145901409465890155 (poundpound) 38httpwwwofwatgovuksustainabilityclimatechangerpt_com201106mottmacsewerpdf
205240txt012|May 2013
20
Drainage Strategy Framework
222 Good practice example ndash Severn Trent Waterrsquos MICAS
Severn Trent Water has developed a process to measure confidence in hydraulic models of sewer systems Modelling Investment Confidence Assessment Scoring (MICAS) was developed to provide an objective evaluation of model confidence It uses information stored in the hydraulic model about the provenance of each data element and the quality of model verification Before the approach was developed the assessment of lsquofitness for purposersquo of models was subjective and based on modellers judgment This was not always reliable and certainly not repeatable and transparent MICAS provides an objective assessment of hydraulic model quality which can be used to inform its use and prioritise improvements to input data and model verification
Figure 7 and Figure 8 illustrate how an understanding of model confidence from the MICAS assessment (right hand side images) can be used to interpret predictions of flooding (left hand side images) In Figure 7 areas at predicted high risk of flooding (red in the left hand side image) are shown to be in high confidence areas of the hydraulic model (green in the right hand side image) In contrast in Figure 8 areas at predicted high risk of flooding (red in the left hand side image) are shown to be in poor confidence areas of the hydraulic models (orange in the right hand side image) In the latter case this information is used to identify where further model improvements would be beneficial
Flood Risk MICAS
Figure 7 Modelled flood risk and MICAS confidence scores (high model confidence)
Flood Risk MICAS
Figure 8 Modelled flood risk and MICAS confidence scores (lower model confidence)
205240txt012|May 2013
21
23
Drainage Strategy Framework
Principle Three Risk Based
Strategies should be risk based This means that planning operational and investment activities should be based on consideration of the probability and consequence of inadequate drainage function (risks) as these relate to the achievement of measures that demonstrate delivery of outcomes A risk based Strategy ensures that investment is made where risks are the greatest
To aid communication risks should be visualised through maps and plans (Figure 10 is an example) To aid risk assessment risks should be monetised combined and predicted into the future To aid options appraisal the impact of interventions on the level of risk should be predicted
The approach to Drainage Strategy development should be risk based itself The degree of detail included should be related to an understanding of the overall level of risks in the catchment now and in the future
231 Recommended good practice
No Good practice Example references
1 Determine where a Drainage Strategy is required by combining current performance with external influences likely to result in deteriorating performance This stage requires no modelling or detailed assessment On a catchment‐by‐catchment (drainage area) basis understand current risks by collating data on current performance eg blockages collapses pumping station failures pollution incidents CSO spills storm tank spills internal flooding incidents external flooding incidents and infiltration rates Relate these risks to performance indicators and the achievement of outcomes Combine with information about known growth rates predictions of urban creep quantity of newly adopted lsquoprivatersquo sewers surface water flooding risks (eg from flood map for surface water) WFD water body status and bathing water status Prioritise catchments with high current risks andor factors suggesting that risks are likely to worsen significantly in the future Consider normalising scoring method for size of catchment (eg by unit area or unit length of sewer) Consult with stakeholders to confirm correct prioritisation Commence with development of Drainage Strategies for the highest ranked catchments Periodically revisit prioritisation (updating with new data) to check that priorities are still correct
The initialisation stage of a Sewer Management Plan (SMP) (described in SRM5) considers how a risk assessment can be used to prioritise which spatial units (eg catchments) should be prioritised for a SMP study
2 Visualise catchment risks (from 1) to illustrate and explain to partners the reasons for prioritisation Accommodate their views amp consider changing prioritisation to aid wider drainage planning requirements (eg increase prioritisation of a catchment with significant surface water flooding problems where close collaboration between water and sewerage company and LLFA will benefit the community)
205240txt012|May 2013
22
Drainage Strategy Framework
No Good practice Example references
3 Clearly relate sewerage risks to the performance indicators that will be used to measure progress towards achieving outcomes eg relate blockage rates to flooding and pollution incidents eg relate increase in flows to increased CSO frequency breaches of permit conditions and deterioration in receiving water quality Adopt a sourcendashpathway‐receptor model and workshop techniques to ensure that cause effect and consequences are fully captured Use performance indicators as the basis for a comprehensive risk assessment that considers likelihood (frequency) and consequence (extent degree and duration of impact) of failure expressed as risk scores Monetise risks in GBP (pound) to align with principle four (whole life costs amp benefits) Use (verified) predictive models to understand near term (lt10 years) and long term (gt30 years) risks The latter to align with principle four (whole life costs amp benefits) Align complexity of method with level of risk recognising the needs of partners eg use complex 2D flood routing models to ascertain (with greater certainty) flood mechanisms and damages where the quantity and frequency of flooding is high and interventions will be complex and costly Elsewhere more simple approaches are appropriate eg use complex UPM3 water quality modelling methods where compliance with river standards or discharge consents is already failing or is expected to do so Elsewhere more simple approaches are appropriate Combine risk scores from different risks to describe the total level of risk in a catchment Use visualisation techniques to communicate combined level of risk Combine analysis from hydraulic blockage and asset deterioration models on a catchment basis In hydraulic analysis consider flooding performance for rainfall events beyond the usually provided standard of protection to understand performance in extreme events in support of partners (especially LLFAs) and in search of cost beneficial interventions at a higher standard than normal
SRM 5 (S3‐03) details approaches to simple and more complex approaches to risk assessment that are consistent with CMPCF guidelines
4 Be alert to interactions between sewer networks and wastewater treatment plans eg by modelling the impact of changing sewer flows on wastewater treatment worksrsquo performance and costs Consider combined impact of different catchments on a single or linked water body (eg an inland river bathing water or shell fishery)
UPM3 guidance discusses approaches to understanding these interactions and applying more complex water quality impact models
5 Establish systems and apply methods to predict how interventions can reduce risks eg how a targeted and pro‐active maintenance can reduce the occurrence of sewer blockage and flooding from lsquoother causesrsquo eg how reducing infiltration can reduce CSO spills eg how reducing connected impermeable area can reduce sewer flooding
205240txt012|May 2013
23
Drainage Strategy Framework
232 Good practice example ndash United Utilities risk assessment
United Utilities has demonstrated a robust risk based approach in the development of sewerage management plans used for long term planning across their area of operations
Hydraulic models were applied in 235 catchments and configured to look at future performance and to evaluate the consequences of inadequate capacity Starting from a baseline of 2010 versions of the models were built for 2020 and 2036 epochs The following model input parameters were adjusted population water consumption infiltration planned development known sewerage improvement projects urban creep rainfall (for climate change)
Two‐dimensional (2D) modelling was used to consider the consequences of sewer flooding resulting from the changes made to reflect the future operating environments As well as the impact on homes and business (from internal and external flooding) the flood risk to critical infrastructure was also considered The operation of CSOs was considered by computing the annual spill volume duration and frequency
Finally predictions of the likelihood and consequence of sewer failure were added taking account of sewer material age and the incident records relating to similar assets
All these data were combined and weighted to generate a Sewer Management Plan (SMP) Risk Score for each length of sewer The process is illustrated in Figure 9
Figure 9 United Utilitiesrsquo process for calculating risk score in sewerage catchments
205240txt012|May 2013
24
Drainage Strategy Framework
Risk scores were summed spatially and monetised so that high priority locations could be identified Mapping and visualisation were used to communicate the results of this assessment priority areas for further investigation and how risks change through time (Figure 10)
Figure 10 Visualisation of sewerage risks
233 Good practice example ndash Northumbrian Water risk assessment
Northumbrian Water completes an annual assessment of hydraulic capacity in its sewerage network at the drainage area scale Its approach does not require hydraulic models to have been completed and yet can reliably highlight areas of under‐capacity in need of further investigation through more detailed analysis including hydraulic modelling New and emerging risk areas can also be identified by applying data for population growth which occurs through development lsquoWhat ifrsquo scenarios can be run to test when capacity limits may be overcome and flood risks potentially set to increase It demonstrates good lsquorisk basedrsquo planning principles because it shows the drainage planner where more detailed analysis is warranted
The approach uses the following data from company records population connected to sewer P water consumption rate G (lhd) trade discharge E (ls) pipe diameter and gradient pipe connectivity CSO consent pass forward rate (ls) pumping station rate (ls) sewage treatment flow rate (ls) A wastewater dry weather capacity map calculates pipe full capacity dry weather flow (PG+E+I) and Formula A flow for fully combined (1360P+2E+DWF) and separate (4PG+3I+E) areas of the network Infiltration (I) is assumed to be 50 PG +E
205240txt012|May 2013
25
Drainage Strategy Framework
A theoretical assessment of network capacity is then calculated by comparing Formula A with pipe full capacity flow consent values at CSOs and wastewater treatment works and pumping rates This determines areas of the network with a capacity shortfall with a potential capacity shortfall and with no capacity shortfall
When run across the whole company area approximately 100 out of 500 drainage areas were found to be under capacity Over 60 of these areas had recorded sewer flooding incidents In over 300 drainage areas there was no forecast capacity shortfall Only 7 of these drainage areas had recorded sewer flooding incidents Overall the system proved to be very reliable at predicting drainage areas likely to have sewer flooding problems because of sewer under‐capacity
In under capacity drainage areas an intermediate (hydraulic model based) assessment is then carried out Figure 11 shows the results thematically mapped for an example drainage area Red areas are predicted to have a very high risk of sewer flooding Yellow and green areas are predicted to have a low risk of sewer flooding
Figure 11 Example of a drainage area capacity map
205240txt012|May 2013
26
24
Drainage Strategy Framework
Principle Four Whole Life Costs and Benefits
Strategies should be informed by consideration of whole life costs and benefits They should promote a series of interventions which in view of the quantified uncertainties are most likely to result in performance indicators which demonstrate the achievement of outcomes at lowest cost to customers and the community more widely
Costs relate to capital and operational expenditure to deliver interventions and the monetised impacts of drainage failures such as flooding and pollution
Benefits relate to the reduction in risks from drainage failures such as flooding and pollution but should also include wider societal impacts such as those calculated using a lsquoPayments for Ecosystems Servicesrsquo approach
When considering the lsquowhole lifersquo the strategy should consider climate population and asset deterioration trends These are likely to increase risks over the long term if no interventions are made The strategy should state lsquowhatrsquo should be done but also broadly lsquowhenrsquo and in what sequence interventions should happen
241 Recommended good practice
No Good practice Example references
1 Predict risks into the future for at least two epochs le10 years (to understand what the company needs to do now and how this fits with longer term outcomes) and ge30 years to understand long term needs in light of changing population and other pressures
Account for the following changes in demand
bull Growth ‐ new homes and businesses
bull Urban creep ndash uncontrolled addition of connected impermeable area
bull Climate change ndash affecting design events (flood predictions) time‐series (CSO and treated effluent quantities) river flows and temperatures
bull Infiltrationexfiltration ndash through deteriorating sewer condition
bull Dry weather flows ndash through changes in water consumption rates
2 Combining monetised risks (associated with sewerage failures) determine whole life costs for a lsquodo nothingrsquo scenario (ie no interventions)
Include costs associated with electricity consumption (in the network and at the wastewater treatment works) and CO2 emissions
UKWIR will publish in 2014 a revision to their Long Term Least Cost Planning for Wastewater Supply‐Demand
guidance This may provide tools and methods for expressing costs and benefits to support the development of a Drainage Strategy
205240txt012|May 2013
27
Drainage Strategy Framework
No Good practice Example references
3 Test intervention strategies which keep performance indicators on track to deliver outcomes by adding capacity (supply) reducing flows (demand) or altering operational regimes
Include the costs of interventions and the benefits of reduced risks to inform selection of the most cost beneficial strategy over the whole life
Have regard to the timing of interventions recognising that uncertainty may require low‐regrets (insensitive to uncertainty) solutions and that delaying major interventions may be more affordable and attractive in the short term Discounting should be used to compare the costs and benefits of interventions occurring at different times
Recognise that some interventions will be obligatory and defined (eg maintenance of a spill frequency standard at a CSO) whilst others will be more discretionary focused on achieving outcomes rather than specific outputs
SRM5 (Section 8) defines and contrasts cost benefit analysis cost effectiveness analysis whole life cost analysis and risk cost benefit analysis
HM Treasury Green Book39
sets out a framework for the appraisal of long term projects which can be applied to the development of a Drainage Strategy
4 Donrsquot at first be concerned with the distribution of costs and benefits between partners who may be sharing costs Identify the most cost beneficial solution first and then debate and agree an equitable sharing of costs
Give equal weighting to OPEX (operating expenditure) and CAPEX (capital expenditure) costs so not to cause bias towards capital intensive solutions Properly consider the costs and benefits of pro‐active maintenance regimes and campaigns to influence customers to reduce fats oils and greases (FOG) build‐ups and the misuse of sewers
Consider the affordability of solutions the impact on customersrsquo bills and the resources of other organisations to play their part
UKWIR research outputs40 in 2013 (SW01) will provide a framework for making a business case for separating storm water from combined sewers
5 Where interventions include the provision of green space public amenity and improved habitats then Payment for Ecosystem Services approaches should be used to identify further monetised benefits in the appraisal Customers should be consulted to help value these benefits
Supplementary Green Book41
guidance describes methods for accounting for environmental impacts including the ecosystems approach
39 httpwwwhm‐treasurygovukdata_greenbook_indexhtm 40 httpwwwukwirorgpublishorsystemcomponent_viewaspLogDocId=96116 41 httpwwwhm‐treasurygovukdaccounting_environmental_impactspdf
205240txt012|May 2013
28
Drainage Strategy Framework
242 Good practice example ndash Severn Trent Water making the case for surface water separation in Stoke-on-Trent
In this example42 Severn Trent Water compared alternative ways of addressing sewer flooding problems by looking at a range of costs and benefits not all of which were directly associated with its specific responsibilities as a water and sewerage company Whilst the example does not express a monetised value for all costs and benefits over the whole life it does illustrate the types of factors which could be included in an appraisal of this type scaled to address problems at a catchment level It also demonstrates how working collaboratively can help identify solutions which are cost‐beneficial for the community at large
In an area of Stoke served by a combined sewer system five properties were at risk from sewer flooding in cellars for events equal to and less frequent than the 1 in 10 year probability A conventional sewer pumping station based solution was presented as the standard option
However a nearby former hospital site was also undergoing re‐development which would result in reduced runoff to the combined sewer The new drainage regime in the redevelopment site was sufficient to remove the flood risk at the five properties (this was a do nothing strategy)
A third option completely separated the development site runoff from the combined sewer and also addressed local flood risk issues nearby The solution required a new storm sewer and a network of swales and other SuDS features connecting with an ordinary watercourse
Table 1 illustrates how costs and benefits were compared across the three alternative strategies Each provided the same benefit in terms of the number of homes (5) relieved from sewer flooding The novel SuDS and surface water management solution additionally gave local flood risk relief to 3 further properties The separationSuDS strategy came at a higher capital cost but delivered greater social cost benefits savings in annual operating costs and a bonus improvement water quality (because of reduced CSO spill volume) Severn Trent selected the separation SuDS solution because the higher capital costs were offset by other benefits
Table 1 Costs and benefits of drainage improvements in part of Stoke-on-Trent
Do nothing Standard option
SuDS
Sewer flooding benefits 5 5 5
Other flooding benefits 0 0 3
Change in runoff to combined sewer (m3year) 0 0 ‐40000
Estimated cost (pound) 0 168000 419000
42httpwwwciwemorgmedia695460Paper203_Creating20Sewer20Capacity_Presentation2 0by20Mike20Woodpdf
205240txt012|May 2013
29
Drainage Strategy Framework
Do nothing Standard option
SuDS
Social Cost Benefit (pound) 16000 5000 51000
Change in electricity costs (poundyear) 0 +75 ‐525
Programme impact (years to deliver solution) + 4 0 +4
CSO spill volume (m3 in 1year event) +298 0 ‐397
243 Good practice example ndash New York City comparison of grey and green infrastructure drainage strategies
This example is taken from New York in the United States of America Itrsquos an illustration of how whole life costs have been compared for alternative strategies to solve urban drainage issues on a mega‐city scale The key data are summarised in Table 2
Table 2 Comparing drainage strategies in New York
Grey Strategy
Green Strategy
CSO spill volume reduction (billion gallons year)
101 122
Wider benefits over 20 years ($ million) 0 139 to 418
Whole life costs over 20 years ($ billion) 68 53
The information is taken from the New York City Green Infrastructure Plan43 produced by the Mayorrsquos Office in 2010 The Plan (and recent updates) provides a comprehensive evidence base around costs and benefits of different approaches to address the cityrsquos drainage problems It is therefore an excellent example of how drainage strategies can be described in plain language for a non‐specialist audience concerned with their environment and the cost of providing infrastructure to enhance it
It is becoming commonplace for North American cities (eg Portland and Philadelphia) to address the issue of frequent combined sewer overflow (CSO) operation by using a combination of grey infrastructure (sewers) and green infrastructure (sustainable drainage systems) The wider health
43 httpwwwnycgovhtmldephtmlstormwaternyc_green_infrastructure_planshtml
205240txt012|May 2013
30
25
Drainage Strategy Framework
and ecological benefits of green infrastructure approaches and the reduced reliance on materials and energy are attractive to utility planners and cities alike
New York has 422 CSOs and an agreed Long Term Control Strategy to significantly reduce the impact wet weather discharges have on aquatic systems throughout the city Annual discharges are currently (2010) estimated to be 30 billion gallons (114 million cubic meters) per year Building on existing and committed new sewer plans an agreed grey infrastructure based strategy to this problem is set to reduce these discharges to 198 billion gallons per year (a 34 reduction) by the 2030s An alternative green infrastructure approach based around intercepting the first inch (25mm) of rainfall across 10 of the impermeable city area by 2030 is predicted to reduce CSO spills to 179 billion gallons per year
Planners have calculated that the whole life costs after 20 years of the grey infrastructure solution will be $68 billion (2010 prices) compared to the green infrastructure whole life costs of $53 billion The green infrastructure strategy reduces CSO spills by more than the grey alternative for $15 billion less in terms of whole life cost Further planners have calculated that New Yorkers will benefit by up to $41844 million (accumulated over 20 years) in additional benefits associated with lower energy bills from control of urban heating increased property values and improved health
Based on this analysis New York City has committed itself to an aggressive green infrastructure based runoff control strategy to provide long term reductions in CSO spills The plan is to achieve interception of 15 of impermeable area by 2015 4 by 2020 7 by 2025 and 10 by 2030
Principle Five Live Process
The Strategy should be adaptable and periodically reviewed Whilst outcomes are expected to be relatively stable over time the pace at which the Strategy delivers outcomes will be linked to volatile influences (like climate and population change) and to the decisions made at each price review about the priorities for the following period The Strategy should be reviewed at regular intervals to reflect investments already made the changing priorities of the water and sewerage company and partners and the presence of emerging risks The review is also an opportunity to report drainage catchment performance relative to performance measures designed to monitor progress towards achieving outcomes
44 Estimated using methods from the New York Municipal Forest Resource Analysis (MFRA) prepared by the US Dept of Agriculture
205240txt012|May 2013
31
Drainage Strategy Framework
251 Recommended good practice
No Good practice Example references
1 Regularly repeat screening exercise to determine catchments requiring a Drainage Strategy and modify programme of Strategy development accordingly
Check for changes in measured rates of flooding and pollution incidents blockages collapses pumping station failures etc
Check for changes in extent and location of new development
Check for activities being undertaken by partners (eg redevelopment urban realm improvements and flooding and pollution management activities)
SRM5 illustrates how improved and updated knowledge of system performance should be applied to establish Strategies
2 In lsquolive Strategiesrsquo repeat risk assessment when data and models improve and adjust confidence scores accordingly
Confirm that Strategy will still achieve performance indicators and outcomes at least cost Revise Strategy as necessary
3 Periodically refresh Strategy accommodating impact of interventions already delivered using re‐verified predictive tools as appropriate
Confirm that Strategy will still achieve performance indicators and outcomes at least cost Revise Strategy as necessary
Triggers for a wholesale review of the Strategy are likely to be significant changes to the location or extent of planned development
4 Monitor report and share (with partners) the measures used to demonstrate delivery of outcomes Example measures may include the number of properties which experience sewer flooding the number of properties at risk of flooding the number of properties at risk from sewerage asset failure risk indices that capture both the probability and consequence of failure customer satisfaction with regards to clean rivers and beaches the number of pollution incidents the frequency of combined sewer overflow operation and compliance with discharge permit conditions
252 Good practice example ndash Thames Water live DAP
Thames Water has initiated a DAP (drainage area plan) Live approach Itrsquos a good example of how companies are continuously monitoring and updating the status of drainage area risks It provides a lsquoliversquo snapshot of the current health of all drainage areas in Thames Waterrsquos region allowing real time planning as part of a strategic approach It enables drainage planners to view the effectiveness
205240txt012|May 2013
32
Drainage Strategy Framework
of intervention strategies and compare incident rates across varying geographies and development types in the Thames Valley
DAP Live will be available for all catchments in the Thames Water area thus enabling
bull high level monitoring of risks across the business bull a live and strategic review of catchment performance bull prioritisation of catchments based on risk and bull an ability to share data with partners collaborating in drainage planning and improvements
Figure 12 illustrates the types of data managed through the DAP Live system These include asset data political and drainage boundaries environmental data operational data property amp growth data and modelling data As new data become available the DAP Live system is updated so that drainage planners have the most current view on emerging risks and issues
Asset data
Operational data
Property and growth data
Modelling data
Environmental data
Boundaries (SDACs operational political)
Figure 12 Data types held in the DAP Live system
Figure 13 illustrates how the system can provide analysis at a variety of scales from local authority boundaries sewage treatment works catchments drainage areas or a regular grid
205240txt012|May 2013
33
Drainage Strategy Framework
NE PROVINCES
WESTERN PROVINCES
NE LONDON bull Ops areas local W LONDON
SE LONDON authorities Large TIDWORTH SE PROVINCES
bull STW Catchments
bull Drainage areas(SDACs)
bull Regular grid Small
Figure 13 DAP Live reporting performance at different scales
205240txt012|May 2013
34
Drainage Strategy Framework
253 Good practice example ndash Wessex Water Water live data
Wessex Water is regularly using data geospatially to proactively identify and respond to risk Theirs is a good example of how data can be used to provide an adaptable approach that is regularly reviewed to plan investment
The risk‐based and live approach uses a set of likelihood and consequence models which are built up from all currently available data asset data (eg CCTV data material age) operational data (eg flooding and pollutions incidents) and information (eg locality near hospital or downstream of an overflow) All these data are collated for the entire Wessex region updated regularly and analysed geospatially
Figure 14 Sewer risk scores presented in a risk matrix and geospatially
This allows a risk score (Figure 14) to be calculated for each mapped sewer length which directs investigation more efficiently by allocating each mapped sewer a planned CCTV inspection date
This risk‐based approach has been successful in targeting problematic sewers increasing identification rates threefold Density analysis is performed using asset failure and operational information which allows planning of both proactive structural and operational investment
Proactively found structural issues are far more cost effective to repair before failure and can also prevent serviceability issues
205240txt012|May 2013
35
f
DDrainage Strateegy Frameworrk
Figgure 15 Hotsppot analysis
Thhe hotspot annalysis (Figuure 15) showss where operrational clustters have beeen calculatedd This hootspot analyssis is made aavailable on tthe Wessex WWater corporrate GIS to a llow operati onal staff to target their effforts to mitiggate against ffurther repeaat incidents AAdditional innformation ffrom asset annd operationnal activities ccan be addedd regularly too the databasses which drrive the mod els enabling rissk scores to bbe kept as livve as require d
226 Prrinciple Sixx Innovativve and Susstainable SSolutions
Thhe Drainage Strategy Fraamework proomotes the fuull evaluationn of alternatiives to tradit ionally enngineered sewwerage soluttions to test wwhether thesse offer loweer whole life ccost options or better reesponses to uuncertainty It is anticipaated that draainage solutioons of the futture will be ddifferent froom the ones we are usedd to
Thhese should iinclude (at leeast at a highh level) real ttime control storm waterr retrofit techhniques edducation to eenable custommers to changge behaviou r enhancingg incentives for customerss to reduce suurface water flowing to seewers and innnovative pe rmitting arraangements a cross drainagge networks annd sewage tr eatment worrks Water annd sewerage companies sshould continnue to revieww and deevelop other innovative ssolutions
Foor example wwhere a commpany may hiistorically haave preferredd to tackle seewer floodingg or coombined sewwer overflow pollution byy increasing iits undergrouund equipmment to store mmore rainfalll duuring stormss it might connsider other options in fuuture ndash such as working wwith custommers to mmanage the raainfall close tt eventing it foorm enteringg the sewer syystem o source pre
2205240txt012|Mayy 2013
36
Drainage Strategy Framework
261 Recommended good practice
No Good practice Example references
1 Use cost‐benefit methods to demonstrate that innovative and sustainable solution types provide best value for customers and the wider community
UKWIR will publish new research and guidance in 2013 addressing active control and storm water removal demonstrating how these technologies can be justified and included within Drainage Strategies
2 Consider integrated water resource management Work with partners (especially developers and local authorities) to examine whether use of stored stormwater reduces potable water consumption AND need for capacity in sewers
CIRIA has published a scoping study for water sensitive urban design45 in the UK
3 Consider a mix of conventional and new technologies using more adaptive approaches as low‐regrets responses to uncertainty eg prevent current sewer flooding with underground tank storage but address future risks (worsened by climate change) with retrofit SuDS implemented progressively
CIRIA has published lsquoRetrofitting to manage surface waterrsquo46 a comprehensive guide to planning and delivering this type of project
4 Use carbon accounting methods to compare embodied and emitted carbon in alternative intervention strategies so that these impacts are accounted for in whole life costs
Consider the benefits of surface water removal on the costs (including carbon) of pumping and sewage treatment
UKWIR47 has and continues to publish detailed guidance on carbon accounting for water and sewerage company use
45httpwwwciriaorgserviceresearch_informationAMContentManagerNet ContentDisplayaspxSection=research_informationampContentID=23581 46httpwwwciriaorgSERVICEHomecoreordersproductaspxcatid=5ampprodid=1909 47httpukwirforefront‐librarycomreports08‐cl‐01‐6923419000190269902659465890269
205240txt012|May 2013
37
Drainage Strategy Framework
No Good practice Example references
5 Where interventions include the provision of green space public amenity and improved habitats then Payment for Ecosystem Services approaches can be used to claim further monetised benefits in the appraisal Customers should be consulted to help value these benefits
The Environment Agency will publish data in 2013 on costs and benefits of retrofit stormwater projects to promote understanding and uptake
6 Share data within the industry on innovative solutions to increase knowledge of new technology and SuDs approaches
EA retrofitting SuDs costs and benefits database48
accommodating data from Ofwat AMP5 SuDS pilot initiative and other examples
262 Good practice example ndash Welsh Water surface water reduction and removal strategy for Gowerton and Llanelli
Dŵr Cymru Welsh Water and partners are applying innovative storm water removal methods to address capacity problems in the sewer network in Gowerton and Llanelli49 (population 140000) Current under capacity leads to localised sewer flooding and excessive combined sewer overflow (CSO) spill to the Burry Inlet a protected shellfish water and special area of conservation The capacity problems in the system were a concern for the Environment Agency (Wales) and there was a risk of widespread restrictions to economic development being imposed Dŵr Cymru Welsh Water Carmarthenshire County Council City and County of Swansea Consumer Council for Water Environment Agency Wales and the Welsh Government all worked in partnership to resolve the situation
A brand new hydraulic model was built for the entire sewerage network with particular attention paid to accurately representing the sources of storm run‐off and infiltration The model was verified against data from flow monitors and observed CSO spill frequencies into the Burry Inlet
To begin with a traditional sewer storage solution was proposed that would result in an average 10 spills a year into the shellfish water from all 90 CSOs in the two catchments Although this reduced spills and dealt with some of the flooding and growth issues the storage requirements would have been unaffordable provide no protection against long term climate change and would not tackle the fundamental problem of too much surface water getting into the combined network
An alternative approach based on the reduction and removal of storm water from the combined sewer system was also developed This was in accordance with Dŵr Cymru Welsh Waterrsquos Rainscape50 (surface water elimination and reduction) strategy To identify areas with the most
48httpevidenceenvironment‐agencygovukfcermenDefaultHomeAndLeisureFloodsWhatWereDoingIntoTheFutureScience ProgrammeResearchAndDevelopmentFCRMProjectaspxProjectID=15515be8‐bbed‐4204‐ae56‐3e810ba47694ampPageID=56bad68e‐dcb1‐4bf8‐84cc‐cbfd03ab63a2 49 httpwwwciwemorgmedia674511Paper20820Stephen20Ollierpdf 50httpwwwdwrcymrucom_libraryleaflets_publications_english
205240txt012|May 2013
38
Drainage Strategy Framework
potential for effective storm water removal a flowareaflooding thematic map was developed This was used to focus attention on areas which would deliver the most benefit if storm water removal was carried out These areas are coloured red in Figure 16
Figure 16 Thematic map showing areas of maximum potential for storm water removal
The following interventions (181 in total) were combined into single strategy to be delivered in phases by 2015 2020 and afterwards
bull The management of surface water through swales basins and soakaways rather than through combined sewers resulting in new amenity and ecological areas within the built‐up environment
bull Implementing smarter flow control to better use existing storage and conveyance assets bull Relining of sewers to prevent groundwater ingress bull Removal of land drainage connections to sewers bull Household rainwater harvesting retrofit schemes
surface_water_management_strategypdf
205240txt012|May 2013
39
Drainage Strategy Framework
Figure 17 is an artistrsquos impression of what one of the sustainable urban drainage system solutions may look like
Figure 17 Example retrofit SuDS solution proposed for Gowerton and Llanelli
Modelling has demonstrated that the alternative strategy will achieve the same CSO reduction benefit as the storage strategy together with flooding improvements and additional less tangible benefits at significantly lower cost than the traditional sewer storage solution
Figure 18 illustrates the dispersed nature of solutions identified for central Llanelli
Figure 18 Water sensitive urban design interventions planned for central Llanelli
205240txt012|May 2013
40
Drainage Strategy Framework
Appendix A
Glossary
205240txt012|May 2013
Drainage Strategy Framework
Appendix A Glossary
CAPEX Capital expenditure Appointed water and sewerage companiesrsquo spending on new replacement or refurbished capital assets such as construction or buying machinery
CIWEM Urban Drainage Group (WaPUG) A group of the Chartered Institution of Water and Environmental Management supporting professionals working in urban drainage
Combined Sewer Overflow (CSO) The discharge of untreated sewage diluted with storm water into rivers and the sea CSOs occur during heavy rain and are necessary to reduce the risk of sewer flooding The physical overflow structure is also called a CSO
Common Framework for Capital A planning approach developed for the water and Maintenance Planning sewerage companies in 2002 which provides a robust basis
for assessing future capital maintenance needs The approach is consistent with the needs of Ofwat
Defra The Department for Environment Food and Rural Affairs The Government Department with responsibility for water flooding and water quality in England
Drainage Area Plan (DAP) A detailed plan for a drainage catchment that prioritises a list of interventions based on risk using an approach established in the WRc Sewerage Rehabilitation Manual This approach has been succeeded by Sewerage Risk Management which guides the preparation of Sewerage Management Plans (SMP) Companies vary in how they prepare DAPs or SMPs (or their equivalents) following the general principles that have been established
Drainage Strategy Developed by water and sewerage companies to demonstrate how outcomes will be delivered in drainage catchments over the long term Drainage Strategies will use the information developed in producing a DAPSMP and if a drainage strategy has been produced this should be the starting point in producing a more detailed DAPSMP should this be required It is likely that the activities required to prepare DAPSMP and Drainage Strategies may overlap Drainage Strategies might not refer to specific interventions but instead outline a general approach
Drainage Strategy Framework Guidance to describe the contents and intention of Drainage Strategies
205240txt012|May 2013
Drainage Strategy Framework
Flood Risk Management Plans Required by the Flood Risk Regulations in Flood Risk Areas by December 2015
Flood Risk Regulations The legislative instrument used to implement the requirements of the Floods Directive in England and Wales
Floods Directive DIRECTIVE 200760EC of the European Parliament and of the Council of 23 October 2007 on the assessment and management of flood risks
Lead Local Flood Authority (LLFA) The Shire County or unitary authority with responsibility for managing local flood risk
Local development plans Developed by planning authorities to explain where and what type of development (new homes and businesses) will occur within their area They are required to explain water infrastructure needs to support this development
Local Flood Risk Management Strategy Developed by the Lead Local Flood Authority to explain (LFRMS) how local flood risk will be managed by the Authority and
in partnership with others
Natural Resources Wales From 1 April 2013 Natural Resources Wales (NRW) a new body formed by the Welsh Government will take over the functions previously carried out by the Environment Agency (EA) in Wales alongside those of the Forestry Commission Wales and the Countryside Council for Wales
Ofwat The Water Services Regulation Authority ndash the economic regulator of the water and sewerage companies of England and Wales
OPEX Operating expenditure Appointed water and sewerage companiesrsquo day‐to‐day spending on running the services for example staff costs and power This is likely to include investment in joint projects that do not create or relate to an asset that the company solely or jointly owns
Outcomes Outcomes are the higher level objectives that a companyrsquos actions are intended to deliver A companyrsquos outcome should reflect its customersrsquo priorities identified through appropriate customer engagement and deliver the best long‐term sustainable solution for customers and the environment An outcome may not be bound by a single price control period and should be set in the context of customersrsquo and the environmentrsquos long‐term needs
205240txt012|May 2013
Drainage Strategy Framework
Price Review The process of setting appointed water and sewerage companiesrsquo price limits The next price review will take place in 2014 for the period 2015‐20 Ofwat currently sets price limits every five years
Real Time Control (RTC) Using actuated pumps gates and weirs to actively control flow in sewers Better use can be made of existing infrastructure and links can be made between network treatment and receiving water systems for operational benefits Sometimes referred to as Active Management
River Basin Management (Plans) River Basin Management is a continuous process of planning (to develop River Basin Management Plans) and delivery The Water Framework Directive introduces a formal series of 6 year cycles The first cycle will end in 2015 when following further planning and consultation the River Basin Management Plans will be updated and reissued
Sewerage Management Plan A risk based approach to indentifying investment needs in sewerage systems as described in the Sewerage Risk Management (SRM) approach developed by WRc plc
Storm water retrofit Releasing capacity in sewers by controlling stormwater at the surface using disconnection swales and other sustainable drainage systems (SuDS)
205240txt012|May 2013
We are the Environment Agency We protect and improve the environment and make it a better place for people and wildlife We operate at the place where environmental change has its greatest impact on peoplersquos lives We reduce the risks to people and properties from flooding make sure there is enough water for people and wildlife protect and improve air land and water quality and apply the environmental standards within which industry can operate Acting to reduce climate change and helping people and wildlife adapt to its consequences are at the heart of all that we do We cannot do this alone We work closely with a wide range of partners including government business local authorities other agencies civil society groups and the communities we serve
wwwenvironment‐agencygovuk
Environment Agency National Customer Contact Centre
Telephone 03708 506 506 enquiriesenvironment‐agencygovuk
Ofwat (The Water Services Regulation Authority) is a non‐ministerial government department We are responsible for making sure that the water and sewerage sectors in England and Wales provide consumers with a good quality and efficient service at a fair price
wwwofwatgovuk
Telephone 0121 644 7500 mailboxofwatgsigovuk
Halcrow Group Limited Burderop Park Swindon Wiltshire SN4 0QD
tel 01793 812479 fax 01793 812089 halcrowcom
Halcrow Group Limited is a CH2M HILL company Halcrow Group Limited has prepared this report in accordance with
the instructions of The Environment Agency for the clientrsquos sole and specific use Any other persons who use any information contained herein do so at their own risk
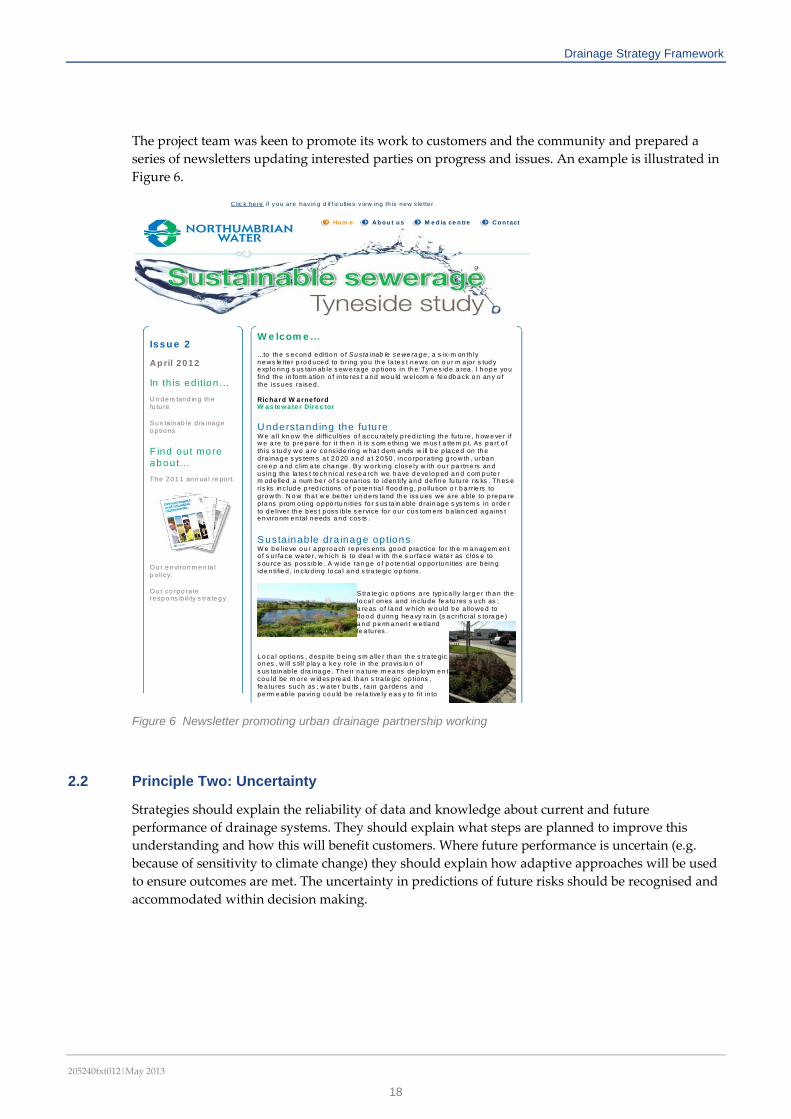
22
Drainage Strategy Framework
The project team was keen to promote its work to customers and the community and prepared a series of newsletters updating interested parties on progress and issues An example is illustrated in Figure 6
C lic k here if y ou are hav in g d if f ic u lties v iew ing th is new s letter
Ho m e A b o u t u s M e d ia ce n tre C o n tact
Issue 2
Ap ril 2012
In th is ed ition U n d e rs tan d in g th e fu tu re
S u s tain ab le d ra ina g e o p tio ns
F ind ou t more about Th e 2 0 1 1 an n ua l re po rt
Ou r e n viro n m e n ta l p o licy
Ou r co rp o ra te re sp o nsib il i ty s tra te g y
W e lcom e to th e s e con d e ditio n o f S u sta inab le se we ra g e a s ix-m on th ly n e ws le tte r p ro d u ce d to b ring yo u th e la te s t n e ws on o u r m a jo r s tud ye xp lo rin g s us tain ab le s ew e ra ge o p tions in th e Tyn e s id e a rea I h o p e yo u fin d th e in fo rm a tio n o f in te res t a n d wo u ld w e lcom e fe e db a ck o n an y o f th e issu es ra ise d
Ric ha rd W a rne ford W a s te wa te r Dire c tor
U nderstand ing the fu tu re W e a ll kn o w th e difficu lties o f a ccu ra tely p re d ic tin g th e fu tu re h ow e ve r ifw e a re to p re pa re fo r i t th e n it is s om e thin g we m us t a tte m p t As p a rt o f th is s tu d y w e a re co ns id e rin g w ha t d em a nds w ill b e p la ce d on th e d ra ina g e s ys tem s a t 2 0 20 a n d a t 2 0 50 in co rpo ra ting g ro w th u rba n cre e p a nd c lim a te cha n ge B y w o rk in g close ly w ith o u r p a rtn e rs an d u s in g th e la tes t te ch n ical res e a rch we h a ve d e ve lo p ed a n d com p u te rm od e lle d a num b e r o f s ce na rios to id en tify a n d d e fin e fu tu re ris ks Th es e ris ks in c lud e p red ic tions o f p o te n tia l floo d in g p o llu tion o r b a rrie rs to g ro w th N o w th a t w e be tte r u n d e rs ta nd th e iss u es we a re a ble to p re pa re p la ns p rom o ting o p po rtu n ities fo r s us ta in a ble d rain ag e s ys tem s in o rde r to d e live r th e b es t p oss ible s e rvice fo r o u r cu s tom e rs b a la n ced a g ains te n viro nm e n tal n e eds a n d cos ts
S usta inab le d ra inage op tions W e b e lie ve o u r a pp ro a ch re p res en ts go o d p ra ctice fo r th e m a n ag em en t o f s u rfa ce wa te r w h ich is to d ea l w ith th e s u rfa ce wa te r as c los e to s ou rce as p oss ib le A w id e ra n g e o f p o te n tial o p po rtu n ities a re b ein g id e n tifie d in c lu d in g lo ca l a n d s tra te gic o p tions
S tra te g ic o p tions a re typ ica lly la rg e r th a n th e lo ca l on es a nd in c lu d e fe a tu res s u ch as a re as o f la nd w h ich w o uld b e a llo we d to flo o d d u rin g he a vy ra in (s a crific ial s to ra g e ) a n d p e rm a n en t w e tla nd fe a tu res
L o ca l op tio ns d esp ite b ein g sm a lle r th a n th e s tra te gic o n es w ill s til l p la y a ke y ro le in th e p ro vis io n o f s us tain ab le d ra ina g e Th e ir n a tu re m e a ns de p lo ym e n t co u ld be m o re w id es p re a d th a n s tra te gic o p tions fe a tu res su ch as w a te r b u tts ra in g a rde ns a nd p e rm e ab le pa vin g co u ld b e re la tive ly e a s y to fi t in to
Figure 6 Newsletter promoting urban drainage partnership working
Principle Two Uncertainty
Strategies should explain the reliability of data and knowledge about current and future performance of drainage systems They should explain what steps are planned to improve this understanding and how this will benefit customers Where future performance is uncertain (eg because of sensitivity to climate change) they should explain how adaptive approaches will be used to ensure outcomes are met The uncertainty in predictions of future risks should be recognised and accommodated within decision making
205240txt012|May 2013
18
Drainage Strategy Framework
221 Recommended good practice
No Good practice Example references
1 Data analysed and used in the development of the strategy related to asset location dimensions condition failure and flood and pollution incidents should be assigned a confidence grading The confidence grading should be related to its accuracy completeness compatibility credibility and currency
Models used to predict blockages and collapses flooding locations polluting discharges and water quality impacts should be assigned a confidence grading based on their accuracy completeness compatibility credibility and currency
Model predictions should be assigned a confidence grading depending on the confidence in the model and whether it is being applied outside of its verification range (eg for extreme events or for atypical geographies)
The purpose of confidence grading data and model results used in strategy setting is to understand the likelihood that outcomes will be achieved in a cost efficient manner Where the outcomes remain uncertain knowledge of data confidence can be used to target improvement programmes
SRM5 (S3‐03‐17) refers to Ofwatrsquos method for recording the reliability and accuracy of regulatory data in bands A to D
The SWMP guidance (Section 319) describes an alternative system of grading data and model results
2 Use the Drainage Strategy to justify data and model improvement programmes This should be focussed on areas where risks are currently (or predicted to be) high and uncertainty in data or models reduces the ability to determine robust operational or capital solutions Poor model verification in high risk areas would be an indicator that model improvements were required
CIWEMrsquos urban drainage group has published a series of guides on hydraulic and water quality modelling They discuss model calibration verification and uses
SRM5 (S3‐04) describes how to determine where the current assessment of risk is sufficient to proceed or whether data and models should be improved
3 Improve understanding of network performance (and improve models) by using long term flow and level monitoring on sewers and CSOs
Yorkshire Water discusses its CSO
monitoring programme here
4 Demonstrate how the uncertainty in both the underlying datamodels and in the future projections is addressed in options appraisal Consider if this should be done implicitly (eg through choosing conservative assumptions) or explicitly through the use of sensitivity analysis or scenario testing
Treasury Green Book supplementary guidance illustrates how to accommodate climate change uncertainties
205240txt012|May 2013
19
Drainage Strategy Framework
No Good practice Example references
5 Population growth new homes and businesses climate change and urban creep combine to make the future highly uncertain but will almost certainly increase flooding and pollution risks from drainage systems Use the Drainage Strategy to explore different scenarios (combining the impact of these drivers) for a near term (le 10 years) and future (ge 30 years) epoch
For example combine modest growth and slight climate change (a low impact case) and contrast with high growth and significant climate change (a high impact case) Where the location of significant new development is unknown include scenarios accommodating different possibilities
Running multiple scenarios is time consuming and costly A risk based approach should be adopted to focus efforts where flooding and pollution risks are especially sensitive to changes in demand
UKWIR has published research on accounting for climate change35 and urban creep36 in sewerage planning together with more general advice on accommodating climate change in water asset management planning37
Ofwat has published research38
predicting the combined impacts of climate change urban creep and development on a national basis
6 In the face of significant uncertainties about future demands on the drainage system and their consequences the Drainage Strategy should identify low‐regrets interventions (ie ones that are robust no matter what the future holds) and ensure that solutions can be adapted if greater certainty is achieved For example through quickening the pace of SuDS retrofit activities or using (previously identified and secured) land to extend underground storage facilities Strategies which remove surface water from sewerage networks provide lsquoheadroomrsquo for unpredictable increases in demand from population and climate change
Designing Resilient Cities A guide to good practice DR Lomardi et al HIS BRE Press
7 Post project appraisal and cost monitoring should be used to capture real costs and performance so that Strategies can be updated and improved with latest information It is especially important to collate and understand the whole life costs of new technologies where industry understanding is currently poor
35httpwwwukwirorgreports03‐cl‐10‐09042794658901799019890198 (poundpound) 36httpukwirforefront‐librarycomreports10‐wm‐07‐1493273 (poundpound) 37httpukwirforefront‐librarycomreports12‐cl‐01‐1694816900019015590145901409465890155 (poundpound) 38httpwwwofwatgovuksustainabilityclimatechangerpt_com201106mottmacsewerpdf
205240txt012|May 2013
20
Drainage Strategy Framework
222 Good practice example ndash Severn Trent Waterrsquos MICAS
Severn Trent Water has developed a process to measure confidence in hydraulic models of sewer systems Modelling Investment Confidence Assessment Scoring (MICAS) was developed to provide an objective evaluation of model confidence It uses information stored in the hydraulic model about the provenance of each data element and the quality of model verification Before the approach was developed the assessment of lsquofitness for purposersquo of models was subjective and based on modellers judgment This was not always reliable and certainly not repeatable and transparent MICAS provides an objective assessment of hydraulic model quality which can be used to inform its use and prioritise improvements to input data and model verification
Figure 7 and Figure 8 illustrate how an understanding of model confidence from the MICAS assessment (right hand side images) can be used to interpret predictions of flooding (left hand side images) In Figure 7 areas at predicted high risk of flooding (red in the left hand side image) are shown to be in high confidence areas of the hydraulic model (green in the right hand side image) In contrast in Figure 8 areas at predicted high risk of flooding (red in the left hand side image) are shown to be in poor confidence areas of the hydraulic models (orange in the right hand side image) In the latter case this information is used to identify where further model improvements would be beneficial
Flood Risk MICAS
Figure 7 Modelled flood risk and MICAS confidence scores (high model confidence)
Flood Risk MICAS
Figure 8 Modelled flood risk and MICAS confidence scores (lower model confidence)
205240txt012|May 2013
21
23
Drainage Strategy Framework
Principle Three Risk Based
Strategies should be risk based This means that planning operational and investment activities should be based on consideration of the probability and consequence of inadequate drainage function (risks) as these relate to the achievement of measures that demonstrate delivery of outcomes A risk based Strategy ensures that investment is made where risks are the greatest
To aid communication risks should be visualised through maps and plans (Figure 10 is an example) To aid risk assessment risks should be monetised combined and predicted into the future To aid options appraisal the impact of interventions on the level of risk should be predicted
The approach to Drainage Strategy development should be risk based itself The degree of detail included should be related to an understanding of the overall level of risks in the catchment now and in the future
231 Recommended good practice
No Good practice Example references
1 Determine where a Drainage Strategy is required by combining current performance with external influences likely to result in deteriorating performance This stage requires no modelling or detailed assessment On a catchment‐by‐catchment (drainage area) basis understand current risks by collating data on current performance eg blockages collapses pumping station failures pollution incidents CSO spills storm tank spills internal flooding incidents external flooding incidents and infiltration rates Relate these risks to performance indicators and the achievement of outcomes Combine with information about known growth rates predictions of urban creep quantity of newly adopted lsquoprivatersquo sewers surface water flooding risks (eg from flood map for surface water) WFD water body status and bathing water status Prioritise catchments with high current risks andor factors suggesting that risks are likely to worsen significantly in the future Consider normalising scoring method for size of catchment (eg by unit area or unit length of sewer) Consult with stakeholders to confirm correct prioritisation Commence with development of Drainage Strategies for the highest ranked catchments Periodically revisit prioritisation (updating with new data) to check that priorities are still correct
The initialisation stage of a Sewer Management Plan (SMP) (described in SRM5) considers how a risk assessment can be used to prioritise which spatial units (eg catchments) should be prioritised for a SMP study
2 Visualise catchment risks (from 1) to illustrate and explain to partners the reasons for prioritisation Accommodate their views amp consider changing prioritisation to aid wider drainage planning requirements (eg increase prioritisation of a catchment with significant surface water flooding problems where close collaboration between water and sewerage company and LLFA will benefit the community)
205240txt012|May 2013
22
Drainage Strategy Framework
No Good practice Example references
3 Clearly relate sewerage risks to the performance indicators that will be used to measure progress towards achieving outcomes eg relate blockage rates to flooding and pollution incidents eg relate increase in flows to increased CSO frequency breaches of permit conditions and deterioration in receiving water quality Adopt a sourcendashpathway‐receptor model and workshop techniques to ensure that cause effect and consequences are fully captured Use performance indicators as the basis for a comprehensive risk assessment that considers likelihood (frequency) and consequence (extent degree and duration of impact) of failure expressed as risk scores Monetise risks in GBP (pound) to align with principle four (whole life costs amp benefits) Use (verified) predictive models to understand near term (lt10 years) and long term (gt30 years) risks The latter to align with principle four (whole life costs amp benefits) Align complexity of method with level of risk recognising the needs of partners eg use complex 2D flood routing models to ascertain (with greater certainty) flood mechanisms and damages where the quantity and frequency of flooding is high and interventions will be complex and costly Elsewhere more simple approaches are appropriate eg use complex UPM3 water quality modelling methods where compliance with river standards or discharge consents is already failing or is expected to do so Elsewhere more simple approaches are appropriate Combine risk scores from different risks to describe the total level of risk in a catchment Use visualisation techniques to communicate combined level of risk Combine analysis from hydraulic blockage and asset deterioration models on a catchment basis In hydraulic analysis consider flooding performance for rainfall events beyond the usually provided standard of protection to understand performance in extreme events in support of partners (especially LLFAs) and in search of cost beneficial interventions at a higher standard than normal
SRM 5 (S3‐03) details approaches to simple and more complex approaches to risk assessment that are consistent with CMPCF guidelines
4 Be alert to interactions between sewer networks and wastewater treatment plans eg by modelling the impact of changing sewer flows on wastewater treatment worksrsquo performance and costs Consider combined impact of different catchments on a single or linked water body (eg an inland river bathing water or shell fishery)
UPM3 guidance discusses approaches to understanding these interactions and applying more complex water quality impact models
5 Establish systems and apply methods to predict how interventions can reduce risks eg how a targeted and pro‐active maintenance can reduce the occurrence of sewer blockage and flooding from lsquoother causesrsquo eg how reducing infiltration can reduce CSO spills eg how reducing connected impermeable area can reduce sewer flooding
205240txt012|May 2013
23
Drainage Strategy Framework
232 Good practice example ndash United Utilities risk assessment
United Utilities has demonstrated a robust risk based approach in the development of sewerage management plans used for long term planning across their area of operations
Hydraulic models were applied in 235 catchments and configured to look at future performance and to evaluate the consequences of inadequate capacity Starting from a baseline of 2010 versions of the models were built for 2020 and 2036 epochs The following model input parameters were adjusted population water consumption infiltration planned development known sewerage improvement projects urban creep rainfall (for climate change)
Two‐dimensional (2D) modelling was used to consider the consequences of sewer flooding resulting from the changes made to reflect the future operating environments As well as the impact on homes and business (from internal and external flooding) the flood risk to critical infrastructure was also considered The operation of CSOs was considered by computing the annual spill volume duration and frequency
Finally predictions of the likelihood and consequence of sewer failure were added taking account of sewer material age and the incident records relating to similar assets
All these data were combined and weighted to generate a Sewer Management Plan (SMP) Risk Score for each length of sewer The process is illustrated in Figure 9
Figure 9 United Utilitiesrsquo process for calculating risk score in sewerage catchments
205240txt012|May 2013
24
Drainage Strategy Framework
Risk scores were summed spatially and monetised so that high priority locations could be identified Mapping and visualisation were used to communicate the results of this assessment priority areas for further investigation and how risks change through time (Figure 10)
Figure 10 Visualisation of sewerage risks
233 Good practice example ndash Northumbrian Water risk assessment
Northumbrian Water completes an annual assessment of hydraulic capacity in its sewerage network at the drainage area scale Its approach does not require hydraulic models to have been completed and yet can reliably highlight areas of under‐capacity in need of further investigation through more detailed analysis including hydraulic modelling New and emerging risk areas can also be identified by applying data for population growth which occurs through development lsquoWhat ifrsquo scenarios can be run to test when capacity limits may be overcome and flood risks potentially set to increase It demonstrates good lsquorisk basedrsquo planning principles because it shows the drainage planner where more detailed analysis is warranted
The approach uses the following data from company records population connected to sewer P water consumption rate G (lhd) trade discharge E (ls) pipe diameter and gradient pipe connectivity CSO consent pass forward rate (ls) pumping station rate (ls) sewage treatment flow rate (ls) A wastewater dry weather capacity map calculates pipe full capacity dry weather flow (PG+E+I) and Formula A flow for fully combined (1360P+2E+DWF) and separate (4PG+3I+E) areas of the network Infiltration (I) is assumed to be 50 PG +E
205240txt012|May 2013
25
Drainage Strategy Framework
A theoretical assessment of network capacity is then calculated by comparing Formula A with pipe full capacity flow consent values at CSOs and wastewater treatment works and pumping rates This determines areas of the network with a capacity shortfall with a potential capacity shortfall and with no capacity shortfall
When run across the whole company area approximately 100 out of 500 drainage areas were found to be under capacity Over 60 of these areas had recorded sewer flooding incidents In over 300 drainage areas there was no forecast capacity shortfall Only 7 of these drainage areas had recorded sewer flooding incidents Overall the system proved to be very reliable at predicting drainage areas likely to have sewer flooding problems because of sewer under‐capacity
In under capacity drainage areas an intermediate (hydraulic model based) assessment is then carried out Figure 11 shows the results thematically mapped for an example drainage area Red areas are predicted to have a very high risk of sewer flooding Yellow and green areas are predicted to have a low risk of sewer flooding
Figure 11 Example of a drainage area capacity map
205240txt012|May 2013
26
24
Drainage Strategy Framework
Principle Four Whole Life Costs and Benefits
Strategies should be informed by consideration of whole life costs and benefits They should promote a series of interventions which in view of the quantified uncertainties are most likely to result in performance indicators which demonstrate the achievement of outcomes at lowest cost to customers and the community more widely
Costs relate to capital and operational expenditure to deliver interventions and the monetised impacts of drainage failures such as flooding and pollution
Benefits relate to the reduction in risks from drainage failures such as flooding and pollution but should also include wider societal impacts such as those calculated using a lsquoPayments for Ecosystems Servicesrsquo approach
When considering the lsquowhole lifersquo the strategy should consider climate population and asset deterioration trends These are likely to increase risks over the long term if no interventions are made The strategy should state lsquowhatrsquo should be done but also broadly lsquowhenrsquo and in what sequence interventions should happen
241 Recommended good practice
No Good practice Example references
1 Predict risks into the future for at least two epochs le10 years (to understand what the company needs to do now and how this fits with longer term outcomes) and ge30 years to understand long term needs in light of changing population and other pressures
Account for the following changes in demand
bull Growth ‐ new homes and businesses
bull Urban creep ndash uncontrolled addition of connected impermeable area
bull Climate change ndash affecting design events (flood predictions) time‐series (CSO and treated effluent quantities) river flows and temperatures
bull Infiltrationexfiltration ndash through deteriorating sewer condition
bull Dry weather flows ndash through changes in water consumption rates
2 Combining monetised risks (associated with sewerage failures) determine whole life costs for a lsquodo nothingrsquo scenario (ie no interventions)
Include costs associated with electricity consumption (in the network and at the wastewater treatment works) and CO2 emissions
UKWIR will publish in 2014 a revision to their Long Term Least Cost Planning for Wastewater Supply‐Demand
guidance This may provide tools and methods for expressing costs and benefits to support the development of a Drainage Strategy
205240txt012|May 2013
27
Drainage Strategy Framework
No Good practice Example references
3 Test intervention strategies which keep performance indicators on track to deliver outcomes by adding capacity (supply) reducing flows (demand) or altering operational regimes
Include the costs of interventions and the benefits of reduced risks to inform selection of the most cost beneficial strategy over the whole life
Have regard to the timing of interventions recognising that uncertainty may require low‐regrets (insensitive to uncertainty) solutions and that delaying major interventions may be more affordable and attractive in the short term Discounting should be used to compare the costs and benefits of interventions occurring at different times
Recognise that some interventions will be obligatory and defined (eg maintenance of a spill frequency standard at a CSO) whilst others will be more discretionary focused on achieving outcomes rather than specific outputs
SRM5 (Section 8) defines and contrasts cost benefit analysis cost effectiveness analysis whole life cost analysis and risk cost benefit analysis
HM Treasury Green Book39
sets out a framework for the appraisal of long term projects which can be applied to the development of a Drainage Strategy
4 Donrsquot at first be concerned with the distribution of costs and benefits between partners who may be sharing costs Identify the most cost beneficial solution first and then debate and agree an equitable sharing of costs
Give equal weighting to OPEX (operating expenditure) and CAPEX (capital expenditure) costs so not to cause bias towards capital intensive solutions Properly consider the costs and benefits of pro‐active maintenance regimes and campaigns to influence customers to reduce fats oils and greases (FOG) build‐ups and the misuse of sewers
Consider the affordability of solutions the impact on customersrsquo bills and the resources of other organisations to play their part
UKWIR research outputs40 in 2013 (SW01) will provide a framework for making a business case for separating storm water from combined sewers
5 Where interventions include the provision of green space public amenity and improved habitats then Payment for Ecosystem Services approaches should be used to identify further monetised benefits in the appraisal Customers should be consulted to help value these benefits
Supplementary Green Book41
guidance describes methods for accounting for environmental impacts including the ecosystems approach
39 httpwwwhm‐treasurygovukdata_greenbook_indexhtm 40 httpwwwukwirorgpublishorsystemcomponent_viewaspLogDocId=96116 41 httpwwwhm‐treasurygovukdaccounting_environmental_impactspdf
205240txt012|May 2013
28
Drainage Strategy Framework
242 Good practice example ndash Severn Trent Water making the case for surface water separation in Stoke-on-Trent
In this example42 Severn Trent Water compared alternative ways of addressing sewer flooding problems by looking at a range of costs and benefits not all of which were directly associated with its specific responsibilities as a water and sewerage company Whilst the example does not express a monetised value for all costs and benefits over the whole life it does illustrate the types of factors which could be included in an appraisal of this type scaled to address problems at a catchment level It also demonstrates how working collaboratively can help identify solutions which are cost‐beneficial for the community at large
In an area of Stoke served by a combined sewer system five properties were at risk from sewer flooding in cellars for events equal to and less frequent than the 1 in 10 year probability A conventional sewer pumping station based solution was presented as the standard option
However a nearby former hospital site was also undergoing re‐development which would result in reduced runoff to the combined sewer The new drainage regime in the redevelopment site was sufficient to remove the flood risk at the five properties (this was a do nothing strategy)
A third option completely separated the development site runoff from the combined sewer and also addressed local flood risk issues nearby The solution required a new storm sewer and a network of swales and other SuDS features connecting with an ordinary watercourse
Table 1 illustrates how costs and benefits were compared across the three alternative strategies Each provided the same benefit in terms of the number of homes (5) relieved from sewer flooding The novel SuDS and surface water management solution additionally gave local flood risk relief to 3 further properties The separationSuDS strategy came at a higher capital cost but delivered greater social cost benefits savings in annual operating costs and a bonus improvement water quality (because of reduced CSO spill volume) Severn Trent selected the separation SuDS solution because the higher capital costs were offset by other benefits
Table 1 Costs and benefits of drainage improvements in part of Stoke-on-Trent
Do nothing Standard option
SuDS
Sewer flooding benefits 5 5 5
Other flooding benefits 0 0 3
Change in runoff to combined sewer (m3year) 0 0 ‐40000
Estimated cost (pound) 0 168000 419000
42httpwwwciwemorgmedia695460Paper203_Creating20Sewer20Capacity_Presentation2 0by20Mike20Woodpdf
205240txt012|May 2013
29
Drainage Strategy Framework
Do nothing Standard option
SuDS
Social Cost Benefit (pound) 16000 5000 51000
Change in electricity costs (poundyear) 0 +75 ‐525
Programme impact (years to deliver solution) + 4 0 +4
CSO spill volume (m3 in 1year event) +298 0 ‐397
243 Good practice example ndash New York City comparison of grey and green infrastructure drainage strategies
This example is taken from New York in the United States of America Itrsquos an illustration of how whole life costs have been compared for alternative strategies to solve urban drainage issues on a mega‐city scale The key data are summarised in Table 2
Table 2 Comparing drainage strategies in New York
Grey Strategy
Green Strategy
CSO spill volume reduction (billion gallons year)
101 122
Wider benefits over 20 years ($ million) 0 139 to 418
Whole life costs over 20 years ($ billion) 68 53
The information is taken from the New York City Green Infrastructure Plan43 produced by the Mayorrsquos Office in 2010 The Plan (and recent updates) provides a comprehensive evidence base around costs and benefits of different approaches to address the cityrsquos drainage problems It is therefore an excellent example of how drainage strategies can be described in plain language for a non‐specialist audience concerned with their environment and the cost of providing infrastructure to enhance it
It is becoming commonplace for North American cities (eg Portland and Philadelphia) to address the issue of frequent combined sewer overflow (CSO) operation by using a combination of grey infrastructure (sewers) and green infrastructure (sustainable drainage systems) The wider health
43 httpwwwnycgovhtmldephtmlstormwaternyc_green_infrastructure_planshtml
205240txt012|May 2013
30
25
Drainage Strategy Framework
and ecological benefits of green infrastructure approaches and the reduced reliance on materials and energy are attractive to utility planners and cities alike
New York has 422 CSOs and an agreed Long Term Control Strategy to significantly reduce the impact wet weather discharges have on aquatic systems throughout the city Annual discharges are currently (2010) estimated to be 30 billion gallons (114 million cubic meters) per year Building on existing and committed new sewer plans an agreed grey infrastructure based strategy to this problem is set to reduce these discharges to 198 billion gallons per year (a 34 reduction) by the 2030s An alternative green infrastructure approach based around intercepting the first inch (25mm) of rainfall across 10 of the impermeable city area by 2030 is predicted to reduce CSO spills to 179 billion gallons per year
Planners have calculated that the whole life costs after 20 years of the grey infrastructure solution will be $68 billion (2010 prices) compared to the green infrastructure whole life costs of $53 billion The green infrastructure strategy reduces CSO spills by more than the grey alternative for $15 billion less in terms of whole life cost Further planners have calculated that New Yorkers will benefit by up to $41844 million (accumulated over 20 years) in additional benefits associated with lower energy bills from control of urban heating increased property values and improved health
Based on this analysis New York City has committed itself to an aggressive green infrastructure based runoff control strategy to provide long term reductions in CSO spills The plan is to achieve interception of 15 of impermeable area by 2015 4 by 2020 7 by 2025 and 10 by 2030
Principle Five Live Process
The Strategy should be adaptable and periodically reviewed Whilst outcomes are expected to be relatively stable over time the pace at which the Strategy delivers outcomes will be linked to volatile influences (like climate and population change) and to the decisions made at each price review about the priorities for the following period The Strategy should be reviewed at regular intervals to reflect investments already made the changing priorities of the water and sewerage company and partners and the presence of emerging risks The review is also an opportunity to report drainage catchment performance relative to performance measures designed to monitor progress towards achieving outcomes
44 Estimated using methods from the New York Municipal Forest Resource Analysis (MFRA) prepared by the US Dept of Agriculture
205240txt012|May 2013
31
Drainage Strategy Framework
251 Recommended good practice
No Good practice Example references
1 Regularly repeat screening exercise to determine catchments requiring a Drainage Strategy and modify programme of Strategy development accordingly
Check for changes in measured rates of flooding and pollution incidents blockages collapses pumping station failures etc
Check for changes in extent and location of new development
Check for activities being undertaken by partners (eg redevelopment urban realm improvements and flooding and pollution management activities)
SRM5 illustrates how improved and updated knowledge of system performance should be applied to establish Strategies
2 In lsquolive Strategiesrsquo repeat risk assessment when data and models improve and adjust confidence scores accordingly
Confirm that Strategy will still achieve performance indicators and outcomes at least cost Revise Strategy as necessary
3 Periodically refresh Strategy accommodating impact of interventions already delivered using re‐verified predictive tools as appropriate
Confirm that Strategy will still achieve performance indicators and outcomes at least cost Revise Strategy as necessary
Triggers for a wholesale review of the Strategy are likely to be significant changes to the location or extent of planned development
4 Monitor report and share (with partners) the measures used to demonstrate delivery of outcomes Example measures may include the number of properties which experience sewer flooding the number of properties at risk of flooding the number of properties at risk from sewerage asset failure risk indices that capture both the probability and consequence of failure customer satisfaction with regards to clean rivers and beaches the number of pollution incidents the frequency of combined sewer overflow operation and compliance with discharge permit conditions
252 Good practice example ndash Thames Water live DAP
Thames Water has initiated a DAP (drainage area plan) Live approach Itrsquos a good example of how companies are continuously monitoring and updating the status of drainage area risks It provides a lsquoliversquo snapshot of the current health of all drainage areas in Thames Waterrsquos region allowing real time planning as part of a strategic approach It enables drainage planners to view the effectiveness
205240txt012|May 2013
32
Drainage Strategy Framework
of intervention strategies and compare incident rates across varying geographies and development types in the Thames Valley
DAP Live will be available for all catchments in the Thames Water area thus enabling
bull high level monitoring of risks across the business bull a live and strategic review of catchment performance bull prioritisation of catchments based on risk and bull an ability to share data with partners collaborating in drainage planning and improvements
Figure 12 illustrates the types of data managed through the DAP Live system These include asset data political and drainage boundaries environmental data operational data property amp growth data and modelling data As new data become available the DAP Live system is updated so that drainage planners have the most current view on emerging risks and issues
Asset data
Operational data
Property and growth data
Modelling data
Environmental data
Boundaries (SDACs operational political)
Figure 12 Data types held in the DAP Live system
Figure 13 illustrates how the system can provide analysis at a variety of scales from local authority boundaries sewage treatment works catchments drainage areas or a regular grid
205240txt012|May 2013
33
Drainage Strategy Framework
NE PROVINCES
WESTERN PROVINCES
NE LONDON bull Ops areas local W LONDON
SE LONDON authorities Large TIDWORTH SE PROVINCES
bull STW Catchments
bull Drainage areas(SDACs)
bull Regular grid Small
Figure 13 DAP Live reporting performance at different scales
205240txt012|May 2013
34
Drainage Strategy Framework
253 Good practice example ndash Wessex Water Water live data
Wessex Water is regularly using data geospatially to proactively identify and respond to risk Theirs is a good example of how data can be used to provide an adaptable approach that is regularly reviewed to plan investment
The risk‐based and live approach uses a set of likelihood and consequence models which are built up from all currently available data asset data (eg CCTV data material age) operational data (eg flooding and pollutions incidents) and information (eg locality near hospital or downstream of an overflow) All these data are collated for the entire Wessex region updated regularly and analysed geospatially
Figure 14 Sewer risk scores presented in a risk matrix and geospatially
This allows a risk score (Figure 14) to be calculated for each mapped sewer length which directs investigation more efficiently by allocating each mapped sewer a planned CCTV inspection date
This risk‐based approach has been successful in targeting problematic sewers increasing identification rates threefold Density analysis is performed using asset failure and operational information which allows planning of both proactive structural and operational investment
Proactively found structural issues are far more cost effective to repair before failure and can also prevent serviceability issues
205240txt012|May 2013
35
f
DDrainage Strateegy Frameworrk
Figgure 15 Hotsppot analysis
Thhe hotspot annalysis (Figuure 15) showss where operrational clustters have beeen calculatedd This hootspot analyssis is made aavailable on tthe Wessex WWater corporrate GIS to a llow operati onal staff to target their effforts to mitiggate against ffurther repeaat incidents AAdditional innformation ffrom asset annd operationnal activities ccan be addedd regularly too the databasses which drrive the mod els enabling rissk scores to bbe kept as livve as require d
226 Prrinciple Sixx Innovativve and Susstainable SSolutions
Thhe Drainage Strategy Fraamework proomotes the fuull evaluationn of alternatiives to tradit ionally enngineered sewwerage soluttions to test wwhether thesse offer loweer whole life ccost options or better reesponses to uuncertainty It is anticipaated that draainage solutioons of the futture will be ddifferent froom the ones we are usedd to
Thhese should iinclude (at leeast at a highh level) real ttime control storm waterr retrofit techhniques edducation to eenable custommers to changge behaviou r enhancingg incentives for customerss to reduce suurface water flowing to seewers and innnovative pe rmitting arraangements a cross drainagge networks annd sewage tr eatment worrks Water annd sewerage companies sshould continnue to revieww and deevelop other innovative ssolutions
Foor example wwhere a commpany may hiistorically haave preferredd to tackle seewer floodingg or coombined sewwer overflow pollution byy increasing iits undergrouund equipmment to store mmore rainfalll duuring stormss it might connsider other options in fuuture ndash such as working wwith custommers to mmanage the raainfall close tt eventing it foorm enteringg the sewer syystem o source pre
2205240txt012|Mayy 2013
36
Drainage Strategy Framework
261 Recommended good practice
No Good practice Example references
1 Use cost‐benefit methods to demonstrate that innovative and sustainable solution types provide best value for customers and the wider community
UKWIR will publish new research and guidance in 2013 addressing active control and storm water removal demonstrating how these technologies can be justified and included within Drainage Strategies
2 Consider integrated water resource management Work with partners (especially developers and local authorities) to examine whether use of stored stormwater reduces potable water consumption AND need for capacity in sewers
CIRIA has published a scoping study for water sensitive urban design45 in the UK
3 Consider a mix of conventional and new technologies using more adaptive approaches as low‐regrets responses to uncertainty eg prevent current sewer flooding with underground tank storage but address future risks (worsened by climate change) with retrofit SuDS implemented progressively
CIRIA has published lsquoRetrofitting to manage surface waterrsquo46 a comprehensive guide to planning and delivering this type of project
4 Use carbon accounting methods to compare embodied and emitted carbon in alternative intervention strategies so that these impacts are accounted for in whole life costs
Consider the benefits of surface water removal on the costs (including carbon) of pumping and sewage treatment
UKWIR47 has and continues to publish detailed guidance on carbon accounting for water and sewerage company use
45httpwwwciriaorgserviceresearch_informationAMContentManagerNet ContentDisplayaspxSection=research_informationampContentID=23581 46httpwwwciriaorgSERVICEHomecoreordersproductaspxcatid=5ampprodid=1909 47httpukwirforefront‐librarycomreports08‐cl‐01‐6923419000190269902659465890269
205240txt012|May 2013
37
Drainage Strategy Framework
No Good practice Example references
5 Where interventions include the provision of green space public amenity and improved habitats then Payment for Ecosystem Services approaches can be used to claim further monetised benefits in the appraisal Customers should be consulted to help value these benefits
The Environment Agency will publish data in 2013 on costs and benefits of retrofit stormwater projects to promote understanding and uptake
6 Share data within the industry on innovative solutions to increase knowledge of new technology and SuDs approaches
EA retrofitting SuDs costs and benefits database48
accommodating data from Ofwat AMP5 SuDS pilot initiative and other examples
262 Good practice example ndash Welsh Water surface water reduction and removal strategy for Gowerton and Llanelli
Dŵr Cymru Welsh Water and partners are applying innovative storm water removal methods to address capacity problems in the sewer network in Gowerton and Llanelli49 (population 140000) Current under capacity leads to localised sewer flooding and excessive combined sewer overflow (CSO) spill to the Burry Inlet a protected shellfish water and special area of conservation The capacity problems in the system were a concern for the Environment Agency (Wales) and there was a risk of widespread restrictions to economic development being imposed Dŵr Cymru Welsh Water Carmarthenshire County Council City and County of Swansea Consumer Council for Water Environment Agency Wales and the Welsh Government all worked in partnership to resolve the situation
A brand new hydraulic model was built for the entire sewerage network with particular attention paid to accurately representing the sources of storm run‐off and infiltration The model was verified against data from flow monitors and observed CSO spill frequencies into the Burry Inlet
To begin with a traditional sewer storage solution was proposed that would result in an average 10 spills a year into the shellfish water from all 90 CSOs in the two catchments Although this reduced spills and dealt with some of the flooding and growth issues the storage requirements would have been unaffordable provide no protection against long term climate change and would not tackle the fundamental problem of too much surface water getting into the combined network
An alternative approach based on the reduction and removal of storm water from the combined sewer system was also developed This was in accordance with Dŵr Cymru Welsh Waterrsquos Rainscape50 (surface water elimination and reduction) strategy To identify areas with the most
48httpevidenceenvironment‐agencygovukfcermenDefaultHomeAndLeisureFloodsWhatWereDoingIntoTheFutureScience ProgrammeResearchAndDevelopmentFCRMProjectaspxProjectID=15515be8‐bbed‐4204‐ae56‐3e810ba47694ampPageID=56bad68e‐dcb1‐4bf8‐84cc‐cbfd03ab63a2 49 httpwwwciwemorgmedia674511Paper20820Stephen20Ollierpdf 50httpwwwdwrcymrucom_libraryleaflets_publications_english
205240txt012|May 2013
38
Drainage Strategy Framework
potential for effective storm water removal a flowareaflooding thematic map was developed This was used to focus attention on areas which would deliver the most benefit if storm water removal was carried out These areas are coloured red in Figure 16
Figure 16 Thematic map showing areas of maximum potential for storm water removal
The following interventions (181 in total) were combined into single strategy to be delivered in phases by 2015 2020 and afterwards
bull The management of surface water through swales basins and soakaways rather than through combined sewers resulting in new amenity and ecological areas within the built‐up environment
bull Implementing smarter flow control to better use existing storage and conveyance assets bull Relining of sewers to prevent groundwater ingress bull Removal of land drainage connections to sewers bull Household rainwater harvesting retrofit schemes
surface_water_management_strategypdf
205240txt012|May 2013
39
Drainage Strategy Framework
Figure 17 is an artistrsquos impression of what one of the sustainable urban drainage system solutions may look like
Figure 17 Example retrofit SuDS solution proposed for Gowerton and Llanelli
Modelling has demonstrated that the alternative strategy will achieve the same CSO reduction benefit as the storage strategy together with flooding improvements and additional less tangible benefits at significantly lower cost than the traditional sewer storage solution
Figure 18 illustrates the dispersed nature of solutions identified for central Llanelli
Figure 18 Water sensitive urban design interventions planned for central Llanelli
205240txt012|May 2013
40
Drainage Strategy Framework
Appendix A
Glossary
205240txt012|May 2013
Drainage Strategy Framework
Appendix A Glossary
CAPEX Capital expenditure Appointed water and sewerage companiesrsquo spending on new replacement or refurbished capital assets such as construction or buying machinery
CIWEM Urban Drainage Group (WaPUG) A group of the Chartered Institution of Water and Environmental Management supporting professionals working in urban drainage
Combined Sewer Overflow (CSO) The discharge of untreated sewage diluted with storm water into rivers and the sea CSOs occur during heavy rain and are necessary to reduce the risk of sewer flooding The physical overflow structure is also called a CSO
Common Framework for Capital A planning approach developed for the water and Maintenance Planning sewerage companies in 2002 which provides a robust basis
for assessing future capital maintenance needs The approach is consistent with the needs of Ofwat
Defra The Department for Environment Food and Rural Affairs The Government Department with responsibility for water flooding and water quality in England
Drainage Area Plan (DAP) A detailed plan for a drainage catchment that prioritises a list of interventions based on risk using an approach established in the WRc Sewerage Rehabilitation Manual This approach has been succeeded by Sewerage Risk Management which guides the preparation of Sewerage Management Plans (SMP) Companies vary in how they prepare DAPs or SMPs (or their equivalents) following the general principles that have been established
Drainage Strategy Developed by water and sewerage companies to demonstrate how outcomes will be delivered in drainage catchments over the long term Drainage Strategies will use the information developed in producing a DAPSMP and if a drainage strategy has been produced this should be the starting point in producing a more detailed DAPSMP should this be required It is likely that the activities required to prepare DAPSMP and Drainage Strategies may overlap Drainage Strategies might not refer to specific interventions but instead outline a general approach
Drainage Strategy Framework Guidance to describe the contents and intention of Drainage Strategies
205240txt012|May 2013
Drainage Strategy Framework
Flood Risk Management Plans Required by the Flood Risk Regulations in Flood Risk Areas by December 2015
Flood Risk Regulations The legislative instrument used to implement the requirements of the Floods Directive in England and Wales
Floods Directive DIRECTIVE 200760EC of the European Parliament and of the Council of 23 October 2007 on the assessment and management of flood risks
Lead Local Flood Authority (LLFA) The Shire County or unitary authority with responsibility for managing local flood risk
Local development plans Developed by planning authorities to explain where and what type of development (new homes and businesses) will occur within their area They are required to explain water infrastructure needs to support this development
Local Flood Risk Management Strategy Developed by the Lead Local Flood Authority to explain (LFRMS) how local flood risk will be managed by the Authority and
in partnership with others
Natural Resources Wales From 1 April 2013 Natural Resources Wales (NRW) a new body formed by the Welsh Government will take over the functions previously carried out by the Environment Agency (EA) in Wales alongside those of the Forestry Commission Wales and the Countryside Council for Wales
Ofwat The Water Services Regulation Authority ndash the economic regulator of the water and sewerage companies of England and Wales
OPEX Operating expenditure Appointed water and sewerage companiesrsquo day‐to‐day spending on running the services for example staff costs and power This is likely to include investment in joint projects that do not create or relate to an asset that the company solely or jointly owns
Outcomes Outcomes are the higher level objectives that a companyrsquos actions are intended to deliver A companyrsquos outcome should reflect its customersrsquo priorities identified through appropriate customer engagement and deliver the best long‐term sustainable solution for customers and the environment An outcome may not be bound by a single price control period and should be set in the context of customersrsquo and the environmentrsquos long‐term needs
205240txt012|May 2013
Drainage Strategy Framework
Price Review The process of setting appointed water and sewerage companiesrsquo price limits The next price review will take place in 2014 for the period 2015‐20 Ofwat currently sets price limits every five years
Real Time Control (RTC) Using actuated pumps gates and weirs to actively control flow in sewers Better use can be made of existing infrastructure and links can be made between network treatment and receiving water systems for operational benefits Sometimes referred to as Active Management
River Basin Management (Plans) River Basin Management is a continuous process of planning (to develop River Basin Management Plans) and delivery The Water Framework Directive introduces a formal series of 6 year cycles The first cycle will end in 2015 when following further planning and consultation the River Basin Management Plans will be updated and reissued
Sewerage Management Plan A risk based approach to indentifying investment needs in sewerage systems as described in the Sewerage Risk Management (SRM) approach developed by WRc plc
Storm water retrofit Releasing capacity in sewers by controlling stormwater at the surface using disconnection swales and other sustainable drainage systems (SuDS)
205240txt012|May 2013
We are the Environment Agency We protect and improve the environment and make it a better place for people and wildlife We operate at the place where environmental change has its greatest impact on peoplersquos lives We reduce the risks to people and properties from flooding make sure there is enough water for people and wildlife protect and improve air land and water quality and apply the environmental standards within which industry can operate Acting to reduce climate change and helping people and wildlife adapt to its consequences are at the heart of all that we do We cannot do this alone We work closely with a wide range of partners including government business local authorities other agencies civil society groups and the communities we serve
wwwenvironment‐agencygovuk
Environment Agency National Customer Contact Centre
Telephone 03708 506 506 enquiriesenvironment‐agencygovuk
Ofwat (The Water Services Regulation Authority) is a non‐ministerial government department We are responsible for making sure that the water and sewerage sectors in England and Wales provide consumers with a good quality and efficient service at a fair price
wwwofwatgovuk
Telephone 0121 644 7500 mailboxofwatgsigovuk
Halcrow Group Limited Burderop Park Swindon Wiltshire SN4 0QD
tel 01793 812479 fax 01793 812089 halcrowcom
Halcrow Group Limited is a CH2M HILL company Halcrow Group Limited has prepared this report in accordance with
the instructions of The Environment Agency for the clientrsquos sole and specific use Any other persons who use any information contained herein do so at their own risk

Drainage Strategy Framework
221 Recommended good practice
No Good practice Example references
1 Data analysed and used in the development of the strategy related to asset location dimensions condition failure and flood and pollution incidents should be assigned a confidence grading The confidence grading should be related to its accuracy completeness compatibility credibility and currency
Models used to predict blockages and collapses flooding locations polluting discharges and water quality impacts should be assigned a confidence grading based on their accuracy completeness compatibility credibility and currency
Model predictions should be assigned a confidence grading depending on the confidence in the model and whether it is being applied outside of its verification range (eg for extreme events or for atypical geographies)
The purpose of confidence grading data and model results used in strategy setting is to understand the likelihood that outcomes will be achieved in a cost efficient manner Where the outcomes remain uncertain knowledge of data confidence can be used to target improvement programmes
SRM5 (S3‐03‐17) refers to Ofwatrsquos method for recording the reliability and accuracy of regulatory data in bands A to D
The SWMP guidance (Section 319) describes an alternative system of grading data and model results
2 Use the Drainage Strategy to justify data and model improvement programmes This should be focussed on areas where risks are currently (or predicted to be) high and uncertainty in data or models reduces the ability to determine robust operational or capital solutions Poor model verification in high risk areas would be an indicator that model improvements were required
CIWEMrsquos urban drainage group has published a series of guides on hydraulic and water quality modelling They discuss model calibration verification and uses
SRM5 (S3‐04) describes how to determine where the current assessment of risk is sufficient to proceed or whether data and models should be improved
3 Improve understanding of network performance (and improve models) by using long term flow and level monitoring on sewers and CSOs
Yorkshire Water discusses its CSO
monitoring programme here
4 Demonstrate how the uncertainty in both the underlying datamodels and in the future projections is addressed in options appraisal Consider if this should be done implicitly (eg through choosing conservative assumptions) or explicitly through the use of sensitivity analysis or scenario testing
Treasury Green Book supplementary guidance illustrates how to accommodate climate change uncertainties
205240txt012|May 2013
19
Drainage Strategy Framework
No Good practice Example references
5 Population growth new homes and businesses climate change and urban creep combine to make the future highly uncertain but will almost certainly increase flooding and pollution risks from drainage systems Use the Drainage Strategy to explore different scenarios (combining the impact of these drivers) for a near term (le 10 years) and future (ge 30 years) epoch
For example combine modest growth and slight climate change (a low impact case) and contrast with high growth and significant climate change (a high impact case) Where the location of significant new development is unknown include scenarios accommodating different possibilities
Running multiple scenarios is time consuming and costly A risk based approach should be adopted to focus efforts where flooding and pollution risks are especially sensitive to changes in demand
UKWIR has published research on accounting for climate change35 and urban creep36 in sewerage planning together with more general advice on accommodating climate change in water asset management planning37
Ofwat has published research38
predicting the combined impacts of climate change urban creep and development on a national basis
6 In the face of significant uncertainties about future demands on the drainage system and their consequences the Drainage Strategy should identify low‐regrets interventions (ie ones that are robust no matter what the future holds) and ensure that solutions can be adapted if greater certainty is achieved For example through quickening the pace of SuDS retrofit activities or using (previously identified and secured) land to extend underground storage facilities Strategies which remove surface water from sewerage networks provide lsquoheadroomrsquo for unpredictable increases in demand from population and climate change
Designing Resilient Cities A guide to good practice DR Lomardi et al HIS BRE Press
7 Post project appraisal and cost monitoring should be used to capture real costs and performance so that Strategies can be updated and improved with latest information It is especially important to collate and understand the whole life costs of new technologies where industry understanding is currently poor
35httpwwwukwirorgreports03‐cl‐10‐09042794658901799019890198 (poundpound) 36httpukwirforefront‐librarycomreports10‐wm‐07‐1493273 (poundpound) 37httpukwirforefront‐librarycomreports12‐cl‐01‐1694816900019015590145901409465890155 (poundpound) 38httpwwwofwatgovuksustainabilityclimatechangerpt_com201106mottmacsewerpdf
205240txt012|May 2013
20
Drainage Strategy Framework
222 Good practice example ndash Severn Trent Waterrsquos MICAS
Severn Trent Water has developed a process to measure confidence in hydraulic models of sewer systems Modelling Investment Confidence Assessment Scoring (MICAS) was developed to provide an objective evaluation of model confidence It uses information stored in the hydraulic model about the provenance of each data element and the quality of model verification Before the approach was developed the assessment of lsquofitness for purposersquo of models was subjective and based on modellers judgment This was not always reliable and certainly not repeatable and transparent MICAS provides an objective assessment of hydraulic model quality which can be used to inform its use and prioritise improvements to input data and model verification
Figure 7 and Figure 8 illustrate how an understanding of model confidence from the MICAS assessment (right hand side images) can be used to interpret predictions of flooding (left hand side images) In Figure 7 areas at predicted high risk of flooding (red in the left hand side image) are shown to be in high confidence areas of the hydraulic model (green in the right hand side image) In contrast in Figure 8 areas at predicted high risk of flooding (red in the left hand side image) are shown to be in poor confidence areas of the hydraulic models (orange in the right hand side image) In the latter case this information is used to identify where further model improvements would be beneficial
Flood Risk MICAS
Figure 7 Modelled flood risk and MICAS confidence scores (high model confidence)
Flood Risk MICAS
Figure 8 Modelled flood risk and MICAS confidence scores (lower model confidence)
205240txt012|May 2013
21
23
Drainage Strategy Framework
Principle Three Risk Based
Strategies should be risk based This means that planning operational and investment activities should be based on consideration of the probability and consequence of inadequate drainage function (risks) as these relate to the achievement of measures that demonstrate delivery of outcomes A risk based Strategy ensures that investment is made where risks are the greatest
To aid communication risks should be visualised through maps and plans (Figure 10 is an example) To aid risk assessment risks should be monetised combined and predicted into the future To aid options appraisal the impact of interventions on the level of risk should be predicted
The approach to Drainage Strategy development should be risk based itself The degree of detail included should be related to an understanding of the overall level of risks in the catchment now and in the future
231 Recommended good practice
No Good practice Example references
1 Determine where a Drainage Strategy is required by combining current performance with external influences likely to result in deteriorating performance This stage requires no modelling or detailed assessment On a catchment‐by‐catchment (drainage area) basis understand current risks by collating data on current performance eg blockages collapses pumping station failures pollution incidents CSO spills storm tank spills internal flooding incidents external flooding incidents and infiltration rates Relate these risks to performance indicators and the achievement of outcomes Combine with information about known growth rates predictions of urban creep quantity of newly adopted lsquoprivatersquo sewers surface water flooding risks (eg from flood map for surface water) WFD water body status and bathing water status Prioritise catchments with high current risks andor factors suggesting that risks are likely to worsen significantly in the future Consider normalising scoring method for size of catchment (eg by unit area or unit length of sewer) Consult with stakeholders to confirm correct prioritisation Commence with development of Drainage Strategies for the highest ranked catchments Periodically revisit prioritisation (updating with new data) to check that priorities are still correct
The initialisation stage of a Sewer Management Plan (SMP) (described in SRM5) considers how a risk assessment can be used to prioritise which spatial units (eg catchments) should be prioritised for a SMP study
2 Visualise catchment risks (from 1) to illustrate and explain to partners the reasons for prioritisation Accommodate their views amp consider changing prioritisation to aid wider drainage planning requirements (eg increase prioritisation of a catchment with significant surface water flooding problems where close collaboration between water and sewerage company and LLFA will benefit the community)
205240txt012|May 2013
22
Drainage Strategy Framework
No Good practice Example references
3 Clearly relate sewerage risks to the performance indicators that will be used to measure progress towards achieving outcomes eg relate blockage rates to flooding and pollution incidents eg relate increase in flows to increased CSO frequency breaches of permit conditions and deterioration in receiving water quality Adopt a sourcendashpathway‐receptor model and workshop techniques to ensure that cause effect and consequences are fully captured Use performance indicators as the basis for a comprehensive risk assessment that considers likelihood (frequency) and consequence (extent degree and duration of impact) of failure expressed as risk scores Monetise risks in GBP (pound) to align with principle four (whole life costs amp benefits) Use (verified) predictive models to understand near term (lt10 years) and long term (gt30 years) risks The latter to align with principle four (whole life costs amp benefits) Align complexity of method with level of risk recognising the needs of partners eg use complex 2D flood routing models to ascertain (with greater certainty) flood mechanisms and damages where the quantity and frequency of flooding is high and interventions will be complex and costly Elsewhere more simple approaches are appropriate eg use complex UPM3 water quality modelling methods where compliance with river standards or discharge consents is already failing or is expected to do so Elsewhere more simple approaches are appropriate Combine risk scores from different risks to describe the total level of risk in a catchment Use visualisation techniques to communicate combined level of risk Combine analysis from hydraulic blockage and asset deterioration models on a catchment basis In hydraulic analysis consider flooding performance for rainfall events beyond the usually provided standard of protection to understand performance in extreme events in support of partners (especially LLFAs) and in search of cost beneficial interventions at a higher standard than normal
SRM 5 (S3‐03) details approaches to simple and more complex approaches to risk assessment that are consistent with CMPCF guidelines
4 Be alert to interactions between sewer networks and wastewater treatment plans eg by modelling the impact of changing sewer flows on wastewater treatment worksrsquo performance and costs Consider combined impact of different catchments on a single or linked water body (eg an inland river bathing water or shell fishery)
UPM3 guidance discusses approaches to understanding these interactions and applying more complex water quality impact models
5 Establish systems and apply methods to predict how interventions can reduce risks eg how a targeted and pro‐active maintenance can reduce the occurrence of sewer blockage and flooding from lsquoother causesrsquo eg how reducing infiltration can reduce CSO spills eg how reducing connected impermeable area can reduce sewer flooding
205240txt012|May 2013
23
Drainage Strategy Framework
232 Good practice example ndash United Utilities risk assessment
United Utilities has demonstrated a robust risk based approach in the development of sewerage management plans used for long term planning across their area of operations
Hydraulic models were applied in 235 catchments and configured to look at future performance and to evaluate the consequences of inadequate capacity Starting from a baseline of 2010 versions of the models were built for 2020 and 2036 epochs The following model input parameters were adjusted population water consumption infiltration planned development known sewerage improvement projects urban creep rainfall (for climate change)
Two‐dimensional (2D) modelling was used to consider the consequences of sewer flooding resulting from the changes made to reflect the future operating environments As well as the impact on homes and business (from internal and external flooding) the flood risk to critical infrastructure was also considered The operation of CSOs was considered by computing the annual spill volume duration and frequency
Finally predictions of the likelihood and consequence of sewer failure were added taking account of sewer material age and the incident records relating to similar assets
All these data were combined and weighted to generate a Sewer Management Plan (SMP) Risk Score for each length of sewer The process is illustrated in Figure 9
Figure 9 United Utilitiesrsquo process for calculating risk score in sewerage catchments
205240txt012|May 2013
24
Drainage Strategy Framework
Risk scores were summed spatially and monetised so that high priority locations could be identified Mapping and visualisation were used to communicate the results of this assessment priority areas for further investigation and how risks change through time (Figure 10)
Figure 10 Visualisation of sewerage risks
233 Good practice example ndash Northumbrian Water risk assessment
Northumbrian Water completes an annual assessment of hydraulic capacity in its sewerage network at the drainage area scale Its approach does not require hydraulic models to have been completed and yet can reliably highlight areas of under‐capacity in need of further investigation through more detailed analysis including hydraulic modelling New and emerging risk areas can also be identified by applying data for population growth which occurs through development lsquoWhat ifrsquo scenarios can be run to test when capacity limits may be overcome and flood risks potentially set to increase It demonstrates good lsquorisk basedrsquo planning principles because it shows the drainage planner where more detailed analysis is warranted
The approach uses the following data from company records population connected to sewer P water consumption rate G (lhd) trade discharge E (ls) pipe diameter and gradient pipe connectivity CSO consent pass forward rate (ls) pumping station rate (ls) sewage treatment flow rate (ls) A wastewater dry weather capacity map calculates pipe full capacity dry weather flow (PG+E+I) and Formula A flow for fully combined (1360P+2E+DWF) and separate (4PG+3I+E) areas of the network Infiltration (I) is assumed to be 50 PG +E
205240txt012|May 2013
25
Drainage Strategy Framework
A theoretical assessment of network capacity is then calculated by comparing Formula A with pipe full capacity flow consent values at CSOs and wastewater treatment works and pumping rates This determines areas of the network with a capacity shortfall with a potential capacity shortfall and with no capacity shortfall
When run across the whole company area approximately 100 out of 500 drainage areas were found to be under capacity Over 60 of these areas had recorded sewer flooding incidents In over 300 drainage areas there was no forecast capacity shortfall Only 7 of these drainage areas had recorded sewer flooding incidents Overall the system proved to be very reliable at predicting drainage areas likely to have sewer flooding problems because of sewer under‐capacity
In under capacity drainage areas an intermediate (hydraulic model based) assessment is then carried out Figure 11 shows the results thematically mapped for an example drainage area Red areas are predicted to have a very high risk of sewer flooding Yellow and green areas are predicted to have a low risk of sewer flooding
Figure 11 Example of a drainage area capacity map
205240txt012|May 2013
26
24
Drainage Strategy Framework
Principle Four Whole Life Costs and Benefits
Strategies should be informed by consideration of whole life costs and benefits They should promote a series of interventions which in view of the quantified uncertainties are most likely to result in performance indicators which demonstrate the achievement of outcomes at lowest cost to customers and the community more widely
Costs relate to capital and operational expenditure to deliver interventions and the monetised impacts of drainage failures such as flooding and pollution
Benefits relate to the reduction in risks from drainage failures such as flooding and pollution but should also include wider societal impacts such as those calculated using a lsquoPayments for Ecosystems Servicesrsquo approach
When considering the lsquowhole lifersquo the strategy should consider climate population and asset deterioration trends These are likely to increase risks over the long term if no interventions are made The strategy should state lsquowhatrsquo should be done but also broadly lsquowhenrsquo and in what sequence interventions should happen
241 Recommended good practice
No Good practice Example references
1 Predict risks into the future for at least two epochs le10 years (to understand what the company needs to do now and how this fits with longer term outcomes) and ge30 years to understand long term needs in light of changing population and other pressures
Account for the following changes in demand
bull Growth ‐ new homes and businesses
bull Urban creep ndash uncontrolled addition of connected impermeable area
bull Climate change ndash affecting design events (flood predictions) time‐series (CSO and treated effluent quantities) river flows and temperatures
bull Infiltrationexfiltration ndash through deteriorating sewer condition
bull Dry weather flows ndash through changes in water consumption rates
2 Combining monetised risks (associated with sewerage failures) determine whole life costs for a lsquodo nothingrsquo scenario (ie no interventions)
Include costs associated with electricity consumption (in the network and at the wastewater treatment works) and CO2 emissions
UKWIR will publish in 2014 a revision to their Long Term Least Cost Planning for Wastewater Supply‐Demand
guidance This may provide tools and methods for expressing costs and benefits to support the development of a Drainage Strategy
205240txt012|May 2013
27
Drainage Strategy Framework
No Good practice Example references
3 Test intervention strategies which keep performance indicators on track to deliver outcomes by adding capacity (supply) reducing flows (demand) or altering operational regimes
Include the costs of interventions and the benefits of reduced risks to inform selection of the most cost beneficial strategy over the whole life
Have regard to the timing of interventions recognising that uncertainty may require low‐regrets (insensitive to uncertainty) solutions and that delaying major interventions may be more affordable and attractive in the short term Discounting should be used to compare the costs and benefits of interventions occurring at different times
Recognise that some interventions will be obligatory and defined (eg maintenance of a spill frequency standard at a CSO) whilst others will be more discretionary focused on achieving outcomes rather than specific outputs
SRM5 (Section 8) defines and contrasts cost benefit analysis cost effectiveness analysis whole life cost analysis and risk cost benefit analysis
HM Treasury Green Book39
sets out a framework for the appraisal of long term projects which can be applied to the development of a Drainage Strategy
4 Donrsquot at first be concerned with the distribution of costs and benefits between partners who may be sharing costs Identify the most cost beneficial solution first and then debate and agree an equitable sharing of costs
Give equal weighting to OPEX (operating expenditure) and CAPEX (capital expenditure) costs so not to cause bias towards capital intensive solutions Properly consider the costs and benefits of pro‐active maintenance regimes and campaigns to influence customers to reduce fats oils and greases (FOG) build‐ups and the misuse of sewers
Consider the affordability of solutions the impact on customersrsquo bills and the resources of other organisations to play their part
UKWIR research outputs40 in 2013 (SW01) will provide a framework for making a business case for separating storm water from combined sewers
5 Where interventions include the provision of green space public amenity and improved habitats then Payment for Ecosystem Services approaches should be used to identify further monetised benefits in the appraisal Customers should be consulted to help value these benefits
Supplementary Green Book41
guidance describes methods for accounting for environmental impacts including the ecosystems approach
39 httpwwwhm‐treasurygovukdata_greenbook_indexhtm 40 httpwwwukwirorgpublishorsystemcomponent_viewaspLogDocId=96116 41 httpwwwhm‐treasurygovukdaccounting_environmental_impactspdf
205240txt012|May 2013
28
Drainage Strategy Framework
242 Good practice example ndash Severn Trent Water making the case for surface water separation in Stoke-on-Trent
In this example42 Severn Trent Water compared alternative ways of addressing sewer flooding problems by looking at a range of costs and benefits not all of which were directly associated with its specific responsibilities as a water and sewerage company Whilst the example does not express a monetised value for all costs and benefits over the whole life it does illustrate the types of factors which could be included in an appraisal of this type scaled to address problems at a catchment level It also demonstrates how working collaboratively can help identify solutions which are cost‐beneficial for the community at large
In an area of Stoke served by a combined sewer system five properties were at risk from sewer flooding in cellars for events equal to and less frequent than the 1 in 10 year probability A conventional sewer pumping station based solution was presented as the standard option
However a nearby former hospital site was also undergoing re‐development which would result in reduced runoff to the combined sewer The new drainage regime in the redevelopment site was sufficient to remove the flood risk at the five properties (this was a do nothing strategy)
A third option completely separated the development site runoff from the combined sewer and also addressed local flood risk issues nearby The solution required a new storm sewer and a network of swales and other SuDS features connecting with an ordinary watercourse
Table 1 illustrates how costs and benefits were compared across the three alternative strategies Each provided the same benefit in terms of the number of homes (5) relieved from sewer flooding The novel SuDS and surface water management solution additionally gave local flood risk relief to 3 further properties The separationSuDS strategy came at a higher capital cost but delivered greater social cost benefits savings in annual operating costs and a bonus improvement water quality (because of reduced CSO spill volume) Severn Trent selected the separation SuDS solution because the higher capital costs were offset by other benefits
Table 1 Costs and benefits of drainage improvements in part of Stoke-on-Trent
Do nothing Standard option
SuDS
Sewer flooding benefits 5 5 5
Other flooding benefits 0 0 3
Change in runoff to combined sewer (m3year) 0 0 ‐40000
Estimated cost (pound) 0 168000 419000
42httpwwwciwemorgmedia695460Paper203_Creating20Sewer20Capacity_Presentation2 0by20Mike20Woodpdf
205240txt012|May 2013
29
Drainage Strategy Framework
Do nothing Standard option
SuDS
Social Cost Benefit (pound) 16000 5000 51000
Change in electricity costs (poundyear) 0 +75 ‐525
Programme impact (years to deliver solution) + 4 0 +4
CSO spill volume (m3 in 1year event) +298 0 ‐397
243 Good practice example ndash New York City comparison of grey and green infrastructure drainage strategies
This example is taken from New York in the United States of America Itrsquos an illustration of how whole life costs have been compared for alternative strategies to solve urban drainage issues on a mega‐city scale The key data are summarised in Table 2
Table 2 Comparing drainage strategies in New York
Grey Strategy
Green Strategy
CSO spill volume reduction (billion gallons year)
101 122
Wider benefits over 20 years ($ million) 0 139 to 418
Whole life costs over 20 years ($ billion) 68 53
The information is taken from the New York City Green Infrastructure Plan43 produced by the Mayorrsquos Office in 2010 The Plan (and recent updates) provides a comprehensive evidence base around costs and benefits of different approaches to address the cityrsquos drainage problems It is therefore an excellent example of how drainage strategies can be described in plain language for a non‐specialist audience concerned with their environment and the cost of providing infrastructure to enhance it
It is becoming commonplace for North American cities (eg Portland and Philadelphia) to address the issue of frequent combined sewer overflow (CSO) operation by using a combination of grey infrastructure (sewers) and green infrastructure (sustainable drainage systems) The wider health
43 httpwwwnycgovhtmldephtmlstormwaternyc_green_infrastructure_planshtml
205240txt012|May 2013
30
25
Drainage Strategy Framework
and ecological benefits of green infrastructure approaches and the reduced reliance on materials and energy are attractive to utility planners and cities alike
New York has 422 CSOs and an agreed Long Term Control Strategy to significantly reduce the impact wet weather discharges have on aquatic systems throughout the city Annual discharges are currently (2010) estimated to be 30 billion gallons (114 million cubic meters) per year Building on existing and committed new sewer plans an agreed grey infrastructure based strategy to this problem is set to reduce these discharges to 198 billion gallons per year (a 34 reduction) by the 2030s An alternative green infrastructure approach based around intercepting the first inch (25mm) of rainfall across 10 of the impermeable city area by 2030 is predicted to reduce CSO spills to 179 billion gallons per year
Planners have calculated that the whole life costs after 20 years of the grey infrastructure solution will be $68 billion (2010 prices) compared to the green infrastructure whole life costs of $53 billion The green infrastructure strategy reduces CSO spills by more than the grey alternative for $15 billion less in terms of whole life cost Further planners have calculated that New Yorkers will benefit by up to $41844 million (accumulated over 20 years) in additional benefits associated with lower energy bills from control of urban heating increased property values and improved health
Based on this analysis New York City has committed itself to an aggressive green infrastructure based runoff control strategy to provide long term reductions in CSO spills The plan is to achieve interception of 15 of impermeable area by 2015 4 by 2020 7 by 2025 and 10 by 2030
Principle Five Live Process
The Strategy should be adaptable and periodically reviewed Whilst outcomes are expected to be relatively stable over time the pace at which the Strategy delivers outcomes will be linked to volatile influences (like climate and population change) and to the decisions made at each price review about the priorities for the following period The Strategy should be reviewed at regular intervals to reflect investments already made the changing priorities of the water and sewerage company and partners and the presence of emerging risks The review is also an opportunity to report drainage catchment performance relative to performance measures designed to monitor progress towards achieving outcomes
44 Estimated using methods from the New York Municipal Forest Resource Analysis (MFRA) prepared by the US Dept of Agriculture
205240txt012|May 2013
31
Drainage Strategy Framework
251 Recommended good practice
No Good practice Example references
1 Regularly repeat screening exercise to determine catchments requiring a Drainage Strategy and modify programme of Strategy development accordingly
Check for changes in measured rates of flooding and pollution incidents blockages collapses pumping station failures etc
Check for changes in extent and location of new development
Check for activities being undertaken by partners (eg redevelopment urban realm improvements and flooding and pollution management activities)
SRM5 illustrates how improved and updated knowledge of system performance should be applied to establish Strategies
2 In lsquolive Strategiesrsquo repeat risk assessment when data and models improve and adjust confidence scores accordingly
Confirm that Strategy will still achieve performance indicators and outcomes at least cost Revise Strategy as necessary
3 Periodically refresh Strategy accommodating impact of interventions already delivered using re‐verified predictive tools as appropriate
Confirm that Strategy will still achieve performance indicators and outcomes at least cost Revise Strategy as necessary
Triggers for a wholesale review of the Strategy are likely to be significant changes to the location or extent of planned development
4 Monitor report and share (with partners) the measures used to demonstrate delivery of outcomes Example measures may include the number of properties which experience sewer flooding the number of properties at risk of flooding the number of properties at risk from sewerage asset failure risk indices that capture both the probability and consequence of failure customer satisfaction with regards to clean rivers and beaches the number of pollution incidents the frequency of combined sewer overflow operation and compliance with discharge permit conditions
252 Good practice example ndash Thames Water live DAP
Thames Water has initiated a DAP (drainage area plan) Live approach Itrsquos a good example of how companies are continuously monitoring and updating the status of drainage area risks It provides a lsquoliversquo snapshot of the current health of all drainage areas in Thames Waterrsquos region allowing real time planning as part of a strategic approach It enables drainage planners to view the effectiveness
205240txt012|May 2013
32
Drainage Strategy Framework
of intervention strategies and compare incident rates across varying geographies and development types in the Thames Valley
DAP Live will be available for all catchments in the Thames Water area thus enabling
bull high level monitoring of risks across the business bull a live and strategic review of catchment performance bull prioritisation of catchments based on risk and bull an ability to share data with partners collaborating in drainage planning and improvements
Figure 12 illustrates the types of data managed through the DAP Live system These include asset data political and drainage boundaries environmental data operational data property amp growth data and modelling data As new data become available the DAP Live system is updated so that drainage planners have the most current view on emerging risks and issues
Asset data
Operational data
Property and growth data
Modelling data
Environmental data
Boundaries (SDACs operational political)
Figure 12 Data types held in the DAP Live system
Figure 13 illustrates how the system can provide analysis at a variety of scales from local authority boundaries sewage treatment works catchments drainage areas or a regular grid
205240txt012|May 2013
33
Drainage Strategy Framework
NE PROVINCES
WESTERN PROVINCES
NE LONDON bull Ops areas local W LONDON
SE LONDON authorities Large TIDWORTH SE PROVINCES
bull STW Catchments
bull Drainage areas(SDACs)
bull Regular grid Small
Figure 13 DAP Live reporting performance at different scales
205240txt012|May 2013
34
Drainage Strategy Framework
253 Good practice example ndash Wessex Water Water live data
Wessex Water is regularly using data geospatially to proactively identify and respond to risk Theirs is a good example of how data can be used to provide an adaptable approach that is regularly reviewed to plan investment
The risk‐based and live approach uses a set of likelihood and consequence models which are built up from all currently available data asset data (eg CCTV data material age) operational data (eg flooding and pollutions incidents) and information (eg locality near hospital or downstream of an overflow) All these data are collated for the entire Wessex region updated regularly and analysed geospatially
Figure 14 Sewer risk scores presented in a risk matrix and geospatially
This allows a risk score (Figure 14) to be calculated for each mapped sewer length which directs investigation more efficiently by allocating each mapped sewer a planned CCTV inspection date
This risk‐based approach has been successful in targeting problematic sewers increasing identification rates threefold Density analysis is performed using asset failure and operational information which allows planning of both proactive structural and operational investment
Proactively found structural issues are far more cost effective to repair before failure and can also prevent serviceability issues
205240txt012|May 2013
35
f
DDrainage Strateegy Frameworrk
Figgure 15 Hotsppot analysis
Thhe hotspot annalysis (Figuure 15) showss where operrational clustters have beeen calculatedd This hootspot analyssis is made aavailable on tthe Wessex WWater corporrate GIS to a llow operati onal staff to target their effforts to mitiggate against ffurther repeaat incidents AAdditional innformation ffrom asset annd operationnal activities ccan be addedd regularly too the databasses which drrive the mod els enabling rissk scores to bbe kept as livve as require d
226 Prrinciple Sixx Innovativve and Susstainable SSolutions
Thhe Drainage Strategy Fraamework proomotes the fuull evaluationn of alternatiives to tradit ionally enngineered sewwerage soluttions to test wwhether thesse offer loweer whole life ccost options or better reesponses to uuncertainty It is anticipaated that draainage solutioons of the futture will be ddifferent froom the ones we are usedd to
Thhese should iinclude (at leeast at a highh level) real ttime control storm waterr retrofit techhniques edducation to eenable custommers to changge behaviou r enhancingg incentives for customerss to reduce suurface water flowing to seewers and innnovative pe rmitting arraangements a cross drainagge networks annd sewage tr eatment worrks Water annd sewerage companies sshould continnue to revieww and deevelop other innovative ssolutions
Foor example wwhere a commpany may hiistorically haave preferredd to tackle seewer floodingg or coombined sewwer overflow pollution byy increasing iits undergrouund equipmment to store mmore rainfalll duuring stormss it might connsider other options in fuuture ndash such as working wwith custommers to mmanage the raainfall close tt eventing it foorm enteringg the sewer syystem o source pre
2205240txt012|Mayy 2013
36
Drainage Strategy Framework
261 Recommended good practice
No Good practice Example references
1 Use cost‐benefit methods to demonstrate that innovative and sustainable solution types provide best value for customers and the wider community
UKWIR will publish new research and guidance in 2013 addressing active control and storm water removal demonstrating how these technologies can be justified and included within Drainage Strategies
2 Consider integrated water resource management Work with partners (especially developers and local authorities) to examine whether use of stored stormwater reduces potable water consumption AND need for capacity in sewers
CIRIA has published a scoping study for water sensitive urban design45 in the UK
3 Consider a mix of conventional and new technologies using more adaptive approaches as low‐regrets responses to uncertainty eg prevent current sewer flooding with underground tank storage but address future risks (worsened by climate change) with retrofit SuDS implemented progressively
CIRIA has published lsquoRetrofitting to manage surface waterrsquo46 a comprehensive guide to planning and delivering this type of project
4 Use carbon accounting methods to compare embodied and emitted carbon in alternative intervention strategies so that these impacts are accounted for in whole life costs
Consider the benefits of surface water removal on the costs (including carbon) of pumping and sewage treatment
UKWIR47 has and continues to publish detailed guidance on carbon accounting for water and sewerage company use
45httpwwwciriaorgserviceresearch_informationAMContentManagerNet ContentDisplayaspxSection=research_informationampContentID=23581 46httpwwwciriaorgSERVICEHomecoreordersproductaspxcatid=5ampprodid=1909 47httpukwirforefront‐librarycomreports08‐cl‐01‐6923419000190269902659465890269
205240txt012|May 2013
37
Drainage Strategy Framework
No Good practice Example references
5 Where interventions include the provision of green space public amenity and improved habitats then Payment for Ecosystem Services approaches can be used to claim further monetised benefits in the appraisal Customers should be consulted to help value these benefits
The Environment Agency will publish data in 2013 on costs and benefits of retrofit stormwater projects to promote understanding and uptake
6 Share data within the industry on innovative solutions to increase knowledge of new technology and SuDs approaches
EA retrofitting SuDs costs and benefits database48
accommodating data from Ofwat AMP5 SuDS pilot initiative and other examples
262 Good practice example ndash Welsh Water surface water reduction and removal strategy for Gowerton and Llanelli
Dŵr Cymru Welsh Water and partners are applying innovative storm water removal methods to address capacity problems in the sewer network in Gowerton and Llanelli49 (population 140000) Current under capacity leads to localised sewer flooding and excessive combined sewer overflow (CSO) spill to the Burry Inlet a protected shellfish water and special area of conservation The capacity problems in the system were a concern for the Environment Agency (Wales) and there was a risk of widespread restrictions to economic development being imposed Dŵr Cymru Welsh Water Carmarthenshire County Council City and County of Swansea Consumer Council for Water Environment Agency Wales and the Welsh Government all worked in partnership to resolve the situation
A brand new hydraulic model was built for the entire sewerage network with particular attention paid to accurately representing the sources of storm run‐off and infiltration The model was verified against data from flow monitors and observed CSO spill frequencies into the Burry Inlet
To begin with a traditional sewer storage solution was proposed that would result in an average 10 spills a year into the shellfish water from all 90 CSOs in the two catchments Although this reduced spills and dealt with some of the flooding and growth issues the storage requirements would have been unaffordable provide no protection against long term climate change and would not tackle the fundamental problem of too much surface water getting into the combined network
An alternative approach based on the reduction and removal of storm water from the combined sewer system was also developed This was in accordance with Dŵr Cymru Welsh Waterrsquos Rainscape50 (surface water elimination and reduction) strategy To identify areas with the most
48httpevidenceenvironment‐agencygovukfcermenDefaultHomeAndLeisureFloodsWhatWereDoingIntoTheFutureScience ProgrammeResearchAndDevelopmentFCRMProjectaspxProjectID=15515be8‐bbed‐4204‐ae56‐3e810ba47694ampPageID=56bad68e‐dcb1‐4bf8‐84cc‐cbfd03ab63a2 49 httpwwwciwemorgmedia674511Paper20820Stephen20Ollierpdf 50httpwwwdwrcymrucom_libraryleaflets_publications_english
205240txt012|May 2013
38
Drainage Strategy Framework
potential for effective storm water removal a flowareaflooding thematic map was developed This was used to focus attention on areas which would deliver the most benefit if storm water removal was carried out These areas are coloured red in Figure 16
Figure 16 Thematic map showing areas of maximum potential for storm water removal
The following interventions (181 in total) were combined into single strategy to be delivered in phases by 2015 2020 and afterwards
bull The management of surface water through swales basins and soakaways rather than through combined sewers resulting in new amenity and ecological areas within the built‐up environment
bull Implementing smarter flow control to better use existing storage and conveyance assets bull Relining of sewers to prevent groundwater ingress bull Removal of land drainage connections to sewers bull Household rainwater harvesting retrofit schemes
surface_water_management_strategypdf
205240txt012|May 2013
39
Drainage Strategy Framework
Figure 17 is an artistrsquos impression of what one of the sustainable urban drainage system solutions may look like
Figure 17 Example retrofit SuDS solution proposed for Gowerton and Llanelli
Modelling has demonstrated that the alternative strategy will achieve the same CSO reduction benefit as the storage strategy together with flooding improvements and additional less tangible benefits at significantly lower cost than the traditional sewer storage solution
Figure 18 illustrates the dispersed nature of solutions identified for central Llanelli
Figure 18 Water sensitive urban design interventions planned for central Llanelli
205240txt012|May 2013
40
Drainage Strategy Framework
Appendix A
Glossary
205240txt012|May 2013
Drainage Strategy Framework
Appendix A Glossary
CAPEX Capital expenditure Appointed water and sewerage companiesrsquo spending on new replacement or refurbished capital assets such as construction or buying machinery
CIWEM Urban Drainage Group (WaPUG) A group of the Chartered Institution of Water and Environmental Management supporting professionals working in urban drainage
Combined Sewer Overflow (CSO) The discharge of untreated sewage diluted with storm water into rivers and the sea CSOs occur during heavy rain and are necessary to reduce the risk of sewer flooding The physical overflow structure is also called a CSO
Common Framework for Capital A planning approach developed for the water and Maintenance Planning sewerage companies in 2002 which provides a robust basis
for assessing future capital maintenance needs The approach is consistent with the needs of Ofwat
Defra The Department for Environment Food and Rural Affairs The Government Department with responsibility for water flooding and water quality in England
Drainage Area Plan (DAP) A detailed plan for a drainage catchment that prioritises a list of interventions based on risk using an approach established in the WRc Sewerage Rehabilitation Manual This approach has been succeeded by Sewerage Risk Management which guides the preparation of Sewerage Management Plans (SMP) Companies vary in how they prepare DAPs or SMPs (or their equivalents) following the general principles that have been established
Drainage Strategy Developed by water and sewerage companies to demonstrate how outcomes will be delivered in drainage catchments over the long term Drainage Strategies will use the information developed in producing a DAPSMP and if a drainage strategy has been produced this should be the starting point in producing a more detailed DAPSMP should this be required It is likely that the activities required to prepare DAPSMP and Drainage Strategies may overlap Drainage Strategies might not refer to specific interventions but instead outline a general approach
Drainage Strategy Framework Guidance to describe the contents and intention of Drainage Strategies
205240txt012|May 2013
Drainage Strategy Framework
Flood Risk Management Plans Required by the Flood Risk Regulations in Flood Risk Areas by December 2015
Flood Risk Regulations The legislative instrument used to implement the requirements of the Floods Directive in England and Wales
Floods Directive DIRECTIVE 200760EC of the European Parliament and of the Council of 23 October 2007 on the assessment and management of flood risks
Lead Local Flood Authority (LLFA) The Shire County or unitary authority with responsibility for managing local flood risk
Local development plans Developed by planning authorities to explain where and what type of development (new homes and businesses) will occur within their area They are required to explain water infrastructure needs to support this development
Local Flood Risk Management Strategy Developed by the Lead Local Flood Authority to explain (LFRMS) how local flood risk will be managed by the Authority and
in partnership with others
Natural Resources Wales From 1 April 2013 Natural Resources Wales (NRW) a new body formed by the Welsh Government will take over the functions previously carried out by the Environment Agency (EA) in Wales alongside those of the Forestry Commission Wales and the Countryside Council for Wales
Ofwat The Water Services Regulation Authority ndash the economic regulator of the water and sewerage companies of England and Wales
OPEX Operating expenditure Appointed water and sewerage companiesrsquo day‐to‐day spending on running the services for example staff costs and power This is likely to include investment in joint projects that do not create or relate to an asset that the company solely or jointly owns
Outcomes Outcomes are the higher level objectives that a companyrsquos actions are intended to deliver A companyrsquos outcome should reflect its customersrsquo priorities identified through appropriate customer engagement and deliver the best long‐term sustainable solution for customers and the environment An outcome may not be bound by a single price control period and should be set in the context of customersrsquo and the environmentrsquos long‐term needs
205240txt012|May 2013
Drainage Strategy Framework
Price Review The process of setting appointed water and sewerage companiesrsquo price limits The next price review will take place in 2014 for the period 2015‐20 Ofwat currently sets price limits every five years
Real Time Control (RTC) Using actuated pumps gates and weirs to actively control flow in sewers Better use can be made of existing infrastructure and links can be made between network treatment and receiving water systems for operational benefits Sometimes referred to as Active Management
River Basin Management (Plans) River Basin Management is a continuous process of planning (to develop River Basin Management Plans) and delivery The Water Framework Directive introduces a formal series of 6 year cycles The first cycle will end in 2015 when following further planning and consultation the River Basin Management Plans will be updated and reissued
Sewerage Management Plan A risk based approach to indentifying investment needs in sewerage systems as described in the Sewerage Risk Management (SRM) approach developed by WRc plc
Storm water retrofit Releasing capacity in sewers by controlling stormwater at the surface using disconnection swales and other sustainable drainage systems (SuDS)
205240txt012|May 2013
We are the Environment Agency We protect and improve the environment and make it a better place for people and wildlife We operate at the place where environmental change has its greatest impact on peoplersquos lives We reduce the risks to people and properties from flooding make sure there is enough water for people and wildlife protect and improve air land and water quality and apply the environmental standards within which industry can operate Acting to reduce climate change and helping people and wildlife adapt to its consequences are at the heart of all that we do We cannot do this alone We work closely with a wide range of partners including government business local authorities other agencies civil society groups and the communities we serve
wwwenvironment‐agencygovuk
Environment Agency National Customer Contact Centre
Telephone 03708 506 506 enquiriesenvironment‐agencygovuk
Ofwat (The Water Services Regulation Authority) is a non‐ministerial government department We are responsible for making sure that the water and sewerage sectors in England and Wales provide consumers with a good quality and efficient service at a fair price
wwwofwatgovuk
Telephone 0121 644 7500 mailboxofwatgsigovuk
Halcrow Group Limited Burderop Park Swindon Wiltshire SN4 0QD
tel 01793 812479 fax 01793 812089 halcrowcom
Halcrow Group Limited is a CH2M HILL company Halcrow Group Limited has prepared this report in accordance with
the instructions of The Environment Agency for the clientrsquos sole and specific use Any other persons who use any information contained herein do so at their own risk
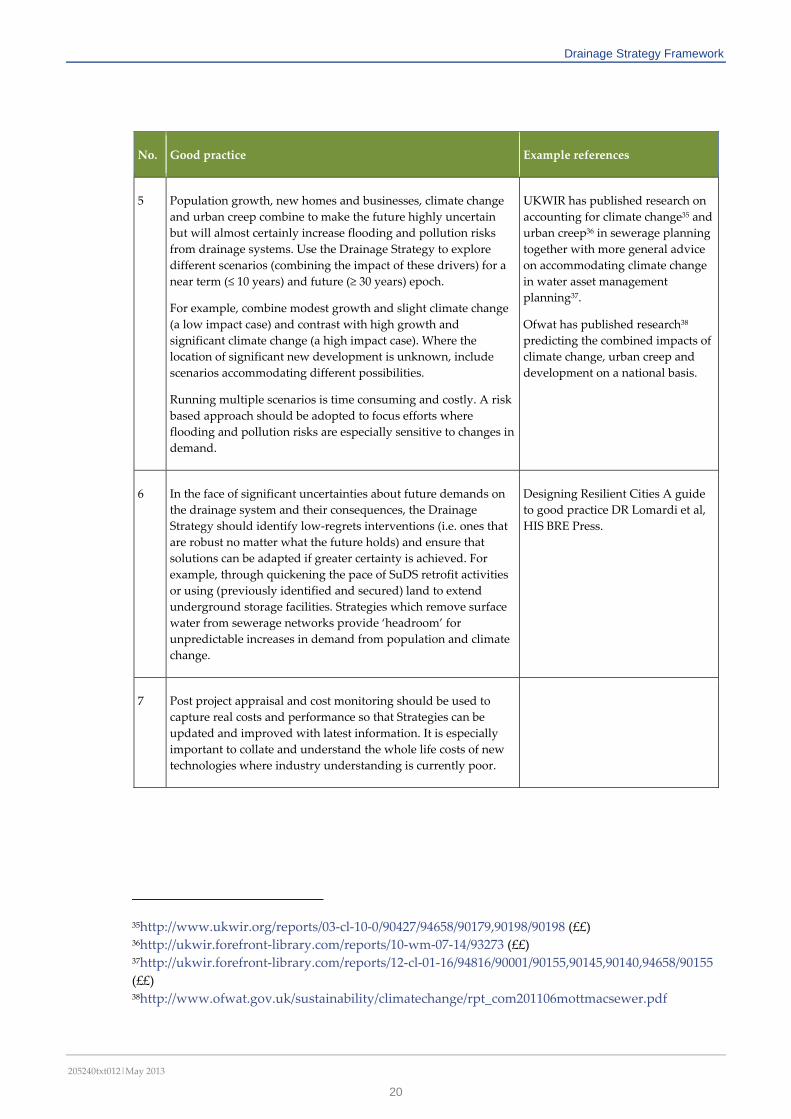
Drainage Strategy Framework
No Good practice Example references
5 Population growth new homes and businesses climate change and urban creep combine to make the future highly uncertain but will almost certainly increase flooding and pollution risks from drainage systems Use the Drainage Strategy to explore different scenarios (combining the impact of these drivers) for a near term (le 10 years) and future (ge 30 years) epoch
For example combine modest growth and slight climate change (a low impact case) and contrast with high growth and significant climate change (a high impact case) Where the location of significant new development is unknown include scenarios accommodating different possibilities
Running multiple scenarios is time consuming and costly A risk based approach should be adopted to focus efforts where flooding and pollution risks are especially sensitive to changes in demand
UKWIR has published research on accounting for climate change35 and urban creep36 in sewerage planning together with more general advice on accommodating climate change in water asset management planning37
Ofwat has published research38
predicting the combined impacts of climate change urban creep and development on a national basis
6 In the face of significant uncertainties about future demands on the drainage system and their consequences the Drainage Strategy should identify low‐regrets interventions (ie ones that are robust no matter what the future holds) and ensure that solutions can be adapted if greater certainty is achieved For example through quickening the pace of SuDS retrofit activities or using (previously identified and secured) land to extend underground storage facilities Strategies which remove surface water from sewerage networks provide lsquoheadroomrsquo for unpredictable increases in demand from population and climate change
Designing Resilient Cities A guide to good practice DR Lomardi et al HIS BRE Press
7 Post project appraisal and cost monitoring should be used to capture real costs and performance so that Strategies can be updated and improved with latest information It is especially important to collate and understand the whole life costs of new technologies where industry understanding is currently poor
35httpwwwukwirorgreports03‐cl‐10‐09042794658901799019890198 (poundpound) 36httpukwirforefront‐librarycomreports10‐wm‐07‐1493273 (poundpound) 37httpukwirforefront‐librarycomreports12‐cl‐01‐1694816900019015590145901409465890155 (poundpound) 38httpwwwofwatgovuksustainabilityclimatechangerpt_com201106mottmacsewerpdf
205240txt012|May 2013
20
Drainage Strategy Framework
222 Good practice example ndash Severn Trent Waterrsquos MICAS
Severn Trent Water has developed a process to measure confidence in hydraulic models of sewer systems Modelling Investment Confidence Assessment Scoring (MICAS) was developed to provide an objective evaluation of model confidence It uses information stored in the hydraulic model about the provenance of each data element and the quality of model verification Before the approach was developed the assessment of lsquofitness for purposersquo of models was subjective and based on modellers judgment This was not always reliable and certainly not repeatable and transparent MICAS provides an objective assessment of hydraulic model quality which can be used to inform its use and prioritise improvements to input data and model verification
Figure 7 and Figure 8 illustrate how an understanding of model confidence from the MICAS assessment (right hand side images) can be used to interpret predictions of flooding (left hand side images) In Figure 7 areas at predicted high risk of flooding (red in the left hand side image) are shown to be in high confidence areas of the hydraulic model (green in the right hand side image) In contrast in Figure 8 areas at predicted high risk of flooding (red in the left hand side image) are shown to be in poor confidence areas of the hydraulic models (orange in the right hand side image) In the latter case this information is used to identify where further model improvements would be beneficial
Flood Risk MICAS
Figure 7 Modelled flood risk and MICAS confidence scores (high model confidence)
Flood Risk MICAS
Figure 8 Modelled flood risk and MICAS confidence scores (lower model confidence)
205240txt012|May 2013
21
23
Drainage Strategy Framework
Principle Three Risk Based
Strategies should be risk based This means that planning operational and investment activities should be based on consideration of the probability and consequence of inadequate drainage function (risks) as these relate to the achievement of measures that demonstrate delivery of outcomes A risk based Strategy ensures that investment is made where risks are the greatest
To aid communication risks should be visualised through maps and plans (Figure 10 is an example) To aid risk assessment risks should be monetised combined and predicted into the future To aid options appraisal the impact of interventions on the level of risk should be predicted
The approach to Drainage Strategy development should be risk based itself The degree of detail included should be related to an understanding of the overall level of risks in the catchment now and in the future
231 Recommended good practice
No Good practice Example references
1 Determine where a Drainage Strategy is required by combining current performance with external influences likely to result in deteriorating performance This stage requires no modelling or detailed assessment On a catchment‐by‐catchment (drainage area) basis understand current risks by collating data on current performance eg blockages collapses pumping station failures pollution incidents CSO spills storm tank spills internal flooding incidents external flooding incidents and infiltration rates Relate these risks to performance indicators and the achievement of outcomes Combine with information about known growth rates predictions of urban creep quantity of newly adopted lsquoprivatersquo sewers surface water flooding risks (eg from flood map for surface water) WFD water body status and bathing water status Prioritise catchments with high current risks andor factors suggesting that risks are likely to worsen significantly in the future Consider normalising scoring method for size of catchment (eg by unit area or unit length of sewer) Consult with stakeholders to confirm correct prioritisation Commence with development of Drainage Strategies for the highest ranked catchments Periodically revisit prioritisation (updating with new data) to check that priorities are still correct
The initialisation stage of a Sewer Management Plan (SMP) (described in SRM5) considers how a risk assessment can be used to prioritise which spatial units (eg catchments) should be prioritised for a SMP study
2 Visualise catchment risks (from 1) to illustrate and explain to partners the reasons for prioritisation Accommodate their views amp consider changing prioritisation to aid wider drainage planning requirements (eg increase prioritisation of a catchment with significant surface water flooding problems where close collaboration between water and sewerage company and LLFA will benefit the community)
205240txt012|May 2013
22
Drainage Strategy Framework
No Good practice Example references
3 Clearly relate sewerage risks to the performance indicators that will be used to measure progress towards achieving outcomes eg relate blockage rates to flooding and pollution incidents eg relate increase in flows to increased CSO frequency breaches of permit conditions and deterioration in receiving water quality Adopt a sourcendashpathway‐receptor model and workshop techniques to ensure that cause effect and consequences are fully captured Use performance indicators as the basis for a comprehensive risk assessment that considers likelihood (frequency) and consequence (extent degree and duration of impact) of failure expressed as risk scores Monetise risks in GBP (pound) to align with principle four (whole life costs amp benefits) Use (verified) predictive models to understand near term (lt10 years) and long term (gt30 years) risks The latter to align with principle four (whole life costs amp benefits) Align complexity of method with level of risk recognising the needs of partners eg use complex 2D flood routing models to ascertain (with greater certainty) flood mechanisms and damages where the quantity and frequency of flooding is high and interventions will be complex and costly Elsewhere more simple approaches are appropriate eg use complex UPM3 water quality modelling methods where compliance with river standards or discharge consents is already failing or is expected to do so Elsewhere more simple approaches are appropriate Combine risk scores from different risks to describe the total level of risk in a catchment Use visualisation techniques to communicate combined level of risk Combine analysis from hydraulic blockage and asset deterioration models on a catchment basis In hydraulic analysis consider flooding performance for rainfall events beyond the usually provided standard of protection to understand performance in extreme events in support of partners (especially LLFAs) and in search of cost beneficial interventions at a higher standard than normal
SRM 5 (S3‐03) details approaches to simple and more complex approaches to risk assessment that are consistent with CMPCF guidelines
4 Be alert to interactions between sewer networks and wastewater treatment plans eg by modelling the impact of changing sewer flows on wastewater treatment worksrsquo performance and costs Consider combined impact of different catchments on a single or linked water body (eg an inland river bathing water or shell fishery)
UPM3 guidance discusses approaches to understanding these interactions and applying more complex water quality impact models
5 Establish systems and apply methods to predict how interventions can reduce risks eg how a targeted and pro‐active maintenance can reduce the occurrence of sewer blockage and flooding from lsquoother causesrsquo eg how reducing infiltration can reduce CSO spills eg how reducing connected impermeable area can reduce sewer flooding
205240txt012|May 2013
23
Drainage Strategy Framework
232 Good practice example ndash United Utilities risk assessment
United Utilities has demonstrated a robust risk based approach in the development of sewerage management plans used for long term planning across their area of operations
Hydraulic models were applied in 235 catchments and configured to look at future performance and to evaluate the consequences of inadequate capacity Starting from a baseline of 2010 versions of the models were built for 2020 and 2036 epochs The following model input parameters were adjusted population water consumption infiltration planned development known sewerage improvement projects urban creep rainfall (for climate change)
Two‐dimensional (2D) modelling was used to consider the consequences of sewer flooding resulting from the changes made to reflect the future operating environments As well as the impact on homes and business (from internal and external flooding) the flood risk to critical infrastructure was also considered The operation of CSOs was considered by computing the annual spill volume duration and frequency
Finally predictions of the likelihood and consequence of sewer failure were added taking account of sewer material age and the incident records relating to similar assets
All these data were combined and weighted to generate a Sewer Management Plan (SMP) Risk Score for each length of sewer The process is illustrated in Figure 9
Figure 9 United Utilitiesrsquo process for calculating risk score in sewerage catchments
205240txt012|May 2013
24
Drainage Strategy Framework
Risk scores were summed spatially and monetised so that high priority locations could be identified Mapping and visualisation were used to communicate the results of this assessment priority areas for further investigation and how risks change through time (Figure 10)
Figure 10 Visualisation of sewerage risks
233 Good practice example ndash Northumbrian Water risk assessment
Northumbrian Water completes an annual assessment of hydraulic capacity in its sewerage network at the drainage area scale Its approach does not require hydraulic models to have been completed and yet can reliably highlight areas of under‐capacity in need of further investigation through more detailed analysis including hydraulic modelling New and emerging risk areas can also be identified by applying data for population growth which occurs through development lsquoWhat ifrsquo scenarios can be run to test when capacity limits may be overcome and flood risks potentially set to increase It demonstrates good lsquorisk basedrsquo planning principles because it shows the drainage planner where more detailed analysis is warranted
The approach uses the following data from company records population connected to sewer P water consumption rate G (lhd) trade discharge E (ls) pipe diameter and gradient pipe connectivity CSO consent pass forward rate (ls) pumping station rate (ls) sewage treatment flow rate (ls) A wastewater dry weather capacity map calculates pipe full capacity dry weather flow (PG+E+I) and Formula A flow for fully combined (1360P+2E+DWF) and separate (4PG+3I+E) areas of the network Infiltration (I) is assumed to be 50 PG +E
205240txt012|May 2013
25
Drainage Strategy Framework
A theoretical assessment of network capacity is then calculated by comparing Formula A with pipe full capacity flow consent values at CSOs and wastewater treatment works and pumping rates This determines areas of the network with a capacity shortfall with a potential capacity shortfall and with no capacity shortfall
When run across the whole company area approximately 100 out of 500 drainage areas were found to be under capacity Over 60 of these areas had recorded sewer flooding incidents In over 300 drainage areas there was no forecast capacity shortfall Only 7 of these drainage areas had recorded sewer flooding incidents Overall the system proved to be very reliable at predicting drainage areas likely to have sewer flooding problems because of sewer under‐capacity
In under capacity drainage areas an intermediate (hydraulic model based) assessment is then carried out Figure 11 shows the results thematically mapped for an example drainage area Red areas are predicted to have a very high risk of sewer flooding Yellow and green areas are predicted to have a low risk of sewer flooding
Figure 11 Example of a drainage area capacity map
205240txt012|May 2013
26
24
Drainage Strategy Framework
Principle Four Whole Life Costs and Benefits
Strategies should be informed by consideration of whole life costs and benefits They should promote a series of interventions which in view of the quantified uncertainties are most likely to result in performance indicators which demonstrate the achievement of outcomes at lowest cost to customers and the community more widely
Costs relate to capital and operational expenditure to deliver interventions and the monetised impacts of drainage failures such as flooding and pollution
Benefits relate to the reduction in risks from drainage failures such as flooding and pollution but should also include wider societal impacts such as those calculated using a lsquoPayments for Ecosystems Servicesrsquo approach
When considering the lsquowhole lifersquo the strategy should consider climate population and asset deterioration trends These are likely to increase risks over the long term if no interventions are made The strategy should state lsquowhatrsquo should be done but also broadly lsquowhenrsquo and in what sequence interventions should happen
241 Recommended good practice
No Good practice Example references
1 Predict risks into the future for at least two epochs le10 years (to understand what the company needs to do now and how this fits with longer term outcomes) and ge30 years to understand long term needs in light of changing population and other pressures
Account for the following changes in demand
bull Growth ‐ new homes and businesses
bull Urban creep ndash uncontrolled addition of connected impermeable area
bull Climate change ndash affecting design events (flood predictions) time‐series (CSO and treated effluent quantities) river flows and temperatures
bull Infiltrationexfiltration ndash through deteriorating sewer condition
bull Dry weather flows ndash through changes in water consumption rates
2 Combining monetised risks (associated with sewerage failures) determine whole life costs for a lsquodo nothingrsquo scenario (ie no interventions)
Include costs associated with electricity consumption (in the network and at the wastewater treatment works) and CO2 emissions
UKWIR will publish in 2014 a revision to their Long Term Least Cost Planning for Wastewater Supply‐Demand
guidance This may provide tools and methods for expressing costs and benefits to support the development of a Drainage Strategy
205240txt012|May 2013
27
Drainage Strategy Framework
No Good practice Example references
3 Test intervention strategies which keep performance indicators on track to deliver outcomes by adding capacity (supply) reducing flows (demand) or altering operational regimes
Include the costs of interventions and the benefits of reduced risks to inform selection of the most cost beneficial strategy over the whole life
Have regard to the timing of interventions recognising that uncertainty may require low‐regrets (insensitive to uncertainty) solutions and that delaying major interventions may be more affordable and attractive in the short term Discounting should be used to compare the costs and benefits of interventions occurring at different times
Recognise that some interventions will be obligatory and defined (eg maintenance of a spill frequency standard at a CSO) whilst others will be more discretionary focused on achieving outcomes rather than specific outputs
SRM5 (Section 8) defines and contrasts cost benefit analysis cost effectiveness analysis whole life cost analysis and risk cost benefit analysis
HM Treasury Green Book39
sets out a framework for the appraisal of long term projects which can be applied to the development of a Drainage Strategy
4 Donrsquot at first be concerned with the distribution of costs and benefits between partners who may be sharing costs Identify the most cost beneficial solution first and then debate and agree an equitable sharing of costs
Give equal weighting to OPEX (operating expenditure) and CAPEX (capital expenditure) costs so not to cause bias towards capital intensive solutions Properly consider the costs and benefits of pro‐active maintenance regimes and campaigns to influence customers to reduce fats oils and greases (FOG) build‐ups and the misuse of sewers
Consider the affordability of solutions the impact on customersrsquo bills and the resources of other organisations to play their part
UKWIR research outputs40 in 2013 (SW01) will provide a framework for making a business case for separating storm water from combined sewers
5 Where interventions include the provision of green space public amenity and improved habitats then Payment for Ecosystem Services approaches should be used to identify further monetised benefits in the appraisal Customers should be consulted to help value these benefits
Supplementary Green Book41
guidance describes methods for accounting for environmental impacts including the ecosystems approach
39 httpwwwhm‐treasurygovukdata_greenbook_indexhtm 40 httpwwwukwirorgpublishorsystemcomponent_viewaspLogDocId=96116 41 httpwwwhm‐treasurygovukdaccounting_environmental_impactspdf
205240txt012|May 2013
28
Drainage Strategy Framework
242 Good practice example ndash Severn Trent Water making the case for surface water separation in Stoke-on-Trent
In this example42 Severn Trent Water compared alternative ways of addressing sewer flooding problems by looking at a range of costs and benefits not all of which were directly associated with its specific responsibilities as a water and sewerage company Whilst the example does not express a monetised value for all costs and benefits over the whole life it does illustrate the types of factors which could be included in an appraisal of this type scaled to address problems at a catchment level It also demonstrates how working collaboratively can help identify solutions which are cost‐beneficial for the community at large
In an area of Stoke served by a combined sewer system five properties were at risk from sewer flooding in cellars for events equal to and less frequent than the 1 in 10 year probability A conventional sewer pumping station based solution was presented as the standard option
However a nearby former hospital site was also undergoing re‐development which would result in reduced runoff to the combined sewer The new drainage regime in the redevelopment site was sufficient to remove the flood risk at the five properties (this was a do nothing strategy)
A third option completely separated the development site runoff from the combined sewer and also addressed local flood risk issues nearby The solution required a new storm sewer and a network of swales and other SuDS features connecting with an ordinary watercourse
Table 1 illustrates how costs and benefits were compared across the three alternative strategies Each provided the same benefit in terms of the number of homes (5) relieved from sewer flooding The novel SuDS and surface water management solution additionally gave local flood risk relief to 3 further properties The separationSuDS strategy came at a higher capital cost but delivered greater social cost benefits savings in annual operating costs and a bonus improvement water quality (because of reduced CSO spill volume) Severn Trent selected the separation SuDS solution because the higher capital costs were offset by other benefits
Table 1 Costs and benefits of drainage improvements in part of Stoke-on-Trent
Do nothing Standard option
SuDS
Sewer flooding benefits 5 5 5
Other flooding benefits 0 0 3
Change in runoff to combined sewer (m3year) 0 0 ‐40000
Estimated cost (pound) 0 168000 419000
42httpwwwciwemorgmedia695460Paper203_Creating20Sewer20Capacity_Presentation2 0by20Mike20Woodpdf
205240txt012|May 2013
29
Drainage Strategy Framework
Do nothing Standard option
SuDS
Social Cost Benefit (pound) 16000 5000 51000
Change in electricity costs (poundyear) 0 +75 ‐525
Programme impact (years to deliver solution) + 4 0 +4
CSO spill volume (m3 in 1year event) +298 0 ‐397
243 Good practice example ndash New York City comparison of grey and green infrastructure drainage strategies
This example is taken from New York in the United States of America Itrsquos an illustration of how whole life costs have been compared for alternative strategies to solve urban drainage issues on a mega‐city scale The key data are summarised in Table 2
Table 2 Comparing drainage strategies in New York
Grey Strategy
Green Strategy
CSO spill volume reduction (billion gallons year)
101 122
Wider benefits over 20 years ($ million) 0 139 to 418
Whole life costs over 20 years ($ billion) 68 53
The information is taken from the New York City Green Infrastructure Plan43 produced by the Mayorrsquos Office in 2010 The Plan (and recent updates) provides a comprehensive evidence base around costs and benefits of different approaches to address the cityrsquos drainage problems It is therefore an excellent example of how drainage strategies can be described in plain language for a non‐specialist audience concerned with their environment and the cost of providing infrastructure to enhance it
It is becoming commonplace for North American cities (eg Portland and Philadelphia) to address the issue of frequent combined sewer overflow (CSO) operation by using a combination of grey infrastructure (sewers) and green infrastructure (sustainable drainage systems) The wider health
43 httpwwwnycgovhtmldephtmlstormwaternyc_green_infrastructure_planshtml
205240txt012|May 2013
30
25
Drainage Strategy Framework
and ecological benefits of green infrastructure approaches and the reduced reliance on materials and energy are attractive to utility planners and cities alike
New York has 422 CSOs and an agreed Long Term Control Strategy to significantly reduce the impact wet weather discharges have on aquatic systems throughout the city Annual discharges are currently (2010) estimated to be 30 billion gallons (114 million cubic meters) per year Building on existing and committed new sewer plans an agreed grey infrastructure based strategy to this problem is set to reduce these discharges to 198 billion gallons per year (a 34 reduction) by the 2030s An alternative green infrastructure approach based around intercepting the first inch (25mm) of rainfall across 10 of the impermeable city area by 2030 is predicted to reduce CSO spills to 179 billion gallons per year
Planners have calculated that the whole life costs after 20 years of the grey infrastructure solution will be $68 billion (2010 prices) compared to the green infrastructure whole life costs of $53 billion The green infrastructure strategy reduces CSO spills by more than the grey alternative for $15 billion less in terms of whole life cost Further planners have calculated that New Yorkers will benefit by up to $41844 million (accumulated over 20 years) in additional benefits associated with lower energy bills from control of urban heating increased property values and improved health
Based on this analysis New York City has committed itself to an aggressive green infrastructure based runoff control strategy to provide long term reductions in CSO spills The plan is to achieve interception of 15 of impermeable area by 2015 4 by 2020 7 by 2025 and 10 by 2030
Principle Five Live Process
The Strategy should be adaptable and periodically reviewed Whilst outcomes are expected to be relatively stable over time the pace at which the Strategy delivers outcomes will be linked to volatile influences (like climate and population change) and to the decisions made at each price review about the priorities for the following period The Strategy should be reviewed at regular intervals to reflect investments already made the changing priorities of the water and sewerage company and partners and the presence of emerging risks The review is also an opportunity to report drainage catchment performance relative to performance measures designed to monitor progress towards achieving outcomes
44 Estimated using methods from the New York Municipal Forest Resource Analysis (MFRA) prepared by the US Dept of Agriculture
205240txt012|May 2013
31
Drainage Strategy Framework
251 Recommended good practice
No Good practice Example references
1 Regularly repeat screening exercise to determine catchments requiring a Drainage Strategy and modify programme of Strategy development accordingly
Check for changes in measured rates of flooding and pollution incidents blockages collapses pumping station failures etc
Check for changes in extent and location of new development
Check for activities being undertaken by partners (eg redevelopment urban realm improvements and flooding and pollution management activities)
SRM5 illustrates how improved and updated knowledge of system performance should be applied to establish Strategies
2 In lsquolive Strategiesrsquo repeat risk assessment when data and models improve and adjust confidence scores accordingly
Confirm that Strategy will still achieve performance indicators and outcomes at least cost Revise Strategy as necessary
3 Periodically refresh Strategy accommodating impact of interventions already delivered using re‐verified predictive tools as appropriate
Confirm that Strategy will still achieve performance indicators and outcomes at least cost Revise Strategy as necessary
Triggers for a wholesale review of the Strategy are likely to be significant changes to the location or extent of planned development
4 Monitor report and share (with partners) the measures used to demonstrate delivery of outcomes Example measures may include the number of properties which experience sewer flooding the number of properties at risk of flooding the number of properties at risk from sewerage asset failure risk indices that capture both the probability and consequence of failure customer satisfaction with regards to clean rivers and beaches the number of pollution incidents the frequency of combined sewer overflow operation and compliance with discharge permit conditions
252 Good practice example ndash Thames Water live DAP
Thames Water has initiated a DAP (drainage area plan) Live approach Itrsquos a good example of how companies are continuously monitoring and updating the status of drainage area risks It provides a lsquoliversquo snapshot of the current health of all drainage areas in Thames Waterrsquos region allowing real time planning as part of a strategic approach It enables drainage planners to view the effectiveness
205240txt012|May 2013
32
Drainage Strategy Framework
of intervention strategies and compare incident rates across varying geographies and development types in the Thames Valley
DAP Live will be available for all catchments in the Thames Water area thus enabling
bull high level monitoring of risks across the business bull a live and strategic review of catchment performance bull prioritisation of catchments based on risk and bull an ability to share data with partners collaborating in drainage planning and improvements
Figure 12 illustrates the types of data managed through the DAP Live system These include asset data political and drainage boundaries environmental data operational data property amp growth data and modelling data As new data become available the DAP Live system is updated so that drainage planners have the most current view on emerging risks and issues
Asset data
Operational data
Property and growth data
Modelling data
Environmental data
Boundaries (SDACs operational political)
Figure 12 Data types held in the DAP Live system
Figure 13 illustrates how the system can provide analysis at a variety of scales from local authority boundaries sewage treatment works catchments drainage areas or a regular grid
205240txt012|May 2013
33
Drainage Strategy Framework
NE PROVINCES
WESTERN PROVINCES
NE LONDON bull Ops areas local W LONDON
SE LONDON authorities Large TIDWORTH SE PROVINCES
bull STW Catchments
bull Drainage areas(SDACs)
bull Regular grid Small
Figure 13 DAP Live reporting performance at different scales
205240txt012|May 2013
34
Drainage Strategy Framework
253 Good practice example ndash Wessex Water Water live data
Wessex Water is regularly using data geospatially to proactively identify and respond to risk Theirs is a good example of how data can be used to provide an adaptable approach that is regularly reviewed to plan investment
The risk‐based and live approach uses a set of likelihood and consequence models which are built up from all currently available data asset data (eg CCTV data material age) operational data (eg flooding and pollutions incidents) and information (eg locality near hospital or downstream of an overflow) All these data are collated for the entire Wessex region updated regularly and analysed geospatially
Figure 14 Sewer risk scores presented in a risk matrix and geospatially
This allows a risk score (Figure 14) to be calculated for each mapped sewer length which directs investigation more efficiently by allocating each mapped sewer a planned CCTV inspection date
This risk‐based approach has been successful in targeting problematic sewers increasing identification rates threefold Density analysis is performed using asset failure and operational information which allows planning of both proactive structural and operational investment
Proactively found structural issues are far more cost effective to repair before failure and can also prevent serviceability issues
205240txt012|May 2013
35
f
DDrainage Strateegy Frameworrk
Figgure 15 Hotsppot analysis
Thhe hotspot annalysis (Figuure 15) showss where operrational clustters have beeen calculatedd This hootspot analyssis is made aavailable on tthe Wessex WWater corporrate GIS to a llow operati onal staff to target their effforts to mitiggate against ffurther repeaat incidents AAdditional innformation ffrom asset annd operationnal activities ccan be addedd regularly too the databasses which drrive the mod els enabling rissk scores to bbe kept as livve as require d
226 Prrinciple Sixx Innovativve and Susstainable SSolutions
Thhe Drainage Strategy Fraamework proomotes the fuull evaluationn of alternatiives to tradit ionally enngineered sewwerage soluttions to test wwhether thesse offer loweer whole life ccost options or better reesponses to uuncertainty It is anticipaated that draainage solutioons of the futture will be ddifferent froom the ones we are usedd to
Thhese should iinclude (at leeast at a highh level) real ttime control storm waterr retrofit techhniques edducation to eenable custommers to changge behaviou r enhancingg incentives for customerss to reduce suurface water flowing to seewers and innnovative pe rmitting arraangements a cross drainagge networks annd sewage tr eatment worrks Water annd sewerage companies sshould continnue to revieww and deevelop other innovative ssolutions
Foor example wwhere a commpany may hiistorically haave preferredd to tackle seewer floodingg or coombined sewwer overflow pollution byy increasing iits undergrouund equipmment to store mmore rainfalll duuring stormss it might connsider other options in fuuture ndash such as working wwith custommers to mmanage the raainfall close tt eventing it foorm enteringg the sewer syystem o source pre
2205240txt012|Mayy 2013
36
Drainage Strategy Framework
261 Recommended good practice
No Good practice Example references
1 Use cost‐benefit methods to demonstrate that innovative and sustainable solution types provide best value for customers and the wider community
UKWIR will publish new research and guidance in 2013 addressing active control and storm water removal demonstrating how these technologies can be justified and included within Drainage Strategies
2 Consider integrated water resource management Work with partners (especially developers and local authorities) to examine whether use of stored stormwater reduces potable water consumption AND need for capacity in sewers
CIRIA has published a scoping study for water sensitive urban design45 in the UK
3 Consider a mix of conventional and new technologies using more adaptive approaches as low‐regrets responses to uncertainty eg prevent current sewer flooding with underground tank storage but address future risks (worsened by climate change) with retrofit SuDS implemented progressively
CIRIA has published lsquoRetrofitting to manage surface waterrsquo46 a comprehensive guide to planning and delivering this type of project
4 Use carbon accounting methods to compare embodied and emitted carbon in alternative intervention strategies so that these impacts are accounted for in whole life costs
Consider the benefits of surface water removal on the costs (including carbon) of pumping and sewage treatment
UKWIR47 has and continues to publish detailed guidance on carbon accounting for water and sewerage company use
45httpwwwciriaorgserviceresearch_informationAMContentManagerNet ContentDisplayaspxSection=research_informationampContentID=23581 46httpwwwciriaorgSERVICEHomecoreordersproductaspxcatid=5ampprodid=1909 47httpukwirforefront‐librarycomreports08‐cl‐01‐6923419000190269902659465890269
205240txt012|May 2013
37
Drainage Strategy Framework
No Good practice Example references
5 Where interventions include the provision of green space public amenity and improved habitats then Payment for Ecosystem Services approaches can be used to claim further monetised benefits in the appraisal Customers should be consulted to help value these benefits
The Environment Agency will publish data in 2013 on costs and benefits of retrofit stormwater projects to promote understanding and uptake
6 Share data within the industry on innovative solutions to increase knowledge of new technology and SuDs approaches
EA retrofitting SuDs costs and benefits database48
accommodating data from Ofwat AMP5 SuDS pilot initiative and other examples
262 Good practice example ndash Welsh Water surface water reduction and removal strategy for Gowerton and Llanelli
Dŵr Cymru Welsh Water and partners are applying innovative storm water removal methods to address capacity problems in the sewer network in Gowerton and Llanelli49 (population 140000) Current under capacity leads to localised sewer flooding and excessive combined sewer overflow (CSO) spill to the Burry Inlet a protected shellfish water and special area of conservation The capacity problems in the system were a concern for the Environment Agency (Wales) and there was a risk of widespread restrictions to economic development being imposed Dŵr Cymru Welsh Water Carmarthenshire County Council City and County of Swansea Consumer Council for Water Environment Agency Wales and the Welsh Government all worked in partnership to resolve the situation
A brand new hydraulic model was built for the entire sewerage network with particular attention paid to accurately representing the sources of storm run‐off and infiltration The model was verified against data from flow monitors and observed CSO spill frequencies into the Burry Inlet
To begin with a traditional sewer storage solution was proposed that would result in an average 10 spills a year into the shellfish water from all 90 CSOs in the two catchments Although this reduced spills and dealt with some of the flooding and growth issues the storage requirements would have been unaffordable provide no protection against long term climate change and would not tackle the fundamental problem of too much surface water getting into the combined network
An alternative approach based on the reduction and removal of storm water from the combined sewer system was also developed This was in accordance with Dŵr Cymru Welsh Waterrsquos Rainscape50 (surface water elimination and reduction) strategy To identify areas with the most
48httpevidenceenvironment‐agencygovukfcermenDefaultHomeAndLeisureFloodsWhatWereDoingIntoTheFutureScience ProgrammeResearchAndDevelopmentFCRMProjectaspxProjectID=15515be8‐bbed‐4204‐ae56‐3e810ba47694ampPageID=56bad68e‐dcb1‐4bf8‐84cc‐cbfd03ab63a2 49 httpwwwciwemorgmedia674511Paper20820Stephen20Ollierpdf 50httpwwwdwrcymrucom_libraryleaflets_publications_english
205240txt012|May 2013
38
Drainage Strategy Framework
potential for effective storm water removal a flowareaflooding thematic map was developed This was used to focus attention on areas which would deliver the most benefit if storm water removal was carried out These areas are coloured red in Figure 16
Figure 16 Thematic map showing areas of maximum potential for storm water removal
The following interventions (181 in total) were combined into single strategy to be delivered in phases by 2015 2020 and afterwards
bull The management of surface water through swales basins and soakaways rather than through combined sewers resulting in new amenity and ecological areas within the built‐up environment
bull Implementing smarter flow control to better use existing storage and conveyance assets bull Relining of sewers to prevent groundwater ingress bull Removal of land drainage connections to sewers bull Household rainwater harvesting retrofit schemes
surface_water_management_strategypdf
205240txt012|May 2013
39
Drainage Strategy Framework
Figure 17 is an artistrsquos impression of what one of the sustainable urban drainage system solutions may look like
Figure 17 Example retrofit SuDS solution proposed for Gowerton and Llanelli
Modelling has demonstrated that the alternative strategy will achieve the same CSO reduction benefit as the storage strategy together with flooding improvements and additional less tangible benefits at significantly lower cost than the traditional sewer storage solution
Figure 18 illustrates the dispersed nature of solutions identified for central Llanelli
Figure 18 Water sensitive urban design interventions planned for central Llanelli
205240txt012|May 2013
40
Drainage Strategy Framework
Appendix A
Glossary
205240txt012|May 2013
Drainage Strategy Framework
Appendix A Glossary
CAPEX Capital expenditure Appointed water and sewerage companiesrsquo spending on new replacement or refurbished capital assets such as construction or buying machinery
CIWEM Urban Drainage Group (WaPUG) A group of the Chartered Institution of Water and Environmental Management supporting professionals working in urban drainage
Combined Sewer Overflow (CSO) The discharge of untreated sewage diluted with storm water into rivers and the sea CSOs occur during heavy rain and are necessary to reduce the risk of sewer flooding The physical overflow structure is also called a CSO
Common Framework for Capital A planning approach developed for the water and Maintenance Planning sewerage companies in 2002 which provides a robust basis
for assessing future capital maintenance needs The approach is consistent with the needs of Ofwat
Defra The Department for Environment Food and Rural Affairs The Government Department with responsibility for water flooding and water quality in England
Drainage Area Plan (DAP) A detailed plan for a drainage catchment that prioritises a list of interventions based on risk using an approach established in the WRc Sewerage Rehabilitation Manual This approach has been succeeded by Sewerage Risk Management which guides the preparation of Sewerage Management Plans (SMP) Companies vary in how they prepare DAPs or SMPs (or their equivalents) following the general principles that have been established
Drainage Strategy Developed by water and sewerage companies to demonstrate how outcomes will be delivered in drainage catchments over the long term Drainage Strategies will use the information developed in producing a DAPSMP and if a drainage strategy has been produced this should be the starting point in producing a more detailed DAPSMP should this be required It is likely that the activities required to prepare DAPSMP and Drainage Strategies may overlap Drainage Strategies might not refer to specific interventions but instead outline a general approach
Drainage Strategy Framework Guidance to describe the contents and intention of Drainage Strategies
205240txt012|May 2013
Drainage Strategy Framework
Flood Risk Management Plans Required by the Flood Risk Regulations in Flood Risk Areas by December 2015
Flood Risk Regulations The legislative instrument used to implement the requirements of the Floods Directive in England and Wales
Floods Directive DIRECTIVE 200760EC of the European Parliament and of the Council of 23 October 2007 on the assessment and management of flood risks
Lead Local Flood Authority (LLFA) The Shire County or unitary authority with responsibility for managing local flood risk
Local development plans Developed by planning authorities to explain where and what type of development (new homes and businesses) will occur within their area They are required to explain water infrastructure needs to support this development
Local Flood Risk Management Strategy Developed by the Lead Local Flood Authority to explain (LFRMS) how local flood risk will be managed by the Authority and
in partnership with others
Natural Resources Wales From 1 April 2013 Natural Resources Wales (NRW) a new body formed by the Welsh Government will take over the functions previously carried out by the Environment Agency (EA) in Wales alongside those of the Forestry Commission Wales and the Countryside Council for Wales
Ofwat The Water Services Regulation Authority ndash the economic regulator of the water and sewerage companies of England and Wales
OPEX Operating expenditure Appointed water and sewerage companiesrsquo day‐to‐day spending on running the services for example staff costs and power This is likely to include investment in joint projects that do not create or relate to an asset that the company solely or jointly owns
Outcomes Outcomes are the higher level objectives that a companyrsquos actions are intended to deliver A companyrsquos outcome should reflect its customersrsquo priorities identified through appropriate customer engagement and deliver the best long‐term sustainable solution for customers and the environment An outcome may not be bound by a single price control period and should be set in the context of customersrsquo and the environmentrsquos long‐term needs
205240txt012|May 2013
Drainage Strategy Framework
Price Review The process of setting appointed water and sewerage companiesrsquo price limits The next price review will take place in 2014 for the period 2015‐20 Ofwat currently sets price limits every five years
Real Time Control (RTC) Using actuated pumps gates and weirs to actively control flow in sewers Better use can be made of existing infrastructure and links can be made between network treatment and receiving water systems for operational benefits Sometimes referred to as Active Management
River Basin Management (Plans) River Basin Management is a continuous process of planning (to develop River Basin Management Plans) and delivery The Water Framework Directive introduces a formal series of 6 year cycles The first cycle will end in 2015 when following further planning and consultation the River Basin Management Plans will be updated and reissued
Sewerage Management Plan A risk based approach to indentifying investment needs in sewerage systems as described in the Sewerage Risk Management (SRM) approach developed by WRc plc
Storm water retrofit Releasing capacity in sewers by controlling stormwater at the surface using disconnection swales and other sustainable drainage systems (SuDS)
205240txt012|May 2013
We are the Environment Agency We protect and improve the environment and make it a better place for people and wildlife We operate at the place where environmental change has its greatest impact on peoplersquos lives We reduce the risks to people and properties from flooding make sure there is enough water for people and wildlife protect and improve air land and water quality and apply the environmental standards within which industry can operate Acting to reduce climate change and helping people and wildlife adapt to its consequences are at the heart of all that we do We cannot do this alone We work closely with a wide range of partners including government business local authorities other agencies civil society groups and the communities we serve
wwwenvironment‐agencygovuk
Environment Agency National Customer Contact Centre
Telephone 03708 506 506 enquiriesenvironment‐agencygovuk
Ofwat (The Water Services Regulation Authority) is a non‐ministerial government department We are responsible for making sure that the water and sewerage sectors in England and Wales provide consumers with a good quality and efficient service at a fair price
wwwofwatgovuk
Telephone 0121 644 7500 mailboxofwatgsigovuk
Halcrow Group Limited Burderop Park Swindon Wiltshire SN4 0QD
tel 01793 812479 fax 01793 812089 halcrowcom
Halcrow Group Limited is a CH2M HILL company Halcrow Group Limited has prepared this report in accordance with
the instructions of The Environment Agency for the clientrsquos sole and specific use Any other persons who use any information contained herein do so at their own risk

Drainage Strategy Framework
222 Good practice example ndash Severn Trent Waterrsquos MICAS
Severn Trent Water has developed a process to measure confidence in hydraulic models of sewer systems Modelling Investment Confidence Assessment Scoring (MICAS) was developed to provide an objective evaluation of model confidence It uses information stored in the hydraulic model about the provenance of each data element and the quality of model verification Before the approach was developed the assessment of lsquofitness for purposersquo of models was subjective and based on modellers judgment This was not always reliable and certainly not repeatable and transparent MICAS provides an objective assessment of hydraulic model quality which can be used to inform its use and prioritise improvements to input data and model verification
Figure 7 and Figure 8 illustrate how an understanding of model confidence from the MICAS assessment (right hand side images) can be used to interpret predictions of flooding (left hand side images) In Figure 7 areas at predicted high risk of flooding (red in the left hand side image) are shown to be in high confidence areas of the hydraulic model (green in the right hand side image) In contrast in Figure 8 areas at predicted high risk of flooding (red in the left hand side image) are shown to be in poor confidence areas of the hydraulic models (orange in the right hand side image) In the latter case this information is used to identify where further model improvements would be beneficial
Flood Risk MICAS
Figure 7 Modelled flood risk and MICAS confidence scores (high model confidence)
Flood Risk MICAS
Figure 8 Modelled flood risk and MICAS confidence scores (lower model confidence)
205240txt012|May 2013
21
23
Drainage Strategy Framework
Principle Three Risk Based
Strategies should be risk based This means that planning operational and investment activities should be based on consideration of the probability and consequence of inadequate drainage function (risks) as these relate to the achievement of measures that demonstrate delivery of outcomes A risk based Strategy ensures that investment is made where risks are the greatest
To aid communication risks should be visualised through maps and plans (Figure 10 is an example) To aid risk assessment risks should be monetised combined and predicted into the future To aid options appraisal the impact of interventions on the level of risk should be predicted
The approach to Drainage Strategy development should be risk based itself The degree of detail included should be related to an understanding of the overall level of risks in the catchment now and in the future
231 Recommended good practice
No Good practice Example references
1 Determine where a Drainage Strategy is required by combining current performance with external influences likely to result in deteriorating performance This stage requires no modelling or detailed assessment On a catchment‐by‐catchment (drainage area) basis understand current risks by collating data on current performance eg blockages collapses pumping station failures pollution incidents CSO spills storm tank spills internal flooding incidents external flooding incidents and infiltration rates Relate these risks to performance indicators and the achievement of outcomes Combine with information about known growth rates predictions of urban creep quantity of newly adopted lsquoprivatersquo sewers surface water flooding risks (eg from flood map for surface water) WFD water body status and bathing water status Prioritise catchments with high current risks andor factors suggesting that risks are likely to worsen significantly in the future Consider normalising scoring method for size of catchment (eg by unit area or unit length of sewer) Consult with stakeholders to confirm correct prioritisation Commence with development of Drainage Strategies for the highest ranked catchments Periodically revisit prioritisation (updating with new data) to check that priorities are still correct
The initialisation stage of a Sewer Management Plan (SMP) (described in SRM5) considers how a risk assessment can be used to prioritise which spatial units (eg catchments) should be prioritised for a SMP study
2 Visualise catchment risks (from 1) to illustrate and explain to partners the reasons for prioritisation Accommodate their views amp consider changing prioritisation to aid wider drainage planning requirements (eg increase prioritisation of a catchment with significant surface water flooding problems where close collaboration between water and sewerage company and LLFA will benefit the community)
205240txt012|May 2013
22
Drainage Strategy Framework
No Good practice Example references
3 Clearly relate sewerage risks to the performance indicators that will be used to measure progress towards achieving outcomes eg relate blockage rates to flooding and pollution incidents eg relate increase in flows to increased CSO frequency breaches of permit conditions and deterioration in receiving water quality Adopt a sourcendashpathway‐receptor model and workshop techniques to ensure that cause effect and consequences are fully captured Use performance indicators as the basis for a comprehensive risk assessment that considers likelihood (frequency) and consequence (extent degree and duration of impact) of failure expressed as risk scores Monetise risks in GBP (pound) to align with principle four (whole life costs amp benefits) Use (verified) predictive models to understand near term (lt10 years) and long term (gt30 years) risks The latter to align with principle four (whole life costs amp benefits) Align complexity of method with level of risk recognising the needs of partners eg use complex 2D flood routing models to ascertain (with greater certainty) flood mechanisms and damages where the quantity and frequency of flooding is high and interventions will be complex and costly Elsewhere more simple approaches are appropriate eg use complex UPM3 water quality modelling methods where compliance with river standards or discharge consents is already failing or is expected to do so Elsewhere more simple approaches are appropriate Combine risk scores from different risks to describe the total level of risk in a catchment Use visualisation techniques to communicate combined level of risk Combine analysis from hydraulic blockage and asset deterioration models on a catchment basis In hydraulic analysis consider flooding performance for rainfall events beyond the usually provided standard of protection to understand performance in extreme events in support of partners (especially LLFAs) and in search of cost beneficial interventions at a higher standard than normal
SRM 5 (S3‐03) details approaches to simple and more complex approaches to risk assessment that are consistent with CMPCF guidelines
4 Be alert to interactions between sewer networks and wastewater treatment plans eg by modelling the impact of changing sewer flows on wastewater treatment worksrsquo performance and costs Consider combined impact of different catchments on a single or linked water body (eg an inland river bathing water or shell fishery)
UPM3 guidance discusses approaches to understanding these interactions and applying more complex water quality impact models
5 Establish systems and apply methods to predict how interventions can reduce risks eg how a targeted and pro‐active maintenance can reduce the occurrence of sewer blockage and flooding from lsquoother causesrsquo eg how reducing infiltration can reduce CSO spills eg how reducing connected impermeable area can reduce sewer flooding
205240txt012|May 2013
23
Drainage Strategy Framework
232 Good practice example ndash United Utilities risk assessment
United Utilities has demonstrated a robust risk based approach in the development of sewerage management plans used for long term planning across their area of operations
Hydraulic models were applied in 235 catchments and configured to look at future performance and to evaluate the consequences of inadequate capacity Starting from a baseline of 2010 versions of the models were built for 2020 and 2036 epochs The following model input parameters were adjusted population water consumption infiltration planned development known sewerage improvement projects urban creep rainfall (for climate change)
Two‐dimensional (2D) modelling was used to consider the consequences of sewer flooding resulting from the changes made to reflect the future operating environments As well as the impact on homes and business (from internal and external flooding) the flood risk to critical infrastructure was also considered The operation of CSOs was considered by computing the annual spill volume duration and frequency
Finally predictions of the likelihood and consequence of sewer failure were added taking account of sewer material age and the incident records relating to similar assets
All these data were combined and weighted to generate a Sewer Management Plan (SMP) Risk Score for each length of sewer The process is illustrated in Figure 9
Figure 9 United Utilitiesrsquo process for calculating risk score in sewerage catchments
205240txt012|May 2013
24
Drainage Strategy Framework
Risk scores were summed spatially and monetised so that high priority locations could be identified Mapping and visualisation were used to communicate the results of this assessment priority areas for further investigation and how risks change through time (Figure 10)
Figure 10 Visualisation of sewerage risks
233 Good practice example ndash Northumbrian Water risk assessment
Northumbrian Water completes an annual assessment of hydraulic capacity in its sewerage network at the drainage area scale Its approach does not require hydraulic models to have been completed and yet can reliably highlight areas of under‐capacity in need of further investigation through more detailed analysis including hydraulic modelling New and emerging risk areas can also be identified by applying data for population growth which occurs through development lsquoWhat ifrsquo scenarios can be run to test when capacity limits may be overcome and flood risks potentially set to increase It demonstrates good lsquorisk basedrsquo planning principles because it shows the drainage planner where more detailed analysis is warranted
The approach uses the following data from company records population connected to sewer P water consumption rate G (lhd) trade discharge E (ls) pipe diameter and gradient pipe connectivity CSO consent pass forward rate (ls) pumping station rate (ls) sewage treatment flow rate (ls) A wastewater dry weather capacity map calculates pipe full capacity dry weather flow (PG+E+I) and Formula A flow for fully combined (1360P+2E+DWF) and separate (4PG+3I+E) areas of the network Infiltration (I) is assumed to be 50 PG +E
205240txt012|May 2013
25
Drainage Strategy Framework
A theoretical assessment of network capacity is then calculated by comparing Formula A with pipe full capacity flow consent values at CSOs and wastewater treatment works and pumping rates This determines areas of the network with a capacity shortfall with a potential capacity shortfall and with no capacity shortfall
When run across the whole company area approximately 100 out of 500 drainage areas were found to be under capacity Over 60 of these areas had recorded sewer flooding incidents In over 300 drainage areas there was no forecast capacity shortfall Only 7 of these drainage areas had recorded sewer flooding incidents Overall the system proved to be very reliable at predicting drainage areas likely to have sewer flooding problems because of sewer under‐capacity
In under capacity drainage areas an intermediate (hydraulic model based) assessment is then carried out Figure 11 shows the results thematically mapped for an example drainage area Red areas are predicted to have a very high risk of sewer flooding Yellow and green areas are predicted to have a low risk of sewer flooding
Figure 11 Example of a drainage area capacity map
205240txt012|May 2013
26
24
Drainage Strategy Framework
Principle Four Whole Life Costs and Benefits
Strategies should be informed by consideration of whole life costs and benefits They should promote a series of interventions which in view of the quantified uncertainties are most likely to result in performance indicators which demonstrate the achievement of outcomes at lowest cost to customers and the community more widely
Costs relate to capital and operational expenditure to deliver interventions and the monetised impacts of drainage failures such as flooding and pollution
Benefits relate to the reduction in risks from drainage failures such as flooding and pollution but should also include wider societal impacts such as those calculated using a lsquoPayments for Ecosystems Servicesrsquo approach
When considering the lsquowhole lifersquo the strategy should consider climate population and asset deterioration trends These are likely to increase risks over the long term if no interventions are made The strategy should state lsquowhatrsquo should be done but also broadly lsquowhenrsquo and in what sequence interventions should happen
241 Recommended good practice
No Good practice Example references
1 Predict risks into the future for at least two epochs le10 years (to understand what the company needs to do now and how this fits with longer term outcomes) and ge30 years to understand long term needs in light of changing population and other pressures
Account for the following changes in demand
bull Growth ‐ new homes and businesses
bull Urban creep ndash uncontrolled addition of connected impermeable area
bull Climate change ndash affecting design events (flood predictions) time‐series (CSO and treated effluent quantities) river flows and temperatures
bull Infiltrationexfiltration ndash through deteriorating sewer condition
bull Dry weather flows ndash through changes in water consumption rates
2 Combining monetised risks (associated with sewerage failures) determine whole life costs for a lsquodo nothingrsquo scenario (ie no interventions)
Include costs associated with electricity consumption (in the network and at the wastewater treatment works) and CO2 emissions
UKWIR will publish in 2014 a revision to their Long Term Least Cost Planning for Wastewater Supply‐Demand
guidance This may provide tools and methods for expressing costs and benefits to support the development of a Drainage Strategy
205240txt012|May 2013
27
Drainage Strategy Framework
No Good practice Example references
3 Test intervention strategies which keep performance indicators on track to deliver outcomes by adding capacity (supply) reducing flows (demand) or altering operational regimes
Include the costs of interventions and the benefits of reduced risks to inform selection of the most cost beneficial strategy over the whole life
Have regard to the timing of interventions recognising that uncertainty may require low‐regrets (insensitive to uncertainty) solutions and that delaying major interventions may be more affordable and attractive in the short term Discounting should be used to compare the costs and benefits of interventions occurring at different times
Recognise that some interventions will be obligatory and defined (eg maintenance of a spill frequency standard at a CSO) whilst others will be more discretionary focused on achieving outcomes rather than specific outputs
SRM5 (Section 8) defines and contrasts cost benefit analysis cost effectiveness analysis whole life cost analysis and risk cost benefit analysis
HM Treasury Green Book39
sets out a framework for the appraisal of long term projects which can be applied to the development of a Drainage Strategy
4 Donrsquot at first be concerned with the distribution of costs and benefits between partners who may be sharing costs Identify the most cost beneficial solution first and then debate and agree an equitable sharing of costs
Give equal weighting to OPEX (operating expenditure) and CAPEX (capital expenditure) costs so not to cause bias towards capital intensive solutions Properly consider the costs and benefits of pro‐active maintenance regimes and campaigns to influence customers to reduce fats oils and greases (FOG) build‐ups and the misuse of sewers
Consider the affordability of solutions the impact on customersrsquo bills and the resources of other organisations to play their part
UKWIR research outputs40 in 2013 (SW01) will provide a framework for making a business case for separating storm water from combined sewers
5 Where interventions include the provision of green space public amenity and improved habitats then Payment for Ecosystem Services approaches should be used to identify further monetised benefits in the appraisal Customers should be consulted to help value these benefits
Supplementary Green Book41
guidance describes methods for accounting for environmental impacts including the ecosystems approach
39 httpwwwhm‐treasurygovukdata_greenbook_indexhtm 40 httpwwwukwirorgpublishorsystemcomponent_viewaspLogDocId=96116 41 httpwwwhm‐treasurygovukdaccounting_environmental_impactspdf
205240txt012|May 2013
28
Drainage Strategy Framework
242 Good practice example ndash Severn Trent Water making the case for surface water separation in Stoke-on-Trent
In this example42 Severn Trent Water compared alternative ways of addressing sewer flooding problems by looking at a range of costs and benefits not all of which were directly associated with its specific responsibilities as a water and sewerage company Whilst the example does not express a monetised value for all costs and benefits over the whole life it does illustrate the types of factors which could be included in an appraisal of this type scaled to address problems at a catchment level It also demonstrates how working collaboratively can help identify solutions which are cost‐beneficial for the community at large
In an area of Stoke served by a combined sewer system five properties were at risk from sewer flooding in cellars for events equal to and less frequent than the 1 in 10 year probability A conventional sewer pumping station based solution was presented as the standard option
However a nearby former hospital site was also undergoing re‐development which would result in reduced runoff to the combined sewer The new drainage regime in the redevelopment site was sufficient to remove the flood risk at the five properties (this was a do nothing strategy)
A third option completely separated the development site runoff from the combined sewer and also addressed local flood risk issues nearby The solution required a new storm sewer and a network of swales and other SuDS features connecting with an ordinary watercourse
Table 1 illustrates how costs and benefits were compared across the three alternative strategies Each provided the same benefit in terms of the number of homes (5) relieved from sewer flooding The novel SuDS and surface water management solution additionally gave local flood risk relief to 3 further properties The separationSuDS strategy came at a higher capital cost but delivered greater social cost benefits savings in annual operating costs and a bonus improvement water quality (because of reduced CSO spill volume) Severn Trent selected the separation SuDS solution because the higher capital costs were offset by other benefits
Table 1 Costs and benefits of drainage improvements in part of Stoke-on-Trent
Do nothing Standard option
SuDS
Sewer flooding benefits 5 5 5
Other flooding benefits 0 0 3
Change in runoff to combined sewer (m3year) 0 0 ‐40000
Estimated cost (pound) 0 168000 419000
42httpwwwciwemorgmedia695460Paper203_Creating20Sewer20Capacity_Presentation2 0by20Mike20Woodpdf
205240txt012|May 2013
29
Drainage Strategy Framework
Do nothing Standard option
SuDS
Social Cost Benefit (pound) 16000 5000 51000
Change in electricity costs (poundyear) 0 +75 ‐525
Programme impact (years to deliver solution) + 4 0 +4
CSO spill volume (m3 in 1year event) +298 0 ‐397
243 Good practice example ndash New York City comparison of grey and green infrastructure drainage strategies
This example is taken from New York in the United States of America Itrsquos an illustration of how whole life costs have been compared for alternative strategies to solve urban drainage issues on a mega‐city scale The key data are summarised in Table 2
Table 2 Comparing drainage strategies in New York
Grey Strategy
Green Strategy
CSO spill volume reduction (billion gallons year)
101 122
Wider benefits over 20 years ($ million) 0 139 to 418
Whole life costs over 20 years ($ billion) 68 53
The information is taken from the New York City Green Infrastructure Plan43 produced by the Mayorrsquos Office in 2010 The Plan (and recent updates) provides a comprehensive evidence base around costs and benefits of different approaches to address the cityrsquos drainage problems It is therefore an excellent example of how drainage strategies can be described in plain language for a non‐specialist audience concerned with their environment and the cost of providing infrastructure to enhance it
It is becoming commonplace for North American cities (eg Portland and Philadelphia) to address the issue of frequent combined sewer overflow (CSO) operation by using a combination of grey infrastructure (sewers) and green infrastructure (sustainable drainage systems) The wider health
43 httpwwwnycgovhtmldephtmlstormwaternyc_green_infrastructure_planshtml
205240txt012|May 2013
30
25
Drainage Strategy Framework
and ecological benefits of green infrastructure approaches and the reduced reliance on materials and energy are attractive to utility planners and cities alike
New York has 422 CSOs and an agreed Long Term Control Strategy to significantly reduce the impact wet weather discharges have on aquatic systems throughout the city Annual discharges are currently (2010) estimated to be 30 billion gallons (114 million cubic meters) per year Building on existing and committed new sewer plans an agreed grey infrastructure based strategy to this problem is set to reduce these discharges to 198 billion gallons per year (a 34 reduction) by the 2030s An alternative green infrastructure approach based around intercepting the first inch (25mm) of rainfall across 10 of the impermeable city area by 2030 is predicted to reduce CSO spills to 179 billion gallons per year
Planners have calculated that the whole life costs after 20 years of the grey infrastructure solution will be $68 billion (2010 prices) compared to the green infrastructure whole life costs of $53 billion The green infrastructure strategy reduces CSO spills by more than the grey alternative for $15 billion less in terms of whole life cost Further planners have calculated that New Yorkers will benefit by up to $41844 million (accumulated over 20 years) in additional benefits associated with lower energy bills from control of urban heating increased property values and improved health
Based on this analysis New York City has committed itself to an aggressive green infrastructure based runoff control strategy to provide long term reductions in CSO spills The plan is to achieve interception of 15 of impermeable area by 2015 4 by 2020 7 by 2025 and 10 by 2030
Principle Five Live Process
The Strategy should be adaptable and periodically reviewed Whilst outcomes are expected to be relatively stable over time the pace at which the Strategy delivers outcomes will be linked to volatile influences (like climate and population change) and to the decisions made at each price review about the priorities for the following period The Strategy should be reviewed at regular intervals to reflect investments already made the changing priorities of the water and sewerage company and partners and the presence of emerging risks The review is also an opportunity to report drainage catchment performance relative to performance measures designed to monitor progress towards achieving outcomes
44 Estimated using methods from the New York Municipal Forest Resource Analysis (MFRA) prepared by the US Dept of Agriculture
205240txt012|May 2013
31
Drainage Strategy Framework
251 Recommended good practice
No Good practice Example references
1 Regularly repeat screening exercise to determine catchments requiring a Drainage Strategy and modify programme of Strategy development accordingly
Check for changes in measured rates of flooding and pollution incidents blockages collapses pumping station failures etc
Check for changes in extent and location of new development
Check for activities being undertaken by partners (eg redevelopment urban realm improvements and flooding and pollution management activities)
SRM5 illustrates how improved and updated knowledge of system performance should be applied to establish Strategies
2 In lsquolive Strategiesrsquo repeat risk assessment when data and models improve and adjust confidence scores accordingly
Confirm that Strategy will still achieve performance indicators and outcomes at least cost Revise Strategy as necessary
3 Periodically refresh Strategy accommodating impact of interventions already delivered using re‐verified predictive tools as appropriate
Confirm that Strategy will still achieve performance indicators and outcomes at least cost Revise Strategy as necessary
Triggers for a wholesale review of the Strategy are likely to be significant changes to the location or extent of planned development
4 Monitor report and share (with partners) the measures used to demonstrate delivery of outcomes Example measures may include the number of properties which experience sewer flooding the number of properties at risk of flooding the number of properties at risk from sewerage asset failure risk indices that capture both the probability and consequence of failure customer satisfaction with regards to clean rivers and beaches the number of pollution incidents the frequency of combined sewer overflow operation and compliance with discharge permit conditions
252 Good practice example ndash Thames Water live DAP
Thames Water has initiated a DAP (drainage area plan) Live approach Itrsquos a good example of how companies are continuously monitoring and updating the status of drainage area risks It provides a lsquoliversquo snapshot of the current health of all drainage areas in Thames Waterrsquos region allowing real time planning as part of a strategic approach It enables drainage planners to view the effectiveness
205240txt012|May 2013
32
Drainage Strategy Framework
of intervention strategies and compare incident rates across varying geographies and development types in the Thames Valley
DAP Live will be available for all catchments in the Thames Water area thus enabling
bull high level monitoring of risks across the business bull a live and strategic review of catchment performance bull prioritisation of catchments based on risk and bull an ability to share data with partners collaborating in drainage planning and improvements
Figure 12 illustrates the types of data managed through the DAP Live system These include asset data political and drainage boundaries environmental data operational data property amp growth data and modelling data As new data become available the DAP Live system is updated so that drainage planners have the most current view on emerging risks and issues
Asset data
Operational data
Property and growth data
Modelling data
Environmental data
Boundaries (SDACs operational political)
Figure 12 Data types held in the DAP Live system
Figure 13 illustrates how the system can provide analysis at a variety of scales from local authority boundaries sewage treatment works catchments drainage areas or a regular grid
205240txt012|May 2013
33
Drainage Strategy Framework
NE PROVINCES
WESTERN PROVINCES
NE LONDON bull Ops areas local W LONDON
SE LONDON authorities Large TIDWORTH SE PROVINCES
bull STW Catchments
bull Drainage areas(SDACs)
bull Regular grid Small
Figure 13 DAP Live reporting performance at different scales
205240txt012|May 2013
34
Drainage Strategy Framework
253 Good practice example ndash Wessex Water Water live data
Wessex Water is regularly using data geospatially to proactively identify and respond to risk Theirs is a good example of how data can be used to provide an adaptable approach that is regularly reviewed to plan investment
The risk‐based and live approach uses a set of likelihood and consequence models which are built up from all currently available data asset data (eg CCTV data material age) operational data (eg flooding and pollutions incidents) and information (eg locality near hospital or downstream of an overflow) All these data are collated for the entire Wessex region updated regularly and analysed geospatially
Figure 14 Sewer risk scores presented in a risk matrix and geospatially
This allows a risk score (Figure 14) to be calculated for each mapped sewer length which directs investigation more efficiently by allocating each mapped sewer a planned CCTV inspection date
This risk‐based approach has been successful in targeting problematic sewers increasing identification rates threefold Density analysis is performed using asset failure and operational information which allows planning of both proactive structural and operational investment
Proactively found structural issues are far more cost effective to repair before failure and can also prevent serviceability issues
205240txt012|May 2013
35
f
DDrainage Strateegy Frameworrk
Figgure 15 Hotsppot analysis
Thhe hotspot annalysis (Figuure 15) showss where operrational clustters have beeen calculatedd This hootspot analyssis is made aavailable on tthe Wessex WWater corporrate GIS to a llow operati onal staff to target their effforts to mitiggate against ffurther repeaat incidents AAdditional innformation ffrom asset annd operationnal activities ccan be addedd regularly too the databasses which drrive the mod els enabling rissk scores to bbe kept as livve as require d
226 Prrinciple Sixx Innovativve and Susstainable SSolutions
Thhe Drainage Strategy Fraamework proomotes the fuull evaluationn of alternatiives to tradit ionally enngineered sewwerage soluttions to test wwhether thesse offer loweer whole life ccost options or better reesponses to uuncertainty It is anticipaated that draainage solutioons of the futture will be ddifferent froom the ones we are usedd to
Thhese should iinclude (at leeast at a highh level) real ttime control storm waterr retrofit techhniques edducation to eenable custommers to changge behaviou r enhancingg incentives for customerss to reduce suurface water flowing to seewers and innnovative pe rmitting arraangements a cross drainagge networks annd sewage tr eatment worrks Water annd sewerage companies sshould continnue to revieww and deevelop other innovative ssolutions
Foor example wwhere a commpany may hiistorically haave preferredd to tackle seewer floodingg or coombined sewwer overflow pollution byy increasing iits undergrouund equipmment to store mmore rainfalll duuring stormss it might connsider other options in fuuture ndash such as working wwith custommers to mmanage the raainfall close tt eventing it foorm enteringg the sewer syystem o source pre
2205240txt012|Mayy 2013
36
Drainage Strategy Framework
261 Recommended good practice
No Good practice Example references
1 Use cost‐benefit methods to demonstrate that innovative and sustainable solution types provide best value for customers and the wider community
UKWIR will publish new research and guidance in 2013 addressing active control and storm water removal demonstrating how these technologies can be justified and included within Drainage Strategies
2 Consider integrated water resource management Work with partners (especially developers and local authorities) to examine whether use of stored stormwater reduces potable water consumption AND need for capacity in sewers
CIRIA has published a scoping study for water sensitive urban design45 in the UK
3 Consider a mix of conventional and new technologies using more adaptive approaches as low‐regrets responses to uncertainty eg prevent current sewer flooding with underground tank storage but address future risks (worsened by climate change) with retrofit SuDS implemented progressively
CIRIA has published lsquoRetrofitting to manage surface waterrsquo46 a comprehensive guide to planning and delivering this type of project
4 Use carbon accounting methods to compare embodied and emitted carbon in alternative intervention strategies so that these impacts are accounted for in whole life costs
Consider the benefits of surface water removal on the costs (including carbon) of pumping and sewage treatment
UKWIR47 has and continues to publish detailed guidance on carbon accounting for water and sewerage company use
45httpwwwciriaorgserviceresearch_informationAMContentManagerNet ContentDisplayaspxSection=research_informationampContentID=23581 46httpwwwciriaorgSERVICEHomecoreordersproductaspxcatid=5ampprodid=1909 47httpukwirforefront‐librarycomreports08‐cl‐01‐6923419000190269902659465890269
205240txt012|May 2013
37
Drainage Strategy Framework
No Good practice Example references
5 Where interventions include the provision of green space public amenity and improved habitats then Payment for Ecosystem Services approaches can be used to claim further monetised benefits in the appraisal Customers should be consulted to help value these benefits
The Environment Agency will publish data in 2013 on costs and benefits of retrofit stormwater projects to promote understanding and uptake
6 Share data within the industry on innovative solutions to increase knowledge of new technology and SuDs approaches
EA retrofitting SuDs costs and benefits database48
accommodating data from Ofwat AMP5 SuDS pilot initiative and other examples
262 Good practice example ndash Welsh Water surface water reduction and removal strategy for Gowerton and Llanelli
Dŵr Cymru Welsh Water and partners are applying innovative storm water removal methods to address capacity problems in the sewer network in Gowerton and Llanelli49 (population 140000) Current under capacity leads to localised sewer flooding and excessive combined sewer overflow (CSO) spill to the Burry Inlet a protected shellfish water and special area of conservation The capacity problems in the system were a concern for the Environment Agency (Wales) and there was a risk of widespread restrictions to economic development being imposed Dŵr Cymru Welsh Water Carmarthenshire County Council City and County of Swansea Consumer Council for Water Environment Agency Wales and the Welsh Government all worked in partnership to resolve the situation
A brand new hydraulic model was built for the entire sewerage network with particular attention paid to accurately representing the sources of storm run‐off and infiltration The model was verified against data from flow monitors and observed CSO spill frequencies into the Burry Inlet
To begin with a traditional sewer storage solution was proposed that would result in an average 10 spills a year into the shellfish water from all 90 CSOs in the two catchments Although this reduced spills and dealt with some of the flooding and growth issues the storage requirements would have been unaffordable provide no protection against long term climate change and would not tackle the fundamental problem of too much surface water getting into the combined network
An alternative approach based on the reduction and removal of storm water from the combined sewer system was also developed This was in accordance with Dŵr Cymru Welsh Waterrsquos Rainscape50 (surface water elimination and reduction) strategy To identify areas with the most
48httpevidenceenvironment‐agencygovukfcermenDefaultHomeAndLeisureFloodsWhatWereDoingIntoTheFutureScience ProgrammeResearchAndDevelopmentFCRMProjectaspxProjectID=15515be8‐bbed‐4204‐ae56‐3e810ba47694ampPageID=56bad68e‐dcb1‐4bf8‐84cc‐cbfd03ab63a2 49 httpwwwciwemorgmedia674511Paper20820Stephen20Ollierpdf 50httpwwwdwrcymrucom_libraryleaflets_publications_english
205240txt012|May 2013
38
Drainage Strategy Framework
potential for effective storm water removal a flowareaflooding thematic map was developed This was used to focus attention on areas which would deliver the most benefit if storm water removal was carried out These areas are coloured red in Figure 16
Figure 16 Thematic map showing areas of maximum potential for storm water removal
The following interventions (181 in total) were combined into single strategy to be delivered in phases by 2015 2020 and afterwards
bull The management of surface water through swales basins and soakaways rather than through combined sewers resulting in new amenity and ecological areas within the built‐up environment
bull Implementing smarter flow control to better use existing storage and conveyance assets bull Relining of sewers to prevent groundwater ingress bull Removal of land drainage connections to sewers bull Household rainwater harvesting retrofit schemes
surface_water_management_strategypdf
205240txt012|May 2013
39
Drainage Strategy Framework
Figure 17 is an artistrsquos impression of what one of the sustainable urban drainage system solutions may look like
Figure 17 Example retrofit SuDS solution proposed for Gowerton and Llanelli
Modelling has demonstrated that the alternative strategy will achieve the same CSO reduction benefit as the storage strategy together with flooding improvements and additional less tangible benefits at significantly lower cost than the traditional sewer storage solution
Figure 18 illustrates the dispersed nature of solutions identified for central Llanelli
Figure 18 Water sensitive urban design interventions planned for central Llanelli
205240txt012|May 2013
40
Drainage Strategy Framework
Appendix A
Glossary
205240txt012|May 2013
Drainage Strategy Framework
Appendix A Glossary
CAPEX Capital expenditure Appointed water and sewerage companiesrsquo spending on new replacement or refurbished capital assets such as construction or buying machinery
CIWEM Urban Drainage Group (WaPUG) A group of the Chartered Institution of Water and Environmental Management supporting professionals working in urban drainage
Combined Sewer Overflow (CSO) The discharge of untreated sewage diluted with storm water into rivers and the sea CSOs occur during heavy rain and are necessary to reduce the risk of sewer flooding The physical overflow structure is also called a CSO
Common Framework for Capital A planning approach developed for the water and Maintenance Planning sewerage companies in 2002 which provides a robust basis
for assessing future capital maintenance needs The approach is consistent with the needs of Ofwat
Defra The Department for Environment Food and Rural Affairs The Government Department with responsibility for water flooding and water quality in England
Drainage Area Plan (DAP) A detailed plan for a drainage catchment that prioritises a list of interventions based on risk using an approach established in the WRc Sewerage Rehabilitation Manual This approach has been succeeded by Sewerage Risk Management which guides the preparation of Sewerage Management Plans (SMP) Companies vary in how they prepare DAPs or SMPs (or their equivalents) following the general principles that have been established
Drainage Strategy Developed by water and sewerage companies to demonstrate how outcomes will be delivered in drainage catchments over the long term Drainage Strategies will use the information developed in producing a DAPSMP and if a drainage strategy has been produced this should be the starting point in producing a more detailed DAPSMP should this be required It is likely that the activities required to prepare DAPSMP and Drainage Strategies may overlap Drainage Strategies might not refer to specific interventions but instead outline a general approach
Drainage Strategy Framework Guidance to describe the contents and intention of Drainage Strategies
205240txt012|May 2013
Drainage Strategy Framework
Flood Risk Management Plans Required by the Flood Risk Regulations in Flood Risk Areas by December 2015
Flood Risk Regulations The legislative instrument used to implement the requirements of the Floods Directive in England and Wales
Floods Directive DIRECTIVE 200760EC of the European Parliament and of the Council of 23 October 2007 on the assessment and management of flood risks
Lead Local Flood Authority (LLFA) The Shire County or unitary authority with responsibility for managing local flood risk
Local development plans Developed by planning authorities to explain where and what type of development (new homes and businesses) will occur within their area They are required to explain water infrastructure needs to support this development
Local Flood Risk Management Strategy Developed by the Lead Local Flood Authority to explain (LFRMS) how local flood risk will be managed by the Authority and
in partnership with others
Natural Resources Wales From 1 April 2013 Natural Resources Wales (NRW) a new body formed by the Welsh Government will take over the functions previously carried out by the Environment Agency (EA) in Wales alongside those of the Forestry Commission Wales and the Countryside Council for Wales
Ofwat The Water Services Regulation Authority ndash the economic regulator of the water and sewerage companies of England and Wales
OPEX Operating expenditure Appointed water and sewerage companiesrsquo day‐to‐day spending on running the services for example staff costs and power This is likely to include investment in joint projects that do not create or relate to an asset that the company solely or jointly owns
Outcomes Outcomes are the higher level objectives that a companyrsquos actions are intended to deliver A companyrsquos outcome should reflect its customersrsquo priorities identified through appropriate customer engagement and deliver the best long‐term sustainable solution for customers and the environment An outcome may not be bound by a single price control period and should be set in the context of customersrsquo and the environmentrsquos long‐term needs
205240txt012|May 2013
Drainage Strategy Framework
Price Review The process of setting appointed water and sewerage companiesrsquo price limits The next price review will take place in 2014 for the period 2015‐20 Ofwat currently sets price limits every five years
Real Time Control (RTC) Using actuated pumps gates and weirs to actively control flow in sewers Better use can be made of existing infrastructure and links can be made between network treatment and receiving water systems for operational benefits Sometimes referred to as Active Management
River Basin Management (Plans) River Basin Management is a continuous process of planning (to develop River Basin Management Plans) and delivery The Water Framework Directive introduces a formal series of 6 year cycles The first cycle will end in 2015 when following further planning and consultation the River Basin Management Plans will be updated and reissued
Sewerage Management Plan A risk based approach to indentifying investment needs in sewerage systems as described in the Sewerage Risk Management (SRM) approach developed by WRc plc
Storm water retrofit Releasing capacity in sewers by controlling stormwater at the surface using disconnection swales and other sustainable drainage systems (SuDS)
205240txt012|May 2013
We are the Environment Agency We protect and improve the environment and make it a better place for people and wildlife We operate at the place where environmental change has its greatest impact on peoplersquos lives We reduce the risks to people and properties from flooding make sure there is enough water for people and wildlife protect and improve air land and water quality and apply the environmental standards within which industry can operate Acting to reduce climate change and helping people and wildlife adapt to its consequences are at the heart of all that we do We cannot do this alone We work closely with a wide range of partners including government business local authorities other agencies civil society groups and the communities we serve
wwwenvironment‐agencygovuk
Environment Agency National Customer Contact Centre
Telephone 03708 506 506 enquiriesenvironment‐agencygovuk
Ofwat (The Water Services Regulation Authority) is a non‐ministerial government department We are responsible for making sure that the water and sewerage sectors in England and Wales provide consumers with a good quality and efficient service at a fair price
wwwofwatgovuk
Telephone 0121 644 7500 mailboxofwatgsigovuk
Halcrow Group Limited Burderop Park Swindon Wiltshire SN4 0QD
tel 01793 812479 fax 01793 812089 halcrowcom
Halcrow Group Limited is a CH2M HILL company Halcrow Group Limited has prepared this report in accordance with
the instructions of The Environment Agency for the clientrsquos sole and specific use Any other persons who use any information contained herein do so at their own risk

23
Drainage Strategy Framework
Principle Three Risk Based
Strategies should be risk based This means that planning operational and investment activities should be based on consideration of the probability and consequence of inadequate drainage function (risks) as these relate to the achievement of measures that demonstrate delivery of outcomes A risk based Strategy ensures that investment is made where risks are the greatest
To aid communication risks should be visualised through maps and plans (Figure 10 is an example) To aid risk assessment risks should be monetised combined and predicted into the future To aid options appraisal the impact of interventions on the level of risk should be predicted
The approach to Drainage Strategy development should be risk based itself The degree of detail included should be related to an understanding of the overall level of risks in the catchment now and in the future
231 Recommended good practice
No Good practice Example references
1 Determine where a Drainage Strategy is required by combining current performance with external influences likely to result in deteriorating performance This stage requires no modelling or detailed assessment On a catchment‐by‐catchment (drainage area) basis understand current risks by collating data on current performance eg blockages collapses pumping station failures pollution incidents CSO spills storm tank spills internal flooding incidents external flooding incidents and infiltration rates Relate these risks to performance indicators and the achievement of outcomes Combine with information about known growth rates predictions of urban creep quantity of newly adopted lsquoprivatersquo sewers surface water flooding risks (eg from flood map for surface water) WFD water body status and bathing water status Prioritise catchments with high current risks andor factors suggesting that risks are likely to worsen significantly in the future Consider normalising scoring method for size of catchment (eg by unit area or unit length of sewer) Consult with stakeholders to confirm correct prioritisation Commence with development of Drainage Strategies for the highest ranked catchments Periodically revisit prioritisation (updating with new data) to check that priorities are still correct
The initialisation stage of a Sewer Management Plan (SMP) (described in SRM5) considers how a risk assessment can be used to prioritise which spatial units (eg catchments) should be prioritised for a SMP study
2 Visualise catchment risks (from 1) to illustrate and explain to partners the reasons for prioritisation Accommodate their views amp consider changing prioritisation to aid wider drainage planning requirements (eg increase prioritisation of a catchment with significant surface water flooding problems where close collaboration between water and sewerage company and LLFA will benefit the community)
205240txt012|May 2013
22
Drainage Strategy Framework
No Good practice Example references
3 Clearly relate sewerage risks to the performance indicators that will be used to measure progress towards achieving outcomes eg relate blockage rates to flooding and pollution incidents eg relate increase in flows to increased CSO frequency breaches of permit conditions and deterioration in receiving water quality Adopt a sourcendashpathway‐receptor model and workshop techniques to ensure that cause effect and consequences are fully captured Use performance indicators as the basis for a comprehensive risk assessment that considers likelihood (frequency) and consequence (extent degree and duration of impact) of failure expressed as risk scores Monetise risks in GBP (pound) to align with principle four (whole life costs amp benefits) Use (verified) predictive models to understand near term (lt10 years) and long term (gt30 years) risks The latter to align with principle four (whole life costs amp benefits) Align complexity of method with level of risk recognising the needs of partners eg use complex 2D flood routing models to ascertain (with greater certainty) flood mechanisms and damages where the quantity and frequency of flooding is high and interventions will be complex and costly Elsewhere more simple approaches are appropriate eg use complex UPM3 water quality modelling methods where compliance with river standards or discharge consents is already failing or is expected to do so Elsewhere more simple approaches are appropriate Combine risk scores from different risks to describe the total level of risk in a catchment Use visualisation techniques to communicate combined level of risk Combine analysis from hydraulic blockage and asset deterioration models on a catchment basis In hydraulic analysis consider flooding performance for rainfall events beyond the usually provided standard of protection to understand performance in extreme events in support of partners (especially LLFAs) and in search of cost beneficial interventions at a higher standard than normal
SRM 5 (S3‐03) details approaches to simple and more complex approaches to risk assessment that are consistent with CMPCF guidelines
4 Be alert to interactions between sewer networks and wastewater treatment plans eg by modelling the impact of changing sewer flows on wastewater treatment worksrsquo performance and costs Consider combined impact of different catchments on a single or linked water body (eg an inland river bathing water or shell fishery)
UPM3 guidance discusses approaches to understanding these interactions and applying more complex water quality impact models
5 Establish systems and apply methods to predict how interventions can reduce risks eg how a targeted and pro‐active maintenance can reduce the occurrence of sewer blockage and flooding from lsquoother causesrsquo eg how reducing infiltration can reduce CSO spills eg how reducing connected impermeable area can reduce sewer flooding
205240txt012|May 2013
23
Drainage Strategy Framework
232 Good practice example ndash United Utilities risk assessment
United Utilities has demonstrated a robust risk based approach in the development of sewerage management plans used for long term planning across their area of operations
Hydraulic models were applied in 235 catchments and configured to look at future performance and to evaluate the consequences of inadequate capacity Starting from a baseline of 2010 versions of the models were built for 2020 and 2036 epochs The following model input parameters were adjusted population water consumption infiltration planned development known sewerage improvement projects urban creep rainfall (for climate change)
Two‐dimensional (2D) modelling was used to consider the consequences of sewer flooding resulting from the changes made to reflect the future operating environments As well as the impact on homes and business (from internal and external flooding) the flood risk to critical infrastructure was also considered The operation of CSOs was considered by computing the annual spill volume duration and frequency
Finally predictions of the likelihood and consequence of sewer failure were added taking account of sewer material age and the incident records relating to similar assets
All these data were combined and weighted to generate a Sewer Management Plan (SMP) Risk Score for each length of sewer The process is illustrated in Figure 9
Figure 9 United Utilitiesrsquo process for calculating risk score in sewerage catchments
205240txt012|May 2013
24
Drainage Strategy Framework
Risk scores were summed spatially and monetised so that high priority locations could be identified Mapping and visualisation were used to communicate the results of this assessment priority areas for further investigation and how risks change through time (Figure 10)
Figure 10 Visualisation of sewerage risks
233 Good practice example ndash Northumbrian Water risk assessment
Northumbrian Water completes an annual assessment of hydraulic capacity in its sewerage network at the drainage area scale Its approach does not require hydraulic models to have been completed and yet can reliably highlight areas of under‐capacity in need of further investigation through more detailed analysis including hydraulic modelling New and emerging risk areas can also be identified by applying data for population growth which occurs through development lsquoWhat ifrsquo scenarios can be run to test when capacity limits may be overcome and flood risks potentially set to increase It demonstrates good lsquorisk basedrsquo planning principles because it shows the drainage planner where more detailed analysis is warranted
The approach uses the following data from company records population connected to sewer P water consumption rate G (lhd) trade discharge E (ls) pipe diameter and gradient pipe connectivity CSO consent pass forward rate (ls) pumping station rate (ls) sewage treatment flow rate (ls) A wastewater dry weather capacity map calculates pipe full capacity dry weather flow (PG+E+I) and Formula A flow for fully combined (1360P+2E+DWF) and separate (4PG+3I+E) areas of the network Infiltration (I) is assumed to be 50 PG +E
205240txt012|May 2013
25
Drainage Strategy Framework
A theoretical assessment of network capacity is then calculated by comparing Formula A with pipe full capacity flow consent values at CSOs and wastewater treatment works and pumping rates This determines areas of the network with a capacity shortfall with a potential capacity shortfall and with no capacity shortfall
When run across the whole company area approximately 100 out of 500 drainage areas were found to be under capacity Over 60 of these areas had recorded sewer flooding incidents In over 300 drainage areas there was no forecast capacity shortfall Only 7 of these drainage areas had recorded sewer flooding incidents Overall the system proved to be very reliable at predicting drainage areas likely to have sewer flooding problems because of sewer under‐capacity
In under capacity drainage areas an intermediate (hydraulic model based) assessment is then carried out Figure 11 shows the results thematically mapped for an example drainage area Red areas are predicted to have a very high risk of sewer flooding Yellow and green areas are predicted to have a low risk of sewer flooding
Figure 11 Example of a drainage area capacity map
205240txt012|May 2013
26
24
Drainage Strategy Framework
Principle Four Whole Life Costs and Benefits
Strategies should be informed by consideration of whole life costs and benefits They should promote a series of interventions which in view of the quantified uncertainties are most likely to result in performance indicators which demonstrate the achievement of outcomes at lowest cost to customers and the community more widely
Costs relate to capital and operational expenditure to deliver interventions and the monetised impacts of drainage failures such as flooding and pollution
Benefits relate to the reduction in risks from drainage failures such as flooding and pollution but should also include wider societal impacts such as those calculated using a lsquoPayments for Ecosystems Servicesrsquo approach
When considering the lsquowhole lifersquo the strategy should consider climate population and asset deterioration trends These are likely to increase risks over the long term if no interventions are made The strategy should state lsquowhatrsquo should be done but also broadly lsquowhenrsquo and in what sequence interventions should happen
241 Recommended good practice
No Good practice Example references
1 Predict risks into the future for at least two epochs le10 years (to understand what the company needs to do now and how this fits with longer term outcomes) and ge30 years to understand long term needs in light of changing population and other pressures
Account for the following changes in demand
bull Growth ‐ new homes and businesses
bull Urban creep ndash uncontrolled addition of connected impermeable area
bull Climate change ndash affecting design events (flood predictions) time‐series (CSO and treated effluent quantities) river flows and temperatures
bull Infiltrationexfiltration ndash through deteriorating sewer condition
bull Dry weather flows ndash through changes in water consumption rates
2 Combining monetised risks (associated with sewerage failures) determine whole life costs for a lsquodo nothingrsquo scenario (ie no interventions)
Include costs associated with electricity consumption (in the network and at the wastewater treatment works) and CO2 emissions
UKWIR will publish in 2014 a revision to their Long Term Least Cost Planning for Wastewater Supply‐Demand
guidance This may provide tools and methods for expressing costs and benefits to support the development of a Drainage Strategy
205240txt012|May 2013
27
Drainage Strategy Framework
No Good practice Example references
3 Test intervention strategies which keep performance indicators on track to deliver outcomes by adding capacity (supply) reducing flows (demand) or altering operational regimes
Include the costs of interventions and the benefits of reduced risks to inform selection of the most cost beneficial strategy over the whole life
Have regard to the timing of interventions recognising that uncertainty may require low‐regrets (insensitive to uncertainty) solutions and that delaying major interventions may be more affordable and attractive in the short term Discounting should be used to compare the costs and benefits of interventions occurring at different times
Recognise that some interventions will be obligatory and defined (eg maintenance of a spill frequency standard at a CSO) whilst others will be more discretionary focused on achieving outcomes rather than specific outputs
SRM5 (Section 8) defines and contrasts cost benefit analysis cost effectiveness analysis whole life cost analysis and risk cost benefit analysis
HM Treasury Green Book39
sets out a framework for the appraisal of long term projects which can be applied to the development of a Drainage Strategy
4 Donrsquot at first be concerned with the distribution of costs and benefits between partners who may be sharing costs Identify the most cost beneficial solution first and then debate and agree an equitable sharing of costs
Give equal weighting to OPEX (operating expenditure) and CAPEX (capital expenditure) costs so not to cause bias towards capital intensive solutions Properly consider the costs and benefits of pro‐active maintenance regimes and campaigns to influence customers to reduce fats oils and greases (FOG) build‐ups and the misuse of sewers
Consider the affordability of solutions the impact on customersrsquo bills and the resources of other organisations to play their part
UKWIR research outputs40 in 2013 (SW01) will provide a framework for making a business case for separating storm water from combined sewers
5 Where interventions include the provision of green space public amenity and improved habitats then Payment for Ecosystem Services approaches should be used to identify further monetised benefits in the appraisal Customers should be consulted to help value these benefits
Supplementary Green Book41
guidance describes methods for accounting for environmental impacts including the ecosystems approach
39 httpwwwhm‐treasurygovukdata_greenbook_indexhtm 40 httpwwwukwirorgpublishorsystemcomponent_viewaspLogDocId=96116 41 httpwwwhm‐treasurygovukdaccounting_environmental_impactspdf
205240txt012|May 2013
28
Drainage Strategy Framework
242 Good practice example ndash Severn Trent Water making the case for surface water separation in Stoke-on-Trent
In this example42 Severn Trent Water compared alternative ways of addressing sewer flooding problems by looking at a range of costs and benefits not all of which were directly associated with its specific responsibilities as a water and sewerage company Whilst the example does not express a monetised value for all costs and benefits over the whole life it does illustrate the types of factors which could be included in an appraisal of this type scaled to address problems at a catchment level It also demonstrates how working collaboratively can help identify solutions which are cost‐beneficial for the community at large
In an area of Stoke served by a combined sewer system five properties were at risk from sewer flooding in cellars for events equal to and less frequent than the 1 in 10 year probability A conventional sewer pumping station based solution was presented as the standard option
However a nearby former hospital site was also undergoing re‐development which would result in reduced runoff to the combined sewer The new drainage regime in the redevelopment site was sufficient to remove the flood risk at the five properties (this was a do nothing strategy)
A third option completely separated the development site runoff from the combined sewer and also addressed local flood risk issues nearby The solution required a new storm sewer and a network of swales and other SuDS features connecting with an ordinary watercourse
Table 1 illustrates how costs and benefits were compared across the three alternative strategies Each provided the same benefit in terms of the number of homes (5) relieved from sewer flooding The novel SuDS and surface water management solution additionally gave local flood risk relief to 3 further properties The separationSuDS strategy came at a higher capital cost but delivered greater social cost benefits savings in annual operating costs and a bonus improvement water quality (because of reduced CSO spill volume) Severn Trent selected the separation SuDS solution because the higher capital costs were offset by other benefits
Table 1 Costs and benefits of drainage improvements in part of Stoke-on-Trent
Do nothing Standard option
SuDS
Sewer flooding benefits 5 5 5
Other flooding benefits 0 0 3
Change in runoff to combined sewer (m3year) 0 0 ‐40000
Estimated cost (pound) 0 168000 419000
42httpwwwciwemorgmedia695460Paper203_Creating20Sewer20Capacity_Presentation2 0by20Mike20Woodpdf
205240txt012|May 2013
29
Drainage Strategy Framework
Do nothing Standard option
SuDS
Social Cost Benefit (pound) 16000 5000 51000
Change in electricity costs (poundyear) 0 +75 ‐525
Programme impact (years to deliver solution) + 4 0 +4
CSO spill volume (m3 in 1year event) +298 0 ‐397
243 Good practice example ndash New York City comparison of grey and green infrastructure drainage strategies
This example is taken from New York in the United States of America Itrsquos an illustration of how whole life costs have been compared for alternative strategies to solve urban drainage issues on a mega‐city scale The key data are summarised in Table 2
Table 2 Comparing drainage strategies in New York
Grey Strategy
Green Strategy
CSO spill volume reduction (billion gallons year)
101 122
Wider benefits over 20 years ($ million) 0 139 to 418
Whole life costs over 20 years ($ billion) 68 53
The information is taken from the New York City Green Infrastructure Plan43 produced by the Mayorrsquos Office in 2010 The Plan (and recent updates) provides a comprehensive evidence base around costs and benefits of different approaches to address the cityrsquos drainage problems It is therefore an excellent example of how drainage strategies can be described in plain language for a non‐specialist audience concerned with their environment and the cost of providing infrastructure to enhance it
It is becoming commonplace for North American cities (eg Portland and Philadelphia) to address the issue of frequent combined sewer overflow (CSO) operation by using a combination of grey infrastructure (sewers) and green infrastructure (sustainable drainage systems) The wider health
43 httpwwwnycgovhtmldephtmlstormwaternyc_green_infrastructure_planshtml
205240txt012|May 2013
30
25
Drainage Strategy Framework
and ecological benefits of green infrastructure approaches and the reduced reliance on materials and energy are attractive to utility planners and cities alike
New York has 422 CSOs and an agreed Long Term Control Strategy to significantly reduce the impact wet weather discharges have on aquatic systems throughout the city Annual discharges are currently (2010) estimated to be 30 billion gallons (114 million cubic meters) per year Building on existing and committed new sewer plans an agreed grey infrastructure based strategy to this problem is set to reduce these discharges to 198 billion gallons per year (a 34 reduction) by the 2030s An alternative green infrastructure approach based around intercepting the first inch (25mm) of rainfall across 10 of the impermeable city area by 2030 is predicted to reduce CSO spills to 179 billion gallons per year
Planners have calculated that the whole life costs after 20 years of the grey infrastructure solution will be $68 billion (2010 prices) compared to the green infrastructure whole life costs of $53 billion The green infrastructure strategy reduces CSO spills by more than the grey alternative for $15 billion less in terms of whole life cost Further planners have calculated that New Yorkers will benefit by up to $41844 million (accumulated over 20 years) in additional benefits associated with lower energy bills from control of urban heating increased property values and improved health
Based on this analysis New York City has committed itself to an aggressive green infrastructure based runoff control strategy to provide long term reductions in CSO spills The plan is to achieve interception of 15 of impermeable area by 2015 4 by 2020 7 by 2025 and 10 by 2030
Principle Five Live Process
The Strategy should be adaptable and periodically reviewed Whilst outcomes are expected to be relatively stable over time the pace at which the Strategy delivers outcomes will be linked to volatile influences (like climate and population change) and to the decisions made at each price review about the priorities for the following period The Strategy should be reviewed at regular intervals to reflect investments already made the changing priorities of the water and sewerage company and partners and the presence of emerging risks The review is also an opportunity to report drainage catchment performance relative to performance measures designed to monitor progress towards achieving outcomes
44 Estimated using methods from the New York Municipal Forest Resource Analysis (MFRA) prepared by the US Dept of Agriculture
205240txt012|May 2013
31
Drainage Strategy Framework
251 Recommended good practice
No Good practice Example references
1 Regularly repeat screening exercise to determine catchments requiring a Drainage Strategy and modify programme of Strategy development accordingly
Check for changes in measured rates of flooding and pollution incidents blockages collapses pumping station failures etc
Check for changes in extent and location of new development
Check for activities being undertaken by partners (eg redevelopment urban realm improvements and flooding and pollution management activities)
SRM5 illustrates how improved and updated knowledge of system performance should be applied to establish Strategies
2 In lsquolive Strategiesrsquo repeat risk assessment when data and models improve and adjust confidence scores accordingly
Confirm that Strategy will still achieve performance indicators and outcomes at least cost Revise Strategy as necessary
3 Periodically refresh Strategy accommodating impact of interventions already delivered using re‐verified predictive tools as appropriate
Confirm that Strategy will still achieve performance indicators and outcomes at least cost Revise Strategy as necessary
Triggers for a wholesale review of the Strategy are likely to be significant changes to the location or extent of planned development
4 Monitor report and share (with partners) the measures used to demonstrate delivery of outcomes Example measures may include the number of properties which experience sewer flooding the number of properties at risk of flooding the number of properties at risk from sewerage asset failure risk indices that capture both the probability and consequence of failure customer satisfaction with regards to clean rivers and beaches the number of pollution incidents the frequency of combined sewer overflow operation and compliance with discharge permit conditions
252 Good practice example ndash Thames Water live DAP
Thames Water has initiated a DAP (drainage area plan) Live approach Itrsquos a good example of how companies are continuously monitoring and updating the status of drainage area risks It provides a lsquoliversquo snapshot of the current health of all drainage areas in Thames Waterrsquos region allowing real time planning as part of a strategic approach It enables drainage planners to view the effectiveness
205240txt012|May 2013
32
Drainage Strategy Framework
of intervention strategies and compare incident rates across varying geographies and development types in the Thames Valley
DAP Live will be available for all catchments in the Thames Water area thus enabling
bull high level monitoring of risks across the business bull a live and strategic review of catchment performance bull prioritisation of catchments based on risk and bull an ability to share data with partners collaborating in drainage planning and improvements
Figure 12 illustrates the types of data managed through the DAP Live system These include asset data political and drainage boundaries environmental data operational data property amp growth data and modelling data As new data become available the DAP Live system is updated so that drainage planners have the most current view on emerging risks and issues
Asset data
Operational data
Property and growth data
Modelling data
Environmental data
Boundaries (SDACs operational political)
Figure 12 Data types held in the DAP Live system
Figure 13 illustrates how the system can provide analysis at a variety of scales from local authority boundaries sewage treatment works catchments drainage areas or a regular grid
205240txt012|May 2013
33
Drainage Strategy Framework
NE PROVINCES
WESTERN PROVINCES
NE LONDON bull Ops areas local W LONDON
SE LONDON authorities Large TIDWORTH SE PROVINCES
bull STW Catchments
bull Drainage areas(SDACs)
bull Regular grid Small
Figure 13 DAP Live reporting performance at different scales
205240txt012|May 2013
34
Drainage Strategy Framework
253 Good practice example ndash Wessex Water Water live data
Wessex Water is regularly using data geospatially to proactively identify and respond to risk Theirs is a good example of how data can be used to provide an adaptable approach that is regularly reviewed to plan investment
The risk‐based and live approach uses a set of likelihood and consequence models which are built up from all currently available data asset data (eg CCTV data material age) operational data (eg flooding and pollutions incidents) and information (eg locality near hospital or downstream of an overflow) All these data are collated for the entire Wessex region updated regularly and analysed geospatially
Figure 14 Sewer risk scores presented in a risk matrix and geospatially
This allows a risk score (Figure 14) to be calculated for each mapped sewer length which directs investigation more efficiently by allocating each mapped sewer a planned CCTV inspection date
This risk‐based approach has been successful in targeting problematic sewers increasing identification rates threefold Density analysis is performed using asset failure and operational information which allows planning of both proactive structural and operational investment
Proactively found structural issues are far more cost effective to repair before failure and can also prevent serviceability issues
205240txt012|May 2013
35
f
DDrainage Strateegy Frameworrk
Figgure 15 Hotsppot analysis
Thhe hotspot annalysis (Figuure 15) showss where operrational clustters have beeen calculatedd This hootspot analyssis is made aavailable on tthe Wessex WWater corporrate GIS to a llow operati onal staff to target their effforts to mitiggate against ffurther repeaat incidents AAdditional innformation ffrom asset annd operationnal activities ccan be addedd regularly too the databasses which drrive the mod els enabling rissk scores to bbe kept as livve as require d
226 Prrinciple Sixx Innovativve and Susstainable SSolutions
Thhe Drainage Strategy Fraamework proomotes the fuull evaluationn of alternatiives to tradit ionally enngineered sewwerage soluttions to test wwhether thesse offer loweer whole life ccost options or better reesponses to uuncertainty It is anticipaated that draainage solutioons of the futture will be ddifferent froom the ones we are usedd to
Thhese should iinclude (at leeast at a highh level) real ttime control storm waterr retrofit techhniques edducation to eenable custommers to changge behaviou r enhancingg incentives for customerss to reduce suurface water flowing to seewers and innnovative pe rmitting arraangements a cross drainagge networks annd sewage tr eatment worrks Water annd sewerage companies sshould continnue to revieww and deevelop other innovative ssolutions
Foor example wwhere a commpany may hiistorically haave preferredd to tackle seewer floodingg or coombined sewwer overflow pollution byy increasing iits undergrouund equipmment to store mmore rainfalll duuring stormss it might connsider other options in fuuture ndash such as working wwith custommers to mmanage the raainfall close tt eventing it foorm enteringg the sewer syystem o source pre
2205240txt012|Mayy 2013
36
Drainage Strategy Framework
261 Recommended good practice
No Good practice Example references
1 Use cost‐benefit methods to demonstrate that innovative and sustainable solution types provide best value for customers and the wider community
UKWIR will publish new research and guidance in 2013 addressing active control and storm water removal demonstrating how these technologies can be justified and included within Drainage Strategies
2 Consider integrated water resource management Work with partners (especially developers and local authorities) to examine whether use of stored stormwater reduces potable water consumption AND need for capacity in sewers
CIRIA has published a scoping study for water sensitive urban design45 in the UK
3 Consider a mix of conventional and new technologies using more adaptive approaches as low‐regrets responses to uncertainty eg prevent current sewer flooding with underground tank storage but address future risks (worsened by climate change) with retrofit SuDS implemented progressively
CIRIA has published lsquoRetrofitting to manage surface waterrsquo46 a comprehensive guide to planning and delivering this type of project
4 Use carbon accounting methods to compare embodied and emitted carbon in alternative intervention strategies so that these impacts are accounted for in whole life costs
Consider the benefits of surface water removal on the costs (including carbon) of pumping and sewage treatment
UKWIR47 has and continues to publish detailed guidance on carbon accounting for water and sewerage company use
45httpwwwciriaorgserviceresearch_informationAMContentManagerNet ContentDisplayaspxSection=research_informationampContentID=23581 46httpwwwciriaorgSERVICEHomecoreordersproductaspxcatid=5ampprodid=1909 47httpukwirforefront‐librarycomreports08‐cl‐01‐6923419000190269902659465890269
205240txt012|May 2013
37
Drainage Strategy Framework
No Good practice Example references
5 Where interventions include the provision of green space public amenity and improved habitats then Payment for Ecosystem Services approaches can be used to claim further monetised benefits in the appraisal Customers should be consulted to help value these benefits
The Environment Agency will publish data in 2013 on costs and benefits of retrofit stormwater projects to promote understanding and uptake
6 Share data within the industry on innovative solutions to increase knowledge of new technology and SuDs approaches
EA retrofitting SuDs costs and benefits database48
accommodating data from Ofwat AMP5 SuDS pilot initiative and other examples
262 Good practice example ndash Welsh Water surface water reduction and removal strategy for Gowerton and Llanelli
Dŵr Cymru Welsh Water and partners are applying innovative storm water removal methods to address capacity problems in the sewer network in Gowerton and Llanelli49 (population 140000) Current under capacity leads to localised sewer flooding and excessive combined sewer overflow (CSO) spill to the Burry Inlet a protected shellfish water and special area of conservation The capacity problems in the system were a concern for the Environment Agency (Wales) and there was a risk of widespread restrictions to economic development being imposed Dŵr Cymru Welsh Water Carmarthenshire County Council City and County of Swansea Consumer Council for Water Environment Agency Wales and the Welsh Government all worked in partnership to resolve the situation
A brand new hydraulic model was built for the entire sewerage network with particular attention paid to accurately representing the sources of storm run‐off and infiltration The model was verified against data from flow monitors and observed CSO spill frequencies into the Burry Inlet
To begin with a traditional sewer storage solution was proposed that would result in an average 10 spills a year into the shellfish water from all 90 CSOs in the two catchments Although this reduced spills and dealt with some of the flooding and growth issues the storage requirements would have been unaffordable provide no protection against long term climate change and would not tackle the fundamental problem of too much surface water getting into the combined network
An alternative approach based on the reduction and removal of storm water from the combined sewer system was also developed This was in accordance with Dŵr Cymru Welsh Waterrsquos Rainscape50 (surface water elimination and reduction) strategy To identify areas with the most
48httpevidenceenvironment‐agencygovukfcermenDefaultHomeAndLeisureFloodsWhatWereDoingIntoTheFutureScience ProgrammeResearchAndDevelopmentFCRMProjectaspxProjectID=15515be8‐bbed‐4204‐ae56‐3e810ba47694ampPageID=56bad68e‐dcb1‐4bf8‐84cc‐cbfd03ab63a2 49 httpwwwciwemorgmedia674511Paper20820Stephen20Ollierpdf 50httpwwwdwrcymrucom_libraryleaflets_publications_english
205240txt012|May 2013
38
Drainage Strategy Framework
potential for effective storm water removal a flowareaflooding thematic map was developed This was used to focus attention on areas which would deliver the most benefit if storm water removal was carried out These areas are coloured red in Figure 16
Figure 16 Thematic map showing areas of maximum potential for storm water removal
The following interventions (181 in total) were combined into single strategy to be delivered in phases by 2015 2020 and afterwards
bull The management of surface water through swales basins and soakaways rather than through combined sewers resulting in new amenity and ecological areas within the built‐up environment
bull Implementing smarter flow control to better use existing storage and conveyance assets bull Relining of sewers to prevent groundwater ingress bull Removal of land drainage connections to sewers bull Household rainwater harvesting retrofit schemes
surface_water_management_strategypdf
205240txt012|May 2013
39
Drainage Strategy Framework
Figure 17 is an artistrsquos impression of what one of the sustainable urban drainage system solutions may look like
Figure 17 Example retrofit SuDS solution proposed for Gowerton and Llanelli
Modelling has demonstrated that the alternative strategy will achieve the same CSO reduction benefit as the storage strategy together with flooding improvements and additional less tangible benefits at significantly lower cost than the traditional sewer storage solution
Figure 18 illustrates the dispersed nature of solutions identified for central Llanelli
Figure 18 Water sensitive urban design interventions planned for central Llanelli
205240txt012|May 2013
40
Drainage Strategy Framework
Appendix A
Glossary
205240txt012|May 2013
Drainage Strategy Framework
Appendix A Glossary
CAPEX Capital expenditure Appointed water and sewerage companiesrsquo spending on new replacement or refurbished capital assets such as construction or buying machinery
CIWEM Urban Drainage Group (WaPUG) A group of the Chartered Institution of Water and Environmental Management supporting professionals working in urban drainage
Combined Sewer Overflow (CSO) The discharge of untreated sewage diluted with storm water into rivers and the sea CSOs occur during heavy rain and are necessary to reduce the risk of sewer flooding The physical overflow structure is also called a CSO
Common Framework for Capital A planning approach developed for the water and Maintenance Planning sewerage companies in 2002 which provides a robust basis
for assessing future capital maintenance needs The approach is consistent with the needs of Ofwat
Defra The Department for Environment Food and Rural Affairs The Government Department with responsibility for water flooding and water quality in England
Drainage Area Plan (DAP) A detailed plan for a drainage catchment that prioritises a list of interventions based on risk using an approach established in the WRc Sewerage Rehabilitation Manual This approach has been succeeded by Sewerage Risk Management which guides the preparation of Sewerage Management Plans (SMP) Companies vary in how they prepare DAPs or SMPs (or their equivalents) following the general principles that have been established
Drainage Strategy Developed by water and sewerage companies to demonstrate how outcomes will be delivered in drainage catchments over the long term Drainage Strategies will use the information developed in producing a DAPSMP and if a drainage strategy has been produced this should be the starting point in producing a more detailed DAPSMP should this be required It is likely that the activities required to prepare DAPSMP and Drainage Strategies may overlap Drainage Strategies might not refer to specific interventions but instead outline a general approach
Drainage Strategy Framework Guidance to describe the contents and intention of Drainage Strategies
205240txt012|May 2013
Drainage Strategy Framework
Flood Risk Management Plans Required by the Flood Risk Regulations in Flood Risk Areas by December 2015
Flood Risk Regulations The legislative instrument used to implement the requirements of the Floods Directive in England and Wales
Floods Directive DIRECTIVE 200760EC of the European Parliament and of the Council of 23 October 2007 on the assessment and management of flood risks
Lead Local Flood Authority (LLFA) The Shire County or unitary authority with responsibility for managing local flood risk
Local development plans Developed by planning authorities to explain where and what type of development (new homes and businesses) will occur within their area They are required to explain water infrastructure needs to support this development
Local Flood Risk Management Strategy Developed by the Lead Local Flood Authority to explain (LFRMS) how local flood risk will be managed by the Authority and
in partnership with others
Natural Resources Wales From 1 April 2013 Natural Resources Wales (NRW) a new body formed by the Welsh Government will take over the functions previously carried out by the Environment Agency (EA) in Wales alongside those of the Forestry Commission Wales and the Countryside Council for Wales
Ofwat The Water Services Regulation Authority ndash the economic regulator of the water and sewerage companies of England and Wales
OPEX Operating expenditure Appointed water and sewerage companiesrsquo day‐to‐day spending on running the services for example staff costs and power This is likely to include investment in joint projects that do not create or relate to an asset that the company solely or jointly owns
Outcomes Outcomes are the higher level objectives that a companyrsquos actions are intended to deliver A companyrsquos outcome should reflect its customersrsquo priorities identified through appropriate customer engagement and deliver the best long‐term sustainable solution for customers and the environment An outcome may not be bound by a single price control period and should be set in the context of customersrsquo and the environmentrsquos long‐term needs
205240txt012|May 2013
Drainage Strategy Framework
Price Review The process of setting appointed water and sewerage companiesrsquo price limits The next price review will take place in 2014 for the period 2015‐20 Ofwat currently sets price limits every five years
Real Time Control (RTC) Using actuated pumps gates and weirs to actively control flow in sewers Better use can be made of existing infrastructure and links can be made between network treatment and receiving water systems for operational benefits Sometimes referred to as Active Management
River Basin Management (Plans) River Basin Management is a continuous process of planning (to develop River Basin Management Plans) and delivery The Water Framework Directive introduces a formal series of 6 year cycles The first cycle will end in 2015 when following further planning and consultation the River Basin Management Plans will be updated and reissued
Sewerage Management Plan A risk based approach to indentifying investment needs in sewerage systems as described in the Sewerage Risk Management (SRM) approach developed by WRc plc
Storm water retrofit Releasing capacity in sewers by controlling stormwater at the surface using disconnection swales and other sustainable drainage systems (SuDS)
205240txt012|May 2013
We are the Environment Agency We protect and improve the environment and make it a better place for people and wildlife We operate at the place where environmental change has its greatest impact on peoplersquos lives We reduce the risks to people and properties from flooding make sure there is enough water for people and wildlife protect and improve air land and water quality and apply the environmental standards within which industry can operate Acting to reduce climate change and helping people and wildlife adapt to its consequences are at the heart of all that we do We cannot do this alone We work closely with a wide range of partners including government business local authorities other agencies civil society groups and the communities we serve
wwwenvironment‐agencygovuk
Environment Agency National Customer Contact Centre
Telephone 03708 506 506 enquiriesenvironment‐agencygovuk
Ofwat (The Water Services Regulation Authority) is a non‐ministerial government department We are responsible for making sure that the water and sewerage sectors in England and Wales provide consumers with a good quality and efficient service at a fair price
wwwofwatgovuk
Telephone 0121 644 7500 mailboxofwatgsigovuk
Halcrow Group Limited Burderop Park Swindon Wiltshire SN4 0QD
tel 01793 812479 fax 01793 812089 halcrowcom
Halcrow Group Limited is a CH2M HILL company Halcrow Group Limited has prepared this report in accordance with
the instructions of The Environment Agency for the clientrsquos sole and specific use Any other persons who use any information contained herein do so at their own risk

Drainage Strategy Framework
No Good practice Example references
3 Clearly relate sewerage risks to the performance indicators that will be used to measure progress towards achieving outcomes eg relate blockage rates to flooding and pollution incidents eg relate increase in flows to increased CSO frequency breaches of permit conditions and deterioration in receiving water quality Adopt a sourcendashpathway‐receptor model and workshop techniques to ensure that cause effect and consequences are fully captured Use performance indicators as the basis for a comprehensive risk assessment that considers likelihood (frequency) and consequence (extent degree and duration of impact) of failure expressed as risk scores Monetise risks in GBP (pound) to align with principle four (whole life costs amp benefits) Use (verified) predictive models to understand near term (lt10 years) and long term (gt30 years) risks The latter to align with principle four (whole life costs amp benefits) Align complexity of method with level of risk recognising the needs of partners eg use complex 2D flood routing models to ascertain (with greater certainty) flood mechanisms and damages where the quantity and frequency of flooding is high and interventions will be complex and costly Elsewhere more simple approaches are appropriate eg use complex UPM3 water quality modelling methods where compliance with river standards or discharge consents is already failing or is expected to do so Elsewhere more simple approaches are appropriate Combine risk scores from different risks to describe the total level of risk in a catchment Use visualisation techniques to communicate combined level of risk Combine analysis from hydraulic blockage and asset deterioration models on a catchment basis In hydraulic analysis consider flooding performance for rainfall events beyond the usually provided standard of protection to understand performance in extreme events in support of partners (especially LLFAs) and in search of cost beneficial interventions at a higher standard than normal
SRM 5 (S3‐03) details approaches to simple and more complex approaches to risk assessment that are consistent with CMPCF guidelines
4 Be alert to interactions between sewer networks and wastewater treatment plans eg by modelling the impact of changing sewer flows on wastewater treatment worksrsquo performance and costs Consider combined impact of different catchments on a single or linked water body (eg an inland river bathing water or shell fishery)
UPM3 guidance discusses approaches to understanding these interactions and applying more complex water quality impact models
5 Establish systems and apply methods to predict how interventions can reduce risks eg how a targeted and pro‐active maintenance can reduce the occurrence of sewer blockage and flooding from lsquoother causesrsquo eg how reducing infiltration can reduce CSO spills eg how reducing connected impermeable area can reduce sewer flooding
205240txt012|May 2013
23
Drainage Strategy Framework
232 Good practice example ndash United Utilities risk assessment
United Utilities has demonstrated a robust risk based approach in the development of sewerage management plans used for long term planning across their area of operations
Hydraulic models were applied in 235 catchments and configured to look at future performance and to evaluate the consequences of inadequate capacity Starting from a baseline of 2010 versions of the models were built for 2020 and 2036 epochs The following model input parameters were adjusted population water consumption infiltration planned development known sewerage improvement projects urban creep rainfall (for climate change)
Two‐dimensional (2D) modelling was used to consider the consequences of sewer flooding resulting from the changes made to reflect the future operating environments As well as the impact on homes and business (from internal and external flooding) the flood risk to critical infrastructure was also considered The operation of CSOs was considered by computing the annual spill volume duration and frequency
Finally predictions of the likelihood and consequence of sewer failure were added taking account of sewer material age and the incident records relating to similar assets
All these data were combined and weighted to generate a Sewer Management Plan (SMP) Risk Score for each length of sewer The process is illustrated in Figure 9
Figure 9 United Utilitiesrsquo process for calculating risk score in sewerage catchments
205240txt012|May 2013
24
Drainage Strategy Framework
Risk scores were summed spatially and monetised so that high priority locations could be identified Mapping and visualisation were used to communicate the results of this assessment priority areas for further investigation and how risks change through time (Figure 10)
Figure 10 Visualisation of sewerage risks
233 Good practice example ndash Northumbrian Water risk assessment
Northumbrian Water completes an annual assessment of hydraulic capacity in its sewerage network at the drainage area scale Its approach does not require hydraulic models to have been completed and yet can reliably highlight areas of under‐capacity in need of further investigation through more detailed analysis including hydraulic modelling New and emerging risk areas can also be identified by applying data for population growth which occurs through development lsquoWhat ifrsquo scenarios can be run to test when capacity limits may be overcome and flood risks potentially set to increase It demonstrates good lsquorisk basedrsquo planning principles because it shows the drainage planner where more detailed analysis is warranted
The approach uses the following data from company records population connected to sewer P water consumption rate G (lhd) trade discharge E (ls) pipe diameter and gradient pipe connectivity CSO consent pass forward rate (ls) pumping station rate (ls) sewage treatment flow rate (ls) A wastewater dry weather capacity map calculates pipe full capacity dry weather flow (PG+E+I) and Formula A flow for fully combined (1360P+2E+DWF) and separate (4PG+3I+E) areas of the network Infiltration (I) is assumed to be 50 PG +E
205240txt012|May 2013
25
Drainage Strategy Framework
A theoretical assessment of network capacity is then calculated by comparing Formula A with pipe full capacity flow consent values at CSOs and wastewater treatment works and pumping rates This determines areas of the network with a capacity shortfall with a potential capacity shortfall and with no capacity shortfall
When run across the whole company area approximately 100 out of 500 drainage areas were found to be under capacity Over 60 of these areas had recorded sewer flooding incidents In over 300 drainage areas there was no forecast capacity shortfall Only 7 of these drainage areas had recorded sewer flooding incidents Overall the system proved to be very reliable at predicting drainage areas likely to have sewer flooding problems because of sewer under‐capacity
In under capacity drainage areas an intermediate (hydraulic model based) assessment is then carried out Figure 11 shows the results thematically mapped for an example drainage area Red areas are predicted to have a very high risk of sewer flooding Yellow and green areas are predicted to have a low risk of sewer flooding
Figure 11 Example of a drainage area capacity map
205240txt012|May 2013
26
24
Drainage Strategy Framework
Principle Four Whole Life Costs and Benefits
Strategies should be informed by consideration of whole life costs and benefits They should promote a series of interventions which in view of the quantified uncertainties are most likely to result in performance indicators which demonstrate the achievement of outcomes at lowest cost to customers and the community more widely
Costs relate to capital and operational expenditure to deliver interventions and the monetised impacts of drainage failures such as flooding and pollution
Benefits relate to the reduction in risks from drainage failures such as flooding and pollution but should also include wider societal impacts such as those calculated using a lsquoPayments for Ecosystems Servicesrsquo approach
When considering the lsquowhole lifersquo the strategy should consider climate population and asset deterioration trends These are likely to increase risks over the long term if no interventions are made The strategy should state lsquowhatrsquo should be done but also broadly lsquowhenrsquo and in what sequence interventions should happen
241 Recommended good practice
No Good practice Example references
1 Predict risks into the future for at least two epochs le10 years (to understand what the company needs to do now and how this fits with longer term outcomes) and ge30 years to understand long term needs in light of changing population and other pressures
Account for the following changes in demand
bull Growth ‐ new homes and businesses
bull Urban creep ndash uncontrolled addition of connected impermeable area
bull Climate change ndash affecting design events (flood predictions) time‐series (CSO and treated effluent quantities) river flows and temperatures
bull Infiltrationexfiltration ndash through deteriorating sewer condition
bull Dry weather flows ndash through changes in water consumption rates
2 Combining monetised risks (associated with sewerage failures) determine whole life costs for a lsquodo nothingrsquo scenario (ie no interventions)
Include costs associated with electricity consumption (in the network and at the wastewater treatment works) and CO2 emissions
UKWIR will publish in 2014 a revision to their Long Term Least Cost Planning for Wastewater Supply‐Demand
guidance This may provide tools and methods for expressing costs and benefits to support the development of a Drainage Strategy
205240txt012|May 2013
27
Drainage Strategy Framework
No Good practice Example references
3 Test intervention strategies which keep performance indicators on track to deliver outcomes by adding capacity (supply) reducing flows (demand) or altering operational regimes
Include the costs of interventions and the benefits of reduced risks to inform selection of the most cost beneficial strategy over the whole life
Have regard to the timing of interventions recognising that uncertainty may require low‐regrets (insensitive to uncertainty) solutions and that delaying major interventions may be more affordable and attractive in the short term Discounting should be used to compare the costs and benefits of interventions occurring at different times
Recognise that some interventions will be obligatory and defined (eg maintenance of a spill frequency standard at a CSO) whilst others will be more discretionary focused on achieving outcomes rather than specific outputs
SRM5 (Section 8) defines and contrasts cost benefit analysis cost effectiveness analysis whole life cost analysis and risk cost benefit analysis
HM Treasury Green Book39
sets out a framework for the appraisal of long term projects which can be applied to the development of a Drainage Strategy
4 Donrsquot at first be concerned with the distribution of costs and benefits between partners who may be sharing costs Identify the most cost beneficial solution first and then debate and agree an equitable sharing of costs
Give equal weighting to OPEX (operating expenditure) and CAPEX (capital expenditure) costs so not to cause bias towards capital intensive solutions Properly consider the costs and benefits of pro‐active maintenance regimes and campaigns to influence customers to reduce fats oils and greases (FOG) build‐ups and the misuse of sewers
Consider the affordability of solutions the impact on customersrsquo bills and the resources of other organisations to play their part
UKWIR research outputs40 in 2013 (SW01) will provide a framework for making a business case for separating storm water from combined sewers
5 Where interventions include the provision of green space public amenity and improved habitats then Payment for Ecosystem Services approaches should be used to identify further monetised benefits in the appraisal Customers should be consulted to help value these benefits
Supplementary Green Book41
guidance describes methods for accounting for environmental impacts including the ecosystems approach
39 httpwwwhm‐treasurygovukdata_greenbook_indexhtm 40 httpwwwukwirorgpublishorsystemcomponent_viewaspLogDocId=96116 41 httpwwwhm‐treasurygovukdaccounting_environmental_impactspdf
205240txt012|May 2013
28
Drainage Strategy Framework
242 Good practice example ndash Severn Trent Water making the case for surface water separation in Stoke-on-Trent
In this example42 Severn Trent Water compared alternative ways of addressing sewer flooding problems by looking at a range of costs and benefits not all of which were directly associated with its specific responsibilities as a water and sewerage company Whilst the example does not express a monetised value for all costs and benefits over the whole life it does illustrate the types of factors which could be included in an appraisal of this type scaled to address problems at a catchment level It also demonstrates how working collaboratively can help identify solutions which are cost‐beneficial for the community at large
In an area of Stoke served by a combined sewer system five properties were at risk from sewer flooding in cellars for events equal to and less frequent than the 1 in 10 year probability A conventional sewer pumping station based solution was presented as the standard option
However a nearby former hospital site was also undergoing re‐development which would result in reduced runoff to the combined sewer The new drainage regime in the redevelopment site was sufficient to remove the flood risk at the five properties (this was a do nothing strategy)
A third option completely separated the development site runoff from the combined sewer and also addressed local flood risk issues nearby The solution required a new storm sewer and a network of swales and other SuDS features connecting with an ordinary watercourse
Table 1 illustrates how costs and benefits were compared across the three alternative strategies Each provided the same benefit in terms of the number of homes (5) relieved from sewer flooding The novel SuDS and surface water management solution additionally gave local flood risk relief to 3 further properties The separationSuDS strategy came at a higher capital cost but delivered greater social cost benefits savings in annual operating costs and a bonus improvement water quality (because of reduced CSO spill volume) Severn Trent selected the separation SuDS solution because the higher capital costs were offset by other benefits
Table 1 Costs and benefits of drainage improvements in part of Stoke-on-Trent
Do nothing Standard option
SuDS
Sewer flooding benefits 5 5 5
Other flooding benefits 0 0 3
Change in runoff to combined sewer (m3year) 0 0 ‐40000
Estimated cost (pound) 0 168000 419000
42httpwwwciwemorgmedia695460Paper203_Creating20Sewer20Capacity_Presentation2 0by20Mike20Woodpdf
205240txt012|May 2013
29
Drainage Strategy Framework
Do nothing Standard option
SuDS
Social Cost Benefit (pound) 16000 5000 51000
Change in electricity costs (poundyear) 0 +75 ‐525
Programme impact (years to deliver solution) + 4 0 +4
CSO spill volume (m3 in 1year event) +298 0 ‐397
243 Good practice example ndash New York City comparison of grey and green infrastructure drainage strategies
This example is taken from New York in the United States of America Itrsquos an illustration of how whole life costs have been compared for alternative strategies to solve urban drainage issues on a mega‐city scale The key data are summarised in Table 2
Table 2 Comparing drainage strategies in New York
Grey Strategy
Green Strategy
CSO spill volume reduction (billion gallons year)
101 122
Wider benefits over 20 years ($ million) 0 139 to 418
Whole life costs over 20 years ($ billion) 68 53
The information is taken from the New York City Green Infrastructure Plan43 produced by the Mayorrsquos Office in 2010 The Plan (and recent updates) provides a comprehensive evidence base around costs and benefits of different approaches to address the cityrsquos drainage problems It is therefore an excellent example of how drainage strategies can be described in plain language for a non‐specialist audience concerned with their environment and the cost of providing infrastructure to enhance it
It is becoming commonplace for North American cities (eg Portland and Philadelphia) to address the issue of frequent combined sewer overflow (CSO) operation by using a combination of grey infrastructure (sewers) and green infrastructure (sustainable drainage systems) The wider health
43 httpwwwnycgovhtmldephtmlstormwaternyc_green_infrastructure_planshtml
205240txt012|May 2013
30
25
Drainage Strategy Framework
and ecological benefits of green infrastructure approaches and the reduced reliance on materials and energy are attractive to utility planners and cities alike
New York has 422 CSOs and an agreed Long Term Control Strategy to significantly reduce the impact wet weather discharges have on aquatic systems throughout the city Annual discharges are currently (2010) estimated to be 30 billion gallons (114 million cubic meters) per year Building on existing and committed new sewer plans an agreed grey infrastructure based strategy to this problem is set to reduce these discharges to 198 billion gallons per year (a 34 reduction) by the 2030s An alternative green infrastructure approach based around intercepting the first inch (25mm) of rainfall across 10 of the impermeable city area by 2030 is predicted to reduce CSO spills to 179 billion gallons per year
Planners have calculated that the whole life costs after 20 years of the grey infrastructure solution will be $68 billion (2010 prices) compared to the green infrastructure whole life costs of $53 billion The green infrastructure strategy reduces CSO spills by more than the grey alternative for $15 billion less in terms of whole life cost Further planners have calculated that New Yorkers will benefit by up to $41844 million (accumulated over 20 years) in additional benefits associated with lower energy bills from control of urban heating increased property values and improved health
Based on this analysis New York City has committed itself to an aggressive green infrastructure based runoff control strategy to provide long term reductions in CSO spills The plan is to achieve interception of 15 of impermeable area by 2015 4 by 2020 7 by 2025 and 10 by 2030
Principle Five Live Process
The Strategy should be adaptable and periodically reviewed Whilst outcomes are expected to be relatively stable over time the pace at which the Strategy delivers outcomes will be linked to volatile influences (like climate and population change) and to the decisions made at each price review about the priorities for the following period The Strategy should be reviewed at regular intervals to reflect investments already made the changing priorities of the water and sewerage company and partners and the presence of emerging risks The review is also an opportunity to report drainage catchment performance relative to performance measures designed to monitor progress towards achieving outcomes
44 Estimated using methods from the New York Municipal Forest Resource Analysis (MFRA) prepared by the US Dept of Agriculture
205240txt012|May 2013
31
Drainage Strategy Framework
251 Recommended good practice
No Good practice Example references
1 Regularly repeat screening exercise to determine catchments requiring a Drainage Strategy and modify programme of Strategy development accordingly
Check for changes in measured rates of flooding and pollution incidents blockages collapses pumping station failures etc
Check for changes in extent and location of new development
Check for activities being undertaken by partners (eg redevelopment urban realm improvements and flooding and pollution management activities)
SRM5 illustrates how improved and updated knowledge of system performance should be applied to establish Strategies
2 In lsquolive Strategiesrsquo repeat risk assessment when data and models improve and adjust confidence scores accordingly
Confirm that Strategy will still achieve performance indicators and outcomes at least cost Revise Strategy as necessary
3 Periodically refresh Strategy accommodating impact of interventions already delivered using re‐verified predictive tools as appropriate
Confirm that Strategy will still achieve performance indicators and outcomes at least cost Revise Strategy as necessary
Triggers for a wholesale review of the Strategy are likely to be significant changes to the location or extent of planned development
4 Monitor report and share (with partners) the measures used to demonstrate delivery of outcomes Example measures may include the number of properties which experience sewer flooding the number of properties at risk of flooding the number of properties at risk from sewerage asset failure risk indices that capture both the probability and consequence of failure customer satisfaction with regards to clean rivers and beaches the number of pollution incidents the frequency of combined sewer overflow operation and compliance with discharge permit conditions
252 Good practice example ndash Thames Water live DAP
Thames Water has initiated a DAP (drainage area plan) Live approach Itrsquos a good example of how companies are continuously monitoring and updating the status of drainage area risks It provides a lsquoliversquo snapshot of the current health of all drainage areas in Thames Waterrsquos region allowing real time planning as part of a strategic approach It enables drainage planners to view the effectiveness
205240txt012|May 2013
32
Drainage Strategy Framework
of intervention strategies and compare incident rates across varying geographies and development types in the Thames Valley
DAP Live will be available for all catchments in the Thames Water area thus enabling
bull high level monitoring of risks across the business bull a live and strategic review of catchment performance bull prioritisation of catchments based on risk and bull an ability to share data with partners collaborating in drainage planning and improvements
Figure 12 illustrates the types of data managed through the DAP Live system These include asset data political and drainage boundaries environmental data operational data property amp growth data and modelling data As new data become available the DAP Live system is updated so that drainage planners have the most current view on emerging risks and issues
Asset data
Operational data
Property and growth data
Modelling data
Environmental data
Boundaries (SDACs operational political)
Figure 12 Data types held in the DAP Live system
Figure 13 illustrates how the system can provide analysis at a variety of scales from local authority boundaries sewage treatment works catchments drainage areas or a regular grid
205240txt012|May 2013
33
Drainage Strategy Framework
NE PROVINCES
WESTERN PROVINCES
NE LONDON bull Ops areas local W LONDON
SE LONDON authorities Large TIDWORTH SE PROVINCES
bull STW Catchments
bull Drainage areas(SDACs)
bull Regular grid Small
Figure 13 DAP Live reporting performance at different scales
205240txt012|May 2013
34
Drainage Strategy Framework
253 Good practice example ndash Wessex Water Water live data
Wessex Water is regularly using data geospatially to proactively identify and respond to risk Theirs is a good example of how data can be used to provide an adaptable approach that is regularly reviewed to plan investment
The risk‐based and live approach uses a set of likelihood and consequence models which are built up from all currently available data asset data (eg CCTV data material age) operational data (eg flooding and pollutions incidents) and information (eg locality near hospital or downstream of an overflow) All these data are collated for the entire Wessex region updated regularly and analysed geospatially
Figure 14 Sewer risk scores presented in a risk matrix and geospatially
This allows a risk score (Figure 14) to be calculated for each mapped sewer length which directs investigation more efficiently by allocating each mapped sewer a planned CCTV inspection date
This risk‐based approach has been successful in targeting problematic sewers increasing identification rates threefold Density analysis is performed using asset failure and operational information which allows planning of both proactive structural and operational investment
Proactively found structural issues are far more cost effective to repair before failure and can also prevent serviceability issues
205240txt012|May 2013
35
f
DDrainage Strateegy Frameworrk
Figgure 15 Hotsppot analysis
Thhe hotspot annalysis (Figuure 15) showss where operrational clustters have beeen calculatedd This hootspot analyssis is made aavailable on tthe Wessex WWater corporrate GIS to a llow operati onal staff to target their effforts to mitiggate against ffurther repeaat incidents AAdditional innformation ffrom asset annd operationnal activities ccan be addedd regularly too the databasses which drrive the mod els enabling rissk scores to bbe kept as livve as require d
226 Prrinciple Sixx Innovativve and Susstainable SSolutions
Thhe Drainage Strategy Fraamework proomotes the fuull evaluationn of alternatiives to tradit ionally enngineered sewwerage soluttions to test wwhether thesse offer loweer whole life ccost options or better reesponses to uuncertainty It is anticipaated that draainage solutioons of the futture will be ddifferent froom the ones we are usedd to
Thhese should iinclude (at leeast at a highh level) real ttime control storm waterr retrofit techhniques edducation to eenable custommers to changge behaviou r enhancingg incentives for customerss to reduce suurface water flowing to seewers and innnovative pe rmitting arraangements a cross drainagge networks annd sewage tr eatment worrks Water annd sewerage companies sshould continnue to revieww and deevelop other innovative ssolutions
Foor example wwhere a commpany may hiistorically haave preferredd to tackle seewer floodingg or coombined sewwer overflow pollution byy increasing iits undergrouund equipmment to store mmore rainfalll duuring stormss it might connsider other options in fuuture ndash such as working wwith custommers to mmanage the raainfall close tt eventing it foorm enteringg the sewer syystem o source pre
2205240txt012|Mayy 2013
36
Drainage Strategy Framework
261 Recommended good practice
No Good practice Example references
1 Use cost‐benefit methods to demonstrate that innovative and sustainable solution types provide best value for customers and the wider community
UKWIR will publish new research and guidance in 2013 addressing active control and storm water removal demonstrating how these technologies can be justified and included within Drainage Strategies
2 Consider integrated water resource management Work with partners (especially developers and local authorities) to examine whether use of stored stormwater reduces potable water consumption AND need for capacity in sewers
CIRIA has published a scoping study for water sensitive urban design45 in the UK
3 Consider a mix of conventional and new technologies using more adaptive approaches as low‐regrets responses to uncertainty eg prevent current sewer flooding with underground tank storage but address future risks (worsened by climate change) with retrofit SuDS implemented progressively
CIRIA has published lsquoRetrofitting to manage surface waterrsquo46 a comprehensive guide to planning and delivering this type of project
4 Use carbon accounting methods to compare embodied and emitted carbon in alternative intervention strategies so that these impacts are accounted for in whole life costs
Consider the benefits of surface water removal on the costs (including carbon) of pumping and sewage treatment
UKWIR47 has and continues to publish detailed guidance on carbon accounting for water and sewerage company use
45httpwwwciriaorgserviceresearch_informationAMContentManagerNet ContentDisplayaspxSection=research_informationampContentID=23581 46httpwwwciriaorgSERVICEHomecoreordersproductaspxcatid=5ampprodid=1909 47httpukwirforefront‐librarycomreports08‐cl‐01‐6923419000190269902659465890269
205240txt012|May 2013
37
Drainage Strategy Framework
No Good practice Example references
5 Where interventions include the provision of green space public amenity and improved habitats then Payment for Ecosystem Services approaches can be used to claim further monetised benefits in the appraisal Customers should be consulted to help value these benefits
The Environment Agency will publish data in 2013 on costs and benefits of retrofit stormwater projects to promote understanding and uptake
6 Share data within the industry on innovative solutions to increase knowledge of new technology and SuDs approaches
EA retrofitting SuDs costs and benefits database48
accommodating data from Ofwat AMP5 SuDS pilot initiative and other examples
262 Good practice example ndash Welsh Water surface water reduction and removal strategy for Gowerton and Llanelli
Dŵr Cymru Welsh Water and partners are applying innovative storm water removal methods to address capacity problems in the sewer network in Gowerton and Llanelli49 (population 140000) Current under capacity leads to localised sewer flooding and excessive combined sewer overflow (CSO) spill to the Burry Inlet a protected shellfish water and special area of conservation The capacity problems in the system were a concern for the Environment Agency (Wales) and there was a risk of widespread restrictions to economic development being imposed Dŵr Cymru Welsh Water Carmarthenshire County Council City and County of Swansea Consumer Council for Water Environment Agency Wales and the Welsh Government all worked in partnership to resolve the situation
A brand new hydraulic model was built for the entire sewerage network with particular attention paid to accurately representing the sources of storm run‐off and infiltration The model was verified against data from flow monitors and observed CSO spill frequencies into the Burry Inlet
To begin with a traditional sewer storage solution was proposed that would result in an average 10 spills a year into the shellfish water from all 90 CSOs in the two catchments Although this reduced spills and dealt with some of the flooding and growth issues the storage requirements would have been unaffordable provide no protection against long term climate change and would not tackle the fundamental problem of too much surface water getting into the combined network
An alternative approach based on the reduction and removal of storm water from the combined sewer system was also developed This was in accordance with Dŵr Cymru Welsh Waterrsquos Rainscape50 (surface water elimination and reduction) strategy To identify areas with the most
48httpevidenceenvironment‐agencygovukfcermenDefaultHomeAndLeisureFloodsWhatWereDoingIntoTheFutureScience ProgrammeResearchAndDevelopmentFCRMProjectaspxProjectID=15515be8‐bbed‐4204‐ae56‐3e810ba47694ampPageID=56bad68e‐dcb1‐4bf8‐84cc‐cbfd03ab63a2 49 httpwwwciwemorgmedia674511Paper20820Stephen20Ollierpdf 50httpwwwdwrcymrucom_libraryleaflets_publications_english
205240txt012|May 2013
38
Drainage Strategy Framework
potential for effective storm water removal a flowareaflooding thematic map was developed This was used to focus attention on areas which would deliver the most benefit if storm water removal was carried out These areas are coloured red in Figure 16
Figure 16 Thematic map showing areas of maximum potential for storm water removal
The following interventions (181 in total) were combined into single strategy to be delivered in phases by 2015 2020 and afterwards
bull The management of surface water through swales basins and soakaways rather than through combined sewers resulting in new amenity and ecological areas within the built‐up environment
bull Implementing smarter flow control to better use existing storage and conveyance assets bull Relining of sewers to prevent groundwater ingress bull Removal of land drainage connections to sewers bull Household rainwater harvesting retrofit schemes
surface_water_management_strategypdf
205240txt012|May 2013
39
Drainage Strategy Framework
Figure 17 is an artistrsquos impression of what one of the sustainable urban drainage system solutions may look like
Figure 17 Example retrofit SuDS solution proposed for Gowerton and Llanelli
Modelling has demonstrated that the alternative strategy will achieve the same CSO reduction benefit as the storage strategy together with flooding improvements and additional less tangible benefits at significantly lower cost than the traditional sewer storage solution
Figure 18 illustrates the dispersed nature of solutions identified for central Llanelli
Figure 18 Water sensitive urban design interventions planned for central Llanelli
205240txt012|May 2013
40
Drainage Strategy Framework
Appendix A
Glossary
205240txt012|May 2013
Drainage Strategy Framework
Appendix A Glossary
CAPEX Capital expenditure Appointed water and sewerage companiesrsquo spending on new replacement or refurbished capital assets such as construction or buying machinery
CIWEM Urban Drainage Group (WaPUG) A group of the Chartered Institution of Water and Environmental Management supporting professionals working in urban drainage
Combined Sewer Overflow (CSO) The discharge of untreated sewage diluted with storm water into rivers and the sea CSOs occur during heavy rain and are necessary to reduce the risk of sewer flooding The physical overflow structure is also called a CSO
Common Framework for Capital A planning approach developed for the water and Maintenance Planning sewerage companies in 2002 which provides a robust basis
for assessing future capital maintenance needs The approach is consistent with the needs of Ofwat
Defra The Department for Environment Food and Rural Affairs The Government Department with responsibility for water flooding and water quality in England
Drainage Area Plan (DAP) A detailed plan for a drainage catchment that prioritises a list of interventions based on risk using an approach established in the WRc Sewerage Rehabilitation Manual This approach has been succeeded by Sewerage Risk Management which guides the preparation of Sewerage Management Plans (SMP) Companies vary in how they prepare DAPs or SMPs (or their equivalents) following the general principles that have been established
Drainage Strategy Developed by water and sewerage companies to demonstrate how outcomes will be delivered in drainage catchments over the long term Drainage Strategies will use the information developed in producing a DAPSMP and if a drainage strategy has been produced this should be the starting point in producing a more detailed DAPSMP should this be required It is likely that the activities required to prepare DAPSMP and Drainage Strategies may overlap Drainage Strategies might not refer to specific interventions but instead outline a general approach
Drainage Strategy Framework Guidance to describe the contents and intention of Drainage Strategies
205240txt012|May 2013
Drainage Strategy Framework
Flood Risk Management Plans Required by the Flood Risk Regulations in Flood Risk Areas by December 2015
Flood Risk Regulations The legislative instrument used to implement the requirements of the Floods Directive in England and Wales
Floods Directive DIRECTIVE 200760EC of the European Parliament and of the Council of 23 October 2007 on the assessment and management of flood risks
Lead Local Flood Authority (LLFA) The Shire County or unitary authority with responsibility for managing local flood risk
Local development plans Developed by planning authorities to explain where and what type of development (new homes and businesses) will occur within their area They are required to explain water infrastructure needs to support this development
Local Flood Risk Management Strategy Developed by the Lead Local Flood Authority to explain (LFRMS) how local flood risk will be managed by the Authority and
in partnership with others
Natural Resources Wales From 1 April 2013 Natural Resources Wales (NRW) a new body formed by the Welsh Government will take over the functions previously carried out by the Environment Agency (EA) in Wales alongside those of the Forestry Commission Wales and the Countryside Council for Wales
Ofwat The Water Services Regulation Authority ndash the economic regulator of the water and sewerage companies of England and Wales
OPEX Operating expenditure Appointed water and sewerage companiesrsquo day‐to‐day spending on running the services for example staff costs and power This is likely to include investment in joint projects that do not create or relate to an asset that the company solely or jointly owns
Outcomes Outcomes are the higher level objectives that a companyrsquos actions are intended to deliver A companyrsquos outcome should reflect its customersrsquo priorities identified through appropriate customer engagement and deliver the best long‐term sustainable solution for customers and the environment An outcome may not be bound by a single price control period and should be set in the context of customersrsquo and the environmentrsquos long‐term needs
205240txt012|May 2013
Drainage Strategy Framework
Price Review The process of setting appointed water and sewerage companiesrsquo price limits The next price review will take place in 2014 for the period 2015‐20 Ofwat currently sets price limits every five years
Real Time Control (RTC) Using actuated pumps gates and weirs to actively control flow in sewers Better use can be made of existing infrastructure and links can be made between network treatment and receiving water systems for operational benefits Sometimes referred to as Active Management
River Basin Management (Plans) River Basin Management is a continuous process of planning (to develop River Basin Management Plans) and delivery The Water Framework Directive introduces a formal series of 6 year cycles The first cycle will end in 2015 when following further planning and consultation the River Basin Management Plans will be updated and reissued
Sewerage Management Plan A risk based approach to indentifying investment needs in sewerage systems as described in the Sewerage Risk Management (SRM) approach developed by WRc plc
Storm water retrofit Releasing capacity in sewers by controlling stormwater at the surface using disconnection swales and other sustainable drainage systems (SuDS)
205240txt012|May 2013
We are the Environment Agency We protect and improve the environment and make it a better place for people and wildlife We operate at the place where environmental change has its greatest impact on peoplersquos lives We reduce the risks to people and properties from flooding make sure there is enough water for people and wildlife protect and improve air land and water quality and apply the environmental standards within which industry can operate Acting to reduce climate change and helping people and wildlife adapt to its consequences are at the heart of all that we do We cannot do this alone We work closely with a wide range of partners including government business local authorities other agencies civil society groups and the communities we serve
wwwenvironment‐agencygovuk
Environment Agency National Customer Contact Centre
Telephone 03708 506 506 enquiriesenvironment‐agencygovuk
Ofwat (The Water Services Regulation Authority) is a non‐ministerial government department We are responsible for making sure that the water and sewerage sectors in England and Wales provide consumers with a good quality and efficient service at a fair price
wwwofwatgovuk
Telephone 0121 644 7500 mailboxofwatgsigovuk
Halcrow Group Limited Burderop Park Swindon Wiltshire SN4 0QD
tel 01793 812479 fax 01793 812089 halcrowcom
Halcrow Group Limited is a CH2M HILL company Halcrow Group Limited has prepared this report in accordance with
the instructions of The Environment Agency for the clientrsquos sole and specific use Any other persons who use any information contained herein do so at their own risk
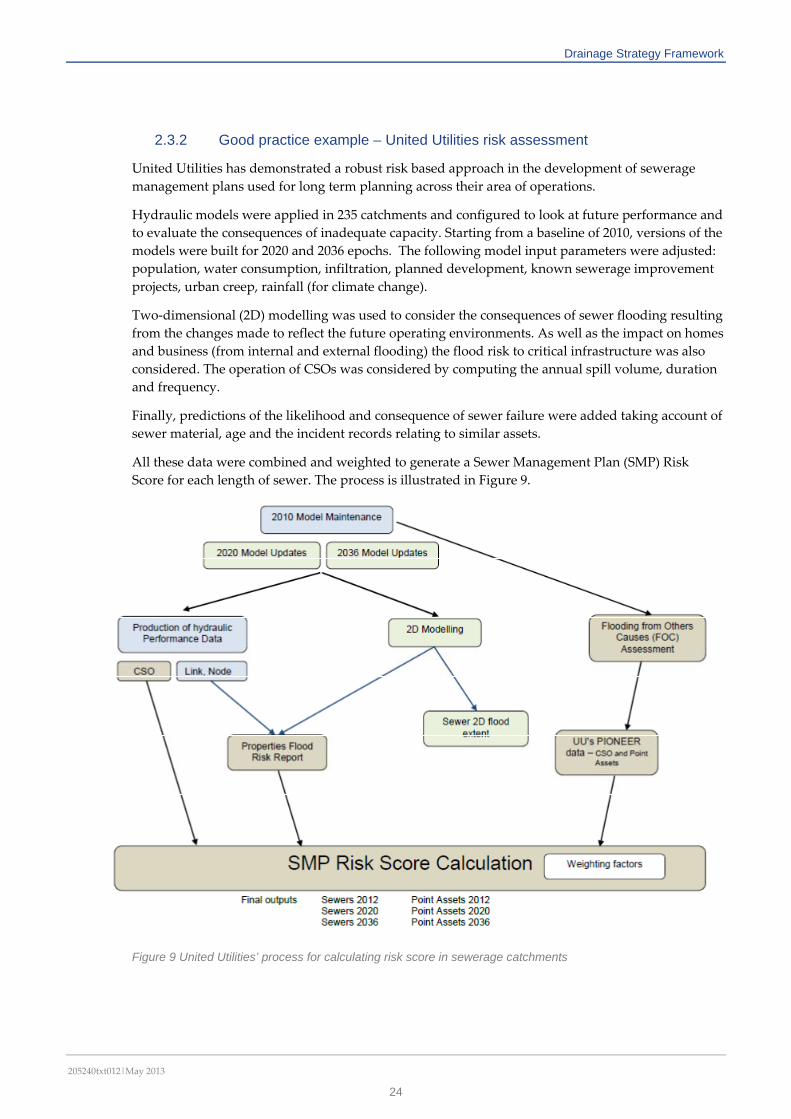
Drainage Strategy Framework
A theoretical assessment of network capacity is then calculated by comparing Formula A with pipe full capacity flow consent values at CSOs and wastewater treatment works and pumping rates This determines areas of the network with a capacity shortfall with a potential capacity shortfall and with no capacity shortfall
When run across the whole company area approximately 100 out of 500 drainage areas were found to be under capacity Over 60 of these areas had recorded sewer flooding incidents In over 300 drainage areas there was no forecast capacity shortfall Only 7 of these drainage areas had recorded sewer flooding incidents Overall the system proved to be very reliable at predicting drainage areas likely to have sewer flooding problems because of sewer under‐capacity
In under capacity drainage areas an intermediate (hydraulic model based) assessment is then carried out Figure 11 shows the results thematically mapped for an example drainage area Red areas are predicted to have a very high risk of sewer flooding Yellow and green areas are predicted to have a low risk of sewer flooding
Figure 11 Example of a drainage area capacity map
205240txt012|May 2013
26
24
Drainage Strategy Framework
Principle Four Whole Life Costs and Benefits
Strategies should be informed by consideration of whole life costs and benefits They should promote a series of interventions which in view of the quantified uncertainties are most likely to result in performance indicators which demonstrate the achievement of outcomes at lowest cost to customers and the community more widely
Costs relate to capital and operational expenditure to deliver interventions and the monetised impacts of drainage failures such as flooding and pollution
Benefits relate to the reduction in risks from drainage failures such as flooding and pollution but should also include wider societal impacts such as those calculated using a lsquoPayments for Ecosystems Servicesrsquo approach
When considering the lsquowhole lifersquo the strategy should consider climate population and asset deterioration trends These are likely to increase risks over the long term if no interventions are made The strategy should state lsquowhatrsquo should be done but also broadly lsquowhenrsquo and in what sequence interventions should happen
241 Recommended good practice
No Good practice Example references
1 Predict risks into the future for at least two epochs le10 years (to understand what the company needs to do now and how this fits with longer term outcomes) and ge30 years to understand long term needs in light of changing population and other pressures
Account for the following changes in demand
bull Growth ‐ new homes and businesses
bull Urban creep ndash uncontrolled addition of connected impermeable area
bull Climate change ndash affecting design events (flood predictions) time‐series (CSO and treated effluent quantities) river flows and temperatures
bull Infiltrationexfiltration ndash through deteriorating sewer condition
bull Dry weather flows ndash through changes in water consumption rates
2 Combining monetised risks (associated with sewerage failures) determine whole life costs for a lsquodo nothingrsquo scenario (ie no interventions)
Include costs associated with electricity consumption (in the network and at the wastewater treatment works) and CO2 emissions
UKWIR will publish in 2014 a revision to their Long Term Least Cost Planning for Wastewater Supply‐Demand
guidance This may provide tools and methods for expressing costs and benefits to support the development of a Drainage Strategy
205240txt012|May 2013
27
Drainage Strategy Framework
No Good practice Example references
3 Test intervention strategies which keep performance indicators on track to deliver outcomes by adding capacity (supply) reducing flows (demand) or altering operational regimes
Include the costs of interventions and the benefits of reduced risks to inform selection of the most cost beneficial strategy over the whole life
Have regard to the timing of interventions recognising that uncertainty may require low‐regrets (insensitive to uncertainty) solutions and that delaying major interventions may be more affordable and attractive in the short term Discounting should be used to compare the costs and benefits of interventions occurring at different times
Recognise that some interventions will be obligatory and defined (eg maintenance of a spill frequency standard at a CSO) whilst others will be more discretionary focused on achieving outcomes rather than specific outputs
SRM5 (Section 8) defines and contrasts cost benefit analysis cost effectiveness analysis whole life cost analysis and risk cost benefit analysis
HM Treasury Green Book39
sets out a framework for the appraisal of long term projects which can be applied to the development of a Drainage Strategy
4 Donrsquot at first be concerned with the distribution of costs and benefits between partners who may be sharing costs Identify the most cost beneficial solution first and then debate and agree an equitable sharing of costs
Give equal weighting to OPEX (operating expenditure) and CAPEX (capital expenditure) costs so not to cause bias towards capital intensive solutions Properly consider the costs and benefits of pro‐active maintenance regimes and campaigns to influence customers to reduce fats oils and greases (FOG) build‐ups and the misuse of sewers
Consider the affordability of solutions the impact on customersrsquo bills and the resources of other organisations to play their part
UKWIR research outputs40 in 2013 (SW01) will provide a framework for making a business case for separating storm water from combined sewers
5 Where interventions include the provision of green space public amenity and improved habitats then Payment for Ecosystem Services approaches should be used to identify further monetised benefits in the appraisal Customers should be consulted to help value these benefits
Supplementary Green Book41
guidance describes methods for accounting for environmental impacts including the ecosystems approach
39 httpwwwhm‐treasurygovukdata_greenbook_indexhtm 40 httpwwwukwirorgpublishorsystemcomponent_viewaspLogDocId=96116 41 httpwwwhm‐treasurygovukdaccounting_environmental_impactspdf
205240txt012|May 2013
28
Drainage Strategy Framework
242 Good practice example ndash Severn Trent Water making the case for surface water separation in Stoke-on-Trent
In this example42 Severn Trent Water compared alternative ways of addressing sewer flooding problems by looking at a range of costs and benefits not all of which were directly associated with its specific responsibilities as a water and sewerage company Whilst the example does not express a monetised value for all costs and benefits over the whole life it does illustrate the types of factors which could be included in an appraisal of this type scaled to address problems at a catchment level It also demonstrates how working collaboratively can help identify solutions which are cost‐beneficial for the community at large
In an area of Stoke served by a combined sewer system five properties were at risk from sewer flooding in cellars for events equal to and less frequent than the 1 in 10 year probability A conventional sewer pumping station based solution was presented as the standard option
However a nearby former hospital site was also undergoing re‐development which would result in reduced runoff to the combined sewer The new drainage regime in the redevelopment site was sufficient to remove the flood risk at the five properties (this was a do nothing strategy)
A third option completely separated the development site runoff from the combined sewer and also addressed local flood risk issues nearby The solution required a new storm sewer and a network of swales and other SuDS features connecting with an ordinary watercourse
Table 1 illustrates how costs and benefits were compared across the three alternative strategies Each provided the same benefit in terms of the number of homes (5) relieved from sewer flooding The novel SuDS and surface water management solution additionally gave local flood risk relief to 3 further properties The separationSuDS strategy came at a higher capital cost but delivered greater social cost benefits savings in annual operating costs and a bonus improvement water quality (because of reduced CSO spill volume) Severn Trent selected the separation SuDS solution because the higher capital costs were offset by other benefits
Table 1 Costs and benefits of drainage improvements in part of Stoke-on-Trent
Do nothing Standard option
SuDS
Sewer flooding benefits 5 5 5
Other flooding benefits 0 0 3
Change in runoff to combined sewer (m3year) 0 0 ‐40000
Estimated cost (pound) 0 168000 419000
42httpwwwciwemorgmedia695460Paper203_Creating20Sewer20Capacity_Presentation2 0by20Mike20Woodpdf
205240txt012|May 2013
29
Drainage Strategy Framework
Do nothing Standard option
SuDS
Social Cost Benefit (pound) 16000 5000 51000
Change in electricity costs (poundyear) 0 +75 ‐525
Programme impact (years to deliver solution) + 4 0 +4
CSO spill volume (m3 in 1year event) +298 0 ‐397
243 Good practice example ndash New York City comparison of grey and green infrastructure drainage strategies
This example is taken from New York in the United States of America Itrsquos an illustration of how whole life costs have been compared for alternative strategies to solve urban drainage issues on a mega‐city scale The key data are summarised in Table 2
Table 2 Comparing drainage strategies in New York
Grey Strategy
Green Strategy
CSO spill volume reduction (billion gallons year)
101 122
Wider benefits over 20 years ($ million) 0 139 to 418
Whole life costs over 20 years ($ billion) 68 53
The information is taken from the New York City Green Infrastructure Plan43 produced by the Mayorrsquos Office in 2010 The Plan (and recent updates) provides a comprehensive evidence base around costs and benefits of different approaches to address the cityrsquos drainage problems It is therefore an excellent example of how drainage strategies can be described in plain language for a non‐specialist audience concerned with their environment and the cost of providing infrastructure to enhance it
It is becoming commonplace for North American cities (eg Portland and Philadelphia) to address the issue of frequent combined sewer overflow (CSO) operation by using a combination of grey infrastructure (sewers) and green infrastructure (sustainable drainage systems) The wider health
43 httpwwwnycgovhtmldephtmlstormwaternyc_green_infrastructure_planshtml
205240txt012|May 2013
30
25
Drainage Strategy Framework
and ecological benefits of green infrastructure approaches and the reduced reliance on materials and energy are attractive to utility planners and cities alike
New York has 422 CSOs and an agreed Long Term Control Strategy to significantly reduce the impact wet weather discharges have on aquatic systems throughout the city Annual discharges are currently (2010) estimated to be 30 billion gallons (114 million cubic meters) per year Building on existing and committed new sewer plans an agreed grey infrastructure based strategy to this problem is set to reduce these discharges to 198 billion gallons per year (a 34 reduction) by the 2030s An alternative green infrastructure approach based around intercepting the first inch (25mm) of rainfall across 10 of the impermeable city area by 2030 is predicted to reduce CSO spills to 179 billion gallons per year
Planners have calculated that the whole life costs after 20 years of the grey infrastructure solution will be $68 billion (2010 prices) compared to the green infrastructure whole life costs of $53 billion The green infrastructure strategy reduces CSO spills by more than the grey alternative for $15 billion less in terms of whole life cost Further planners have calculated that New Yorkers will benefit by up to $41844 million (accumulated over 20 years) in additional benefits associated with lower energy bills from control of urban heating increased property values and improved health
Based on this analysis New York City has committed itself to an aggressive green infrastructure based runoff control strategy to provide long term reductions in CSO spills The plan is to achieve interception of 15 of impermeable area by 2015 4 by 2020 7 by 2025 and 10 by 2030
Principle Five Live Process
The Strategy should be adaptable and periodically reviewed Whilst outcomes are expected to be relatively stable over time the pace at which the Strategy delivers outcomes will be linked to volatile influences (like climate and population change) and to the decisions made at each price review about the priorities for the following period The Strategy should be reviewed at regular intervals to reflect investments already made the changing priorities of the water and sewerage company and partners and the presence of emerging risks The review is also an opportunity to report drainage catchment performance relative to performance measures designed to monitor progress towards achieving outcomes
44 Estimated using methods from the New York Municipal Forest Resource Analysis (MFRA) prepared by the US Dept of Agriculture
205240txt012|May 2013
31
Drainage Strategy Framework
251 Recommended good practice
No Good practice Example references
1 Regularly repeat screening exercise to determine catchments requiring a Drainage Strategy and modify programme of Strategy development accordingly
Check for changes in measured rates of flooding and pollution incidents blockages collapses pumping station failures etc
Check for changes in extent and location of new development
Check for activities being undertaken by partners (eg redevelopment urban realm improvements and flooding and pollution management activities)
SRM5 illustrates how improved and updated knowledge of system performance should be applied to establish Strategies
2 In lsquolive Strategiesrsquo repeat risk assessment when data and models improve and adjust confidence scores accordingly
Confirm that Strategy will still achieve performance indicators and outcomes at least cost Revise Strategy as necessary
3 Periodically refresh Strategy accommodating impact of interventions already delivered using re‐verified predictive tools as appropriate
Confirm that Strategy will still achieve performance indicators and outcomes at least cost Revise Strategy as necessary
Triggers for a wholesale review of the Strategy are likely to be significant changes to the location or extent of planned development
4 Monitor report and share (with partners) the measures used to demonstrate delivery of outcomes Example measures may include the number of properties which experience sewer flooding the number of properties at risk of flooding the number of properties at risk from sewerage asset failure risk indices that capture both the probability and consequence of failure customer satisfaction with regards to clean rivers and beaches the number of pollution incidents the frequency of combined sewer overflow operation and compliance with discharge permit conditions
252 Good practice example ndash Thames Water live DAP
Thames Water has initiated a DAP (drainage area plan) Live approach Itrsquos a good example of how companies are continuously monitoring and updating the status of drainage area risks It provides a lsquoliversquo snapshot of the current health of all drainage areas in Thames Waterrsquos region allowing real time planning as part of a strategic approach It enables drainage planners to view the effectiveness
205240txt012|May 2013
32
Drainage Strategy Framework
of intervention strategies and compare incident rates across varying geographies and development types in the Thames Valley
DAP Live will be available for all catchments in the Thames Water area thus enabling
bull high level monitoring of risks across the business bull a live and strategic review of catchment performance bull prioritisation of catchments based on risk and bull an ability to share data with partners collaborating in drainage planning and improvements
Figure 12 illustrates the types of data managed through the DAP Live system These include asset data political and drainage boundaries environmental data operational data property amp growth data and modelling data As new data become available the DAP Live system is updated so that drainage planners have the most current view on emerging risks and issues
Asset data
Operational data
Property and growth data
Modelling data
Environmental data
Boundaries (SDACs operational political)
Figure 12 Data types held in the DAP Live system
Figure 13 illustrates how the system can provide analysis at a variety of scales from local authority boundaries sewage treatment works catchments drainage areas or a regular grid
205240txt012|May 2013
33
Drainage Strategy Framework
NE PROVINCES
WESTERN PROVINCES
NE LONDON bull Ops areas local W LONDON
SE LONDON authorities Large TIDWORTH SE PROVINCES
bull STW Catchments
bull Drainage areas(SDACs)
bull Regular grid Small
Figure 13 DAP Live reporting performance at different scales
205240txt012|May 2013
34
Drainage Strategy Framework
253 Good practice example ndash Wessex Water Water live data
Wessex Water is regularly using data geospatially to proactively identify and respond to risk Theirs is a good example of how data can be used to provide an adaptable approach that is regularly reviewed to plan investment
The risk‐based and live approach uses a set of likelihood and consequence models which are built up from all currently available data asset data (eg CCTV data material age) operational data (eg flooding and pollutions incidents) and information (eg locality near hospital or downstream of an overflow) All these data are collated for the entire Wessex region updated regularly and analysed geospatially
Figure 14 Sewer risk scores presented in a risk matrix and geospatially
This allows a risk score (Figure 14) to be calculated for each mapped sewer length which directs investigation more efficiently by allocating each mapped sewer a planned CCTV inspection date
This risk‐based approach has been successful in targeting problematic sewers increasing identification rates threefold Density analysis is performed using asset failure and operational information which allows planning of both proactive structural and operational investment
Proactively found structural issues are far more cost effective to repair before failure and can also prevent serviceability issues
205240txt012|May 2013
35
f
DDrainage Strateegy Frameworrk
Figgure 15 Hotsppot analysis
Thhe hotspot annalysis (Figuure 15) showss where operrational clustters have beeen calculatedd This hootspot analyssis is made aavailable on tthe Wessex WWater corporrate GIS to a llow operati onal staff to target their effforts to mitiggate against ffurther repeaat incidents AAdditional innformation ffrom asset annd operationnal activities ccan be addedd regularly too the databasses which drrive the mod els enabling rissk scores to bbe kept as livve as require d
226 Prrinciple Sixx Innovativve and Susstainable SSolutions
Thhe Drainage Strategy Fraamework proomotes the fuull evaluationn of alternatiives to tradit ionally enngineered sewwerage soluttions to test wwhether thesse offer loweer whole life ccost options or better reesponses to uuncertainty It is anticipaated that draainage solutioons of the futture will be ddifferent froom the ones we are usedd to
Thhese should iinclude (at leeast at a highh level) real ttime control storm waterr retrofit techhniques edducation to eenable custommers to changge behaviou r enhancingg incentives for customerss to reduce suurface water flowing to seewers and innnovative pe rmitting arraangements a cross drainagge networks annd sewage tr eatment worrks Water annd sewerage companies sshould continnue to revieww and deevelop other innovative ssolutions
Foor example wwhere a commpany may hiistorically haave preferredd to tackle seewer floodingg or coombined sewwer overflow pollution byy increasing iits undergrouund equipmment to store mmore rainfalll duuring stormss it might connsider other options in fuuture ndash such as working wwith custommers to mmanage the raainfall close tt eventing it foorm enteringg the sewer syystem o source pre
2205240txt012|Mayy 2013
36
Drainage Strategy Framework
261 Recommended good practice
No Good practice Example references
1 Use cost‐benefit methods to demonstrate that innovative and sustainable solution types provide best value for customers and the wider community
UKWIR will publish new research and guidance in 2013 addressing active control and storm water removal demonstrating how these technologies can be justified and included within Drainage Strategies
2 Consider integrated water resource management Work with partners (especially developers and local authorities) to examine whether use of stored stormwater reduces potable water consumption AND need for capacity in sewers
CIRIA has published a scoping study for water sensitive urban design45 in the UK
3 Consider a mix of conventional and new technologies using more adaptive approaches as low‐regrets responses to uncertainty eg prevent current sewer flooding with underground tank storage but address future risks (worsened by climate change) with retrofit SuDS implemented progressively
CIRIA has published lsquoRetrofitting to manage surface waterrsquo46 a comprehensive guide to planning and delivering this type of project
4 Use carbon accounting methods to compare embodied and emitted carbon in alternative intervention strategies so that these impacts are accounted for in whole life costs
Consider the benefits of surface water removal on the costs (including carbon) of pumping and sewage treatment
UKWIR47 has and continues to publish detailed guidance on carbon accounting for water and sewerage company use
45httpwwwciriaorgserviceresearch_informationAMContentManagerNet ContentDisplayaspxSection=research_informationampContentID=23581 46httpwwwciriaorgSERVICEHomecoreordersproductaspxcatid=5ampprodid=1909 47httpukwirforefront‐librarycomreports08‐cl‐01‐6923419000190269902659465890269
205240txt012|May 2013
37
Drainage Strategy Framework
No Good practice Example references
5 Where interventions include the provision of green space public amenity and improved habitats then Payment for Ecosystem Services approaches can be used to claim further monetised benefits in the appraisal Customers should be consulted to help value these benefits
The Environment Agency will publish data in 2013 on costs and benefits of retrofit stormwater projects to promote understanding and uptake
6 Share data within the industry on innovative solutions to increase knowledge of new technology and SuDs approaches
EA retrofitting SuDs costs and benefits database48
accommodating data from Ofwat AMP5 SuDS pilot initiative and other examples
262 Good practice example ndash Welsh Water surface water reduction and removal strategy for Gowerton and Llanelli
Dŵr Cymru Welsh Water and partners are applying innovative storm water removal methods to address capacity problems in the sewer network in Gowerton and Llanelli49 (population 140000) Current under capacity leads to localised sewer flooding and excessive combined sewer overflow (CSO) spill to the Burry Inlet a protected shellfish water and special area of conservation The capacity problems in the system were a concern for the Environment Agency (Wales) and there was a risk of widespread restrictions to economic development being imposed Dŵr Cymru Welsh Water Carmarthenshire County Council City and County of Swansea Consumer Council for Water Environment Agency Wales and the Welsh Government all worked in partnership to resolve the situation
A brand new hydraulic model was built for the entire sewerage network with particular attention paid to accurately representing the sources of storm run‐off and infiltration The model was verified against data from flow monitors and observed CSO spill frequencies into the Burry Inlet
To begin with a traditional sewer storage solution was proposed that would result in an average 10 spills a year into the shellfish water from all 90 CSOs in the two catchments Although this reduced spills and dealt with some of the flooding and growth issues the storage requirements would have been unaffordable provide no protection against long term climate change and would not tackle the fundamental problem of too much surface water getting into the combined network
An alternative approach based on the reduction and removal of storm water from the combined sewer system was also developed This was in accordance with Dŵr Cymru Welsh Waterrsquos Rainscape50 (surface water elimination and reduction) strategy To identify areas with the most
48httpevidenceenvironment‐agencygovukfcermenDefaultHomeAndLeisureFloodsWhatWereDoingIntoTheFutureScience ProgrammeResearchAndDevelopmentFCRMProjectaspxProjectID=15515be8‐bbed‐4204‐ae56‐3e810ba47694ampPageID=56bad68e‐dcb1‐4bf8‐84cc‐cbfd03ab63a2 49 httpwwwciwemorgmedia674511Paper20820Stephen20Ollierpdf 50httpwwwdwrcymrucom_libraryleaflets_publications_english
205240txt012|May 2013
38
Drainage Strategy Framework
potential for effective storm water removal a flowareaflooding thematic map was developed This was used to focus attention on areas which would deliver the most benefit if storm water removal was carried out These areas are coloured red in Figure 16
Figure 16 Thematic map showing areas of maximum potential for storm water removal
The following interventions (181 in total) were combined into single strategy to be delivered in phases by 2015 2020 and afterwards
bull The management of surface water through swales basins and soakaways rather than through combined sewers resulting in new amenity and ecological areas within the built‐up environment
bull Implementing smarter flow control to better use existing storage and conveyance assets bull Relining of sewers to prevent groundwater ingress bull Removal of land drainage connections to sewers bull Household rainwater harvesting retrofit schemes
surface_water_management_strategypdf
205240txt012|May 2013
39
Drainage Strategy Framework
Figure 17 is an artistrsquos impression of what one of the sustainable urban drainage system solutions may look like
Figure 17 Example retrofit SuDS solution proposed for Gowerton and Llanelli
Modelling has demonstrated that the alternative strategy will achieve the same CSO reduction benefit as the storage strategy together with flooding improvements and additional less tangible benefits at significantly lower cost than the traditional sewer storage solution
Figure 18 illustrates the dispersed nature of solutions identified for central Llanelli
Figure 18 Water sensitive urban design interventions planned for central Llanelli
205240txt012|May 2013
40
Drainage Strategy Framework
Appendix A
Glossary
205240txt012|May 2013
Drainage Strategy Framework
Appendix A Glossary
CAPEX Capital expenditure Appointed water and sewerage companiesrsquo spending on new replacement or refurbished capital assets such as construction or buying machinery
CIWEM Urban Drainage Group (WaPUG) A group of the Chartered Institution of Water and Environmental Management supporting professionals working in urban drainage
Combined Sewer Overflow (CSO) The discharge of untreated sewage diluted with storm water into rivers and the sea CSOs occur during heavy rain and are necessary to reduce the risk of sewer flooding The physical overflow structure is also called a CSO
Common Framework for Capital A planning approach developed for the water and Maintenance Planning sewerage companies in 2002 which provides a robust basis
for assessing future capital maintenance needs The approach is consistent with the needs of Ofwat
Defra The Department for Environment Food and Rural Affairs The Government Department with responsibility for water flooding and water quality in England
Drainage Area Plan (DAP) A detailed plan for a drainage catchment that prioritises a list of interventions based on risk using an approach established in the WRc Sewerage Rehabilitation Manual This approach has been succeeded by Sewerage Risk Management which guides the preparation of Sewerage Management Plans (SMP) Companies vary in how they prepare DAPs or SMPs (or their equivalents) following the general principles that have been established
Drainage Strategy Developed by water and sewerage companies to demonstrate how outcomes will be delivered in drainage catchments over the long term Drainage Strategies will use the information developed in producing a DAPSMP and if a drainage strategy has been produced this should be the starting point in producing a more detailed DAPSMP should this be required It is likely that the activities required to prepare DAPSMP and Drainage Strategies may overlap Drainage Strategies might not refer to specific interventions but instead outline a general approach
Drainage Strategy Framework Guidance to describe the contents and intention of Drainage Strategies
205240txt012|May 2013
Drainage Strategy Framework
Flood Risk Management Plans Required by the Flood Risk Regulations in Flood Risk Areas by December 2015
Flood Risk Regulations The legislative instrument used to implement the requirements of the Floods Directive in England and Wales
Floods Directive DIRECTIVE 200760EC of the European Parliament and of the Council of 23 October 2007 on the assessment and management of flood risks
Lead Local Flood Authority (LLFA) The Shire County or unitary authority with responsibility for managing local flood risk
Local development plans Developed by planning authorities to explain where and what type of development (new homes and businesses) will occur within their area They are required to explain water infrastructure needs to support this development
Local Flood Risk Management Strategy Developed by the Lead Local Flood Authority to explain (LFRMS) how local flood risk will be managed by the Authority and
in partnership with others
Natural Resources Wales From 1 April 2013 Natural Resources Wales (NRW) a new body formed by the Welsh Government will take over the functions previously carried out by the Environment Agency (EA) in Wales alongside those of the Forestry Commission Wales and the Countryside Council for Wales
Ofwat The Water Services Regulation Authority ndash the economic regulator of the water and sewerage companies of England and Wales
OPEX Operating expenditure Appointed water and sewerage companiesrsquo day‐to‐day spending on running the services for example staff costs and power This is likely to include investment in joint projects that do not create or relate to an asset that the company solely or jointly owns
Outcomes Outcomes are the higher level objectives that a companyrsquos actions are intended to deliver A companyrsquos outcome should reflect its customersrsquo priorities identified through appropriate customer engagement and deliver the best long‐term sustainable solution for customers and the environment An outcome may not be bound by a single price control period and should be set in the context of customersrsquo and the environmentrsquos long‐term needs
205240txt012|May 2013
Drainage Strategy Framework
Price Review The process of setting appointed water and sewerage companiesrsquo price limits The next price review will take place in 2014 for the period 2015‐20 Ofwat currently sets price limits every five years
Real Time Control (RTC) Using actuated pumps gates and weirs to actively control flow in sewers Better use can be made of existing infrastructure and links can be made between network treatment and receiving water systems for operational benefits Sometimes referred to as Active Management
River Basin Management (Plans) River Basin Management is a continuous process of planning (to develop River Basin Management Plans) and delivery The Water Framework Directive introduces a formal series of 6 year cycles The first cycle will end in 2015 when following further planning and consultation the River Basin Management Plans will be updated and reissued
Sewerage Management Plan A risk based approach to indentifying investment needs in sewerage systems as described in the Sewerage Risk Management (SRM) approach developed by WRc plc
Storm water retrofit Releasing capacity in sewers by controlling stormwater at the surface using disconnection swales and other sustainable drainage systems (SuDS)
205240txt012|May 2013
We are the Environment Agency We protect and improve the environment and make it a better place for people and wildlife We operate at the place where environmental change has its greatest impact on peoplersquos lives We reduce the risks to people and properties from flooding make sure there is enough water for people and wildlife protect and improve air land and water quality and apply the environmental standards within which industry can operate Acting to reduce climate change and helping people and wildlife adapt to its consequences are at the heart of all that we do We cannot do this alone We work closely with a wide range of partners including government business local authorities other agencies civil society groups and the communities we serve
wwwenvironment‐agencygovuk
Environment Agency National Customer Contact Centre
Telephone 03708 506 506 enquiriesenvironment‐agencygovuk
Ofwat (The Water Services Regulation Authority) is a non‐ministerial government department We are responsible for making sure that the water and sewerage sectors in England and Wales provide consumers with a good quality and efficient service at a fair price
wwwofwatgovuk
Telephone 0121 644 7500 mailboxofwatgsigovuk
Halcrow Group Limited Burderop Park Swindon Wiltshire SN4 0QD
tel 01793 812479 fax 01793 812089 halcrowcom
Halcrow Group Limited is a CH2M HILL company Halcrow Group Limited has prepared this report in accordance with
the instructions of The Environment Agency for the clientrsquos sole and specific use Any other persons who use any information contained herein do so at their own risk
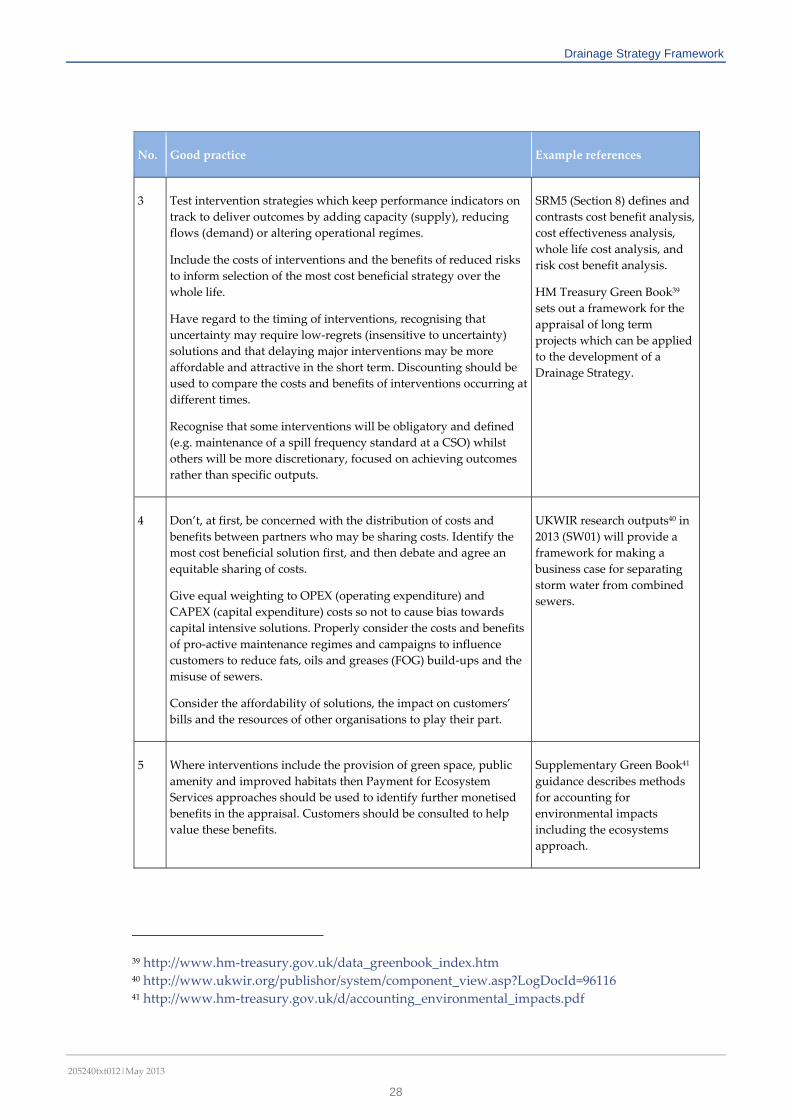
Drainage Strategy Framework
No Good practice Example references
3 Test intervention strategies which keep performance indicators on track to deliver outcomes by adding capacity (supply) reducing flows (demand) or altering operational regimes
Include the costs of interventions and the benefits of reduced risks to inform selection of the most cost beneficial strategy over the whole life
Have regard to the timing of interventions recognising that uncertainty may require low‐regrets (insensitive to uncertainty) solutions and that delaying major interventions may be more affordable and attractive in the short term Discounting should be used to compare the costs and benefits of interventions occurring at different times
Recognise that some interventions will be obligatory and defined (eg maintenance of a spill frequency standard at a CSO) whilst others will be more discretionary focused on achieving outcomes rather than specific outputs
SRM5 (Section 8) defines and contrasts cost benefit analysis cost effectiveness analysis whole life cost analysis and risk cost benefit analysis
HM Treasury Green Book39
sets out a framework for the appraisal of long term projects which can be applied to the development of a Drainage Strategy
4 Donrsquot at first be concerned with the distribution of costs and benefits between partners who may be sharing costs Identify the most cost beneficial solution first and then debate and agree an equitable sharing of costs
Give equal weighting to OPEX (operating expenditure) and CAPEX (capital expenditure) costs so not to cause bias towards capital intensive solutions Properly consider the costs and benefits of pro‐active maintenance regimes and campaigns to influence customers to reduce fats oils and greases (FOG) build‐ups and the misuse of sewers
Consider the affordability of solutions the impact on customersrsquo bills and the resources of other organisations to play their part
UKWIR research outputs40 in 2013 (SW01) will provide a framework for making a business case for separating storm water from combined sewers
5 Where interventions include the provision of green space public amenity and improved habitats then Payment for Ecosystem Services approaches should be used to identify further monetised benefits in the appraisal Customers should be consulted to help value these benefits
Supplementary Green Book41
guidance describes methods for accounting for environmental impacts including the ecosystems approach
39 httpwwwhm‐treasurygovukdata_greenbook_indexhtm 40 httpwwwukwirorgpublishorsystemcomponent_viewaspLogDocId=96116 41 httpwwwhm‐treasurygovukdaccounting_environmental_impactspdf
205240txt012|May 2013
28
Drainage Strategy Framework
242 Good practice example ndash Severn Trent Water making the case for surface water separation in Stoke-on-Trent
In this example42 Severn Trent Water compared alternative ways of addressing sewer flooding problems by looking at a range of costs and benefits not all of which were directly associated with its specific responsibilities as a water and sewerage company Whilst the example does not express a monetised value for all costs and benefits over the whole life it does illustrate the types of factors which could be included in an appraisal of this type scaled to address problems at a catchment level It also demonstrates how working collaboratively can help identify solutions which are cost‐beneficial for the community at large
In an area of Stoke served by a combined sewer system five properties were at risk from sewer flooding in cellars for events equal to and less frequent than the 1 in 10 year probability A conventional sewer pumping station based solution was presented as the standard option
However a nearby former hospital site was also undergoing re‐development which would result in reduced runoff to the combined sewer The new drainage regime in the redevelopment site was sufficient to remove the flood risk at the five properties (this was a do nothing strategy)
A third option completely separated the development site runoff from the combined sewer and also addressed local flood risk issues nearby The solution required a new storm sewer and a network of swales and other SuDS features connecting with an ordinary watercourse
Table 1 illustrates how costs and benefits were compared across the three alternative strategies Each provided the same benefit in terms of the number of homes (5) relieved from sewer flooding The novel SuDS and surface water management solution additionally gave local flood risk relief to 3 further properties The separationSuDS strategy came at a higher capital cost but delivered greater social cost benefits savings in annual operating costs and a bonus improvement water quality (because of reduced CSO spill volume) Severn Trent selected the separation SuDS solution because the higher capital costs were offset by other benefits
Table 1 Costs and benefits of drainage improvements in part of Stoke-on-Trent
Do nothing Standard option
SuDS
Sewer flooding benefits 5 5 5
Other flooding benefits 0 0 3
Change in runoff to combined sewer (m3year) 0 0 ‐40000
Estimated cost (pound) 0 168000 419000
42httpwwwciwemorgmedia695460Paper203_Creating20Sewer20Capacity_Presentation2 0by20Mike20Woodpdf
205240txt012|May 2013
29
Drainage Strategy Framework
Do nothing Standard option
SuDS
Social Cost Benefit (pound) 16000 5000 51000
Change in electricity costs (poundyear) 0 +75 ‐525
Programme impact (years to deliver solution) + 4 0 +4
CSO spill volume (m3 in 1year event) +298 0 ‐397
243 Good practice example ndash New York City comparison of grey and green infrastructure drainage strategies
This example is taken from New York in the United States of America Itrsquos an illustration of how whole life costs have been compared for alternative strategies to solve urban drainage issues on a mega‐city scale The key data are summarised in Table 2
Table 2 Comparing drainage strategies in New York
Grey Strategy
Green Strategy
CSO spill volume reduction (billion gallons year)
101 122
Wider benefits over 20 years ($ million) 0 139 to 418
Whole life costs over 20 years ($ billion) 68 53
The information is taken from the New York City Green Infrastructure Plan43 produced by the Mayorrsquos Office in 2010 The Plan (and recent updates) provides a comprehensive evidence base around costs and benefits of different approaches to address the cityrsquos drainage problems It is therefore an excellent example of how drainage strategies can be described in plain language for a non‐specialist audience concerned with their environment and the cost of providing infrastructure to enhance it
It is becoming commonplace for North American cities (eg Portland and Philadelphia) to address the issue of frequent combined sewer overflow (CSO) operation by using a combination of grey infrastructure (sewers) and green infrastructure (sustainable drainage systems) The wider health
43 httpwwwnycgovhtmldephtmlstormwaternyc_green_infrastructure_planshtml
205240txt012|May 2013
30
25
Drainage Strategy Framework
and ecological benefits of green infrastructure approaches and the reduced reliance on materials and energy are attractive to utility planners and cities alike
New York has 422 CSOs and an agreed Long Term Control Strategy to significantly reduce the impact wet weather discharges have on aquatic systems throughout the city Annual discharges are currently (2010) estimated to be 30 billion gallons (114 million cubic meters) per year Building on existing and committed new sewer plans an agreed grey infrastructure based strategy to this problem is set to reduce these discharges to 198 billion gallons per year (a 34 reduction) by the 2030s An alternative green infrastructure approach based around intercepting the first inch (25mm) of rainfall across 10 of the impermeable city area by 2030 is predicted to reduce CSO spills to 179 billion gallons per year
Planners have calculated that the whole life costs after 20 years of the grey infrastructure solution will be $68 billion (2010 prices) compared to the green infrastructure whole life costs of $53 billion The green infrastructure strategy reduces CSO spills by more than the grey alternative for $15 billion less in terms of whole life cost Further planners have calculated that New Yorkers will benefit by up to $41844 million (accumulated over 20 years) in additional benefits associated with lower energy bills from control of urban heating increased property values and improved health
Based on this analysis New York City has committed itself to an aggressive green infrastructure based runoff control strategy to provide long term reductions in CSO spills The plan is to achieve interception of 15 of impermeable area by 2015 4 by 2020 7 by 2025 and 10 by 2030
Principle Five Live Process
The Strategy should be adaptable and periodically reviewed Whilst outcomes are expected to be relatively stable over time the pace at which the Strategy delivers outcomes will be linked to volatile influences (like climate and population change) and to the decisions made at each price review about the priorities for the following period The Strategy should be reviewed at regular intervals to reflect investments already made the changing priorities of the water and sewerage company and partners and the presence of emerging risks The review is also an opportunity to report drainage catchment performance relative to performance measures designed to monitor progress towards achieving outcomes
44 Estimated using methods from the New York Municipal Forest Resource Analysis (MFRA) prepared by the US Dept of Agriculture
205240txt012|May 2013
31
Drainage Strategy Framework
251 Recommended good practice
No Good practice Example references
1 Regularly repeat screening exercise to determine catchments requiring a Drainage Strategy and modify programme of Strategy development accordingly
Check for changes in measured rates of flooding and pollution incidents blockages collapses pumping station failures etc
Check for changes in extent and location of new development
Check for activities being undertaken by partners (eg redevelopment urban realm improvements and flooding and pollution management activities)
SRM5 illustrates how improved and updated knowledge of system performance should be applied to establish Strategies
2 In lsquolive Strategiesrsquo repeat risk assessment when data and models improve and adjust confidence scores accordingly
Confirm that Strategy will still achieve performance indicators and outcomes at least cost Revise Strategy as necessary
3 Periodically refresh Strategy accommodating impact of interventions already delivered using re‐verified predictive tools as appropriate
Confirm that Strategy will still achieve performance indicators and outcomes at least cost Revise Strategy as necessary
Triggers for a wholesale review of the Strategy are likely to be significant changes to the location or extent of planned development
4 Monitor report and share (with partners) the measures used to demonstrate delivery of outcomes Example measures may include the number of properties which experience sewer flooding the number of properties at risk of flooding the number of properties at risk from sewerage asset failure risk indices that capture both the probability and consequence of failure customer satisfaction with regards to clean rivers and beaches the number of pollution incidents the frequency of combined sewer overflow operation and compliance with discharge permit conditions
252 Good practice example ndash Thames Water live DAP
Thames Water has initiated a DAP (drainage area plan) Live approach Itrsquos a good example of how companies are continuously monitoring and updating the status of drainage area risks It provides a lsquoliversquo snapshot of the current health of all drainage areas in Thames Waterrsquos region allowing real time planning as part of a strategic approach It enables drainage planners to view the effectiveness
205240txt012|May 2013
32
Drainage Strategy Framework
of intervention strategies and compare incident rates across varying geographies and development types in the Thames Valley
DAP Live will be available for all catchments in the Thames Water area thus enabling
bull high level monitoring of risks across the business bull a live and strategic review of catchment performance bull prioritisation of catchments based on risk and bull an ability to share data with partners collaborating in drainage planning and improvements
Figure 12 illustrates the types of data managed through the DAP Live system These include asset data political and drainage boundaries environmental data operational data property amp growth data and modelling data As new data become available the DAP Live system is updated so that drainage planners have the most current view on emerging risks and issues
Asset data
Operational data
Property and growth data
Modelling data
Environmental data
Boundaries (SDACs operational political)
Figure 12 Data types held in the DAP Live system
Figure 13 illustrates how the system can provide analysis at a variety of scales from local authority boundaries sewage treatment works catchments drainage areas or a regular grid
205240txt012|May 2013
33
Drainage Strategy Framework
NE PROVINCES
WESTERN PROVINCES
NE LONDON bull Ops areas local W LONDON
SE LONDON authorities Large TIDWORTH SE PROVINCES
bull STW Catchments
bull Drainage areas(SDACs)
bull Regular grid Small
Figure 13 DAP Live reporting performance at different scales
205240txt012|May 2013
34
Drainage Strategy Framework
253 Good practice example ndash Wessex Water Water live data
Wessex Water is regularly using data geospatially to proactively identify and respond to risk Theirs is a good example of how data can be used to provide an adaptable approach that is regularly reviewed to plan investment
The risk‐based and live approach uses a set of likelihood and consequence models which are built up from all currently available data asset data (eg CCTV data material age) operational data (eg flooding and pollutions incidents) and information (eg locality near hospital or downstream of an overflow) All these data are collated for the entire Wessex region updated regularly and analysed geospatially
Figure 14 Sewer risk scores presented in a risk matrix and geospatially
This allows a risk score (Figure 14) to be calculated for each mapped sewer length which directs investigation more efficiently by allocating each mapped sewer a planned CCTV inspection date
This risk‐based approach has been successful in targeting problematic sewers increasing identification rates threefold Density analysis is performed using asset failure and operational information which allows planning of both proactive structural and operational investment
Proactively found structural issues are far more cost effective to repair before failure and can also prevent serviceability issues
205240txt012|May 2013
35
f
DDrainage Strateegy Frameworrk
Figgure 15 Hotsppot analysis
Thhe hotspot annalysis (Figuure 15) showss where operrational clustters have beeen calculatedd This hootspot analyssis is made aavailable on tthe Wessex WWater corporrate GIS to a llow operati onal staff to target their effforts to mitiggate against ffurther repeaat incidents AAdditional innformation ffrom asset annd operationnal activities ccan be addedd regularly too the databasses which drrive the mod els enabling rissk scores to bbe kept as livve as require d
226 Prrinciple Sixx Innovativve and Susstainable SSolutions
Thhe Drainage Strategy Fraamework proomotes the fuull evaluationn of alternatiives to tradit ionally enngineered sewwerage soluttions to test wwhether thesse offer loweer whole life ccost options or better reesponses to uuncertainty It is anticipaated that draainage solutioons of the futture will be ddifferent froom the ones we are usedd to
Thhese should iinclude (at leeast at a highh level) real ttime control storm waterr retrofit techhniques edducation to eenable custommers to changge behaviou r enhancingg incentives for customerss to reduce suurface water flowing to seewers and innnovative pe rmitting arraangements a cross drainagge networks annd sewage tr eatment worrks Water annd sewerage companies sshould continnue to revieww and deevelop other innovative ssolutions
Foor example wwhere a commpany may hiistorically haave preferredd to tackle seewer floodingg or coombined sewwer overflow pollution byy increasing iits undergrouund equipmment to store mmore rainfalll duuring stormss it might connsider other options in fuuture ndash such as working wwith custommers to mmanage the raainfall close tt eventing it foorm enteringg the sewer syystem o source pre
2205240txt012|Mayy 2013
36
Drainage Strategy Framework
261 Recommended good practice
No Good practice Example references
1 Use cost‐benefit methods to demonstrate that innovative and sustainable solution types provide best value for customers and the wider community
UKWIR will publish new research and guidance in 2013 addressing active control and storm water removal demonstrating how these technologies can be justified and included within Drainage Strategies
2 Consider integrated water resource management Work with partners (especially developers and local authorities) to examine whether use of stored stormwater reduces potable water consumption AND need for capacity in sewers
CIRIA has published a scoping study for water sensitive urban design45 in the UK
3 Consider a mix of conventional and new technologies using more adaptive approaches as low‐regrets responses to uncertainty eg prevent current sewer flooding with underground tank storage but address future risks (worsened by climate change) with retrofit SuDS implemented progressively
CIRIA has published lsquoRetrofitting to manage surface waterrsquo46 a comprehensive guide to planning and delivering this type of project
4 Use carbon accounting methods to compare embodied and emitted carbon in alternative intervention strategies so that these impacts are accounted for in whole life costs
Consider the benefits of surface water removal on the costs (including carbon) of pumping and sewage treatment
UKWIR47 has and continues to publish detailed guidance on carbon accounting for water and sewerage company use
45httpwwwciriaorgserviceresearch_informationAMContentManagerNet ContentDisplayaspxSection=research_informationampContentID=23581 46httpwwwciriaorgSERVICEHomecoreordersproductaspxcatid=5ampprodid=1909 47httpukwirforefront‐librarycomreports08‐cl‐01‐6923419000190269902659465890269
205240txt012|May 2013
37
Drainage Strategy Framework
No Good practice Example references
5 Where interventions include the provision of green space public amenity and improved habitats then Payment for Ecosystem Services approaches can be used to claim further monetised benefits in the appraisal Customers should be consulted to help value these benefits
The Environment Agency will publish data in 2013 on costs and benefits of retrofit stormwater projects to promote understanding and uptake
6 Share data within the industry on innovative solutions to increase knowledge of new technology and SuDs approaches
EA retrofitting SuDs costs and benefits database48
accommodating data from Ofwat AMP5 SuDS pilot initiative and other examples
262 Good practice example ndash Welsh Water surface water reduction and removal strategy for Gowerton and Llanelli
Dŵr Cymru Welsh Water and partners are applying innovative storm water removal methods to address capacity problems in the sewer network in Gowerton and Llanelli49 (population 140000) Current under capacity leads to localised sewer flooding and excessive combined sewer overflow (CSO) spill to the Burry Inlet a protected shellfish water and special area of conservation The capacity problems in the system were a concern for the Environment Agency (Wales) and there was a risk of widespread restrictions to economic development being imposed Dŵr Cymru Welsh Water Carmarthenshire County Council City and County of Swansea Consumer Council for Water Environment Agency Wales and the Welsh Government all worked in partnership to resolve the situation
A brand new hydraulic model was built for the entire sewerage network with particular attention paid to accurately representing the sources of storm run‐off and infiltration The model was verified against data from flow monitors and observed CSO spill frequencies into the Burry Inlet
To begin with a traditional sewer storage solution was proposed that would result in an average 10 spills a year into the shellfish water from all 90 CSOs in the two catchments Although this reduced spills and dealt with some of the flooding and growth issues the storage requirements would have been unaffordable provide no protection against long term climate change and would not tackle the fundamental problem of too much surface water getting into the combined network
An alternative approach based on the reduction and removal of storm water from the combined sewer system was also developed This was in accordance with Dŵr Cymru Welsh Waterrsquos Rainscape50 (surface water elimination and reduction) strategy To identify areas with the most
48httpevidenceenvironment‐agencygovukfcermenDefaultHomeAndLeisureFloodsWhatWereDoingIntoTheFutureScience ProgrammeResearchAndDevelopmentFCRMProjectaspxProjectID=15515be8‐bbed‐4204‐ae56‐3e810ba47694ampPageID=56bad68e‐dcb1‐4bf8‐84cc‐cbfd03ab63a2 49 httpwwwciwemorgmedia674511Paper20820Stephen20Ollierpdf 50httpwwwdwrcymrucom_libraryleaflets_publications_english
205240txt012|May 2013
38
Drainage Strategy Framework
potential for effective storm water removal a flowareaflooding thematic map was developed This was used to focus attention on areas which would deliver the most benefit if storm water removal was carried out These areas are coloured red in Figure 16
Figure 16 Thematic map showing areas of maximum potential for storm water removal
The following interventions (181 in total) were combined into single strategy to be delivered in phases by 2015 2020 and afterwards
bull The management of surface water through swales basins and soakaways rather than through combined sewers resulting in new amenity and ecological areas within the built‐up environment
bull Implementing smarter flow control to better use existing storage and conveyance assets bull Relining of sewers to prevent groundwater ingress bull Removal of land drainage connections to sewers bull Household rainwater harvesting retrofit schemes
surface_water_management_strategypdf
205240txt012|May 2013
39
Drainage Strategy Framework
Figure 17 is an artistrsquos impression of what one of the sustainable urban drainage system solutions may look like
Figure 17 Example retrofit SuDS solution proposed for Gowerton and Llanelli
Modelling has demonstrated that the alternative strategy will achieve the same CSO reduction benefit as the storage strategy together with flooding improvements and additional less tangible benefits at significantly lower cost than the traditional sewer storage solution
Figure 18 illustrates the dispersed nature of solutions identified for central Llanelli
Figure 18 Water sensitive urban design interventions planned for central Llanelli
205240txt012|May 2013
40
Drainage Strategy Framework
Appendix A
Glossary
205240txt012|May 2013
Drainage Strategy Framework
Appendix A Glossary
CAPEX Capital expenditure Appointed water and sewerage companiesrsquo spending on new replacement or refurbished capital assets such as construction or buying machinery
CIWEM Urban Drainage Group (WaPUG) A group of the Chartered Institution of Water and Environmental Management supporting professionals working in urban drainage
Combined Sewer Overflow (CSO) The discharge of untreated sewage diluted with storm water into rivers and the sea CSOs occur during heavy rain and are necessary to reduce the risk of sewer flooding The physical overflow structure is also called a CSO
Common Framework for Capital A planning approach developed for the water and Maintenance Planning sewerage companies in 2002 which provides a robust basis
for assessing future capital maintenance needs The approach is consistent with the needs of Ofwat
Defra The Department for Environment Food and Rural Affairs The Government Department with responsibility for water flooding and water quality in England
Drainage Area Plan (DAP) A detailed plan for a drainage catchment that prioritises a list of interventions based on risk using an approach established in the WRc Sewerage Rehabilitation Manual This approach has been succeeded by Sewerage Risk Management which guides the preparation of Sewerage Management Plans (SMP) Companies vary in how they prepare DAPs or SMPs (or their equivalents) following the general principles that have been established
Drainage Strategy Developed by water and sewerage companies to demonstrate how outcomes will be delivered in drainage catchments over the long term Drainage Strategies will use the information developed in producing a DAPSMP and if a drainage strategy has been produced this should be the starting point in producing a more detailed DAPSMP should this be required It is likely that the activities required to prepare DAPSMP and Drainage Strategies may overlap Drainage Strategies might not refer to specific interventions but instead outline a general approach
Drainage Strategy Framework Guidance to describe the contents and intention of Drainage Strategies
205240txt012|May 2013
Drainage Strategy Framework
Flood Risk Management Plans Required by the Flood Risk Regulations in Flood Risk Areas by December 2015
Flood Risk Regulations The legislative instrument used to implement the requirements of the Floods Directive in England and Wales
Floods Directive DIRECTIVE 200760EC of the European Parliament and of the Council of 23 October 2007 on the assessment and management of flood risks
Lead Local Flood Authority (LLFA) The Shire County or unitary authority with responsibility for managing local flood risk
Local development plans Developed by planning authorities to explain where and what type of development (new homes and businesses) will occur within their area They are required to explain water infrastructure needs to support this development
Local Flood Risk Management Strategy Developed by the Lead Local Flood Authority to explain (LFRMS) how local flood risk will be managed by the Authority and
in partnership with others
Natural Resources Wales From 1 April 2013 Natural Resources Wales (NRW) a new body formed by the Welsh Government will take over the functions previously carried out by the Environment Agency (EA) in Wales alongside those of the Forestry Commission Wales and the Countryside Council for Wales
Ofwat The Water Services Regulation Authority ndash the economic regulator of the water and sewerage companies of England and Wales
OPEX Operating expenditure Appointed water and sewerage companiesrsquo day‐to‐day spending on running the services for example staff costs and power This is likely to include investment in joint projects that do not create or relate to an asset that the company solely or jointly owns
Outcomes Outcomes are the higher level objectives that a companyrsquos actions are intended to deliver A companyrsquos outcome should reflect its customersrsquo priorities identified through appropriate customer engagement and deliver the best long‐term sustainable solution for customers and the environment An outcome may not be bound by a single price control period and should be set in the context of customersrsquo and the environmentrsquos long‐term needs
205240txt012|May 2013
Drainage Strategy Framework
Price Review The process of setting appointed water and sewerage companiesrsquo price limits The next price review will take place in 2014 for the period 2015‐20 Ofwat currently sets price limits every five years
Real Time Control (RTC) Using actuated pumps gates and weirs to actively control flow in sewers Better use can be made of existing infrastructure and links can be made between network treatment and receiving water systems for operational benefits Sometimes referred to as Active Management
River Basin Management (Plans) River Basin Management is a continuous process of planning (to develop River Basin Management Plans) and delivery The Water Framework Directive introduces a formal series of 6 year cycles The first cycle will end in 2015 when following further planning and consultation the River Basin Management Plans will be updated and reissued
Sewerage Management Plan A risk based approach to indentifying investment needs in sewerage systems as described in the Sewerage Risk Management (SRM) approach developed by WRc plc
Storm water retrofit Releasing capacity in sewers by controlling stormwater at the surface using disconnection swales and other sustainable drainage systems (SuDS)
205240txt012|May 2013
We are the Environment Agency We protect and improve the environment and make it a better place for people and wildlife We operate at the place where environmental change has its greatest impact on peoplersquos lives We reduce the risks to people and properties from flooding make sure there is enough water for people and wildlife protect and improve air land and water quality and apply the environmental standards within which industry can operate Acting to reduce climate change and helping people and wildlife adapt to its consequences are at the heart of all that we do We cannot do this alone We work closely with a wide range of partners including government business local authorities other agencies civil society groups and the communities we serve
wwwenvironment‐agencygovuk
Environment Agency National Customer Contact Centre
Telephone 03708 506 506 enquiriesenvironment‐agencygovuk
Ofwat (The Water Services Regulation Authority) is a non‐ministerial government department We are responsible for making sure that the water and sewerage sectors in England and Wales provide consumers with a good quality and efficient service at a fair price
wwwofwatgovuk
Telephone 0121 644 7500 mailboxofwatgsigovuk
Halcrow Group Limited Burderop Park Swindon Wiltshire SN4 0QD
tel 01793 812479 fax 01793 812089 halcrowcom
Halcrow Group Limited is a CH2M HILL company Halcrow Group Limited has prepared this report in accordance with
the instructions of The Environment Agency for the clientrsquos sole and specific use Any other persons who use any information contained herein do so at their own risk

Drainage Strategy Framework
242 Good practice example ndash Severn Trent Water making the case for surface water separation in Stoke-on-Trent
In this example42 Severn Trent Water compared alternative ways of addressing sewer flooding problems by looking at a range of costs and benefits not all of which were directly associated with its specific responsibilities as a water and sewerage company Whilst the example does not express a monetised value for all costs and benefits over the whole life it does illustrate the types of factors which could be included in an appraisal of this type scaled to address problems at a catchment level It also demonstrates how working collaboratively can help identify solutions which are cost‐beneficial for the community at large
In an area of Stoke served by a combined sewer system five properties were at risk from sewer flooding in cellars for events equal to and less frequent than the 1 in 10 year probability A conventional sewer pumping station based solution was presented as the standard option
However a nearby former hospital site was also undergoing re‐development which would result in reduced runoff to the combined sewer The new drainage regime in the redevelopment site was sufficient to remove the flood risk at the five properties (this was a do nothing strategy)
A third option completely separated the development site runoff from the combined sewer and also addressed local flood risk issues nearby The solution required a new storm sewer and a network of swales and other SuDS features connecting with an ordinary watercourse
Table 1 illustrates how costs and benefits were compared across the three alternative strategies Each provided the same benefit in terms of the number of homes (5) relieved from sewer flooding The novel SuDS and surface water management solution additionally gave local flood risk relief to 3 further properties The separationSuDS strategy came at a higher capital cost but delivered greater social cost benefits savings in annual operating costs and a bonus improvement water quality (because of reduced CSO spill volume) Severn Trent selected the separation SuDS solution because the higher capital costs were offset by other benefits
Table 1 Costs and benefits of drainage improvements in part of Stoke-on-Trent
Do nothing Standard option
SuDS
Sewer flooding benefits 5 5 5
Other flooding benefits 0 0 3
Change in runoff to combined sewer (m3year) 0 0 ‐40000
Estimated cost (pound) 0 168000 419000
42httpwwwciwemorgmedia695460Paper203_Creating20Sewer20Capacity_Presentation2 0by20Mike20Woodpdf
205240txt012|May 2013
29
Drainage Strategy Framework
Do nothing Standard option
SuDS
Social Cost Benefit (pound) 16000 5000 51000
Change in electricity costs (poundyear) 0 +75 ‐525
Programme impact (years to deliver solution) + 4 0 +4
CSO spill volume (m3 in 1year event) +298 0 ‐397
243 Good practice example ndash New York City comparison of grey and green infrastructure drainage strategies
This example is taken from New York in the United States of America Itrsquos an illustration of how whole life costs have been compared for alternative strategies to solve urban drainage issues on a mega‐city scale The key data are summarised in Table 2
Table 2 Comparing drainage strategies in New York
Grey Strategy
Green Strategy
CSO spill volume reduction (billion gallons year)
101 122
Wider benefits over 20 years ($ million) 0 139 to 418
Whole life costs over 20 years ($ billion) 68 53
The information is taken from the New York City Green Infrastructure Plan43 produced by the Mayorrsquos Office in 2010 The Plan (and recent updates) provides a comprehensive evidence base around costs and benefits of different approaches to address the cityrsquos drainage problems It is therefore an excellent example of how drainage strategies can be described in plain language for a non‐specialist audience concerned with their environment and the cost of providing infrastructure to enhance it
It is becoming commonplace for North American cities (eg Portland and Philadelphia) to address the issue of frequent combined sewer overflow (CSO) operation by using a combination of grey infrastructure (sewers) and green infrastructure (sustainable drainage systems) The wider health
43 httpwwwnycgovhtmldephtmlstormwaternyc_green_infrastructure_planshtml
205240txt012|May 2013
30
25
Drainage Strategy Framework
and ecological benefits of green infrastructure approaches and the reduced reliance on materials and energy are attractive to utility planners and cities alike
New York has 422 CSOs and an agreed Long Term Control Strategy to significantly reduce the impact wet weather discharges have on aquatic systems throughout the city Annual discharges are currently (2010) estimated to be 30 billion gallons (114 million cubic meters) per year Building on existing and committed new sewer plans an agreed grey infrastructure based strategy to this problem is set to reduce these discharges to 198 billion gallons per year (a 34 reduction) by the 2030s An alternative green infrastructure approach based around intercepting the first inch (25mm) of rainfall across 10 of the impermeable city area by 2030 is predicted to reduce CSO spills to 179 billion gallons per year
Planners have calculated that the whole life costs after 20 years of the grey infrastructure solution will be $68 billion (2010 prices) compared to the green infrastructure whole life costs of $53 billion The green infrastructure strategy reduces CSO spills by more than the grey alternative for $15 billion less in terms of whole life cost Further planners have calculated that New Yorkers will benefit by up to $41844 million (accumulated over 20 years) in additional benefits associated with lower energy bills from control of urban heating increased property values and improved health
Based on this analysis New York City has committed itself to an aggressive green infrastructure based runoff control strategy to provide long term reductions in CSO spills The plan is to achieve interception of 15 of impermeable area by 2015 4 by 2020 7 by 2025 and 10 by 2030
Principle Five Live Process
The Strategy should be adaptable and periodically reviewed Whilst outcomes are expected to be relatively stable over time the pace at which the Strategy delivers outcomes will be linked to volatile influences (like climate and population change) and to the decisions made at each price review about the priorities for the following period The Strategy should be reviewed at regular intervals to reflect investments already made the changing priorities of the water and sewerage company and partners and the presence of emerging risks The review is also an opportunity to report drainage catchment performance relative to performance measures designed to monitor progress towards achieving outcomes
44 Estimated using methods from the New York Municipal Forest Resource Analysis (MFRA) prepared by the US Dept of Agriculture
205240txt012|May 2013
31
Drainage Strategy Framework
251 Recommended good practice
No Good practice Example references
1 Regularly repeat screening exercise to determine catchments requiring a Drainage Strategy and modify programme of Strategy development accordingly
Check for changes in measured rates of flooding and pollution incidents blockages collapses pumping station failures etc
Check for changes in extent and location of new development
Check for activities being undertaken by partners (eg redevelopment urban realm improvements and flooding and pollution management activities)
SRM5 illustrates how improved and updated knowledge of system performance should be applied to establish Strategies
2 In lsquolive Strategiesrsquo repeat risk assessment when data and models improve and adjust confidence scores accordingly
Confirm that Strategy will still achieve performance indicators and outcomes at least cost Revise Strategy as necessary
3 Periodically refresh Strategy accommodating impact of interventions already delivered using re‐verified predictive tools as appropriate
Confirm that Strategy will still achieve performance indicators and outcomes at least cost Revise Strategy as necessary
Triggers for a wholesale review of the Strategy are likely to be significant changes to the location or extent of planned development
4 Monitor report and share (with partners) the measures used to demonstrate delivery of outcomes Example measures may include the number of properties which experience sewer flooding the number of properties at risk of flooding the number of properties at risk from sewerage asset failure risk indices that capture both the probability and consequence of failure customer satisfaction with regards to clean rivers and beaches the number of pollution incidents the frequency of combined sewer overflow operation and compliance with discharge permit conditions
252 Good practice example ndash Thames Water live DAP
Thames Water has initiated a DAP (drainage area plan) Live approach Itrsquos a good example of how companies are continuously monitoring and updating the status of drainage area risks It provides a lsquoliversquo snapshot of the current health of all drainage areas in Thames Waterrsquos region allowing real time planning as part of a strategic approach It enables drainage planners to view the effectiveness
205240txt012|May 2013
32
Drainage Strategy Framework
of intervention strategies and compare incident rates across varying geographies and development types in the Thames Valley
DAP Live will be available for all catchments in the Thames Water area thus enabling
bull high level monitoring of risks across the business bull a live and strategic review of catchment performance bull prioritisation of catchments based on risk and bull an ability to share data with partners collaborating in drainage planning and improvements
Figure 12 illustrates the types of data managed through the DAP Live system These include asset data political and drainage boundaries environmental data operational data property amp growth data and modelling data As new data become available the DAP Live system is updated so that drainage planners have the most current view on emerging risks and issues
Asset data
Operational data
Property and growth data
Modelling data
Environmental data
Boundaries (SDACs operational political)
Figure 12 Data types held in the DAP Live system
Figure 13 illustrates how the system can provide analysis at a variety of scales from local authority boundaries sewage treatment works catchments drainage areas or a regular grid
205240txt012|May 2013
33
Drainage Strategy Framework
NE PROVINCES
WESTERN PROVINCES
NE LONDON bull Ops areas local W LONDON
SE LONDON authorities Large TIDWORTH SE PROVINCES
bull STW Catchments
bull Drainage areas(SDACs)
bull Regular grid Small
Figure 13 DAP Live reporting performance at different scales
205240txt012|May 2013
34
Drainage Strategy Framework
253 Good practice example ndash Wessex Water Water live data
Wessex Water is regularly using data geospatially to proactively identify and respond to risk Theirs is a good example of how data can be used to provide an adaptable approach that is regularly reviewed to plan investment
The risk‐based and live approach uses a set of likelihood and consequence models which are built up from all currently available data asset data (eg CCTV data material age) operational data (eg flooding and pollutions incidents) and information (eg locality near hospital or downstream of an overflow) All these data are collated for the entire Wessex region updated regularly and analysed geospatially
Figure 14 Sewer risk scores presented in a risk matrix and geospatially
This allows a risk score (Figure 14) to be calculated for each mapped sewer length which directs investigation more efficiently by allocating each mapped sewer a planned CCTV inspection date
This risk‐based approach has been successful in targeting problematic sewers increasing identification rates threefold Density analysis is performed using asset failure and operational information which allows planning of both proactive structural and operational investment
Proactively found structural issues are far more cost effective to repair before failure and can also prevent serviceability issues
205240txt012|May 2013
35
f
DDrainage Strateegy Frameworrk
Figgure 15 Hotsppot analysis
Thhe hotspot annalysis (Figuure 15) showss where operrational clustters have beeen calculatedd This hootspot analyssis is made aavailable on tthe Wessex WWater corporrate GIS to a llow operati onal staff to target their effforts to mitiggate against ffurther repeaat incidents AAdditional innformation ffrom asset annd operationnal activities ccan be addedd regularly too the databasses which drrive the mod els enabling rissk scores to bbe kept as livve as require d
226 Prrinciple Sixx Innovativve and Susstainable SSolutions
Thhe Drainage Strategy Fraamework proomotes the fuull evaluationn of alternatiives to tradit ionally enngineered sewwerage soluttions to test wwhether thesse offer loweer whole life ccost options or better reesponses to uuncertainty It is anticipaated that draainage solutioons of the futture will be ddifferent froom the ones we are usedd to
Thhese should iinclude (at leeast at a highh level) real ttime control storm waterr retrofit techhniques edducation to eenable custommers to changge behaviou r enhancingg incentives for customerss to reduce suurface water flowing to seewers and innnovative pe rmitting arraangements a cross drainagge networks annd sewage tr eatment worrks Water annd sewerage companies sshould continnue to revieww and deevelop other innovative ssolutions
Foor example wwhere a commpany may hiistorically haave preferredd to tackle seewer floodingg or coombined sewwer overflow pollution byy increasing iits undergrouund equipmment to store mmore rainfalll duuring stormss it might connsider other options in fuuture ndash such as working wwith custommers to mmanage the raainfall close tt eventing it foorm enteringg the sewer syystem o source pre
2205240txt012|Mayy 2013
36
Drainage Strategy Framework
261 Recommended good practice
No Good practice Example references
1 Use cost‐benefit methods to demonstrate that innovative and sustainable solution types provide best value for customers and the wider community
UKWIR will publish new research and guidance in 2013 addressing active control and storm water removal demonstrating how these technologies can be justified and included within Drainage Strategies
2 Consider integrated water resource management Work with partners (especially developers and local authorities) to examine whether use of stored stormwater reduces potable water consumption AND need for capacity in sewers
CIRIA has published a scoping study for water sensitive urban design45 in the UK
3 Consider a mix of conventional and new technologies using more adaptive approaches as low‐regrets responses to uncertainty eg prevent current sewer flooding with underground tank storage but address future risks (worsened by climate change) with retrofit SuDS implemented progressively
CIRIA has published lsquoRetrofitting to manage surface waterrsquo46 a comprehensive guide to planning and delivering this type of project
4 Use carbon accounting methods to compare embodied and emitted carbon in alternative intervention strategies so that these impacts are accounted for in whole life costs
Consider the benefits of surface water removal on the costs (including carbon) of pumping and sewage treatment
UKWIR47 has and continues to publish detailed guidance on carbon accounting for water and sewerage company use
45httpwwwciriaorgserviceresearch_informationAMContentManagerNet ContentDisplayaspxSection=research_informationampContentID=23581 46httpwwwciriaorgSERVICEHomecoreordersproductaspxcatid=5ampprodid=1909 47httpukwirforefront‐librarycomreports08‐cl‐01‐6923419000190269902659465890269
205240txt012|May 2013
37
Drainage Strategy Framework
No Good practice Example references
5 Where interventions include the provision of green space public amenity and improved habitats then Payment for Ecosystem Services approaches can be used to claim further monetised benefits in the appraisal Customers should be consulted to help value these benefits
The Environment Agency will publish data in 2013 on costs and benefits of retrofit stormwater projects to promote understanding and uptake
6 Share data within the industry on innovative solutions to increase knowledge of new technology and SuDs approaches
EA retrofitting SuDs costs and benefits database48
accommodating data from Ofwat AMP5 SuDS pilot initiative and other examples
262 Good practice example ndash Welsh Water surface water reduction and removal strategy for Gowerton and Llanelli
Dŵr Cymru Welsh Water and partners are applying innovative storm water removal methods to address capacity problems in the sewer network in Gowerton and Llanelli49 (population 140000) Current under capacity leads to localised sewer flooding and excessive combined sewer overflow (CSO) spill to the Burry Inlet a protected shellfish water and special area of conservation The capacity problems in the system were a concern for the Environment Agency (Wales) and there was a risk of widespread restrictions to economic development being imposed Dŵr Cymru Welsh Water Carmarthenshire County Council City and County of Swansea Consumer Council for Water Environment Agency Wales and the Welsh Government all worked in partnership to resolve the situation
A brand new hydraulic model was built for the entire sewerage network with particular attention paid to accurately representing the sources of storm run‐off and infiltration The model was verified against data from flow monitors and observed CSO spill frequencies into the Burry Inlet
To begin with a traditional sewer storage solution was proposed that would result in an average 10 spills a year into the shellfish water from all 90 CSOs in the two catchments Although this reduced spills and dealt with some of the flooding and growth issues the storage requirements would have been unaffordable provide no protection against long term climate change and would not tackle the fundamental problem of too much surface water getting into the combined network
An alternative approach based on the reduction and removal of storm water from the combined sewer system was also developed This was in accordance with Dŵr Cymru Welsh Waterrsquos Rainscape50 (surface water elimination and reduction) strategy To identify areas with the most
48httpevidenceenvironment‐agencygovukfcermenDefaultHomeAndLeisureFloodsWhatWereDoingIntoTheFutureScience ProgrammeResearchAndDevelopmentFCRMProjectaspxProjectID=15515be8‐bbed‐4204‐ae56‐3e810ba47694ampPageID=56bad68e‐dcb1‐4bf8‐84cc‐cbfd03ab63a2 49 httpwwwciwemorgmedia674511Paper20820Stephen20Ollierpdf 50httpwwwdwrcymrucom_libraryleaflets_publications_english
205240txt012|May 2013
38
Drainage Strategy Framework
potential for effective storm water removal a flowareaflooding thematic map was developed This was used to focus attention on areas which would deliver the most benefit if storm water removal was carried out These areas are coloured red in Figure 16
Figure 16 Thematic map showing areas of maximum potential for storm water removal
The following interventions (181 in total) were combined into single strategy to be delivered in phases by 2015 2020 and afterwards
bull The management of surface water through swales basins and soakaways rather than through combined sewers resulting in new amenity and ecological areas within the built‐up environment
bull Implementing smarter flow control to better use existing storage and conveyance assets bull Relining of sewers to prevent groundwater ingress bull Removal of land drainage connections to sewers bull Household rainwater harvesting retrofit schemes
surface_water_management_strategypdf
205240txt012|May 2013
39
Drainage Strategy Framework
Figure 17 is an artistrsquos impression of what one of the sustainable urban drainage system solutions may look like
Figure 17 Example retrofit SuDS solution proposed for Gowerton and Llanelli
Modelling has demonstrated that the alternative strategy will achieve the same CSO reduction benefit as the storage strategy together with flooding improvements and additional less tangible benefits at significantly lower cost than the traditional sewer storage solution
Figure 18 illustrates the dispersed nature of solutions identified for central Llanelli
Figure 18 Water sensitive urban design interventions planned for central Llanelli
205240txt012|May 2013
40
Drainage Strategy Framework
Appendix A
Glossary
205240txt012|May 2013
Drainage Strategy Framework
Appendix A Glossary
CAPEX Capital expenditure Appointed water and sewerage companiesrsquo spending on new replacement or refurbished capital assets such as construction or buying machinery
CIWEM Urban Drainage Group (WaPUG) A group of the Chartered Institution of Water and Environmental Management supporting professionals working in urban drainage
Combined Sewer Overflow (CSO) The discharge of untreated sewage diluted with storm water into rivers and the sea CSOs occur during heavy rain and are necessary to reduce the risk of sewer flooding The physical overflow structure is also called a CSO
Common Framework for Capital A planning approach developed for the water and Maintenance Planning sewerage companies in 2002 which provides a robust basis
for assessing future capital maintenance needs The approach is consistent with the needs of Ofwat
Defra The Department for Environment Food and Rural Affairs The Government Department with responsibility for water flooding and water quality in England
Drainage Area Plan (DAP) A detailed plan for a drainage catchment that prioritises a list of interventions based on risk using an approach established in the WRc Sewerage Rehabilitation Manual This approach has been succeeded by Sewerage Risk Management which guides the preparation of Sewerage Management Plans (SMP) Companies vary in how they prepare DAPs or SMPs (or their equivalents) following the general principles that have been established
Drainage Strategy Developed by water and sewerage companies to demonstrate how outcomes will be delivered in drainage catchments over the long term Drainage Strategies will use the information developed in producing a DAPSMP and if a drainage strategy has been produced this should be the starting point in producing a more detailed DAPSMP should this be required It is likely that the activities required to prepare DAPSMP and Drainage Strategies may overlap Drainage Strategies might not refer to specific interventions but instead outline a general approach
Drainage Strategy Framework Guidance to describe the contents and intention of Drainage Strategies
205240txt012|May 2013
Drainage Strategy Framework
Flood Risk Management Plans Required by the Flood Risk Regulations in Flood Risk Areas by December 2015
Flood Risk Regulations The legislative instrument used to implement the requirements of the Floods Directive in England and Wales
Floods Directive DIRECTIVE 200760EC of the European Parliament and of the Council of 23 October 2007 on the assessment and management of flood risks
Lead Local Flood Authority (LLFA) The Shire County or unitary authority with responsibility for managing local flood risk
Local development plans Developed by planning authorities to explain where and what type of development (new homes and businesses) will occur within their area They are required to explain water infrastructure needs to support this development
Local Flood Risk Management Strategy Developed by the Lead Local Flood Authority to explain (LFRMS) how local flood risk will be managed by the Authority and
in partnership with others
Natural Resources Wales From 1 April 2013 Natural Resources Wales (NRW) a new body formed by the Welsh Government will take over the functions previously carried out by the Environment Agency (EA) in Wales alongside those of the Forestry Commission Wales and the Countryside Council for Wales
Ofwat The Water Services Regulation Authority ndash the economic regulator of the water and sewerage companies of England and Wales
OPEX Operating expenditure Appointed water and sewerage companiesrsquo day‐to‐day spending on running the services for example staff costs and power This is likely to include investment in joint projects that do not create or relate to an asset that the company solely or jointly owns
Outcomes Outcomes are the higher level objectives that a companyrsquos actions are intended to deliver A companyrsquos outcome should reflect its customersrsquo priorities identified through appropriate customer engagement and deliver the best long‐term sustainable solution for customers and the environment An outcome may not be bound by a single price control period and should be set in the context of customersrsquo and the environmentrsquos long‐term needs
205240txt012|May 2013
Drainage Strategy Framework
Price Review The process of setting appointed water and sewerage companiesrsquo price limits The next price review will take place in 2014 for the period 2015‐20 Ofwat currently sets price limits every five years
Real Time Control (RTC) Using actuated pumps gates and weirs to actively control flow in sewers Better use can be made of existing infrastructure and links can be made between network treatment and receiving water systems for operational benefits Sometimes referred to as Active Management
River Basin Management (Plans) River Basin Management is a continuous process of planning (to develop River Basin Management Plans) and delivery The Water Framework Directive introduces a formal series of 6 year cycles The first cycle will end in 2015 when following further planning and consultation the River Basin Management Plans will be updated and reissued
Sewerage Management Plan A risk based approach to indentifying investment needs in sewerage systems as described in the Sewerage Risk Management (SRM) approach developed by WRc plc
Storm water retrofit Releasing capacity in sewers by controlling stormwater at the surface using disconnection swales and other sustainable drainage systems (SuDS)
205240txt012|May 2013
We are the Environment Agency We protect and improve the environment and make it a better place for people and wildlife We operate at the place where environmental change has its greatest impact on peoplersquos lives We reduce the risks to people and properties from flooding make sure there is enough water for people and wildlife protect and improve air land and water quality and apply the environmental standards within which industry can operate Acting to reduce climate change and helping people and wildlife adapt to its consequences are at the heart of all that we do We cannot do this alone We work closely with a wide range of partners including government business local authorities other agencies civil society groups and the communities we serve
wwwenvironment‐agencygovuk
Environment Agency National Customer Contact Centre
Telephone 03708 506 506 enquiriesenvironment‐agencygovuk
Ofwat (The Water Services Regulation Authority) is a non‐ministerial government department We are responsible for making sure that the water and sewerage sectors in England and Wales provide consumers with a good quality and efficient service at a fair price
wwwofwatgovuk
Telephone 0121 644 7500 mailboxofwatgsigovuk
Halcrow Group Limited Burderop Park Swindon Wiltshire SN4 0QD
tel 01793 812479 fax 01793 812089 halcrowcom
Halcrow Group Limited is a CH2M HILL company Halcrow Group Limited has prepared this report in accordance with
the instructions of The Environment Agency for the clientrsquos sole and specific use Any other persons who use any information contained herein do so at their own risk
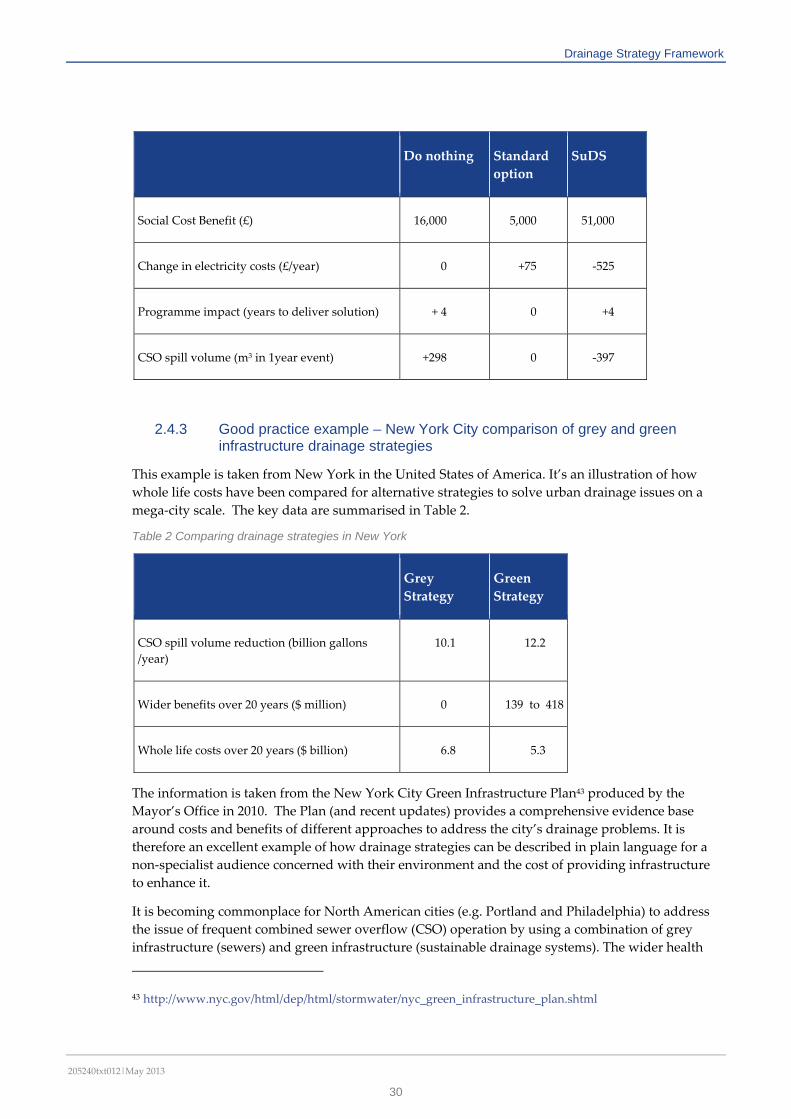
Drainage Strategy Framework
Do nothing Standard option
SuDS
Social Cost Benefit (pound) 16000 5000 51000
Change in electricity costs (poundyear) 0 +75 ‐525
Programme impact (years to deliver solution) + 4 0 +4
CSO spill volume (m3 in 1year event) +298 0 ‐397
243 Good practice example ndash New York City comparison of grey and green infrastructure drainage strategies
This example is taken from New York in the United States of America Itrsquos an illustration of how whole life costs have been compared for alternative strategies to solve urban drainage issues on a mega‐city scale The key data are summarised in Table 2
Table 2 Comparing drainage strategies in New York
Grey Strategy
Green Strategy
CSO spill volume reduction (billion gallons year)
101 122
Wider benefits over 20 years ($ million) 0 139 to 418
Whole life costs over 20 years ($ billion) 68 53
The information is taken from the New York City Green Infrastructure Plan43 produced by the Mayorrsquos Office in 2010 The Plan (and recent updates) provides a comprehensive evidence base around costs and benefits of different approaches to address the cityrsquos drainage problems It is therefore an excellent example of how drainage strategies can be described in plain language for a non‐specialist audience concerned with their environment and the cost of providing infrastructure to enhance it
It is becoming commonplace for North American cities (eg Portland and Philadelphia) to address the issue of frequent combined sewer overflow (CSO) operation by using a combination of grey infrastructure (sewers) and green infrastructure (sustainable drainage systems) The wider health
43 httpwwwnycgovhtmldephtmlstormwaternyc_green_infrastructure_planshtml
205240txt012|May 2013
30
25
Drainage Strategy Framework
and ecological benefits of green infrastructure approaches and the reduced reliance on materials and energy are attractive to utility planners and cities alike
New York has 422 CSOs and an agreed Long Term Control Strategy to significantly reduce the impact wet weather discharges have on aquatic systems throughout the city Annual discharges are currently (2010) estimated to be 30 billion gallons (114 million cubic meters) per year Building on existing and committed new sewer plans an agreed grey infrastructure based strategy to this problem is set to reduce these discharges to 198 billion gallons per year (a 34 reduction) by the 2030s An alternative green infrastructure approach based around intercepting the first inch (25mm) of rainfall across 10 of the impermeable city area by 2030 is predicted to reduce CSO spills to 179 billion gallons per year
Planners have calculated that the whole life costs after 20 years of the grey infrastructure solution will be $68 billion (2010 prices) compared to the green infrastructure whole life costs of $53 billion The green infrastructure strategy reduces CSO spills by more than the grey alternative for $15 billion less in terms of whole life cost Further planners have calculated that New Yorkers will benefit by up to $41844 million (accumulated over 20 years) in additional benefits associated with lower energy bills from control of urban heating increased property values and improved health
Based on this analysis New York City has committed itself to an aggressive green infrastructure based runoff control strategy to provide long term reductions in CSO spills The plan is to achieve interception of 15 of impermeable area by 2015 4 by 2020 7 by 2025 and 10 by 2030
Principle Five Live Process
The Strategy should be adaptable and periodically reviewed Whilst outcomes are expected to be relatively stable over time the pace at which the Strategy delivers outcomes will be linked to volatile influences (like climate and population change) and to the decisions made at each price review about the priorities for the following period The Strategy should be reviewed at regular intervals to reflect investments already made the changing priorities of the water and sewerage company and partners and the presence of emerging risks The review is also an opportunity to report drainage catchment performance relative to performance measures designed to monitor progress towards achieving outcomes
44 Estimated using methods from the New York Municipal Forest Resource Analysis (MFRA) prepared by the US Dept of Agriculture
205240txt012|May 2013
31
Drainage Strategy Framework
251 Recommended good practice
No Good practice Example references
1 Regularly repeat screening exercise to determine catchments requiring a Drainage Strategy and modify programme of Strategy development accordingly
Check for changes in measured rates of flooding and pollution incidents blockages collapses pumping station failures etc
Check for changes in extent and location of new development
Check for activities being undertaken by partners (eg redevelopment urban realm improvements and flooding and pollution management activities)
SRM5 illustrates how improved and updated knowledge of system performance should be applied to establish Strategies
2 In lsquolive Strategiesrsquo repeat risk assessment when data and models improve and adjust confidence scores accordingly
Confirm that Strategy will still achieve performance indicators and outcomes at least cost Revise Strategy as necessary
3 Periodically refresh Strategy accommodating impact of interventions already delivered using re‐verified predictive tools as appropriate
Confirm that Strategy will still achieve performance indicators and outcomes at least cost Revise Strategy as necessary
Triggers for a wholesale review of the Strategy are likely to be significant changes to the location or extent of planned development
4 Monitor report and share (with partners) the measures used to demonstrate delivery of outcomes Example measures may include the number of properties which experience sewer flooding the number of properties at risk of flooding the number of properties at risk from sewerage asset failure risk indices that capture both the probability and consequence of failure customer satisfaction with regards to clean rivers and beaches the number of pollution incidents the frequency of combined sewer overflow operation and compliance with discharge permit conditions
252 Good practice example ndash Thames Water live DAP
Thames Water has initiated a DAP (drainage area plan) Live approach Itrsquos a good example of how companies are continuously monitoring and updating the status of drainage area risks It provides a lsquoliversquo snapshot of the current health of all drainage areas in Thames Waterrsquos region allowing real time planning as part of a strategic approach It enables drainage planners to view the effectiveness
205240txt012|May 2013
32
Drainage Strategy Framework
of intervention strategies and compare incident rates across varying geographies and development types in the Thames Valley
DAP Live will be available for all catchments in the Thames Water area thus enabling
bull high level monitoring of risks across the business bull a live and strategic review of catchment performance bull prioritisation of catchments based on risk and bull an ability to share data with partners collaborating in drainage planning and improvements
Figure 12 illustrates the types of data managed through the DAP Live system These include asset data political and drainage boundaries environmental data operational data property amp growth data and modelling data As new data become available the DAP Live system is updated so that drainage planners have the most current view on emerging risks and issues
Asset data
Operational data
Property and growth data
Modelling data
Environmental data
Boundaries (SDACs operational political)
Figure 12 Data types held in the DAP Live system
Figure 13 illustrates how the system can provide analysis at a variety of scales from local authority boundaries sewage treatment works catchments drainage areas or a regular grid
205240txt012|May 2013
33
Drainage Strategy Framework
NE PROVINCES
WESTERN PROVINCES
NE LONDON bull Ops areas local W LONDON
SE LONDON authorities Large TIDWORTH SE PROVINCES
bull STW Catchments
bull Drainage areas(SDACs)
bull Regular grid Small
Figure 13 DAP Live reporting performance at different scales
205240txt012|May 2013
34
Drainage Strategy Framework
253 Good practice example ndash Wessex Water Water live data
Wessex Water is regularly using data geospatially to proactively identify and respond to risk Theirs is a good example of how data can be used to provide an adaptable approach that is regularly reviewed to plan investment
The risk‐based and live approach uses a set of likelihood and consequence models which are built up from all currently available data asset data (eg CCTV data material age) operational data (eg flooding and pollutions incidents) and information (eg locality near hospital or downstream of an overflow) All these data are collated for the entire Wessex region updated regularly and analysed geospatially
Figure 14 Sewer risk scores presented in a risk matrix and geospatially
This allows a risk score (Figure 14) to be calculated for each mapped sewer length which directs investigation more efficiently by allocating each mapped sewer a planned CCTV inspection date
This risk‐based approach has been successful in targeting problematic sewers increasing identification rates threefold Density analysis is performed using asset failure and operational information which allows planning of both proactive structural and operational investment
Proactively found structural issues are far more cost effective to repair before failure and can also prevent serviceability issues
205240txt012|May 2013
35
f
DDrainage Strateegy Frameworrk
Figgure 15 Hotsppot analysis
Thhe hotspot annalysis (Figuure 15) showss where operrational clustters have beeen calculatedd This hootspot analyssis is made aavailable on tthe Wessex WWater corporrate GIS to a llow operati onal staff to target their effforts to mitiggate against ffurther repeaat incidents AAdditional innformation ffrom asset annd operationnal activities ccan be addedd regularly too the databasses which drrive the mod els enabling rissk scores to bbe kept as livve as require d
226 Prrinciple Sixx Innovativve and Susstainable SSolutions
Thhe Drainage Strategy Fraamework proomotes the fuull evaluationn of alternatiives to tradit ionally enngineered sewwerage soluttions to test wwhether thesse offer loweer whole life ccost options or better reesponses to uuncertainty It is anticipaated that draainage solutioons of the futture will be ddifferent froom the ones we are usedd to
Thhese should iinclude (at leeast at a highh level) real ttime control storm waterr retrofit techhniques edducation to eenable custommers to changge behaviou r enhancingg incentives for customerss to reduce suurface water flowing to seewers and innnovative pe rmitting arraangements a cross drainagge networks annd sewage tr eatment worrks Water annd sewerage companies sshould continnue to revieww and deevelop other innovative ssolutions
Foor example wwhere a commpany may hiistorically haave preferredd to tackle seewer floodingg or coombined sewwer overflow pollution byy increasing iits undergrouund equipmment to store mmore rainfalll duuring stormss it might connsider other options in fuuture ndash such as working wwith custommers to mmanage the raainfall close tt eventing it foorm enteringg the sewer syystem o source pre
2205240txt012|Mayy 2013
36
Drainage Strategy Framework
261 Recommended good practice
No Good practice Example references
1 Use cost‐benefit methods to demonstrate that innovative and sustainable solution types provide best value for customers and the wider community
UKWIR will publish new research and guidance in 2013 addressing active control and storm water removal demonstrating how these technologies can be justified and included within Drainage Strategies
2 Consider integrated water resource management Work with partners (especially developers and local authorities) to examine whether use of stored stormwater reduces potable water consumption AND need for capacity in sewers
CIRIA has published a scoping study for water sensitive urban design45 in the UK
3 Consider a mix of conventional and new technologies using more adaptive approaches as low‐regrets responses to uncertainty eg prevent current sewer flooding with underground tank storage but address future risks (worsened by climate change) with retrofit SuDS implemented progressively
CIRIA has published lsquoRetrofitting to manage surface waterrsquo46 a comprehensive guide to planning and delivering this type of project
4 Use carbon accounting methods to compare embodied and emitted carbon in alternative intervention strategies so that these impacts are accounted for in whole life costs
Consider the benefits of surface water removal on the costs (including carbon) of pumping and sewage treatment
UKWIR47 has and continues to publish detailed guidance on carbon accounting for water and sewerage company use
45httpwwwciriaorgserviceresearch_informationAMContentManagerNet ContentDisplayaspxSection=research_informationampContentID=23581 46httpwwwciriaorgSERVICEHomecoreordersproductaspxcatid=5ampprodid=1909 47httpukwirforefront‐librarycomreports08‐cl‐01‐6923419000190269902659465890269
205240txt012|May 2013
37
Drainage Strategy Framework
No Good practice Example references
5 Where interventions include the provision of green space public amenity and improved habitats then Payment for Ecosystem Services approaches can be used to claim further monetised benefits in the appraisal Customers should be consulted to help value these benefits
The Environment Agency will publish data in 2013 on costs and benefits of retrofit stormwater projects to promote understanding and uptake
6 Share data within the industry on innovative solutions to increase knowledge of new technology and SuDs approaches
EA retrofitting SuDs costs and benefits database48
accommodating data from Ofwat AMP5 SuDS pilot initiative and other examples
262 Good practice example ndash Welsh Water surface water reduction and removal strategy for Gowerton and Llanelli
Dŵr Cymru Welsh Water and partners are applying innovative storm water removal methods to address capacity problems in the sewer network in Gowerton and Llanelli49 (population 140000) Current under capacity leads to localised sewer flooding and excessive combined sewer overflow (CSO) spill to the Burry Inlet a protected shellfish water and special area of conservation The capacity problems in the system were a concern for the Environment Agency (Wales) and there was a risk of widespread restrictions to economic development being imposed Dŵr Cymru Welsh Water Carmarthenshire County Council City and County of Swansea Consumer Council for Water Environment Agency Wales and the Welsh Government all worked in partnership to resolve the situation
A brand new hydraulic model was built for the entire sewerage network with particular attention paid to accurately representing the sources of storm run‐off and infiltration The model was verified against data from flow monitors and observed CSO spill frequencies into the Burry Inlet
To begin with a traditional sewer storage solution was proposed that would result in an average 10 spills a year into the shellfish water from all 90 CSOs in the two catchments Although this reduced spills and dealt with some of the flooding and growth issues the storage requirements would have been unaffordable provide no protection against long term climate change and would not tackle the fundamental problem of too much surface water getting into the combined network
An alternative approach based on the reduction and removal of storm water from the combined sewer system was also developed This was in accordance with Dŵr Cymru Welsh Waterrsquos Rainscape50 (surface water elimination and reduction) strategy To identify areas with the most
48httpevidenceenvironment‐agencygovukfcermenDefaultHomeAndLeisureFloodsWhatWereDoingIntoTheFutureScience ProgrammeResearchAndDevelopmentFCRMProjectaspxProjectID=15515be8‐bbed‐4204‐ae56‐3e810ba47694ampPageID=56bad68e‐dcb1‐4bf8‐84cc‐cbfd03ab63a2 49 httpwwwciwemorgmedia674511Paper20820Stephen20Ollierpdf 50httpwwwdwrcymrucom_libraryleaflets_publications_english
205240txt012|May 2013
38
Drainage Strategy Framework
potential for effective storm water removal a flowareaflooding thematic map was developed This was used to focus attention on areas which would deliver the most benefit if storm water removal was carried out These areas are coloured red in Figure 16
Figure 16 Thematic map showing areas of maximum potential for storm water removal
The following interventions (181 in total) were combined into single strategy to be delivered in phases by 2015 2020 and afterwards
bull The management of surface water through swales basins and soakaways rather than through combined sewers resulting in new amenity and ecological areas within the built‐up environment
bull Implementing smarter flow control to better use existing storage and conveyance assets bull Relining of sewers to prevent groundwater ingress bull Removal of land drainage connections to sewers bull Household rainwater harvesting retrofit schemes
surface_water_management_strategypdf
205240txt012|May 2013
39
Drainage Strategy Framework
Figure 17 is an artistrsquos impression of what one of the sustainable urban drainage system solutions may look like
Figure 17 Example retrofit SuDS solution proposed for Gowerton and Llanelli
Modelling has demonstrated that the alternative strategy will achieve the same CSO reduction benefit as the storage strategy together with flooding improvements and additional less tangible benefits at significantly lower cost than the traditional sewer storage solution
Figure 18 illustrates the dispersed nature of solutions identified for central Llanelli
Figure 18 Water sensitive urban design interventions planned for central Llanelli
205240txt012|May 2013
40
Drainage Strategy Framework
Appendix A
Glossary
205240txt012|May 2013
Drainage Strategy Framework
Appendix A Glossary
CAPEX Capital expenditure Appointed water and sewerage companiesrsquo spending on new replacement or refurbished capital assets such as construction or buying machinery
CIWEM Urban Drainage Group (WaPUG) A group of the Chartered Institution of Water and Environmental Management supporting professionals working in urban drainage
Combined Sewer Overflow (CSO) The discharge of untreated sewage diluted with storm water into rivers and the sea CSOs occur during heavy rain and are necessary to reduce the risk of sewer flooding The physical overflow structure is also called a CSO
Common Framework for Capital A planning approach developed for the water and Maintenance Planning sewerage companies in 2002 which provides a robust basis
for assessing future capital maintenance needs The approach is consistent with the needs of Ofwat
Defra The Department for Environment Food and Rural Affairs The Government Department with responsibility for water flooding and water quality in England
Drainage Area Plan (DAP) A detailed plan for a drainage catchment that prioritises a list of interventions based on risk using an approach established in the WRc Sewerage Rehabilitation Manual This approach has been succeeded by Sewerage Risk Management which guides the preparation of Sewerage Management Plans (SMP) Companies vary in how they prepare DAPs or SMPs (or their equivalents) following the general principles that have been established
Drainage Strategy Developed by water and sewerage companies to demonstrate how outcomes will be delivered in drainage catchments over the long term Drainage Strategies will use the information developed in producing a DAPSMP and if a drainage strategy has been produced this should be the starting point in producing a more detailed DAPSMP should this be required It is likely that the activities required to prepare DAPSMP and Drainage Strategies may overlap Drainage Strategies might not refer to specific interventions but instead outline a general approach
Drainage Strategy Framework Guidance to describe the contents and intention of Drainage Strategies
205240txt012|May 2013
Drainage Strategy Framework
Flood Risk Management Plans Required by the Flood Risk Regulations in Flood Risk Areas by December 2015
Flood Risk Regulations The legislative instrument used to implement the requirements of the Floods Directive in England and Wales
Floods Directive DIRECTIVE 200760EC of the European Parliament and of the Council of 23 October 2007 on the assessment and management of flood risks
Lead Local Flood Authority (LLFA) The Shire County or unitary authority with responsibility for managing local flood risk
Local development plans Developed by planning authorities to explain where and what type of development (new homes and businesses) will occur within their area They are required to explain water infrastructure needs to support this development
Local Flood Risk Management Strategy Developed by the Lead Local Flood Authority to explain (LFRMS) how local flood risk will be managed by the Authority and
in partnership with others
Natural Resources Wales From 1 April 2013 Natural Resources Wales (NRW) a new body formed by the Welsh Government will take over the functions previously carried out by the Environment Agency (EA) in Wales alongside those of the Forestry Commission Wales and the Countryside Council for Wales
Ofwat The Water Services Regulation Authority ndash the economic regulator of the water and sewerage companies of England and Wales
OPEX Operating expenditure Appointed water and sewerage companiesrsquo day‐to‐day spending on running the services for example staff costs and power This is likely to include investment in joint projects that do not create or relate to an asset that the company solely or jointly owns
Outcomes Outcomes are the higher level objectives that a companyrsquos actions are intended to deliver A companyrsquos outcome should reflect its customersrsquo priorities identified through appropriate customer engagement and deliver the best long‐term sustainable solution for customers and the environment An outcome may not be bound by a single price control period and should be set in the context of customersrsquo and the environmentrsquos long‐term needs
205240txt012|May 2013
Drainage Strategy Framework
Price Review The process of setting appointed water and sewerage companiesrsquo price limits The next price review will take place in 2014 for the period 2015‐20 Ofwat currently sets price limits every five years
Real Time Control (RTC) Using actuated pumps gates and weirs to actively control flow in sewers Better use can be made of existing infrastructure and links can be made between network treatment and receiving water systems for operational benefits Sometimes referred to as Active Management
River Basin Management (Plans) River Basin Management is a continuous process of planning (to develop River Basin Management Plans) and delivery The Water Framework Directive introduces a formal series of 6 year cycles The first cycle will end in 2015 when following further planning and consultation the River Basin Management Plans will be updated and reissued
Sewerage Management Plan A risk based approach to indentifying investment needs in sewerage systems as described in the Sewerage Risk Management (SRM) approach developed by WRc plc
Storm water retrofit Releasing capacity in sewers by controlling stormwater at the surface using disconnection swales and other sustainable drainage systems (SuDS)
205240txt012|May 2013
We are the Environment Agency We protect and improve the environment and make it a better place for people and wildlife We operate at the place where environmental change has its greatest impact on peoplersquos lives We reduce the risks to people and properties from flooding make sure there is enough water for people and wildlife protect and improve air land and water quality and apply the environmental standards within which industry can operate Acting to reduce climate change and helping people and wildlife adapt to its consequences are at the heart of all that we do We cannot do this alone We work closely with a wide range of partners including government business local authorities other agencies civil society groups and the communities we serve
wwwenvironment‐agencygovuk
Environment Agency National Customer Contact Centre
Telephone 03708 506 506 enquiriesenvironment‐agencygovuk
Ofwat (The Water Services Regulation Authority) is a non‐ministerial government department We are responsible for making sure that the water and sewerage sectors in England and Wales provide consumers with a good quality and efficient service at a fair price
wwwofwatgovuk
Telephone 0121 644 7500 mailboxofwatgsigovuk
Halcrow Group Limited Burderop Park Swindon Wiltshire SN4 0QD
tel 01793 812479 fax 01793 812089 halcrowcom
Halcrow Group Limited is a CH2M HILL company Halcrow Group Limited has prepared this report in accordance with
the instructions of The Environment Agency for the clientrsquos sole and specific use Any other persons who use any information contained herein do so at their own risk

Drainage Strategy Framework
253 Good practice example ndash Wessex Water Water live data
Wessex Water is regularly using data geospatially to proactively identify and respond to risk Theirs is a good example of how data can be used to provide an adaptable approach that is regularly reviewed to plan investment
The risk‐based and live approach uses a set of likelihood and consequence models which are built up from all currently available data asset data (eg CCTV data material age) operational data (eg flooding and pollutions incidents) and information (eg locality near hospital or downstream of an overflow) All these data are collated for the entire Wessex region updated regularly and analysed geospatially
Figure 14 Sewer risk scores presented in a risk matrix and geospatially
This allows a risk score (Figure 14) to be calculated for each mapped sewer length which directs investigation more efficiently by allocating each mapped sewer a planned CCTV inspection date
This risk‐based approach has been successful in targeting problematic sewers increasing identification rates threefold Density analysis is performed using asset failure and operational information which allows planning of both proactive structural and operational investment
Proactively found structural issues are far more cost effective to repair before failure and can also prevent serviceability issues
205240txt012|May 2013
35
f
DDrainage Strateegy Frameworrk
Figgure 15 Hotsppot analysis
Thhe hotspot annalysis (Figuure 15) showss where operrational clustters have beeen calculatedd This hootspot analyssis is made aavailable on tthe Wessex WWater corporrate GIS to a llow operati onal staff to target their effforts to mitiggate against ffurther repeaat incidents AAdditional innformation ffrom asset annd operationnal activities ccan be addedd regularly too the databasses which drrive the mod els enabling rissk scores to bbe kept as livve as require d
226 Prrinciple Sixx Innovativve and Susstainable SSolutions
Thhe Drainage Strategy Fraamework proomotes the fuull evaluationn of alternatiives to tradit ionally enngineered sewwerage soluttions to test wwhether thesse offer loweer whole life ccost options or better reesponses to uuncertainty It is anticipaated that draainage solutioons of the futture will be ddifferent froom the ones we are usedd to
Thhese should iinclude (at leeast at a highh level) real ttime control storm waterr retrofit techhniques edducation to eenable custommers to changge behaviou r enhancingg incentives for customerss to reduce suurface water flowing to seewers and innnovative pe rmitting arraangements a cross drainagge networks annd sewage tr eatment worrks Water annd sewerage companies sshould continnue to revieww and deevelop other innovative ssolutions
Foor example wwhere a commpany may hiistorically haave preferredd to tackle seewer floodingg or coombined sewwer overflow pollution byy increasing iits undergrouund equipmment to store mmore rainfalll duuring stormss it might connsider other options in fuuture ndash such as working wwith custommers to mmanage the raainfall close tt eventing it foorm enteringg the sewer syystem o source pre
2205240txt012|Mayy 2013
36
Drainage Strategy Framework
261 Recommended good practice
No Good practice Example references
1 Use cost‐benefit methods to demonstrate that innovative and sustainable solution types provide best value for customers and the wider community
UKWIR will publish new research and guidance in 2013 addressing active control and storm water removal demonstrating how these technologies can be justified and included within Drainage Strategies
2 Consider integrated water resource management Work with partners (especially developers and local authorities) to examine whether use of stored stormwater reduces potable water consumption AND need for capacity in sewers
CIRIA has published a scoping study for water sensitive urban design45 in the UK
3 Consider a mix of conventional and new technologies using more adaptive approaches as low‐regrets responses to uncertainty eg prevent current sewer flooding with underground tank storage but address future risks (worsened by climate change) with retrofit SuDS implemented progressively
CIRIA has published lsquoRetrofitting to manage surface waterrsquo46 a comprehensive guide to planning and delivering this type of project
4 Use carbon accounting methods to compare embodied and emitted carbon in alternative intervention strategies so that these impacts are accounted for in whole life costs
Consider the benefits of surface water removal on the costs (including carbon) of pumping and sewage treatment
UKWIR47 has and continues to publish detailed guidance on carbon accounting for water and sewerage company use
45httpwwwciriaorgserviceresearch_informationAMContentManagerNet ContentDisplayaspxSection=research_informationampContentID=23581 46httpwwwciriaorgSERVICEHomecoreordersproductaspxcatid=5ampprodid=1909 47httpukwirforefront‐librarycomreports08‐cl‐01‐6923419000190269902659465890269
205240txt012|May 2013
37
Drainage Strategy Framework
No Good practice Example references
5 Where interventions include the provision of green space public amenity and improved habitats then Payment for Ecosystem Services approaches can be used to claim further monetised benefits in the appraisal Customers should be consulted to help value these benefits
The Environment Agency will publish data in 2013 on costs and benefits of retrofit stormwater projects to promote understanding and uptake
6 Share data within the industry on innovative solutions to increase knowledge of new technology and SuDs approaches
EA retrofitting SuDs costs and benefits database48
accommodating data from Ofwat AMP5 SuDS pilot initiative and other examples
262 Good practice example ndash Welsh Water surface water reduction and removal strategy for Gowerton and Llanelli
Dŵr Cymru Welsh Water and partners are applying innovative storm water removal methods to address capacity problems in the sewer network in Gowerton and Llanelli49 (population 140000) Current under capacity leads to localised sewer flooding and excessive combined sewer overflow (CSO) spill to the Burry Inlet a protected shellfish water and special area of conservation The capacity problems in the system were a concern for the Environment Agency (Wales) and there was a risk of widespread restrictions to economic development being imposed Dŵr Cymru Welsh Water Carmarthenshire County Council City and County of Swansea Consumer Council for Water Environment Agency Wales and the Welsh Government all worked in partnership to resolve the situation
A brand new hydraulic model was built for the entire sewerage network with particular attention paid to accurately representing the sources of storm run‐off and infiltration The model was verified against data from flow monitors and observed CSO spill frequencies into the Burry Inlet
To begin with a traditional sewer storage solution was proposed that would result in an average 10 spills a year into the shellfish water from all 90 CSOs in the two catchments Although this reduced spills and dealt with some of the flooding and growth issues the storage requirements would have been unaffordable provide no protection against long term climate change and would not tackle the fundamental problem of too much surface water getting into the combined network
An alternative approach based on the reduction and removal of storm water from the combined sewer system was also developed This was in accordance with Dŵr Cymru Welsh Waterrsquos Rainscape50 (surface water elimination and reduction) strategy To identify areas with the most
48httpevidenceenvironment‐agencygovukfcermenDefaultHomeAndLeisureFloodsWhatWereDoingIntoTheFutureScience ProgrammeResearchAndDevelopmentFCRMProjectaspxProjectID=15515be8‐bbed‐4204‐ae56‐3e810ba47694ampPageID=56bad68e‐dcb1‐4bf8‐84cc‐cbfd03ab63a2 49 httpwwwciwemorgmedia674511Paper20820Stephen20Ollierpdf 50httpwwwdwrcymrucom_libraryleaflets_publications_english
205240txt012|May 2013
38
Drainage Strategy Framework
potential for effective storm water removal a flowareaflooding thematic map was developed This was used to focus attention on areas which would deliver the most benefit if storm water removal was carried out These areas are coloured red in Figure 16
Figure 16 Thematic map showing areas of maximum potential for storm water removal
The following interventions (181 in total) were combined into single strategy to be delivered in phases by 2015 2020 and afterwards
bull The management of surface water through swales basins and soakaways rather than through combined sewers resulting in new amenity and ecological areas within the built‐up environment
bull Implementing smarter flow control to better use existing storage and conveyance assets bull Relining of sewers to prevent groundwater ingress bull Removal of land drainage connections to sewers bull Household rainwater harvesting retrofit schemes
surface_water_management_strategypdf
205240txt012|May 2013
39
Drainage Strategy Framework
Figure 17 is an artistrsquos impression of what one of the sustainable urban drainage system solutions may look like
Figure 17 Example retrofit SuDS solution proposed for Gowerton and Llanelli
Modelling has demonstrated that the alternative strategy will achieve the same CSO reduction benefit as the storage strategy together with flooding improvements and additional less tangible benefits at significantly lower cost than the traditional sewer storage solution
Figure 18 illustrates the dispersed nature of solutions identified for central Llanelli
Figure 18 Water sensitive urban design interventions planned for central Llanelli
205240txt012|May 2013
40
Drainage Strategy Framework
Appendix A
Glossary
205240txt012|May 2013
Drainage Strategy Framework
Appendix A Glossary
CAPEX Capital expenditure Appointed water and sewerage companiesrsquo spending on new replacement or refurbished capital assets such as construction or buying machinery
CIWEM Urban Drainage Group (WaPUG) A group of the Chartered Institution of Water and Environmental Management supporting professionals working in urban drainage
Combined Sewer Overflow (CSO) The discharge of untreated sewage diluted with storm water into rivers and the sea CSOs occur during heavy rain and are necessary to reduce the risk of sewer flooding The physical overflow structure is also called a CSO
Common Framework for Capital A planning approach developed for the water and Maintenance Planning sewerage companies in 2002 which provides a robust basis
for assessing future capital maintenance needs The approach is consistent with the needs of Ofwat
Defra The Department for Environment Food and Rural Affairs The Government Department with responsibility for water flooding and water quality in England
Drainage Area Plan (DAP) A detailed plan for a drainage catchment that prioritises a list of interventions based on risk using an approach established in the WRc Sewerage Rehabilitation Manual This approach has been succeeded by Sewerage Risk Management which guides the preparation of Sewerage Management Plans (SMP) Companies vary in how they prepare DAPs or SMPs (or their equivalents) following the general principles that have been established
Drainage Strategy Developed by water and sewerage companies to demonstrate how outcomes will be delivered in drainage catchments over the long term Drainage Strategies will use the information developed in producing a DAPSMP and if a drainage strategy has been produced this should be the starting point in producing a more detailed DAPSMP should this be required It is likely that the activities required to prepare DAPSMP and Drainage Strategies may overlap Drainage Strategies might not refer to specific interventions but instead outline a general approach
Drainage Strategy Framework Guidance to describe the contents and intention of Drainage Strategies
205240txt012|May 2013
Drainage Strategy Framework
Flood Risk Management Plans Required by the Flood Risk Regulations in Flood Risk Areas by December 2015
Flood Risk Regulations The legislative instrument used to implement the requirements of the Floods Directive in England and Wales
Floods Directive DIRECTIVE 200760EC of the European Parliament and of the Council of 23 October 2007 on the assessment and management of flood risks
Lead Local Flood Authority (LLFA) The Shire County or unitary authority with responsibility for managing local flood risk
Local development plans Developed by planning authorities to explain where and what type of development (new homes and businesses) will occur within their area They are required to explain water infrastructure needs to support this development
Local Flood Risk Management Strategy Developed by the Lead Local Flood Authority to explain (LFRMS) how local flood risk will be managed by the Authority and
in partnership with others
Natural Resources Wales From 1 April 2013 Natural Resources Wales (NRW) a new body formed by the Welsh Government will take over the functions previously carried out by the Environment Agency (EA) in Wales alongside those of the Forestry Commission Wales and the Countryside Council for Wales
Ofwat The Water Services Regulation Authority ndash the economic regulator of the water and sewerage companies of England and Wales
OPEX Operating expenditure Appointed water and sewerage companiesrsquo day‐to‐day spending on running the services for example staff costs and power This is likely to include investment in joint projects that do not create or relate to an asset that the company solely or jointly owns
Outcomes Outcomes are the higher level objectives that a companyrsquos actions are intended to deliver A companyrsquos outcome should reflect its customersrsquo priorities identified through appropriate customer engagement and deliver the best long‐term sustainable solution for customers and the environment An outcome may not be bound by a single price control period and should be set in the context of customersrsquo and the environmentrsquos long‐term needs
205240txt012|May 2013
Drainage Strategy Framework
Price Review The process of setting appointed water and sewerage companiesrsquo price limits The next price review will take place in 2014 for the period 2015‐20 Ofwat currently sets price limits every five years
Real Time Control (RTC) Using actuated pumps gates and weirs to actively control flow in sewers Better use can be made of existing infrastructure and links can be made between network treatment and receiving water systems for operational benefits Sometimes referred to as Active Management
River Basin Management (Plans) River Basin Management is a continuous process of planning (to develop River Basin Management Plans) and delivery The Water Framework Directive introduces a formal series of 6 year cycles The first cycle will end in 2015 when following further planning and consultation the River Basin Management Plans will be updated and reissued
Sewerage Management Plan A risk based approach to indentifying investment needs in sewerage systems as described in the Sewerage Risk Management (SRM) approach developed by WRc plc
Storm water retrofit Releasing capacity in sewers by controlling stormwater at the surface using disconnection swales and other sustainable drainage systems (SuDS)
205240txt012|May 2013
We are the Environment Agency We protect and improve the environment and make it a better place for people and wildlife We operate at the place where environmental change has its greatest impact on peoplersquos lives We reduce the risks to people and properties from flooding make sure there is enough water for people and wildlife protect and improve air land and water quality and apply the environmental standards within which industry can operate Acting to reduce climate change and helping people and wildlife adapt to its consequences are at the heart of all that we do We cannot do this alone We work closely with a wide range of partners including government business local authorities other agencies civil society groups and the communities we serve
wwwenvironment‐agencygovuk
Environment Agency National Customer Contact Centre
Telephone 03708 506 506 enquiriesenvironment‐agencygovuk
Ofwat (The Water Services Regulation Authority) is a non‐ministerial government department We are responsible for making sure that the water and sewerage sectors in England and Wales provide consumers with a good quality and efficient service at a fair price
wwwofwatgovuk
Telephone 0121 644 7500 mailboxofwatgsigovuk
Halcrow Group Limited Burderop Park Swindon Wiltshire SN4 0QD
tel 01793 812479 fax 01793 812089 halcrowcom
Halcrow Group Limited is a CH2M HILL company Halcrow Group Limited has prepared this report in accordance with
the instructions of The Environment Agency for the clientrsquos sole and specific use Any other persons who use any information contained herein do so at their own risk
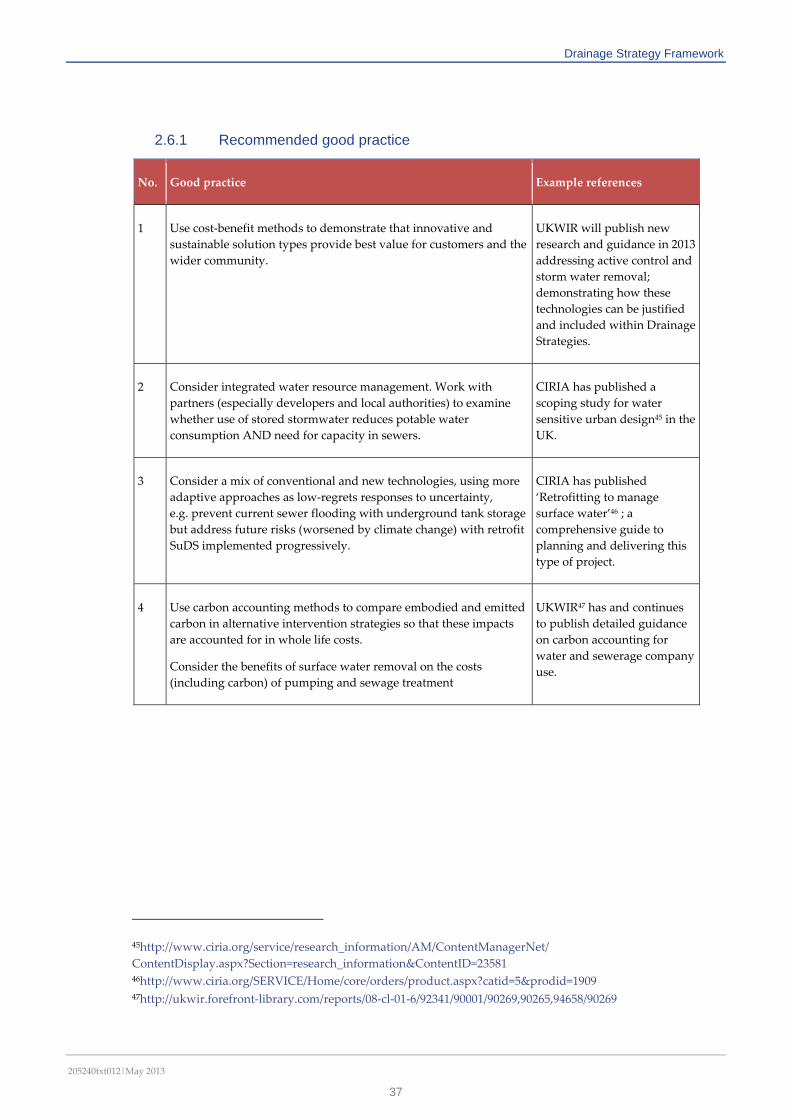
Drainage Strategy Framework
Price Review The process of setting appointed water and sewerage companiesrsquo price limits The next price review will take place in 2014 for the period 2015‐20 Ofwat currently sets price limits every five years
Real Time Control (RTC) Using actuated pumps gates and weirs to actively control flow in sewers Better use can be made of existing infrastructure and links can be made between network treatment and receiving water systems for operational benefits Sometimes referred to as Active Management
River Basin Management (Plans) River Basin Management is a continuous process of planning (to develop River Basin Management Plans) and delivery The Water Framework Directive introduces a formal series of 6 year cycles The first cycle will end in 2015 when following further planning and consultation the River Basin Management Plans will be updated and reissued
Sewerage Management Plan A risk based approach to indentifying investment needs in sewerage systems as described in the Sewerage Risk Management (SRM) approach developed by WRc plc
Storm water retrofit Releasing capacity in sewers by controlling stormwater at the surface using disconnection swales and other sustainable drainage systems (SuDS)
205240txt012|May 2013
We are the Environment Agency We protect and improve the environment and make it a better place for people and wildlife We operate at the place where environmental change has its greatest impact on peoplersquos lives We reduce the risks to people and properties from flooding make sure there is enough water for people and wildlife protect and improve air land and water quality and apply the environmental standards within which industry can operate Acting to reduce climate change and helping people and wildlife adapt to its consequences are at the heart of all that we do We cannot do this alone We work closely with a wide range of partners including government business local authorities other agencies civil society groups and the communities we serve
wwwenvironment‐agencygovuk
Environment Agency National Customer Contact Centre
Telephone 03708 506 506 enquiriesenvironment‐agencygovuk
Ofwat (The Water Services Regulation Authority) is a non‐ministerial government department We are responsible for making sure that the water and sewerage sectors in England and Wales provide consumers with a good quality and efficient service at a fair price
wwwofwatgovuk
Telephone 0121 644 7500 mailboxofwatgsigovuk
Halcrow Group Limited Burderop Park Swindon Wiltshire SN4 0QD
tel 01793 812479 fax 01793 812089 halcrowcom
Halcrow Group Limited is a CH2M HILL company Halcrow Group Limited has prepared this report in accordance with
the instructions of The Environment Agency for the clientrsquos sole and specific use Any other persons who use any information contained herein do so at their own risk