drainage and land use impacts on changes in selected peat .... z. anshari et al.: drainage and land...
TRANSCRIPT

Biogeosciences, 7, 3403–3419, 2010www.biogeosciences.net/7/3403/2010/doi:10.5194/bg-7-3403-2010© Author(s) 2010. CC Attribution 3.0 License.
Biogeosciences
Drainage and land use impacts on changes in selected peatproperties and peat degradation in West Kalimantan Province,Indonesia
G. Z. Anshari1,2, M. Afifudin 3, M. Nuriman 1, E. Gusmayanti1,2, L. Arianie 1,4, R. Susana1,2, R. W. Nusantara1,2,J. Sugardjito5, and A. Rafiastanto6
1Centre for Wetlands People and Biodiversity, Universitas Tanjungpura (UNTAN), Pontianak,West Kalimantan Province, Indonesia2Agroteknologi Department, Universitas Tanjungpura (UNTAN), Pontianak,West Kalimantan Province, Indonesia3Department of Forestry, Pontianak, West Kalimatan Province, Indonesia4Chemistry Department, Universitas Tanjungpura (UNTAN), Pontianak,West Kalimantan Province, Indonesia5The Research Centre for Biology, The Indonesian Institute of Sciences (LIPI), Jakarta, Indonesia6Fauna Flora International – Indonesia Programme (FFI-IP), Jakarta, Indonesia
Received: 17 March 2010 – Published in Biogeosciences Discuss.: 12 May 2010Revised: 14 October 2010 – Accepted: 27 October 2010 – Published: 4 November 2010
Abstract. Degradation of tropical peats is a global concerndue to large Carbon emission and loss of biodiversity. Thedegradation of tropical peats usually starts when the govern-ment drains and clears peat forests into open peats used forfood crops, oil palm and industrial timber plantations. Ma-jor properties of tropical peat forests are high in Water Con-tents (WC), Loss on Ignition (LOI) and Total Organic Carbon(TOC), and low in peat pH, Dry Bulk Density (DBD), andTotal Nitrogen (TN). In this study, we investigated impactsof drainage and land use change on these properties. We col-lected peat samples from peat forests, logged over peat for-est, industrial timber plantation, community agriculture, andoil palms. We used independent t-tests and oneway ANOVAto analyze mean differences of the research variables. Wefound that peat pH, DBD, and TN tend to increase. A signif-icant decrease of C/N ratio in oil palm and agriculture sitesimportantly denotes a high rate of peat decompositions. Wa-ter contents, LOI, and TOC are relatively constants. We sug-gest that changes in pH, DBD, TN and atomic C/N ratio areimportant indicators for assessing tropical peat degradation.We infer that land use change from tropical peat forests into
Correspondence to:G. Z. Anshari([email protected])
cleared and drained peats used for intensive timber harvest-ing, oil palms and industrial timber plantations in Indonesiahas greatly degraded major ecological function of tropicalpeats as Carbon storage.
1 Introduction
Land use change and tropical peat degradation are commonlydiscussed from a perspective of Carbon emission (Page et al.,2004; Hooijer et al., 2010; Miettinen and Liew, 2010). Moststudies in tropical peats were based on remotely sensed data(Jaenicke et al., 2008), and general models of Carbon emis-sions associated with land use change and peat degradation(Page et al., 2004). A study focusing on direct measure-ments of peat properties associated with drainage and landuse changes is not common. Therefore, we conducted thisstudy by investigating peat properties in peat forests, indus-trial timber, oil palm plantations, and community agriculture.We aim to discuss impacts of drainage and land uses on se-lected peat properties and peat degradation in West Kaliman-tan Province, Indonesia. We also suggest important indica-tors of peat properties that could be used to indicate tropi-cal peat degradation due to drainage and land use change.We also believe that global climate change leading to more
Published by Copernicus Publications on behalf of the European Geosciences Union.
3404 G. Z. Anshari et al.: Drainage and land use impacts on changes in selected peat properties and peat degradation
Figure 1. The average monthly rain from selected climate stations in the West Kalimantan Province (Source: BMKG Supadio, 2010)
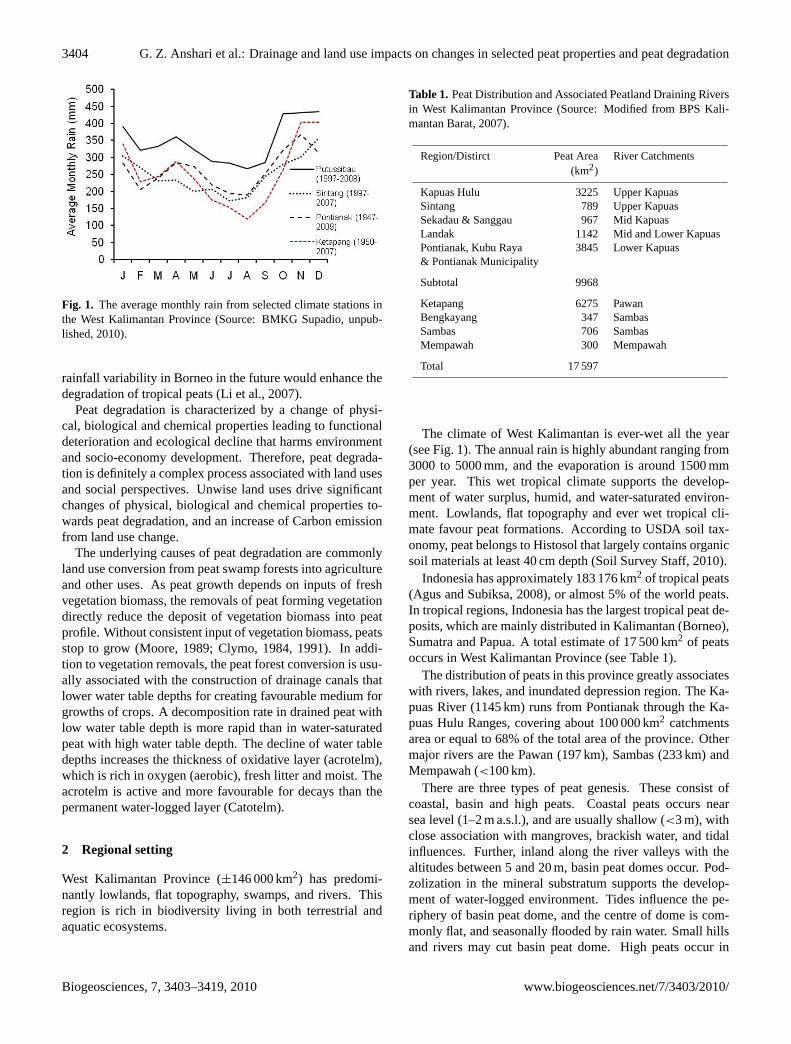
Fig. 1. The average monthly rain from selected climate stations inthe West Kalimantan Province (Source: BMKG Supadio, unpub-lished, 2010).
rainfall variability in Borneo in the future would enhance thedegradation of tropical peats (Li et al., 2007).
Peat degradation is characterized by a change of physi-cal, biological and chemical properties leading to functionaldeterioration and ecological decline that harms environmentand socio-economy development. Therefore, peat degrada-tion is definitely a complex process associated with land usesand social perspectives. Unwise land uses drive significantchanges of physical, biological and chemical properties to-wards peat degradation, and an increase of Carbon emissionfrom land use change.
The underlying causes of peat degradation are commonlyland use conversion from peat swamp forests into agricultureand other uses. As peat growth depends on inputs of freshvegetation biomass, the removals of peat forming vegetationdirectly reduce the deposit of vegetation biomass into peatprofile. Without consistent input of vegetation biomass, peatsstop to grow (Moore, 1989; Clymo, 1984, 1991). In addi-tion to vegetation removals, the peat forest conversion is usu-ally associated with the construction of drainage canals thatlower water table depths for creating favourable medium forgrowths of crops. A decomposition rate in drained peat withlow water table depth is more rapid than in water-saturatedpeat with high water table depth. The decline of water tabledepths increases the thickness of oxidative layer (acrotelm),which is rich in oxygen (aerobic), fresh litter and moist. Theacrotelm is active and more favourable for decays than thepermanent water-logged layer (Catotelm).
2 Regional setting
West Kalimantan Province (±146 000 km2) has predomi-nantly lowlands, flat topography, swamps, and rivers. Thisregion is rich in biodiversity living in both terrestrial andaquatic ecosystems.
Table 1. Peat Distribution and Associated Peatland Draining Riversin West Kalimantan Province (Source: Modified from BPS Kali-mantan Barat, 2007).
Region/Distirct Peat Area River Catchments(km2)
Kapuas Hulu 3225 Upper KapuasSintang 789 Upper KapuasSekadau & Sanggau 967 Mid KapuasLandak 1142 Mid and Lower KapuasPontianak, Kubu Raya 3845 Lower Kapuas& Pontianak Municipality
Subtotal 9968
Ketapang 6275 PawanBengkayang 347 SambasSambas 706 SambasMempawah 300 Mempawah
Total 17 597
The climate of West Kalimantan is ever-wet all the year(see Fig. 1). The annual rain is highly abundant ranging from3000 to 5000 mm, and the evaporation is around 1500 mmper year. This wet tropical climate supports the develop-ment of water surplus, humid, and water-saturated environ-ment. Lowlands, flat topography and ever wet tropical cli-mate favour peat formations. According to USDA soil tax-onomy, peat belongs to Histosol that largely contains organicsoil materials at least 40 cm depth (Soil Survey Staff, 2010).
Indonesia has approximately 183 176 km2 of tropical peats(Agus and Subiksa, 2008), or almost 5% of the world peats.In tropical regions, Indonesia has the largest tropical peat de-posits, which are mainly distributed in Kalimantan (Borneo),Sumatra and Papua. A total estimate of 17 500 km2 of peatsoccurs in West Kalimantan Province (see Table 1).
The distribution of peats in this province greatly associateswith rivers, lakes, and inundated depression region. The Ka-puas River (1145 km) runs from Pontianak through the Ka-puas Hulu Ranges, covering about 100 000 km2 catchmentsarea or equal to 68% of the total area of the province. Othermajor rivers are the Pawan (197 km), Sambas (233 km) andMempawah (<100 km).
There are three types of peat genesis. These consist ofcoastal, basin and high peats. Coastal peats occurs nearsea level (1–2 m a.s.l.), and are usually shallow (<3 m), withclose association with mangroves, brackish water, and tidalinfluences. Further, inland along the river valleys with thealtitudes between 5 and 20 m, basin peat domes occur. Pod-zolization in the mineral substratum supports the develop-ment of water-logged environment. Tides influence the pe-riphery of basin peat dome, and the centre of dome is com-monly flat, and seasonally flooded by rain water. Small hillsand rivers may cut basin peat dome. High peats occur in
Biogeosciences, 7, 3403–3419, 2010 www.biogeosciences.net/7/3403/2010/

G. Z. Anshari et al.: Drainage and land use impacts on changes in selected peat properties and peat degradation 3405
Table 2. 14C and Calibrated Calendar Ages of coastal peats from the lower Kapuas River basin.
No Lab Code Depth (cm) σ13C (‰) % Modern Peat Age± SD Calibrated Date (Cal Yr BP)1
(14C Yr BP) Mean± SD Median
1 Wk26756 40 −29.9±0.2 92.4±0.4 631±33 607±34 5992 Wk26758 440 −29.7±0.2 62.4±0.3 3175±39 3402±38 34013 Wk 26757 700 −28.2±0.2 62.4±0.3 3784±40 4164±73 41634 450∗ 3590±60 3896±90 38965 580∗ 3410±40 3665±63 36616 700∗ 3600±60 3911±90 39107 700∗ 3410±60 3668±86 3664
∗ The last four age is adopted from Diemont and Supardi (1987).1 The conversion of14C age into Calendar year age was done by Oxcal 4.1 program (Ramsey, 2010).
the depressions at altitude greater than 20 m a.s.l. Some-times, high peats are marginally developed between hills orundulating terrains of the upper river basin. High peats mayform small domes, with variability of depths. The formationof hard-pan in the mineral substratum maintain inundated en-vironment.
Biomass deposit into peat profile suffers from decompo-sition, and it is only between 5 and 10% of the biomass arepreserved into peat. Water-logged environment, poor nutri-ents and low pH inhibit the growth of decomposers. Highlignin content in the peat forming vegetation species slowsbiological and chemical decomposition.
In coastal regions of the rivers, coastal peats commonlyoccur in a variety of dome shapes on former sea beds(Diemont and Supardi, 1987). In the upper Kapuas riverbasin, inland peat formation is very complex, occurring onformer lake beds and several depression areas between smallhills. It is common that distribution of inland peats in theupper Kapuas River is marginally scattered and these peatsform a variety of small peat domes, which may range from 1to 10 km2 (Anshari, 2009).
The formation of peats is very complex processes of in-complete decays of organic matters under anaerobic environ-ment. Peat accumulation occurs when the decay rate is lowerthan the preservation rate. Therefore, a consistent input ofpartially decayed organic matters should be maintained in or-der to favour peat accumulation. When the decay rate is rapidand high, peat does not grow but suffers from decompositionthat turns the organic matters into gases and dissolved or-ganic acids and substances.
Selected radio Carbon ages of tropical peats in Kaliman-tan and Peninsular Malaysia are so variable, spanning from30 000 to hundreds of years (Anshari et al., 2001, 2004; Pageet al., 2004; Wust and Bustin, 2004; Wust et al., 2008). Theradio Carbon analysis indicates that coastal peat in the Ka-puas River basin is formed around 3000–4000 years BP (seeTable 2). The basal dates show that the formation of peats in
this coastal region of West Kalimantan probably occurred atthe same time (Diemont and Supardi, 1987).
In contrast, the peat age from the upper Kapuas River basinis very much older than peats from the lower Kapuas Riverbasin. Anshari et al. (2004) reported that the age of peat fromDanau Sentarum National Park in the upper Kapuas Riveris greater than 30 000 yrs BP (see Table 3). Further, a basalradio Carbon date of peat from Sebangau National Park is20 000 yrs BP (Page et al., 2004). In Tasek Bera Basin, peatdates range from 3400 to 20 000 yrs BP (Wust and Bustin,2004). More radio Carbon dates are required in order to de-tect the initiation of peats in this region. Also, it is impor-tant to note that peat formations are intermittently in severalphases of accumulations and decays of organic matters (An-shari et al., 2004). The rates of peat accumulation in Kali-mantan and Tasek Bera of Peninsular Malaysia are estimatedto occur from 0.1 to 2.5 mm yr−1 (Wust and Bustin, 2004;Page et al., 2004; Hope et al., 2005).
3 Methods
3.1 Sample collection and research site
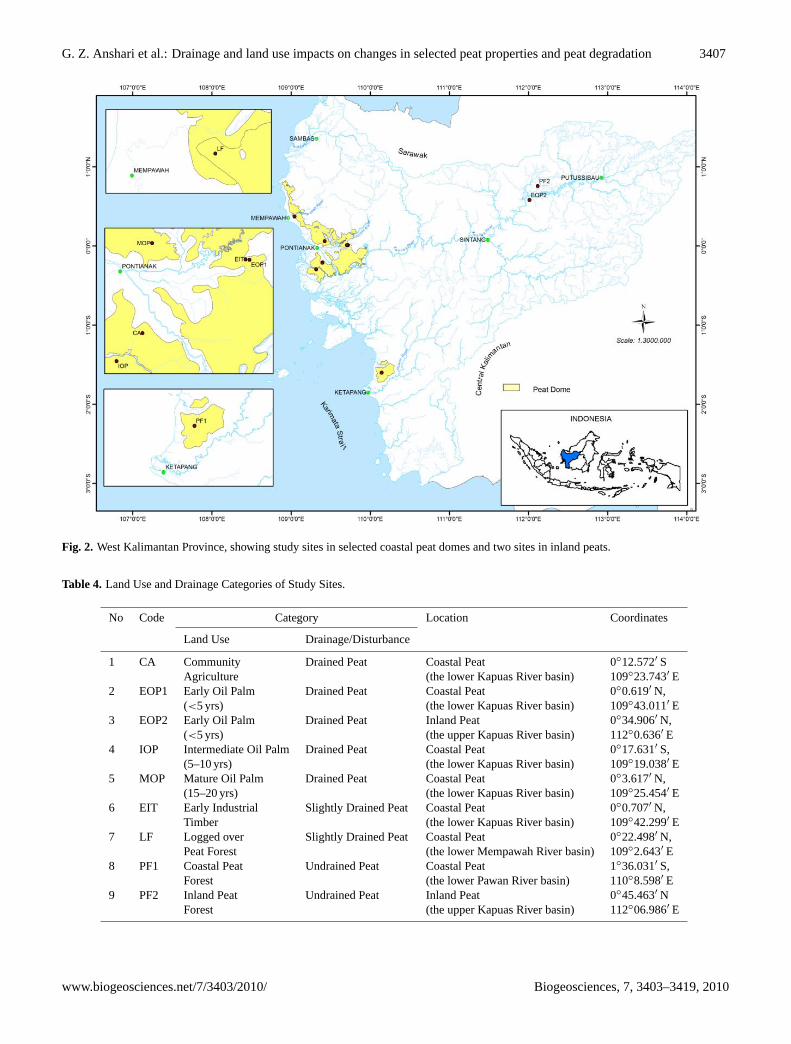
The study was conducted in West Kalimantan Province, In-donesia (see Fig. 2). We collected peat core samples us-ing a Russian type auger by Eijkelkamp, Holland. The peatsample campaigns were done between 2007 and 2010. Weretrieved the core sample every 50 cm increment until re-claiming mineral substrate beneath peat. Every 50 cm peatcore was transferred into half-cut PVC pipe (8 = 2 inch), andcarefully wrapped with home cling wrap. We took subsam-ples at a 50 cm interval up to 200 cm depths for laboratoryanalyses. Table 4 summarizes location and core sample cat-egories.
Core samples comprise of several land use groups, consist-ing of coastal and inland peat forests (PF1 and PF2), loggedover peat forest (LF), industrial timber estate (EIT) of fast
www.biogeosciences.net/7/3403/2010/ Biogeosciences, 7, 3403–3419, 2010

3406 G. Z. Anshari et al.: Drainage and land use impacts on changes in selected peat properties and peat degradation
Table 3. Selected Radio Carbon Dates of Peats from Kalimantan and Peninsular Malaysia.
Site Core Lab. No. Depth Peat Age± SD Source(cm) (14C Yr BP)
Tasek Bera Basin TB5 BIRM255 860 4500±80 Wust and Bustin (2004)(Peninsular Malaysia) B78 TO-8272 536 20 480±190
B53 TO-7613 530 3410±50B7 TO-8269 644 3930±70B115 TO-8271 436 3730±80
Danau Sentarum A OZE 137 10–11 12 440±60 Anshari et al. (2004)National Park, A OZE 138 27–28 28 900±250West Kalimantan A OZE 139 49–50 28 250±150
A OZE 140 102–103 24 250±120A Wk 5777 120–150 23 570±170A OZE 141 149–150 32 800±300B OZE 133 14–15 265±35B Wk 6278 41–42 1366±72B OZE 134 60–61 2920±50B Wk 6275 67–68 3117±57B OZE 135 71–72 13 070±70B Wk 6277 91.5–92.5 16 840±120B OZE 136 94–95 28 600±250B Wk 5779 104–124 28 780±100
Sebangau National Park SA65 90–110 170±60 Page et al. (2004)Central Kalimantan SA65 110–130 540±60
SA65 190–210 4670±80SA65 330–350 7820±50SA65 570–590 8540±100SA65 650–670 10 320±50SA65 840–860 22 120±320SA65 940–960 20 350±130
growing species, community agriculture (CA), and oil palmplantations (see Fig. 2 and Table 4).
The inland peat forest is located in Danau SentarumNational Park in the upper Kapuas River basin, and issufficiently intact and undrained. The coastal peat forest islocated in Sungai Putri peat dome of Ketapang District, andit is also undrained. Both inland and coastal peat forests wereselectively logged in the past. At present, no timber harvest-ing occurs in inland peats of Danau Sentarum National Park,and some illegal logging currently taking place in coastalpeat forest of Sungai Putri peat dome.
Logged over peat forest is located in Antibar peat domenear Mempawah (about 70 km North of Pontianak). Thiscoastal peat forest currently suffers from rapid rates of illegallogging activities, and slightly drained due to road construc-tion.
The early industrial timber estate (EIT) is located in asmall peat dome near Pontianak in the lower Kapuas Riverbasin. The estate has just cleared the natural forest and re-placed with a fast growing timber species (Acaciaspp.) for
one year. The timber plantation is slightly drained in order tolower water table depth.
The oil palm plantations consist of three age groups. Oneof the early oil palm (EOP2) is located in a scattered inlandpeat in the upper Kapuas River Basin. Other palm plantationsare all located in coastal peat domes, and consist of earlyoil palm (<5 years), intermediate oil palm (5–10 years), andmature oil palm (15–20 years). All oil palm sites are heavilydrained and regularly received fertilizers, particularly Nitro-gen, Phosphorous, and Potassium.
The community agriculture (CA) is located in drained andopen peat of Rasau Jaya peat dome. The forest of this peatdome was cleared and converted into agriculture by the gov-ernment in 1972. Farmers usually plant maize and manykinds of vegetables in this peat. The use of chicken manuresand limited amount of chemical fertilizers is common prac-tice in this agriculture.
Biogeosciences, 7, 3403–3419, 2010 www.biogeosciences.net/7/3403/2010/
G. Z. Anshari et al.: Drainage and land use impacts on changes in selected peat properties and peat degradation 3407
6
growing species, community agriculture (CA), and oil palm plantations (See Figure 2 and
Table 4).
The inland peat forest is located in Danau Sentarum National Park in the upper Kapuas River
basin, and is sufficiently intact and undrained. The coastal peat forest is located in Sungai
Putri peat dome of Ketapang District, and it is also undrained. Both inland and coastal peat
forests were selectively logged in the past. At present, no timber harvesting occurs in inland
peats of Danau Sentarum National Park, and some illegal logging currently taking place in
coastal peat forest of Sungai Putri peat dome.
Logged over peat forest is located in Antibar peat dome near Mempawah (about 70 Km
North of Pontianak). This coastal peat forest currently suffers from rapid rates of illegal
logging activities, and slightly drained due to road construction.
Figure 2. West Kalimantan Province, showing study sites in selected coastal peat domes and
two sites in inland peats
The early industrial timber estate (EIT) is located in a small peat dome near Pontianak in the
lower Kapuas River basin. The estate has just cleared the natural forest and replaced with a
fast growing timber species (Acacia spp) for one year. The timber plantation is slightly
drained in order to lower water table depth.
Fig. 2. West Kalimantan Province, showing study sites in selected coastal peat domes and two sites in inland peats.
Table 4. Land Use and Drainage Categories of Study Sites.
No Code Category Location Coordinates
Land Use Drainage/Disturbance
1 CA Community Drained Peat Coastal Peat 0◦12.572′ SAgriculture (the lower Kapuas River basin) 109◦23.743′ E
2 EOP1 Early Oil Palm Drained Peat Coastal Peat 0◦0.619′ N,(<5 yrs) (the lower Kapuas River basin) 109◦43.011′ E
3 EOP2 Early Oil Palm Drained Peat Inland Peat 0◦34.906′ N,(<5 yrs) (the upper Kapuas River basin) 112◦0.636′ E
4 IOP Intermediate Oil Palm Drained Peat Coastal Peat 0◦17.631′ S,(5–10 yrs) (the lower Kapuas River basin) 109◦19.038′ E
5 MOP Mature Oil Palm Drained Peat Coastal Peat 0◦3.617′ N,(15–20 yrs) (the lower Kapuas River basin) 109◦25.454′ E
6 EIT Early Industrial Slightly Drained Peat Coastal Peat 0◦0.707′ N,Timber (the lower Kapuas River basin) 109◦42.299′ E
7 LF Logged over Slightly Drained Peat Coastal Peat 0◦22.498′ N,Peat Forest (the lower Mempawah River basin) 109◦2.643′ E
8 PF1 Coastal Peat Undrained Peat Coastal Peat 1◦36.031′ S,Forest (the lower Pawan River basin) 110◦8.598′ E
9 PF2 Inland Peat Undrained Peat Inland Peat 0◦45.463′ NForest (the upper Kapuas River basin) 112◦06.986′ E
www.biogeosciences.net/7/3403/2010/ Biogeosciences, 7, 3403–3419, 2010

3408 G. Z. Anshari et al.: Drainage and land use impacts on changes in selected peat properties and peat degradation
Table 5. A list of research variables in this study.
No Code Variable Unit Method
1 pH (H2O) Soil Acidity pH Meter2 DBD (g cm−3) Dry Bulk Density g cm−3 Core Method and Oven Dry at 105◦C3 LOI Loss on Ignition g kg−1 Dry Combustion at 550◦C4 GWC (ρ) Gravimetric Water g kg−1 Gravimetric, Oven at 105◦C
Content (ρ)5 VWC (θ ) Volumteric Water g cm−3 By Calculation
Content (θ ) (DBD × GWC/1000)6 TOC Total Organic Carbon % High Temperature Combustion
by Elemental Analyzer7 TN Total Nitrogen % High Temperature Combustion
by Elemental Analyzer8 Atomic C/N Ratio Atomic C/N Ratio By Calculation TOC/TN
3.2 Laboratory analysis
We studied selected physical and chemical property changesof peats due to different land uses and drainage disturbances.Research variables are peat pH (H2O), Dry Bulk Density(DBD), Loss on Ignition (LOI), Gravimetric Water Content(GWC), Volumetric Water Content (VWC), Total OrganicCarbon (TOC), Total Nitrogen (TN), and Atomic C/N Ra-tio (see Table 5). We took sub-samples for laboratory analy-sis at every 50 cm interval. The volumes of sub-samples formeasurements are 50 cm3 for pH, TOC, and TN, and 100 cm3
for DBD, GWC, and LOI.We used Inolab pH meter (type 720 Bench to pH meter)
to measure peat acidity. Fresh subsamples were diluted intodistilled water at 1:5 for pH (H2O) measurements. GWCand DBD were determined after drying at 105◦C for 24 h.LOI values were calculated after combusting the oven drysamples at 550◦C for 5 h. LOI value represents the amountof organic matters. GWC, Ash Free DBD, and LOI werecalculated using Eqs. (1), (2), (3), and (4).
Water Content(g kg−1)=WS(g)−DOW110(g)
DOW110(g)×1000 (1)
DBD (g cm−3)=DOW110(g)
SV(cm3) (2)
LOI (g kg−1)=DOW110(g)−AW550(g)
DOW110(g)×1000
(Heiri et al., 2001) (3)
Ash Free DBD(g cm−3)=DBD×LOI (4)
Where: WS= wet sample weight, DOW110= constantweight after drying at 110◦C for 24–48 h, SV= samplevolume, LOI= Loss on Ignition, DBD= Dry Bulk DensityAW550= ash residue weight after combusting at 550◦C for5 h.
The concentrations of TOC and TN were determined bydry combustion at high temperature with El Vario CHNSAnalyzer. Samples were prepared by drying at 40◦C for atleast 24 h until constant weights. About 20 mg of dry sam-ples were oxidized and the evolved gases were measured.
3.3 Statistical analysis
We used SPSS version 17 for independent t-tests andOneway ANOVA (SPSS, 2008). We compared average val-ues of research variables according to contrasted locations(i.e. coastal and inland peats), and peat layers (i.e. acrotelmand catotelm). We assume that averages of acrotelm andcatotelm depths are up to 100 cm, and greater than 100 cm,respectively. We realize that depths of acrotelm seasonallyfluctuate following rainfall, and may be either less or greaterthan 100 cm. The determination of the acrotelm depth be-tween 0–100 cm in this study is a conservative estimate.Takahashi (1999) reported that the water table depth of peatswamp forest in Central Kalimantan in a severe drought as-sociated with El Nino of 1997 was 98 cm below the peat sur-face.
We used oneway ANOVA to analyze differences of peatproperties according to the defined land use and drainagecategories. As the numbers of samples collected from thesegroups are not equal, data distribution is not normal, and hasunequal variances. To overcome this concern, we used Welchand Brown-Forsythe statistics in order to detect significantdifferences of the research variables with unequal variances(Field, 2005). If mean differences of research variables arestatistically significant, we used Games-Howell (GH) proce-dure to detect specific differences in drainage and land usecategories.
Biogeosciences, 7, 3403–3419, 2010 www.biogeosciences.net/7/3403/2010/

G. Z. Anshari et al.: Drainage and land use impacts on changes in selected peat properties and peat degradation 3409
Table 6. Means of Research Variables according to Acrotelm versus Catotelm, and Inland and Coastal Peats.
Variable Peat Stratum N Mean Std.Variable Peat Stratum N Mean Std.and Location Deviation and Location Deviation
pH (H2O) Acrotelm 123 3.59 0.20 VWC (g cm−3) Acrotelm 148 0.92 0.24Catotelm 95 3.69 0.18 Catotelm 99 1.01 0.19Inland peat 47 3.61 0.21 Inland peat 23 0.74 0.17Coastal peat 171 3.64 0.19 Coastal peat 224 0.98 0.22
DBD (g cm−3) Acrotelm 163 0.12 0.04 TOC (%) Acrotelm 225 51.82 3.47Catotelm 107 0.10 0.04 Catotelm 111 52.41 4.43Inland peat 46 0.09 0.04 Inland peat 47 51.78 4.18Coastal peat 224 0.12 0.04 Coastal peat 289 52.05 3.77
LOI (g kg−1) Acrotelm 163 958.22 62.95 TN (%) Acrotelm 225 2.40 1.12Catotelm 107 964.57 55.18 Catotelm 111 2.00 1.21Inland peat 46 965.02 56.37 Inland peat 47 1.85 1.19Coastal peat 224 959.86 60.76 Coastal peat 289 2.33 1.15
GWC (g kg−1) Acrotelm 148 8645.82 3201.61 Atomic C/N Ratio Acrotelm 225 30.55 22.22Catotelm 99 11 076.47 3568.68 Catotelm 111 39.49 24.53Inland peat 23 12 111.43 4278.68 Inland peat 47 45.96 33.11Coastal peat 224 9364.24 3378.36 Coastal peat 289 31.48 20.73
Table 7a.Results of Independent t-tests for Acrotelm versus Catotelm (a) and Inland versus Coastal Peats (b).
Variable Acrotelm versus Levene’s Test for t-test for Equality of MeansCatotelm Equality of Variances
F Sig. t df Sig. (2-tailed) Mean Difference
pH (H2O) Equal variances 1.84 0.18 −3.77 216.00 0.00 −0.10∗∗∗
assumedDBD (g cm−3) Equal variances 0.16 0.69 2.72 268.00 0.01 0.01∗∗
assumedLOI (g kg−1) Equal variances 0.63 0.43 −0.85 268.00 0.40 −6.35
assumedGWC (g kg−1) Equal variances 4.25 0.04 −5.58 245.00 0.00 −2430.65∗∗∗
assumedEqual variances −5.46 194.37 0.00 −2430.65∗∗∗
not assumedVWC (g cm−3) Equal variances 5.23 0.02 −3.33 245.00 0.00 −0.10∗∗∗
assumedEqual variances −3.49 237.83 0.00 −0.10∗∗∗
not assumedTOC (%) Equal variances 1.01 0.31 −1.35 334.00 0.18 −0.60
assumedTN (%) Equal variances 3.07 0.08 3.00 334.00 0.00 0.40∗∗∗
assumedAtomic C/N Ratio Equal variances 9.25 0.00 −3.35 334.00 0.00 −8.94∗∗∗
assumedEqual variances −3.24 200.91 0.00 −8.94∗∗∗
not assumed
∗∗∗ p < 0.00; ∗∗ p < 0.01; ∗ p < 0.05
www.biogeosciences.net/7/3403/2010/ Biogeosciences, 7, 3403–3419, 2010

3410 G. Z. Anshari et al.: Drainage and land use impacts on changes in selected peat properties and peat degradation
Table 7b. Continued.
Variable Inland versus Levene’s Test for t-test for Equality of MeansCoastal Peats Equality of Variances
F Sig. t df Sig. (2-tailed) Mean Difference
pH (H2O) Equal variances 1.10 0.30 −0.82 216.00 0.41 −0.03assumed
DBD (g cm−3) Equal variances 0.01 0.94 −4.47 268.00 0.00 −0.03∗∗∗
assumedLOI (g kg−1) Equal variances 0.88 0.35 0.53 268.00 0.60 5.16
assumedEqual variances 0.56 68.25 0.58 5.16not assumed
GWC (g kg−1) Equal variances 5.40 0.02 3.62 245.00 0.00 2747.19∗∗∗
assumedEqual variances 2.99 24.90 0.01 2747.19∗∗
not assumedVWC (g cm−3) Equal variances 2.66 0.10 −4.85 245.00 0.00 −0.23∗∗∗
assumedTOC (%) Equal variances 2.21 0.14 −0.44 334.00 0.66 −0.27
assumedTN (%) Equal variances 0.17 0.68 −2.67 334.00 0.01 −0.48∗∗
assumedAtomic C/N Ratio Equal variances 30.43 0.00 4.03 334.00 0.00 14.48∗∗∗
assumedEqual variances 2.91 52.02 0.01 14.48∗∗
not assumed
∗∗∗ p < 0.00; ∗∗ p < 0.01; ∗ p < 0.05
4 Results
4.1 Independent t-tests
Table 6 presents means of research variables as classified intoacrotelm-catotelm, and inland-coastal peats. We summarizedresults of independent t-tests for acrotelm (0–100 cm) versuscatotelm (>100 cm), and inland versus coastal peats in Ta-ble 7a and b.
Table 6 shows that pH and DBD values are relatively low.Peat pH is slightly higher in catotelm than acrotelm, and pHin inland and coastal peats is very much similar to each other.DBD in acrotelm is slightly higher than catotelm, and DBDin inland peats is lower than in coastal peats. LOI values aregenerally lower in acrotelm than catotelm, and are higher ininland peats than in coastal peats. As expected, water con-tents in catotelm and inland peats are higher than acrotelmand coastal peats. The average TOC value is 52% in all cat-egories. TN values are more concentrated in acrotelm andcoastal peat. Accordingly, atomic C/N ratios in acrotelm andcoastal peats are lower than catotelm and inland peats.
The t-tests for acrotelm-catotelm and inland-coastal peatshow that LOI and TOC are indifferent. Significant differ-ences between acrotelm and catotelm are found in pH, DBD,
GWC, VWC, TN, and Atomic C/N Ratio. Peat pH, LOI andTOC between inland and coastal peats are statistically indif-ferent. Other variables (DBD, GWC, VWC, TN, and atomicC/N ratio) between coastal and inland peats are significantlydifferent.
4.2 Oneway ANOVA
4.2.1 Drainage groups
Table 8 presents a summary of peat properties according todrainage categories. Values of peat pH, DBD, and TN in-crease following drainage disturbance. TOC values seem todecrease due to drainage influences. Therefore, atomic C/Nratios substantially decrease in drained peats. LOI seems un-affected by drainage.
Peat drainage influences pH, DBD, VWC and TN, show-ing some increasing trends towards drained peat. LOI andGWC do not indicate either an increasing or decreasingtrend. TOC is slightly higher in undrained peat than indrained peat. It is obvious that atomic C/N ratio show a de-creasing trend from undrained peat to drained peat (see Ta-ble 8).
Biogeosciences, 7, 3403–3419, 2010 www.biogeosciences.net/7/3403/2010/

G. Z. Anshari et al.: Drainage and land use impacts on changes in selected peat properties and peat degradation 3411
Table 8. Means of Research Variables in Drainage Groups.
Variable Drainage N Mean SD Variable Drainage N Mean SD
pH (H2O) Undrained Peat Forest 40 3.53 0.25VWC (g cm−3) Undrained Peat Forest 16 0.69 0.12Slightly Drained Peat 63 3.63 0.21 Slightly Drained Peat 72 0.95 0.22Drained Peat 115 3.67 0.16 Drained Peat 159 0.98 0.22Total 218 3.63 0.20 Total 247 0.95 0.23
DBD (g cm−3) Undrained Peat Forest 39 0.09 0.03TOC (%) Undrained Peat Forest 40 53.38 3.16Slightly Drained Peat 72 0.11 0.04 Slightly Drained Peat 72 50.77 3.04Drained Peat 159 0.12 0.04 Drained Peat 224 52.17 4.05Total 270 0.11 0.04 Total 336 52.01 3.82
LOI (g kg−1) Undrained Peat Forest 39 958.95 91.77TN (%) Undrained Peat Forest 40 0.96 0.33Slightly Drained Peat 72 967.97 39.05 Slightly Drained Peat 72 1.10 0.29Drained Peat 159 957.90 58.13 Drained Peat 224 2.87 0.93Total 270 960.74 59.97 Total 336 2.26 1.16
GWC (g kg−1) Undrained Peat Forest 16 9754.42 2501.87Atomic C/N Ratio Undrained Peat Forest 40 62.86 24.58Slightly Drained Peat 72 10 249.69 3839.70 Slightly Drained Peat 72 50.22 16.42Drained Peat 159 9321.41 3487.46 Drained Peat 224 22.89 16.43Total 247 9620.05 3552.93 Total 336 33.51 23.36
Table 9. Test of Homogeneity of Variances in Drainage Groups.
Variable Levene df1 df2 Sig.Statistic
pH (H2O) 10.740 2 215.00 0.00DBD (g cm−3) 4.510 2 267.00 0.01LOI (g kg−1) 3.566 2 267.00 0.03GWC (g kg−1) 2.966 2 244.00 0.05VWC (g cm−3) 3.373 2 244.00 0.04TOC (%) 2.264 2 333.00 0.11TN (%) 29.136 2 333.00 0.00Atomic C/N Ratio 4.379 2 333.00 0.01
Table 9 presents a test result of homogeneity of variancesin drainage groups. All variables, except TOC, have unequalvariances. Table 10 depicts results of robust tests of equal-ity of means of the variables. The robust tests of equalityof means show that LOI and GWC are indifferent and othervariables are significantly different.
Table 11 presents Games-Howell (GH) multiple compar-isons. Highly significant differences between undrained peatforest and drained peats are found in pH, DBD, VWC, TNand atomic C/N ratio. As shown, DBD in slightly drainedpeats (i.e. logged over peat forest (LF) and industrial tim-ber plantation (EIT)) shows significant different from drainedpeats used for oil palm and agriculture. Significant dif-ferent in TOC is shown between slightly drained peat andboth drained and undrained peats. TN in drained peat issignificantly different from undrained peat forest and slightlydrained peat. Atomic C/N ratios show significantly differentin all drainage groups.
Table 10.Robust Tests of Equality of Means of Research Variablesin Drainage Groups.
Variable Statistica df1 df2 Sig.
pH (H2O) Welch 5.69 2.00 84.20 0.00Brown-Forsythe 6.05 2.00 107.63 0.00
DBD (g cm−3) Welch 16.01 2.00 119.16 0.00Brown-Forsythe 12.47 2.00 201.91 0.00
LOI (g kg−1) Welch 1.22 2.00 90.41 0.30Brown-Forsythe 0.53 2.00 67.57 0.59
GWC (g kg−1) Welch 1.55 2.00 44.37 0.22Brown-Forsythe 2.08 2.00 108.04 0.13
VWC (g cm−3) Welch 38.12 2.00 51.03 0.00Brown-Forsythe 19.66 2.00 140.80 0.00
TOC (%) Welch 9.83 2.00 102.71 0.00Brown-Forsythe 8.95 2.00 161.94 0.00
TN (%) Welch 351.33 2.00 132.33 0.00Brown-Forsythe 548.31 2.00 301.17 0.00
Atomic C/N Ratio Welch 109.19 2.00 84.58 0.00Brown-Forsythe 95.69 2.00 87.73 0.00
a AsymptoticallyF distributed
4.2.2 Land use groups
We present means of research variables in land use groupsin Table 12. Peat pH shows inconsistent variability in thesegroups. We believe that the variability of organic substanceshas a greater role in determining pH values. Without chem-ical fractionation of these organic matters, it is difficult toexplain why peat pH has small variability in these land usegroups.
DBD show an increasing trend from peat forests to dis-turbed and converted peats used for logging, oil palms, andindustrial timber. A small sample number in CA influenceslow DBD values in this research.
www.biogeosciences.net/7/3403/2010/ Biogeosciences, 7, 3403–3419, 2010

3412 G. Z. Anshari et al.: Drainage and land use impacts on changes in selected peat properties and peat degradation
Table 11.Games-Howell (GH) Multilple Comparisons of Drainage Groups.
Dependent (I) Disturbance (J) Disturbance Mean Difference (I–J) Std. Sig.Variable error
pH (H2O) Undrained Peat Forest Drained Peat −0.14∗∗∗ 0.04 0.00Undrained Peat Forest Slightly Drained Peat−0.10 0.05 0.10Slightly Drained Peat Drained Peat −0.04 0.03 0.39
DBD (g cm−3) Undrained Peat Forest Drained Peat −0.03∗∗∗ 0.01 0.00Undrained Peat Forest Slightly Drained Peat−0.02∗∗ 0.01 0.01Slightly Drained Peat Drained Peat −0.01 0.01 0.09
VWC (g cm−3) Undrained Peat Forest Drained Peat −0.30∗∗∗ 0.03 0.00Undrained Peat Forest Slightly Drained Peat−0.27∗∗∗ 0.04 0.00Slightly Drained Peat Drained Peat −0.03 0.03 0.61
TOC (%) Slightly Drained Peat Drained Peat −1.40∗∗ 0.45 0.01Undrained Peat Forest Drained Peat 1.21 0.57 0.09Undrained Peat Forest Slightly Drained Peat 2.62∗∗∗ 0.61 0.00
TN (%) Undrained Peat Forest Drained Peat −1.91∗∗∗ 0.08 0.00Slightly Drained Peat Drained Peat −1.78∗∗∗ 0.07 0.00Undrained Peat Forest Slightly Drained Peat−0.14 0.06 0.08
Atomic C/N Ratio Undrained Peat Forest Slightly Drained Peat 12.64∗∗ 4.34 0.01Slightly Drained Peat Drained Peat 27.32∗∗∗ 2.23 0.00Undrained Peat Forest Drained Peat 39.97∗∗∗ 4.04 0.00
∗∗∗ p < 0.00; ∗∗ p < 0.01; ∗ p < 0.05
TOC values are relatively constant in the peat forests thanthe disturbed and converted peats used for logging, oil palms,and industrial timber. In general, TOC values range from 49to 54%. The quality of organic matters must have a greaterinfluence in the variability of TOC.
TN concentrations tend to be slightly higher in peats usedfor oil palms and agriculture due to fertilizer application. Ingeneral, TN values in peat forest range from 0.8 to 1.5%. Inpeats used for oil palms and agriculture, TN concentrationsrange from 2.4 to 3.4%. In consequence, atomic C/N ratiosin peats used for oil palms and agriculture are lower than inpeat forests.
Tables 13 and 14 present results of test homogeneity ofvariances, and robust tests of equality of means of researchvariables. We found that variances in land use classes are sig-nificantly unequal, and all research variables are significantlydifferent. Results of GH multiple comparisons are presentedin Table 15.
Based on GH multiple comparisons, DBD in inland peatforest are significantly different from DBD in selected peatsused for agriculture, intermediate and mature oil palm plan-tations, the timber estate, and logged over peat forest. It isimportant to note that DBD in inland peat forest is not dif-ferent from DBD in coastal peat forest. DBD in logged overpeat forest is significantly different from DBD in EIT, PF1,EOP2, and CA. DBD in Coastal peat forest is notably differ-ent from most DBD in peats used for oil palms in coastal re-gion. Further DBD in community agriculture is significantlydifferent from DBD in PF2, LF, EOP1, IOP, and MOP. DBD
in all oil palms of coastal peat is significantly different fromDBD in early oil palm in inland peat.
LOI in intermediate oil palm plantations (IOP) signifi-cantly differs from PF2, EIT, LF, EOP1, MOP, and CA. TOCconcentrations are not very much different in the land usecategories. TOC in inland peat forest is only significantlydifferent from TOC in EIT, which is also significantly dif-ferent from TOC in IOP, CA and PF1. TOC in coastal peatforest (PF1) is significantly different from TOC in LF andMOP. TOC values in oil palms are all indifferent.
TN concentration in inland peat forest (PF2) is signifi-cantly different from other land uses in coastal peats andearly oil palm in inland peat. TN in early industrial timber(EIT) in coastal peat is indifferent from TN in coastal peatforest, but is significantly different from other land use types.TN in coastal peat forest (PF1) is not significantly differentfrom TN in logged over forest (LF), and is significantly dif-ferent from other land uses. In peats used for oil palms andagriculture, TN concentrations in early oil palm of coastalpeat (EOP1) and intermediate oil palm of coastal peat (IOP)are highly significantly different. In coastal area, peats usedfor oil palms show significant different between TN in IOPand MOP, and between TN in MOP and EOP2. TN in com-munity agriculture (CA) is significantly different from TN isIOP and MOP.
As TN concentrations significantly increase in peats usedfor oil palms and agriculture, atomic C/N ratios between thepeat forest and converted peats are mostly different. The C/Nratio in inland peat forest (PF2) is also different from the
Biogeosciences, 7, 3403–3419, 2010 www.biogeosciences.net/7/3403/2010/

G. Z. Anshari et al.: Drainage and land use impacts on changes in selected peat properties and peat degradation 3413
Table 12.Means of Research Variables according to Land Use Groups.
Category pH DBD LOI GWC VWC TOC (%) TN (%) Atomic C/N(H2O) (g cm−3) (g kg−1) (g kg−1) (g cm−3) Ratio
Coastal Peat Forest (PF1) 3.591 0.081 936.728 9385.125 0.719 54.386 1.568 41.896SD 0.345 0.028 120.458 2426.795 0.201 2.272 0.779 17.372N 16 20 20 20 20 20 20 20Inland Peat Forest (PF2) 3.488 0.097 982.865 N/A N/A 53.043 0.784 73.078SD 0.143 0.026 33.326 N/A N/A 3.663 0.199 24.778N 24 23 23 N/A N/A 24 24 24Early Industrial Timber (EIT) 3.823 0.071 974.250 13112.138 0.894 50.211 1.243 42.413SD 0.123 0.017 29.166 3631.144 0.206 1.929 0.252 10.598N 28 32 32 32 32 32 32 32Logged over Peat Forest (LF) 3.469 0.134 962.940 7959.738 0.999 51.210 0.981 56.458SD 0.106 0.031 45.186 2063.609 0.225 3.668 0.270 17.656N 35 40 40 40 40 40 40 40Early Oil Palm 1 (<5 Yr) (EOP1) 3.686 0.119 976.189 9784.039 1.053 51.433 3.278 16.181SD 0.141 0.040 44.932 3129.855 0.149 5.381 0.620 3.264N 34 38 38 38 38 38 38 38Early Oil Palm 2 (<5 yr) (EOP2) 3.717 0.076 944.728 11456.994 0.719 49.255 2.789 18.280SD 0.226 0.047 68.867 4132.435 0.177 6.393 0.630 3.547N 18 18 18 18 18 18 18 18Intermediate Oil Palm (5–10 yr) (IOP) 3.571 0.136 917.056 8757.394 1.071 52.654 2.377 32.848SD 0.066 0.047 69.524 3340.385 0.207 2.924 1.199 23.082N 28 48 48 48 48 86 86 86Mature Oil Palm (15–20 yr) (MOP) 3.698 0.132 986.933 7435.390 0.947 51.698 3.398 15.402SD 0.158 0.024 9.601 2229.008 0.202 1.998 0.385 1.810N 35 40 40 40 40 40 40 40Community Agriculture (CA) 0.069 978.936 14061.973 0.953 53.248 3.071 17.514SD 0.017 31.581 2015.596 0.201 4.287 0.335 2.204N 11 11 11 11 38 38 38
Table 13.Test of Homogeneity of Variances.
Variable Levene df1 df2 Sig.Statistic
DBD (g cm−3) 4.238 8 261 0.00LOI (g kg?−1) 10.270 8 261 0.00TOC (%) 2.947 8 327 0.00TN (%) 48.215 8 327 0.00Atomic C/N Ratio 28.890 8 327 0.00pH (H2O) 12.841 6 187 0.00GWC (g kg−1) 3.482 6 187 0.00VWC (g cm−3) 2.453 6 187 0.03
Table 14. Robust Tests of Equality of Means of DBD, LOI, TOC,TN, Atomic C/N Ratio, pH, GWC and VWC.
Variable Statistica df1 df2 Sig.
DBD (g cm−3) Welch 35.913 8 84.348 0.00Brown-Forsythe 22.250 8 156.630 0.00
LOI (g kg−1) Welch 8.274 8 76.732 0.00Brown-Forsythe 5.876 8 69.903 0.00
TOC (%) Welch 7.827 8 105.036 0.00Brown-Forsythe 4.182 8 120.433 0.00
TN (%) Welch 316.454 8 108.433 0.00Brown-Forsythe 102.987 8 175.225 0.00
Atomic C/N Ratio Welch 74.902 8 103.795 0.00Brown-Forsythe 61.051 8 121.768 0.00
pH (H2O) Welch 28.708 6 70.010 0.00Brown-Forsythe 11.070 6 50.179 0.00
GWC (g kg−1) Welch 11.783 6 71.722 0.00Brown-Forsythe 12.155 6 124.197 0.00
VWC (g cm−3) Welch 30.249 6 74.885 0.00Brown-Forsythe 18.785 6 165.141 0.00
a AsymptoticallyF Distributed
www.biogeosciences.net/7/3403/2010/ Biogeosciences, 7, 3403–3419, 2010

3414 G. Z. Anshari et al.: Drainage and land use impacts on changes in selected peat properties and peat degradation
Page 1/1
Copernicus Publications Bahnhofsallee 1e 37081 Göttingen Germany Martin Rasmussen (Managing Director) Nadine Deisel (Head of Production/Promotion)
Contact [email protected] http://publications.copernicus.org Phone +49-551-900339-50 Fax +49-551-900339-70
Legal Body Copernicus Gesellschaft mbH Based in Göttingen Registered in HRB 131 298 County Court Göttingen Tax Office FA Göttingen USt-IdNr. DE216566440
Fig. 3. A scatter plot TN versus TOC according to DrainageGroups.
C/N ratio in coastal peat forest (PF1), and the C/N ratios inPF1 and PF1 are significantly different from the C/N ratiosin converted peats used for oil palms and agriculture.
Values of pH between coastal and inland peat forests arenot significantly different according to GH multiple compar-isons. Logged over forest shows significant different in pHfrom all peats used for oil palms, and early industrial timber(EIT). Means of pH in EIT is significantly different in all oilpalms, except in EOP2. Further, pH value in IOP is signifi-cantly different from MOP and EOP1. It is important to notethat pH in CA was not recorded in this analysis.
GWC values show significant differences between GWCvalues in EIT and EOP1, IOP and MOP. In oil palm landuses, GWC in MOP is significantly different from GWC inEOP1, EOP2, and IOP. GWC in PF1 was not recorded, andtherefore was not compared.
VWC in coastal peat forest (PF1) is significantly differentfrom VWC in peats used for MOP, IOP, and EOP1; and peatsused for EIT and LF. In oil palms, there is significantly dif-ferent between VWC in EOP 1 and EOP2; between IOP andMOP; between IOP and EOP2; between MOP and EOP2.
Figure 3 presents a scatter plot TOC versus TN accordingto drainage groups, and Fig. 4 presents scatter plots DBD ver-sus TN according to land use groups. We recorded high TNconcentration in drained peats used for oil palms and agricul-ture.
DBD in peat forests is generally lower than 0.1 g cm−3.Rieley et al. (2008) recorded an average DBD value of0.08 g cm−3 in peats from Central Kalimantan. Other au-thors commonly report the average DBD value of 0.1 g cm−3
for fibrist peats (Andriesse, 1988; Satrio et al., 2009; SoilSurvey Staff, 2010).
Increases in TN in peats used for oil palms are mostly as-sociated with application of fertilizers (see Figs. 3 and 4). Alloil palms need regular and heavy inputs of fertilizers, particu-larly Nitrogen (N), Phosphorous (P) and Potassium (K). Thedirect impact of Nitrogen is to reduce C/N ratio as TOC val-
Figure 4. Scatter plots DBD vs TN according to Land Use Groups (PF1= coastal peat forest; PF2= inland peat forest; LF = logged over peat forest; EIT =
industrial timber plantation; CA= community agriculture; EOP1= Early Oil Palm (< 5 yrs) in coastal peat; EOP2 = Early Oil Palm (<5 yrs) in inland peat; IOP = Intermiediate Oil Palm (5-10
yrs); MOP = Mature Oil Palm (15-20 yrs)
Fig. 4. Scatter plots DBD vs. TN according to Land UseGroups (PF1= coastal peat forest; PF2= inland peat forest;LF = logged over peat forest; EIT= industrial timber plantation;CA = community agriculture; EOP1= Early Oil Palm (<5 yrs)in coastal peat; EOP2= Early Oil Palm (<5 yrs) in inland peat;IOP= Intermiediate Oil Palm (5–10 yrs); MOP= Mature Oil Palm(15–20 yrs).
ues are relatively constant in all land use groups, and are notgreatly affected by drainage. We believe that the reductionof C/N ratio greatly influences a rate of peat decomposition.The availability of N would enhance decomposers to oxidizepeats into dissolved organic Carbon, dissolved organic acids,and CO2 gas.
Figure 5 depicts scatter plots of LOI versus C/N ratio inland use groups, and Fig. 6 presents scatter plots LOI ver-sus TOC, and LOI versus TN. These figures show that LOIvalues in both peat forest and converted peats for oil palmsand agricuture are consistently high, and values of C/N ratiosin converted peats are substantially lower than in peat forest.Values of C/N ratio in IOP are comparably as high as in peatforest. This occurs because regular inundation in IOP causesrapid loss of Nitrogen, and retards the decomposition rate inthis oil palm site.
Biogeosciences, 7, 3403–3419, 2010 www.biogeosciences.net/7/3403/2010/

G. Z. Anshari et al.: Drainage and land use impacts on changes in selected peat properties and peat degradation 3415
Table 15.Games-Howell Multiple Comparisons of DBD, LOI TOC, TN, and Atomic C/N Ratio according to Land Use Groups.
Dependent Variable (I) LandUse (J) LandUse Mean Difference (I–J) Sig.
DBD (g cm−3) Early Industrial Timber (EIT) Intermediate Oil Palm (5–10 yr) (IOP) −0.07∗∗∗ 0.00Early Industrial Timber (EIT) Logged over Peat Forest (LF) −0.06∗∗∗ 0.00Early Industrial Timber (EIT) Mature Oil Palm (15–20 yr) (MOP) −0.06∗∗∗ 0.00Early Industrial Timber (EIT) Early Oil Palm 1 (<5 Yr) (EOP1) −0.05∗∗∗ 0.00Inland Peat Forest (PF2) Intermediate Oil Palm (5–10 yr) (IOP) −0.04∗∗∗ 0.00Inland Peat Forest (PF2) Logged over Peat Forest (LF) −0.04∗∗∗ 0.00Inland Peat Forest (PF2) Mature Oil Palm (15–20 yr) (MOP) −0.03∗∗∗ 0.00Inland Peat Forest (PF2) Early Industrial Timber (EIT) 0.03∗∗∗ 0.00Inland Peat Forest (PF2) Community Agriculture (CA) 0.03∗∗ 0.02Early Oil Palm 1 (<5 Yr) (EOP1) Coastal Peat Forest (PF1) 0.04∗∗∗ 0.00Early Oil Palm 1 (<5 Yr) (EOP1) Early Oil Palm 2 (<5 yr) (EOP2) 0.04∗ 0.05Early Oil Palm 1 (<5 Yr) (EOP1) Community Agriculture (CA) 0.05∗∗∗ 0.00Mature Oil Palm (15–20 yr) (MOP) Coastal Peat Forest (PF1) 0.05∗∗∗ 0.00Logged over Peat Forest (LF) Coastal Peat Forest (PF1) 0.05∗∗∗ 0.00Intermediate Oil Palm (5–10 yr) (IOP) Coastal Peat Forest (PF1) 0.06∗∗∗ 0.00Mature Oil Palm (15–20 yr) (MOP) Early Oil Palm 2 (<5 yr) (EOP2) 0.06∗∗∗ 0.00Logged over Peat Forest (LF) Early Oil Palm 2 (<5 yr) (EOP2) 0.06∗∗∗ 0.00Intermediate Oil Palm (5–10 yr) (IOP) Early Oil Palm 2 (<5 yr) (EOP2) 0.06∗∗∗ 0.00Mature Oil Palm (15–20 yr) (MOP) Community Agriculture (CA) 0.06∗∗∗ 0.00Logged over Peat Forest (LF) Community Agriculture (CA) 0.07∗∗∗ 0.00Intermediate Oil Palm (5–10 yr) (IOP) Community Agriculture (CA) 0.07∗∗∗ 0.00
LOI (g kg−1) Intermediate Oil Palm (5–10 yr) (IOP) Mature Oil Palm (15–20 yr) (MOP) −69.88∗∗∗ 0.00Logged over Peat Forest (LF) Mature Oil Palm (15–20 yr) (MOP) −23.99∗ 0.05Logged over Peat Forest (LF) Intermediate Oil Palm (5–10 yr) (IOP) 45.88∗∗ 0.01Early Industrial Timber (EIT) Intermediate Oil Palm (5–10 yr) (IOP) 57.19∗∗∗ 0.00Early Oil Palm 1 (<5 Yr) (EOP1) Intermediate Oil Palm (5–10 yr) (IOP) 59.13∗∗∗ 0.00Community Agriculture (CA) Intermediate Oil Palm (5–10 yr) (IOP) 61.88∗∗∗ 0.00Inland Peat Forest (PF2) Intermediate Oil Palm (5–10 yr) (IOP) 65.81∗∗∗ 0.00
TOC (%) Early Industrial Timber (EIT) Coastal Peat Forest (PF1) −4.17∗∗∗ 0.00Logged over Peat Forest (LF) Coastal Peat Forest (PF1) −3.18∗∗∗ 0.00Early Industrial Timber (EIT) Community Agriculture (CA) −3.04∗∗ 0.01Mature Oil Palm (15–20 yr) (MOP) Coastal Peat Forest (PF1) −2.69∗∗∗ 0.00Early Industrial Timber (EIT) Intermediate Oil Palm (5–10 yr) (IOP) −2.44∗∗∗ 0.00Inland Peat Forest (PF2) Early Industrial Timber (EIT) 2.83∗ 0.04
TN (%) Inland Peat Forest (PF2) Mature Oil Palm (15–20 yr) (MOP) −2.61∗∗∗ 0.00Inland Peat Forest (PF2) Early Oil Palm 1 (<5 Yr) (EOP1) −2.49∗∗∗ 0.00Logged over Peat Forest (LF) Mature Oil Palm (15–20 yr) (MOP) −2.42∗∗∗ 0.00Logged over Peat Forest (LF) Early Oil Palm 1 (<5 Yr) (EOP1) −2.30∗∗∗ 0.00Inland Peat Forest (PF2) Community Agriculture (CA) −2.29∗∗∗ 0.00Early Industrial Timber (EIT) Mature Oil Palm (15–20 yr) (MOP) −2.16∗∗∗ 0.00Logged over Peat Forest (LF) Community Agriculture (CA) −2.09∗∗∗ 0.00Early Industrial Timber (EIT) Early Oil Palm 1 (<5 Yr) (EOP1) −2.03∗∗∗ 0.00Inland Peat Forest (PF2) Early Oil Palm 2 (<5 yr) (EOP2) −2.01∗∗∗ 0.00Early Industrial Timber (EIT) Community Agriculture (CA) −1.83∗∗∗ 0.00Logged over Peat Forest (LF) Early Oil Palm 2 (<5 yr) (EOP2) −1.81∗∗∗ 0.00Inland Peat Forest (PF2) Intermediate Oil Palm (5–10 yr) (IOP) −1.59∗∗∗ 0.00Early Industrial Timber (EIT) Early Oil Palm 2 (<5 yr) (EOP2) −1.55∗∗∗ 0.00Logged over Peat Forest (LF) Intermediate Oil Palm (5–10 yr) (IOP) −1.40∗∗∗ 0.00Coastal Peat Forest (PF1) Early Oil Palm 2 (<5 yr) (EOP2) −1.22∗∗∗ 0.00Early Industrial Timber (EIT) Intermediate Oil Palm (5–10 yr) (IOP) −1.13∗∗∗ 0.00Intermediate Oil Palm (5–10 yr) (IOP) Mature Oil Palm (15–20 yr) (MOP) −1.02∗∗∗ 0.00Inland Peat Forest (PF2) Coastal Peat Forest (PF1) −0.78∗∗ 0.01Intermediate Oil Palm (5–10 yr) (IOP) Community Agriculture (CA) −0.69∗∗∗ 0.00Inland Peat Forest (PF2) Early Industrial Timber (EIT) −0.46∗∗∗ 0.00Inland Peat Forest (PF2) Logged over Peat Forest (LF) −0.20∗ 0.04Early Industrial Timber (EIT) Logged over Peat Forest (LF) 0.26∗∗∗ 0.00Mature Oil Palm (15–20 yr) (MOP) Community Agriculture (CA) 0.33∗∗∗ 0.00Mature Oil Palm (15–20 yr) (MOP) Early Oil Palm 2 (<5 yr) (EOP2) 0.61∗ 0.02Intermediate Oil Palm (5–10 yr) (IOP) Coastal Peat Forest (PF1) 0.81∗∗ 0.01Early Oil Palm 1 (<5 Yr) (EOP1) Intermediate Oil Palm (5–10 yr) (IOP) 0.90∗∗∗ 0.00Community Agriculture (CA) Coastal Peat Forest (PF1) 1.50∗∗∗ 0.00Early Oil Palm 1 (<5 Yr) (EOP1) Coastal Peat Forest (PF1) 1.71∗∗∗ 0.00Mature Oil Palm (15–20 yr) (MOP) Coastal Peat Forest (PF1) 1.83∗∗∗ 0.00
www.biogeosciences.net/7/3403/2010/ Biogeosciences, 7, 3403–3419, 2010

3416 G. Z. Anshari et al.: Drainage and land use impacts on changes in selected peat properties and peat degradation
Table 15.Continued.
Dependent Variable (I) LandUse (J) LandUse Mean Difference (I–J) Sig.
Atomic C/N Ratio Mature Oil Palm (15–20 yr) (MOP) Logged over Peat Forest (LF) −41.06∗∗∗ 0.00Mature Oil Palm (15–20 yr) (MOP) Early Industrial Timber (EIT) −27.01∗∗∗ 0.00Mature Oil Palm (15–20 yr) (MOP) Coastal Peat Forest (PF1) −26.49∗∗∗ 0.00Early Oil Palm 1 (<5 Yr) (EOP1) Early Industrial Timber (EIT) −26.23∗∗∗ 0.00Early Oil Palm 1 (<5 Yr) (EOP1) Coastal Peat Forest (PF1) −25.72∗∗∗ 0.00Community Agriculture (CA) Coastal Peat Forest (PF1) −24.38∗∗∗ 0.00Intermediate Oil Palm (5–10 yr) (IOP) Logged over Peat Forest (LF) −23.61∗∗∗ 0.00Early Oil Palm 1 (<5 Yr) (EOP1) Intermediate Oil Palm (5–10 yr) (IOP) −16.67∗∗∗ 0.00Early Industrial Timber (EIT) Logged over Peat Forest (LF) −14.04∗∗∗ 0.00Mature Oil Palm (15–20 yr) (MOP) Community Agriculture (CA) −2.11∗∗∗ 0.00Intermediate Oil Palm (5–10 yr) (IOP) Early Oil Palm 2 (<5 yr) (EOP2) 14.57∗∗∗ 0.00Intermediate Oil Palm (5–10 yr) (IOP) Community Agriculture (CA) 15.33∗∗∗ 0.00Intermediate Oil Palm (5–10 yr) (IOP) Mature Oil Palm (15–20 yr) (MOP) 17.45∗∗∗ 0.00Coastal Peat Forest (PF1) Early Oil Palm 2 (<5 yr) (EOP2) 23.62∗∗∗ 0.00Early Industrial Timber (EIT) Early Oil Palm 2 (<5 yr) (EOP2) 24.13∗∗∗ 0.00Early Industrial Timber (EIT) Community Agriculture (CA) 24.90∗∗∗ 0.00Inland Peat Forest (PF2) Early Industrial Timber (EIT) 30.67∗∗∗ 0.00Inland Peat Forest (PF2) Coastal Peat Forest (PF1) 31.18∗∗∗ 0.00Logged over Peat Forest (LF) Early Oil Palm 2 (<5 yr) (EOP2) 38.18∗∗∗ 0.00Logged over Peat Forest (LF) Community Agriculture (CA) 38.94∗∗∗ 0.00Inland Peat Forest (PF2) Intermediate Oil Palm (5–10 yr) (IOP) 40.23∗∗∗ 0.00Logged over Peat Forest (LF) Early Oil Palm 1 (<5 Yr) (EOP1) 40.28∗∗∗ 0.00Inland Peat Forest (PF2) Early Oil Palm 2 (<5 yr) (EOP2) 54.80∗∗∗ 0.00Inland Peat Forest (PF2) Community Agriculture (CA) 55.56∗∗∗ 0.00Inland Peat Forest (PF2) Early Oil Palm 1 (<5 Yr) (EOP1) 56.90∗∗∗ 0.00Inland Peat Forest (PF2) Mature Oil Palm (15–20 yr) (MOP) 57.68∗∗∗ 0.00
pH (H2O) Logged over Peat Forest (LF) Early Oil Palm 2 (<5 yr) (EOP2) −0.25∗∗∗ 0.00Logged over Peat Forest (LF) Mature Oil Palm (15–20 yr) (MOP) −0.23∗∗∗ 0.00Logged over Peat Forest (LF) Early Oil Palm 1 (<5 Yr) (EOP1) −0.22∗∗∗ 0.00Intermediate Oil Palm (5–10 yr) (IOP) Mature Oil Palm (15–20 yr) (MOP) −0.13∗∗∗ 0.00Logged over Peat Forest (LF) Intermediate Oil Palm (5–10 yr) (IOP) −0.10∗∗∗ 0.00Early Oil Palm 1 (<5 Yr) (EOP1) Intermediate Oil Palm (5–10 yr) (IOP) 0.11∗∗∗ 0.00Early Industrial Timber (EIT) Mature Oil Palm (15–20 yr) (MOP) 0.13∗∗ 0.01Early Industrial Timber (EIT) Early Oil Palm 1 (<5 Yr) (EOP1) 0.14∗∗∗ 0.00Early Industrial Timber (EIT) Intermediate Oil Palm (5–10 yr) (IOP) 0.25∗∗∗ 0.00Early Industrial Timber (EIT) Logged over Peat Forest (LF) 0.35∗∗∗ 0.00
GWC (g kg−1) Mature Oil Palm (15–20 yr) (MOP) Early Oil Palm 2 (<5 yr) (EOP2) −3840.15∗ 0.02Logged over Peat Forest (LF) Early Oil Palm 2 (<5 yr) (EOP2) −3436.11∗ 0.04Logged over Peat Forest (LF) Intermediate Oil Palm (5–10 yr) (IOP) −2101.16∗ 0.05Early Oil Palm 1 (<5 Yr) (EOP1) Mature Oil Palm (15–20 yr) (MOP) 2188.69∗ 0.04Intermediate Oil Palm (5–10 yr) (IOP) Mature Oil Palm (15–20 yr) (MOP) 2505.20∗∗ 0.01Early Industrial Timber (EIT) Intermediate Oil Palm (5–10 yr) (IOP) 3331.45∗∗ 0.01Early Industrial Timber (EIT) Early Oil Palm 1 (<5 Yr) (EOP1) 3647.97∗∗∗ 0.00Early Industrial Timber (EIT) Coastal Peat Forest (PF1) 3699.08∗∗ 0.01Early Industrial Timber (EIT) Logged over Peat Forest (LF) 5432.61∗∗∗ 0.00Early Industrial Timber (EIT) Mature Oil Palm (15–20 yr) (MOP) 5836.65∗∗∗ 0.00
VWC (g cm−3) Early Industrial Timber (EIT) Intermediate Oil Palm (5–10 yr) (IOP) −0.26∗∗∗ 0.00Early Industrial Timber (EIT) Early Oil Palm 1 (<5 Yr) (EOP1) −0.16∗ 0.02Logged over Peat Forest (LF) Intermediate Oil Palm (5–10 yr) (IOP) −0.15∗ 0.03Intermediate Oil Palm (5–10 yr) (IOP) Mature Oil Palm (15–20 yr) (MOP) 0.18∗∗∗ 0.00Early Industrial Timber (EIT) Coastal Peat Forest (PF1) 0.20∗∗∗ 0.00Mature Oil Palm (15–20 yr) (MOP) Early Oil Palm 2 (<5 yr) (EOP2) 0.25∗∗∗ 0.00Logged over Peat Forest (LF) Early Oil Palm 2 (<5 yr) (EOP2) 0.27∗∗∗ 0.00Mature Oil Palm (15–20 yr) (MOP) Coastal Peat Forest (PF1) 0.28∗∗∗ 0.00Logged over Peat Forest (LF) Coastal Peat Forest (PF1) 0.31∗∗∗ 0.00Early Oil Palm 1 (<5 Yr) (EOP1) Early Oil Palm 2 (<5 yr) (EOP2) 0.33∗∗∗ 0.00Early Oil Palm 1 (<5 Yr) (EOP1) Coastal Peat Forest (PF1) 0.36∗∗∗ 0.00Intermediate Oil Palm (5–10 yr) (IOP) Early Oil Palm 2 (<5 yr) (EOP2) 0.43∗∗∗ 0.00Intermediate Oil Palm (5–10 yr) (IOP) Coastal Peat Forest (PF1) 0.46∗∗∗ 0.00
Biogeosciences, 7, 3403–3419, 2010 www.biogeosciences.net/7/3403/2010/

G. Z. Anshari et al.: Drainage and land use impacts on changes in selected peat properties and peat degradation 3417
Figure 5. Scatter plots of LOI versus C/N Ratio according to Land Use Groups (PF1= coastal peat forest; PF2= inland peat forest; LF = logged over peat forest; EIT =
industrial timber plantation; CA= community agriculture; EOP1= Early Oil Palm (< 5 yrs) in coastal peat; EOP2 = Early Oil Palm (<5 yrs) in inland peat; IOP = Intermiediate Oil Palm (5-10
yrs); MOP = Mature Oil Palm (15-20 yrs)
Fig. 5. Scatter plots of LOI versus C/N Ratio according to Land Use Groups (PF1= coastal peat forest; PF2= inland peat forest;LF = logged over peat forest; EIT= industrial timber plantation; CA= community agriculture; EOP1= Early Oil Palm (<5 yrs) in coastalpeat; EOP2= Early Oil Palm (<5 yrs) in inland peat; IOP= Intermiediate Oil Palm (5–10 yrs); MOP= Mature Oil Palm (15–20 yrs).
0
10
20
30
40
50
60
70
0 200 400 600 800 1,000
PF1
PF2
LF
EIT TOC (%
)
LOI (g kg⁻¹)
0
10
20
30
40
50
60
70
80
0 200 400 600 800 1,000
CA
EOP1
EOP2
IOP
MOP
TOC (%
)
LOI (g kg⁻¹)
0.0
0.2
0.4
0.6
0.8
1.0
1.2
1.4
1.6
1.8
2.0
0 200 400 600 800 1,000
PF1
PF2
LF
EIT TN (%)
LOI (g kg⁻¹)
0.0
0.5
1.0
1.5
2.0
2.5
3.0
3.5
4.0
4.5
5.0
0 200 400 600 800 1,000
CA
EOP1
EOP2
IOP
MOP
TN (%)
LOI (g kg⁻¹)
Figure 6. Scatter plots LOI versus TOC and LOI versus TN according to Land Use Groups (PF1= coastal peat forest; PF2= inland peat forest; LF = logged over peat forest; EIT =
industrial timber plantation; CA= community agriculture; EOP1= Early Oil Palm (< 5 yrs) in coastal peat; EOP2 = Early Oil Palm (<5 yrs) in inland peat; IOP = Intermiediate Oil Palm (5-10
yrs); MOP = Mature Oil Palm (15-20 yrs)
Figure 7. A scatted plot LOI vs TOC in the upper 200 cm depth from Sebangau Peat Forest, Central Kalimantan (Modified from Page et al., 2004)
0
10
20
30
40
50
60
70
0 200 400 600 800 1,000
PF1
PF2
LF
EIT TOC (%
)
LOI (g kg⁻¹)
0
10
20
30
40
50
60
70
80
0 200 400 600 800 1,000
CA
EOP1
EOP2
IOP
MOP
TOC (%
)
LOI (g kg⁻¹)
0.0
0.2
0.4
0.6
0.8
1.0
1.2
1.4
1.6
1.8
2.0
0 200 400 600 800 1,000
PF1
PF2
LF
EIT TN (%)
LOI (g kg⁻¹)
0.0
0.5
1.0
1.5
2.0
2.5
3.0
3.5
4.0
4.5
5.0
0 200 400 600 800 1,000
CA
EOP1
EOP2
IOP
MOP
TN (%)
LOI (g kg⁻¹)
Figure 6. Scatter plots LOI versus TOC and LOI versus TN according to Land Use Groups (PF1= coastal peat forest; PF2= inland peat forest; LF = logged over peat forest; EIT =
industrial timber plantation; CA= community agriculture; EOP1= Early Oil Palm (< 5 yrs) in coastal peat; EOP2 = Early Oil Palm (<5 yrs) in inland peat; IOP = Intermiediate Oil Palm (5-10
yrs); MOP = Mature Oil Palm (15-20 yrs)
Figure 7. A scatted plot LOI vs TOC in the upper 200 cm depth from Sebangau Peat Forest, Central Kalimantan (Modified from Page et al., 2004)
Fig. 6. Scatter plots LOI versus TOC and LOI versus TN according to Land Use Groups (PF1= coastal peat forest; PF2= inland peat forest;LF = logged over peat forest; EIT= industrial timber plantation; CA= community agriculture; EOP1= Early Oil Palm (<5 yrs) in coastalpeat; EOP2= Early Oil Palm (<5 yrs) in inland peat; IOP= Intermiediate Oil Palm (5–10 yrs); MOP= Mature Oil Palm (15–20 yrs).
www.biogeosciences.net/7/3403/2010/ Biogeosciences, 7, 3403–3419, 2010

3418 G. Z. Anshari et al.: Drainage and land use impacts on changes in selected peat properties and peat degradation
0
10
20
30
40
50
60
70
0 200 400 600 800 1,000
PF1
PF2
LF
EIT TOC (%
)
LOI (g kg⁻¹)
0
10
20
30
40
50
60
70
80
0 200 400 600 800 1,000
CA
EOP1
EOP2
IOP
MOP
TOC (%
)
LOI (g kg⁻¹)
0.0
0.2
0.4
0.6
0.8
1.0
1.2
1.4
1.6
1.8
2.0
0 200 400 600 800 1,000
PF1
PF2
LF
EIT TN (%)
LOI (g kg⁻¹)
0.0
0.5
1.0
1.5
2.0
2.5
3.0
3.5
4.0
4.5
5.0
0 200 400 600 800 1,000
CA
EOP1
EOP2
IOP
MOP
TN (%)
LOI (g kg⁻¹)
Figure 6. Scatter plots LOI versus TOC and LOI versus TN according to Land Use Groups (PF1= coastal peat forest; PF2= inland peat forest; LF = logged over peat forest; EIT =
industrial timber plantation; CA= community agriculture; EOP1= Early Oil Palm (< 5 yrs) in coastal peat; EOP2 = Early Oil Palm (<5 yrs) in inland peat; IOP = Intermiediate Oil Palm (5-10
yrs); MOP = Mature Oil Palm (15-20 yrs)
Figure 7. A scatted plot LOI vs TOC in the upper 200 cm depth from Sebangau Peat Forest, Central Kalimantan (Modified from Page et al., 2004)
Fig. 7. A scatted plot LOI vs. TOC in the upper 200 cm depth fromSebangau Peat Forest, Central Kalimantan (Modified from Page etal., 2004).
Page et al. (2004) reported high LOI and TOC values inthe upper 200 cm depth of peat from Sebangau peat forestin Central Kalimantan (see Fig. 7). The average values ofTOC and LOI from 0–200 cm depth in this peat forest are52% and 996 g kg−1, which are comparably close to TOCand LOI values in this study.
5 Conclusions
We found that drainage and the conversion of peat forestsinto agriculture, oil palm and industrial timber plantationcauses major changes of selected peat properties. In gen-eral, LOI and TOC values are constant in both peat forestsand converted peats. Peat pH, DBD, and TN sufficientlytend to increase. Consequently, C/N ratio in the convertedpeats is significantly lower than in the peat forest. We be-lieve that drainage largely influences an adequate increase ofDBD and peat pH. Peat compaction is a direct consequenceof drainage, and the removals of organic acids may substan-tially increase peat pH. An increase of TN concentrations inpeats used for oil palms and agriculture is a direct impactof fertilizer uses, and subsequently leads to significant re-duction of C/N ratio. We believe that increases in peat pH,DBD and TN concentration, and low C/N ratio (<20) in thedrained and converted peats in this study are important indi-cators that indicate some processes of peat degradation.
Further studies are required in order to fully assess tropicalpeat degradation. We suggest to measure and develop modelsof decomposition rates under various land uses covering peatforests and drained peats used for agricultures, oil palms,and industrial timber plantations. Direct measurements ofCarbon flux from these different land uses may improve ourunderstanding on Carbon balance in tropical peats. Eddy co-
variance and closed gas chamber techniques for measuringCO2 emissions from these peats are urgently required.
Acknowledgements.We sincerely thank you to friends, col-leagues, and students for giving their hands in this research. Tomention a few, we thank Eko Setiawan, M. Sahir, Mugi Utomo,Dedek Asmarahadi, Eta Fanani, Bambang Daha, Darmadi, Saad,Nasir, Darkono, and Andi Erman. A special thank is deservedto Delia Anshari who sustainably provides eminent cares andever-lasting supports. The field work could not be realized withoutassistance from local communities. This research is partiallyfunded by DIKTI (Contract Nos. 041/SP2H/PP/DP2M/III/2007;318/SP2H/DP2M/VI/2009; 168/SP2N/DP2m/PP/III/2010; and437/SP2N/PP/DP2M/XI/2010) and Fauna Flora International-Indonesia Programme (FFI-IP).
Edited by: T. Laurila
References
Agus, F. and Subiksa, I. G. M.: Lahan Gambut: Potensi untuk Per-tanian dan Aspek Lingkungan: Balai Penelitian Tanah dan WorldAgroforestry Centre, Bogor, 2008.
Andriesse, J. P.: Nature and Management of tropical peat soils, FAOSoils Bulletin No. 59, Soil Resources, Management and Con-servation Service, FAO Land and Water Development Division,Rome, 1988.
Anshari, G.: Peats from West Kalimantan Province, Indonesia: theDistribution, Formation, Disturbances, Utilization and Conser-vation, Proceedings of International Symposium on Earth Sci-ence and Technology 2009, 8–9 December, Nishijin Palace 2-10-1 Nishijin, Sawara-ku, Fukuoka, Japan, Organized by Coop-erative International Network for Earth Science and Technology(CINEST) and Global COE Program “Novel Carbon ResourceSciences”, Kyushu University, 21–26, 2009.
Anshari, G., Kershaw, A. P., van der Kaars, S., and Jacobsen, G.:Environmental change and peatland forest dynamics in the LakeSentarum area, West Kalimantan, Indonesia, J. Quaternary Sci.19(7), 637–656, 2004.
Anshari, G., Kershaw, A. P., and van der Kaars, S.: A LatePleistocene and Holocene pollen and charcoal record from peatswamp forest, Lake Sentarum Wildlife Reserve, West Kaliman-tan, Indonesia, Palaeogeogr. Palaeocl., 171, 213–228, 2001.
BPS Kalimantan Barat: Kalimantan Barat in Figures, Badan PusatStatistik, Pontianak, 2007.
Clymo, R. S.: Peat Growth, in: Quaternary Landscapes, edited by:Linda, C. K., Shane and Edward J. Cushing, University of Min-nesota Press, Minneapolis, 76–112, 1991.
Clymo, R. S.: The limits to peat bog growth, Phil. T. R. Soc. Lond.,303B, 605–654, 1984.
Diemont, H. and Supardi, S.: Forest peat in Indonesia on FormerSea Beds, IPS Symposium on tropical peatlands for develop-ment, Yogyakarta, 9–14 February, 1987.
Field, A: Discovering statistics using SPSS, 2nd Edn., Sage Publi-cations Ltd, London, 2005.
Heiri, O., Lotter, A. F., and Lemcke, G.: Loss on Ignition as aMethod for Estimating Organic and Carbonate Content in Sed-iments: Reproducibility and Comparability, J. Paleolimnol., 25,101–110, 2001.
Biogeosciences, 7, 3403–3419, 2010 www.biogeosciences.net/7/3403/2010/

G. Z. Anshari et al.: Drainage and land use impacts on changes in selected peat properties and peat degradation 3419
Hope, G., Chokkalingam, U., and Anwar, S.: The stratigraphy andfire history of the Kutai Peatlands, Kalimantan, Indonesia, Qua-ternary Res., 64, 407–417, 2005.
Hooijer, A., Page, S., Canadell, J. G., Silvius, M., Kwadijk, J.,Wosten, H., and Jauhiainen, J.: Current and future CO2 emis-sions from drained peatlands in Southeast Asia, Biogeosciences,7, 1505–1514, doi:10.5194/bg-7-1505-2010, 2010.
Jaenicke, J., Rieley, J. O., Mott, C., Kimman, P., and Siegert, F.:Determination of the amount of carbon stored in Indonesian peat-lands, Geoderma, 147, 151–158, 2008.
Li, W., Dickinson, R. E., Fu, R., Niu, G.-Y., Yang, Z.-L., andCanadell, J. G.: Future precipitation changes and their implica-tions for tropical peatlands, Geophys. Res. Lett., 34, L01403,doi:10.1029/2006GL028364, 2007.
Miettinen, J. and Liew, S. C.: Degradation and development ofpeatlands in Peninsular Malaysia and in the islands of Suma-tra and Borneo since 1990, Land Degrad. Dev., 21, 285–296,doi:10.1002/ldr.976, 2010.
Moore, P. D.: The Ecology Of Peat-Forming Processes: A Review,Int. J. Coal Geol., 12, 89–103, 1989.
Page, S. E., Wust, R. A. J., Weiss, D., Rieley, J. O., Shotyk, W., andLimin, S. H.: A record of Late Pleistocene and Holocene Carbonaccumulation and climate change from an equatorial peat bog(Kalimantan, Indonesia): Implications for past, present and fu-ture carbon dynamics, J. Quaternary Sci., 19(7), 625–636, 2004.
Ramsey, B. C.:https://c14.arch.ox.ac.uk/oxcal/OxCal.html, last ac-cess: 2 November 2010.
Rieley, J. O., Wust, R. A. J., Jauhiainen, J., Page, S. E., Wosten, H.,Hooijer, A., Siegert, F., Limin, S. H., Vasander, H., and Stahlhut,M.: Tropical peatlands: Carbon stores, Carbon gas emissions andcontribution to climate change processes, in: Peatlands and Cli-mate Change, edited by: Strack, M., International Peat Society(IPS), Finland, 148–181, 2008.
Satrio, A. E., Gandaseca, S., Ahmed, O. H., and Majid, M.: Ef-fect of Logging Operation on Soil Carbon Storage of a Tropi-cal Peat Swamp Forest, American Journal of Environmental Sci-ences, 5(6), 748–752, 2009.
Soil Survey Staff: Keys to soil taxonomy, 11th edn., USDA NaturalResources Conservation Service, Washington, DC, 2010.
SPSS Inc.: SPSS Statistics 17.0, New York, 2008.Takahashi, H.: Hydrological and Meteorological Environments of
Inland Peat Swamp Forest in Central Kalimantan, Indonesia withSpecial Reference to the Effects of Forest Fire, Tropics, 9(1), 17–25, 1999.
Wosten, J. H. M., Ismail, A. B., and van Wijk, A. L. M.: Peat sub-sidence and its practical implications: a case study in Malaysia,Geoderma 78, 25–36, 1997.
Wust, R. A. J. and Bustin, M. R.: Late Pleistocene and Holocenedevelopment of the interior peat-accumulating basin of tropicalTasek Bera, Peninsular Malaysia, Palaeogeogr. Palaeocl., 211(3–4), 241–270, 2004.
Wust, R. A. J., Jacobsen, G. E., van der Kaars, H., Smith, A. M.:Comparison of Radiocarbon Ages from Different Organic Frac-tions in Tropical Peat Cores: Insights from Kalimantan, Indone-sia, Radiocarbon, 3, 359–373, 2008.
www.biogeosciences.net/7/3403/2010/ Biogeosciences, 7, 3403–3419, 2010