drainage analysis appendix e - crw engineering group, … · design study report appendix e ‐...
TRANSCRIPT

Drainage Analysis
Appendix E


DesignStudyReport AppendixE‐DrainageFebruary2012
The existing and proposed storm drainage systems have been modeled with Bentley CivilStorm V8
computer modeling software. The peak stormwater discharge was determined for both conditions. The
EPA‐SWMM Runoff method was used to develop rain‐runoff response. Precipitation losses were
estimated using the Green and Ampt method, with soil parameters selected as suitable for the project
site conditions. As published in the MOA PM&E DCM, the SCS Type I, 10‐year, 24‐hour duration storm
distribution was modeled for peak discharge conveyance design. Additionally, peak storm water
discharge for the 2‐year, 6‐hour storm event was analyzed for storm water treatment purposes. Based
on the location of the project area, a 1.25 orographic factor has been applied to adjust the 1.77‐inch and
1.26‐inch base storm volumes for conveyance and water treatment design, respectively.
Municipality of Anchorage Drainage Design Guidelines March 2008
Page 6-2
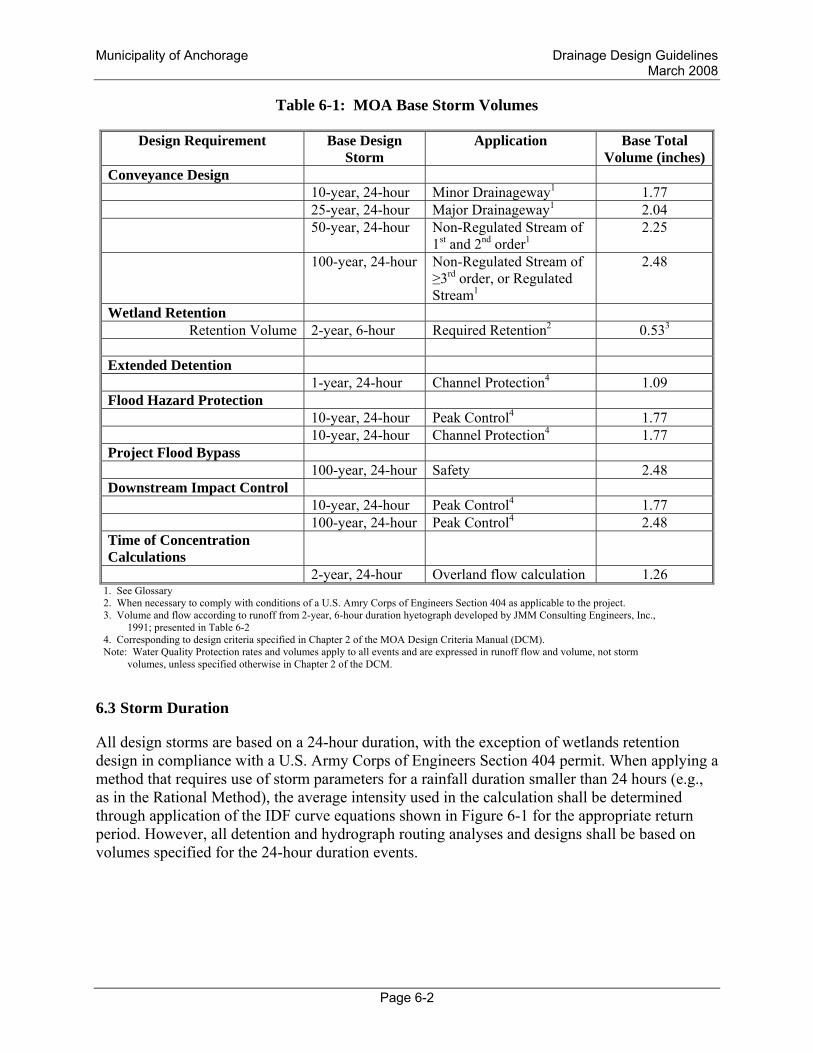
Table 6-1: MOA Base Storm Volumes
Design Requirement Base Design Storm
Application
Base Total Volume (inches)
Conveyance Design 10-year, 24-hour Minor Drainageway1 1.77 25-year, 24-hour Major Drainageway1 2.04 50-year, 24-hour Non-Regulated Stream of
1st and 2nd order1 2.25
100-year, 24-hour Non-Regulated Stream of ≥3rd order, or Regulated Stream1
2.48
Wetland Retention Retention Volume 2-year, 6-hour Required Retention2 0.533
Extended Detention
1-year, 24-hour Channel Protection4 1.09 Flood Hazard Protection 10-year, 24-hour Peak Control4 1.77 10-year, 24-hour Channel Protection4 1.77 Project Flood Bypass 100-year, 24-hour Safety 2.48 Downstream Impact Control 10-year, 24-hour Peak Control4 1.77 100-year, 24-hour Peak Control4 2.48 Time of Concentration Calculations
2-year, 24-hour Overland flow calculation 1.26 1. See Glossary 2. When necessary to comply with conditions of a U.S. Amry Corps of Engineers Section 404 as applicable to the project. 3. Volume and flow according to runoff from 2-year, 6-hour duration hyetograph developed by JMM Consulting Engineers, Inc.,
1991; presented in Table 6-2 4. Corresponding to design criteria specified in Chapter 2 of the MOA Design Criteria Manual (DCM). Note: Water Quality Protection rates and volumes apply to all events and are expressed in runoff flow and volume, not storm
volumes, unless specified otherwise in Chapter 2 of the DCM.
6.3 Storm Duration
All design storms are based on a 24-hour duration, with the exception of wetlands retention design in compliance with a U.S. Army Corps of Engineers Section 404 permit. When applying a method that requires use of storm parameters for a rainfall duration smaller than 24 hours (e.g., as in the Rational Method), the average intensity used in the calculation shall be determined through application of the IDF curve equations shown in Figure 6-1 for the appropriate return period. However, all detention and hydrograph routing analyses and designs shall be based on volumes specified for the 24-hour duration events.

Municipality of Anchorage Drainage Design Guidelines March 2008
Page 6-4
6.4 Storm Distribution
Design storms for MOA drainage applications have distributions based on either the 2-year, 6-hour design event (Table 6-2) or the SCS Type I, 24-hour duration storm distribution (Appendix D).
Table 6-2: MOA Water Quality Treatment/Wetland Retention Design Storm
2-year, 6-hour rainfall Time min. Precip. in. Time min. Precip. in. Time min. Precip. in.
5 0.004 125 0.007 245 0.007 10 0.004 130 0.007 250 0.006 15 0.004 135 0.007 255 0.006 20 0.004 140 0.008 260 0.006 25 0.004 145 0.008 265 0.006 30 0.005 150 0.009 270 0.006 35 0.005 155 0.009 275 0.006 40 0.005 160 0.010 280 0.005 45 0.005 165 0.011 285 0.005 50 0.005 170 0.013 290 0.005 55 0.005 175 0.015 295 0.005 60 0.005 180 0.062 300 0.005 65 0.005 185 0.016 305 0.005 70 0.005 190 0.015 310 0.005 75 0.005 195 0.014 315 0.005 80 0.005 200 0.011 320 0.005 85 0.005 205 0.010 325 0.005 90 0.006 210 0.009 330 0.005 95 0.006 215 0.009 335 0.005
100 0.006 220 0.008 340 0.004 105 0.006 225 0.008 345 0.004 110 0.006 230 0.007 350 0.004 115 0.006 235 0.007 355 0.004 120 0.007 240 0.007 360 0.004
Total volume: 0.53 inches From: JMM Consulting Engineers Inc, 1991
6.5 Storm Frequency
The frequency (return period) of a design storm is selected based on the purpose of the analysis as specified in the DCM.

Chapter 2 Drainage
MOA Project Management & Engineering 2-16 Design Criteria Manual March 2007
FIGURE 2-2 OROGRAPHIC FACTOR MAP (ANCHORAGE)
2.50

Storm Conveyance Design10-year, 1-year SCS Type 1 Storm Event Graph
SCS Type 1 Base Storm1 Factor2 Total1 year 1.09 1.25 1.3625
10 year 1.77 1.25 2.2125
Time Cumulative Total Rainfall Total Rainfall(hr) Fraction (in) (in/period) (in) (in/period)
0 0.000 0.00 0 0.00 02 0.035 0.05 0.05 0.08 0.084 0.076 0.10 0.06 0.17 0.096 0.125 0.17 0.07 0.28 0.117 0.156 0.21 0.04 0.35 0.078 0.194 0.26 0.05 0.43 0.08
8.5 0.219 0.30 0.03 0.48 0.069 0.254 0.35 0.05 0.56 0.08
9.5 0.303 0.41 0.07 0.67 0.119.75 0.362 0.49 0.08 0.80 0.1310 0.515 0.70 0.21 1.14 0.34
10.5 0.583 0.79 0.09 1.29 0.1511 0.624 0.85 0.06 1.38 0.09
11.5 0.654 0.89 0.04 1.45 0.0711.75 0.669 0.91 0.02 1.48 0.03
12 0.682 0.93 0.02 1.51 0.0312.5 0.706 0.96 0.03 1.56 0.0513 0.727 0.99 0.03 1.61 0.05
13.5 0.748 1.02 0.03 1.65 0.0514 0.767 1.05 0.03 1.70 0.0416 0.830 1.13 0.09 1.84 0.1420 0.926 1.26 0.13 2.05 0.2124 1.000 1.36 0.10 2.21 0.16
1 Table 6-2, Watershed Management Services Drainage Design Guidelines, March 20072 Figure 2-2, Municipality of Anchorage Design Criteria Manual, March 20073 Table 14.3.1 Applied Hydrology, Chow/Maidment/Mays, 1988
1 year 10 year
0.00
0.20
0.40
0.60
0.80
1.00
1.20
1.40
1.60
1.80
2.00
0 5 10 15 20
Rai
nfal
l (in
)
Time (hr)
1 year
10 year
Campbell Airstrip RoadMOA Project No. 10-028


LEGEND
13
24
5
6
7


Project Name: Campbell Airstrip Road
Project #: 10119
Description: Subcatchment Input Parameters (CivilStorm)
Prepared By: Erica Jensen
Date: 2/28/2012
Subcatchment Summary - Civil Storm Input Parameters, Existing Conditions
Subc
atch
men
t
Tota
l Are
a
Tc L
engt
hC
hara
cter
istic
W
idth
Impe
rvio
us
Dep
ress
ion
Stor
age
Perv
ious
D
epre
ssio
n St
orag
eIm
perv
ious
M
anni
ngs
nPe
rvio
us
Man
ning
s n
Perc
ent
Impe
rvio
us
Slop
e
Perc
ent
Impe
rvio
us
Zero
Sto
rage
Suba
rea
Rou
ting
Perc
ent R
oute
d Pe
rvio
us
Loss
Met
hod
Cap
illar
y Su
ctio
nH
ydra
ulic
C
ondu
ctiv
ity,
Ks
Moi
stur
e D
efic
it
UNIT AC ft ft in in n n % ft/ft % - % - in in/hr -
1 3.4 485 309 0.00 2.00 0.011 0.020 0.018 0.159 0.0 Outlet 100% Green and Ampt 9.8 2.46 0.31
2 3.5 631 242 0.00 2.00 0.011 0.020 0.018 0.170 0.0 Outlet 100% Green and Ampt 9.8 2.46 0.31
3 2.1 410 219 0.00 2.00 0.011 0.020 0.018 0.141 0.0 Outlet 100% Green and Ampt 9.8 2.46 0.31
4 2.9 552 230 0.00 2.00 0.011 0.020 0.018 0.200 0.0 Outlet 100% Green and Ampt 9.8 2.46 0.31
5 3.0 967 135 0.00 2.00 0.011 0.020 0.018 0.094 0.0 Outlet 100% Green and Ampt 9.8 2.46 0.31
6 10.1 943 465 0.00 2.00 0.011 0.020 0.018 0.090 0.0 Outlet 100% Green and Ampt 9.8 2.46 0.31
7 7.5 1078 304 0.00 2.00 0.011 0.020 0.018 0.063 0.0 Outlet 100% Green and Ampt 9.8 2.46 0.31
Subcatchment
Campbell Airstrip RoadMOA Project No. 10-028 March 2012
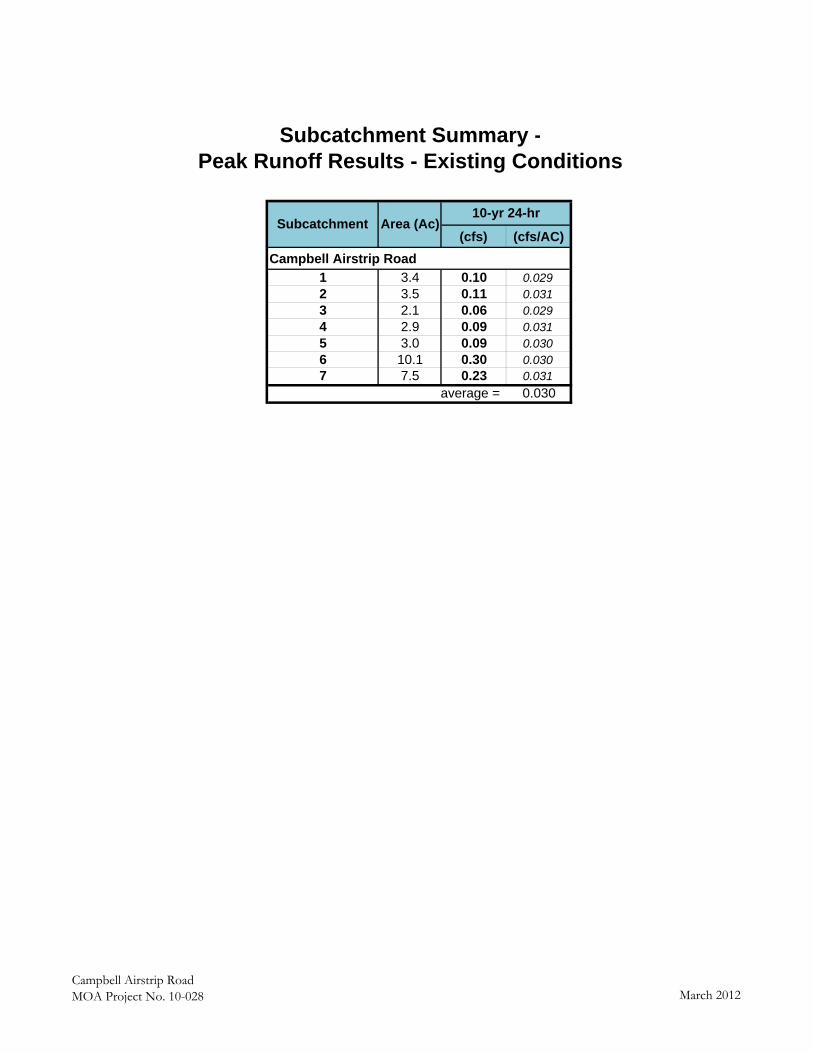
Subcatchment Summary -Peak Runoff Results - Existing Conditions
(cfs) (cfs/AC)Campbell Airstrip Road
1 3.4 0.10 0.0292 3.5 0.11 0.0313 2.1 0.06 0.0294 2.9 0.09 0.0315 3.0 0.09 0.0306 10.1 0.30 0.0307 7.5 0.23 0.031
average = 0.030
Subcatchment Area (Ac)10-yr 24-hr
Campbell Airstrip RoadMOA Project No. 10-028 March 2012

13
24
5
6
7
11
10
98
12
13
14
LEGEND


Project Name: Campbell Airstrip Road
Project #: 10119
Description: Subcatchment Input Parameters (CivilStorm)
Prepared By: Erica Jensen
Date: 2/28/2012
Subcatchment Summary - Civil Storm Input Parameters, Proposed Conditions
Subc
atch
men
t
Tota
l Are
a
Tc L
engt
hCh
arac
teris
tic
Wid
th
Impe
rvio
us
Depr
essi
on
Stor
age
Perv
ious
De
pres
sion
St
orag
eIm
perv
ious
M
anni
ngs
nPe
rvio
us
Man
ning
s n
Perc
ent
Impe
rvio
us
Slop
e
Perc
ent
Impe
rvio
us
Zero
Sto
rage
Suba
rea
Rout
ing
Perc
ent R
oute
d Pe
rvio
us
Loss
Met
hod
Capi
llary
Su
ctio
nHy
drau
lic
Cond
uctiv
ity,
Ks
Moi
stur
e D
efic
it
UNIT AC ft ft in in n n % ft/ft % - % - in in/hr -
1 3.4 485 309 0.00 2.01 0.011 0.020 0.02 0.159 0 Outlet 100% Green and Ampt 9.7 2.38 0.31
2 3.5 631 242 0.00 2.01 0.011 0.020 0.02 0.170 0 Outlet 100% Green and Ampt 9.7 2.38 0.31
3 2.1 410 219 0.00 2.00 0.011 0.020 0.02 0.141 0 Outlet 100% Green and Ampt 9.6 2.36 0.31
4 2.9 552 230 0.00 2.00 0.011 0.020 0.02 0.200 0 Outlet 100% Green and Ampt 9.6 2.36 0.31
5 3.0 967 135 0.00 2.00 0.011 0.020 0.02 0.094 0 Outlet 100% Green and Ampt 9.6 2.36 0.31
6 10.1 943 465 0.00 2.01 0.011 0.020 0.02 0.090 0 Outlet 100% Green and Ampt 9.7 2.38 0.31
7 7.5 1078 304 0.00 2.01 0.011 0.020 0.02 0.063 0 Outlet 100% Green and Ampt 9.7 2.38 0.31
8 0.3 107 124 0.00 1.45 0.011 0.026 0.21 0.086 0 Outlet 100% Green and Ampt 5.6 1.46 0.31
9 0.3 153 99 0.00 1.45 0.011 0.026 0.21 0.145 0 Outlet 100% Green and Ampt 5.6 1.46 0.31
10 0.7 310 105 0.00 1.45 0.011 0.026 0.21 0.109 0 Outlet 100% Green and Ampt 5.6 1.46 0.31
11 0.7 240 123 0.00 1.45 0.011 0.026 0.21 0.180 0 Outlet 100% Green and Ampt 5.6 1.46 0.31
12 0.5 194 116 0.00 1.45 0.011 0.026 0.21 0.329 0 Outlet 100% Green and Ampt 5.6 1.46 0.31
13 0.5 240 93 0.00 1.45 0.011 0.026 0.21 0.334 0 Outlet 100% Green and Ampt 5.6 1.46 0.31
14 0.2 117 73 0.00 1.45 0.011 0.026 0.21 0.315 0 Outlet 100% Green and Ampt 5.6 1.46 0.31
Subcatchment
Campbell Airstrip RoadMOA Project No. 10-028 March 2012

Subcatchment Summary - Peak Runoff Results - Proposed
(cfs) (cfs/AC) (cfs) (cfs/AC) (cfs) (cfs/AC) (cfs) (cfs/AC)Campbell Airstrip Road
1 3.4 0.07 0.03 0.11 0.03 0.01 0.00 0.08 0.022 3.5 0.07 0.03 0.12 0.03 0.01 0.00 0.08 0.023 2.1 0.04 0.03 0.07 0.03 0.01 0.00 0.05 0.024 2.9 0.06 0.03 0.10 0.03 0.01 0.00 0.07 0.025 3.0 0.06 0.03 0.10 0.03 0.01 0.00 0.07 0.026 10.1 0.21 0.03 0.34 0.03 0.04 0.00 0.24 0.027 7.5 0.15 0.03 0.25 0.03 0.03 0.00 0.18 0.028 0.3 0.06 0.36 0.11 0.36 0.01 0.03 0.08 0.269 0.3 0.06 0.32 0.11 0.32 0.01 0.03 0.08 0.2310 0.7 0.15 0.33 0.25 0.33 0.03 0.04 0.18 0.2411 0.7 0.15 0.37 0.25 0.37 0.03 0.04 0.18 0.2712 0.5 0.11 0.35 0.18 0.35 0.02 0.04 0.13 0.2513 0.5 0.11 0.35 0.18 0.35 0.02 0.04 0.13 0.2514 0.2 0.04 0.36 0.07 0.36 0.01 0.05 0.05 0.26
Minimum: 0.04 0.03 0.07 0.03 0.01 0.00 0.05 0.02Mean: 0.10 0.19 0.16 0.19 0.02 0.02 0.11 0.14
Max: 0.21 0.37 0.34 0.37 0.04 0.05 0.24 0.27
All Scenarios Max: 0.34
Subcatchment ID
Area (Acre)
Aug 1989 Storm10-yr 24-hr1-yr 24-hr 2-yr 24-hr
Campbell Airstrip RoadMOA Project No. 10-028 March 2012

Culvert Summary - Peak Pipe Flows - ProposedCulvert
ID1Diameter
(in)Manning's
n
Flow (Maximum)
(ft³/s)
Velocity (Maximum)
(ft/s)
Full Capacity
(ft³/s)
Pipe Surcharged?
Campbell Airstrip RoadCulv-1 24 0.02 0.11 1.60 15.21 NoCulv-2 24 0.02 0.11 1.55 15.98 NoCulv-3 24 0.02 0.09 1.19 29.48 NoCulv-4 24 0.02 0.07 1.22 18.12 NoCulv-5 24 0.02 0.10 1.41 40.00 NoCulv-6 24 0.02 0.33 1.89 14.83 NoCulv-7 24 0.02 0.25 1.86 22.83 NoCulv-8 24 0.01 0.28 2.60 46.80 NoCulv-9 24 0.02 0.21 2.23 27.39 No
Culv-10 24 0.02 0.19 1.92 48.99 NoCulv-11 24 0.02 0.30 2.64 36.44 NoCulv-12 24 0.02 0.16 1.82 40.39 NoCulv-13 24 0.02 0.55 4.09 41.65 NoCulv-14 24 0.02 0.41 2.52 21.49 No
1. Each culvert is located in the low spot of the drainage subcatchment of the same number.
Campbell Airstrip RoadMOA Project No. 10-028 March 2012