draft - wychavon
TRANSCRIPT
1
October 2019
DRAFT

2
Contents
1. The district ................................................................................................................3
1.1 At a glance ........................................................................................................................................... 4
2. People - Happy, healthy, active and supported .....................................................5
2.1 Population ............................................................................................................................................ 6
2.2 Population change ............................................................................................................................... 7
2.3 Ward populations ................................................................................................................................. 8
2.4 Life expectancy .................................................................................................................................... 9
2.5 Obesity ................................................................................................................................................. 10
2.6 Other health issues and fast food outlets ............................................................................................ 11
2.7 Older people and sport and physical activity ...................................................................................... 12
2.8 Personal wellbeing ............................................................................................................................... 13
2.9 Poverty ................................................................................................................................................. 14
2.10 Deprivation ........................................................................................................................................... 15
2.11 Mosaic profile ....................................................................................................................................... 17
3. Place - Green, clean and safe with quality, affordable homes .............................19
3.1 Satisfaction and quality of life .............................................................................................................. 20
3.2 Energy consumption ............................................................................................................................ 21
3.3 Renewable electricity and carbon emissions……………………………………………………………….22
3.4 Waste ................................................................................................................................................... 23
3.5 Crime and community safety ............................................................................................................... 24
3.6 House prices ....................................................................................................................................... 26
3.7 Affordable housing and Sports facilities…………………………………………………………………….28
4. Prosperity - Vibrant communities with quality jobs and skills .............................29
4.1 Businesses and jobs ............................................................................................................................ 30
4.2 Active enterprises an UK Competitiveness Index ................................................................................ 31
4.3 Employment and out of work benefits .................................................................................................. 32
4.4 Earnings ............................................................................................................................................... 33
4.5 Social mobility and travel times ........................................................................................................... 34
4.6 Tourism…………………………………………………………………………………………………………35
3
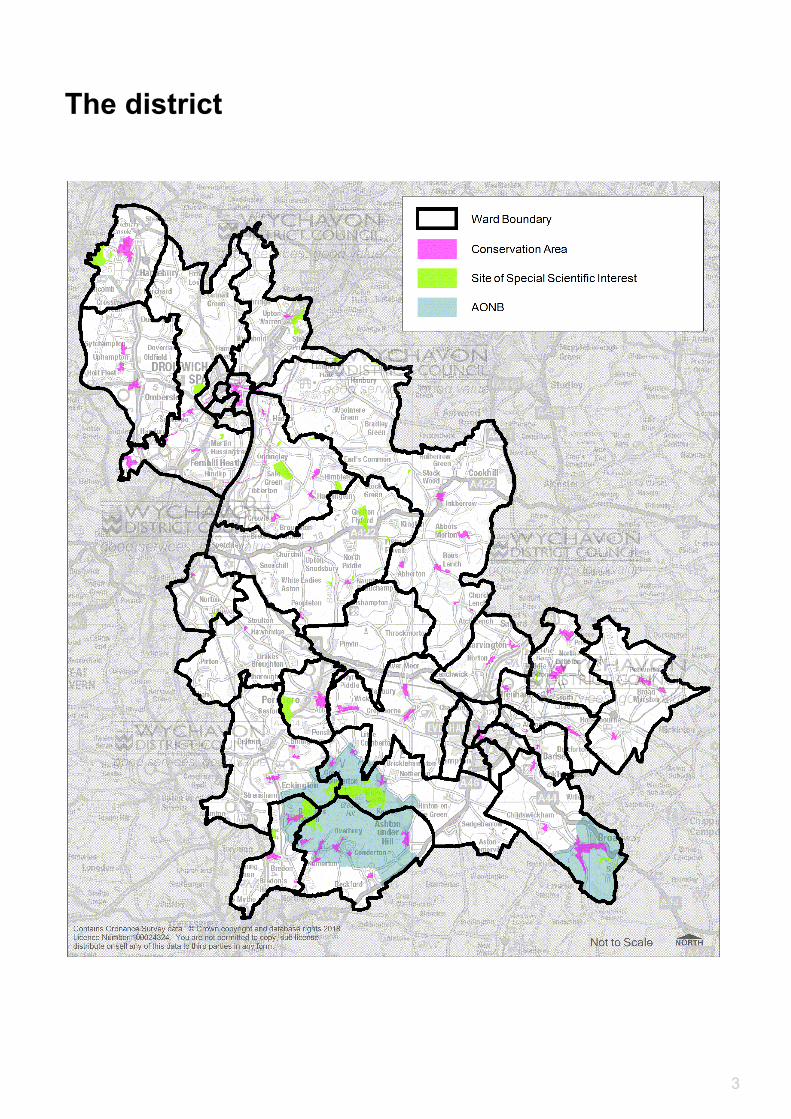
The district
4

5
6
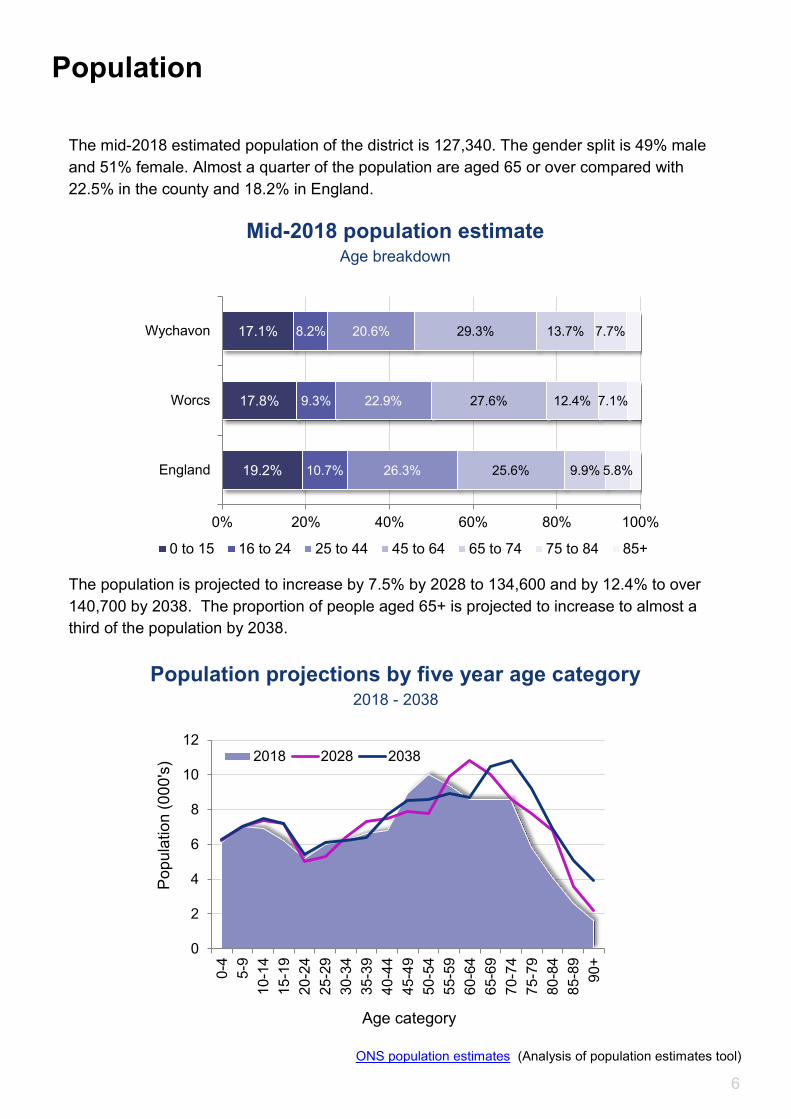
The mid-2018 estimated population of the district is 127,340. The gender split is 49% male
and 51% female. Almost a quarter of the population are aged 65 or over compared with
22.5% in the county and 18.2% in England.
The population is projected to increase by 7.5% by 2028 to 134,600 and by 12.4% to over
140,700 by 2038. The proportion of people aged 65+ is projected to increase to almost a
third of the population by 2038.
Mid-2018 population estimate Age breakdown
Population projections by five year age category 2018 - 2038
Population
ONS population estimates (Analysis of population estimates tool)
0
2
4
6
8
10
12
0-4
5-9
10-1
4
15-1
9
20-2
4
25-2
9
30-3
4
35-3
9
40-4
4
45-4
9
50-5
4
55-5
9
60-6
4
65-6
9
70-7
4
75-7
9
80-8
4
85-8
9
90
+
Po
pu
latio
n (
00
0's
)
Age category
2018 2028 2038
17.1%
17.8%
19.2%
8.2%
9.3%
10.7%
20.6%
22.9%
26.3%
29.3%
27.6%
25.6%
13.7%
12.4%
9.9%
7.7%
7.1%
5.8%
0% 20% 40% 60% 80% 100%
Wychavon
Worcs
England
0 to 15 16 to 24 25 to 44 45 to 64 65 to 74 75 to 84 85+

7
Just 2.1% of the district’s residents are from a Black and Ethnic Minority (BME) background. 91% of residents were born in England and a further 3.4% in the rest of the UK. The next largest proportion (2.9%) were born in other EU countries.
Yearly change in population estimates
Ethnicity of Wychavon residents
Population change
The overall population of the district has increased in each of the last of the last five years although the natural change has seen decreases in the last two. In 2017, internal migration fell slightly from the previous year but was higher than the three years prior to that. Levels of inter-national migration have fallen in each of the last two years.
White British 93.9%
0.5%0.4%
3.1%
0.8%
1.0%
Other 6.1%
White; British White; Irish
White; Gypsy or Irish Traveller White; Other White
Mixed/Multiple ethnic groups Asian/Asian British
Black/African/Caribbean/Black British Other Ethnic Group
ONS population estimates (Analysis of population estimates tool)
Census 2011 (Table KS201EW)
-500
0
500
1,000
1,500
2,000
2,500
2013 2014 2015 2016 2017
International migration
Internal migration
Natural change
Overall population change
8
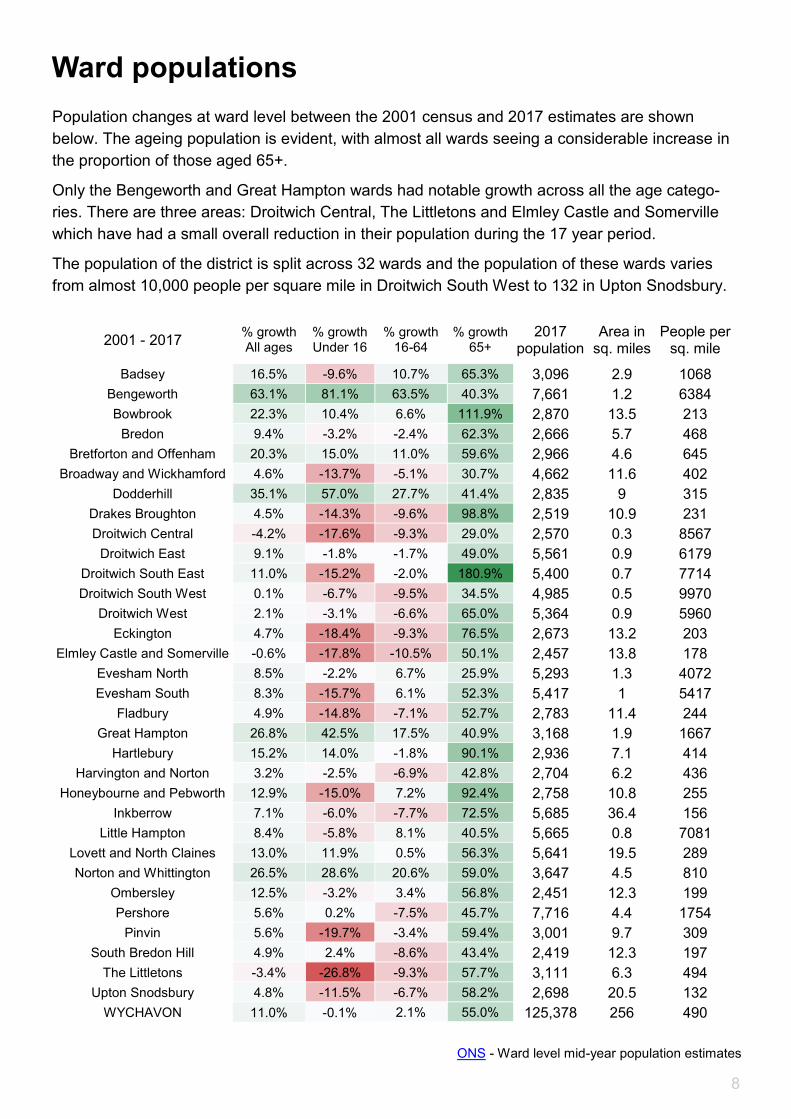
Ward populations
Population changes at ward level between the 2001 census and 2017 estimates are shown
below. The ageing population is evident, with almost all wards seeing a considerable increase in
the proportion of those aged 65+.
Only the Bengeworth and Great Hampton wards had notable growth across all the age catego-
ries. There are three areas: Droitwich Central, The Littletons and Elmley Castle and Somerville
which have had a small overall reduction in their population during the 17 year period.
The population of the district is split across 32 wards and the population of these wards varies
from almost 10,000 people per square mile in Droitwich South West to 132 in Upton Snodsbury.
2001 - 2017 % growth All ages
% growth Under 16
% growth 16-64
% growth 65+
2017 population
Area in sq. miles
People per sq. mile
Badsey 16.5% -9.6% 10.7% 65.3% 3,096 2.9 1068
Bengeworth 63.1% 81.1% 63.5% 40.3% 7,661 1.2 6384
Bowbrook 22.3% 10.4% 6.6% 111.9% 2,870 13.5 213
Bredon 9.4% -3.2% -2.4% 62.3% 2,666 5.7 468
Bretforton and Offenham 20.3% 15.0% 11.0% 59.6% 2,966 4.6 645
Broadway and Wickhamford 4.6% -13.7% -5.1% 30.7% 4,662 11.6 402
Dodderhill 35.1% 57.0% 27.7% 41.4% 2,835 9 315
Drakes Broughton 4.5% -14.3% -9.6% 98.8% 2,519 10.9 231
Droitwich Central -4.2% -17.6% -9.3% 29.0% 2,570 0.3 8567
Droitwich East 9.1% -1.8% -1.7% 49.0% 5,561 0.9 6179
Droitwich South East 11.0% -15.2% -2.0% 180.9% 5,400 0.7 7714
Droitwich South West 0.1% -6.7% -9.5% 34.5% 4,985 0.5 9970
Droitwich West 2.1% -3.1% -6.6% 65.0% 5,364 0.9 5960
Eckington 4.7% -18.4% -9.3% 76.5% 2,673 13.2 203
Elmley Castle and Somerville -0.6% -17.8% -10.5% 50.1% 2,457 13.8 178
Evesham North 8.5% -2.2% 6.7% 25.9% 5,293 1.3 4072
Evesham South 8.3% -15.7% 6.1% 52.3% 5,417 1 5417
Fladbury 4.9% -14.8% -7.1% 52.7% 2,783 11.4 244
Great Hampton 26.8% 42.5% 17.5% 40.9% 3,168 1.9 1667
Hartlebury 15.2% 14.0% -1.8% 90.1% 2,936 7.1 414
Harvington and Norton 3.2% -2.5% -6.9% 42.8% 2,704 6.2 436
Honeybourne and Pebworth 12.9% -15.0% 7.2% 92.4% 2,758 10.8 255
Inkberrow 7.1% -6.0% -7.7% 72.5% 5,685 36.4 156
Little Hampton 8.4% -5.8% 8.1% 40.5% 5,665 0.8 7081
Lovett and North Claines 13.0% 11.9% 0.5% 56.3% 5,641 19.5 289
Norton and Whittington 26.5% 28.6% 20.6% 59.0% 3,647 4.5 810
Ombersley 12.5% -3.2% 3.4% 56.8% 2,451 12.3 199
Pershore 5.6% 0.2% -7.5% 45.7% 7,716 4.4 1754
Pinvin 5.6% -19.7% -3.4% 59.4% 3,001 9.7 309
South Bredon Hill 4.9% 2.4% -8.6% 43.4% 2,419 12.3 197
The Littletons -3.4% -26.8% -9.3% 57.7% 3,111 6.3 494
Upton Snodsbury 4.8% -11.5% -6.7% 58.2% 2,698 20.5 132
WYCHAVON 11.0% -0.1% 2.1% 55.0% 125,378 256 490
ONS - Ward level mid-year population estimates

9
Life expectancy at birth (male) 2015-17
Life expectancy at birth (female) 2015-17
Life expectancy
Life expectancy at birth for Wychavon residents is 81 years for males and 85.4 years for females. These are the highest of the Worcestershire districts and higher than the county and national averages. Life expectancies in Wychavon are consistently around 1.5 years higher than England average for males and around two years longer for females.
Inequality in life expectancy Difference between most and least deprived areas
Although the life expectancy figures for Wychavon are high, the gap in life expectancy for people
in the most deprived wards compared with those in the least deprived wards is 7.5 years for
males and 6.7 years for females.
Public health profiles
Worcs
England
77
78
79
80
81
82
Bro
msg
rove
Ma
lve
rnH
ills
Re
dd
itch
Wo
rce
ste
r
Wycha
vo
n
Wyre
Fore
st
Ag
e in
ye
ars
Worcs
England
77
78
79
80
81
82
Bro
msg
rove
Ma
lve
rnH
ills
Re
dd
itch
Worc
este
r
Wych
avo
n
Wyre
Fore
st
Ag
e in
ye
ars
7.8 8
7.5 7.67.1
5.1
7.1
8.5
6.5 6.5
2
3
4
5
6
7
8
9
2011-13 2012-14 2013-15 2014-16 2015-17
Male
Female

10
Reception year: Prevalence of overweight (including obese)
2017/18
Year 6: Prevalence of overweight (including obese)
2017/18
Adult
Public health profiles (National Child Measurement Programme)
22.7% of children in reception year are classified as overweight or obese , which now in line with the county (22.4%), regional (23.4%) and national (22.4%) averages. This is considered similar to the national average for the first time in five years. When children reach year six in Wychavon, the chance of them being overweight moves below that of the wider areas. The coloured dots in the charts below represent a comparison with England where red is worse, amber similar and green and figures for this measure have remained similar for a number of years.
Worcs
England
52%
54%
56%
58%
60%
62%
64%
66%
68%
Bro
msgro
ve
Ma
lvern
Hill
s
Re
dditch
Worc
este
r
Wycha
vo
n
Wyre
Fore
st
Child
At 65.3% the estimated proportion of adults who are overweight or obese in Wychavon is higher than the county (62%) and the England (61.3%) averages.
Percentage of adults (aged 18+) classified
as overweight or obese 2016/17
Public health profiles
(Sport England—Active lives survey)
15
20
25
30
2012/13 2013/14 2014/15 2015/16 2016/17 2017/18
Wychavon Worcs
West Mids England
20
25
30
35
40
2012/13 2013/14 2014/15 2015/16 2016/17 2017/18
Wychavon Worcs
West Mids England
Obesity

11
Other health issues
Admission episodes for alcohol
related conditions (Narrow) Over 65s
The following areas are highlighted in the public health profile for Wychavon as being worse than the national average. The number of people killed or seriously injured on the districts roads has risen to 47.5 per 100,000 people which has remained above the county, regional and national averages and is now classified as worse.
The number of people aged over 65 admitted to hospital for alcohol related conditions is higher than the county and national average but remains below the regional average at 1,159 per 100,000 admissions.
Public health profiles
Levels of dementia diagnosis have remained significantly below the county and national levels for the second consecutive year. The 2018 figure of 51% is the lowest of all the West Midlands authorities and refers to the percentage of people aged 65+ who have been diagnosed with dementia from all those estimated to have dementia given the characteristics of the population.
0
200
400
600
800
1000
1200
1400
2012/13 2013/14 2014/15 2015/16 2016/17
pe
r 1
00
,00
0
Wychavon Worcs
West Mids England
Dementia diagnosis
30
35
40
45
50
55
60
65
70
2017 2018
%
Wychavon Worcs
West Mids England
0
5
10
15
20
25
30
35
40
45
50
2010-12 2011-13 2012-14 2013-15 2014-16
per
1,0
00
Wychavon Worcs
West Mids England
Number of people killed or seriously
injured on roads per 100,000 population
Fast food outlets
There are 75 fast food outlets in the district which is a rate of 60.9 per 100,000 people. This is the lowest in Worcestershire and the 40th lowest rate out of 325 local authority areas.
Gov.uk - Fast food outlets—density by local authority

12
Percentage of physically inactive adults 2017/18
Sport and physical activity
Sport England active lives
In Wychavon, 24.7% of people aged 16+ were classed as inactive in 2017/18 which meant that they did less than 30 minutes of activity with moderate intensity per week. This was a decrease from 28.5% in 2016/17 and is now broadly in line with the Worcestershire average.
738610828
6008
9555
0
5000
10000
15000
20000
25000
2017 2020 2025 2030 2035
65+ limited a lot
65+ limited a little
4180 5010
6615
11202
0
2000
4000
6000
8000
10000
12000
14000
16000
18000
2017 2020 2025 2030 2035
75+
65-74
Limiting long term illness Living alone
Falls Dementia
1763 2101
19072290
125018021303
21171763
3784
0
2000
4000
6000
8000
10000
12000
14000
2017 2020 2025 2030 2035
85+ 80-84 75-79
70-74 65-69
222 266315 454473
768500
1045477
1035
0
500
1000
1500
2000
2500
3000
3500
4000
2017 2020 2025 2030 2035
90+ 85+
80-84 75-79
70-74 65-69
Projecting Older People Population Information (POPPI) provide projected numbers of older
people by age category likely to be impacted by a variety of health conditions and the charts
below show projections from 2017 to 2035. Levels of dementia sufferers are set to more than
double overall and there is expected to be more than 5000 more people in the district aged 65+
who will be living alone and 4000 more who are predicted to have fallen at least once in the last
twelve months.
POPPI
Worcs
England
15%
20%
25%
30%
Bro
msg
rove
Ma
lve
rnH
ills
Re
dd
itch
Wo
rce
ste
r
Wych
avo
n
Wyre
Fo
rest
Older people

13
Life satisfaction Worthwhile
Happiness Anxiety
Personal wellbeing
Personal wellbeing in Wychavon
The annual population survey assesses people’s personal wellbeing by looking at four areas: life satisfaction, happiness, anxiety and whether the things in a person’s life are worthwhile. These are rated on a scale from 0 to 10 where 0 is not at all and 10 is completely. The charts below are for the 2017/18 data and show that Wychavon residents are some of the most satisfied, happiest and least anxious in Worcestershire.
Although there has been a slight decline in the most recent figures, all of the measures improved between 2011/12 and 2015/16.
Personal Wellbeing 2017/18 local authority update
Worcs
England
7.0
7.2
7.4
7.6
7.8
8.0
8.2
Bro
msg
rove
Ma
lvern
Hill
s
Re
dditch
Wo
rce
ste
r
Wych
avo
n
Wyre
Fo
rest
Worcs
England
7.0
7.2
7.4
7.6
7.8
8.0
8.2
Bro
msg
rove
Ma
lve
rn H
ills
Re
dditch
Wo
rce
ste
r
Wych
avo
n
Wyre
Fo
rest
Worcs
England
7.0
7.2
7.4
7.6
7.8
8.0
Bro
msg
rove
Ma
lve
rn H
ills
Re
dditch
Wo
rce
ste
r
Wych
avo
n
Wyre
Fore
st
Worcs
England
1.0
1.5
2.0
2.5
3.0
3.5
Bro
msg
rove
Ma
lve
rn H
ills
Re
dditch
Wo
rce
ste
r
Wych
avo
n
Wyre
Fo
rest
2.0
2.1
2.2
2.3
2.4
2.5
2.6
2.7
6.8
7.0
7.2
7.4
7.6
7.8
8.0
8.2
8.4
20
12/1
3
20
13/1
4
20
14/1
5
20
15/1
6
20
16/1
7
20
17/1
8
An
xie
ty -
wh
ere
'1
0' is
co
mp
lete
ly a
nxio
us
Wh
ere
10 is c
om
ple
tely
sa
tisfie
d/w
ort
hw
hile
/ha
pp
y
Life satisfaction
Worthwhile
Happiness
Anxiety

14
Poverty
Child poverty
0%
5%
10%
15%
20%
25%
30%
Bro
msg
rove
Ma
lvern
Hill
s
Re
dditch
Wo
rce
ste
r
Wych
avo
n
Wyre
Fo
rest
Before housing costs After housing costs
Fuel poverty
The Campaign to End Child Poverty estimates that 30% of children are living in poverty in the UK, this is one of the highest rates in the industrialised world. They estimate child poverty both before housing costs and after housing costs.
In Wychavon, child poverty after housing costs affected around 19% of children in 2017. This is the second lowest of the districts in Worcestershire but has risen from 17% in 2013.
Fuel poverty in England is currently monitored using the Low Income High Cost Indicator (LIHC). Under the LIHC definition, a household is considered to be fuel poor if: They have required fuel costs that are above average (the national median level) Were they to spend that amount, they would be left with a residual income below the official
poverty line.
In 2017, 4,940 households (9.5%) in Wychavon were fuel poor; this has fallen from 12.7% in 2015. This is below the Worcestershire (10.2%) and national (10.9%) averages. Fuel poverty at local level uses lower super output areas (LSOAs) which are small areas covering around 1,500 residents on average. The LSOAs with the highest proportion of fuel poor households in Wychavon are located are in South Bredon Hill (14.7%), Inkberrow, Upton Snodsbury, Droitwich West, Harvington and Norton and Evesham North ( all between 12.5 and 12.9%).
Children in poverty
Fuel poverty in Worcestershire
endchildpoverty.org.uk — poverty in your area
Gov.uk Sub-regional fuel poverty data 2019
WorcsEngland
0
2
4
6
8
10
12
14
Bro
msgro
ve
Malv
ern
Hill
s
Redditch
Worc
este
r
Wychavon
Wyre
Fore
st
15
Income
Employment
Education
HealthCrime
Barriers tohousing and…
Livingenvironment
2015 rank
2010 rank
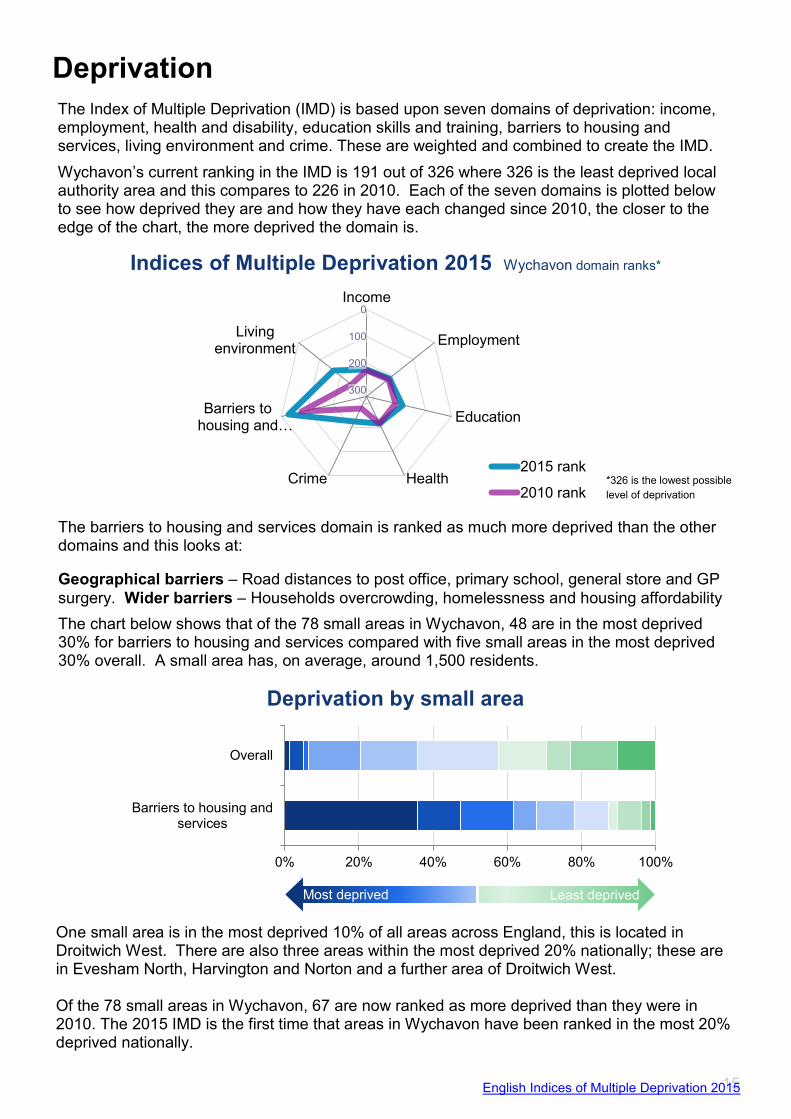
The Index of Multiple Deprivation (IMD) is based upon seven domains of deprivation: income, employment, health and disability, education skills and training, barriers to housing and services, living environment and crime. These are weighted and combined to create the IMD.
Wychavon’s current ranking in the IMD is 191 out of 326 where 326 is the least deprived local authority area and this compares to 226 in 2010. Each of the seven domains is plotted below to see how deprived they are and how they have each changed since 2010, the closer to the edge of the chart, the more deprived the domain is.
Deprivation
The barriers to housing and services domain is ranked as much more deprived than the other domains and this looks at:
Geographical barriers – Road distances to post office, primary school, general store and GP
surgery. Wider barriers – Households overcrowding, homelessness and housing affordability
The chart below shows that of the 78 small areas in Wychavon, 48 are in the most deprived 30% for barriers to housing and services compared with five small areas in the most deprived 30% overall. A small area has, on average, around 1,500 residents.
One small area is in the most deprived 10% of all areas across England, this is located in Droitwich West. There are also three areas within the most deprived 20% nationally; these are in Evesham North, Harvington and Norton and a further area of Droitwich West. Of the 78 small areas in Wychavon, 67 are now ranked as more deprived than they were in 2010. The 2015 IMD is the first time that areas in Wychavon have been ranked in the most 20% deprived nationally.
0% 20% 40% 60% 80% 100%
Overall
Barriers to housing andservices
Most deprived Least deprived
Deprivation by small area
Indices of Multiple Deprivation 2015 Wychavon domain ranks*
*326 is the lowest possible
level of deprivation
English Indices of Multiple Deprivation 2015

16
Deprivation The map below shows the overall deprivation decile that each small area falls into, with red being
the most deprived decile.
Most deprived Least deprived
English Indices of Multiple Deprivation 2015

17
MOSAIC
Group
code Group description
Number of
households %
A Country Living 14,621 26.77
G Rural Reality 8,680 15.89
B Prestige Positions 5,251 9.61
H Aspiring Homemakers 4,631 8.48
D Domestic Success 3,931 7.2
F Senior Security 3,295 6.03
N Vintage Value 2,963 5.42
E Suburban Stability 2,744 5.02
K Modest Traditions 2,579 4.72
L Transient Renters 2,401 4.4
M Family Basics 2,041 3.74
J Rental Hubs 1,042 1.91
O Municipal Challenge 424 0.78
I Urban Cohesion 22 0.04
TOTAL 54,625 100
MOSAIC is Experian’s cross-channel consumer classification designed to help understand the demographics, lifestyles, preferences and behaviours of the UK adult population in detail. It classifies all consumers in the UK by allocating them to one of 15 groups and 66 types. 72% of the information used to build Mosaic Public Sector is sourced from a combination of data that includes the consumer view database, which provides consumer demographic information for the UK’s adults and households. The remainder is sourced from the 2011 Census. Over 50% of Wychavon households fall into just three groups: A, G and B. The proportion of each group and the key features of these top three are shown in the table below.
Proportion of household groups in Wychavon
Key features of the top three groups in Wychavon
MOSAIC
group A: Country Living G: Rural Reality B: Prestige Positions
Rural locations Rural locations High value detached homes
Key
features
Well-off homeowners Village and outlying houses Married couples
Attractive detached homes Agricultural employment Managerial and senior positions
Higher self-employment Most are homeowners Supporting older children
High car ownership Affordable value homes High assets and investments
High use of internet Slow internet speeds Online shopping and banking
Channel
preference
Prefer not to be contacted Prefer not to be contacted Email
Post Email Post
Email Post Prefer not to be contacted

18
MOSAIC
Mosaic type Households Key features Channel
preference
A03: Wealthy Landowners
6,801 12.5%
High value large detached homes 1. Prefer no contact
Rural locations 2. Post
Own several cars 3. Email
Most likely to own a horse 4. Landline
Mature married couples 5. SMS
Own both PCs and laptops 6. Mobile call
A04: Village retirement
6,294 11.5%
Retired couples and singles 1. Post
Larger village location 2. Prefer no contact
Likely to be self sufficient 3. Email
Enjoy UK holidays 4. Landline
Most likely to play cricket and golf 5. SMS
Often prefer post for communication 6. Mobile call
G29: Satellite Settlers
4,734 8.7%
Mature households 1. Email
Larger villages 2. Prefer no contact
Close to transport links 3. SMS
Own pleasant homes 4. Post
Online groceries 5. Mobile call
Try to reduce water used at home 6. Landline
G28: Local Focus
2,163 4.0%
Rural families 1. Landline
Rent or own affordable homes 2. Email
Skilled trades 3. Post
Long distance from towns and cities 4. Prefer no contact
Shop locally 5. Mobile call
Online gaming 5. SMS
F24: Bungalow Haven
2,099 3.8%
Elderly couples and singles 1. Post
Own their property outright 2. Landline
Neighbourhoods of elderly people 2. Prefer no contact
May research online 4. Email
Like buying in store 5. Mobile call
Pre-pay mobiles, low spend 6. SMS
D16: Mid-career Convention
1,961 3.8%
Married couples with children 1. Email
Traditional suburbs 2. Prefer no contact
Professional jobs 3. SMS
Likely to have life cover 4. Post
High proportion with mortgage 5. Mobile call
Online grocery shopping 6. Landline
Within each group description there are four to six household types. For example, within the Country Living (Group A) there is Rural Vogue (A01), Scattered Homesteads (A02), Wealthy Landowners (A03), and Village Retirement (A04). The types within each group have a further more defined description, which provides key features and preferences. The top six types within Wychavon are detailed below:

19

20
Satisfaction with the local area as a place to live
Every year since 2009 Wychavon residents have been invited to complete an annual survey to enable the council to gather their views and opinions. In the 2018 survey, satisfaction with the local area remained high at 84% and was the second highest of the Worcestershire districts.
0% 20% 40% 60% 80% 100%
Wychavon
Bromsgrove
Malvern Hills
Redditch
Worcester City
Wyre Forest
Very satisfied Fairly satisfied
Neither satisfied nor dissatisfied Fairly dissatisfied
Very dissatisfied
The level of traffic congestion
Road and pavement repairs
Health services
Public transport
Activities for teenagers
0
1
2
3
4
5
6
7
8
9
10
Jun2018
Jun2017
May2016
May2015
May2014
Nov2013
Most
needs im
pro
vin
g
Top five things that need improving
Satisfaction
Respondents are asked to choose the things that they feel most need improving in the district and the chart below shows that traffic congestion has become an increasing area for concern over the last few years, climbing from sixth most in need of improving to the most important. Health services have also risen notably in people’s priorities, climbing from ninth most in need of improvement in 2013 to third in 2018.
The district is one of the top 20 places to live in the UK, according to the Halifax Quality of Life
Survey 2018 and the top in the West Midlands. The survey ranks key local indicators covering:
the labour market, the housing market, the environment, education, health, and personal well-
being. Halifax also produce a rural areas quality of life survey where Wychavon ranks third na-
tionally and a children's quality of life survey where Wychavon ranks the 17th best place to bring
up children nationally.
Quality of life
Worcestershire
Viewpoint
Halifax Quality of Life Surveys - Overall, Rural, Childrens

21
2017 was the first year since 2012 that domestic levels energy consumption have fallen in Wychavon with a slight rise from 17,177 kWh in 2016 to 17,333 kWh. Gas accounts for 74.8% of the total.
Domestic consumption levels are the second highest in Worcestershire for electricity and the third highest for gas.
Energy consumption
Figures for non-domestic energy consumption are the same for 2017 as for 2016 after previous falls and the average consumption per meter was 1,203 mWh. Consumption in Wychavon is considerably greater than in the rest of Worcestershire with gas levels around three or four times higher than the other districts.
Average domestic energy
consumption (kWh) Domestic energy
consumption 2017
Average non-domestic energy
consumption (kWh) Non-domestic energy
consumption 2017
Gov.uk Sub-national electricity and gas consumption statistics: analysis tool
11500
12000
12500
13000
13500
14000
14500
15000
4100
4200
4300
4400
4500
4600
4700
4800
4900
5000
20102011201220132014201520162017
Gas (
kW
h p
er
mete
r)
Ele
ctr
icity
(kW
h)
per
mete
r Electricity
Gas
0 5000 10000 15000 20000
Bromsgrove
Malvern Hills
Redditch
Worcester
Wychavon
Wyre Forest
Average consumption per meter (kWh)
Electricity
Gas
950
1000
1050
1100
1150
1200
1250
64
66
68
70
72
74
76
78
80
82
84
86
20102011201220132014201520162017
Gas (
mW
h)
per
mete
r)
Ele
ctr
icity
(mW
h)
per
mete
r
Electricity
Gas
0 500 1000 1500
Bromsgrove
Malvern Hills
Redditch
Worcester
Wychavon
Wyre Forest
Average consumption per meter (kWh)
Electricity
Gas
22
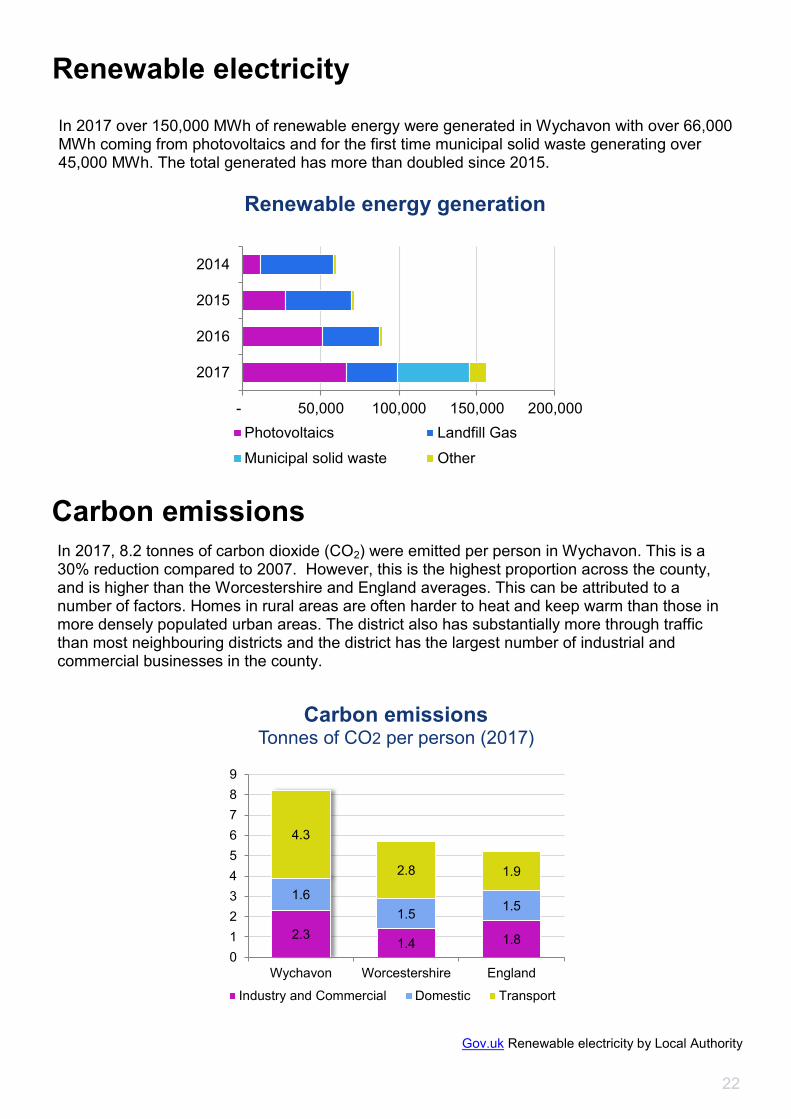
Renewable electricity
In 2017 over 150,000 MWh of renewable energy were generated in Wychavon with over 66,000 MWh coming from photovoltaics and for the first time municipal solid waste generating over 45,000 MWh. The total generated has more than doubled since 2015.
Renewable energy generation
Carbon emissions Tonnes of CO2 per person (2017)
In 2017, 8.2 tonnes of carbon dioxide (CO2) were emitted per person in Wychavon. This is a 30% reduction compared to 2007. However, this is the highest proportion across the county, and is higher than the Worcestershire and England averages. This can be attributed to a number of factors. Homes in rural areas are often harder to heat and keep warm than those in more densely populated urban areas. The district also has substantially more through traffic than most neighbouring districts and the district has the largest number of industrial and commercial businesses in the county.
Carbon emissions
- 50,000 100,000 150,000 200,000
2014
2015
2016
2017
Photovoltaics Landfill Gas
Municipal solid waste Other
Gov.uk Renewable electricity by Local Authority
2.31.4 1.8
1.6
1.51.5
4.3
2.8 1.9
0
1
2
3
4
5
6
7
8
9
Wychavon Worcestershire England
Industry and Commercial Domestic Transport

23
Waste
Proportion of household waste
recycled 2017/18
Just under 44% of household waste collected in 2017/18 was sent for recycling/composting/reuse which was the second highest of the Worcestershire districts and above the England average. This percentage has remained very similar for each of the last three years in Wychavon, during the same period, the West Midlands has seen a notable decline.
Household waste recycled 2012/13 - 2017/18
Fly tipping incidents
Recycling
Fly tipping
There were 614 reported fly tipping incidents in the district during 2017/18, a return to the levels of previous years after a sharp rise in 2016/17. Incidents on the highway are at their lowest level of the last five years but those on footpaths/bridleways, council land and ‘other’ remain higher than in previous years.
WestMidlands
England
0
5
10
15
20
25
30
35
40
45
50
Bro
msg
rove
Ma
lvern
Hill
s
Re
dditch
Wo
rce
ste
r
Wych
avo
n
Wyre
Fo
rest
%
38%
39%
40%
41%
42%
43%
44%
45%
46%
Wychavon
WestMidlands
England
0
100
200
300
400
500
600
700
800
900
2013-14 2014-15 2015-16 2016-17 2017-18
Other
Private / ResidentialIncidents
Council LandIncidents
Footpath / BridlewayIncidents
Highway
Gov.uk Local authority collected waste
Gov.uk Fly tipping incidents and actions
Other district figures?

24
Crime There were 7,534 crimes in Wychavon during 2018 which equates to 60.1 per 1,000 residents. There has been an overall rise in crime from 7,046 in 2017. Crime types that have increased during this time include burglary, shoplifting and violence and sexual offences.
The ward with most crimes per 1,00 residents was Bengeworth 320.4 and the ward with the least was Bredon 19.4.
There were 3,449 anti-social behaviour (ASB) incidents in Wychavon during 2018 which equates to 27.5 per 1,000 residents.
Across the 32 wards this varies from 79.4 (Evesham North) to 8.6 (Bredon).
2017 2018
Anti-social behaviour 3480 3449 -31
Bicycle theft 91 74 -17
Burglary 787 977 190
Criminal damage and arson 866 900 34
Drugs 154 140 -14
Other crime 145 103 -42
Other theft 815 894 79
Possession of weapons 35 70 35
Public order 335 291 -44
Robbery 29 50 21
Shoplifting 539 713 174
Theft from the person 57 77 20
Vehicle crime 681 592 -89
Violence and sexual offences 2512 2653 141
Crimes only 7046 7534 488
Grand Total 10526 10983 457
Change
596367706767
323226242627
0%
10%
20%
30%
40%
50%
60%
70%
80%
90%
100%
201820172016201520142013
Very unsafe
Fairly unsafe
Neither safe nor unsafe
Fairly safe
Very safe
Feeling safe when outside in your local area during the day
Community safety We ask respondents to the annual residents’ survey about how safe they feel in their area during
the day has remained above 90% for the last six years. However the proportion that those that
feel very safe has seen a decline from 70% in 2015 to 59% in 2018.

25
0%
10%
20%
30%
40%
50%
60%
70%
80%
90%
100%
201820172016201520142013
Very unsafe
Fairly unsafe
Neither safe nor unsafe
Fairly safe
Very safe
Community safety We also ask respondents how safe they feel in their area after dark. The proportion of Wychavon
residents that feel either very safe or fairly safe has fallen in each of the last five years to 72% in
2018 from a high of 79% in 2014.
Respondents are also asked which issues they consider to be a problem in their local area. The
chart below shows clear rises in several issues over the last few years. It illustrates those that
feel the issues are either a very big problem or a fairly big problem and ‘local area’ refers to the
area with 15-20 minutes walking distance from their home.
The proportion of people who believe that people using or dealing drugs is a problem has more
than doubled since 2014.
Feeling safe when outside in your local area after dark
A very big or fairly big problem in your local area
5%
10%
15%
20%
25%
30%
35%
201820172016201520142013
Worcestershire
Viewpoint

26
House prices
The average sold price in June 2019 was £278,173 compared with £270,173 in June 2018, a
2.9% rise. This was the second lowest percentage increase of the Worcestershire districts and
considerably lower than the overall county figure of 3.8%.
There was a 29% reduction in the number of sales made in April 2019 (140) in comparison with
March 2019 (180). This is a trend reflected in the county as a whole and nationally although to a
lesser degree.
The average price that houses in Wychavon were sold for in May 2019 was £275,192.
The difference between the price paid by first time buyers and those who are former owners is
highlighted below. Both have risen considerably over the last few years but have levelled out
somewhat in the last twelve months, In May 2019 the price paid by the average first time buyer
had climbed by around £47,000 since 2014 to £207,271.
Average house prices in Wychavon
Land registry
house price index
House sales volume change (Apr 18 vs Apr 19)
Change in sold price (Jun 18 vs Jun 19)
£170,277
£207,271
£257,669
£316,114
£223,000
£272,936
£140,000
£160,000
£180,000
£200,000
£220,000
£240,000
£260,000
£280,000
£300,000
£320,000
£340,000
May2014
May2015
May2016
May2017
May2018
May2019
First time buyer average price
Former owner occupier average price
Overall
Malvern Hills
Bromsgrove
Worcester
Wyre Forest
Wychavon
Redditch
Worcs
England
0% 1% 2% 3% 4% 5% 6%
Malvern Hills
Redditch
Bromsgrove
Wychavon
Wyre Forest
Worcester
Worcs
England
-60% -40% -20% 0% 20% 40%

27
House prices
Change in house prices by type Jan 2015 – May 2019
House prices in Wychavon have remained consistently more expensive than the county average across all property types.
In May 2019 the average price for a detached house was £395,313, for a semi-detached property it was £237,917, a terraced property was £184,056 and for a flat it was £134,575.
Across all property types a slowdown in noticeable in the last six months.
Detached Semi-detached
Terraced Flats
Private market rents (April 2018 - March 2019)
Private market rents are
more than in Worcestershire
and the West Midlands
across all property types and
the median monthly rent
between April 2018 and
March 2019 was £754.
This was the highest of the
districts with Bromsgrove the
second highest at £739. 0
200
400
600
800
1000
1200
1400
One bed Two bed Three bed Four or more Overall
Month
lym
edia
n r
ent (£
's) Wychavon
Worcestershire
West Midlands
£270,000
£290,000
£310,000
£330,000
£350,000
£370,000
£390,000
£410,000
£430,000
2015 2016 2017 2018 2019
Worcs detached
Wychavon detached
£160,000
£170,000
£180,000
£190,000
£200,000
£210,000
£220,000
£230,000
£240,000
£250,000
2015 2016 2017 2018 2019
Worcs semi-detached
Wychavon semi-detached
£140,000
£150,000
£160,000
£170,000
£180,000
£190,000
£200,000
2015 2016 2017 2018 2019
Worcs terraced
Wychavon terraced
£100,000
£105,000
£110,000
£115,000
£120,000
£125,000
£130,000
£135,000
£140,000
£145,000
2015 2016 2017 2018 2019
Worcs flats
Wychavon flats

28
Sport facilities
There are 424 sports facilities in Wychavon located at 107 sites. There are:
271 Grass pitches 26 Sports halls 14 Studios 10 Swimming pools 8 Squash courts
55 Tennis courts 17 Health and
fitness suites 13 Golf courses
8 Artificial grass
pitches
2 Indoor tennis
centres
Access to sports facilities Ownership of sports facilities
Membership of a sports club or commercial provider is required for the majority of them and
almost 80% are owned by education providers, the local authority or a sports club.
Education, 37%
Local authority, 24%
Sports club, 18%
Commercial, 15%
Community organisation,
4%
Other, 3%
Free public access
1%
Pay and play13%
Private use18%
Registered membership
use13%
Sports club / community association
55%
Affordable housing
0
20
40
60
80
100
120
140
160
Q1 Q2 Q3 Q4 Q1 Q2 Q3 Q4 Q1 Q2 Q3 Q4 Q1
2016/17 2017/18 2018/19 19/20
Number of affordable homes completed
The South Worcestershire Development Plan (SWDP) was adopted on 25 February 2016. The SWDP is a planning framework that aims to ensure development has a positive impact on the environment.
It was jointly prepared by Wychavon District Council, Malvern Hills District Council and Worcester
City Council and will guide development in the area up to the year 2030. The plan has set Wychavon a target to de-liver 7,803 housing units by 2030, which equates to 38.3% of all new units in South Worcestershire.
There have been 1,079 affordable homes completed in Wychavon since April 2016.

29
30
Number of employees in enterprises in Wychavon
0 - 4,79.3%
5 - 9,11.1% 10-19, 5.2%
20-49, 2.8%
50-99, 1.0%100-249, 0.5%
Other, 9.8%
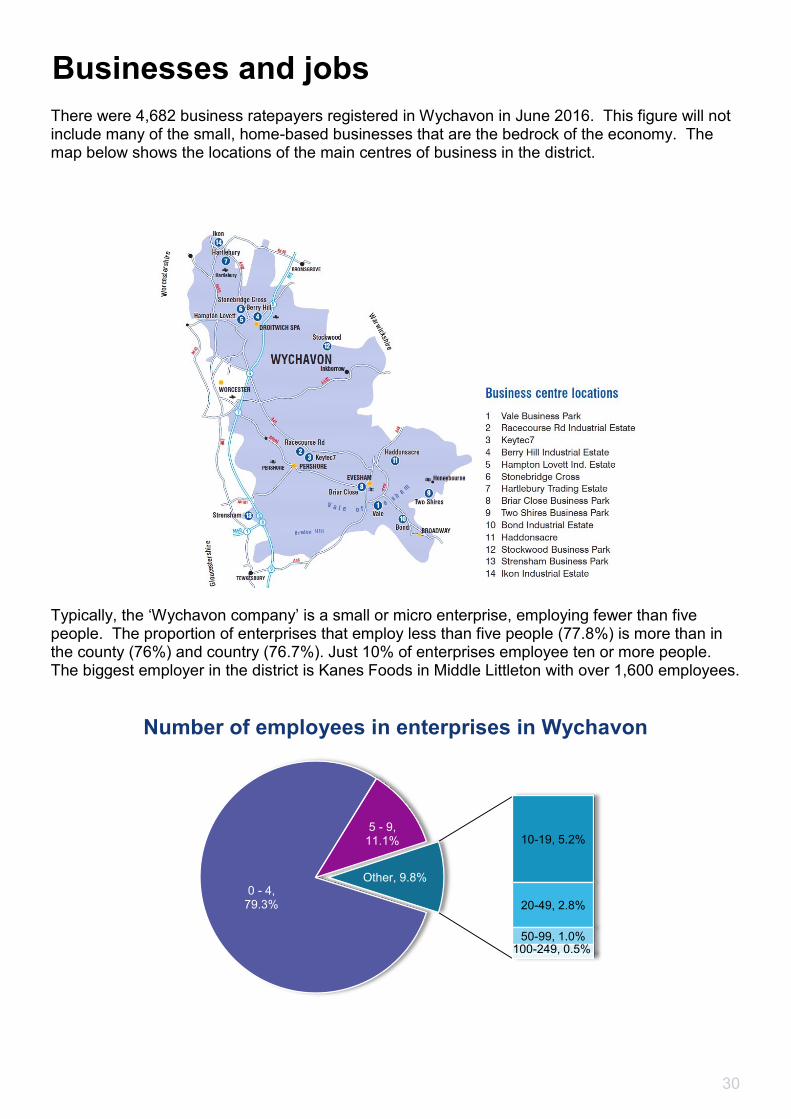
Businesses and jobs
There were 4,682 business ratepayers registered in Wychavon in June 2016. This figure will not include many of the small, home-based businesses that are the bedrock of the economy. The map below shows the locations of the main centres of business in the district.
Typically, the ‘Wychavon company’ is a small or micro enterprise, employing fewer than five people. The proportion of enterprises that employ less than five people (77.8%) is more than in the county (76%) and country (76.7%). Just 10% of enterprises employee ten or more people. The biggest employer in the district is Kanes Foods in Middle Littleton with over 1,600 employees.
31
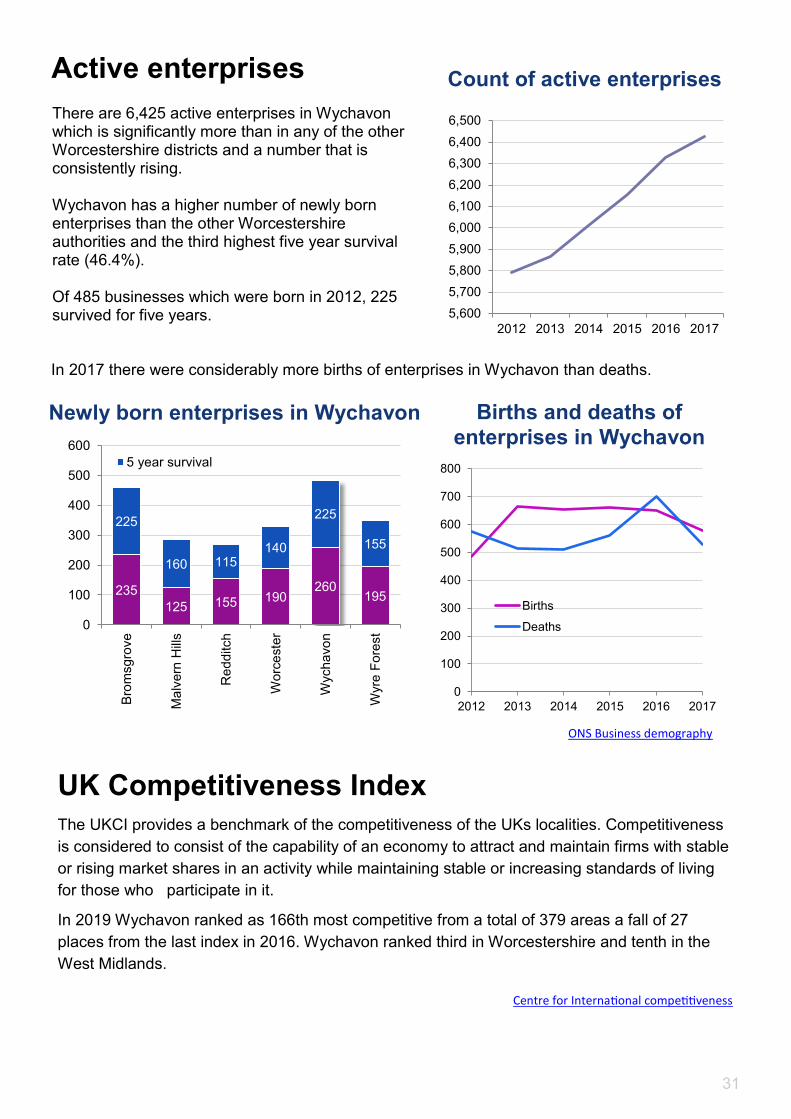
Count of active enterprises
5,600
5,700
5,800
5,900
6,000
6,100
6,200
6,300
6,400
6,500
2012 2013 2014 2015 2016 2017
Active enterprises
There are 6,425 active enterprises in Wychavon which is significantly more than in any of the other Worcestershire districts and a number that is consistently rising. Wychavon has a higher number of newly born enterprises than the other Worcestershire authorities and the third highest five year survival rate (46.4%). Of 485 businesses which were born in 2012, 225 survived for five years.
Newly born enterprises in Wychavon Births and deaths of
enterprises in Wychavon
235
125 155 190260
195
225
160 115140
225
155
0
100
200
300
400
500
600
Bro
msgro
ve
Ma
lvern
Hill
s
Re
dditch
Worc
este
r
Wycha
vo
n
Wyre
Fore
st
5 year survival
0
100
200
300
400
500
600
700
800
2012 2013 2014 2015 2016 2017
Births
Deaths
In 2017 there were considerably more births of enterprises in Wychavon than deaths.
UK Competitiveness Index
The UKCI provides a benchmark of the competitiveness of the UKs localities. Competitiveness
is considered to consist of the capability of an economy to attract and maintain firms with stable
or rising market shares in an activity while maintaining stable or increasing standards of living
for those who participate in it.
In 2019 Wychavon ranked as 166th most competitive from a total of 379 areas a fall of 27
places from the last index in 2016. Wychavon ranked third in Worcestershire and tenth in the
West Midlands.
Centre for International competitiveness
ONS Business demography

32
Claimant count*
*Claimant count: The number of people claiming Jobseeker's Allowance plus those who claim Universal Credit who are out of work.
Apprenticeship achievements Apprenticeship starts
Employment
Job density Job density is the ratio of total jobs to population
aged 16-64 and this has increased over the last few
years and remains well above the national and
regional averages.
The number of apprenticeships started in the last
year decreased in Wychavon but this was in line
with the other districts. There were 780 starts and
590 achievements in 2017/18.
0
0.5
1
1.5
2
2.5
3
3.5
4
Ju
l-1
5
Oct-
15
Ja
n-1
6
Ap
r-1
6
Jul-1
6
Oct-
16
Ja
n-1
7
Apr-
17
Ju
l-1
7
Oct-
17
Jan-1
8
Ap
r-1
8
Ju
l-1
8
Oct-
18
Ja
n-1
9
Ap
r-1
9
Ju
l-1
9
%
Wychavon
West Midlands
Great Britain
NOMIS local area reports
Out of work benefits
200
400
600
800
1,000
1,200
2014/15 2015/16 2016/17 2017/18
Bromsgrove Malvern Hills RedditchWorcester Wychavon Wyre Forest
200
300
400
500
600
700
2014/15 2015/16 2016/17 2017/18
Bromsgrove Malvern Hills Redditch
Worcester Wychavon Wyre Forest
Wychavon
England
West Midlands
0.70
0.75
0.80
0.85
0.90
0.95
2012 2013 2014 2015 2016 2017
Levels of claimants in Wychavon remain
lower than in the West Midlands and
Great Britain levels despite a recent
upturn in claimants since the turn of the
year.

33
Ratio of median house price to median earnings
Earnings
Median full time salary for full time
workers who live or work in Wychavon
ONS earnings and working hours
ONS house price to resident earnings
£1
95
,00
0
£2
10
,00
0
£2
25
,37
5
£2
45
,00
0
£2
55
,99
5
£2
70
,00
0
£25,2
03
£26,4
05
£27,3
09
£28,0
19
£28,8
13
£29,9
93
7.74
7.95
8.25
8.74
8.889
7.0
8.0
9.0
10.0
£0
£50,000
£100,000
£150,000
£200,000
£250,000
£300,000
2013 2014 2015 2016 2017 2018
Median house price
Median residence based earnings
Ratio of house price to median residence based earnings
The ratio of house price to earnings has risen sharply in the last five years as the median gross
salary has stagnated whilst the median house price has increased by almost £75,000.
The median house price in Wychavon is now nine times the median full time residence-based
salary. This is the second highest in Worcestershire behind Malvern Hills (9.77)
The median annual salary for people who live in Wychavon rose to £29,993 in 2018 and is more
than the county average of £27,900.
The median annual salary for people who work in the district rose to £27,504 in 2018 compared
with the county figure of £25,896, again a gap which has remained similar for each of the last
four years.
Worcs residence
Wychavon residence
Worcs workplace
Wychavon workplace
£20,000
£22,000
£24,000
£26,000
£28,000
£30,000
£32,000
2015 2016 2017 2018 (provisional)

34
Social mobility
The Social Mobility Index assesses the education, employability and housing prospects of people living in each of England’s 324 local authority (LA) areas. The index highlights where people from disadvantaged backgrounds are most and least likely to make social progress.
The index itself is comprised of four areas spanning each major life stage and each one consists of a number of measures. The four areas area early years, school, youth and working lives.
Each of the 324 local authorities in England is ranked on these criteria and an overall rank from 1 to 324 is given to each local authority (where 1 is the greatest level of social mobility for children from disadvantaged backgrounds).
In November 2017 Wychavon was given a rank of 310 which means that it is rated as the 15th worst area for social mobility in England.
The ranking Wychavon was given for each of the four areas is shown below:
Overall Early years School Youth Working lives
310 320 229 297 150
Journey time statistics are produced annually by the Department for Transport and provide
journey times to key services including food stores, education, health care, town centres,
employment centres and transport hubs. These statistics are from the analysis of spatial data
on public transport timetables, road, cycle and footpath networks, population and service
locations.
The chart below shows the minimum average travel time in minutes by walking/public transport
to a range of amenities in Wychavon compared to the rest of Worcestershire and England as a
whole.
GP HospitalPrimary
School
Secondary
SchoolFE College Town centres Food stores
Employment
centres
Bromsgrove 13 53 13 16 20 21 10 14
Malvern Hills 20 61 14 28 34 31 16 29
Redditch 11 25 11 14 18 21 11 12
Worcester 10 30 10 18 21 17 7 10
Wychavon 19 58 13 24 26 23 14 23
Wyre Forest 14 30 11 19 19 17 9 14
Worcestershire 15 43 12 20 23 21 11 17
England 11 39 10 18 21 21 9 13
Travel times
Gov.uk - Social mobility index
Gov.uk - Journey time statistics
35
Tourism The visitor economy is a very important element of the district’s economic base. The most
recent Economic Impact Assessment in Wychavon was completed in 2015.
Key findings were:
3.58 million trips were undertaken to (and within) the district - 3.3 million day trips and 280,000 overnight visits.
Visitors spent approximately £147 million.
This spending supported 3,103 jobs within Wychavon; 2,528 direct tourism related jobs plus around 575 indirect / induced jobs. This equates to just under 5% of employed people in the district.
Overnight trips account for a total of 976,000 nights in the area and 44% of these were made by visitors form overseas.
Day trips by UK residents were made mainly by people from the surrounding hour or so, directly spending £97 million into the local economy.
Overnight visits generated approximately £52.2 million in the area and 45% of this (£23.6 million) was generated by overseas visitors.
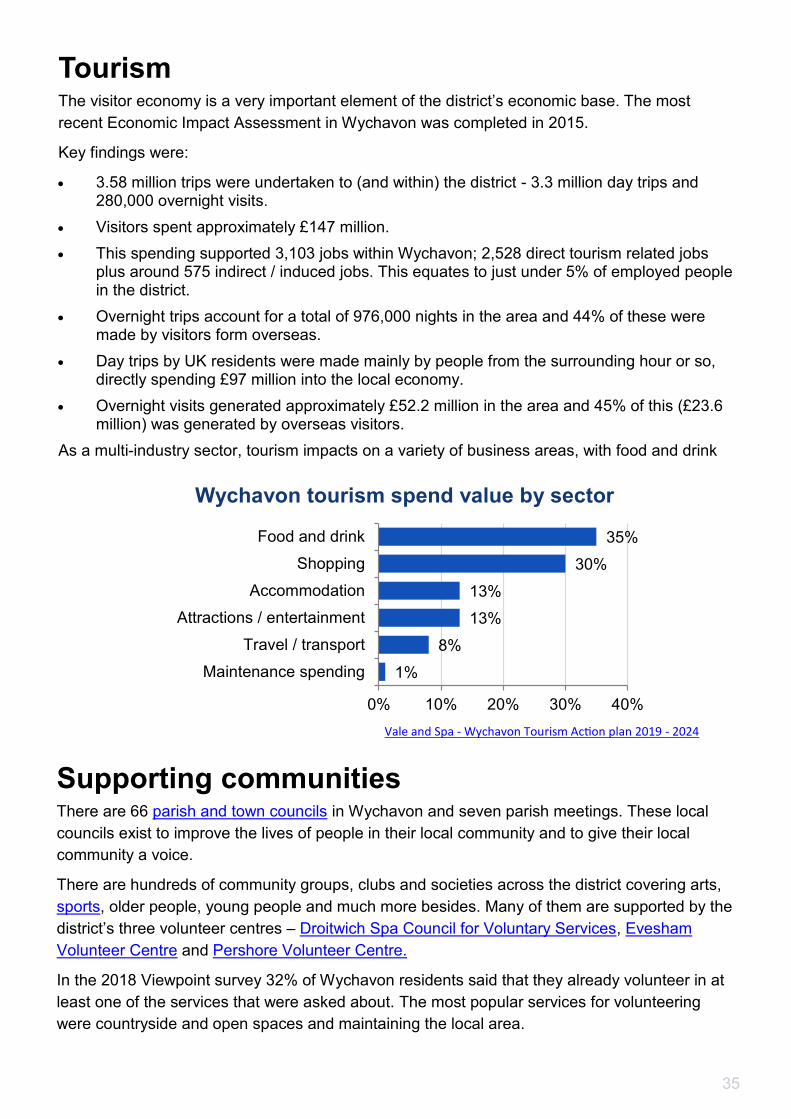
As a multi-industry sector, tourism impacts on a variety of business areas, with food and drink
35%
30%
13%
13%
8%
1%
Food and drink
Shopping
Accommodation
Attractions / entertainment
Travel / transport
Maintenance spending
0% 10% 20% 30% 40%
Supporting communities There are 66 parish and town councils in Wychavon and seven parish meetings. These local
councils exist to improve the lives of people in their local community and to give their local
community a voice.
There are hundreds of community groups, clubs and societies across the district covering arts,
sports, older people, young people and much more besides. Many of them are supported by the
district’s three volunteer centres – Droitwich Spa Council for Voluntary Services, Evesham
Volunteer Centre and Pershore Volunteer Centre.
In the 2018 Viewpoint survey 32% of Wychavon residents said that they already volunteer in at
least one of the services that were asked about. The most popular services for volunteering
were countryside and open spaces and maintaining the local area.
Vale and Spa - Wychavon Tourism Action plan 2019 - 2024
Wychavon tourism spend value by sector