draft update to ocean going vessels (ogv) emissions inventory
TRANSCRIPT

Draft – Deliberative – For discussion only
Draft Update to Ocean Going Vessels (OGV) Emissions Inventory
1
2022 AQMP Mobile Source Working Group
August 24, 2021
Draft – Deliberative – For discussion only
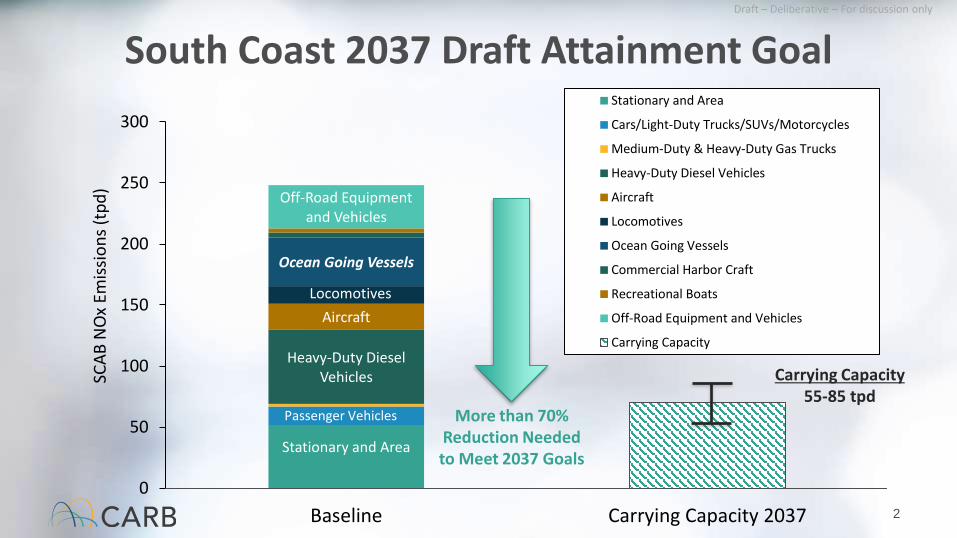
South Coast 2037 Draft Attainment Goal
Stationary and Area
Heavy-Duty Diesel Vehicles
Aircraft
Ocean Going Vessels
Off-Road Equipment and Vehicles
0
50
100
150
200
250
300
Baseline Carrying Capacity 2037
SCA
B N
Ox
Emis
sio
ns
(tp
d)
Stationary and Area
Cars/Light-Duty Trucks/SUVs/Motorcycles
Medium-Duty & Heavy-Duty Gas Trucks
Heavy-Duty Diesel Vehicles
Aircraft
Locomotives
Ocean Going Vessels
Commercial Harbor Craft
Recreational Boats
Off-Road Equipment and Vehicles
Carrying Capacity
Locomotives
Passenger Vehicles
Carrying Capacity55-85 tpd
2
More than 70% Reduction Needed to Meet 2037 Goals

Draft – Deliberative – For discussion only
OGV NOx Emission Contribution in South Coast
3
On-Road43%
OGVs19%
Aircraft10%
Trains4%
Off-Road Equip.24%
2037
On-Road56%
OGVs10%
Aircraft5%
Trains5%
Off-Road Equip.24%
2017
• OGV emissions (out to 100 nautical miles) make up 20% of mobile source NOx emission in 2037, up from 10% in 2017
Source: CEPAM 2019 Summer Emissions, with 2020 At Berth Regulation amendments

Draft – Deliberative – For discussion only
OGV Inventory• OGV inventory covers marine vessels over
400 feet, 10,000 tons, with large engine displacement
• At-Berth inventory updated in 2020
• Inventory updates for transit, maneuvering, anchorage are needed
o Improve base year accuracy and location specificity
o Review growth forecast and future engine Tiers for visiting vessels
o Review literature on emission factors for main/auxiliary engines and boilers
42016 Container Vessel Tracks

Draft – Deliberative – For discussion only
Modes of Operation• At-Berth: Operations while moored to a dock
• Anchorage: Operations when vessel drops anchor near the port
• Maneuvering: Slow speed vessel operations while in port areas
• Transit: Vessel operations between ports
5
Transit Maneuvering Anchorage
At-Berth

Draft – Deliberative – For discussion only
Data Sources: Overview
6
Emission Factors
Characteristics
Vessel Activity Forecasting
2020 AIS Records
2020 IHS Records
2020 EPA EFs FAF 4.4
Engine Defaults
2020 IHS Records
2020 Starcrest Historical Port Calls
Mercator ReportControl Measures
2019 Compliance
2019 Industry
FAF: Freight Analysis Framework

Draft – Deliberative – For discussion only
Activity Data Source: AIS• Automatic Identification System (AIS) is an onboard navigation safety device that all OGVs
are required to equip for improved navigation and collision avoidance.
7
• AIS reports provide vessel location and movement information in US waterways.
• This massive data source is made public through collaboration of the USCG, NOAA, and the Bureau of Ocean and Energy Management (BOEM) via Marine Cadastre.
https://coast.noaa.gov/htdata/CMSP/AISDataHandler/2020/index.html

Draft – Deliberative – For discussion only
Geographic Domain
Statewide
8
South Coast
0 – 3 nm
3 – 24 nm
24 – 100 nm
Point Fermin
20 nm
40 nm
Over-water Boundary

Draft – Deliberative – For discussion only
Processing AIS
9
• OGV records are matched with EPA emissions factors and default loads by vessel type, engine type, and activity.
• Activity defined by location and speed.
* This figure depicts one month of cleaned AIS data for illustration purposes only. Berth Hotelling
Activity Modes:
Berth Hotelling• Within 4 km of port, not in
anchorage zone, and speed of 0 kts
Anchorage Hotelling• Within anchorage zone with
speed < 1 kts
Maneuvering• Within 3 nm, speed < 3 kts

Draft – Deliberative – For discussion only
South Coast 2020 OGV by Type
10
Anchorage Hotelling Maneuvering TransitBerth Hotelling
0
20
40
60
80
100
120
140
Container Tanker Bulk Cargo
Tota
l Ob
serv
ed H
ou
rs, T
ho
usa
nd
s
Vessel Type
0
500
1,000
1,500
2,000
2,500
Container Tanker Bulk CargoEn
ergy
Use
d k
Wh
, x1
00
,00
0
Vessel Type

Draft – Deliberative – For discussion only
Engine Default Loads
• Boiler proposed default values from Ports’ emissions inventory (developed by Starcrest) were used directly for all vessels.
• Tanker loading and discharge activities in Richmond were adjusted with custom power operations based on 2019 industry data.
• Auxiliary engine max power was derived from IHS annual averages by type and size, then combined with Starcrest loads by activity.
Operational kW = [engine load] * [Max aux power]
11

Draft – Deliberative – For discussion only
Example: Applying Aux LoadsOn average, IHS registry shows 3180 kW max aux power for all 8,000 TEU capacity containerships identified in 2020 AIS records.
12
Activity StarcrestDefault
Fractional Load = (Starcrest/IHS)
Transit 1,553 0.4885
Maneuvering 2,485.5 0.7818
Berth 1,116.5 0.3512
Anchorage 1,250.5 0.3933
Records with known max aux power:2020 activity record shows an 8,401 TEU capacity containership at anchor with max installed aux engine power of 3,300 kW. The estimated operational kW for aux engines for that record would be 1,298 kW.
Records without known max aux power: Using default values for operating power instead of adjusting unique vessel power. In example record above, the estimated operational aux power in unknown max power case would be 1,250.5 kW.
Statewide average max power of some vessel types and sizes were lower than Starcrest reported defaults. Fractional loads were adjusted to not exceed 1 for those types and sizes, as shown in following slides.

Draft – Deliberative – For discussion only
Aux Operational kW: Maneuvering
13
0
500
1000
1500
2000
2500
3000A
uto
Car
rier
Bu
lk
Bu
lk -
Hea
vy L
oad
Bu
lk -
Sel
f D
isch
argi
ng
Co
nta
iner
1
Co
nta
iner
2
Co
nta
iner
3
Co
nta
iner
4
Co
nta
iner
5
Co
nta
iner
6
Co
nta
iner
7
Co
nta
iner
8
Co
nta
iner
9
Co
nta
iner
10
Co
nta
iner
11
Co
nta
iner
12
Co
nta
iner
13
Co
nta
iner
14
Co
nta
iner
17
Ge
ner
al C
argo
Oce
an T
ug
(ATB
/ITB
)
Ree
fer
Ro
Ro
Tan
ker
Ch
emic
al
Tan
ker
Han
dys
ize
Tan
ker
Pan
amax
Tan
ker
Afr
amax
Tan
ker
Su
ezm
ax
Tan
ker
VLC
C
Tan
ker
ULC
C
Op
erat
ion
al k
W
Vessel Type and Size
Starcrest Proposed Defaults 2020 CARB Applied Defaults
Note: Container size bins in thousand TEU capacity

Draft – Deliberative – For discussion only
Aux Operational kW: Other Modes
14
0
200
400
600
800
1000
1200
1400
Container 1 Reefer
Op
erat
ion
al k
W f
rom
Au
x En
gin
es
Transit
0
200
400
600
800
1000
1200
1400
1600
Reefer
Anchorage
0
200
400
600
800
1000
1200
1400
General Cargo Reefer
Berth
Starcrest Proposed Defaults 2020 CARB Applied Defaults

Draft – Deliberative – For discussion only
0
2
4
6
8
10
12
14
16
18
0 1 2 3 0 1 2 3 0 1 2 3
HSD HSD HSD HSD MSD MSD MSD MSD SSD SSD SSD SSD
NO
x (g
/kW
h)
Engine Tier and Type
Old Inventory Draft Update
NOx Emissions Factors Comparison: Main Engines
15Note: High Speed Diesel (HSD), Medium Speed Diesel (MSD), Slow Speed Diesel (SSD)

Draft – Deliberative – For discussion only
0
2
4
6
8
10
12
14
16
0 1 2 3 0 1 2 3
HSD HSD HSD HSD MSD MSD MSD MSD Boiler
NO
x (g
/kW
h)
Engine Tier and Type
Old Inventory Draft Update
NOx Emissions Factors Comparison:Auxiliary Engines and Boilers
16Note: High Speed Diesel (HSD), Medium Speed Diesel (MSD), Slow Speed Diesel (SSD)

Draft – Deliberative – For discussion only
0
0.05
0.1
0.15
0.2
0.25
0.3
Auxiliary Engine Boiler Main Engine, HSD Main Engine, MSD Main Engine, SSD
PM
(g
/kW
h)
Engine and Type
Old Inventory Draft Update
PM Emissions Factors Comparison:Distillate Fueled Engines and Boilers
17Note: High Speed Diesel (HSD), Medium Speed Diesel (MSD), Slow Speed Diesel (SSD)

Draft – Deliberative – For discussion only
Forecasting Data Source: FAF
18
0%
1%
2%
3%
4%
5%
6%
7%
20
15
20
16
20
17
20
18
20
19
20
20
20
21
20
22
20
23
20
24
20
25
20
26
20
27
20
28
20
29
20
30
20
31
20
32
20
33
20
34
20
35
20
36
20
37
20
38
20
39
20
40
20
41
20
42
20
43
20
44
20
45
20
46
20
47
20
48
20
49
20
50
An
nu
al G
row
th R
ate
Calendar Year
Containership FAF4.4 Growth in LA Region
Base Growth Hi Forecast Lo Forecast Lo with 2 Year Delay
Mercator, Base Mercator, Upside Mercator, Downside
FAF 4.4 Lo Scenario has 2.32 % growth rate in 2020
COVID adjustment to delay Lo Scenario 2021 growth rates by 2 years, before resuming at expected 3.52 % growth in 2023.
Note: Freight Analysis Framework (FAF)

Draft – Deliberative – For discussion only
Containership Capacity Trends
19
0
200
400
600
800
1000
1200
1400
1600
1800
2000
2005 2006 2007 2008 2009 2010 2011 2012 2013 2014 2015 2016 2017 2018 2019
Tota
l Arr
ival
s (P
oLA
+ Po
LB)
Calendar Year
Containerships Calling to SPBP Have Larger Capacity Over Last 14 Years
Less than 4000 4001 - 8000 8001 - 16000 More than 16000TEU TEU TEU TEU
Draft – Deliberative – For discussion only
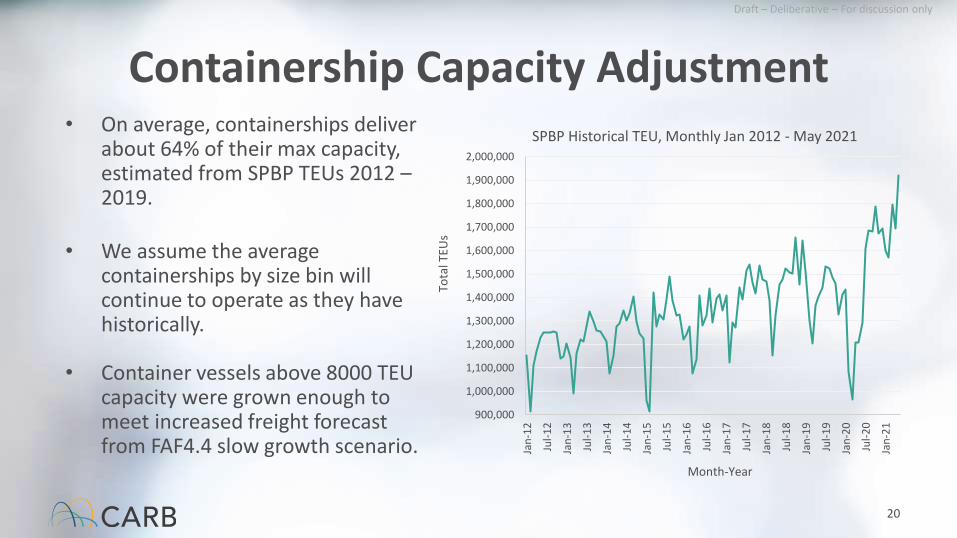
Containership Capacity Adjustment• On average, containerships deliver
about 64% of their max capacity, estimated from SPBP TEUs 2012 –2019.
• We assume the average containerships by size bin will continue to operate as they have historically.
• Container vessels above 8000 TEU capacity were grown enough to meet increased freight forecast from FAF4.4 slow growth scenario.
20
900,000
1,000,000
1,100,000
1,200,000
1,300,000
1,400,000
1,500,000
1,600,000
1,700,000
1,800,000
1,900,000
2,000,000
Jan
-12
Jul-
12
Jan
-13
Jul-
13
Jan
-14
Jul-
14
Jan
-15
Jul-
15
Jan
-16
Jul-
16
Jan
-17
Jul-
17
Jan
-18
Jul-
18
Jan
-19
Jul-
19
Jan
-20
Jul-
20
Jan
-21
Tota
l TEU
s
Month-Year
SPBP Historical TEU, Monthly Jan 2012 - May 2021

Draft – Deliberative – For discussion only
Containership Capacity NOx Impacts
21
0
2
4
6
8
10
12
14
16
18
20
20
20
21
20
22
20
23
20
24
20
25
20
26
20
27
20
28
20
29
20
30
20
31
20
32
20
33
20
34
20
35
20
36
20
37
20
38
20
39
20
40
20
41
20
42
20
43
20
44
20
45
20
46
20
47
20
48
20
49
20
50
NO
x (t
pd
)
Calendar Year
South Coast Containership NOx by Size Bin Group
Less than 4000 TEU 4001 - 8000 TEU 8001 - 16000 TEU More than 16000 TEU

Draft – Deliberative – For discussion only
Tier Assumptions
• Based on Mercator report, growth of Tier III vessels delayed until 2030.
• Main engine duty cycle adjustment: All Tier III main engines operating at less than 25% load are assumed to be operating at Tier II levels.
22

Draft – Deliberative – For discussion only
South Coast Containership NOx by Tier
23
0
2
4
6
8
10
12
14
16
18
20
20
20
21
20
22
20
23
20
24
20
25
20
26
20
27
20
28
20
29
20
30
20
31
20
32
20
33
20
34
20
35
20
36
20
37
20
38
20
39
20
40
20
41
20
42
20
43
20
44
20
45
20
46
20
47
20
48
20
49
20
50
NO
x (t
pd
)
Calendar Year
Tier 0 Tier I Tier II Tier III

Draft – Deliberative – For discussion only
South Coast NOx Emissions Out to 100 nm
24
0
5
10
15
20
25
30
35
40
20
20
20
21
20
22
20
23
20
24
20
25
20
26
20
27
20
28
20
29
20
30
20
31
20
32
20
33
20
34
20
35
20
36
20
37
20
38
20
39
20
40
20
41
20
42
20
43
20
44
20
45
20
46
20
47
20
48
20
49
20
50
NO
x (t
pd
)
Calendar Year
Draft AIS Update by Vessel Type
Auto Carrier Bulk Cargo Container Cruise General Cargo
Reefer RoRo Tanker Vessels (Other) Old Inventory

Draft – Deliberative – For discussion only
South Coast NOx Emissions Out to 24 nm
25
0
5
10
15
20
25
30
35
40
20
20
20
21
20
22
20
23
20
24
20
25
20
26
20
27
20
28
20
29
20
30
20
31
20
32
20
33
20
34
20
35
20
36
20
37
20
38
20
39
20
40
20
41
20
42
20
43
20
44
20
45
20
46
20
47
20
48
20
49
20
50
NO
x (t
pd
)
Calendar Year
Draft AIS Update by Vessel Type
Auto Carrier Bulk Cargo Container Cruise General Cargo
Reefer RoRo Tanker Vessels (Other) Old Inventory

Draft – Deliberative – For discussion only
What Are Your Thoughts
• Tier III Penetration: Is it reasonable to assume that growth of Tier III vessels will be delayed until 2030?
• Tier III Low Load Operation: What do you think about the emission rate assumptions for Tier III engines operating under 25% load?
• Forecasted Freight Growth Rates: Considering recent congestions at the ports, what are your thoughts about the long-term growth rate assumptions embedded in this draft?
26
Send your comments and suggestions to: [email protected]

Draft – Deliberative – For discussion only
Next Steps
CARB Public Workshop
• More statewide level details
• Sep 2021
Draft Release • Open for public comments
• Oct 2021
Final Release• Inclusion in 2022 South Coast SIP
emissions inventory
• Nov/Dec 2021
27

Draft – Deliberative – For discussion only
Contact Information• Nancy Bui, Inventory staff
• Cory Parmer, Manager, Off-Road Diesel Analysis [email protected]
• Sam Pournazeri, Chief, Mobile Source Analysis [email protected]
• Useful Links:o 2019 At Berth Emissions Inventory:
https://ww2.arb.ca.gov/sites/default/files/classic/regact/2019/ogvatberth2019/apph.pdf
o 2011 OGV Emissions Inventory: https://ww2.arb.ca.gov/sites/default/files/classic/regact/2011/ogv11/ogv11appd.pdf
o 2022 State Strategy for the State Implementation Plan: https://ww2.arb.ca.gov/resources/documents/2022-state-strategy-state-implementation-plan-2022-state-sip-strategy
28

Ocean-Going Vessel RetrofitWater-in-Fuel Project Update
South Coast AQMP Mobile Source Working Group
August 24, 2021
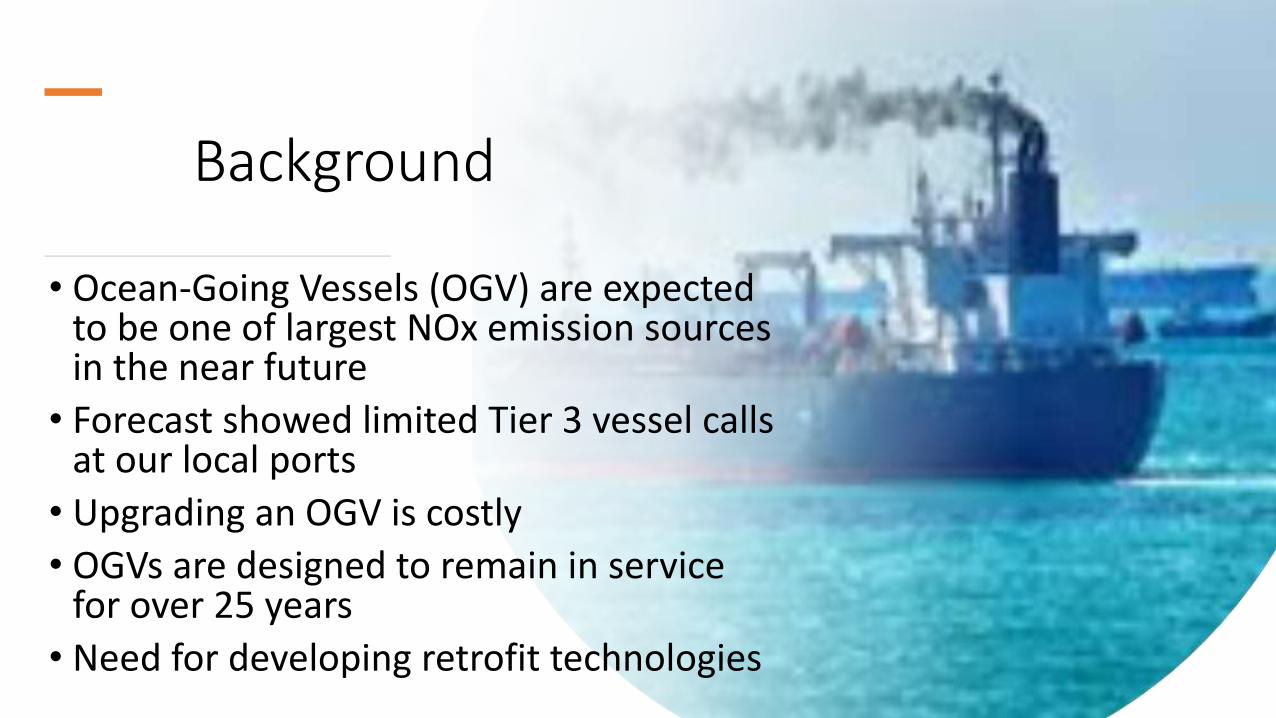
Background
• Ocean-Going Vessels (OGV) are expected to be one of largest NOx emission sources in the near future
• Forecast showed limited Tier 3 vessel calls at our local ports
• Upgrading an OGV is costly
• OGVs are designed to remain in service for over 25 years
• Need for developing retrofit technologies
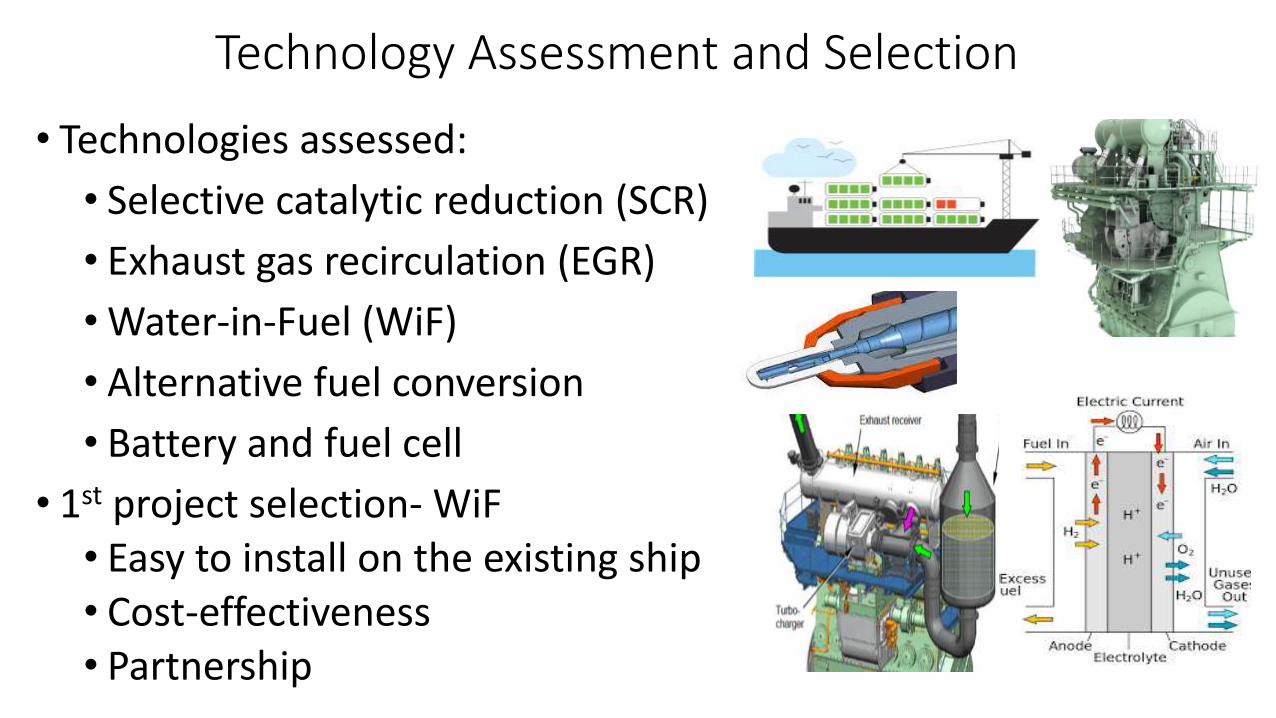
Technology Assessment and Selection
• Technologies assessed:
• Selective catalytic reduction (SCR)
• Exhaust gas recirculation (EGR)
• Water-in-Fuel (WiF)
• Alternative fuel conversion
• Battery and fuel cell
• 1st project selection- WiF • Easy to install on the existing ship• Cost-effectiveness• Partnership

Project Partners• Funding: SCAQMD, Port of Los Angeles and Long Beach
• MAN Energy Solutions –Technology Provider• Design and develop the WiF unit• Oversee the manufacturing of WiF• Supervise the installation • Commission and optimization • Emission Testing
• MSC- Demonstrator• Provide vessel specification, access and on-board support• Coordinate ship routes and schedule• Vessel –MSC ANZU
• Built in 2015 Tier 2, container ship with 8800TEU capacity• MAN 9S90ME engine (main)

Water-in-Fuel Retrofit• The WiF unit manufactured into 2 parts:
• Emulsion Mixer
• Emulsion booster
• Elevated foundation installation
• Installation time: 4-6 weeks, while vessel at berth and on route
• Commissioning and optimization
• Emission testing and verification
• Operation range: 10-50% engine load
• Total project cost: $3M
• Expected NOx reduction: 40% or 2.2 ton/call

Project status
June 2020
Project Kick off
October 2020
Engineering and design complete
February 2021
CARB emission test plan approved
April 2021
WiF unit manufactured and Shipped
July-September 2021
Installation
October 2021 Commissioning

Next Steps• Obtain marine approval
• DNV GL
• Installation inspection – August 15, 2021, at Antwerp
• Finalize the vessel route for Q4 2021
• Commissioning and optimization
• Emission Test and verification
• Expected project completion: June 2022
• Expected San Pedro Bay Port vessel call: 5-7 times/year

Challenges
•Uncertainties of vessel routes due to the congestion at the ports around the world
• COVID restrictions• Travel• Board the ship•Deliver materials to the ship
