draft - university of toronto t-space influence of hudson bay on the carbon dynamics of a hudson bay...
TRANSCRIPT

Draft
Influence of Hudson Bay on the Carbon Dynamics of a
Hudson Bay Lowlands Coastal Site
Journal: Arctic Science
Manuscript ID AS-2015-0026.R3
Manuscript Type: Article
Date Submitted by the Author: 05-May-2016
Complete List of Authors: Delidjakova, Kristina; York University, Geography Bello, Richard; York University, Geography Higuchi, Kaz; York University, Environmental Studies Pokharel, Bipin; York University, Geography
Keyword: photosynthesis, respiration, advection, eddy covariance, peatlands
https://mc06.manuscriptcentral.com/asopen-pubs
Arctic Science

Draft
1
Influence of Hudson Bay on the Carbon Dynamics of a Hudson Bay Lowlands Coastal Site
By Kristina K. Delidjakova1, Richard L. Bello
1*, Kaz Higuchi
2, Bipin Pokharel
1
1Department of Geography, York University, Toronto, Ontario, Canada;
2Faculty of
Environmental Studies, York University Toronto, Ontario, Canada
*Corresponding Author:
Richard Bello
Department of Geography, York University,
Toronto, Ontario, M3J 1P3
Canada
Tel.: 416-736-5107 x22561
Fax: 416-736-5988
Original Research
Page 1 of 53
https://mc06.manuscriptcentral.com/asopen-pubs
Arctic Science

Draft
2
Abstract
Eddy Covariance (EC) estimates of Net Ecosystem Exchange (NEE) and the surface
energy balance were gathered from an elevated peat plateau within the Hudson Bay Lowlands
near Churchill, Manitoba, Canada (58° 43' 46''N, 93° 49' 57''W) during the growing season of
2007. Data were segregated into onshore and offshore wind regimes to assess the advective
influence of the generally cold and moist Hudson Bay air masses compared to generally warm
and dry air masses of non-marine origin. Monthly average net ecosystem exchange (NEE)
ranged from an uptake of 0.2 µmol/m2/s in September to 5.6 µmol/m
2/s in July. Over the
growing season, onshore winds from Hudson Bay contributed to an average 4.2°C reduction in
air temperature and an NEE increase of 27%. When normalized with respect to sunlight receipt,
the ratio of gross primary production to photosynthetically active radiation (GPP/PAR) was 26%
stronger for offshore regimes than for onshore, while the ratio of ecosystem respiration to PAR
(ER/PAR) was 71% stronger for offshore regimes. It was concluded that GPP maintains the
same strength for both wind regimes, while ER is significantly stronger for offshore regimes,
resulting in reduced NEE capacity during periods when winds originate from inland.
Keywords: global warming, carbon dioxide, photosynthesis, respiration, Hudson Bay Lowlands,
advection, eddy covariance, peatlands
Page 2 of 53
https://mc06.manuscriptcentral.com/asopen-pubs
Arctic Science

Draft
3
Introduction
The carbon (C) balance of northern ecosystems plays an important role in observed and
projected climate warming. Although the photosynthetic rates for peatlands are relatively low,
the total amount of C stored in them is approximately 450x103
TgC, or about 30% of the global
terrestrial C pool (Gorham 1991; Smith et al. 2004), as they represent strong C sinks in rich and
slowly decomposing soils (Corradi et al. 2005). The Hudson Bay Lowlands, off the west coast of
Hudson Bay, are the second largest continuous peatlands in the world, spanning 250,000 km2
and comprising 25% of Canada’s wetlands (Riley 2011). In the northern portion of the Hudson
Bay Lowlands within the Province of Manitoba, peat thickness reaches 4 m, with an overall
average depth of about 0.5 m (Dredge and Mott 2003). Accumulations over the past ca.4500
years are generally greatest inland and diminish towards the coast which is still progressing
seaward as new land emerges from Hudson Bay due to isostatic uplift. The strength of the C sink
is a result of inhibited decomposition in anerobic and frozen soil conditions (Burton et al. 1996;
Cai et al. 2010), and it has been accumulating at a long term average rate of 21 gC/m2/year
(Clymo et al. 1998). However, projected climate warming, causing longer growing season, will
likely affect northern ecosystems more strongly than in any other parts of the globe, with
measurable consequences on the hydrological and carbon cycles (Cess et al. 1991; Rizzo and
Wiken 1992; Chapman and Walsh 1993; Myneni et al. 1997; Serreze et al. 2000).
The amplification of the warming in the circumpolar north is primarily a result of positive
feedback processes, most notably the surface-albedo/surface-temperature feedback, whereby
increased air temperatures will result in the melting of snow and ice, which will further decrease
the albedo, and enhance warming through greater absorption of solar radiation at the surface
Page 3 of 53
https://mc06.manuscriptcentral.com/asopen-pubs
Arctic Science

Draft
4
(Cess et al. 1991; Chapin et al. 2005; Hinzman et al. 2005). Another important positive feedback
effect is from a prolonged thawing of carbon-rich permafrost soils, which could release stored
organic C through microbial respiration in the form of carbon dioxide (CO2) and methane (CH4),
depending on the water table depth. The carbon released under increasing temperatures further
increases the greenhouse effect by contributing to the atmospheric CO2 concentration
(Armentano and Menges 1986; Oechel et al. 1993; Zimov et al. 2006).
Although allowances are made within climate projection models for the interplay of
feedback mechanisms, there still remain large uncertainties as to how some ecosystems will
respond to a warming climate (Callaghan et al. 2004; Luo 2007; Heimann and Reichstein 2008),
particularly in the north. Thus, it is important to quantify with field experiments the exchange of
CO2 between northern ecosystems and the atmosphere that will increase our understanding of
their functioning under future warming scenarios. Characterizing the drivers of CO2 exchange in
Subarctic peatlands will establish the sensitivity of these active carbon sinks. In addition,
warming temperatures have the potential to increase evaporation rates (Chapin et al. 2005) and
dry out substantial areas of wetlands (Chivers et al. 2009). Peatlands are exceptionally
vulnerable to drying out, as they have extremely large water contents when wet, and an equal
amount of air content when dry (Rouse 2000), which suggests that a sink-source threshold of Net
Ecosystem Exchange (NEE) is easy to cross. The sensitivity of these ecosystems is still
uncertain, as some studies report that they are net sources of atmospheric CO2 (Griffis et al.
2000; Rouse et al. 2002), while others report them as sinks (Tans et al. 1990; Griffis et al. 2000;
Aurela et al. 2002; Roulet et al. 2007; Cai et al. 2010). What is likely is that productive, peat-
accumulating wetlands have the potential to become large carbon sources under increasing air
Page 4 of 53
https://mc06.manuscriptcentral.com/asopen-pubs
Arctic Science

Draft
5
temperatures, which will induce greater respiration (Armentano and Menges 1986; Oeochel and
Billings 1992; Zimov et al. 1999; Aurela et al. 2002; Dutta et al. 2006; Cai et al. 2010).
There have been a number of studies that have measured carbon fluxes in northern
wetlands (Hamilton et al. 1994; Burton et al. 1996; Waddington and Roulet 1996; Griffis et al.
2000; Roulet et al. 2007), but the influence of Hudson Bay (via temperature and moisture) on
these fluxes has not been investigated. Hudson Bay is a massive inland sea (3.9 x 10⁹ km
2) which
historically was completely free of ice only in September (Danielson 1971) but more recently has
attained ice-free status in August (Gagnon and Gough 2005). It is responsible for extending
southward the range of Arctic flora and fauna, the continental treeline and permafrost into central
Canada. The current rate of disappearance of sea-ice is 11% per decade since 1968 (Henry
2011), resulting in an extension of the ice-free season that will impact significantly on the
surrounding terrestrial environment. An energy balance study by Rouse and Bello (1985)
concluded that there is a strong dependence of the energy balance of three different sites (1 km, 2
km and 65 km inland) within the Hudson Bay Lowlands on the advective wind direction around
Hudson Bay. This has been confirmed by others (Lafleur and Rouse 1988; Rouse et al. 1997).
The current study serves as an extension to these findings to fill an important gap in our
understanding of the advective influence of Hudson Bay on terrestrial carbon dynamics. It is
expected that Ecosystem Respiration (ER) will increase with warmer soil temperatures,
associated with offshore wind regimes, but the response of Gross Primary Productivity (GPP) to
the same influences requires further investigation. Offshore wind regimes during the growing
season are associated with warmer and drier air masses of continental origin, while onshore wind
regimes are associated with cooler and moister air masses originating off the Bay.
Page 5 of 53
https://mc06.manuscriptcentral.com/asopen-pubs
Arctic Science

Draft
6
This study addresses the advective influence of Hudson Bay on the carbon dynamics of
the Hudson Bay Lowlands at an elevated peat plateau near Churchill, Manitoba, Canada. The
primary objectives are to (1) understand the environmental variables that influence the variability
in NEE, GPP and ER of a Subarctic peat plateau during the growing season; (2) quantify the
advective influence of Hudson Bay on the CO2 dynamics of the coastal peatlands through
onshore and offshore wind analysis; (3) and ensure that measurement bias due to vegetation
heterogeneity is addressed in flux computations.
Page 6 of 53
https://mc06.manuscriptcentral.com/asopen-pubs
Arctic Science

Draft
7
Methods
Study site description
Measurements for this study were collected between May 31, 2007 and September 18,
2007 as part of the ArcticNet Theme 3.2 campaign (ArcticNet 2015). The study was conducted
at an elevated peat plateau, 20 km east of Churchill, Manitoba (58° 43' 46''N, 093° 49' 57''W) and
approximately 5 km south of the Hudson Bay coastline (Fig. 1) that runs east-west locally. The
length of the day on the summer solstice is approximately 18.5 hours. The measurement site was
located 17.5 m above sea level, with the ground gently sloping down towards the shore (3.5
m/km). Based on the elevation, the mineral soils at the site emerged from Hudson Bay
approximately 1600 years ago, based on a 0.01 m/year isostatic rebound rate (Stella et al. 2007).
The climate is classified as Low Arctic (Rouse 1993) with cold winters and large summer-winter
temperature contrasts. Mean annual temperature is -6.5°C, and mean total precipitation is 452
mm with about 40% arriving as snow. The lowest daily average temperatures occur in January (-
26.0°C), and the highest daily average is in July (12.7°C) (Environment Canada, 1981-2010
climate normal). The peat layer is 1.5 m thick, while maximum active layer depths are 45 cm.
The site is located approximately 80 km north of the continental treeline, with scattered trees
such as Larix laricina (larch or tamarack) and Picea glauca (white spruce) present in low
numbers locally with shrubs such as Salix spp. (willow) and Betula glandulosa (birch) common
at greater distances from the tower. The peat plateau comprises high center ice-wedge polygons
dominated by mosses (Dicranium elongatum, Tomenthypnum nitens, Aulocomnium spp.) and
lichens (Cladina spp.) as well as Ericacae notably Rhododendron decumbens (dwarf labrador
tea), Empetrum nigrum (crowberry), Vacinium vitis-ideae (low ground cranberry) and the herb
Page 7 of 53
https://mc06.manuscriptcentral.com/asopen-pubs
Arctic Science

Draft
8
Rubus chamaemorus (cloudberry). High center polygon peatlands dominate the inaccesible
interior portion of the Hudson Bay Lowlands, comprising approximately 12,000 km2 in Northern
Manitoba (Dredge and Nixon 1983; Bello and Smith1990) but are highly underrepresented in the
coastal zone. The peat plateau under study is approximately 6 ha in areal extent and within 2 km
of the Churchill Northern Studies Centre on the Twin Lakes Rd., providing a unique opportunity
to examine net ecosystem exchange from habitats of this nature.
Throughout the growing season, the coastal zone of Hudson Bay is subjected to abrupt
changes in weather owing to passages of frontal systems, as well as the effect of sea-breeze
which can lower temperatures by as much as 25°C in a half-hour, especially when the Bay is still
ice covered. In attributing a certain portion of the measured ecosystem response to changes in the
accompanying air mass characteristics alone, throughout the various phenological stages of plant
growth, it was important to first assess the extent to which differences in plant cover between the
onshore and offshore directions might contribute to the observed differences in NEE. A detailed
plant survey was conducted radially along 16 compass directions from the measurement tower in
22.5-degree increments, by measuring plant cover using 50 cm x 50 cm quadrats at 2 m intervals
along each 100 m long transect. Understory cover comprised the vascular species, lichen, moss,
water, rock while the overstory groups comprised the shrubs coniferous trees and cloudberry
(Table 1). Cloudberry was classified as overstory due to its late leafout and large and variable
proportionate cover compared to other vascular species. The influence of plant cover groups on
measured CO2 fluxes for onshore and offshore regimes was assesssed using a weighted footprint
analysis after Schuepp et al. (1990). The results were statistically tested (Table 2) to ensure that
the site asymmetry did not influence the differences in measured fluxes. Plant cover proportions
to the north and south were statistically different, but by less than 4.5% in all cases, well within
Page 8 of 53
https://mc06.manuscriptcentral.com/asopen-pubs
Arctic Science

Draft
9
the closure accuracy of the flux system, suggesting that the tower was optimally located for the
purposes of this study.
Instrumentation
The micrometeorological method of eddy covariance (EC) was applied to measure the
turbulent fluxes of CO2, latent and sensible heat in the surface layer. It directly measures the
scalar constituents and correlates those measurements to vertical wind velocity to give vertical
fluxes. The system consisted of two fast-response instruments; three-dimensional wind
components were measured by a sonic anemometer, model ATI-V style, (Applied Technologies,
Inc.) logging the 20 Hz median of u,v,w wind components sampled at 200 Hz; the mean
concentrations of CO2 and H2O were logged at 20 Hz using an non-dispersive open-path infrared
gas analyzer (NDIR), model LI7500, (LI-COR Inc., Lincoln, NE, USA). Both instruments were
mounted adjacent to each other separated by 12 cm, at a height of 1.49 m above the peat surface,
while the LI7500 was mounted with a slight tilt. Data were logged to a datalogger (Campbell
Scientific Inc., CR3000) using serial and SDM communications.
Slow-response ancillary data were collected to describe the meteorological conditions of
the site every 30 minutes. A net radiometer (Middleton CN1) was placed on an adjacent tower at
the same height as the fast-response instruments, which measured the net radiation surrounding
the tower as Q* (W/m2). A pyranometer (Eppley PSP) measured incoming solar radiation as Rg
(W/m2); three soil heat flux plates (Middleton CN3) were placed at 2 cm below the surface as QG
(W/m2). The slow-response instruments were connected to a Campbell Scientific CR23x data
logger. PPFD (photosynthetic photon flux density) was acquired by applying a linear model to
Page 9 of 53
https://mc06.manuscriptcentral.com/asopen-pubs
Arctic Science

Draft
10
the Rg data. The linear model was developed from the data collected at an EC station
approximately 1 km away.
Data Processing
The high frequency flux data were processed with an open-source EC software, EddyPro
4.1.0 (LI-COR Biogeosciences, Lincoln, NE, USA). The eddy fluxes were calculated as the
covariance between turbulent fluctuations in the vertical wind component and the scalar densities
of CO2 and H2O using covariance optimization for time lag compensation. The data were
averaged over 30 minutes, derived from Reynolds block averaging for trend removal. The sonic
anemometer was adjusted for tilt using the planar fit method (Wilczak et al. 2001) by taking into
account wind fields observed throughout the data collection period. High-pass filtering for low
frequency data loss was performed using a block average detrend method after Moncrieff et al.
(2004). A low-pass high frequency filter for data loss in the high frequency range was performed
after Moncrieff et al. (1997), which accounts for the lateral and longitudinal sensor separation,
sensor time response, scalar and vector path averaging (Foken et al. 2008). An off-season uptake
correction has been performed to account for additional instrument-related sensible heat flux
generation during temperatures below -10 °C, following a method proposed by Burba et al.
(2008). The fluxes were corrected for the effect of temperature and humidity fluctuations in trace
gas concentrations that were not part of the investigated flux, using the WPL correction (Webb et
al. 1980). Periods when less than 90% of the high frequency flux was available were marked as
missing values and addressed during the post-processing. The resultant 30-minute CO2 fluxes
represent NEE, or the balance between the total flux that entered the ecosystem and the total flux
that left the ecosystem.
Page 10 of 53
https://mc06.manuscriptcentral.com/asopen-pubs
Arctic Science

Draft
11
Post Processing
The flux data were flagged using the 1-9 system after Foken (2004), which incorporates a
steady-state, integral turbulence test, and horizontal advection tests. As advised, classes 7-9 have
been removed from the dataset and marked as missing data, accounting for 6.9% of the total
data. Data loss due to adverse weather and instrument malfunctioning accounted for 16% of the
total data. Data loss due to data failing statistical analysis tests, performed after Vickers and
Mahrt (1997), and after manual screening accounted for 7.3%. Of the remaining data,
approximately 4.9% of the nighttime fluxes were removed using a filter. For the removal of
periods under non-turbulent conditions, the filter was applied after Reichstein et al. (2005).
The method involves the binning of temperature values to produce 6 temperature classes, which
are further subdivided into 20 classes. The threshold value was determined to be 0.082
m/s. The total data loss added up to 35.1%, which was gap-filled. A random error of ±0.12
µmol/m2/s was estimated following Moncrieff et al. (1996).
Since the EC method is only able to measure NEE, it is necessary to partition it into the
two component fluxes that make up the total exchange – ER and GPP. In order to obtain ER, we
used one of the most common methods which employs nighttime respiration data as a function of
air temperature and apply the same relationship to daytime values. Respiration has been modeled
using an Arrhenius equation modified by Lloyd and Taylor (1994) as an exponential regression
model derived from all available, non-gap-filled 30-min fluxes:
Page 11 of 53
https://mc06.manuscriptcentral.com/asopen-pubs
Arctic Science

Draft
12
(1)
where ����� is the respiration rate at the reference temperature, ����, set to 10°C and ��is the
regression parameter kept constant at -46.02°C as in the original model. The activation energy
parameter ,��, was adjusted to achieve the most optimal model fit.
The gap-filling was done after Falge et al. (2001) and modified by Reichstein et al.
(2005). Single 30-minute gaps were filled by linear interpolation (Falge et al. 2001); larger gaps
were filled using mean diurnal variation with a 14-day window that looks for the flux under
similar atmospheric conditions (global radiation (Rg, W/m2) air temperature (°C, T), vapour
pressure deficit (kPa, VPD)) (Reichstein et al. 2005), which was the most consistent method
based on 15 different methods analyzed by Moffat et al. (2007). The gaps in the energy fluxes
were filled in the same manner.
Data Treatment
In order to better understand and quantify the effects of Hudson Bay on the Hudson Bay
Lowlands, the flux data were differentiated between onshore and offshore wind regimes. The
study site was situated on a nearly perpendicular tangent with respect to the Hudson Bay
shoreline, which runs due east to west. For this reason, winds originating from north of the east-
west tangent were considered to be onshore winds; winds originating from south of the east-west
tangent were considered to be offshore winds. Due to the smaller frequency of onshore wind
regimes taking place at night, the analysis concentrates on monthly averages using daytime
Page 12 of 53
https://mc06.manuscriptcentral.com/asopen-pubs
Arctic Science

Draft
13
values, which are representative of both wind regimes. The monthly average is considered a long
enough time period to gather data that are representative of both wind regimes.
In order to assess how well the EC system performed, the energy balance closure was
considered, calculated as the ratio of ��
∗��, where �∗ is net radiation, �� is the sensible heat
flux, �� is the latent heat flux and �� is the ground heat flux, all in units of W/m2 . On average,
the system underestimated the turbulent fluxes, but there was a difference between onshore and
offshore regimes. During onshore regimes, the closure was 87%, while under offshore regimes it
was 64%. The difference may be due to larger amount of offshore regimes occurring during
nighttime hours which commonly results in more stable atmospheric conditions. Other northern
peatland studies have reported energy balance closure between 70% and 91% (Lafleur et al.
2001; Lafleur et al. 2003; Sottocornola and Kiely 2010; Runkle et al. 2014). The fluxes
presented have been compensated to achieve energy balance closure.
Given that the datatset was post-processed to produce just two test groups – onshore and
offshore – the statistical tests performed for this study were student’s two-tailed t-tests assuming
equal variances.
Page 13 of 53
https://mc06.manuscriptcentral.com/asopen-pubs
Arctic Science

Draft
14
Results
Environmental Conditions
During the calendar year of 2007, the mean daily air temperature was -9.9°C, slightly
cooler than the climate normal of -6.5°C (Table 3). During the study period, July experienced the
highest mean temperature of 15.4°C, while September had the lowest mean temperature of
5.4°C. All normal monthly temperatures were within ±1 standard deviation of the observed mean
monthly temperatures, except for July, which was 2 standard deviations higher than the climate
normal. The 2007 calendar year was drier than normal, with 338 mm of precipitation, compared
to a 30-year average of 432 mm. The observed precipitation values were 48.2 (44.2), 30.2 (59.8),
44.4 (69.4) and 87.5 (69.9) mm for June, July August and September, respectively; bracketed
numbers are climatological values. Thus, July and August were slightly drier and warmer than
average.
The precipitation (P) and evaporation (E) patterns over the study period are shown in Fig.
2, during which evaporation exceeded precipitation for most of the season. For a nearly two-
week period from DOY 160 to DOY 170, precipitation exceeded evaporation, associated with
spring showers, but lower temperatures suppressed a strong evaporation response. The daily
evaporation rates decreased over the season and were especially low into September when the
evaporation rate decreases and the energy receipt was low. The total evaporation during the
measurement period was 218 mm, while the total rainfall amounted to 193 mm, resulting in an
Page 14 of 53
https://mc06.manuscriptcentral.com/asopen-pubs
Arctic Science
Draft
15
evaporative efficiency (E/P) of 1.12, indicating a net decline of ecosystem water storage and a
receding water table.
Temperature Regimes
The differences in meteorological conditions between the two wind regimes were most
pronounced for temperature (Fig. 3). The distinctive differences in diurnal behavior between on-
and offshore regimes are noteworthy, as offshore air temperatures rose significantly during the
daytime, while onshore temperatures exhibited much smaller maxima, owing to the large
differences in surface sensible heat exchange between the tundra and Hudson Bay. In June, the
onshore diurnal temperatures did not rise beyond 6°C, while the offshore temperatures hovered
around 10°C during the daytime hours. Both regimes experienced a pronounced warming into
July, where the daytime highs averaged 16°C for onshore and 23°C for offshore. Into August,
both regimes cooled, with the offshore temperatures continuing to be warmer, while September
temperatures showed patterns similar to June. Thus, the study was able to capture the diurnal
temperature variation during the growing season that contributed to the significant plant
activities of photosynthesis and respiration. On average for the season, offshore T was 4.15°C
higher than onshore, highlighting the importance of the thermal depression created by Hudson
Bay.
Energy Balance
Page 15 of 53
https://mc06.manuscriptcentral.com/asopen-pubs
Arctic Science
Draft
16
Q* appeared to be larger when winds were blowing offshore during the two coldest
months, June and September, associated with the greatest onshore-offshore temperature contrast
(Fig. 4). A reversed pattern is observed for July and August, where onshore regimes were
associated with greater Q*. QG showed stronger soil warming during offshore regimes in June
and September, but a reversed role during July and August. Over the entire growing season, the
ground experienced a net gain of 60 MJ/m2 through surface exchange during onshore regimes,
while 28 MJ/m2 entered the ground during offshore regimes. QH was higher for onshore than
offshore wind regimes, with a progressive decrease over the measurement period, rather than
peaking during July when Q* and T experienced their highest values. By the end of the season,
onshore and offshore sensible heating amounted to 377 MJ/m2 and 79 MJ/m
2, respectively. QE
was smaller during onshore regime for June and September. At the end of the measurement
period, onshore and offshore QE amounted to 365 MJ/m2 and 173 MJ/m
2, respectively. The
seasonal flux totals were strongly influenced by the higher frequency (56% larger) of onshore
wind.
Table 4 shows normalized values of QH, QE, and QG with respect to Q* by dividing each
of them by Q*. The ratios were derived from an average of all 30-minute daytime measurement
periods occurring in the onshore or the offshore directions for a given month, from June through
September. The partitioning of net radiation into evaporation does not show statistically
significant onshore-offshore differences for any month although there was an apparent increase
of 15% over the entire season existed while winds were blowing offshore. The proportion of net
radiation used in warming the atmosphere, QH/Q*, was consistently larger during onshore
regimes. Lastly, the proportion of net radiation used in ground heating, QG/Q* tended to be
Page 16 of 53
https://mc06.manuscriptcentral.com/asopen-pubs
Arctic Science

Draft
17
stronger during offshore wind regimes on average for all months, particularly in July and August
and 64% larger on average over the entire season.
Response of GPP, ER and NEE to Microclimate Variables
Daily average NEE during the four month period ranged from -0.2 µmol/m2/s in the
middle of September (JD 261), to -5.6 µmol/m2/s towards the end of July (JD 207) (Fig. 5). The
month of June experienced a relatively consistent net uptake of CO2 of about -1.5 µmol/m2/s, but
started to increase (higher negative values) in early July (around DOY 170). However, the net
uptake started to decrease in August and by the end of September, the NEE values started to
approach zero. The ecosystem was a consistent net sink for CO2 throughout the measurement
period. On a monthly basis, the largest uptake occurred in July (53.0 gC/m2 or 4.4 mol/m
2),
while the lowest uptake occurred in August (25.5 gC/m2 or 2.13 mol/m
2). Although GPP was
larger in August (113.9 gC/m2 or 9.49 mol/m
2) than in June (80.7 gC/m
2 or 6.73 mol/m
2), the
ecosystem respiration was substantially higher in August (88.4 gC/m2 or 7.37 µmol/m
2) than in
June (48.7 gC/m2 or 4.06 mol/m
2).
The distinctiveness of ecosystem functioning under opposing wind regimes is shown in
Table 5, as monthly means calculated from all 30-minute daytime measurements. Net ecosystem
exchange was consistently larger under onshore regimes with statistically significant differences
for all months except September, with the largest difference of 37% in July. Ecosystem
respiration was always larger during offshore winds, ranging from 20% higher in August to 45%
higher in June.
Page 17 of 53
https://mc06.manuscriptcentral.com/asopen-pubs
Arctic Science

Draft
18
Monthly average GPP differences are less apparent over the summer, as GPP was higher
during offshore regimes in June and September only. Over the entire measurement period, there
is no statistically significant difference in GPP between onshore and offshore regimes. ER, GPP
and NEE monthly averages do not account for potential biases created by the diurnal timing of
onshore and offshore winds, particularly those that may occur as a result of the sea breeze effect.
Thus, carbon fluxes have been normalized to photosynthetically active radiation (PARx100), in
Table 5, which reveals a stronger photosynthetic efficiency during offshore winds; up to 32%
stronger in July.
Similarly, PAR-normalized ecosystem respiration was always stronger for offshore
winds; up to 91% stronger in July. The interplay between GPP and ER, reflected in the ratio of
the two, ER/GPP, describes how much of GPP is offset by ER. For all months and therefore the
entire season, ER/GPP was always larger when winds were offshore, implying that a greater
proportion of assimilation was returned to the atmosphere through respiration during offshore
regimes. The ecosystem remained a net sink for CO2, except for September under offshore
regimes, where ER was 28% larger than GPP. As a seasonal average, offshore ER/GPP was 67%
higher than onshore ER/GPP.
The onshore/offshore light response curves (Fig. 6a) show little deviation from each other
and are not significantly different ( p>0.05), using the Student-t test mentioned in the Method
section. It is apparent that the sensitivity of GPP to PAR is the same regardless of air mass
origin. However, for the same light levels, onshore conditions are cooler (Fig. 6b). This suggests
that despite cooler temperatures, they are able to keep up with offshore GPP rates owing to
enhanced onshore light levels. This suggests that the rates of ER between onshore and offshore
wind regimes are more influential in the determination of NEE than GPP is.
Page 18 of 53
https://mc06.manuscriptcentral.com/asopen-pubs
Arctic Science

Draft
19
The thermal response of the carbon flux is shown graphically for binned air temperatures
for onshore and offshore wind regimes (Fig. 7a,b). Onshore GPP is consistently higher than
offshore GPP at a given temperature, but the difference quickly diminishes after 20°C (Fig. 7a).
Beyond 20°C offshore GPP experiences a slower increase, although values should be interpreted
with caution as less data points were available for the averaging calculation at such high
temperatures. NEE, comprising both GPP and ER, (Fig. 7b) shows a large difference between
the onshore and offshore winds at the same temperature, with intermediate temperatures (11-
20°C) demonstrating the largest difference in favour of onshore winds, which also coincides with
the highest frequency of occurrence. Given that GPP values do not differ between onshore and
offshore regimes at the same PAR (Fig. 6), other environmental factors that influence the carbon
flux need to be considered. As Fig. 6b suggests, the origin of the air mass does not play a role in
determining the strength of GPP, while it strongly influences the fate of ER through the apparent
sensitivity of temperature through the covariance of PAR and temperature.
Discussion
Page 19 of 53
https://mc06.manuscriptcentral.com/asopen-pubs
Arctic Science

Draft
20
Interplay Between Fluxes
The results of the interplay between GPP and ER under the influence of different
environmental conditions reveals important aspects of the Hudson Bay Lowlands as a coastal
environment where Hudson Bay’s overall influence is intermittently imposed on the adjacent
landscape, even up to 60 km inland as reported by Rouse and Bello (1985). The progression of
daily average NEE over the growing season in 2007 was consistent with the pattern observed for
other years at a nearby location (Lafleur et al. 2012). Although data presented here reflect
ecosystem dynamics of a single year, the patterns are such that they are representative of the
generic ecosystem function, although magnitudes may change inter-annually. At the beginning
of the season, the flux was relatively strong (-2 µmol/m2/s) even shortly after snowmelt, a
process described by Aurela et al. (2002). Since a thin layer of snow can drastically alter the
energy balance of an ecosystem, complete snowmelt allows for increased net radiation and the
concurrent onset of photosynthesis, largely due to the presence of mosses and lichens (Oechel
and Collins 1976). Bryophytes begin photosynthesizing immediately after snowmelt, making
them important contributors earlier in the season before many vascular plants have leafed out. In
September, the NEE abruptly dropped from its August levels, similar to Lafleur et al. (2012),
indicating a quick senescence common to northern environments (Corradi et al. 2005; Lund et al.
2010). At this time of the year, daylength shortens, light levels decrease and temperatures are
much cooler, unable to sustain strong photosynthesis.
Total GPP during the measurement period was 391 gC m-2
of which 66% occurred during
onshore wind regimes, while responding to a number of environmental controls that mutually
Page 20 of 53
https://mc06.manuscriptcentral.com/asopen-pubs
Arctic Science

Draft
21
contribute to stronger onshore CO2 uptake. For the same temperature, onshore light levels
consistently exceeded offshore levels, which was reflected in higher onshore GPP for any given
temperature. The strong association between light levels and GPP with respect to marine origin
air masses has also been documented by Lafleur and Rouse (1988). The onshore GPP strength
for a given temperature, as shown in Fig. 7a, is directly translated into enhanced onshore NEE
(Fig. 7b), as a direct consequence of the slope difference between onshore and offshore GPP rise
with increasing temperatures.
The analysis reveals that GPP is less sensitive to temperature than ER, a result consistent
with the findings of others (Billings et al. 1982; Silvola et al. 1996; and McGuire et al. 2000),
regardless of air mass origin. Others report the opposite (McKane et al. 1997) or similar
temperature sensitivities (Chivers et al. 2009), who attribute enhanced GPP in warmer soils to an
increase in nutrient availability at Arctic tundra sites. In the current study, it is unlikely that
changes in nutrient availability would accompany abrupt changes in air mass origin on a time
scale of several hours. The results suggest that with increasing temperatures in the Arctic, the
plant community will assimilate more CO2 under onshore regimes compared to offshore regimes,
if light level differences remain the same between the two regimes. Considering the small dataset
representing temperatures beyond 20°C, it would be difficult to predict how light levels will
change under a warming climate, requiring further research. Nevertheless, the Bay is associated
with high pressure systems due to cooler temperatures and restricted moisture availability as a
result of ice cover, contributing to clear skies under onshore regimes. This illustrates its strong
influence on the surrounding coastal ecosystems, brought on by its current ice cover conditions.
Page 21 of 53
https://mc06.manuscriptcentral.com/asopen-pubs
Arctic Science

Draft
22
Energy Balance and Permafrost
The partitioning of the coastal energy balance is expected to have a significant effect on
the heat flow within the soil columns and within the boundary layer. The way energy is
partitioned at the land surface directly influences the micrometeorological conditions of the
ecosystem through the interaction between heat and moisture and potentially temperature and
precipitation. Average net radiation does not show a difference between onshore and offshore
regimes, but its partitioning into QE, QH and QG does. Although the mean onshore/offshore
QE/Q* is not statistically different, 46% of the growing season evaporation occurred when air
masses were of marine origin. Rouse and Bello (1985) showed a similar pattern for their sea,
near-coast and inland sites, illustrating the suppression of evaporation due to reduced vapor
pressure gradients caused by the advective influence of moist cool air off Hudson Bay. The
sensible heat flux increases strongly in response to cool air masses originating from the Bay,
thereby lowering surface temperatures and removing energy that would have otherwise been
utilized by QG for permafrost degradation. This, in turn, reduces the vertical temperature gradient
into the soil suppressing the ground heat flux as a result of the Bay’s presence (Rouse 2000). For
tundra sites, a large proportion of summertime net radiation (~10-20%) is normally consumed in
ground heating as a consequence of a sparse canopy and proximity of the frost table. (Lafleur et
al.1997; Eugster et al. 2000; Kellner 2001). The enhanced ground heating observed during
offshore regimes increases soil temperatures and active layer growth, both contributing to
heterotrophic decomposition, especially in soils comprised entirely of peat that house non-
vascular plants (Callaghan et al. 2004). This is represented in the measured ecosystem
respiration being especially sensitive to the changing wind direction and the air temperatures
associated with those winds.
Page 22 of 53
https://mc06.manuscriptcentral.com/asopen-pubs
Arctic Science

Draft
23
Expectations under a Warming Climate
In the mid 80’s and 90’s, northern latitudes were generally considered to be sinks for
atmospheric CO2 (Tans et al. 1990; Ciais et al. 2000) but with increasing global temperatures
this may change. Extensive studies on carbon dynamics have demonstrated that temperature has
an observed influence on NEE (Callaghan et al. 2004; Groendahl et al. 2007; Parmentier et al.
2011), although others have not found a strong link (Griffis et al. 2000; Aurela et al. 2004). As
part of a dynamic system, there exist many nonlinear interacting processes within the carbon
dynamical processes that would influence the net flux of carbon at the surface. But based on our
field observations, we think there are two potential outcomes under a warming climate, where
carbon sinks strengthen due to altered biogeochemical processes or where carbon stocks become
sources due to increased respiration. Based on shown results, we expect the ecosystem to begin
to undergo conditions typical of offshore wind regimes in a more pronounced fashion,
characterized by higher temperatures, enhanced ground warming and active layer deepening,
greater evaporation, and reduced light levels. The results presented here show that although
offshore wind regimes produce GPP rates comparable to onshore, they are associated with a
stronger increase in ER, making such regimes weaker sinks and supporting the second scenario.
Since higher temperatures are expected to prolong the growing season (Myneni et al.
1997) a shift in vegetation dynamics is to be expected alongside. This is anticipated to increase
carbon stocks by accumulating newer and larger quantities of organic matter into the peat
(Aurela et al. 2004; Euskirchen et al. 2006; Schuuer et al. 2008). In accord with results presented
in this study, Parmentier et al. (2011) conducted a multi-year analysis of NEE, GPP and ER, and
concluded that longer growing season and warmer temperatures do not increase the NEE uptake
Page 23 of 53
https://mc06.manuscriptcentral.com/asopen-pubs
Arctic Science
Draft
24
in their Siberian location, mainly a result of increased ER sensitivity to increased air
temperatures in comparison to GPP; similar results were found by others (Dorrepaal et al. 2009;
Cai et al. 2010). Consequently, northern ecosystems adapted to cold climate will not benefit by
increased air temperatures with respect to carbon sequestration, as reinforced by our results and
those of others (Fan et al. 2013). Instead, warmer air masses due to large-scale circumpolar
warming are likely to skew the carbon flux towards increased respiration and decreased total
carbon uptake during both onshore and offshore regimes. In addition to this global trend, the
gradual disappearance of sea ice is expected to drive local and regional warming by altering the
composition of the onshore air mass.
At the present time, the geographical situation of Hudson Bay predisposes it to having
nearly complete year-round ice cover, except for two months. In August and September, the Bay
is completely ice-free and summer and fall are characterized by 30-year negative sea-ice cover
trends (Barber et al. 2012; Cavalieri and Parkinson 2012). This will have a significant influence
on the atmospheric circulation regime over the Hudson Bay region. In addition to the influence
of increasing global and regional temperatures on the make-up of onshore and offshore air
masses, temperature is likely a driver for shifting winds. Positive temperature anomalies are
correlated with negative sea-ice trends, most pronounced on the western and south-western part
of the Bay, showing a decrease of 23.3% to 26.9% per decade since 1980 (Hochheim and Barber
2010). Evidence of changing wind regimes is presented by Hochheim et al. (2011), who found
that anti-cyclonic atmospheric rotation occurs under high sea level pressure and low land surface
pressure, resulting in onshore regimes. This pattern has been observed prior to 1989, whereas the
post 1989 period is characterized by cyclonic atmospheric circulation which results from low sea
level pressure and high land surface pressure, resulting in offshore winds. These results are
Page 24 of 53
https://mc06.manuscriptcentral.com/asopen-pubs
Arctic Science

Draft
25
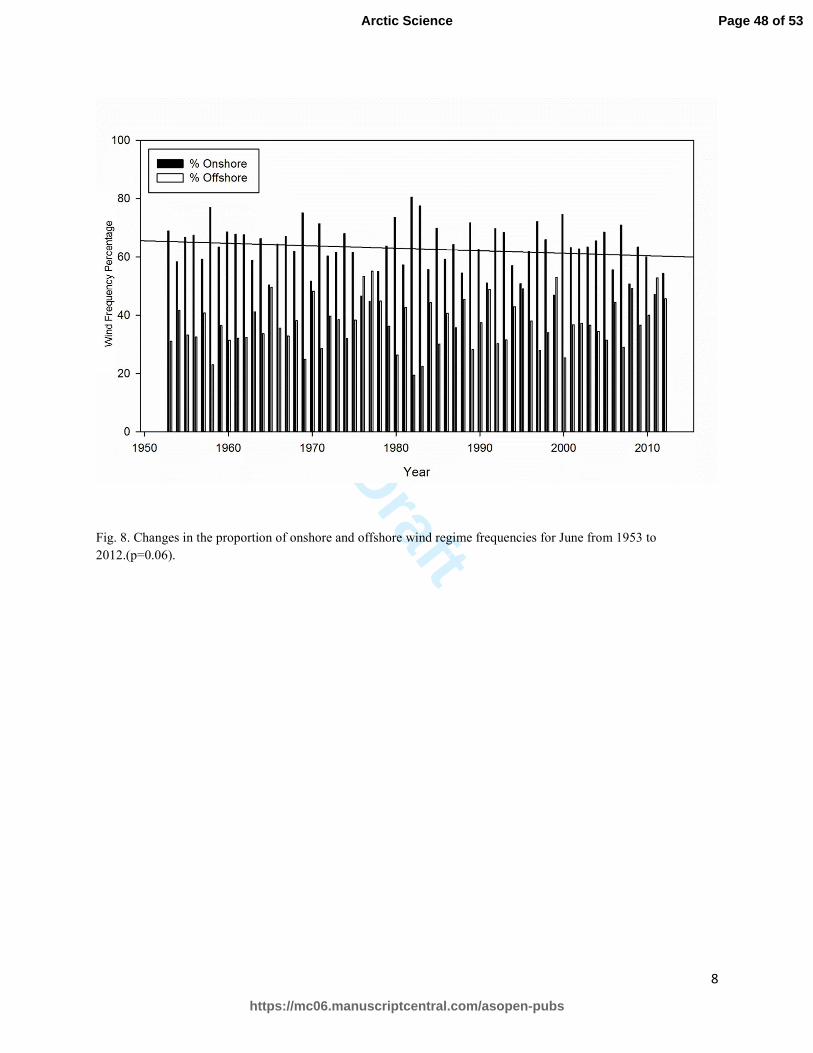
consistent with the qualitative indication of the decreasing frequency of onshore winds,
compared to offshore winds (Fig. 8) during the month of June. The month of June behaves as a
transitional month between ice-covered and ice-free water in Hudson Bay, and therefore is an
indication of the encroaching offshore winds in the past, present and in the future. The decrease
in onshore wind frequency will result in a weakened advective influence of Hudson Bay on the
coastal Hudson Bay Lowlands, thereby increasing air and soil temperatures and decreasing the
strength of the carbon sink. The conclusions reached are reinforced by those found by Rouse and
Bello (1985) who identified a modest shift from onshore to offshore wind regimes as a result of
advanced melting in the early growing season. The observed shift from onshore to offshore
regimes in conjunction with melting sea ice will weaken the carbon sink of the coastal Hudson
Bay Lowlands, in consequence reducing its capacity to sequester the increasing concentration of
CO2 in the atmosphere. A probable shift to more frequent offshore winds coupled with
circumpolar scale air warming has significant implications for the degradation of permafrost
through a deepening of the active layer, which has already been noted to occur (Payette et al.
2004).
During the 2007 growing season, the peat plateau experienced a substantial net gain of
carbon, 116 gC/m2. If the respiration before and after the growing season is accounted for by
using the measured air temperatures from the Churchill airport (Environment Canada 2013) and
using the respiration model described by Lloyd and Taylor (1994), the sequestered amount
reduces to 27 gC/m2/year, which is relatively close to the long term value of 23 gC/m
2 /year
estimated by Gorham (1991) for northern peatlands. Yet, this represents only 9.8% and 6.9% of
annual GPP and ER, respectively, which is comparable to potential measurement errors. It is
noteworthy that this coastal peat plateau comprises close to 50% vascular plant cover which is
Page 25 of 53
https://mc06.manuscriptcentral.com/asopen-pubs
Arctic Science

Draft
26
not necessarily representative of ice-wedge polygon systems in general. Nevertheless, if this
value is extrapolated to the entire area of the Hudson Bay Lowlands of 250,000 km2, the uptake
corresponds to 6.7 MtC/year. It is important to note the large uncertainty in extrapolating the
carbon flux of a small area over the vast and heterogeneous ecosystems of the Hudson Bay
Lowlands, however it does highlight the role tundra ecosystems in cold environments can play in
mitigating anthropogenic emissions.
Conclusion
The difference in the CO2 flux from upland tundra during onshore and offshore wind
regimes was measured using the EC method in the Hudson Bay Lowlands near Churchill, MB.
During the 2007 growing season, the peat plateau experienced a substantial net gain of carbon,
116 gC/m2.
It was confirmed that the Hudson Bay has an advective influence on the carbon dynamics
and energy balance of the coastal Hudson Bay Lowlands as others have concluded (Rouse and
Bello 1985; Lafleur and Rouse 1988; Rouse et al. 1997). The CO2 flux between the two wind
regimes differed significantly, reinforcing the importance of Hudson Bay as mostly frozen water
body dominated by onshore wind regimes. When normalized to PAR, there was no statistical
difference between the GPP of onshore and offshore regimes, yet the offshore air temperature
was significantly higher than the onshore air temperature. This suggests that although air
temperatures have no effect on the difference of onshore and offshore GPP, ER is responsive to
air mass origin. The strong response of ER is associated with different QH energy portioning,
whereby onshore regimes remove energy that would otherwise warm the permafrost, while
Page 26 of 53
https://mc06.manuscriptcentral.com/asopen-pubs
Arctic Science

Draft
27
offshore regimes add energy that contributes to permafrost degradation. This indicates a
potential deterioration of the CO2 budget of the Hudson Bay Lowlands under projected climate
warming and sea ice reduction. As such, a better understanding of meso-scale wind regimes and
sea ice dynamics under a warming climate is needed to have the ability to accurately project the
future response of the coastal Hudson Bay Lowlands. Nevertheless, the observed shift from
onshore to offshore regimes in conjunction with melting sea ice will weaken the carbon sink of
the Hudson Bay Lowlands, in consequence reducing its capacity to sequester the increasing
global emissions.
Acknowledgements
The authors would like to acknowledge the funding support of ArcticNet, the Department of
Aboriginal Affairs and Northern Development Canada through the Northern Scientific Training
Program, The Faculty of Liberal Arts and Professional Studies, York University, and the
Churchill Northern Studies Centre through the Northern Research Fund. The logistical support
of Clifford Paddock and staff of the Churchill Northern Studies Centre, Dr. Mario Tenuta and
Dr. Tim Papakyriakou of the University of Manitoba is gratefully acknowledged. Field
assistance was provided by Robert Whitten, Patrick Mojdehi, Kyle Switsyn, Ryan Rimas and
Patrick Shuman and was instrumental to the success of this project. The authors would also like
to thank the two anonymous reviewers who provided valuable criticism to this paper.
Page 27 of 53
https://mc06.manuscriptcentral.com/asopen-pubs
Arctic Science

Draft
28
References
ArcticNet. 2015. Theme 3 – Managing the Largest Canadian Watershed in a New Climate: Land-
Ocean Interactions in Sub-Artic Hudson Bay. Research. Data Accessed: December 21,
2015. < http://www.arcticnet.ulaval.ca/research/theme3.php>
Armentano, T.V., and Menges, E.S. 1986. Patterns of change in the carbon balance of organic
soil-wetlands of the temperate zone. Journal of Ecology, 74,755-774.
Aurela, M., Laurila, T., and Tuovinen, J.P. 2002. Annual CO2 balance of a subarctic fen in
northern Europe: Importance of the wintertime efflux. Journal of Geophysical Research,
107, 17-1 – 17-12.
Aurela, M., Laurila, T., and Tuovinen, J.P. 2004. The timing of snow melt controls the annual
CO2 balance in a subarctic fen. Geophysical Research Letters, 31, GL20315.
Aurela, M., Riutta, T., Laurila, T., Tuovinen, J.P., Vesala, T., Tuittila, E.S., Rinne, J., Haapanala,
S., and Laine, J. 2007. CO2 exchange of a sedge fen in southern Finland – the impact of a
drought period. Tellus, 59B, 826-837.
Barber, D.G., Asplin, M.G., Raddatz, R.L., Candlish, L.M., Nickels, S., Meakin, S., Hochheim,
K.P., Lukovich, J.V., Galley, R.J. and Prinseberg, S.J. 2012. Change and variability in
sea ice during the 2007-2008 Canadian International Polar Year program. Climatic
Change, 115, 115-133.
Bello, R.L., and Smith, J.D. 1990. The effects of weather variability on the energy balance of the
lake in the Hudson Bay Lowlands, Canada. Arctic and Alpine Research, 22, 1, 98-107.
Billings, W.D., Luken, J.O., Mortensen, D.A., and Peterson, K.M. 1982. Arctic tundra: A source
or a sink for atmospheric carbon dioxide in a changing environment? Oecologia, 53, 7-
11.
Page 28 of 53
https://mc06.manuscriptcentral.com/asopen-pubs
Arctic Science
Draft
29
Burba, G.G., Mc Dermitt, D., Grelle, A., Anderson, D.J., and Xu, L. 2008. Addressing the
influence of instrument surface heat exchange on the measurements of CO2 flux from
open-path gas analyzers. Global Change Biology, 14:1854–1876.
Burton, K.L., Rouse, W.R., and Boudreau, L.D. 1996. Factors affecting the summer carbon
dioxide budget of subarctic wetland tundra. Climate Research, 6, 203-213.
Cai, T., Flanagan, L.B., and Syed, K.H. 2010. Warmer and drier conditions stimulate respiration
more than photosynthesis in a boreal peatland ecosystem: Analysis of automatic
chambers and eddy covariance measurements. Plant, Cell and Environment, 33, 394-407.
Callaghan, T.V., Bjorn, L.O., Chernov, Y., Chapin, T., Christensen, T.R., Huntley, B., Ims, R.A.,
Johansson, M., Jolly, D., Jonasson, S., Matveyeva, N., Panikov, N., Shaver, G.,
Schaphoff, S., and Sitch, S. 2004. Effects of changes in climate on landscape and regional
processes, and feedbacks to the climate system. Ambio, 33, 459-468.
Cavalieri, D.J., and Parkinson, C.L. 2012. Arctic sea ice variability and trends, 19679-2010. The
Cryosphere, 6, 881-889.
Cess, R.D., Potter, G.L., Zhang, M.H., Blanchet, J.P., Chalita, S., Colman, R., Dazlich, D.A., Del
Denio, A.D., Dymnikov, V., Galin, V., Jerrett, D., Keup, E., Lacis, A.A., Le Treut, H.,
Liang, X.Z., Mahfouf, J.F., McAvaney, B.J., Meleshko, V.P., Mitchell, J.F.B., Morcrette,
J.J., Norris, P.M., Randall, D.A., Rikus, L., Roeckner, E., Royer, J.F., Schlese, U.,
Sheinin, D.A., Slingo, J.M., Sokolov, A.S., Taylor, K.E., Washington, W.M., Wetherald,
R.T., and Yagai, I. 1991. Interpretation of snow-climate feedback as produced by 17
general circulation models. Science, 253, 888-892.
Chapin III, F.S., Strum, M., Serreze, M.C., McFadden, J.P., Key, J.R., Lloyd, A.H., McGuire,
A.D., Rupp, T.S., Lynch, A.H., Schimel, J.P., Beringer, J., Chapman, W.L., Epstein,
H.E., Euskirchen, E.S., Hinzman, L.D., Jia, G, Ping, C.L., Tape, K.D., Thompson,
Page 29 of 53
https://mc06.manuscriptcentral.com/asopen-pubs
Arctic Science

Draft
30
C.D.C., Walker, D.A., and Welker, J.M. 2005. Role of land-surface changes in Arctic
summer warming. Science, 310, 657-660.
Chapman, W.L., and Walsh, J.E. 1993. Recent variations of sea ice and air temperature in high
latitudes. Bulletin of the American Meteorological Society, 74, 33-47.
Chivers, M.R., Turetsky, M.R., Waddington, J.M., Harden, J.W., and McGuire, A.D. 2009.
Effects of experimental water table and temperature manipulations on ecosystem CO2
fluxes in an Alaskan rich fen. Ecosystems, 12, 1329-1342.
Ciais, P., Peylin, P., and Bousquet, P. 2000. Regional biospheric carbon fluxes as inferred from
atmospheric CO2 measurements. Ecological Applications, 10, 1574-1589.
Clymo, R.S., Turunen, J., and Tolonen, K. 1998. Carbon accumulation in peatland. OIKOS, 81,
368-388.
Corradi, C., Kolle, O., Walter, K., Zimov, S.A., and Schulze, E.D. 2005. Carbon dioxide and
methane exchange of a north-yeast Siberian tussock tundra. Global Change Biology, 11,
1910-1925.
Danielson Jr., E.R. 1971. Hudson Bay ice conditions. Arctic, 24, 90-107.
Dorrepaal, E., Toet, S., van Logtestijn, R.S.P., Swart, E, van de Weg, M.J., Callaghan, T.V., and
Aert, R. 2009. Carbon respiration from subsurface peat accelerated by climate warming
in the subarctic. Nature, 460, 616-620.
Dredge, L.A., and Nixon, M. 1986. Surficial Geology, Northeastern Manitoba. Geological
Survey of Canada, Map 1517A, scale 1:500,000.
Dredge, L.A., and Mott, R.J. 2003. Holocene pollen records and peatland development,
northeastern Manitoba. Geographic Phisique et Quarternaire, 57, 7-19.
Page 30 of 53
https://mc06.manuscriptcentral.com/asopen-pubs
Arctic Science

Draft
31
Environment Canada 2013. National Climate Data and Information Archive. Churchill Airport,
1953-2012.
Eugster, W., Rouse, W.R., Pielke Sr., R.A., McFadden, J.P., Baldocchi, D.D., Kittel, T.G.F.,
Chapin III, F.S., Liston, G.E., Vidale, P.L., Vaganov, E., and Chambers, S. 2000. Land-
atmosphere energy exchange in Arctic tundra and boreal forest: available data and
feedbacks to climate. Global Change Biology, 6, 84-115.
Euskirchen, E.S., McGuire, A.D., Kicklighter, D.W., Zhuang, Q., Clein, J.S., Dargaville, R.J.,
Dye, D.G., Kimball, J.S., McDonald, K.C., Melillo, J.M., Romanovsky, V.E., and Smith,
N.V. 2006. Importance of recent shifts in soil thermal dynamics on growing season
length, productivity, and carbon sequestration in terrestrial high-latitude ecosystems.
Global Change Biology, 12, 731-750.
Fan Z., McGuire, A.D., Turetsky, M.R., Harden, J.W., Waddington, J.M., and Kane, E.S. 2013.
The response of soil organic carbon of a rich fen peatland in interior Alaska to projected
climate change. Global Change Biology, 19, 604-620.
Falge, E., Baldocchi, D., Olson, R., Anthoni, P., Aubinet, M., Bernhofer, C., Burba, G.,
Ceulemans, R., Clement, R., Dolman, H., Granier, A., Gross, P., Grunwald, T., Hollinger,
D., Jensen, N.O., Katul, G., Keronen, P., Kowalski, A., Lai, C.L., Law, B.E., Meyers, T.,
Moncrieff, J., Moors, E., Munger, J.W., Pilegaard, K., Rannik, U., Rebmann, C., Suyker,
A., Tenhunen, J., Tu, K., Verman, S., and Vesala, T. 2001. Gap filling strategies for
defensible annual sums of net ecosystem exchange. Agricultural and Forest Meteorology,
107, 43-69.
Foken, T. 2008. Micro-meteorology. Berlin: Springer.
Page 31 of 53
https://mc06.manuscriptcentral.com/asopen-pubs
Arctic Science

Draft
32
Foken, T., Gockede, M., Mauder, M., Mahrt, L., Amiro, B.D., and Munger, J.W. 2004. Post-field
quality control, in: Handbook of Micrometeorology. Kluwer Academic Publishers,
Dordrecht.
Gagnon, A.S., and Gough, W.A. 2005. Trend and Variability in the Dates of Ice Freeze-up and
Breakup over Hudson Bay and James Bay. Arctic 58(4), 370-382
Gorham, E. 1991. Northern Peatlands: Role in the carbon cycle and probable responses to
climatic warming. Ecological Applications, 1, 182-195.
Griffis, T.J., Rouse, W.R., and Waddington, J.M. 2000. Interannual variability of net ecosystem
CO2 exchange at a subarctic fen. Global Biogeochemical Cycles, 14, 1109–1121.
Groendahl, L., Friborg, T., and Soegaard, H. 2007. Temperature and snow-melt controls on
interannual variability in carbon exchange in the high Arctic. Theoretical and Applied
Climatology, 88, 111-125.
Hamilton, J.D., Kelly, C.A., Rudd, J.W.M., Hesslein, R.H., and Roulet, N.T. 1994. Flux to the
atmosphere of CH4 and CO2 from wetland ponds on the Hudson Bay Lowlands (HBLs).
Journal of Geophysical Research, 99, 1495-1510.
Heimann, M., and Reichstein, M. 2008. Terrestrial ecosystem carbon dynamics and climate
feedbacks. Nature, 451, 289-292.
Henry, M. 2011. Sea ice trends in Canada. Statistics Canada – EnviroSats, 5, 3-13.
Hinzman, L.D., Bettez, N.D., Bolton, W.R., Chapin, F.S., Dyurgerov, M.B., Fastie, C.L.,
Griffith, B., Hollister, R.D., Hope, A., et. al. 2005. Evidence and implications of recent
climate change in northern Alaska and other arctic regions. Climatic Change, 75, 251-
298.
Page 32 of 53
https://mc06.manuscriptcentral.com/asopen-pubs
Arctic Science

Draft
33
Hinzman, L.D., Goering, D.J., and Kane, D.L. 1998. A distributed thermal model for calculating
soil temperature profiles and depth of thaw in permafrost regions. Journal of Geophysical
Research: Atmospheres, 103, 28975-28991.
Hochheim, K.P., and Barber, D.G. 2010. Atmospheric forcing of sea ice in Hudson Bay during
the fall period, 1980-2005. Journal of Geophysical Research, 115, JC5334.
Hochheim, K.P., Lukovich, J.V., and Barber, D.G. 2011. Atmospheric forcing of sea ice in
Hudson Bay during the spring period, 1980-2005. Journal of Marine Systems, 88, 476-
487.
Joiner, D.W., Lafleur, P.M., McCaughey, J.H., and Bartlett, P.A. 1999. Interannual variability in
carbon dioxide exchanges at a boreal wetland in the BOREAS northern study area.
Journal of Geophysical Research, 104, 27663-27672.
Kellner, E. 2001. Surface energy fluxes and control of evapotranspiration from a Swedish
Sphagnum mire. Agricultural and Forest Meteorology, 110, 101-123.
Lafleur, P.M., and Rouse, W.R. 1988. The influence of surface cover and climate on energy
partitioning and evaporation in a subarctic wetland. Boundary-Layer Meteorology, 44,
327-347.
Lafleur, P.M., Roulet, N.T., and Admiral, S.W. 2001. Annual cycle of CO2 exchange at a bog
peatland. Journal of Geophysical Research – Atmospheres, 106, 3071-3081.
Lafleur, P.M., Roulet, N.T., Bubier, J.L., Frolking, S., and Moore, T.R. 2003. Interannual
variability in the peatland-atmosphere carbon dioxide exchange at an ombrotrophic bog.
Global Biogeochemical Cycles, 17, 1-14.
Lafleur, P.M., Humphreys, E.R., St. Louis, V.L., Myklebust, M.C., Papakyriakou, T., Poissant,
L., Barker, J.D., Pilote, M., and Swystun, K.A. 2012. Variation in peak growing season
Page 33 of 53
https://mc06.manuscriptcentral.com/asopen-pubs
Arctic Science
Draft
34
net ecosystem production across the Canadian Arctic. Environmental Science and
Ecology, 46, 7971-7977.
Lafleur, P.M., McCaughey, J.H., Joiner, D.W., Bartlett, P.A., and Jelinski, D.E. 1997. Seasonal
trends in energy, water, and carbon dioxide fluxes at a northern boreal wetland. Journal
of Geophysical Research – Atmospheres, 102, 29009-29020.
Lloyd, J., and Taylor, J.A. 1994. On the temperature dependence of soil respiration. Functional
Ecology, 8, 315-323.
Lund, M., Lafleur, P.M., Roulet, N.T., Lindroth, A., Christensen, T.R., Aurela, M., Chojnicki,
B.H., Flanagan, L.B., Humphreys, E.R., Laurila, T., Oechel, W.C., Olejnik, J., Runne, J.,
Schubert, P., and Nilsson, M.B. 2010. Variability in exchange of CO2 across 12 northern
peatland and tundra sites. Global Change Biology, 16, 2436-2448.
Luo, Y. 2007. Terrestrial carbon-cycle feedback to climate warming. Annual Review of Ecology,
Evolution and Systematics, 38, 683-712.
McGuire, A.D., Clein, J.S., Melillo, J.M., Kicklighter, D.W., Meier, R.A., Vorosmarty, C.J., and
Serreze, M.C. 2000. Modelling carbon responses of tundra ecosystems to historial and
projected climate: sensitivity of pan-Arctic carbon storage to temporal and spatial
variation in climate. Global Change Biology, 6, 141-159.
McKane, R.B., Rastetter, E.B., Shaver, G.R., Nadelhoffer, K.J., Giblin, A.E., Laundre, J.A., and
Chapin III, F.S. 1997. Climatic effects on tundra carbon storage inferred from
experimental data and a model. Ecology, 78, 1170-1187.
Moncrieff, J.B., Clement, R., Finnigan, J., and Meyers, T. 2004. Averaging, detrending and
filtering of eddy covariance time series, in: Handbook of Mictometeorology. Kluwer
Academic Publishers, Dordrecht.
Page 34 of 53
https://mc06.manuscriptcentral.com/asopen-pubs
Arctic Science

Draft
35
Moncrieff, J.B., Malhi, Y., and Leuning, R. 1996. The propagation of errors in long-term
measurements of land-atmosphere fluxes of carbon and water. Global Change Biology, 2,
231-240.
Moncrieff, J.B., Massheder, J.M., DeBruin, H., Elbers, J., Friborg, T., Heusinkveld, B., Kabat,
P., Scott, S., Soegaard, H., and Verhoef, A. 1997. A system to measure fluxes of
momentum, sensible heat, water vapour and carbon dioxide. Journal of Hydrology, 188-
189, 589-611.
Moore, T.R., and Knowles, R. 1989. The influence of water table levels on methane and carbon
dioxide emissions from peatland soils. Canadian Journal of Soil Science, 69, 33-38.
Myneni, R.B., Keeling, C.D., Tucker, C.J., Asrar, G., and Nemani, R.R. 1997. Increased plant
growth in the northern high latitudes from 1981-1991. Nature, 386, 698-702.
Nelson, F.E., Shiklomanov, N.I., Mueller, G.R., Hinker, K.M., Walker, D.A., and Bockheim,
J.G. 1997. Estimating active-layer thickness over a large region: Kuparuk River Basin,
Alaska, USA. Arctic and Alpine Research, 29, 367-378.
Nykanen, H., Alm, J., Lang, K., Silvola, J., and Martikainen, P.J. 1995. Emissions of CH4, N2O
and CO2 from a virgin fen and a fen drained for grassland in Finland. Journal of
Biogeography, 22, 351-357.
Oechel, W.C., and Collins, N.J. 1976. Comparative CO2 exchange patterns in mosses from two
tundra habitats at Barrow, Alaska. Canadian Journal of Botany, 54, 1355-1369.
Oechel, W.C., Hastings, S.J., Vourlitis, G., Jenkins, M., Riechers, G., and Grulke, N. 1993.
Recent change of Arctic tundra ecosystems from a net carbon dioxide sink to a source.
Nature, 361, 520-523.
Payette, S., Delwaide, A., Caccianiga, M., and Beauchemin, M. 2004. Accelerated thawing of
subarctic peatland permafrost over the last 50 years. Geophysical Research Letters, 31, 1-
4.
Page 35 of 53
https://mc06.manuscriptcentral.com/asopen-pubs
Arctic Science

Draft
36
Parmentier, F.J.W., van der Molen, M.K., van Huissteden, J., Karsanaev, S.A., Kononov, A.V.,
Suzdalov, D.A., Maximov, T.C., and Dolman, A.J. 2011. Longer growing seasons do not
appear to increase net carbon uptake in Northeastern Siberian tundra. Journal of
Geophysical Research: Biogeosciences, 116, JG1653.
Reichstein, M., Falge, E., Baldocchi, D., Papale, D., Aubinet, M., and Berbigier, P. 2005. On the
separation of net ecosystem exchange into assimilation and ecosystem respiration: review
and improved algorithm. Global Change Biology, 11, 1424-1439.
Riley, J. 2011. Wetlands of the Hudson Bay Lowlands. Nature Conservancy of Canada and the
Ontario Ministry of Natural Resources, Toronto, Ontario, Canada, 156 pp.
Rizzo, R., and Wilken, E. 1992. Assessing the sensitivity of Canada’s ecosystems to climatic
change. Climatic Change, 21, 35-55.
Roulet, N.T., Lafleur, P.M., Richard, P.J.H., Moore, T.R., Humphreys, E.R., and Bubier, J. 2007.
Contemporary carbon balance and late Holocene carbon accumulation in a northern
peatland. Global Change Biology, 13, 397-411.
Rouse, W.R., and Bello, R.L. 1985. Impact of Hudson Bay on the energy balance in the Hudson
Bay Lowlands and the potential for climatic modification. Atmosphere-Ocean, 23, 375-
392.
Rouse, W.R. 1993. Northern Climates, in Canada’s Cold Environments, H.M. French and O.
Slaymaker (eds.), McGill Queens Press Montreal & Kingston, 340pp.
Rouse, W.R. 2000. The energy and water balance of high-latitude wetlands: control and
extrapolation. Global Change Biology, 6, 59-68.
Page 36 of 53
https://mc06.manuscriptcentral.com/asopen-pubs
Arctic Science

Draft
37
Rouse, W.R., Bello, R.L., D’Sourza, A., and Griffis, T.J. 2002. The annual carbon budget for fen
and forest in a wetland at Arctic treeline. Arctic, 55, 229-237.
Rouse, W.R., Hardill, S.G., and Lafleur, P. 1987. Energy balance in the coastal environment of
James Bay and Hudson Bay during the growing season. Journal of Climatology, 7, 165-
179.
Runkle, B.R.K., Wille, C., Gazovic, M., Wilmking, M., and Kutzbach, L. 2014. The surface
energy balance and its drivers in a boreal peatland fen of northwestern Russia. Journal of
Hydrology, 511, 359-373.
Schuepp, P.H., Lecrec, M.Y., MacPherson, J.I., and Desjardins, R.L. 1990. Footprint prediction
of scalar fluxes from analytical solutions of the diffusion equation. Boundary-Layer
Meteorology, 50, 355-373.
Schuur, E.A.G., Bockheim, J., Canadell, J.P., Euskirchen, E., Field, C.B., Goryachkin, S.V.,
Hagemann, S., Kuhry, P., Lafleur, P.M. et. al. 2008. Vulnerability of permafrost carbon
to climate change: implications for the global carbon cycle. BioScience, 58, 701-714.
Serreze, M.C., Walsh, J.E., Chapin III, F.S., Osterkamp, T., Dyurgerov, M., Romanovsky, V.,
Oechel, W.C., Morison, J., Zhang, T., and Barry, R.G. 2000. Observational evidence of
recent change in the northern high-latitude environment. Climatic Change, 45, 159-207.
Shurpali, N.J., Verma, S.B., Kim, J., and Askebauer, T.J. 1995. Carbon dioxide exchange in a
peatland ecosystem. Journal of Geophysical Research, 100, 14319-14326.
Silvola, J., Alm, J., Ahlholm, U., Nykanen, H., and Martikainen, P.J. 1996. CO2 fluxes from peat
inn boreal mires under varying temperature and moisture conditions. Journal of Ecology,
84, 219-228.
Page 37 of 53
https://mc06.manuscriptcentral.com/asopen-pubs
Arctic Science

Draft
38
Smith, L.C., MacDonald, G.M., Velichko, A.A., Beilman, D.W., Borisova, O.K., Kremenetski,
K.V., and Sheng, Y. 2004. Siberian peatlands a net carbon sink and global methane
source since the early Holocene. Science, 303, 353:356.
Sottocornola, M., and Kiely, G. 2010. Energy fluxes and evaporation mechanisms in an Atlantic
blanket bog in southwestern Ireland. Water Resources Research, 46, 1-13.
Stella, G.F., Stein, S., Dixon, T.H., Craymer, M., James, T.S., Mazzotti, S., and Dokka, R.K.
2007. Observation of glacial isostatic adjustment in “stable” North America with GPS.
Geophysical Research Letters, 34, 1-6.
Tans, P.P., Fung, I.Y., and Takahashi, T. 1990. Observational constraints on the global
atmospheric CO2 budget. Science, 247, 1431-1438.
Waddington, J.M., and Roulet, N.T. 1996. Atmosphere-wetland carbon exchanges: Scale
dependency of CO2 and CH4 exchange on the developmental topography of a peatland.
Global Biogeochemical Cycles, 10, 233-245.
Webb, E.K., Pearman, G.I., and Leuning, R. 1980. Correction of flux measurements for density
effects due to heat and water vapour transfer. Quarterly Journal of Royal Meteorological
Society, 106, 85-100.
Wilczak, J.M., Oncley, S.P., and Stage, S.A. 2001. Sonic anemometer tilt correction algorithms.
Boundary-Layer Meteorology, 99, 127-150.
Zimov, S.A., Davidov, S.P., Zimova, G.M., Davidova, A.I., Chapin III, F.S., Chapin, M.C., and
Reynolds, J.F. 1999. Contribution of disturbance to increasing seasonal amplitude of
atmospheric CO2. Science, 284, 1973-1976.
Page 38 of 53
https://mc06.manuscriptcentral.com/asopen-pubs
Arctic Science

Draft
39
Zimov, S.A., Davydov, S.P., Zimova, G.M., Davydova, A.I., Schuur, E.A.G., Dutta, K., and
Chapin III, F.S. 2006. Permafrost carbon: Stock and decomposability of a globally
significant carbon pool. Geophysical Research Letters, 33, L20502.
Page 39 of 53
https://mc06.manuscriptcentral.com/asopen-pubs
Arctic Science

Draft
Figure Captions
Fig. 1. Map of tower location and surrounding water bodies. Small ponds have been omitted.
Inset: Location of Churchill Manitoba near the northern limit of the Hudson Bay Lowlands
(black).
Fig. 2. Cumulative precipitation and evaporation rates (mm) over the study period.
Fig. 3. Mean monthly diurnal temperature curves for onshore and offshore wind regimes.
Fig. 4. Mean monthly energy balance for onshore and offshore wind regimes, as derived from
mean monthly 30-minute daytime fluxes. September values are calculated until September 18th.
Note the different axis scale for QG. Error bars represent standard error.
Fig. 5. Seasonal daily average NEE for data from all wind directions.
Fig. 6. (a) Binned light response curve for GPP for onshore and offshore wind regimes (p>0.05).
(b) Temperature response over binned light levels for onshore and offshore wind regimes
(p<0.001).
Fig. 7. (a) Daytime GPP and R (Lloyd and Taylor (1974) model) curves for binned air
temperatures for onshore and offshore regimes. ER estimates are based on the same model for
both wind directions due to the same model that was used. (b) Daytime NEE curves for binned
air temperatures for onshore and offshore wind regimes.
Fig. 8. Changes in the proportion of onshore and offshore wind regime frequencies for June from
1953 to 2012.(p=0.06).
Page 40 of 53
https://mc06.manuscriptcentral.com/asopen-pubs
Arctic Science

Draft
1
Fig. 1. Map of tower location and surrounding water bodies. Small ponds have been omitted. Inset: Location of
Churchill Manitoba near the northern limit of the Hudson Bay Lowlands (black).
Page 41 of 53
https://mc06.manuscriptcentral.com/asopen-pubs
Arctic Science

Draft
2
Fig. 2. Cumulative precipitation and evaporation rates (mm) over the study period.
Page 42 of 53
https://mc06.manuscriptcentral.com/asopen-pubs
Arctic Science

Draft
3
Fig. 3. Mean monthly diurnal temperature curves for onshore and offshore wind regimes.
Page 43 of 53
https://mc06.manuscriptcentral.com/asopen-pubs
Arctic Science

Draft
4
Fig. 4. Mean monthly energy balance for onshore and offshore wind regimes, as derived from mean monthly 30-
minute daytime fluxes. September values are calculated until September 18th. Note the different axis scale for QG.
Error bars represent standard error.
Page 44 of 53
https://mc06.manuscriptcentral.com/asopen-pubs
Arctic Science

Draft
5
Fig. 5. Seasonal daily average NEE for data from all wind directions.
Page 45 of 53
https://mc06.manuscriptcentral.com/asopen-pubs
Arctic Science

Draft
6
Fig. 6. (a) Binned light response curve for GPP for onshore and offshore wind regimes (p>0.05). (b) Temperature
response over binned light levels for onshore and offshore wind regimes (p<0.001).
Page 46 of 53
https://mc06.manuscriptcentral.com/asopen-pubs
Arctic Science

Draft
7
Fig. 7. (a) Daytime GPP and R (Lloyd and Taylor (1974) model) curves for binned air temperatures for onshore and
offshore regimes. ER estimates are based on the same model for both wind directions due to the same model that
was used. (b) Daytime NEE curves for binned air temperatures for onshore and offshore wind regimes.
Page 47 of 53
https://mc06.manuscriptcentral.com/asopen-pubs
Arctic Science
Draft
8
Fig. 8. Changes in the proportion of onshore and offshore wind regime frequencies for June from 1953 to
2012.(p=0.06).
Page 48 of 53
https://mc06.manuscriptcentral.com/asopen-pubs
Arctic Science

Draft
Table 1. Percent plant cover surrounding the EC tower within 100 m radius. Sampling methods are based on 50 cm
x 50 cm quadrat sampling at 2 m intervals in 16 compass directions.
Plant Cover Percent Cover
Understory
Vascular 47.8
Lichen 25.4
Moss 23.2
Pond 1.0
Rock 2.7
Overstory
Cloudberry 13.6
Birch 2.1
Willow 4.0
Evergreen 1.9
Page 49 of 53
https://mc06.manuscriptcentral.com/asopen-pubs
Arctic Science

Draft
Table 2. Relative influence for four dominant plant covers (vascular, lichen, moss, cloudberry) computed for
onshore and offshore wind directions. T-tests were performed, and a difference in magnitude is shown. Relative
influence was computed using a weighted footprint model after Schuepp et al., (1990). (* p<0.05; ** p<0.01, ***
p<0.001).
Relative Influence
Difference
Magnitude
Statistical
Significance Onshore Offshore
%
Understory
Vascular * 33.12 32.51 1.02
%
Understory
Lichen * 22.90 21.94 1.04
%
Understory
Moss *** 17.85 13.54 1.32
% Overstory
Cloudberry *** 12.73 11.70 1.09
Page 50 of 53
https://mc06.manuscriptcentral.com/asopen-pubs
Arctic Science

Draft
Table 3. Monthly precipitation (mm) and temperature (°C) for the study year of 2007 and historical average (HA)
values. Bracketed terms show one standard deviation.
June July August
September (until
18th)
200
7 HA 2007 HA
200
7 HA 2007 HA
Precipitation
(mm) 48.2 44.3
30.2
2 56 44.4 68.3 70.6 63.4
T (°C)
5.9
6.6
(2.1)
15.4
12
(1.7)
12
11.7
(1.5)
5.4
5.6 (1.8)
Page 51 of 53
https://mc06.manuscriptcentral.com/asopen-pubs
Arctic Science

Draft
Table 4. Energy balance components as proportions of net available energy for onshore (ON) and offshore (OFF)
wind regimes for the four study months, as derived from 30-minute daytime fluxes. SS-statistical significance. *
P<0.05; ** P<0.01; *** P<0.001.
QE/Q* QH/Q* QG/Q*
ON OFF SS ON OFF SS ON OFF SS
June 0.46 0.41 - 0.61 0.44 ** 0.05 0.05 -
July 0.49 0.58 - 0.45 0.23 *** 0.09 0.17 **
August 0.61 0.63 - 0.28 0.11 ** 0.10 0.13 *
September 0.69 0.40 - 0.11 0.38 * 0.12 0.26 -
Season 0.46 0.53 - 0.44 0.26 *** 0.08 0.14 **
Page 52 of 53
https://mc06.manuscriptcentral.com/asopen-pubs
Arctic Science

Draft
Table 5. (a) Monthly and seasonal flux means and flux normalized to PAR for onshore and offshore wind regimes,
as derived from 30-minute daytime fluxes. (b) Ratios of offshore to onshore (OFF/ON) represent % difference with
associated statistical test. SS-statistical significance. * P<0.05; ** P<0.01; *** P<0.001.
(a) GPP
(µmol/m2/s)
ER
(µmol/m2/s)
NEE
(µmol/m2/s)
T
(ºC)
GPP/PAR
(µmol CO2 /
µmol photons)
ER/PAR
(µmol CO2 /
µmol photons)
ER/GPP
ON OFF ON OFF ON OFF ON OFF ON OFF ON OFF ON OFF
June 3.69
±0.07
4.17
±0.10
1.53
±0.02
2.21
±0.04
-2.16
±0.07
-1.91
±0.09 4.93 9.70 0.73 0.80 0.46 0.57 0.53 0.63
July 7.29
±0.11
7.02
±0.19
3.31
±0.04
4.31
±0.06
-3.95
±0.10
-2.49
±0.16 14.39 19.46 1.28 1.69 0.83 1.58 0.55 0.78
August 6.35
±0.11
5.83
±0.14
2.82
±0.02
3.40
±0.05
-3.54
±0.11
-2.47
±0.14 11.66 14.59 1.20 1.58 0.74 1.33 0.56 0.93
September 3.58
±0.11
4.17
±0.18
1.75
±0.03
2.48
±0.06
-1.80
±0.10
-1.55
±0.16 5.28 9.58 1.15 1.19 0.82 1.15 0.71 1.28
Season 5.43
±0.06
5.45
±0.09
2.42
±0.02
3.19
±0.04
-3.00
±0.05
-2.20
±0.07 9.52 13.67 1.07 1.35 0.68 1.17 0.60 0.99
(b) GPP
ER
NEE
T
(ºC) GPP/PAR ER/PAR ER/GPP
OFF/ON
Mean SS
OFF/ON
Mean SS
OFF/ON
Mean SS
ºC higher
for OFF SS
OFF/ ON
Mean SS
OFF/ ON
Mean SS
OFF/ ON
Mean SS
June 1.13 *** 1.45 *** 0.88 * 4.77 *** 1.09 - 1.26 ** 1.18 ***
July 0.96 - 1.30 *** 0.63 *** 5.07 *** 1.32 *** 1.91 *** 1.43 ***
August 0.92 ** 1.20 *** 0.70 *** 2.93 *** 1.31 *** 1.80 *** 1.65 **
September 1.16 - 1.42 *** 0.86 - 4.30 *** 1.04 - 1.40 *** 1.81 **
Season 1.00 - 1.32 *** 0.73 *** 4.15 *** 1.26 *** 1.71 *** 1.67 ***
Page 53 of 53
https://mc06.manuscriptcentral.com/asopen-pubs
Arctic Science