draft total maximum daily load evaluation for -...
TRANSCRIPT
Draft
Total Maximum Daily Load
Evaluation
for
Thirty- Six Segments
in the
Coosa River Basin
for
PCBs in Fish Tissue 16 Segments
Commercial Fishing Ban due to PCBs
24 Segments
Submitted to: The U.S. Environmental Protection Agency
Region 4 Atlanta, Georgia
Submitted by: The Georgia Department of Natural Resources
Environmental Protection Division Atlanta, Georgia
November 2013
Draft Total Maximum Daily Load Evaluation November 2013 Coosa River (FCG and CFB -PCBs)
Georgia Environmental Protection Division ii Atlanta, Georgia
Table of Contents
1.0 INTRODUCTION ................................................................................................................. 1
1.1 Background ..................................................................................................................... 1 1.2 Watershed Description ................................................................................................... 1 1.3 Impact of PCBs ............................................................................................................... 5 1.4 Water Quality Standard................................................................................................... 6
2.0 AVAILABLE MONITORING DATA ...................................................................................... 7 3.0 SOURCE ASSESSMENT .................................................................................................. 12 4.0 TMDL DEVELOPMENT APPROACH ............................................................................... 15 5.0 ALLOCATIONS .................................................................................................................. 16
5.1 Waste Load and Load Allocations ................................................................................ 16 5.2 Seasonal Variation ......................................................................................................... 18 5.3 Margin of Safety ............................................................................................................ 18
6.0 RECOMMENDATIONS ...................................................................................................... 19
6.1 Monitoring ....................................................................................................................... 19 6.2 Reasonable Assurance .................................................................................................. 19
6.3 Public Participation ......................................................................................................... 19 7.0 INITIAL TMDL IMPLEMENTATION PLAN .......................................................................... 20 REFERENCES........................................................................................................................... 24
List of Figures
1. Location of the Coosa River Basin 2. 303(d) Listed Segments for PCBs in the Coosa River Basin 3. Average PCB Levels in Channel Catfish from the Lower Coosa River (Hwy 100 to State
Line) 4. PCB Levels Measured in Sediments from the Coosa River in the Vicinity of Hwy 100
(Data Collected By USEPA in 2002) 5. Average PCB Levels in Fish from the Coosa River
List of Tables
1. Listed Segments for Fish Consumption Guidelines and/or a Commercial Fishing Ban for (PCBs) in the Coosa River Basin
2. Land Cover Distribution Associated with the Coosa River Basin 3. Coosa River Basin Fish Consumption Guidelines 4. General Electric NPDES Permit (GA0024155) 5. Phase I Permitted MS4s in the Coosa River Basin 6. Phase II Permitted MS4s in the Coosa River Basin

Draft Total Maximum Daily Load Evaluation November 2013 Coosa River (FCG and CFB -PCBs)
Georgia Environmental Protection Division 1 Atlanta, Georgia
1.0 INTRODUCTION
1.1 Background
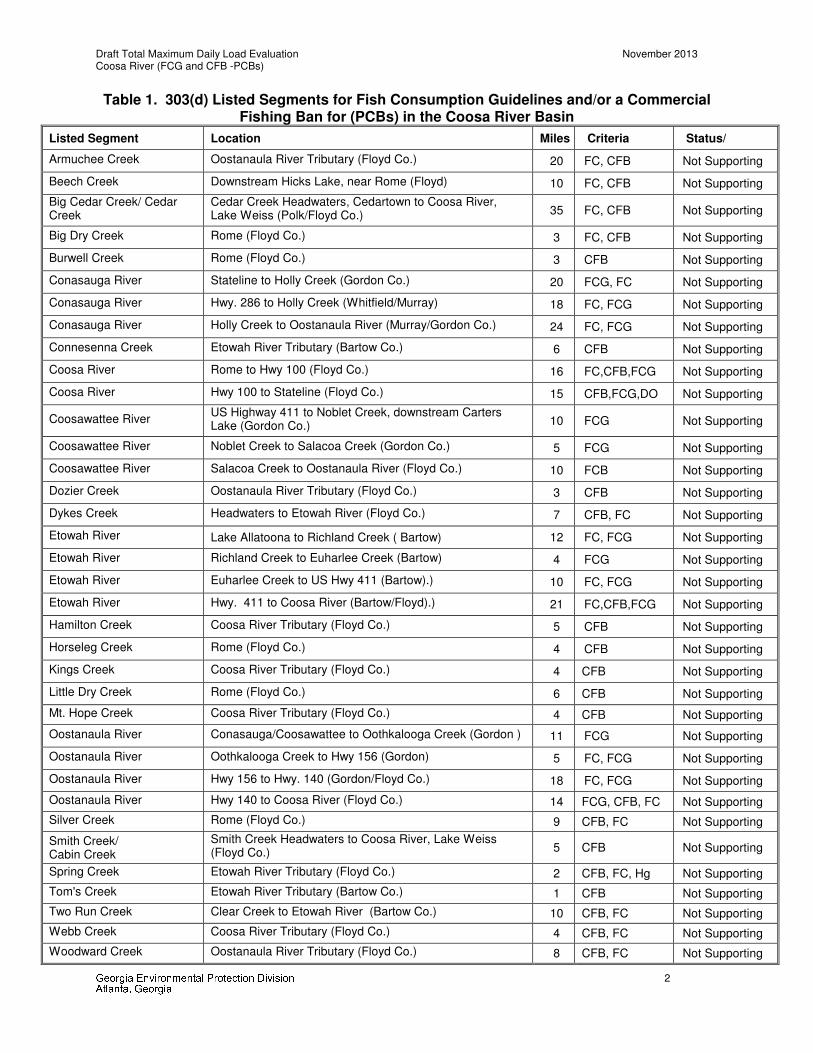
The State of Georgia assesses its water bodies for compliance with water quality standards criteria established for their designated uses as required by the Federal Clean Water Act (CWA). Assessed water bodies are placed into one of three categories with respect to designated uses: 1) supporting, 2) partially supporting, or 3) not supporting. These water bodies are found on Georgia’s 305(b) list as required by that section of the CWA that defines the assessment process, and are published in Water Quality in Georgia every two years (GA EPD 2000-2001). Some of the 305(b) partially and not supporting water bodies are also assigned to Georgia’s 303(d) list, also named after that section of the CWA. Water bodies on the 303(d) list are required to have a Total Maximum Daily Load (TMDL) evaluation for the water quality constituent(s) in violation of the water quality standard. The TMDL process establishes the allowable loading of pollutants or other quantifiable parameters for a water body based on the relationship between pollution sources and instream water quality conditions. This allows water quality-based controls to be developed to reduce pollution and to restore and maintain water quality. The State of Georgia has identified thirty-four (34) segments in the Coosa River Basin as not supporting their designated use due to the issuance of fish consumption guidelines (FCG) or a commercial fishing ban (CFB) because of polychlorinated biphenyl (PCB) contamination (see Table 1). Several of these segments are also listed for fecal coliform (FC). One is also listed for dissolved oxygen (DO) and one for mercury (Hg). Separate TMDLs are being proposed for these constituents. The State of Alabama has listed Lake Weiss from the dam to the Alabama-Georgia state line for PCBs in fish tissue. Lake Weiss was on the Alabama 1996, 1998, and 2002 303(d) lists. In October 2003, EPA developed a draft PCB TMDL for the Lake. 1.2 Watershed Description
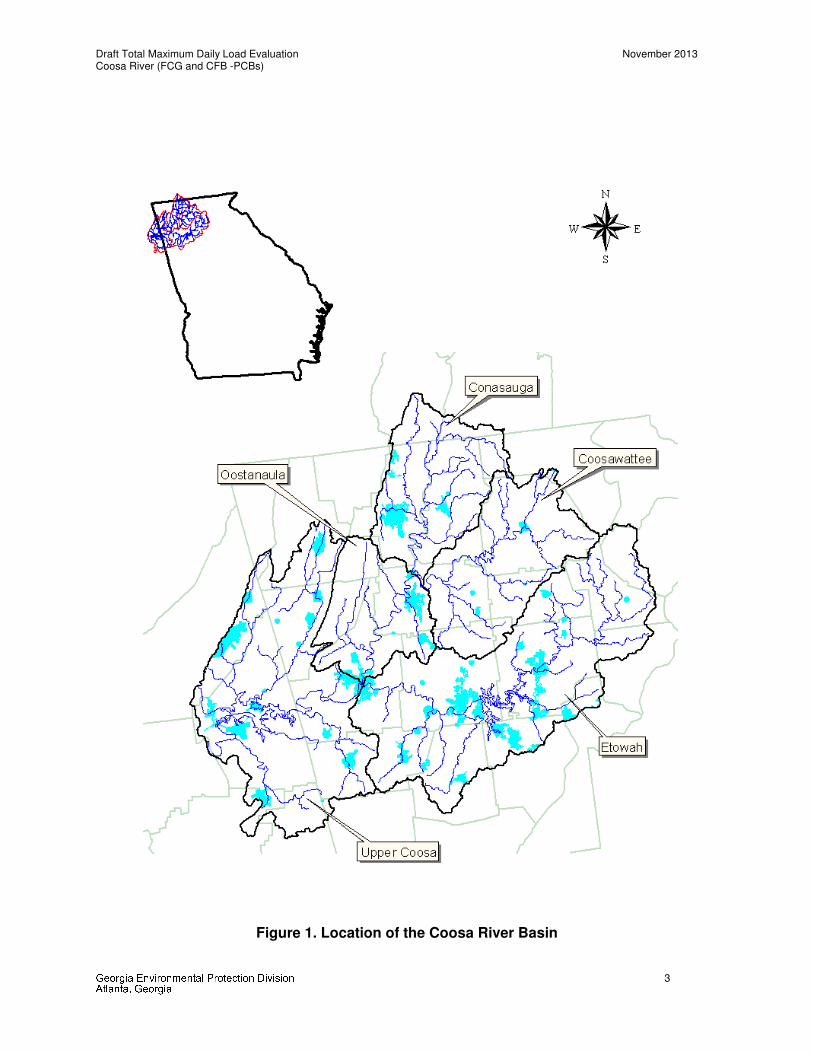
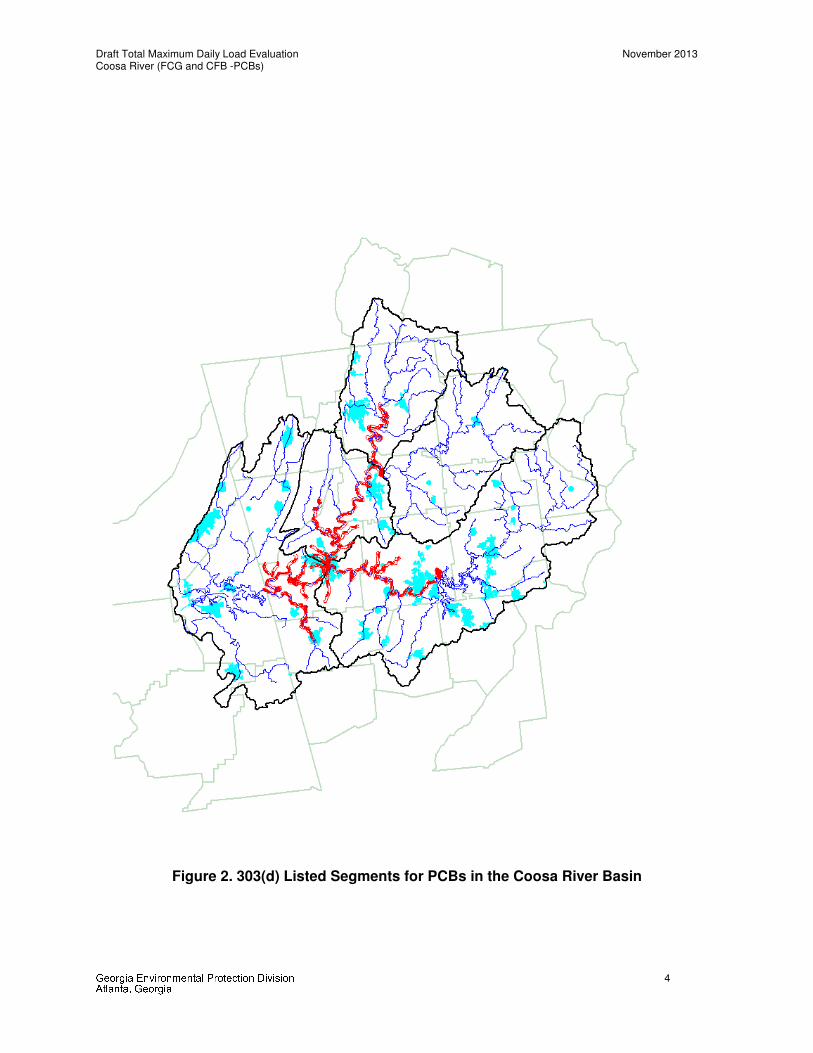
The Coosa River originates in Tennessee as the Conasauga River, and in the north Georgia mountains as the Etowah, Coosawattee and Chattooga Rivers (see Figure 1). The Conasauga River flows south from Tennessee where it converges with the Coosawattee River near Resaca, Georgia, to form the Oostanaula River. The Coosawattee River originates in Ellijay, Georgia, by the merging of the Ellijay and Cartecay Rivers. The Coosawattee flows west from Ellijay, joins with Mountain Creek and then flow into Carter’s Lake. From Carter’s Lake, the Coosawattee River flows west toward Resaca where it meets the Conasauga to form the Oostanaula River The Etowah River flows southwest from Lumpkin County to Lake Allatoona. From there it flows west toward Rome, Georgia, where it merges with the Oostanaula River to form the Coosa River. The Coosa River then flows west into Alabama to Lake Weiss. The Coosa River flows from Lake Weiss through several other lakes and eventually flows into the Alabama River, which ultimately discharges to the Gulf of Mexico. The USGS has divided the Coosa River Basin into five sub-basins, or Hydrologic Unit Codes (HUCs). Figure 1 shows the location of these sub-basins and the associated counties within each sub-basin. Figure 2 shows the location of the listed PCB segments within the Coosa
Draft Total Maximum Daily Load Evaluation November 2013 Coosa River (FCG and CFB -PCBs)
Georgia Environmental Protection Division 2 Atlanta, Georgia
Table 1. 303(d) Listed Segments for Fish Consumption Guidelines and/or a Commercial Fishing Ban for (PCBs) in the Coosa River Basin
Listed Segment Location Miles Criteria Status/
Armuchee Creek Oostanaula River Tributary (Floyd Co.) 20 FC, CFB Not Supporting
Beech Creek Downstream Hicks Lake, near Rome (Floyd) 10 FC, CFB Not Supporting
Big Cedar Creek/ Cedar Creek
Cedar Creek Headwaters, Cedartown to Coosa River, Lake Weiss (Polk/Floyd Co.) 35 FC, CFB Not Supporting
Big Dry Creek Rome (Floyd Co.) 3 FC, CFB Not Supporting
Burwell Creek Rome (Floyd Co.) 3 CFB Not Supporting
Conasauga River Stateline to Holly Creek (Gordon Co.) 20 FCG, FC Not Supporting
Conasauga River Hwy. 286 to Holly Creek (Whitfield/Murray) 18 FC, FCG Not Supporting
Conasauga River Holly Creek to Oostanaula River (Murray/Gordon Co.) 24 FC, FCG Not Supporting
Connesenna Creek Etowah River Tributary (Bartow Co.) 6 CFB Not Supporting
Coosa River Rome to Hwy 100 (Floyd Co.) 16 FC,CFB,FCG Not Supporting
Coosa River Hwy 100 to Stateline (Floyd Co.) 15 CFB,FCG,DO Not Supporting
Coosawattee River US Highway 411 to Noblet Creek, downstream Carters Lake (Gordon Co.) 10 FCG Not Supporting
Coosawattee River Noblet Creek to Salacoa Creek (Gordon Co.) 5 FCG Not Supporting
Coosawattee River Salacoa Creek to Oostanaula River (Floyd Co.) 10 FCB Not Supporting
Dozier Creek Oostanaula River Tributary (Floyd Co.) 3 CFB Not Supporting
Dykes Creek Headwaters to Etowah River (Floyd Co.) 7 CFB, FC Not Supporting
Etowah River Lake Allatoona to Richland Creek ( Bartow) 12 FC, FCG Not Supporting
Etowah River Richland Creek to Euharlee Creek (Bartow) 4 FCG Not Supporting
Etowah River Euharlee Creek to US Hwy 411 (Bartow).) 10 FC, FCG Not Supporting
Etowah River Hwy. 411 to Coosa River (Bartow/Floyd).) 21 FC,CFB,FCG Not Supporting
Hamilton Creek Coosa River Tributary (Floyd Co.) 5 CFB Not Supporting
Horseleg Creek Rome (Floyd Co.) 4 CFB Not Supporting
Kings Creek Coosa River Tributary (Floyd Co.) 4 CFB Not Supporting
Little Dry Creek Rome (Floyd Co.) 6 CFB Not Supporting
Mt. Hope Creek Coosa River Tributary (Floyd Co.) 4 CFB Not Supporting
Oostanaula River Conasauga/Coosawattee to Oothkalooga Creek (Gordon ) 11 FCG Not Supporting
Oostanaula River Oothkalooga Creek to Hwy 156 (Gordon) 5 FC, FCG Not Supporting
Oostanaula River Hwy 156 to Hwy. 140 (Gordon/Floyd Co.) 18 FC, FCG Not Supporting
Oostanaula River Hwy 140 to Coosa River (Floyd Co.) 14 FCG, CFB, FC Not Supporting
Silver Creek Rome (Floyd Co.) 9 CFB, FC Not Supporting
Smith Creek/ Cabin Creek
Smith Creek Headwaters to Coosa River, Lake Weiss (Floyd Co.) 5 CFB Not Supporting
Spring Creek Etowah River Tributary (Floyd Co.) 2 CFB, FC, Hg Not Supporting
Tom's Creek Etowah River Tributary (Bartow Co.) 1 CFB Not Supporting
Two Run Creek Clear Creek to Etowah River (Bartow Co.) 10 CFB, FC Not Supporting
Webb Creek Coosa River Tributary (Floyd Co.) 4 CFB, FC Not Supporting
Woodward Creek Oostanaula River Tributary (Floyd Co.) 8 CFB, FC Not Supporting
Draft Total Maximum Daily Load Evaluation November 2013 Coosa River (FCG and CFB -PCBs)
Georgia Environmental Protection Division 3 Atlanta, Georgia
Figure 1. Location of the Coosa River Basin
Draft Total Maximum Daily Load Evaluation November 2013 Coosa River (FCG and CFB -PCBs)
Georgia Environmental Protection Division 4 Atlanta, Georgia
Figure 2. 303(d) Listed Segments for PCBs in the Coosa River Basin
Draft Total Maximum Daily Load Evaluation November 2013 Coosa River (FCG and CFB -PCBs)
Georgia Environmental Protection Division 5 Atlanta, Georgia
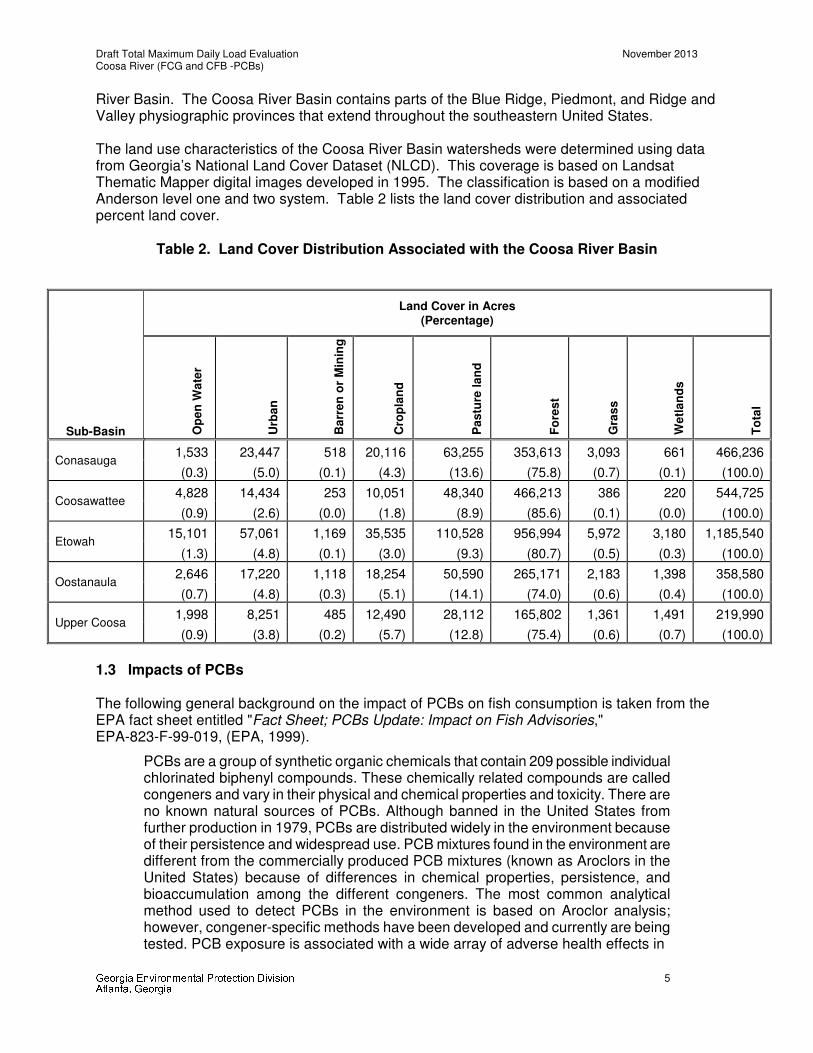
River Basin. The Coosa River Basin contains parts of the Blue Ridge, Piedmont, and Ridge and Valley physiographic provinces that extend throughout the southeastern United States. The land use characteristics of the Coosa River Basin watersheds were determined using data from Georgia’s National Land Cover Dataset (NLCD). This coverage is based on Landsat Thematic Mapper digital images developed in 1995. The classification is based on a modified Anderson level one and two system. Table 2 lists the land cover distribution and associated percent land cover.
Table 2. Land Cover Distribution Associated with the Coosa River Basin
Sub-Basin
Land Cover in Acres (Percentage)
Op
en
Wa
ter
Urb
an
Ba
rre
n o
r M
inin
g
Cro
pla
nd
Pa
stu
re l
an
d
Fo
res
t
Gra
ss
We
tla
nd
s
To
tal
Conasauga 1,533 23,447 518 20,116 63,255 353,613 3,093 661 466,236
(0.3) (5.0) (0.1) (4.3) (13.6) (75.8) (0.7) (0.1) (100.0)
Coosawattee 4,828 14,434 253 10,051 48,340 466,213 386 220 544,725
(0.9) (2.6) (0.0) (1.8) (8.9) (85.6) (0.1) (0.0) (100.0)
Etowah 15,101 57,061 1,169 35,535 110,528 956,994 5,972 3,180 1,185,540
(1.3) (4.8) (0.1) (3.0) (9.3) (80.7) (0.5) (0.3) (100.0)
Oostanaula 2,646 17,220 1,118 18,254 50,590 265,171 2,183 1,398 358,580
(0.7) (4.8) (0.3) (5.1) (14.1) (74.0) (0.6) (0.4) (100.0)
Upper Coosa 1,998 8,251 485 12,490 28,112 165,802 1,361 1,491 219,990
(0.9) (3.8) (0.2) (5.7) (12.8) (75.4) (0.6) (0.7) (100.0)
1.3 Impacts of PCBs The following general background on the impact of PCBs on fish consumption is taken from the EPA fact sheet entitled "Fact Sheet; PCBs Update: Impact on Fish Advisories," EPA-823-F-99-019, (EPA, 1999).
PCBs are a group of synthetic organic chemicals that contain 209 possible individual chlorinated biphenyl compounds. These chemically related compounds are called congeners and vary in their physical and chemical properties and toxicity. There are no known natural sources of PCBs. Although banned in the United States from further production in 1979, PCBs are distributed widely in the environment because of their persistence and widespread use. PCB mixtures found in the environment are different from the commercially produced PCB mixtures (known as Aroclors in the United States) because of differences in chemical properties, persistence, and bioaccumulation among the different congeners. The most common analytical method used to detect PCBs in the environment is based on Aroclor analysis; however, congener-specific methods have been developed and currently are being tested. PCB exposure is associated with a wide array of adverse health effects in
Draft Total Maximum Daily Load Evaluation November 2013 Coosa River (FCG and CFB -PCBs)
Georgia Environmental Protection Division 6 Atlanta, Georgia
experimental animals. Experimental animal studies have shown toxic effects to the liver, gastrointestinal system, blood, skin, endocrine system, immune system, nervous system, and reproductive system. In addition, developmental effects and liver cancer have been reported. Skin rashes and a severe form of acne have been documented in humans; however, other effects of PCB exposure in humans are not well understood. EPA has classified PCBs as probable human carcinogens (Group B2). As of 1998, 37 states have issued 679 fish advisories for PCBs. These advisories inform the public that high concentrations of PCBs have been found in local fish at levels of public health concern. State advisories recommend either limiting or avoiding consumption of certain fish from specific waterbodies or, in some cases, from specific waterbody types (e.g., all freshwater lakes or rivers).
1.4 Water Quality Standard
The water use classification for all listed segments in the Coosa River basin is fishing. The fishing classification, as stated in Georgia’s Rules and Regulations for Water Quality Control, Chapter 391-3-6-.03(6)(c), is established to protect the “propagation of fish, shellfish, game and other aquatic life; secondary contact recreation in and on the water; or for any other use requiring water of a lower quality.” Two segments are also classified as drinking water. They are the Conasauga River from Highway 286 to Holly Creek and the Oostanaula River from Highway 140 to the Coosa River. Georgia's instream criterion for polychlorinated biphenyls (PCBs) is established for all waters and is deemed to be necessary and applicable to all waters of the State. Georgia's Water Quality Standard for PCBs is expressed in Georgia's Rules and Regulations for Water Quality Control, Chapter 391-3-6, Revised December 2002. Georgia Regulation 391-3-6-.03(5)(e)(iv) states that "Instream concentrations of the following chemical constituents listed by the U. S. Environmental Protection Agency as toxic priority pollutants pursuant to Section 307(a)(1) of the Federal Clean Water Act (as amended) shall not exceed criteria indicated below under annual average or higher stream flow conditions". The State water quality instream target of 0.00017
µg/L is protective of the FDA action level for fish consumption. This level is also protective of the DNR fish consumption guidance level. It should be noted that there is also an aquatic life
criteria for PCBs of 0.014µg/L, which is in effect during 7Q10 or higher stream flow conditions. Alabama's Water Quality Criteria Administrative Code, 335-6-10-.07, specifies that for pollutants USEPA classified as carcinogens and for which water use classification is public water supply and fish consumption, the human health criteria (under annual average or higher stream flow conditions) should be computed as:
Concentration (mg/L) = (HBW x RL)/(CPF x [(FCR x BCF) + WCR])
Where: HBW = human body weight, set at 70 kg RL = risk level, set at 1 x 10⁻⁵ CPF = cancer potency factor, which is 7.7 kg-day/day for PCBs FCR = fish consumption rate, set at 0.030 kg/day BCF = bioconcentration factor, which is 31,200 L/kg for PCBs WCR = water use consumption rate, set at 2 L/day
PCB concentration = (70 kg x 10-5)/(7. 7 kg-day/day x [(0.030 kg/day x 31,200 L/kg) + 2 L/day]) = 9.7 x 10⁻⁸ mg/L or 0.000097 µg/L

Draft Total Maximum Daily Load Evaluation November 2013 Coosa River (FCG and CFB -PCBs)
Georgia Environmental Protection Division 7 Atlanta, Georgia
2.0 AVAILABLE MONITORING DATA
The following information on PCBs in fish in the Coosa River Basin is taken from EPD’s 1998 Coosa River Basin Management Plan:
In 1976, the Department of Natural Resources (DNR) issued an advisory recommending that people not eat fish taken from the Coosa River from Rome to the Georgia-Alabama border. Additionally, the Coosa River was officially closed to commercial fishing by the Board of Natural Resources. Both of these actions were taken because of contamination of fish in the Coosa River with significant concentrations of Polychlorinated Biphenyls (PCBs). Section 391-4-3-.04, Waters Open to Commercial Fishing, Amended, of the Georgia Fishing Regulations delineates those portions of the Coosa River, Etowah River, and Oostanaula River (including tributaries to them), and the Georgia portion of Lake Weiss that were closed to commercial fishing. Measurements of PCBs in the late 1970’s revealed concentrations of PCBs in fish greater than 30 parts per million (ppm) in some instances. The Food and Drug Administration’s (FDA) Action Level for PCBs at that time was 5.0 ppm. From 1977 to 1990, PCB concentrations in fish tissue were monitored extensively in the Coosa River. The monitoring strategy consisted of measuring PCB concentrations in tissue of a single species of fish. Each year approximately 45 individual channel catfish of approximately 1 pound were collected for analysis of fillet tissue. From 1977 to 1984, the concentrations of PCBs monitored in catfish from the Coosa River decreased dramatically from concentrations greater than 30 ppm to less than 2 ppm. After 1984, the changes in PCB concentration on a year by year basis were not as dramatic, but continued to decline to an average concentration of 0.39 ppm in 1990. The FDA’s Action Level of 5.0 ppm in effect at the beginning of the study in 1977 was officially changed to a Tolerance Level of 2.0 ppm in 1984.
In 1991, EPD began monitoring Coosa River fish in a manner consistent with the newly instituted statewide monitoring plan. As a part of that strategy, fillet tissue from three to five individual fish is composited and analyzed for 43 different contaminants, including PCBs. The goal of the monitoring strategy is to provide at least 3 composites of each species tested, and to test at least two important indicator species at each location. Several different species of fish have been evaluated in the Coosa River with this strategy. For example, PCB concentrations in smallmouth buffalo measured in 1991, 1993, and 1995 were 5.75, 1.15, and 0.64 ppm, respectively. Other species monitored at some point since 1991 and corresponding PCB concentrations include striped bass (1.55 ppm in 1992), largemouth bass (0.33 ppm in 1993), and black crappie (0.13 ppm in 1991). Fish in the Etowah and Oostanaula Rivers have also been monitored for contaminants. Low concentrations of PCBs have been found in some species of fish in both rivers. However, fish tissue concentrations of PCBs in both of these rivers are lower than in the Coosa.
In 1994, EPD began utilizing a ” risk-based” approach to develop fish consumption guidelines for the state’s waters. The EPD’s guidelines are based on the use of US EPA potency factors for carcinogenicity and reference doses for noncancer toxicity, whichever is most protective. Inputs used in the derivation of guidelines include a 1 x 10⁻⁴ risk level for cancer, a 30-year exposure duration, 70 kg as body weight for an adult, and 70 years as the lifetime duration. A range of possible intakes from a low of 3 g/day to a high of 30 g/day are evaluated and one of four different recommendations is made: no
Draft Total Maximum Daily Load Evaluation November 2013 Coosa River (FCG and CFB -PCBs)
Georgia Environmental Protection Division 8 Atlanta, Georgia
restriction, limit consumption to 1 meal per week, limit consumption to 1 meal per month, or do not eat. Recommendations are currently in place for several species of fish in the Coosa, the Etowah, and the Oostanaula Rivers. The most severe restrictions (do not eat) are in place for two species in the Coosa: smallmouth buffalo, and channel catfish, and one species in the Etowah, smallmouth buffalo. All other species listed for these rivers allow either limited consumption or no restriction on fish consumption. The current recommendations are for the Rivers themselves, and do not specifically list all tributaries. This contrasts to past approaches taken where all tributaries were automatically listed under fish consumption advisories.
Table 3 shows the fish consumption guidelines that were included in the 2007 update of “Guidelines for Eating Fish from Georgia Waters (GA DNR, 2007).” In addition there is a commercial fishing ban for the following areas:
• Coosa River and all its tributaries
• Etowah River and tributaries downstream of Highway 411
• Oostanaula River and tributaries downstream of Highway 140 Fish tissue data from 1992-2002 was reviewed for this TMDL. The highest values were the ones responsible for the Do Not Eat listings.
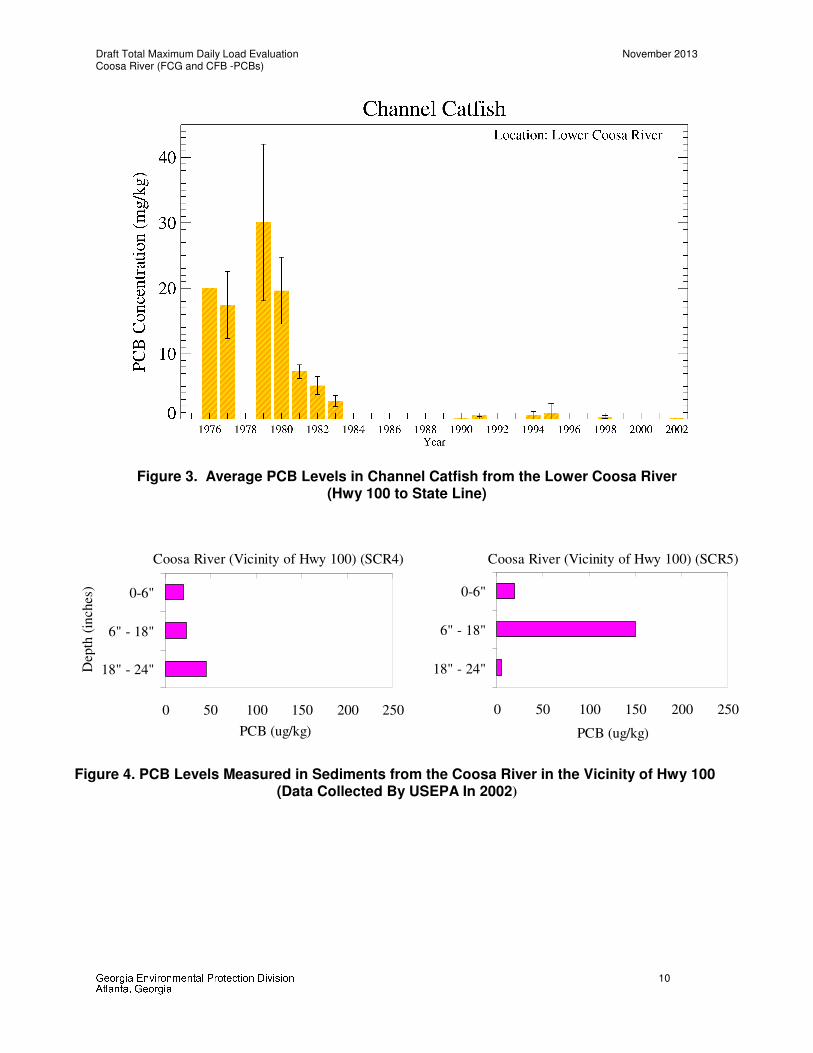
The Coosa River Basin has demonstrated long-term natural recovery following reductions in contributions from PCB sources. Annual monitoring of PCBs in several fish species demonstrates that PCB levels declined between 20 and 40 percent per year during the decade following source control in the mid-1970s. Overall, fish tissue concentrations have decreased more than 90% since PCB use stopped in the 1970’s. These patterns are exemplified by the data for catfish shown in Figure 3. Similar trends are evident in the other species with data sufficient to assess trends (i.e., largemouth bass and black and white crappie). Furthermore, natural recovery is demonstrated in the sediments of the Coosa River: in sediment cores collected by USEPA in 2002, older, more contaminated sediments were found to be buried below the surface of the sediments (Figure 4). The fish trend data show an apparent interruption of natural recovery in the early to mid-1990s. During this period, levels in largemouth bass, channel catfish and black and white crappie rose from about 0.1 mg/kg to about 1 mg/kg, as shown in Figure 5. This increase followed one of the highest-flow years in the recent record, 1990, suggesting the role played by PCB sources associated with or affected by surface runoff. In all species, since the early to mid-1990s, fish PCB levels have declined, indicating a resumption of natural recovery (Figure 3).
In order to characterize the extent of the PCB problem in the mainstem of the Coosa River, EPA’s Science and Ecosystem Support Division has collected additional PCB data. A summary of these fish tissue and sediment data are available in a report titled Coosa River PCB TMDL Environmental Sampling Report, dated April 2003.

Draft Total Maximum Daily Load Evaluation November 2013 Coosa River (FCG and CFB -PCBs)
Georgia Environmental Protection Division 9 Atlanta, Georgia
Table 3. Coosa River Basin Fish Consumption Guidelines
Stream Segment Fish Species
Fish Consumption Recommendation
Site Tested
Conasauga River: State Line-Hwy 286; Hwy 286-Calhoun
Smallmouth Buffalo one meal per month Ga. Hwy. 2 and Old Tilton Bridge
White Bass one meal per month Old Tilton Bridge
Coosa River (River Mile Zero to Hwy 100)
Largemouth Bass one meal per month River Mile 2, Rome
Spotted Bass one meal per week River Mile 2, Rome
Striped Bass one meal per month River Mile 2, Rome
Blue Catfish one meal per month River Mile 2, Rome
Smallmouth Buffalo Do Not Eat River Mile 2, Rome
Coosa River (Hwy 100 to Stateline)
Smallmouth Buffalo one meal per month Below Hwy 100 and at Brushy Branch
Largemouth Bass one meal per week Below Hwy 100 and at Brushy Branch
Striped Bass one meal per month Below Hwy 100 and at Brushy Branch
Channel Catfish one meal per month Below Hwy 100 and at Brushy Branch
Black Crappie one meal per week Foster Bend
Blue Catfish one meal per month Hwy 100
Coosawattee River (Below Carters Lake Dam)
Smallmouth Buffalo one meal per month Owens Gin Road
Etowah River (Below Lake Allatoona, Bartow/Floyd Counties)
Spotted Bass one meal per week U.S. Hwy.411
Smallmouth Buffalo one meal per month U.S. Hwy.411
Oostanaula River (Floyd/Gordon Counties)
Smallmouth Buffalo one meal per week Ga. Hwy 156, Calhoun
Largemouth Bass one meal per week Ga. Hwy 140
Striped Bass one meal per month Ga. Hwy 140
Channel Catfish one meal per week Ga. Hwy 140
Draft Total Maximum Daily Load Evaluation November 2013 Coosa River (FCG and CFB -PCBs)
Georgia Environmental Protection Division 10 Atlanta, Georgia
Figure 3. Average PCB Levels in Channel Catfish from the Lower Coosa River
(Hwy 100 to State Line)
Figure 4. PCB Levels Measured in Sediments from the Coosa River in the Vicinity of Hwy 100
(Data Collected By USEPA In 2002)
Coosa River (Vicinity of Hwy 100) (SCR4)
0 50 100 150 200 250
0-6"
6" - 18"
18" - 24"Depth
(in
ches)
PCB (ug/kg)
Coosa River (Vicinity of Hwy 100) (SCR5)
0 50 100 150 200 250
0-6"
6" - 18"
18" - 24"
PCB (ug/kg)

Draft Total Maximum Daily Load Evaluation November 2013 Coosa River (FCG and CFB -PCBs)
Georgia Environmental Protection Division 11 Atlanta, Georgia
Figure 5. Average PCB Levels in Fish from the Coosa River
Panel A: Channel Catfish From the Lower Coosa River (Hwy 100 To State Line) Panel B: Largemouth Bass From the Lower Coosa River Panel C: Black And White Crappie from the Lower Coosa River Panel D: Smallmouth Buffalo from the Lower River, the Upper River, and from Undefined Locations within the Coosa River
Draft Total Maximum Daily Load Evaluation November 2013 Coosa River (FCG and CFB -PCBs)
Georgia Environmental Protection Division 12 Atlanta, Georgia
3.0 SOURCE ASSESSMENT
A source assessment characterizes the known and suspected sources of PCBs in the watershed for use in the development of the TMDL. PCB has been detected in the sediment, water column and fish tissue in the Coosa River Basin. The following history of PCBs in the Coosa River Basin is taken from EPD’s 1998 Coosa River Basin Management Plan:
The contamination of fish in the Coosa River was attributed to the General Electric Company’s plant in Rome, which began operations in 1954. Efforts were made in the late 1970’s and 1980’s by both EPD and USEPA to ensure that releases of PCBs from the facility to the environment were minimized. The facility was closed in June 1998. Currently, the facility has a NPDES permit, which requires monitoring and control of storm water discharges of PCBs, and several areas on the facility’s property are regulated under the Resource Conservation and Recovery Act. Both of these regulatory activities are under the purview of EPD.
The predominate source of PCBs is from the General Electric Plant which operated in Rome, Floyd County, until it shut down a few years ago. The contamination is from PCBs used in transformers. In the late 1980’s General Electric was issued a hazardous waste storage permit that has since been reissued. The investigation of releases and the clean-up of the site are still underway at this time. General Electric has completed remedial actions in several areas, on and off its site, including Landfill A, Tolbert Park, undeveloped property on the plant site, and the West Central Elementary area. Remedial activities are in progress to remove creek bank soils as well. Also, there are several activities that will be taking place pursuant to the facility’s RCRA permit from EPD, including: (1) removing more than 70,000 tons of soil from the Redmond Circle commercial corridor; (2) remediating the General Electric/Georgia Corporation wetland property and installing new surface water controls to mitigate migration from that property: and (3) remediating on-site Solid Waste Management Units (SWMUs) and Areas of Concern (AOCs). In addition to those remedial actions, General Electric has taken steps onsite to capture and treat storm water and groundwater, and additional steps to address off-site groundwater are planned. These activities are taking place pursuant to the facility’s RCRA permit. Erosion controls, such as gravel cover and paving, have been implemented, and source controls have reduced solids loadings and decreased PCB concentrations in storm water runoff. That runoff is then routed to treatment - solids removal and carbon adsorption. Groundwater and landfill leachate are also treated, in a system that includes oil/water separation, air stripping, solids removal and carbon adsorption. An additional system for treatment of offsite groundwater will be constructed in 2004; this system will have the same treatment components as the onsite system. Title IV of the Clean Water Act establishes the National Pollutant Discharge Elimination System (NPDES) permit program. The NPDES permit program requires permits for the discharge of “pollutants” from any “point source” into “waters of the United States” (40 CFR 122.1). Basically, there are two categories of NPDES permits: 1) municipal and industrial wastewater treatment facilities, and 2) regulated storm water discharges. In general, industrial and municipal wastewater treatment facilities have NPDES permits with effluent limits. These permit limits are either based on federal and state effluent guidelines (technology-based limits) or on water quality standards (water quality-based limits). There is one
Draft Total Maximum Daily Load Evaluation November 2013 Coosa River (FCG and CFB -PCBs)
Georgia Environmental Protection Division 13 Atlanta, Georgia
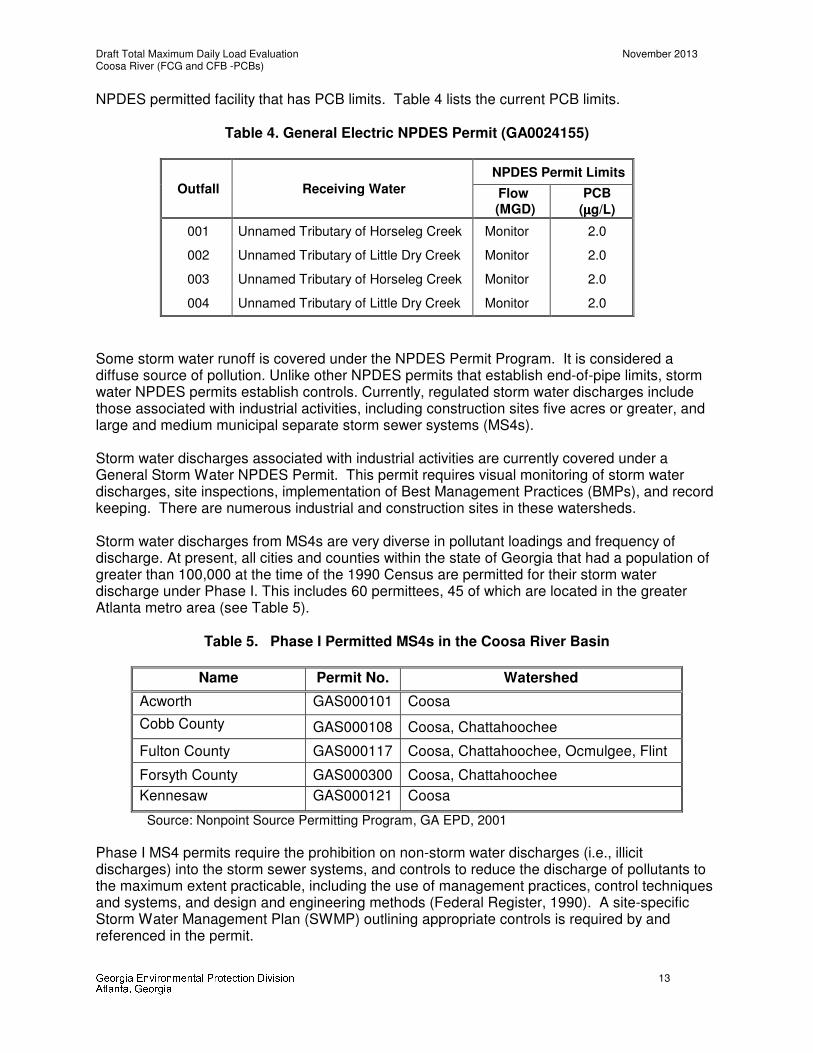
NPDES permitted facility that has PCB limits. Table 4 lists the current PCB limits.
Table 4. General Electric NPDES Permit (GA0024155)
Outfall Receiving Water
NPDES Permit Limits
Flow (MGD)
PCB
(µµµµg/L)
001 Unnamed Tributary of Horseleg Creek Monitor 2.0
002 Unnamed Tributary of Little Dry Creek Monitor 2.0
003 Unnamed Tributary of Horseleg Creek Monitor 2.0
004 Unnamed Tributary of Little Dry Creek Monitor 2.0
Some storm water runoff is covered under the NPDES Permit Program. It is considered a diffuse source of pollution. Unlike other NPDES permits that establish end-of-pipe limits, storm water NPDES permits establish controls. Currently, regulated storm water discharges include those associated with industrial activities, including construction sites five acres or greater, and large and medium municipal separate storm sewer systems (MS4s). Storm water discharges associated with industrial activities are currently covered under a General Storm Water NPDES Permit. This permit requires visual monitoring of storm water discharges, site inspections, implementation of Best Management Practices (BMPs), and record keeping. There are numerous industrial and construction sites in these watersheds. Storm water discharges from MS4s are very diverse in pollutant loadings and frequency of discharge. At present, all cities and counties within the state of Georgia that had a population of greater than 100,000 at the time of the 1990 Census are permitted for their storm water discharge under Phase I. This includes 60 permittees, 45 of which are located in the greater Atlanta metro area (see Table 5).
Table 5. Phase I Permitted MS4s in the Coosa River Basin
Name Permit No. Watershed
Acworth GAS000101 Coosa
Cobb County GAS000108 Coosa, Chattahoochee
Fulton County GAS000117 Coosa, Chattahoochee, Ocmulgee, Flint
Forsyth County GAS000300 Coosa, Chattahoochee
Kennesaw GAS000121 Coosa
Source: Nonpoint Source Permitting Program, GA EPD, 2001
Phase I MS4 permits require the prohibition on non-storm water discharges (i.e., illicit discharges) into the storm sewer systems, and controls to reduce the discharge of pollutants to the maximum extent practicable, including the use of management practices, control techniques and systems, and design and engineering methods (Federal Register, 1990). A site-specific Storm Water Management Plan (SWMP) outlining appropriate controls is required by and referenced in the permit.
Draft Total Maximum Daily Load Evaluation November 2013 Coosa River (FCG and CFB -PCBs)
Georgia Environmental Protection Division 14 Atlanta, Georgia
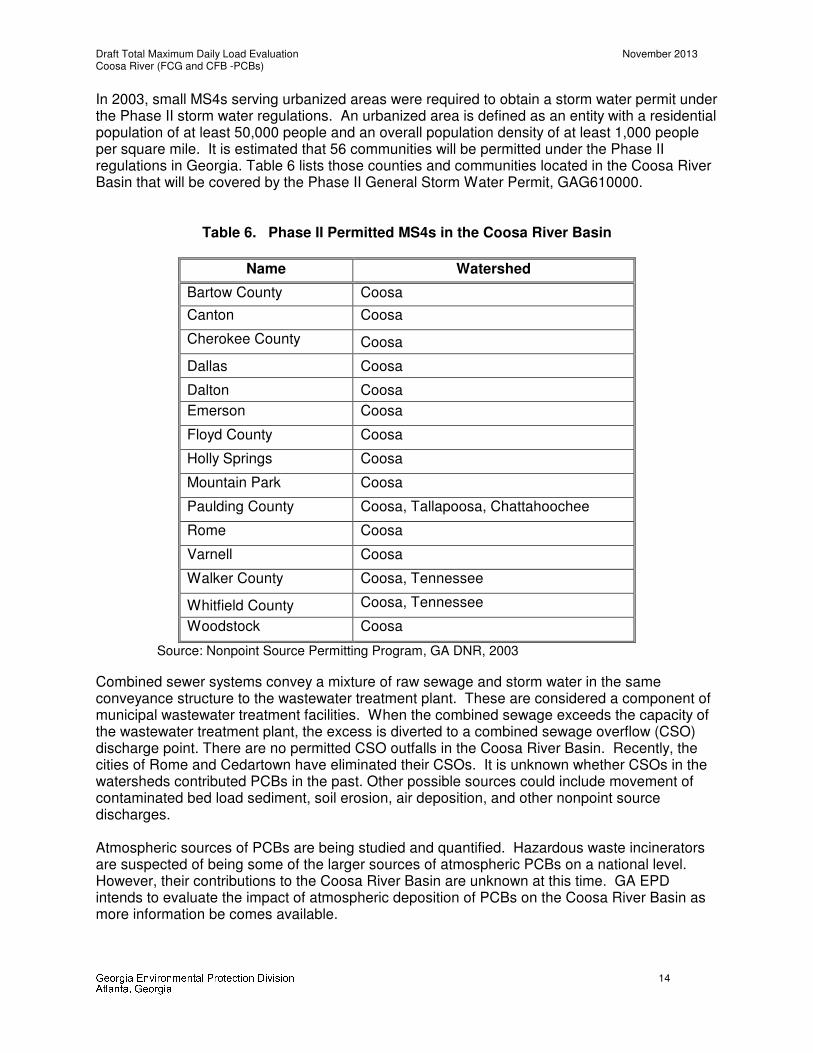
In 2003, small MS4s serving urbanized areas were required to obtain a storm water permit under the Phase II storm water regulations. An urbanized area is defined as an entity with a residential population of at least 50,000 people and an overall population density of at least 1,000 people per square mile. It is estimated that 56 communities will be permitted under the Phase II regulations in Georgia. Table 6 lists those counties and communities located in the Coosa River Basin that will be covered by the Phase II General Storm Water Permit, GAG610000.
Table 6. Phase II Permitted MS4s in the Coosa River Basin
Name Watershed
Bartow County Coosa
Canton Coosa
Cherokee County Coosa
Dallas Coosa
Dalton Coosa
Emerson Coosa
Floyd County Coosa
Holly Springs Coosa
Mountain Park Coosa
Paulding County Coosa, Tallapoosa, Chattahoochee
Rome Coosa
Varnell Coosa
Walker County Coosa, Tennessee
Whitfield County Coosa, Tennessee
Woodstock Coosa
Source: Nonpoint Source Permitting Program, GA DNR, 2003
Combined sewer systems convey a mixture of raw sewage and storm water in the same conveyance structure to the wastewater treatment plant. These are considered a component of municipal wastewater treatment facilities. When the combined sewage exceeds the capacity of the wastewater treatment plant, the excess is diverted to a combined sewage overflow (CSO) discharge point. There are no permitted CSO outfalls in the Coosa River Basin. Recently, the cities of Rome and Cedartown have eliminated their CSOs. It is unknown whether CSOs in the watersheds contributed PCBs in the past. Other possible sources could include movement of contaminated bed load sediment, soil erosion, air deposition, and other nonpoint source discharges. Atmospheric sources of PCBs are being studied and quantified. Hazardous waste incinerators are suspected of being some of the larger sources of atmospheric PCBs on a national level. However, their contributions to the Coosa River Basin are unknown at this time. GA EPD intends to evaluate the impact of atmospheric deposition of PCBs on the Coosa River Basin as more information be comes available.

Draft Total Maximum Daily Load Evaluation November 2013 Coosa River (FCG and CFB -PCBs)
Georgia Environmental Protection Division 15 Atlanta, Georgia
4.0 TMDL DEVELOPMENT APPROACH
An important component of TMDL development is to establish relationships between source loadings and instream water quality. In this section, the numerical techniques used to develop the TMDL are discussed. Georgia has a human health-based water quality standard for PCB, which is based on the average stream flow. This standard, if met, should protect against contaminated fish tissue. This standard is several orders of magnitude less than the detection limit. A mass balance equation is used to calculate the TMDL. The TMDL for the Coosa River Basin equals the annual average flow multiplied by the water quality standard. PCB concentration in the water column is not measurable because it is below the detection limit. However, the fish tissue concentration is known and there is a published bioaccumulation factor for PCBs in fish tissue (EPA 1980). The water column concentration that resulted in the fish tissue contamination can be estimated using the equation shown below.
WC = TC/BCF
Where: WC = Water column concentration (mg/L) TC = Fish tissue concentration (mg/kg) BCF = EPA bioaccumulation Factor (31,200 L/kg)
EPA bioaccumulation factor was developed based on studies performed in the 1970’s. If this value should change based on more current information or any site-specific studies, the human health-based water quality standard for PCB or any other calculations based on the BCF could be revised.

Draft Total Maximum Daily Load Evaluation November 2013 Coosa River (FCG and CFB -PCBs)
Georgia Environmental Protection Division 16 Atlanta, Georgia
5.0 ALLOCATIONS
A Total Maximum Daily Load (TMDL) is the amount of a pollutant that can be assimilated by the receiving waterbody without exceeding the applicable water quality standard. A TMDL is the sum of the individual waste load allocations (WLAs) for points sources and load allocations (LAs) for nonpoint sources and natural background (40 CFR 130.2) for a given waterbody. The TMDL must also include a margin of safety (MOS), either implicitly or explicitly, that accounts for the uncertainty in the relationship between pollutant loads and the water quality response of the receiving water body. TMDLs can be expressed in terms of either mass per time, toxicity, or other appropriate measures. For PCBs, the TMDLs are expressed as a concentration. This concentration is expected to result in both Georgia's and Alabama's water quality criteria for PCBs being met at the State Line. However, should EPA adopt a different approach to developing PCB TMDLs, EPD will revise this TMDL as appropriate. A TMDL is expressed as follows:
TMDL = ΣWLAs + ΣLAs + MOS The TMDL calculates the WLAs and LAs with margins of safety to meet the stream’s water quality standards. The allocations are based on estimates that use the best available data and provide the basis to establish or modify existing controls so that water quality standards can be achieved. In developing a TMDL, it is important to consider if adequate data are available to identify the sources, fate, and transport of the pollutant to be controlled. TMDLs may be developed using a phased approach. Under a phased approach, the TMDL includes: 1) WLAs that confirm existing limits and controls or lead to new limits, and 2) LAs that confirm existing controls or include implementing new controls (EPA TMDL Guidelines). A phased TMDL requires additional data be collected to determine if load reductions required by the TMDL lead to the attainment of water quality standards. The following sections describe the various PCB TMDL components. 5.1 Waste Load and Load Allocations The waste load allocation (WLA) is the portion of the receiving water’s loading capacity that is allocated to existing or future point sources. Waste load allocations are provided to the point sources from municipal and industrial wastewater treatment systems that have NPDES effluent limits. There is one permitted point source discharger with existing limitations for PCBs, stormwater outfalls at the former General Electric facility, which discharges into Horseleg Creek. As discussed above, the predominate source of PCBs in the Coosa River Basin is the former General Electric plant in Rome. Also noted above are various investigation and clean-up activities ongoing at the plant site. These current and future corrective actions, undertaken by General Electric pursuant to a GA EPD issued Resource Conservation and Recovery Act permit, are expected to reduce nonpoint source pollutant loadings of PCB to the Coosa River Basin. Where there is reasonable assurance that reductions in nonpoint source pollutant loading will be achieved, those future reductions may be considered when allocating loads among point and nonpoint sources. EPD, together with EPA, has determined that reasonable assurance exists that reductions in PCB loading to the Coosa River Basin (including the Coosa River, Horseleg Creek, and Little Dry Creek) will be achieved through the corrective action and stormwater controls, including site remediation and best management practices.
Draft Total Maximum Daily Load Evaluation November 2013 Coosa River (FCG and CFB -PCBs)
Georgia Environmental Protection Division 17 Atlanta, Georgia
Considering the future reductions of nonpoint source loadings of PCBs, the wasteload allocation (WLA) for this facility is calculated by multiplying the facility design flow by an allowable PCB concentration. The allowable PCB concentration is calculated based on the mean annual flow in Horseleg Creek and the Georgia human health-based water quality standard, after accounting for background. Based on information provided to EPD by General Electric, the Best Available Technology for the removal of PCBs is carbon adsorption. However, the concentration required by this TMDL is currently not achievable using this technology. Therefore, General Electric may need to perform a use attainability study after completion of current and future RCRA activities, which would be reviewed for approval by both EPD and EPA. In addition, if additional data becomes available regarding background water column concentrations, the WLA and LA may be reallocated. There are several major point sources in this watershed. It is known that wastewaters can contain trace levels of chemicals, including PCBs. However, the current water quality standard for PCBs is below the current detection limit (0.5 microgram per liter) for the current EPA approved analytical method (40 CFR 136). There may come a time when PCBs in discharges or storm water can be measured. If individual wasteload allocations for PCBs are needed for specific permits, the WLA for these facilities can be calculated based on the human health criteria. State and Federal Rules define storm water discharges covered by NPDES permits as point sources. However, storm water discharges are from diffuse sources and there are multiple storm water outfalls. Storm water sources (point and nonpoint) are different than traditional NPDES permitted sources in four respects: 1) they do not produce a continuous (pollutant loading) discharge; 2) their pollutant loading depends on the intensity, duration, and frequency of rainfall events, over which the permittee has no control; 3) the activities contributing to the pollutant loading may include various allowable activities of others, and control of these activities is not solely within the discretion of the permittee; and 4) they do not have wastewater treatment plants that control specific pollutants to meet numerical limits. The intent of storm water NPDES permits is not to treat the water after collection, but to reduce the exposure of storm water to pollutants by implementing various controls. It would be infeasible and prohibitively expensive to control pollutant discharges from each storm water outfall. Therefore, storm water NPDES permits require the establishment of controls or BMPs to reduce pollutants from entering the environment. The waste load allocations from storm water discharges associated with MS4s (WLAsw) can be estimated based on the percentage of urban area in each watershed covered by the MS4 storm water permit. At this time, the portion of each watershed that goes directly to the permitted storm sewer and that which goes through non-permitted point sources, or is sheet flow or agricultural runoff, has not been clearly defined. Thus, it is assumed that approximately 70 percent of the storm water runoff from the regulated urban area is collected by the municipal separate storm sewer systems. The load allocation (LA) is the portion of the receiving water’s loading capacity that is attributed to existing or future nonpoint sources or to natural background sources. Nonpoint sources are identified in 40 CFR 130.6 as follows:
• Residual waste
• Land disposal
• Agricultural and silvicultural
• Mines

Draft Total Maximum Daily Load Evaluation November 2013 Coosa River (FCG and CFB -PCBs)
Georgia Environmental Protection Division 18 Atlanta, Georgia
• Construction
• Saltwater intrusion
• Urban storm water (non-permitted)
The nonpoint sources can include air deposition, non-permitted storm water runoff, movement from sediment bedload into the water column, and decaying aquatic organisms. These mechanisms are very complicated and difficult to quantify. Nonpoint sources should be at concentrations equivalent to or less than the water quality standard for PCBs. As discussed above, the reductions necessary to attain the water quality standard for PCB are expected to be achieved through the corrective action and stormwater controls, including site remediation and best management practices described in General Electric’s RCRA permit. In addition, continued natural recovery in the basin may further reduce PCB loadings. As remediation and recovery progress, EPD will periodically assess progress toward attaining the water quality standard for PCBs. That assessment will provide important information that will help quantify the PCB loading to the Coosa River Basin. If EPD at any time determines that the remediation activities underway at the GE facility are no longer expected to achieve the final TMDL for the Coosa River Basin for PCBs, then the activities undertaken pursuant to GE’s RCRA permit will not be considered reasonable assurances that the final TMDL for PCBs in the Coosa River will be achieved. Revisions to this TMDL may then be made as appropriate. Likewise, as new analytical methods for PCBs come into use, the actual distribution of PCBs in the water column and the possible load sources may be better understood. The TMDL for the mainstem of the Coosa equals the annual average flow multiplied by the more conservative of Alabama’s and Georgia’s water quality standard for PCB. For all other listed segments flowing into the Coosa River, the TMDL for those segments is either the Georgia water quality standard for PCB or a more conservative number as necessary to allow the Coosa to meet Alabama’s water quality standard at the state line. 5.2 Seasonal Variation Seasonal variation is not applicable to this TMDL because PCBs accumulate in fish tissue throughout the year. The water quality standard is based on human health guidelines, which is based on the annual average flow. 5.3 Margin of Safety The MOS is a required component of TMDL development. As specified by section 303(d) of the CWA, the margin of safety must account for any lack of knowledge concerning the relationship between effluent limitations and water quality. There are two basic methods for incorporating the MOS: 1) implicitly incorporate the MOS using conservative model assumptions to develop allocations, or 2) explicitly specify a portion of the TMDL as the MOS and use the remainder for allocations. For this TMDL, the MOS was implicitly incorporated in the use of the following conservative modeling assumptions.
• The TMDL will result in fish tissue concentrations that are below the GA fish consumption action level.
• The background PCB concentrations are at or below the water quality standard.
Draft Total Maximum Daily Load Evaluation November 2013 Coosa River (FCG and CFB -PCBs)
Georgia Environmental Protection Division 19 Atlanta, Georgia
• The cleanup activities associated with the RCRA permit will reduce the nonpoint source loads of PCBs to Coosa River, Horseleg Creek, and Little Dry Creek.
• The assimilative capacity for all listed segments, except Coosa River, Horseleg Creek, and Little Dry Creek, is at or below the water quality standard.

Draft Total Maximum Daily Load Evaluation November 2013 Coosa River (FCG and CFB -PCBs)
Georgia Environmental Protection Division 20 Atlanta, Georgia
6.0 RECOMMENDATIONS
6.1 Monitoring The State should continue with its monitoring program of fish tissue in Georgia’s waters. The Hazardous Waste Branch and Water Protection Branch should continue to work with General Electric to monitor and make improvements under the existing regulatory programs. 6.2 Reasonable Assurance As discussed above, there are various investigation and clean-up activities currently being undertaken by General Electric at its former plant site in Rome. These activities, undertaken pursuant to a Resource Conservation and Recovery Act permit, are expected to reduce nonpoint source pollutant loadings of PCB to the Coosa River Basin. Where there is reasonable assurance that reductions in nonpoint source pollutant loading will be achieved, those future reductions may be considered when allocating loads among point and nonpoint sources. EPD, together with EPA, has determined that reasonable assurance exists that reductions in PCB loadings to the Coosa River Basin (including the Coosa River, Horseleg Creek, and Little Dry Creek) will be achieved through the corrective action and stormwater controls, including site remediation and best management practices, described in General Electric’s RCRA permit. 6.3 Public Participation A thirty-day public notice will be provided for this TMDL. During this time, the availability of the TMDL will be public noticed, a copy of the TMDL will be provided as requested, and the public will be invited to provide comments on the TMDL.
Draft Total Maximum Daily Load Evaluation November 2013 Coosa River (FCG and CFB -PCBs)
Georgia Environmental Protection Division 21 Atlanta, Georgia
7.0 INITIAL TMDL IMPLEMENTATION PLAN
EPD has coordinated with EPA to prepare this Initial TMDL Implementation Plan for this TMDL. EPD has also established a plan and schedule for development of a more comprehensive implementation plan after this TMDL is established. EPD and EPA have executed a Memorandum of Understanding that documents the schedule for developing the more comprehensive plans. This Initial TMDL Implementation Plan includes a list of BMPs and provides for an initial implementation demonstration project to address one of the major sources of pollutants identified in this TMDL, while State and/or local agencies work with local stakeholders to develop a revised TMDL implementation plan. It also includes a process whereby EPD and/or Regional Development Centers (RDCs), or other EPD contractors (hereinafter, “EPD Contractors”), will develop expanded plans (hereinafter, “Revised TMDL Implementation Plans”). This Initial TMDL Implementation Plan, written by EPD and for which EPD and/or the EPD Contractor are responsible, contains the following elements.
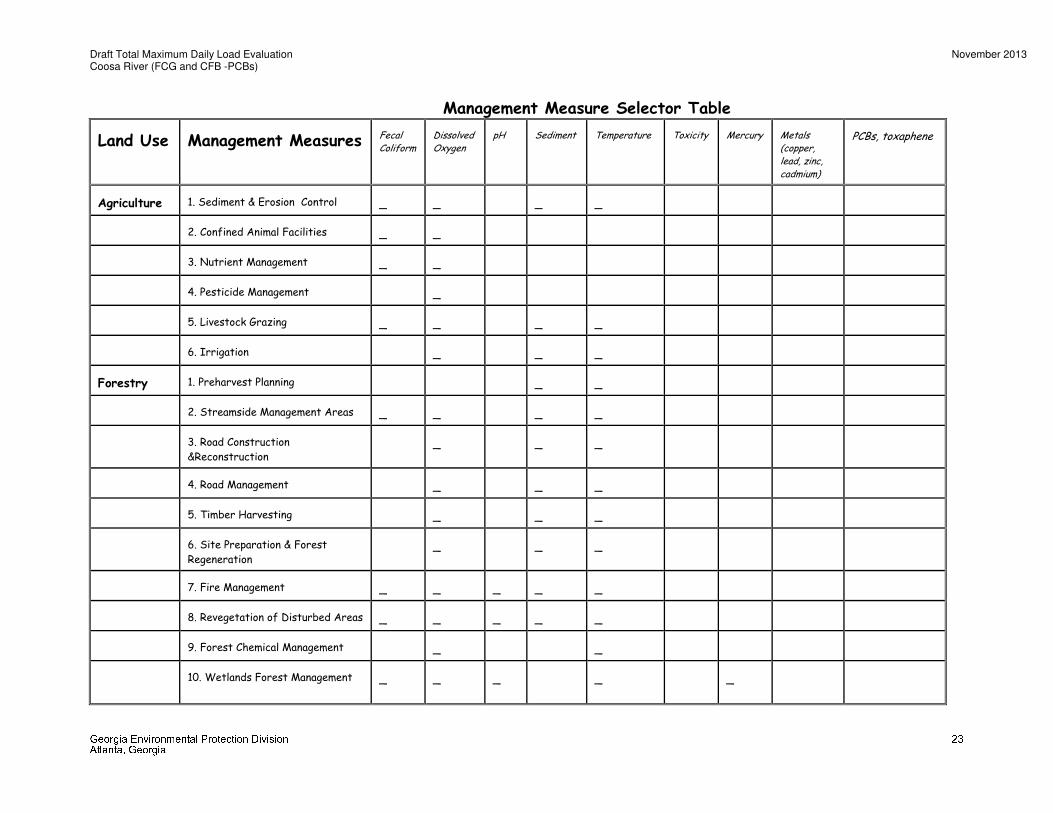
1. EPA has identified a number of management strategies for the control of nonpoint sources of pollutants, representing some best management practices. The “Management Measure Selector Table” shown below identifies these management strategies by source category and pollutant. Nonpoint sources are the primary cause of excessive pollutant loading in most cases. Any wasteload allocations in this TMDL will be implemented in the form of water-quality based effluent limitations in NPDES permits issued under CWA Section 402. [See 40 C.F.R. § 122.44(d)(1)(vii)(B)]. NPDES permit discharges are a secondary source of excessive pollutant loading, where they are a factor, in most cases.
2. EPD and the EPD Contractor will select and implement one or more BMP
demonstration projects for each River Basin. The purpose of the demonstration projects will be to evaluate by River Basin and pollutant parameter the site-specific effectiveness of one or more of the BMPs chosen. EPD intends that the BMP demonstration project be completed before the Revised TMDL Implementation Plan is issued. The BMP demonstration project will address the major pollutant categories of concern for the respective River Basin as identified in the TMDLs. The demonstration project need not be of a large scale, and may consist of one or more measures from the Table or equivalent BMP measures proposed by the EPD Contractor and approved by EPD. Other such measures may include those found in EPA’s “Best Management Practices Handbook,” the “NRCS National Handbook of Conservation Practices,” or any similar reference, or measures that the volunteers, etc., devise that EPD approves. If for any reason the EPD Contractor does not complete the BMP demonstration project, EPD will take responsibility for doing so.
3. As part of the Initial TMDL Implementation Plan the EPD brochure entitled
“Watershed Wisdom -- Georgia’s TMDL Program” will be distributed by EPD to the EPD Contractor for use with appropriate stakeholders for this TMDL. Also, a copy of the video of that same title will be provided to the EPD Contractor for its use in making presentations to appropriate stakeholders on TMDL Implementation Plan development.
4. If for any reason the EPD Contractor does not complete one or more elements of
Draft Total Maximum Daily Load Evaluation November 2013 Coosa River (FCG and CFB -PCBs)
Georgia Environmental Protection Division 22 Atlanta, Georgia
a Revised TMDL Implementation Plan, EPD will be responsible for getting that (those) element(s) completed, either directly or through another contractor.
5. The deadline for development of a Revised TMDL Implementation Plan is the end
of December 2005.
6. The EPD Contractor helping to develop the Revised TMDL Implementation Plan, in coordination with EPD, will work on the following tasks involved in converting the Initial TMDL Implementation Plan to a Revised TMDL Implementation Plan:
A. Generally characterize the watershed; B. Identify stakeholders; C. Verify the present problem to the extent feasible and appropriate, (e.g., local
monitoring); D. Identify probable sources of pollutant(s); E. For the purpose of assisting in the implementation of the load allocations of this
TMDL, identify potential regulatory or voluntary actions to control pollutant(s) from the relevant nonpoint sources;
F. Determine measurable milestones of progress; G. Develop monitoring plan, taking into account available resources, to measure
effectiveness; and H. Complete and submit to EPD the Revised TMDL Implementation Plan.
7. The public will be provided an opportunity to participate in the development of the Revised TMDL Implementation Plan and to comment on it before it is finalized.
8. The Revised TMDL Implementation Plan will supersede this Initial TMDL
Implementation Plan when GA EPD approves the Revised TMDL Implementation Plan.
Draft Total Maximum Daily Load Evaluation November 2013 Coosa River (FCG and CFB -PCBs)
Georgia Environmental Protection Division 23 Atlanta, Georgia
Management Measure Selector Table Land Use
Management Measures
Fecal Coliform
Dissolved Oxygen
pH
Sediment
Temperature
Toxicity
Mercury
Metals (copper, lead, zinc, cadmium)
PCBs, toxaphene
Agriculture 1. Sediment & Erosion Control
_
_
_
_
2. Confined Animal Facilities
_
_
3. Nutrient Management
_
_
4. Pesticide Management
_
5. Livestock Grazing
_
_
_
_
6. Irrigation
_
_
_
Forestry
1. Preharvest Planning
_
_
2. Streamside Management Areas
_
_
_
_
3. Road Construction
&Reconstruction
_
_
_
4. Road Management
_
_
_
5. Timber Harvesting
_
_
_
6. Site Preparation & Forest
Regeneration
_
_
_
7. Fire Management
_
_
_
_
_
8. Revegetation of Disturbed Areas
_
_
_
_
_
9. Forest Chemical Management
_
_
10. Wetlands Forest Management
_
_
_
_
_

Draft Total Maximum Daily Load Evaluation November 2013 Coosa River (FCG and CFB -PCBs)
Georgia Environmental Protection Division 24 Atlanta, Georgia
Land Use
Management Measures
Fecal Coliform
Dissolved Oxygen
pH
Sediment
Temperature
Toxicity
Mercury
Metals (copper, lead, zinc, cadmium)
PCBs, toxaphene
Urban
1. New Development
_
_
_
_
_
2. Watershed Protection & Site
Development
_
_
_
_
_
_
3. Construction Site Erosion and
Sediment Control
_
_
_
4. Construction Site Chemical
Control
_
5. Existing Developments
_
_
_
_
_
6. Residential and Commercial
Pollution Prevention
_
_
Onsite
Wastewater
1. New Onsite Wastewater Disposal
Systems
_
_
2. Operating Existing Onsite
Wastewater Disposal Systems
_
_
Roads,
Highways
and Bridges
1. Siting New Roads, Highways &
Bridges
_
_
_
_
_
2. Construction Projects for Roads,
Highways and Bridges
_
_
_
3. Construction Site Chemical
Control for Roads, Highways and
Bridges
_
4. Operation and Maintenance-
Roads, Highways and Bridges
_
_
_
_

Draft Total Maximum Daily Load Evaluation November 2013 Coosa River (FCG and CFB -PCBs)
Georgia Environmental Protection Division 25 Atlanta, Georgia
REFERENCES
EPA, 1999. Fact Sheet: Polychlorinated Biphenyls (PCBs) Update: Impact on Fish Advisories. USEPA Office of Water, September 1999. EPA-823-F-99-019.
GA DNR, 2013. Guidelines for Eating Fish from Georgia Waters- 2013 Update. GA DNR, 1998. Environmental Protection Division, 1998 Coosa River Basin Management Plan. GAEPD, 2002. Rules and Regulations For Water Quality Control, Chapter 391-3-6, Revised-
December 2002, Georgia Department of Natural Resources, Environmental Protection Division.
USEPA, 1998. Better Assessment Science Integrating Point and Nonpoint Sources (BASINS),
Version 2.0 User’s Manual, U.S. Environmental Protection Agency, Office of Water, Washington D.C.
USEPA, 1991. Guidance for Water Quality –Based Decisions: The TMDL Process. U.S.
Environmental Protection Agency, Office of Water, Washington, DC. EPA-440/4-91-001, April 1991.
USEPA, 1980. 440/5-80-068, October 1980.