draft report of sim comparison - bipmfinal report - hydrometers comparison between sim laboratories...
TRANSCRIPT

Final report - Hydrometers Comparison between SIM Laboratories
SIM.M.D-S4
FINAL REPORT
Supplementary Comparison
COMPARISON ON THE CALIBRATIONS OF
HYDROMETERS FOR LIQUIDS DENSITY DETERMINATION BETWEEN SIM LABORATORIES
FINAL REPORT SIM.M.D-S4
Index Page 1 Introduction 2 2 Participant laboratories 3 3 Transfer standards (hydrometer samples) 3 4 Circulation and date of measurements 6 5 Traceability of results reported by participants 6 6 Results and uncertainties 9 7 Comparison references values 10 8 Determination of the degrees of equivalence 12 9 Conclusions 26 10 References 27 Annex A 28 Annex B 36 Annex C 42 Annex D 53
INACAL – 2017/06 1/56

Final report - Hydrometers Comparison between SIM Laboratories
SIM.M.D-S4
FINAL REPORT
SUPPLEMENTARY COMPARISON
FINAL REPORT OF COMPARISON ON THE CALIBRATIONS OF HYDROMETERS FOR LIQUID DENSITY DETERMINATION BETWEEN SIM LABORATORIES
SIM.M.D-S4
Abed Morales1, Aldo Quiroga1, Diana Cantero2, Luis Omar Becerra3, Arturo A. Daued3, Luis Carlos Castro4, Manuel Salazar5, Maria Vega6, Francisco Sequeira 7
1 Instituto Nacional de Defensa de la Competencia y de la Protección de la Propiedad Intelectual, INDECOPI / Perú
2 Instituto Nacional de Tecnología, Normalización y Metrología, INTN / Paraguay 3 Centro Nacional de Metrología, CENAM / México 4 Instituto Nacional de Metrología, INM / Colombia
5 Instituto Ecuatoriano de Normalización, INEN / Ecuador 6 Instituto Boliviano de Metrología, IBMETRO / Bolivia
7Laboratorio Costarricense de Metrología, LACOMET / Costa Rica 1) Introduction A supplementary comparison concerning the calibration of hydrometers was proposed during the ANDIMET coordination meeting held on May 31st and Jun 01st 2011 in Bolivia with the purpose of strengthening the national quality infrastructures and cooperation between them to improve regional service availability, internationally recognized and demand-driven besides to know the degree of equivalence between Andean countries. In this regard, according to the requirements of the technical groups of the 4 active ANDIMET members (Colombia, Ecuador, Peru and Bolivia), and after a discussion of priorities, it was decided to make a plan of comparisons between national metrology laboratories of the participating countries. In addition, it was decided to include three SIM NMIs: LACOMET (Costa Rica), INTN (Paraguay) and CENAM (Mexico). This comparison has been carried out with the support of PTB within the project “FOMENTO COORDINADO DE LA INFRAESTRUCTURA DE LA CALIDAD EN LA REGIÓN ANDINA, PTB-CAN”, and is following the same protocol of the CCM.D-K4, which is being carried out within the Density Working Group of the CCM [1]. This supplementary comparison was coordinated by the National Metrology Institute of Peru (SNM-INDECOPI) as Pilot Laboratory and supported by all participants. CENAM acted as co-Pilot Laboratory. Each laboratory has determined the corrections to be applied to three stated scale readings at 20 °C of different transfer standards in the density range between 600 kg/m3 and 2 000 kg/m3. The linking laboratory CENAM has calibrated all transfer standards involved in the comparison and has carried out the measurement at the beginning of the comparison. The values reported of CENAM can be used as pivot values to link them with the comparison SIM.M.D-S1 [2], SIM.M.D-K4 [3] and CCM.D-K4 [1].
INACAL – 2017/06 2/56

Final report - Hydrometers Comparison between SIM Laboratories
SIM.M.D-S4
2) Participant laboratories The participant laboratories are listed in table 2.1. NMIs from all SIM sub-regions participated in this comparison.
Table 2.1 Participants of hydrometer comparison
National Institute of Metrology Acronym Country/
SIM Subregion
Technical Contact(s)
Centro Nacional de Metrologia, kilómetro 4,5; Carretera a los Cués, Municipio El Marqués, Querétaro - México
CENAM México / NORAMET
Luis Omar Becerra [email protected]
Instituto Boliviano de Metrología, Av. Camacho No. 1488, La Paz - Bolivia
IBMETRO Bolivia / ANDIMET
Maria Vega [email protected]
Instituto Ecuatoriano de Normalización, Autopista general Rumiñahui pasando el puente peatonal 5, pasando 20 metros en la dirección del trébol al valle de los chillos, Quito - Ecuador
INEN Ecuador / ANDIMET
Manuel Salazar [email protected]
Instituto Nacional de Defensa de la Competencia y de la Protección de la Propiedad Intelectual, (*) Calle de la Prosa 104, San Borja, Lima - Perú
INDECOPI (*)
Perú / ANDIMET
Abed Morales [email protected]
Instituto Nacional de Metrología, Av. Carrera 50 No. 27-55 Interior 2, Bogotá - Colombia
INM (**)
Colombia / ANDIMET
Luis Carlos Castro [email protected]
Instituto Nacional de Tecnología, Normalización y Metrología, Av. Artigas 3973, Asunción - Paraguay
INTN Paraguay / SURAMET
Diana Cantero [email protected]
Laboratorio Costarricense de Metrología, Ciudad de la Investigación de UCR, San Pedro Montes de Oca, San José – Costa Rica
LACOMET Costa Rica / CAMET
Francisco Sequeira [email protected]
(*) Since Jun 01st 2015 the Peruvian NIM is the Instituto Nacional de Calidad (INACAL). (**) Since March of 2012 the Colombian NIM is the Instituto Nacional de Metrología de Colombia (INM) before the Colombian NIM was the Superintendencia de Industria y Comercio (SIC).
3) Transfer standards (hydrometer samples) For the comparison PTB supplies two similar sets of four hydrometers to be used as transfer standards at 20 °C.
INACAL – 2017/06 3/56

Final report - Hydrometers Comparison between SIM Laboratories
SIM.M.D-S4
Table 3.1
Data of the traveling standards for the SIM density comparison Hydrometer 1 Hydrometer 2 Hydrometer 3 Hydrometer 4
Manufacturer Ludwig Schneider
Ludwig Schneider
Ludwig Schneider
Ludwig Schneider
Range 0,6000 g/cm3 – 0,6100 g/cm3 0 % – 10 % vol 1,4900 g/cm3 –
1,5000 g/cm3 1,9800 g/cm3 – 2,0000 g/cm3
Scale division 0,0001 g/cm3 0,1 % 0,0001 g/cm3 0,0002 g/cm3 Nominal values for calibration
(0,6010; 0,6050; 0,6090) g/cm3
(1,0; 5,0; 9,0) % vol.
(1,4910; 1,4950; 1,4990) g/cm3
(1,9810; 1,9900; 1,9990) g/cm3
Reference temperature 20ºC 20ºC 20ºC 20ºC
Surface Tension: 15,2 mN/m (68,1; 57,8; 51,8) mN/m 55 mN/m 75 mN/m
Cubic expansion coefficient 25 x 10-6 ± 2 x 10⁻⁶
Hydrometer weight (approx.)*: 89 g 129 g 287 g 294 g
Photograph 3.1 Transfer Standards (Hydrometers)
INACAL – 2017/06 4/56

Final report - Hydrometers Comparison between SIM Laboratories
SIM.M.D-S4
Photograph 3.1
Some details about the hydrometers
INACAL – 2017/06 5/56

Final report - Hydrometers Comparison between SIM Laboratories
SIM.M.D-S4
4) Circulation and date of measurements
Each laboratory was responsible for receiving the Transfer Packages testing and sending them to the next participant to the schedule. The linking laboratory CENAM made the measurements of the travelling standards at the beginning of the circulation of the hydrometers.
Table 4.1
Dates of arrival of the travelling standards National Metrology
Institute Date of arrival
CENAM March 2012 IBMETRO April 2012
INTN June 2012 INEN November 2012
INDECOPI January 2013 INM March 2013
LACOMET May 2013 CENAM October 2013
5) Traceability of results reported by participants
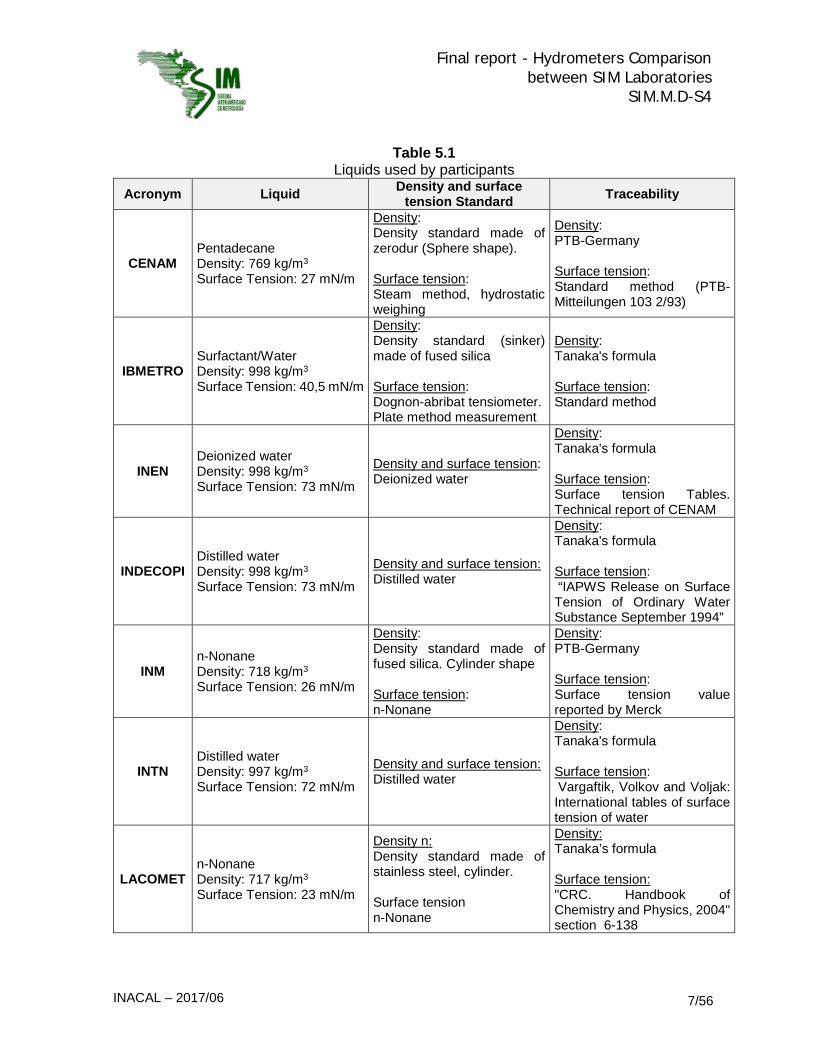
For the calibration of the hydrometers, all laboratories used their own hydrostatic weighing system, and all laboratories determined the corrections to the specific indications (at 20 ºC) of the travelling standards by Cuckow’s method [4]. In the table 5.1 are shown the liquids used by participants as density standards for the calibration of the travelling standards, the mean value and traceability's of the densities and the surface tensions reported by the participants. In the table 5.2 are shown the Thermostat system, balances and mass standard used by participants and also are showing the traceability’s weighing of the travelling standards reported by the participants.
INACAL – 2017/06 6/56
Final report - Hydrometers Comparison between SIM Laboratories
SIM.M.D-S4
Table 5.1
Liquids used by participants Acronym Liquid Density and surface
tension Standard Traceability
CENAM Pentadecane Density: 769 kg/m3 Surface Tension: 27 mN/m
Density: Density standard made of zerodur (Sphere shape). Surface tension: Steam method, hydrostatic weighing
Density: PTB-Germany Surface tension: Standard method (PTB-Mitteilungen 103 2/93)
IBMETRO Surfactant/Water Density: 998 kg/m3 Surface Tension: 40,5 mN/m
Density: Density standard (sinker) made of fused silica Surface tension: Dognon-abribat tensiometer. Plate method measurement
Density: Tanaka's formula Surface tension: Standard method
INEN Deionized water Density: 998 kg/m3 Surface Tension: 73 mN/m
Density and surface tension: Deionized water
Density: Tanaka's formula Surface tension: Surface tension Tables. Technical report of CENAM
INDECOPI Distilled water Density: 998 kg/m3 Surface Tension: 73 mN/m
Density and surface tension: Distilled water
Density: Tanaka's formula Surface tension: “IAPWS Release on Surface Tension of Ordinary Water Substance September 1994”
INM n-Nonane Density: 718 kg/m3 Surface Tension: 26 mN/m
Density: Density standard made of fused silica. Cylinder shape Surface tension: n-Nonane
Density: PTB-Germany Surface tension: Surface tension value reported by Merck
INTN Distilled water Density: 997 kg/m3 Surface Tension: 72 mN/m
Density and surface tension: Distilled water
Density: Tanaka's formula Surface tension: Vargaftik, Volkov and Voljak: International tables of surface tension of water
LACOMET n-Nonane Density: 717 kg/m3 Surface Tension: 23 mN/m
Density n: Density standard made of stainless steel, cylinder. Surface tension n-Nonane
Density: Tanaka’s formula Surface tension: "CRC. Handbook of Chemistry and Physics, 2004" section 6-138
INACAL – 2017/06 7/56

Final report - Hydrometers Comparison between SIM Laboratories
SIM.M.D-S4
Table 5.2
Thermostat system, balances and mass standard used by participants Acronym Thermostat system Balances and mass standard Traceability
CENAM Tamson Bath Maximum capacity: 70 L Temperature range: 10 °C / 50 °C Stability at 20 °C: 0,002 °C
Balance: Mettler Toledo Type AT400 / d=0,1 mg Mass standard: Weights OIML E2
CENAM
IBMETRO Tamson Bath Maximum capacity: 50 L Temperature range: 10 °C / 50 °C Stability at 20 °C: 0,1 °C
Balances: Balance used for weighing in air: Mettler Toledo Type PR1203 / d=1 mg Balance used for weighing in liquid: Sartorius Type BP221S / d=0,1 mg Mass standard: Weights OIML E2
LATU
INEN Homemade bath Balance: Mettler Toledo Type XP504 / d=0,1 mg
INEN mass standards
INDECOPI
Homemade bath composed of a graduated cylinder into a double square glassware container Maximum capacity: 10 L Temperature range: 19 °C / 25 °C Stability at 20 °C: 0,1 °C
Balance: Mettler Type AE163 / d=0,1 mg
INDECOPI mass standards
INM Tamson Bath Maximum capacity: 70 L Temperature range: -40 °C / 80 °C Stability at 20 °C: 0,02 °C
Balance: Mettler Toledo Type XP504 / d=0,1 mg
INM mass standards
INTN Homemade bath Maximum capacity: 30 L Temperature range: 18 °C / 23 °C Stability at 20 °C: 0,1 °C
Balance: Mettler Toledo Type PR 2003 / d=1 mg
INTN mass standards
LACOMET
Homemade bath composed of a double glassware container Maximum capacity: 20 L Temperature range: 20 °C Stability at 20 °C: 0,15 °C
Balances: Balance used for weighing in air: Mettler Toledo Type AT1005 / d=0,1 mg Balance used for weighing in liquid: Mettler Toledo Type PR5003 / d=1 mg Mass standard: Weights OIML E1
LACOMET mass standards
INACAL – 2017/06 8/56

Final report - Hydrometers Comparison between SIM Laboratories
SIM.M.D-S4
6) Results and uncertainties
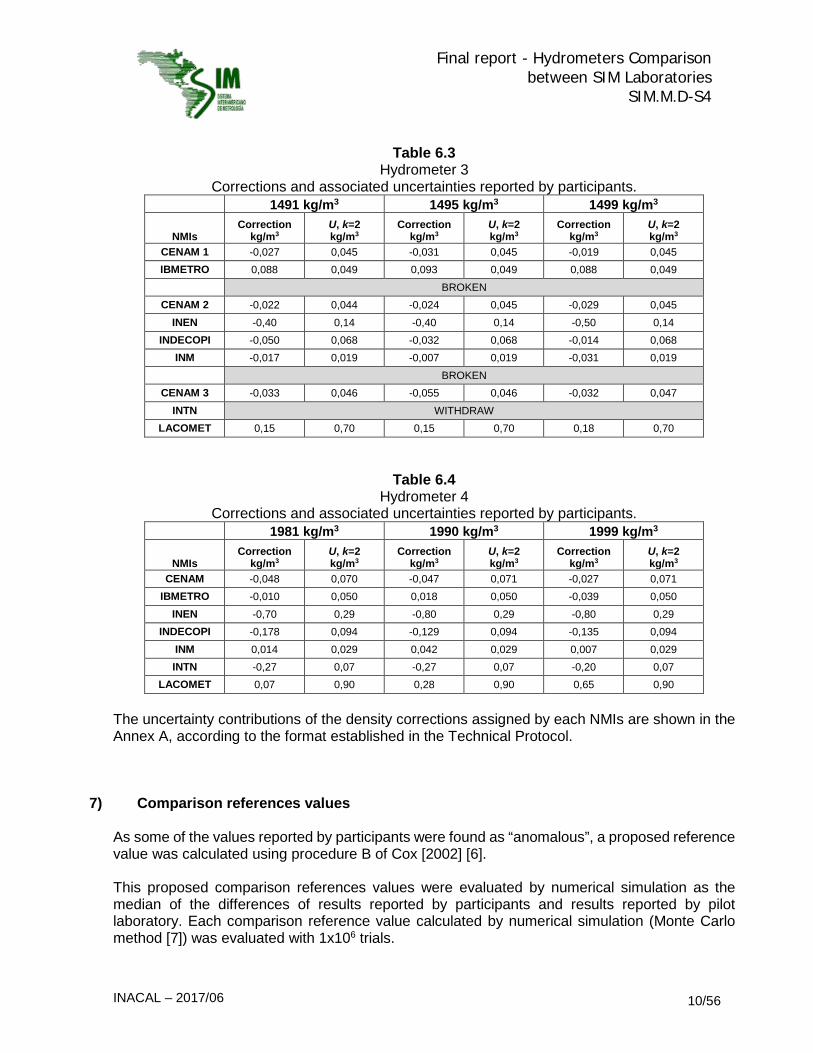
For each hydrometer, the protocol specified three nominal values for which the participants had to report the density corrections and the associated uncertainties at the specific temperature of 20 ºC. CENAM made the measurements at the beginning of the circulation of the travelling standards. The corrections and their uncertainties [5] reported by participants are shown in the table 6.1, table 6.2, table 6.3 and table 6.4. The correction is: “calibrated value – reading”. The rows with successive entries of “CENAM” in Table 6.3 divide data from the three loops and the three hydrometers of each loop. Although the reproducibility of each artifact was not known, it is considered that hydrometers are instruments very stable over time, for that reason the reproducibility is considered negligible in this comparison.
Table 6.1 Hydrometer 1
Corrections and associated uncertainties reported by participants. 601 kg/m3 605 kg/m3 609 kg/m3
NMIs Correction
kg/m3 U, k=2 kg/m3
Correction kg/m3
U, k=2 kg/m3
Correction kg/m3
U, k=2 kg/m3
CENAM -0,056 0,028 -0,053 0,028 -0,057 0,028 IBMETRO -0,045 0,048 -0,030 0,048 -0,015 0,048
INEN -0,80 0,09 -0,80 0,09 -0,80 0,09 INDECOPI -0,066 0,036 -0,037 0,036 -0,104 0,036
INM 0,025 0,013 0,026 0,013 0,032 0,013 INTN -0,10 0,08 0,07 0,08 -0,05 0,08
LACOMET 0,00 0,29 0,00 0,29 0,00 0,29
Table 6.2 Hydrometer 2
Corrections and associated uncertainties reported by participants.
9 %
(985,92 kg/m3) 5 %
(991,06 kg/m3) 1 %
(996,70 kg/m3)
NMIs Correction
kg/m3 U, k=2 kg/m3
Correction kg/m3
U, k=2 kg/m3
Correction kg/m3
U, k=2 kg/m3
CENAM -0,009 0,047 -0,038 0,048 -0,033 0,048 IBMETRO -0,020 0,050 -0,025 0,050 0,001 0,050
INEN -0,60 0,08 -0,70 0,08 -0,70 0,08 INDECOPI -0,026 0,071 0,007 0,071 -0,016 0,071
INM 0,023 0,025 0,082 0,025 0,068 0,025 INTN 0,06 0,03 -0,06 0,03 -0,08 0,03
LACOMET 0,46 0,46 0,13 0,46 0,11 0,46
INACAL – 2017/06 9/56
Final report - Hydrometers Comparison between SIM Laboratories
SIM.M.D-S4
Table 6.3
Hydrometer 3 Corrections and associated uncertainties reported by participants.
1491 kg/m3 1495 kg/m3 1499 kg/m3
NMIs Correction
kg/m3 U, k=2 kg/m3
Correction kg/m3
U, k=2 kg/m3
Correction kg/m3
U, k=2 kg/m3
CENAM 1 -0,027 0,045 -0,031 0,045 -0,019 0,045 IBMETRO 0,088 0,049 0,093 0,049 0,088 0,049
BROKEN CENAM 2 -0,022 0,044 -0,024 0,045 -0,029 0,045
INEN -0,40 0,14 -0,40 0,14 -0,50 0,14 INDECOPI -0,050 0,068 -0,032 0,068 -0,014 0,068
INM -0,017 0,019 -0,007 0,019 -0,031 0,019 BROKEN
CENAM 3 -0,033 0,046 -0,055 0,046 -0,032 0,047 INTN WITHDRAW
LACOMET 0,15 0,70 0,15 0,70 0,18 0,70
Table 6.4 Hydrometer 4
Corrections and associated uncertainties reported by participants. 1981 kg/m3 1990 kg/m3 1999 kg/m3
NMIs Correction
kg/m3 U, k=2 kg/m3
Correction kg/m3
U, k=2 kg/m3
Correction kg/m3
U, k=2 kg/m3
CENAM -0,048 0,070 -0,047 0,071 -0,027 0,071 IBMETRO -0,010 0,050 0,018 0,050 -0,039 0,050
INEN -0,70 0,29 -0,80 0,29 -0,80 0,29 INDECOPI -0,178 0,094 -0,129 0,094 -0,135 0,094
INM 0,014 0,029 0,042 0,029 0,007 0,029 INTN -0,27 0,07 -0,27 0,07 -0,20 0,07
LACOMET 0,07 0,90 0,28 0,90 0,65 0,90
The uncertainty contributions of the density corrections assigned by each NMIs are shown in the Annex A, according to the format established in the Technical Protocol.
7) Comparison references values As some of the values reported by participants were found as “anomalous”, a proposed reference value was calculated using procedure B of Cox [2002] [6]. This proposed comparison references values were evaluated by numerical simulation as the median of the differences of results reported by participants and results reported by pilot laboratory. Each comparison reference value calculated by numerical simulation (Monte Carlo method [7]) was evaluated with 1x10⁶ trials.
INACAL – 2017/06 10/56
Final report - Hydrometers Comparison between SIM Laboratories
SIM.M.D-S4
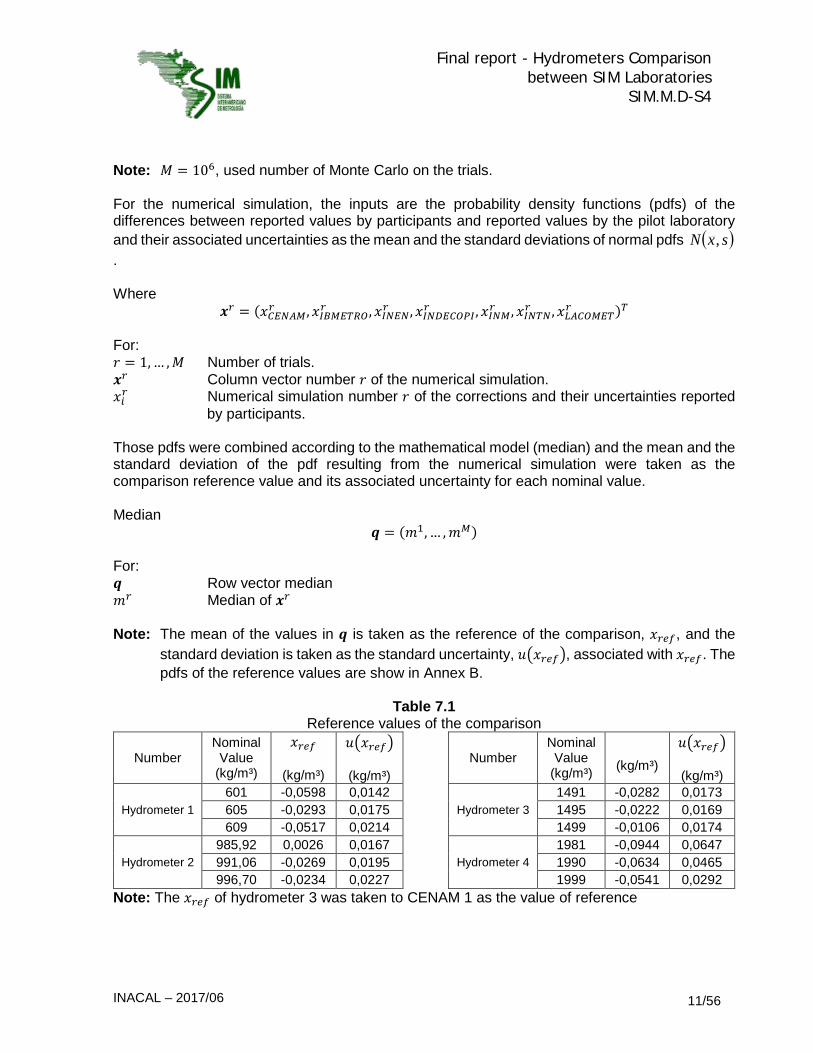
Note: 𝑀𝑀 = 106, used number of Monte Carlo on the trials. For the numerical simulation, the inputs are the probability density functions (pdfs) of the differences between reported values by participants and reported values by the pilot laboratory and their associated uncertainties as the mean and the standard deviations of normal pdfs ( )sxN ,. Where
𝒙𝒙𝑟𝑟 = (𝑥𝑥𝐶𝐶𝐶𝐶𝐶𝐶𝐶𝐶𝐶𝐶𝑟𝑟 ,𝑥𝑥𝐼𝐼𝐼𝐼𝐶𝐶𝐶𝐶𝐼𝐼𝐼𝐼𝐼𝐼𝑟𝑟 ,𝑥𝑥𝐼𝐼𝐶𝐶𝐶𝐶𝐶𝐶𝑟𝑟 ,𝑥𝑥𝐼𝐼𝐶𝐶𝐼𝐼𝐶𝐶𝐶𝐶𝐼𝐼𝐼𝐼𝐼𝐼𝑟𝑟 ,𝑥𝑥𝐼𝐼𝐶𝐶𝐶𝐶𝑟𝑟 ,𝑥𝑥𝐼𝐼𝐶𝐶𝐼𝐼𝐶𝐶𝑟𝑟 ,𝑥𝑥𝐿𝐿𝐶𝐶𝐶𝐶𝐼𝐼𝐶𝐶𝐶𝐶𝐼𝐼𝑟𝑟 )𝐼𝐼 For: 𝑟𝑟 = 1, … ,𝑀𝑀 Number of trials. 𝒙𝒙𝑟𝑟 Column vector number 𝑟𝑟 of the numerical simulation. 𝑥𝑥𝑖𝑖𝑟𝑟 Numerical simulation number 𝑟𝑟 of the corrections and their uncertainties reported
by participants. Those pdfs were combined according to the mathematical model (median) and the mean and the standard deviation of the pdf resulting from the numerical simulation were taken as the comparison reference value and its associated uncertainty for each nominal value. Median
𝒒𝒒 = (𝑚𝑚1, … ,𝑚𝑚𝐶𝐶) For: 𝒒𝒒 Row vector median 𝑚𝑚𝑟𝑟 Median of 𝒙𝒙𝑟𝑟 Note: The mean of the values in 𝒒𝒒 is taken as the reference of the comparison, 𝑥𝑥𝑟𝑟𝑟𝑟𝑟𝑟, and the
standard deviation is taken as the standard uncertainty, 𝑢𝑢�𝑥𝑥𝑟𝑟𝑟𝑟𝑟𝑟�, associated with 𝑥𝑥𝑟𝑟𝑟𝑟𝑟𝑟. The pdfs of the reference values are show in Annex B.
Table 7.1
Reference values of the comparison
Number Nominal
Value (kg/m³)
𝑥𝑥𝑟𝑟𝑟𝑟𝑟𝑟
(kg/m³)
𝑢𝑢�𝑥𝑥𝑟𝑟𝑟𝑟𝑟𝑟�
(kg/m³)
Number
Nominal Value
(kg/m³)
(kg/m³)
𝑢𝑢�𝑥𝑥𝑟𝑟𝑟𝑟𝑟𝑟�
(kg/m³)
Hydrometer 1 601 -0,0598 0,0142
Hydrometer 3 1491 -0,0282 0,0173
605 -0,0293 0,0175 1495 -0,0222 0,0169 609 -0,0517 0,0214 1499 -0,0106 0,0174
Hydrometer 2 985,92 0,0026 0,0167
Hydrometer 4 1981 -0,0944 0,0647
991,06 -0,0269 0,0195 1990 -0,0634 0,0465 996,70 -0,0234 0,0227 1999 -0,0541 0,0292
Note: The 𝑥𝑥𝑟𝑟𝑟𝑟𝑟𝑟 of hydrometer 3 was taken to CENAM 1 as the value of reference
INACAL – 2017/06 11/56

Final report - Hydrometers Comparison between SIM Laboratories
SIM.M.D-S4
8) Determination of the degrees of equivalence
8.1 Degree of equivalence between participants and the comparison references values In order to evaluate the degree of equivalence between the values reported by participants and the comparison references values, 𝑑𝑑𝑖𝑖, the differences between reported values by participants and the comparison references values evaluated by numerical simulation for the corresponding nominal value are as follows,
refii xxd −= From the pdfs resulting for each difference, id , we obtained the mean value and the interval of confidence for an approximately level of confidence of 95%, Pair of values each institute: �𝑑𝑑𝑖𝑖 , �𝑑𝑑𝑙𝑙𝑙𝑙𝑙𝑙(2,5%),𝑑𝑑ℎ𝑖𝑖𝑖𝑖ℎ(97,5%)�� Even when the pdfs of the differences id evaluated by numerical simulation are slightly asymmetrical, the normalized errors were calculated assuming symmetry in pdfs of the differences,
( )( )lowhigh
refimediann
dd
xxE
−
−=
21
INACAL – 2017/06 12/56

Final report - Hydrometers Comparison between SIM Laboratories
SIM.M.D-S4
Table 8.1
Hydrometer 1 Degree of equivalence for 601 kg/m³
NMI id 𝑑𝑑𝑙𝑙𝑙𝑙𝑙𝑙(2,5%) 𝑑𝑑ℎ𝑖𝑖𝑖𝑖ℎ(97,5%) nE
CENAM 0,0038 -0,0287 0,0414 0,11 IBMETRO 0,0148 -0,0278 0,0666 0,31 INEN -0,7402 -0,8325 -0,6476 8,01 INDECOPI -0,0064 -0,0477 0,0291 0,17 INM 0,0848 0,0551 0,1164 2,76 INTN -0,0402 -0,1209 0,0292 0,54 LACOMET 0,0599 -0,2154 0,3392 0,22
Graph 8.1 Hydrometer 1
Degree of equivalence for 601 kg/m³
Note: The bars represent the expanded uncertainty of k=2
INACAL – 2017/06 13/56

Final report - Hydrometers Comparison between SIM Laboratories
SIM.M.D-S4
Table 8.2
Hydrometer 1 Degree of equivalence for 605 kg/m³
NMI id 𝑑𝑑𝑙𝑙𝑙𝑙𝑙𝑙(2,5%) 𝑑𝑑ℎ𝑖𝑖𝑖𝑖ℎ(97,5%) nE
CENAM -0,0237 -0,0698 0,0027 0,65 IBMETRO -0,0007 -0,0459 0,0472 0,01 INEN -0,7707 -0,8656 -0,6763 8,15 INDECOPI -0,0077 -0,0559 0,0300 0,18 INM 0,0553 0,0151 0,0889 1,50 INTN 0,0994 0,0129 0,1844 1,16 LACOMET 0,0294 -0,2444 0,3062 0,11
Graph 8.2 Hydrometer 1
Degree of equivalence for 605 kg/m³
Note: The bars represent the expanded uncertainty of k=2
INACAL – 2017/06 14/56

Final report - Hydrometers Comparison between SIM Laboratories
SIM.M.D-S4
Table 8.3
Hydrometer 1 Degree of equivalence for 609 kg/m³
NMI id 𝑑𝑑𝑙𝑙𝑙𝑙𝑙𝑙(2,5%) 𝑑𝑑ℎ𝑖𝑖𝑖𝑖ℎ(97,5%) nE
CENAM -0,0053 -0,0571 0,0419 0,11 IBMETRO 0,0367 0,0000 0,0990 0,74 INEN -0,7483 -0,8462 -0,6508 7,66 INDECOPI -0,0523 -0,1089 0,0000 0,96 INM 0,0837 0,0365 0,1281 1,83 INTN 0,0017 -0,0681 0,0749 0,02 LACOMET 0,0518 -0,2177 0,3285 0,19
Graph 8.3 Hydrometer 1
Degree of equivalence for 609 kg/m³
Note: The bars represent the expanded uncertainty of k=2
INACAL – 2017/06 15/56

Final report - Hydrometers Comparison between SIM Laboratories
SIM.M.D-S4
Table 8.4
Hydrometer 2 Degree of equivalence for 9 % (985,92 kg/m³)
NMI id 𝑑𝑑𝑙𝑙𝑙𝑙𝑙𝑙(2,5%) 𝑑𝑑ℎ𝑖𝑖𝑖𝑖ℎ(97,5%) nE
CENAM -0,0116 -0,0614 0,0204 0,28 IBMETRO -0,0226 -0,0780 0,0106 0,51 INEN -0,6026 -0,6870 -0,5172 7,10 INDECOPI -0,0286 -0,1005 0,0237 0,46 INM 0,0204 -0,0029 0,0627 0,62 INTN 0,0574 0,0149 0,1027 1,31 LACOMET 0,4576 0,0050 0,9076 1,01
Graph 8.4 Hydrometer 2
Degree of equivalence for 9 % (985,92 kg/m³)
Note: The bars represent the expanded uncertainty of k=2
INACAL – 2017/06 16/56

Final report - Hydrometers Comparison between SIM Laboratories
SIM.M.D-S4
Table 8.5
Hydrometer 2 Degree of equivalence for 5 % (991,06 kg/m³)
NMI id 𝑑𝑑𝑙𝑙𝑙𝑙𝑙𝑙(2,5%) 𝑑𝑑ℎ𝑖𝑖𝑖𝑖ℎ(97,5%) nE
CENAM -0,0111 -0,0680 0,0347 0,22 IBMETRO 0,0019 -0,0462 0,0551 0,04 INEN -0,6731 -0,7606 -0,5862 7,72 INDECOPI 0,0339 -0,0244 0,1104 0,50 INM 0,1089 0,0623 0,1530 2,40 INTN -0,0331 -0,0824 0,0000 0,80 LACOMET 0,1571 -0,2784 0,6027 0,36
Graph 8.5 Hydrometer 2
Degree of equivalence for 5 % (991,06 kg/m³)
Note: The bars represent the expanded uncertainty of k=2
INACAL – 2017/06 17/56

Final report - Hydrometers Comparison between SIM Laboratories
SIM.M.D-S4
Table 8.6
Hydrometer 2 Degree of equivalence for 1 % (996,70 kg/m³)
NMI id 𝑑𝑑𝑙𝑙𝑙𝑙𝑙𝑙(2,5%) 𝑑𝑑ℎ𝑖𝑖𝑖𝑖ℎ(97,5%) nE
CENAM -0,0095 -0,0701 0,0414 0,17 IBMETRO 0,0244 -0,0176 0,0899 0,46 INEN -0,6765 -0,7662 -0,5861 7,51 INDECOPI 0,0075 -0,0555 0,0793 0,11 INM 0,0915 0,0413 0,1432 1,80 INTN -0,0565 -0,1092 0,0000 1,04 LACOMET 0,1336 -0,2994 0,5773 0,30
Graph 8.6 Hydrometer 2
Degree of equivalence for 1 % (996,70 kg/m³)
Note: The bars represent the expanded uncertainty of k=2
INACAL – 2017/06 18/56
Final report - Hydrometers Comparison between SIM Laboratories
SIM.M.D-S4
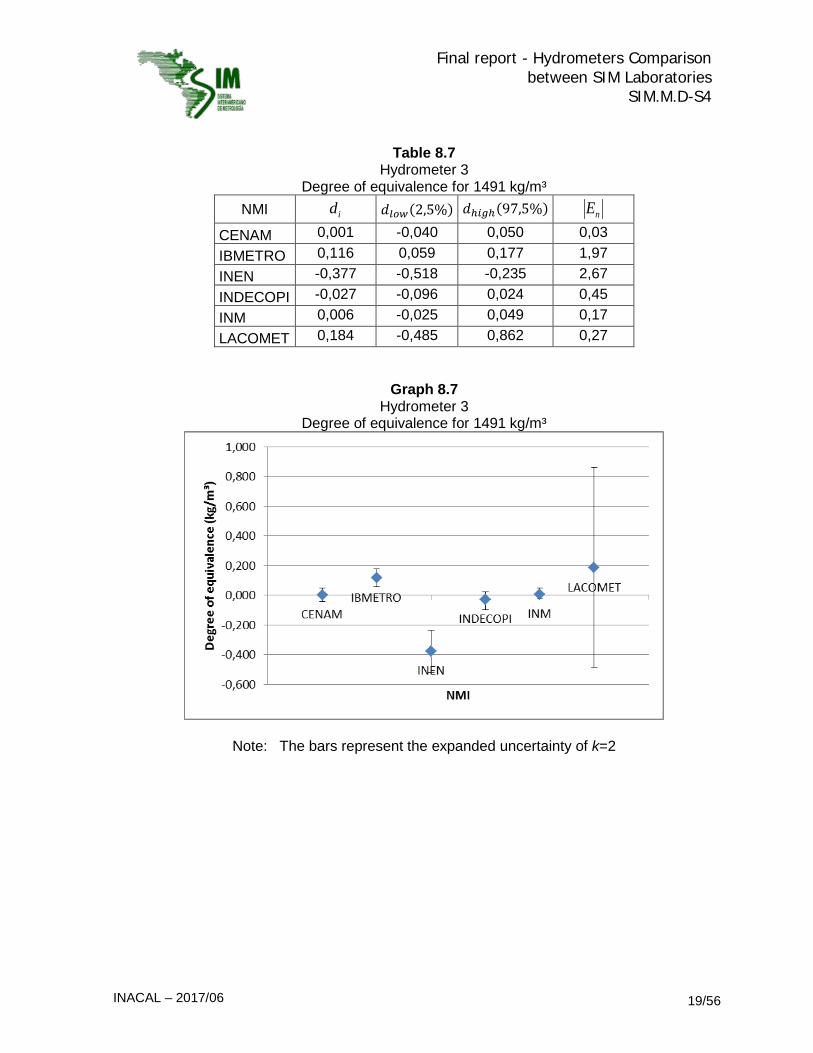
Table 8.7
Hydrometer 3 Degree of equivalence for 1491 kg/m³
NMI id 𝑑𝑑𝑙𝑙𝑙𝑙𝑙𝑙(2,5%) 𝑑𝑑ℎ𝑖𝑖𝑖𝑖ℎ(97,5%) nE
CENAM 0,001 -0,040 0,050 0,03 IBMETRO 0,116 0,059 0,177 1,97 INEN -0,377 -0,518 -0,235 2,67 INDECOPI -0,027 -0,096 0,024 0,45 INM 0,006 -0,025 0,049 0,17 LACOMET 0,184 -0,485 0,862 0,27
Graph 8.7 Hydrometer 3
Degree of equivalence for 1491 kg/m³
Note: The bars represent the expanded uncertainty of k=2
INACAL – 2017/06 19/56

Final report - Hydrometers Comparison between SIM Laboratories
SIM.M.D-S4
Table 8.8
Hydrometer 3 Degree of equivalence for 1495 kg/m³
NMI id 𝑑𝑑𝑙𝑙𝑙𝑙𝑙𝑙(2,5%) 𝑑𝑑ℎ𝑖𝑖𝑖𝑖ℎ(97,5%) nE
CENAM -0,0087 -0,0561 0,0349 0,19 IBMETRO 0,1152 0,0580 0,1752 1,97 INEN -0,3847 -0,5255 -0,2433 2,73 INDECOPI -0,0168 -0,0820 0,0348 0,29 INM 0,0082 -0,0233 0,0499 0,23 LACOMET 0,1965 -0,4739 0,8743 0,29
Graph 8.8 Hydrometer 3
Degree of equivalence for 1495 kg/m³
Note: The bars represent the expanded uncertainty of k=2
INACAL – 2017/06 20/56

Final report - Hydrometers Comparison between SIM Laboratories
SIM.M.D-S4
Table 8.9
Hydrometer 3 Degree of equivalence for 1499 kg/m³
NMI id 𝑑𝑑𝑙𝑙𝑙𝑙𝑙𝑙(2,5%) 𝑑𝑑ℎ𝑖𝑖𝑖𝑖ℎ(97,5%) nE
CENAM -0,0084 -0,0575 0,0324 0,19 IBMETRO 0,0986 0,0392 0,1569 1,68 INEN -0,4794 -0,6207 -0,3380 3,39 INDECOPI 0,0066 -0,0499 0,0657 0,11 INM -0,0104 -0,0496 0,0230 0,29 LACOMET 0,2039 -0,4674 0,8825 0,30
Graph 8.9 Hydrometer 3
Degree of equivalence for 1499 kg/m³
Note: The bars represent the expanded uncertainty of k=2
INACAL – 2017/06 21/56

Final report - Hydrometers Comparison between SIM Laboratories
SIM.M.D-S4
Table 8.10
Hydrometer 4 Degree of equivalence for 1981 kg/m³
NMI id 𝑑𝑑𝑙𝑙𝑙𝑙𝑙𝑙(2,5%) 𝑑𝑑ℎ𝑖𝑖𝑖𝑖ℎ(97,5%) nE
CENAM 0,0464 0,0000 0,2032 0,46 IBMETRO 0,0844 0,0000 0,2333 0,72
INEN -0,6056 -0,9125 -0,2907 1,95 INDECOPI -0,0836 -0,2208 0,0000 0,76
INM 0,1084 0,0118 0,2510 0,91 INTN -0,1756 -0,2953 -0,0155 1,26
LACOMET 0,1647 -0,6395 1,0038 0,20
Graph 8.10 Hydrometer 4
Degree of equivalence for 1981 kg/m³
Note: The bars represent the expanded uncertainty of k=2
INACAL – 2017/06 22/56

Final report - Hydrometers Comparison between SIM Laboratories
SIM.M.D-S4
Table 8.11
Hydrometer 4 Degree of equivalence for 1990 kg/m³
NMI id 𝑑𝑑𝑙𝑙𝑙𝑙𝑙𝑙(2,5%) 𝑑𝑑ℎ𝑖𝑖𝑖𝑖ℎ(97,5%) nE
CENAM 0,0165 -0,0266 0,1430 0,19 IBMETRO 0,0814 0,0000 0,2015 0,81
INEN -0,7365 -1,0329 -0,4359 2,47 INDECOPI -0,0655 -0,1859 0,0000 0,71
INM 0,1054 0,0254 0,2204 1,08 INTN -0,2065 -0,3098 -0,0787 1,79
LACOMET 0,3438 -0,4748 1,2080 0,41
Graph 8.11 Hydrometer 4
Degree of equivalence for 1990 kg/m³
Note: The bars represent the expanded uncertainty of k=2
INACAL – 2017/06 23/56

Final report - Hydrometers Comparison between SIM Laboratories
SIM.M.D-S4
Table 8.12
Hydrometer 4 Degree of equivalence for 1999 kg/m³
NMI id 𝑑𝑑𝑙𝑙𝑙𝑙𝑙𝑙(2,5%) 𝑑𝑑ℎ𝑖𝑖𝑖𝑖ℎ(97,5%) nE
CENAM 0,0271 -0,0009 0,1166 0,46 IBMETRO 0,0151 -0,0018 0,0965 0,31
INEN -0,7459 -1,0346 -0,4552 2,57 INDECOPI -0,0809 -0,1855 0,0000 0,87
INM 0,0611 0,0047 0,1374 0,92 INTN -0,1459 -0,2303 -0,0493 1,61
LACOMET 0,7045 -0,1031 1,5812 0,84
Graph 8.12 Hydrometer 4
Degree of equivalence for 1999 kg/m³
Note: The bars represent the expanded uncertainty of k=2
INACAL – 2017/06 24/56

Final report - Hydrometers Comparison between SIM Laboratories
SIM.M.D-S4
8.2 Degree of equivalence between participants and CENAM The degree of equivalence between participants and CENAM was calculated as the difference between the values reported by participants and CENAM. Note: The values reported of CENAM can be used as pivot values for to link it with the
comparison SIM.M.D-S1 and SIM.M.D-K4. Degree of equivalence between participant and CENAM are,
CENAMiCENAMi xxd −=, with the expanded uncertainty as follows,
( ) ( ) ( )CENAMiCENAMi xuxudU 22, 2 +=
The normalized error were calculated for each nominal value as follows,
�𝐸𝐸𝑛𝑛(𝑖𝑖,𝐶𝐶𝐶𝐶𝐶𝐶𝐶𝐶𝐶𝐶)� =�𝑑𝑑𝑖𝑖,𝐶𝐶𝐶𝐶𝐶𝐶𝐶𝐶𝐶𝐶�𝑈𝑈�𝑑𝑑𝑖𝑖,𝐶𝐶𝐶𝐶𝐶𝐶𝐶𝐶𝐶𝐶�
Where: 𝑖𝑖 IBMETRO, INTN, INEN, INDECOPI, INM and LACOMET The degrees of equivalence between participants are listed in tables C1.1 to C4.3 of annex C. 8.2.1 Link to the “CCM key comparison CCM.D-K4”
The link to the CCM key comparison CCM.D-K4 was made through the CENAM. The degree of equivalence were calculated according to CCM Key Comparison CCM.D-K4 “Hydrometer”: Draft B (3.7 Linkage of international comparisons to the CCM.D-K4).
The normalized errors, respect to CCM.D-K4, were calculated for each nominal value as follows,
�𝐸𝐸𝑛𝑛(𝑖𝑖,𝐶𝐶𝐶𝐶𝐶𝐶.𝐼𝐼−𝐾𝐾4)� =� 4., KDCCMiD − �
𝑈𝑈 � 4., KDCCMiD − �
Where: Di,CCM.D-K4 and U(Di,CCM.D-K4 ), are the degree of equivalence to CCM.D-K4 and its uncertainty
The link to CCM.D-K4 are listed in tables C5 to C6 of annex C.
INACAL – 2017/06 25/56

Final report - Hydrometers Comparison between SIM Laboratories
SIM.M.D-S4
8.3 Degree of equivalence between participants The degree of equivalence among participant laboratories was calculated as the difference between the values reported by participants. Degree of equivalence between participant laboratories are,
jiji xxd −=, with the expanded uncertainty as follows,
( ) ( ) ( )jiji xuxudu 22, 2 +=
Where:
ji ≠ 𝑖𝑖 or 𝑗𝑗 CENAM, IBMETRO, INTN, INEN, INDECOPI, INM and LACOMET The degrees of equivalence between participants are listed in tables D1 to D4 of annex D.
9) Conclusions
The main objectives of this SIM comparison were:
• to evaluate the degree of equivalence between SIM NMIs in the calibration of hydrometers of high accuracy within the range of 600 kg/m3 to 2 000 kg/m3,and
• to anticipate to the CCM KC on hydrometers calibration and eventually to link the results
of SIM NMIs with Key Comparison Reference Value (KCRV) of CCM.D-K4. In order to reach such objectives, one set of four hydrometers each was circulated between seven NMIs of SIM. All measurements were carried out from April 2012 to December 2012. For the measurements each laboratory used their own hydrostatic weighing system with their own respective standard liquid such as: Deionized water, Distilled water, Surfactant/Water, pentadecane, and n-Nonane. The traceability of the density standard liquids are either from PTB’s density standard from CENAM and INM , or from different formulae to calculate the density of water (Tanaka’s formula and others formulae). The participant laboratories agreed to use of the median of the differences of results reported by participants, evaluated by numerical simulation, as the reference value for this comparison.
INACAL – 2017/06 26/56

Final report - Hydrometers Comparison between SIM Laboratories
SIM.M.D-S4
The normalized errors calculated for each result reported by participants are listed in tables 8.1 to 8.12. These normalized errors were calculated with a level of confidence of approximately 95% (k=2). 10. Reference [1] Lorefice, S. - Key comparison CCM.D_K4 “Hydrometer” Project: Comparison of the
calibration of high resolution hydrometers for liquid density determinations. 2011-2012. [2] Becerra L. and Lorefice, S. – Supplementary comparison SIM.M.D-S1, Comparison of the
calibration of hydrometers for liquid density determination (bilateral CENAM - INRIM). 2007.
[3] Becerra L. – Supplementary comparison SIM.M.D- K4, Comparison of the calibration of
density hydrometers. 2007 – 2008. [4] Cuckow F W - A new method of high accuracy for the calibration of reference standard hydrometers J. Soc. Chem. Indust. 68 44–9, 1949. [5] JCGM 100:2008 - Evaluation of measurement data — Guide to the expression of
uncertainty in measurement. [6] Cox M.G., The evaluation of key comparison data, Metrologia, 2002, 39, 589-595. [7] JCGM 101:2008 - Evaluation of measurement data — Supplement 1 to the “Guide to the
expression of uncertainty in measurement” — Propagation of distributions using a Monte Carlo method.
INACAL – 2017/06 27/56

Final report - Hydrometers Comparison between SIM Laboratories
SIM.M.D-S4
ANNEX A
A.1 Uncertainty contributions values reported by the NMIs for the hydrometers
Table A1.1
Uncertainty contributions reported by the NMIs for the hydrometer 1
INFLUENCE QUANTITY Unit CENAM IBMETRO INEN INDECOPI INM INTN LACOMET
Weighing value of hydrometer in air g 0,00004 0,0002 0,00012 0,00079 0,00029 0,00080 0,00028
Weighing value of hydrometer in buoyant liquid (1st point) g 0,00024 0,0002 0,00050 0,00036 0,00033 0,00181 0,00033
Weighing value of hydrometer in buoyant liquid (2nd point) g 0,00024 0,0002 0,00063 0,00036 0,00032 0,00133 0,00027
Weighing value of hydrometer in buoyant liquid (3rd point) g 0,00018 0,0002 0,00060 0,00036 0,00029 0,00110 0,00028
Additional weights g 0,000086 0,0002021
Cubic thermal expansion coefficient of glass 1/K 1x10⁻⁶ 2x10⁻⁶ 1,15x10⁻⁶ 1,15x10⁻⁶ 1,15x10⁻⁶ 1,15x10⁻⁶ 1,15x10⁻⁶
Diameter of stem of hydrometer mm 0,14000 0,005 0,01149 0,01247 0,012 0,03284 0,01041
Density of air g/cm3 0,00000076 0,00000034 0,00000027 0,00000332 0,00000036 0,00000126 0,00000011
Density buoyant liquid (1st point) g/cm3 0,000007 0,000023 0,000071 0,000022 0,000003 0,0000059 0,000166
Density buoyant liquid (2nd point) g/cm3 0,000007 0,000023 0,000071 0,000022 0,000003 0,000021 0,000166
Density buoyant liquid (3rd point) g/cm3 0,000007 0,000023 0,000071 0,000022 0,000003 0,0000065 0,000166
Temperature of liquid at hydrometer °C 0,01 0,10 0,32 0,092 0,011 0,01 0,15
Cubic thermal expansion coefficient of liquid g/(cm3K) 0,00002 0,00002 0,00005 0,00002
Compressibility of liquid Pa-1 2x10-11 2x10-11 1,5x10⁻¹¹ 3x10-11
Surface tension of liquid mN/m 0,23 1 1,039 0,050 0,14 0,087 0,005
Gravitation acceleration m/s2 5x10⁻⁶ 1x10⁻⁴ 2,8x10⁻⁷ 1x10⁻³ 6,8x10⁻⁶ 2,5x10⁻⁵ 4,8x10⁻⁷
Gradient of gravitational acceleration m-1 -3x10⁻⁸ 3,1x10⁻⁷ 3,1x10⁻⁸
Height difference of weights and hydrometer m 0,005 0,01 0,00029
Readings error mm 0,00577350 0,00004 0,1
Reproducibility g/cm3 0,000009
INACAL – 2017/06 28/56

Final report - Hydrometers Comparison between SIM Laboratories
SIM.M.D-S4
Table A1.2 Uncertainty contributions reported by the NMIs for the hydrometer 2
INFLUENCE QUANTITY Unit CENAM IBMETRO INEN INDECOPI INM INTN LACOMET
Weighing value of hydrometer in air g 0,00010 0,00019 0,00011 0,00039 0,00029 0,00085 0,00021
Weighing value of hydrometer in buoyant liquid (1st point) g 0,00011 0,00024 0,00029 0,00034 0,00029 0,00130 0,00039
Weighing value of hydrometer in buoyant liquid (2nd point) g 0,00009 0,00012 0,00031 0,00034 0,00030 0,00125 0,00043
Weighing value of hydrometer in buoyant liquid (3rd point) g 0,00010 0,00013 0,00024 0,00036 0,00029 0,00087 0,00016
Additional weights g 0,000118
Cubic thermal expansion coefficient of glass 1/K 1x10⁻⁶ 2x10⁻⁶ 1,15x10⁻⁶ 1,15x10⁻⁶ 1,15x10⁻⁶ 1,15x10⁻⁶ 1,15x10⁻⁶
Diameter of stem of hydrometer mm 0,14000 0,005 0,01523 0,01394 0,012 0,03019 0,01041
Density air g/cm3 0,00000076 0,00000056 0,00000072 0,00000331 0,00000045 0,00000126 0,00000008
Density buoyant liquid (1st point) g/cm3 0,000007 0,000023 0,000030 0,000027 0,000003 0,00000032 0,000166
Density buoyant liquid (2nd point) g/cm3 0,000007 0,000023 0,000030 0,000027 0,000003 0,0000061 0,000166
Density buoyant liquid (3rd point) g/cm3 0,000007 0,000023 0,000030 0,000027 0,000003 0,0000071 0,000166
Temperature of liquid at hydrometer °C 0,01 0,014 0,13 0,065 0,011 0,0004 0,15
Cubic thermal expansion coefficient of liquid g/(cm3K) 0,00002 0,00002 0,00005 0,00002
Compressibility of liquid Pa-1 2x10-11 2x10-11 1,5x10⁻¹¹ 3x10-11
Surface tension of liquid mN/m 0,23 1 1,039 0,050 0,50 0,087 0,005
Gravitation acceleration m/s2 5x10⁻⁶ 1x10⁻⁴ 2,8x10⁻⁷ 1x10⁻³ 6,8x10⁻⁶ 2,5x10⁻⁵ 4,8x10⁻⁷
Gradient of gravitational acceleration m-1 -3x10⁻⁸ 3,1x10⁻⁷ 3,1x10⁻⁸
Height difference of weights and hydrometer m 0,005 0,01 0,00029
Readings error mm 0,00866025 0,00004 0,1
Reproducibility g/cm3 0,000014
INACAL – 2017/06 29/56

Final report - Hydrometers Comparison between SIM Laboratories
SIM.M.D-S4
Table A1.3 Uncertainty contributions reported by the NMIs for the hydrometer 3
INFLUENCE QUANTITY Unit CENAM IBMETRO INEN INDECOPI INM LACOMET
Weighing value of hydrometer in air g 0,00010 0,0010 0,00011 0,00060 0,00029 0,00017
Weighing value of hydrometer in buoyant liquid (1st point) g 0,00016 0,00018 0,00099 0,00038 0,00037 0,00028
Weighing value of hydrometer in buoyant liquid (2nd point) g 0,00006 0,00020 0,00058 0,00038 0,00031 0,00043
Weighing value of hydrometer in buoyant liquid (3rd point) g 0,00013 0,00007 0,00029 0,00038 0,00030 0,00051
Additional weights g
Cubic thermal expansion coefficient of glass 1/K 1x10⁻⁶ 2x10⁻⁶ 1,15x10⁻⁶ 1,15x10⁻⁶ 1,15x10⁻⁶ 1,15x10⁻⁶
Diameter of stem of hydrometer mm 0,14000 0,005 0,01318 0,01247 0,012 0,04082
Density air g/cm3 0,00000077 0,00002290 0,00000051 0,00000331 0,00000036 0,00000007
Density buoyant liquid (1st point) g/cm3 0,000007 0,000016 0,000044 0,000022 0,000003 0,000164
Density buoyant liquid (2nd point) g/cm3 0,000007 0,000016 0,000044 0,000022 0,000003 0,000164
Density buoyant liquid (3rd point) g/cm3 0,000007 0,000016 0,000044 0,000022 0,000003 0,000164
Temperature of liquid at hydrometer °C 0,01 0,014 0,21 0,092 0,011 0,15
Cubic thermal expansion coefficient of liquid g/(cm3K) 0,00002 0,00002 0,00005 0,00002
Compressibility of liquid Pa-1 2x10-11 2x10-11 1,5x10⁻¹¹ 3x10-11
Surface tension of liquid mN/m 0,23 1 1 0,050 0,50 0,005
Gravitation acceleration m/s2 5x10⁻⁶ 1x10⁻⁴ 2,8x10⁻⁷ 1x10⁻³ 6,8x10⁻⁶ 2,5x10⁻⁵
Gradient of gravitational acceleration m-1 -3x10⁻⁸ 3,1x10⁻⁷ 3,1x10⁻⁸
Height difference of weights and hydrometer m 0,005 0,001 0,00029
Readings error mm 0,00577350 0,00004 0,1
Reproducibility g/cm3 0,00001
INACAL – 2017/06 30/56

Final report - Hydrometers Comparison between SIM Laboratories
SIM.M.D-S4
Table A1.4
Uncertainty contributions reported by the NMIs for the hydrometer 4
INFLUENCE QUANTITY Unit CENAM IBMETRO INEN INDECOPI INM INTN LACOMET
Weighing value of hydrometer in air g 0,00000 0,00094 0,00011 0,00055 0,00029 0,00110 0,00093
Weighing value of hydrometer in buoyant liquid (1st point) g 0,00000 0,00012 0,00080 0,00054 0,00029 0,00131 0,00231
Weighing value of hydrometer in buoyant liquid (2nd point) g 0,00000 0,00014 0,00123 0,00054 0,00029 0,00047 0,00123
Weighing value of hydrometer in buoyant liquid (3rd point) g 0,00000 0,00008 0,00145 0,00054 0,00030 0,00094 0,00023
Additional weights g
Cubic thermal expansion coefficient of glass 1/K 1x10⁻⁶ 2x10⁻⁶ 1,15x10⁻⁶ 1,15x10⁻⁶ 1,15x10⁻⁶ 1,15x10⁻⁶ 1,15x10⁻⁶
Diameter of stem of hydrometer mm 0,14000 0,005 0,01996 0,01247 0,008 0,02948 0,01041
Density air g/cm3 0,00000077 0,00000055 0,00000027 0,00000331 0,00000036 0,00000126 0,00000007
Density buoyant liquid (1st point) g/cm3 0,000007 0,000013 0,000071 0,000022 0,000003 0,0000042 0,000166
Density buoyant liquid (2nd point) g/cm3 0,000007 0,000013 0,000071 0,000022 0,000003 0,0000085 0,000165
Density buoyant liquid (3rd point) g/cm3 0,000007 0,000013 0,000071 0,000022 0,000003 0,0000303 0,000165
Temperature of liquid at hydrometer °C 0,01 0,014 0,32 0,092 0,011 0,0057 0,15
Cubic thermal expansion coefficient of liquid g/(cm3K) 0,00002 0,00002 0,00005 0,00002
Compressibility of liquid Pa-1 2x10-11 2x10-11 1,5x10⁻¹¹ 3x10-11
Surface tension of liquid mN/m 0,23 1 1 0,050 0,50 0,087 0,005
Gravitation acceleration m/s2 5x10⁻⁶ 1x10⁻⁴ 2,8x10⁻⁷ 2x10⁻³ 6,8x10⁻⁶ 2,5x10⁻⁵ 4,8x10⁻⁷
Gradient of gravitational acceleration m-1 -3x10⁻⁸ 3,1x10⁻⁷ 3,1x10⁻⁸
Height difference of weights and hydrometer m 0,005 0,001 0,00029
Readings error mm 0,01154701 0,00004 0,1
Reproducibility g/cm3 0,000018
INACAL – 2017/06 31/56

Final report - Hydrometers Comparison between SIM Laboratories
SIM.M.D-S4
A.2 Percentage uncertainty values reported by the NMIs for the hydrometers
Table A2.1
Uncertainty contributions reported by the NMIs for the hydrometer 1
INFLUENCE QUANTITY UNIT CENAM IBMETRO INEN INDECOPI INM INTN LACOMET
Weighing value of hydrometer in air ( % ) 0,002 0,03 0,007 0,3 0,5 2,7 0,0004
Weighing value of hydrometer in buoyant liquid (1st point) ( % ) 1,1 0,08 0,2 0,9 14,6 58,1 0,02
Weighing value of hydrometer in buoyant liquid (2nd point) ( % )
Weighing value of hydrometer in buoyant liquid (3rd point) ( % )
Additional weights ( % ) 0,05
Cubic thermal expansion coefficient of glass ( % ) 0,00000002 0,00002 0,02 0,05 3,1 0,004
Diameter of stem of hydrometer ( % ) 2,3 0,00005 0,02 0,2 0,04 15,9 0,00004
Density air ( % ) 0,02 0,001 0,001 0,5 2,3 0,009 0,000001
Density buoyant liquid (1st point) ( % ) 21,5 45,3 97,3 55,8 34,5 16,1 99,95
Density buoyant liquid (2nd point) ( % )
Density buoyant liquid (3rd point) ( % )
Temperature of liquid at hydrometer ( % ) 19,4 0,3 0,000001 0,6 0,01 0,03
Cubic thermal expansion coefficient of liquid ( % ) 0,00000002 3,9
Compressibility of liquid ( % ) 0,000000005 0,00000000005
Surface tension of liquid ( % ) 3,3 6,6 2,4 0,04 48,1 4,2
Gravitation acceleration ( % ) 0,000000001 0,01 0,000000000 0,0004 0,0000005 0,00000000
Gradient of gravitational acceleration ( % ) 0,000000000 0,01
Height difference of weights and hydrometer ( % ) 0,00000001 0,0002
Readings error ( % ) 0,000000001 43,8 41,5
Reproducibility ( % ) 52,3
�𝑢𝑢𝑖𝑖2(𝑥𝑥𝑖𝑖)𝑢𝑢𝑐𝑐2
100,00 100,00 100,00 100,00 100,00 100,00 100,00
INACAL – 2017/06 32/56
Final report - Hydrometers Comparison between SIM Laboratories
SIM.M.D-S4
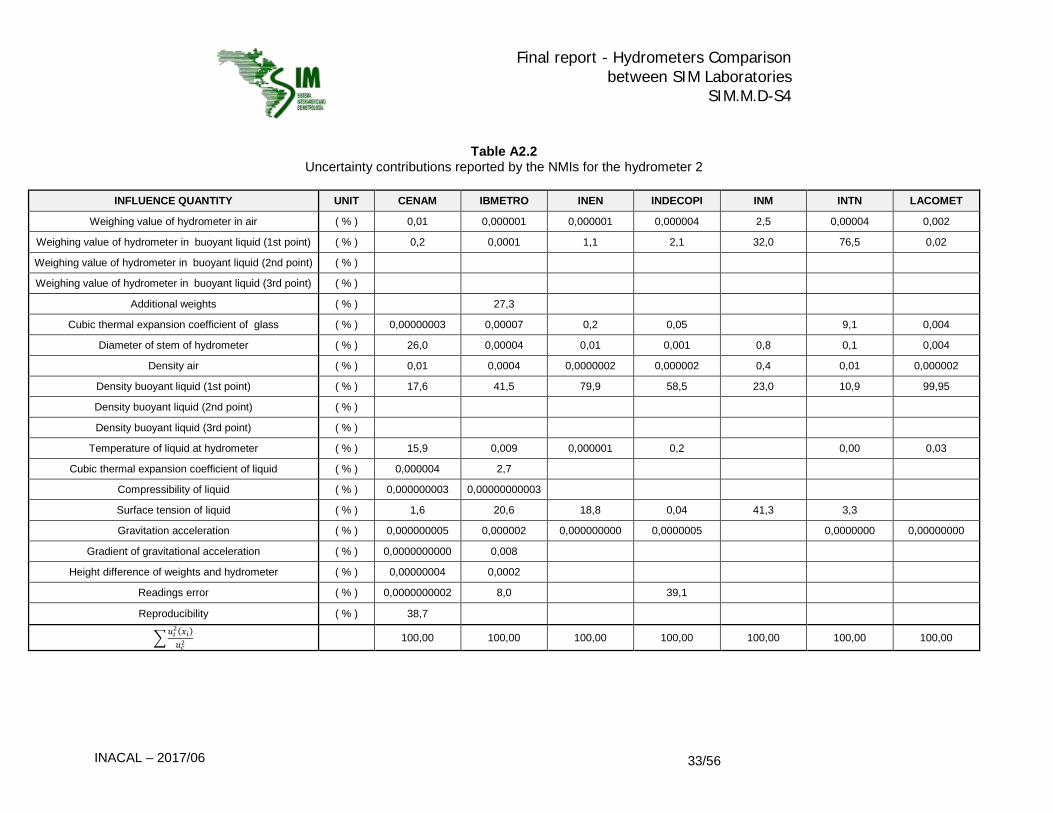
Table A2.2
Uncertainty contributions reported by the NMIs for the hydrometer 2
INFLUENCE QUANTITY UNIT CENAM IBMETRO INEN INDECOPI INM INTN LACOMET
Weighing value of hydrometer in air ( % ) 0,01 0,000001 0,000001 0,000004 2,5 0,00004 0,002
Weighing value of hydrometer in buoyant liquid (1st point) ( % ) 0,2 0,0001 1,1 2,1 32,0 76,5 0,02
Weighing value of hydrometer in buoyant liquid (2nd point) ( % )
Weighing value of hydrometer in buoyant liquid (3rd point) ( % )
Additional weights ( % ) 27,3
Cubic thermal expansion coefficient of glass ( % ) 0,00000003 0,00007 0,2 0,05 9,1 0,004
Diameter of stem of hydrometer ( % ) 26,0 0,00004 0,01 0,001 0,8 0,1 0,004
Density air ( % ) 0,01 0,0004 0,0000002 0,000002 0,4 0,01 0,000002
Density buoyant liquid (1st point) ( % ) 17,6 41,5 79,9 58,5 23,0 10,9 99,95
Density buoyant liquid (2nd point) ( % )
Density buoyant liquid (3rd point) ( % )
Temperature of liquid at hydrometer ( % ) 15,9 0,009 0,000001 0,2 0,00 0,03
Cubic thermal expansion coefficient of liquid ( % ) 0,000004 2,7
Compressibility of liquid ( % ) 0,000000003 0,00000000003
Surface tension of liquid ( % ) 1,6 20,6 18,8 0,04 41,3 3,3
Gravitation acceleration ( % ) 0,000000005 0,000002 0,000000000 0,0000005 0,0000000 0,00000000
Gradient of gravitational acceleration ( % ) 0,0000000000 0,008
Height difference of weights and hydrometer ( % ) 0,00000004 0,0002
Readings error ( % ) 0,0000000002 8,0 39,1
Reproducibility ( % ) 38,7
�𝑢𝑢𝑖𝑖2(𝑥𝑥𝑖𝑖)𝑢𝑢𝑐𝑐2
100,00 100,00 100,00 100,00 100,00 100,00 100,00
INACAL – 2017/06 33/56

Final report - Hydrometers Comparison between SIM Laboratories
SIM.M.D-S4
Table A2.3 Uncertainty contributions reported by the NMIs for the hydrometer 3
INFLUENCE QUANTITY UNIT CENAM IBMETRO INEN INDECOPI INM LACOMET
Weighing value of hydrometer in air ( % ) 0,04 0,6 0,002 0,2 3,7 0,001
Weighing value of hydrometer in buoyant liquid (1st point) ( % ) 0,5 0,2 0,5 0,2 13,5 0,03
Weighing value of hydrometer in buoyant liquid (2nd point) ( % )
Weighing value of hydrometer in buoyant liquid (3rd point) ( % )
Additional weights ( % )
Cubic thermal expansion coefficient of glass ( % ) 0,00000001 0,0005 0,005 0,15 0,000
Diameter of stem of hydrometer ( % ) 0,1 0,0008 0,03 0,11 0,0001 0,0002
Density air ( % ) 0,1 0,003 0,001 0,2 1,7 0,000006
Density buoyant liquid (1st point) ( % ) 40,5 51,8 96,7 94,5 54,6 99,95
Density buoyant liquid (2nd point) ( % )
Density buoyant liquid (3rd point) ( % )
Temperature of liquid at hydrometer ( % ) 36,6 0,001 0,000001 0,9 0,03
Cubic thermal expansion coefficient of liquid ( % ) 0,00000004 36,9
Compressibility of liquid ( % ) 0,000000009 0,00000000004
Surface tension of liquid ( % ) 2,1 10,6 2,8 0,03 26,6
Gravitation acceleration ( % ) 0,0000000000 0,00000001 0,000000000 0,0001 0,00000000
Gradient of gravitational acceleration ( % ) 0,0000000001 0,009
Height difference of weights and hydrometer ( % ) 0,000000000 0,000002
Readings error ( % ) 0,0000000002 0,000002 3,7
Reproducibility ( % ) 20,1
�𝑢𝑢𝑖𝑖2(𝑥𝑥𝑖𝑖)𝑢𝑢𝑐𝑐2
100,00 100,00 100,00 100,00 100,00 100,00
INACAL – 2017/06 34/56

Final report - Hydrometers Comparison between SIM Laboratories
SIM.M.D-S4
Table A2.4 Uncertainty contributions reported by the NMIs for the hydrometer 4
INFLUENCE QUANTITY UNIT CENAM IBMETRO INEN INDECOPI INM INTN LACOMET
Weighing value of hydrometer in air ( % ) 0,0000001 3,5 0,003 0,6 7,4 4,2 0,06
Weighing value of hydrometer in buoyant liquid (1st point) ( % ) 0,000001 0,2 1,2 2,4 18,0 9,9 0,01
Weighing value of hydrometer in buoyant liquid (2nd point) ( % )
Weighing value of hydrometer in buoyant liquid (3rd point) ( % )
Additional weights ( % )
Cubic thermal expansion coefficient of glass ( % ) 0,00000001 0,0003 0,02 0,09 5,4 0,006
Diameter of stem of hydrometer ( % ) 0,3 0,001 0,04 0,0000002 0,001 1,5 0,00003
Density air ( % ) 0,1 0,04 0,0003 0,5 1,1 0,1 0,000008
Density buoyant liquid (1st point) ( % ) 34,5 56,6 97,2 88,0 43,4 78,2 99,9
Density buoyant liquid (2nd point) ( % )
Density buoyant liquid (3rd point) ( % )
Temperature of liquid at hydrometer ( % ) 31,2 0,04 0,000001 0,8 0,01 0,03
Cubic thermal expansion coefficient of liquid ( % ) 0,000004 3,1
Compressibility of liquid ( % ) 0,0000004 0,00000000004
Surface tension of liquid ( % ) 2,8 27,3 1,5 0,03 30,1 0,8
Gravitation acceleration ( % ) 0,000000000 0,00000002 0,000000000 0,0002 0,0000002 0,00000000
Gradient of gravitational acceleration ( % ) 0,000000019 0,009
Height difference of weights and hydrometer ( % ) 0,00000002 0,000002
Readings error ( % ) 0,0000000001 9,2 7,5
Reproducibility ( % ) 31,1
�𝑢𝑢𝑖𝑖2(𝑥𝑥𝑖𝑖)𝑢𝑢𝑐𝑐2
100,00 100,00 100,00 100,00 100,00 100,00 100,00
INACAL – 2017/06 35/56

Final report - Hydrometers Comparison between SIM Laboratories
SIM.M.D-S4
ANNEX B
B.1 REFERENCE VALUES OF THE PDF’s FOR THE HYDROMETER 1 B.1.1 Reference value for 601 kg/m³
Graph B.1.1 Pdf of Reference value for 601 kg/m³
Mean: -0,0598 kg/m³ Standard deviation: 0,0142 kg/m³ 95 % coverage interval: [-0,0892 kg/m³ , -0,0329 kg/m³]
B.1.2 Reference value for 605 kg/m³
Graph B.1.2 Pdf of Reference value for 605 kg/m³
Mean: -0,0293 kg/m³ Standard deviation: 0,0175 kg/m³ 95 % coverage interval: [-0,0601 kg/m³, 0,0091 kg/m³]
INACAL – 2017/06 36/56

Final report - Hydrometers Comparison between SIM Laboratories
SIM.M.D-S4
B.1.3 Reference value for 609 kg/m³
Graph B.1.3 Pdf of Reference value for 609 kg/m³
Mean: -0,0517 kg/m³ Standard deviation: 0,0214 kg/m³ 95 % coverage interval: [-0,0945 kg/m³, -0,0060 kg/m³]
B.2 REFERENCE VALUES OF THE PDF’s FOR THE HYDROMETER 2 B.2.1 Reference value for 985,92 kg/m³
Graph B.2.1 Pdf of Reference value for 985,92 kg/m3
Mean: 0,0026 kg/m³ Standard deviation: 0,0167 kg/m³ 95 % coverage interval: [-0,0321 kg/m³, 0,0323 kg/m³]
INACAL – 2017/06 37/56

Final report - Hydrometers Comparison between SIM Laboratories
SIM.M.D-S4
B.2.2 Reference value for 991,06 kg/m³
Graph B.2.2 Pdf of Reference value for 991,06 kg/m³
Mean: -0,0269 kg/m³ Standard deviation: 0,0195 kg/m³ 95 % coverage interval: [-0,0631 kg/m³, 0,0129 kg/m³]
B.2.3 Reference value for 996,70 kg/m³
Graph B.2.3 Pdf of Reference value for 996,70 kg/m³
Mean: -0,0234 kg/m³ Standard deviation: 0,0227 kg/m³ 95 % coverage interval: [-0,0692 kg/m³, 0,0201 kg/m³]
INACAL – 2017/06 38/56

Final report - Hydrometers Comparison between SIM Laboratories
SIM.M.D-S4
B.3 REFERENCE VALUES OF THE PDF’s FOR THE HYDROMETER 3 B.3.1 Reference value for 1491 kg/m³
Graph B.3.1
Pdf of Reference value for 1491 kg/m3
Mean: -0,0282 kg/m³ Standard deviation: 0,0173 kg/m³ 95 % coverage interval: [-0,0685 kg/m³, 0,0016 kg/m³]
B.3.2 Reference value for 1495 kg/m³
Graph B.3.2 Pdf of Reference value for 1495 kg/m3
Mean: -0,0222 kg/m³ Standard deviation: 0,0169 kg/m³ 95 % coverage interval: [-0,0613 kg/m³, 0,0083 kg/m³]
INACAL – 2017/06 39/56

Final report - Hydrometers Comparison between SIM Laboratories
SIM.M.D-S4
B.3.3 Reference value for 1499 kg/m³
Graph B.3.3 Pdf of Reference value for 1499 kg/m³
Mean: -0,0106 kg/m³ Standard deviation: 0,0174 kg/m³ 95 % coverage interval: [-0,0432 kg/m³, 0,0255 kg/m³]
B.4 REFERENCE VALUES OF THE PDF’s FOR THE HYDROMETER 4 B.4.1 Reference value for 1981 kg/m³
Graph B.4.1
Pdf of Reference value for 1981 kg/m3
Mean: -0,0944 kg/m³ Standard deviation: 0,0647 kg/m³ 95 % coverage interval: [-0,2338 kg/m³, -0,0055 kg/m³]
INACAL – 2017/06 40/56

Final report - Hydrometers Comparison between SIM Laboratories
SIM.M.D-S4
B.4.2 Reference value for 1990 kg/m³
Graph B.4.2 Pdf of Reference value for 1990 kg/m³
Mean: -0,0634 kg/m³ Standard deviation: 0,0465 kg/m³ 95 % coverage interval: [-0,1757 kg/m³, 0,0101 kg/m³]
B.4.3 Reference value for 1993 kg/m³
Graph B.4.3 Pdf of Reference value for 1999 kg/m³
Mean: -0,0541 kg/m³ Standard deviation: 0,0292 kg/m³ 95 % coverage interval: [-0,1270 kg/m³, -0,0077 kg/m³]
INACAL – 2017/06 41/56

Final report - Hydrometers Comparison between SIM Laboratories
SIM.M.D-S4
ANNEX C
C.1 DEGREE OF EQUIVALENCE BETWEEN PARTICIPANTS AND CENAM FOR THE HYDROMETER 1
Table C.1.1
Hydrometer 1 Degree of equivalence between participants and CENAM for 601 kg/m³
NMI CENAMid , ( )CENAMidU , ( )inE
IBMETRO 0,011 0,056 0,20 INEN -0,744 0,094 7,89 INDECOPI -0,010 0,046 0,22 INM 0,081 0,031 2,64 INTN -0,044 0,085 0,52 LACOMET 0,056 0,291 0,19
Table C.1.2 Hydrometer 1
Degree of equivalence between participants and CENAM for 605 kg/m³ NMI CENAMid , ( )CENAMidU , ( )inE
IBMETRO 0,023 0,056 0,41 INEN -0,747 0,094 7,93 INDECOPI 0,016 0,046 0,36 INM 0,079 0,031 2,57 INTN 0,123 0,085 1,45 LACOMET 0,053 0,291 0,18
Table C.1.3 Hydrometer 1
Degree of equivalence between participants and CENAM for 609 kg/m³ NMI CENAMid , ( )CENAMidU , ( )inE
IBMETRO 0,042 0,056 0,75 INEN -0,743 0,094 7,88 INDECOPI -0,047 0,046 1,02 INM 0,089 0,031 2,90 INTN 0,007 0,085 0,08 LACOMET 0,057 0,291 0,20
INACAL – 2017/06 42/56

Final report - Hydrometers Comparison between SIM Laboratories
SIM.M.D-S4
C.2 DEGREE OF EQUIVALENCE BETWEEN PARTICIPANTS AND CENAM FOR THE
HYDROMETER 2
Table C.2.1 Hydrometer 2
Degree of equivalence between participants and CENAM for 985,92 kg/m³ NMI CENAMid , ( )CENAMidU , ( )inE
IBMETRO -0,011 0,069 0,16 INEN -0,591 0,093 6,37 INDECOPI -0,017 0,085 0,21 INM 0,032 0,053 0,60 INTN 0,067 0,056 1,20 LACOMET 0,469 0,462 1,01
Table C.2.2 Hydrometer 2
Degree of equivalence between participants and CENAM for 991,06 kg/m³ NMI CENAMid , ( )CENAMidU , ( )inE
IBMETRO 0,013 0,069 0,19 INEN -0,662 0,093 7,10 INDECOPI 0,045 0,085 0,53 INM 0,120 0,054 2,22 INTN -0,020 0,057 0,36 LACOMET 0,168 0,462 0,36
Table C.2.3 Hydrometer 2
Degree of equivalence between participants and CENAM for 996,70 kg/m³ NMI CENAMid , ( )CENAMidU , ( )inE
IBMETRO 0,034 0,069 0,49 INEN -0,667 0,093 7,15 INDECOPI 0,017 0,085 0,20 INM 0,101 0,054 1,87 INTN -0,043 0,057 0,75 LACOMET 0,143 0,462 0,31
INACAL – 2017/06 43/56

Final report - Hydrometers Comparison between SIM Laboratories
SIM.M.D-S4
C.3 DEGREE OF EQUIVALENCE BETWEEN PARTICIPANTS AND CENAM FOR THE
HYDROMETER 3
Table C.3.1 Hydrometer 3
Degree of equivalence between participants and CENAM for 1491 kg/m³ NMI CENAMid , ( )CENAMidU , ( )inE
IBMETRO 0,115 0,067 1,72 INEN -0,378 0,147 2,57 INDECOPI -0,028 0,082 0,34 INM 0,005 0,049 0,10 INTN ---- ---- ---- LACOMET 0,183 0,701 0,26
Table C.3.2 Hydrometer 3
Degree of equivalence between participants and CENAM for 1495 kg/m³ NMI CENAMid , ( )CENAMidU , ( )inE
IBMETRO 0,124 0,067 1,86 INEN -0,376 0,147 2,56 INDECOPI -0,008 0,082 0,10 INM 0,017 0,049 0,35 INTN ---- ---- ---- LACOMET 0,205 0,701 0,29
Table C.3.3 Hydrometer 3
Degree of equivalence between participants and CENAM for 1499 kg/m³ NMI CENAMid , ( )CENAMidU , ( )inE
IBMETRO 0,107 0,067 1,60 INEN -0,471 0,147 3,20 INDECOPI 0,015 0,082 0,18 INM -0,002 0,049 0,04 INTN ---- ---- ---- LACOMET 0,212 0,701 0,30
INACAL – 2017/06 44/56

Final report - Hydrometers Comparison between SIM Laboratories
SIM.M.D-S4
C.4 DEGREE OF EQUIVALENCE BETWEEN PARTICIPANTS AND CENAM FOR THE
HYDROMETER 4
Table C.4.1 Hydrometer 4
Degree of equivalence between participants and CENAM for 1981 kg/m³ NMI CENAMid , ( )CENAMidU , ( )inE
IBMETRO 0,038 0,086 0,44 INEN -0,652 0,298 2,19 INDECOPI -0,130 0,117 1,11 INM 0,062 0,076 0,82 INTN -0,222 0,099 2,25 LACOMET 0,118 0,903 0,13
Table C.4.2 Hydrometer 4
Degree of equivalence between participants and CENAM for 1990 kg/m³ NMI CENAMid , ( )CENAMidU , ( )inE
IBMETRO 0,065 0,087 0,75 INEN -0,753 0,299 2,52 INDECOPI -0,082 0,118 0,70 INM 0,089 0,077 1,16 INTN -0,222 0,100 2,23 LACOMET 0,327 0,903 0,36
Table C.4.3 Hydrometer 4
Degree of equivalence between participants and CENAM for 1999 kg/m³ NMI CENAMid , ( )CENAMidU , ( )inE
IBMETRO -0,012 0,087 0,14 INEN -0,773 0,299 2,59 INDECOPI -0,108 0,118 0,91 INM 0,034 0,077 0,44 INTN -0,169 0,100 1,69 LACOMET 0,677 0,903 0,75
INACAL – 2017/06 45/56

Final report - Hydrometers Comparison between SIM Laboratories
SIM.M.D-S4
C.5 Link to the CCM key comparison CCM.D-K4
Table C.5.1 Degree of equivalence between IBMETRO and CCM.D-K4
IBMETRO (kg/m3)
4., KDCCMIBMETROD − (kg/m3)
( )4., KDCCMIBMETRODu − (kg/m3)
x1 (2,5%) (kg/m3)
x2 (97,5%) (kg/m3)
nE
601 0,014 0,029 -0,043 0,070 0,2 605 0,026 0,029 -0,031 0,082 0,4 609 0,045 0,029 -0,012 0,101 0,8
985,92 -0,008 0,035 -0,077 0,062 0,1 991,06 0,016 0,035 -0,054 0,086 0,2 996,7 0,037 0,035 -0,033 0,107 0,5 1491 0,118 0,036 0,048 0,188 1,7 1495 0,127 0,036 0,057 0,198 1,8 1499 0,110 0,036 0,040 0,180 1,5 1981 0,042 0,046 -0,050 0,133 0,4 1990 0,069 0,047 -0,024 0,161 0,7 1999 -0,008 0,047 -0,100 0,084 0,1
Table C.5.2 Degree of equivalence between INEN and CCM.D-K4
INEN (kg/m3)
4., KDCCMINEND − (kg/m3)
( )4., KDCCMINENDu − (kg/m3)
x1 (2,5%) (kg/m3)
x2 (97,5%) (kg/m3)
nE
601 -0,741 0,047 -0,834 -0,648 7,8 605 -0,744 0,047 -0,837 -0,651 7,8 609 -0,740 0,047 -0,833 -0,647 7,8
985,92 -0,588 0,047 -0,680 -0,496 6,2 991,06 -0,659 0,047 -0,752 -0,566 7,0 996,7 -0,664 0,047 -0,756 -0,572 7,0 1491 -0,375 0,075 -0,521 -0,229 2,5 1495 -0,373 0,075 -0,519 -0,227 2,5 1499 -0,468 0,075 -0,614 -0,322 3,1 1981 -0,648 0,150 -0,943 -0,354 2,2 1990 -0,749 0,150 -1,044 -0,455 2,5 1999 -0,769 0,151 -1,063 -0,474 2,6
INACAL – 2017/06 46/56

Final report - Hydrometers Comparison between SIM Laboratories
SIM.M.D-S4
Table C.5.3
Degree of equivalence between INDECOPI and CCM.D-K4
INDECOPI (kg/m3)
4., KDCCMINDECOPID − (kg/m3)
( )4., KDCCMINDECOPIDu − (kg/m3)
x1 (2,5%) (kg/m3)
x2 (97,5%) (kg/m3)
nE
601 -0,007 0,024 -0,054 0,039 0,2 605 0,019 0,024 -0,028 0,065 0,4 609 -0,044 0,024 -0,091 0,002 0,9
985,92 -0,014 0,043 -0,099 0,071 0,2 991,06 0,048 0,043 -0,037 0,133 0,6 996,7 0,020 0,044 -0,066 0,106 0,2 1491 -0,025 0,043 -0,109 0,059 0,3 1495 -0,005 0,043 -0,089 0,079 0,1 1499 0,018 0,043 -0,066 0,103 0,2 1981 -0,126 0,061 -0,246 -0,006 1,0 1990 -0,078 0,062 -0,199 0,042 0,6 1999 -0,104 0,062 -0,226 0,017 0,8
Table C.5.4 Degree of equivalence between INM and CCM.D-K4
INM (kg/m3)
4., KDCCMINMD − (kg/m3)
( )4., KDCCMINMDu − (kg/m3)
x1 (2,5%) (kg/m3)
x2 (97,5%) (kg/m3)
nE
601 0,084 0,017 0,051 0,116 2,5 605 0,082 0,017 0,049 0,114 2,4 609 0,092 0,017 0,059 0,124 2,7
985,92 0,035 0,028 -0,019 0,089 0,6 991,06 0,123 0,028 0,068 0,178 2,2 996,7 0,104 0,028 0,049 0,159 1,8 1491 0,008 0,028 -0,046 0,062 0,2 1495 0,020 0,028 -0,034 0,074 0,4 1499 0,001 0,028 -0,053 0,055 0,0 1981 0,066 0,042 -0,016 0,147 0,8 1990 0,093 0,042 0,009 0,175 1,1 1999 0,038 0,042 -0,046 0,121 0,4
INACAL – 2017/06 47/56

Final report - Hydrometers Comparison between SIM Laboratories
SIM.M.D-S4
Table C.5.5
Degree of equivalence between INTN and CCM.D-K4
INTN (kg/m3)
4., KDCCMINTND − (kg/m3)
( )4., KDCCMINTNDu − (kg/m3)
x1 (2,5%) (kg/m3)
x2 (97,5%) (kg/m3)
nE
601 -0,041 0,043 -0,125 0,043 0,5 605 0,126 0,043 0,041 0,210 1,5 609 0,010 0,043 -0,074 0,094 0,1
985,92 0,070 0,029 0,013 0,127 1,2 991,06 -0,017 0,030 -0,098 0,041 0,3 996,7 -0,040 0,030 -0,321 0,018 0,7 1491 ---- ---- ---- ---- ---- 1495 ---- ---- ---- ---- ---- 1499 ---- ---- ---- ---- ---- 1981 -0,218 0,052 -0,322 -0,116 2,1 1990 -0,218 0,053 -0,269 -0,115 2,1 1999 -0,165 0,053 -0,269 -0,062 1,6
Table C.5.6 Degree of equivalence between LACOMET and CCM.D-K4
LACOMET (kg/m3)
4., KDCCMLACOMETD − (kg/m3)
( )4., KDCCMLACOMETDu − (kg/m3)
x1 (2,5%) (kg/m3)
x2 (97,5%) (kg/m3)
nE
601 0,059 0,146 -0,227 0,344 0,2 605 0,056 0,146 -0,229 0,340 0,2 609 0,060 0,146 -0,226 0,345 0,2
985,92 0,472 0,231 0,019 0,924 1,0 991,06 0,171 0,231 -0,282 0,624 0,4 996,7 0,146 0,231 -0,307 0,600 0,3 1491 0,186 0,351 -0,501 0,874 0,3 1495 0,208 0,351 -0,480 0,894 0,3 1499 0,215 0,351 -0,472 0,902 0,3 1981 0,122 0,452 -0,764 1,008 0,1 1990 0,331 0,452 -0,555 1,217 0,4 1999 0,681 0,452 -0,206 1,566 0,8
INACAL – 2017/06 48/56

Final report - Hydrometers Comparison between SIM Laboratories
SIM.M.D-S4
C.6 Graphs of link to the CCM key comparison CCM.D-K4
Graph C.6.1 Link to the CCM key comparison CCM.D-K4
Hydrometer 1
Note: The bars represent the expanded uncertainty of k=2
INACAL – 2017/06 49/56

Final report - Hydrometers Comparison between SIM Laboratories
SIM.M.D-S4
Graph C.6.2 Link to the CCM key comparison CCM.D-K4
Hydrometer 2
Note: The bars represent the expanded uncertainty of k=2
INACAL – 2017/06 50/56

Final report - Hydrometers Comparison between SIM Laboratories
SIM.M.D-S4
Graph C.6.3 Link to the CCM key comparison CCM.D-K4
Hydrometer 3
Note: The bars represent the expanded uncertainty of k=2
INACAL – 2017/06 51/56

Final report - Hydrometers Comparison between SIM Laboratories
SIM.M.D-S4
Graph C.6.4 Link to the CCM key comparison CCM.D-K4
Hydrometer 4
Note: The bars represent the expanded uncertainty of k=2
INACAL – 2017/06 52/56

Final report - Hydrometers Comparison between SIM Laboratories
SIM.M.D-S4
ANNEX D
D.1 DEGREE OF EQUIVALENCE BETWEEN PARTICIPANTS FOR THE HYDROMETER 1
Table D.1 Hydrometer 1
Degree of equivalence between participants for 601 kg/m³
j i
CENAM IBMETRO INEN INDECOPI INM INTN LACOMET jid , ( )jidU ,
jid , ( )jidU ,
jid , ( )jidU ,
jid , ( )jidU ,
jid , ( )jidU ,
jid , ( )jidU ,
jid , ( )jidU ,
CENAM -0,011 0,056 0,744 0,094 0,010 0,046 -0,081 0,031 0,044 0,085 -0,056 0,291 IBMETRO 0,755 0,102 0,021 0,060 -0,070 0,050 0,055 0,093 -0,045 0,294 INEN -0,734 0,097 -0,825 0,091 -0,700 0,120 -0,800 0,304 INDECOPI -0,091 0,038 0,034 0,088 -0,066 0,292 INM 0,125 0,081 0,025 0,290 INTN -0,100 0,301 LACOMET
INACAL – 2017/06 53/56

Final report - Hydrometers Comparison between SIM Laboratories
SIM.M.D-S4
D.2 DEGREE OF EQUIVALENCE BETWEEN PARTICIPANTS FOR THE HYDROMETER 2
Table D.2 Hydrometer 2
Degree of equivalence between participants for 985,92 kg/m³
j i
CENAM IBMETRO INEN INDECOPI INM INTN LACOMET jid , ( )jidU ,
jid , ( )jidU ,
jid , ( )jidU ,
jid , ( )jidU ,
jid , ( )jidU ,
jid , ( )jidU ,
jid , ( )jidU ,
CENAM 0,011 0,069 0,591 0,093 0,017 0,085 -0,032 0,053 -0,067 0,056 -0,469 0,462 IBMETRO 0,58 0,094 0,006 0,087 -0,043 0,056 -0,08 0,059 -0,48 0,463 INEN -0,574 0,107 -0,62 0,084 -0,66 0,085 -1,06 0,467 INDECOPI -0,049 0,075 -0,08 0,077 -0,49 0,465 INM -0,03 0,039 -0,44 0,461 INTN -0,40 0,461 LACOMET
INACAL – 2017/06 54/56

Final report - Hydrometers Comparison between SIM Laboratories
SIM.M.D-S4
D.3 DEGREE OF EQUIVALENCE BETWEEN PARTICIPANTS FOR THE HYDROMETER 3
Table D.3 Hydrometer 3
Degree of equivalence between participants for 1491 kg/m³
j i
CENAM IBMETRO INEN INDECOPI INM INTN LACOMET jid , ( )jidU ,
jid , ( )jidU ,
jid , ( )jidU ,
jid , ( )jidU ,
jid , ( )jidU ,
jid , ( )jidU ,
jid , ( )jidU ,
CENAM -0,115 0,067 0,378 0,147 0,028 0,082 -0,005 0,049 -0,183 0,701 IBMETRO 0,493 0,148 0,143 0,084 0,110 0,053 -0,068 0,702 INEN -0,350 0,156 -0,383 0,141 -0,561 0,714 INDECOPI -0,033 0,071 -0,210 0,703 INM -0,178 0,700 INTN LACOMET
INACAL – 2017/06 55/56

Final report - Hydrometers Comparison between SIM Laboratories
SIM.M.D-S4
D.4 DEGREE OF EQUIVALENCE BETWEEN PARTICIPANTS FOR THE HYDROMETER 4
Table D.4 Hydrometer 4
Degree of equivalence between participants for 1981 kg/m³
j i
CENAM IBMETRO INEN INDECOPI INM INTN LACOMET jid , ( )jidU ,
jid , ( )jidU ,
jid , ( )jidU ,
jid , ( )jidU ,
jid , ( )jidU ,
jid , ( )jidU ,
jid , ( )jidU ,
CENAM -0,038 0,086 0,652 0,298 0,130 0,117 -0,062 0,076 0,222 0,099 -0,118 0,903 IBMETRO 0,690 0,294 0,168 0,106 -0,024 0,058 0,260 0,086 -0,080 0,901 INEN -0,522 0,305 -0,714 0,291 -0,430 0,298 -0,770 0,946 INDECOPI -0,192 0,098 0,093 0,117 -0,248 0,905 INM 0,284 0,076 -0,056 0,900 INTN -0,340 0,903 LACOMET
INACAL – 2017/06 56/56