draft presentation for peer review only. does not .... brp... · msy = 82, 830 mt msy = 16,600 mt...
TRANSCRIPT
The Gulf of Maine stock of Atlantic cod
Draft PresentationFor Peer Review Only.
Does not represent final NOAA Decision/Policy.
4/29/08

Description and history of current approach.
The most recent peer review occurred at SAW 31 in 2001 (Mayo et al. 2002). Since then updated assessments were reviewed at GARMI (2002) and GARMII (2005) Mayo and Col (2006).
The VPA is calibrated using the Adapt method (Parrack1986, Gavaris 1988, Conser and Powers 1990).

= 0.23FMSY
= 82, 830 mtSSBMSY
= 16,600 mtMSYMSY-based Reference Points (NEFSC 2002)
= 0.36F20%
= 0.27Fmax
= 0.15F 0.1
Yield and SSB per Recruit-based Reference Points
Status of Gulf of Maine Cod from the 2005 GARM II
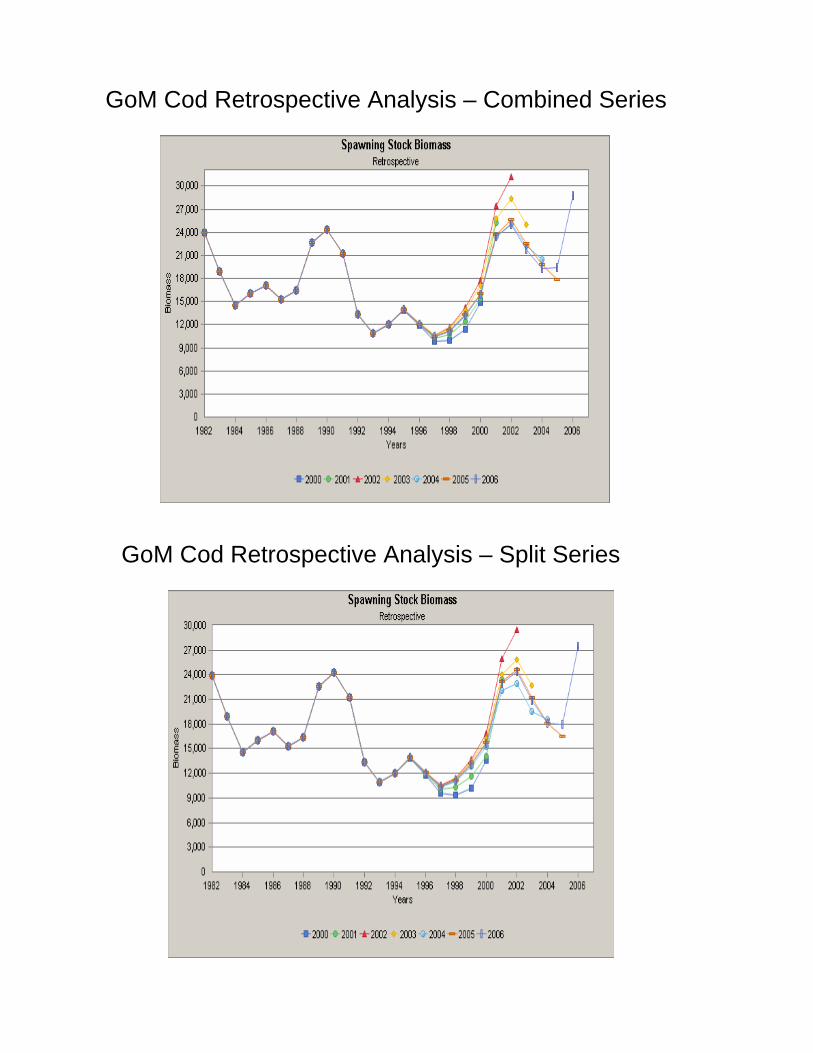
Gulf of Maine cod spawning stock biomass has increased since the late 1990s from 11,100 mt in 1997 to 20,500 mt in 2004, but the stock remains low relative to SSBMSY (82,830 mt).
Fully recruited fishing mortality declined to about 0.35 in 2000 and 2001, but has since increased to 0.58 in 2004, indicating that F continues to remain very high relative to fully recruited F reference points (F0.1 = 0.15; Fmsy = 0.23; Fmax = 0.27).
Thus, the stock remains in an overfished condition and overfishing continues to occur.

Commercial Statistical Areas Used to Define theStocks of Atlantic Cod


Figure 5. Strata sampled by the Massachusetts DMF inshore bottom trawl survey.

Gulf of Maine CodTotal Commercial Landings
Year
1890 1900 1910 1920 1930 1940 1950 1960 1970 1980 1990 2000 2010
Met
ric T
ons
(live
wei
ght)
0
2000
4000
6000
8000
10000
12000
14000
16000
18000
20000
Figure F1. Total commercial landings of Gulf of Maine cod (NAFO Div. 5Y), 1893-2006.

Gulf of Maine CodNEFSC Spring and Autumn Biomass Indices
Year
1960 1965 1970 1975 1980 1985 1990 1995 2000 2005
Stra
tifie
d M
ean
Wei
ght (
kg) p
er T
ow
0
5
10
15
20
25
30
Spring SurveysAutumn Surveys
Figure F4. Biomass indices (stratified mean weight per tow) for Gulf of Maine cod from NEFSC autumn bottom trawl surveys.

Gulf of Maine Cod Autumn Survey Indices by Age
Age (years)
0 1 2 3 4 5 6 7 8 9 10 11 12 13 14
Year
1970
1975
1980
1985
1990
1995
2000
2005
+

NEFSC Autumn Survey: Yearclass Strength at Age 1
Yearclass
1960 1965 1970 1975 1980 1985 1990 1995 2000 2005
Age
1 M
ean
Num
ber p
er T
ow
0
1
2
3
4
5
6
Age 1
NEFSC Autumn Survey: Yearclass Strength at Age 2
Yearclass
1960 1965 1970 1975 1980 1985 1990 1995 2000 2005
Age
2 M
ean
Num
ber p
er T
ow
0
1
2
3
4
5
6
Age 2
Figure F6. Recruitment indices at age 1 and 2 for Gulf of Maine cod from NEFSC autumn bottom trawl surveys.
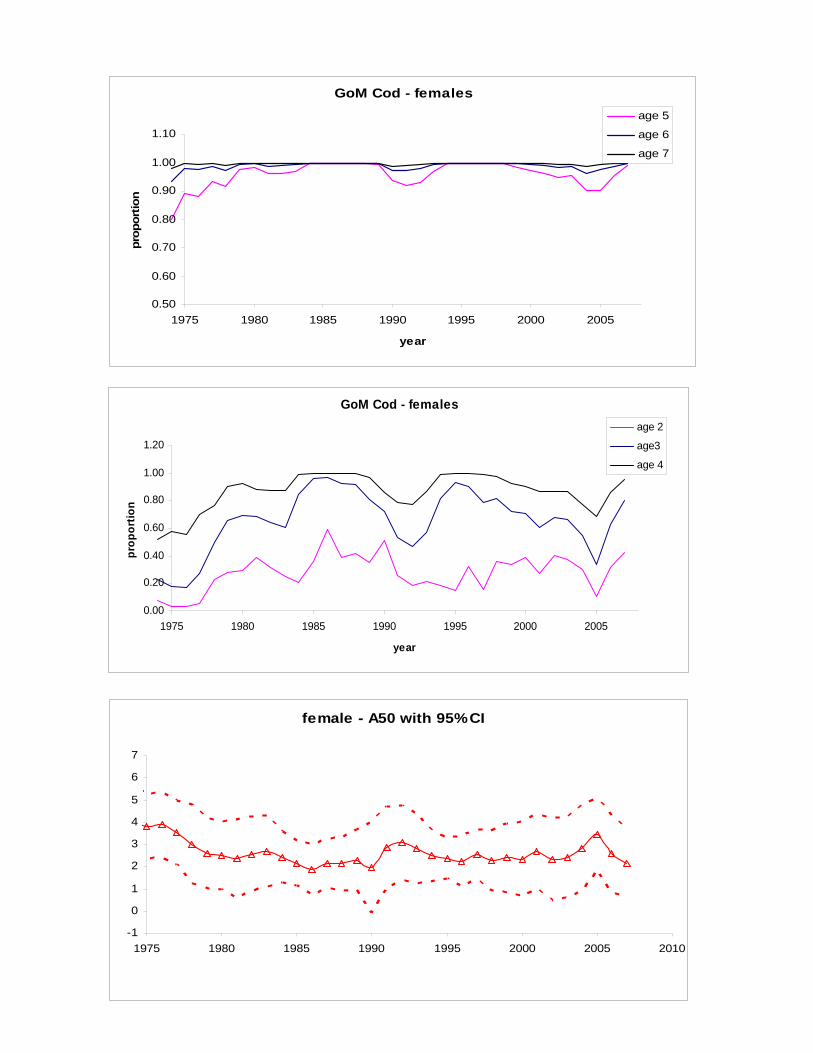
GoM Cod - females
0.00
0.20
0.40
0.60
0.80
1.00
1.20
1975 1980 1985 1990 1995 2000 2005
year
prop
ortio
n
age 2
age3
age 4
GoM Cod - females
0.50
0.60
0.70
0.80
0.90
1.00
1.10
1975 1980 1985 1990 1995 2000 2005
year
prop
ortio
n
age 5
age 6
age 7
female - A50 with 95% CI
-1
0
1
2
3
4
5
6
7
1975 1980 1985 1990 1995 2000 2005 2010

Assessment Results

Trends in Average Fully Recruited F (Ages 4-5) and SSB

Residual Pattern from NEFSC Surveys
SpringSurveys
AutumnSurveys

Residual Patterns from MADMF Surveys
Spring andAutumnSurveys

Retrospective Analysis of Fully Recruited F (Ages 4-5)

Retrospective Analysis of Spawning Stock Biomass

A Digression: Split Survey Series
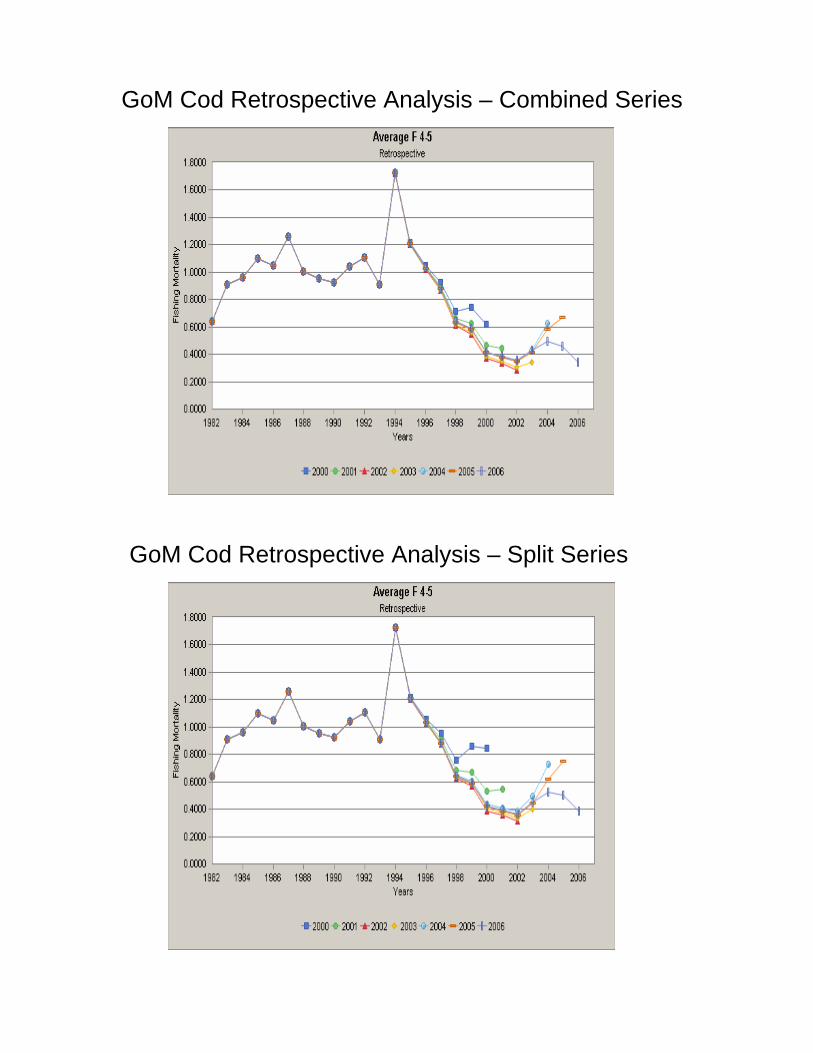
GoM Cod Retrospective Analysis – Combined Series
GoM Cod Retrospective Analysis – Split Series

GoM Cod Retrospective Analysis – Combined Series
GoM Cod Retrospective Analysis – Split Series
GoM Cod Retrospective Analysis – Combined Series
GoM Cod Retrospective Analysis – Split Series

GoM Cod Retrospective Analysis – Combined Series
GoM Cod Retrospective Analysis – Split Series

Back to the Main Feature

Gulf of Maine Cod Average F 4-5
0.00
0.20
0.40
0.60
0.80
1.00
1.20
1.40
1.60
1.80
2.00
1982
1984
1986
1988
1990
1992
1994
1996
1998
2000
2002
2004
2006
single logistic
double logistic
VPA
Comparison between ASAP and VPA ResultsAverage F on Ages 4-5

ASAP Retrospective Pattern – Avg F (Ages 4-5) Single Logistic
ASAP Retrospective Pattern – Avg F (Ages 4-5) Double Logistic

Reference Point Calculations
2 Scenarios
1. Parametric Approach
Fit a stock Recruitment Relationship using estimatesof SSB and Recruits from VPA
Incorporate recent (2002-2006) PR, average weightsand maturity schedule
Use resulting estimates of Fmsy, alpha, beta and sigmain a long-term projection of SSB and Catch
2. Non-parametric Approach
Perform an SSB per Recruit analysis
Incorporate recent (2002-2006) PR, average weightsand maturity schedule
Use resulting the estimate of Fmsy proxy (F40% MSP) and the cumulative distribution function of age 1 recruits from the 1981 to 2004 year classes in a long-term projection of SSB and Catch

1. Parametric Results

From the fit of the Beverton-Holt Stock Recruit Function
Fmsy = 0.28Bmsy = 60,304 mtMSY = 15,691 mtAlpha = 10,982.3Beta = 7,879.1Sigma = 0.626Steepness = 0.867

SSBmsy = 78,413 mt
MSY = 18,886 mt
AGEPRO Projection – Parametric Approach Fmsy = 0.28

2. Non-parametric Results
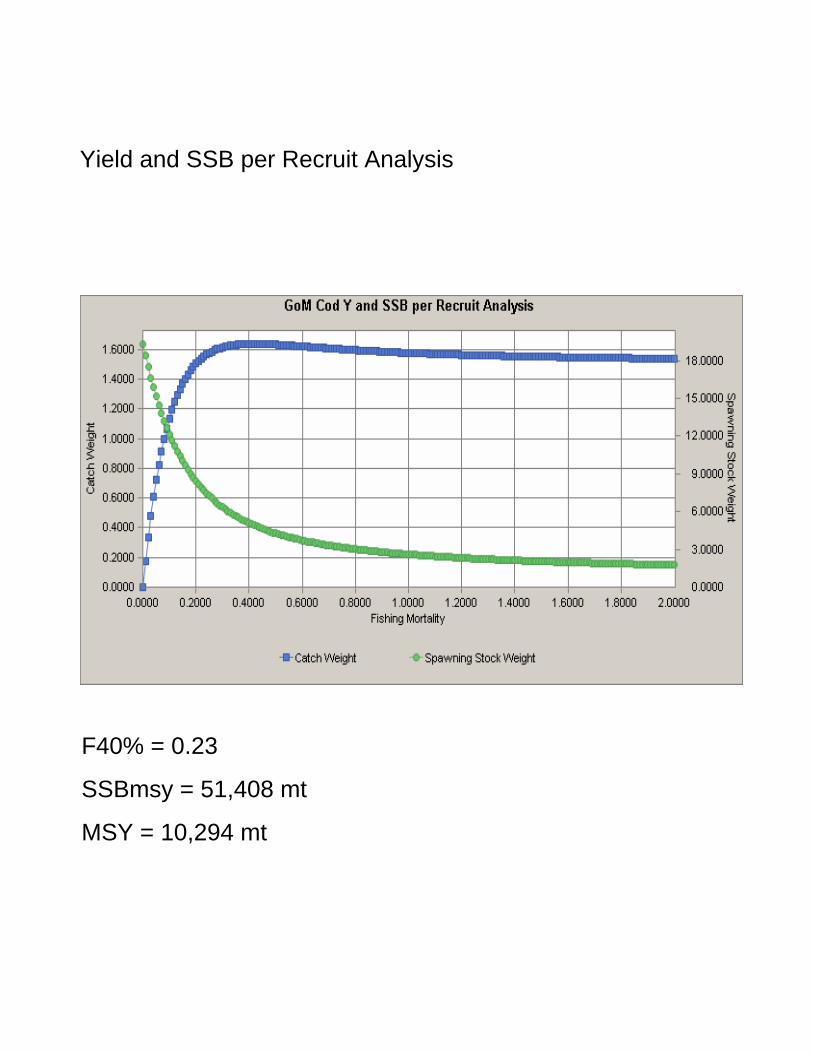
F40% = 0.23
SSBmsy = 51,408 mt
MSY = 10,294 mt
Yield and SSB per Recruit Analysis
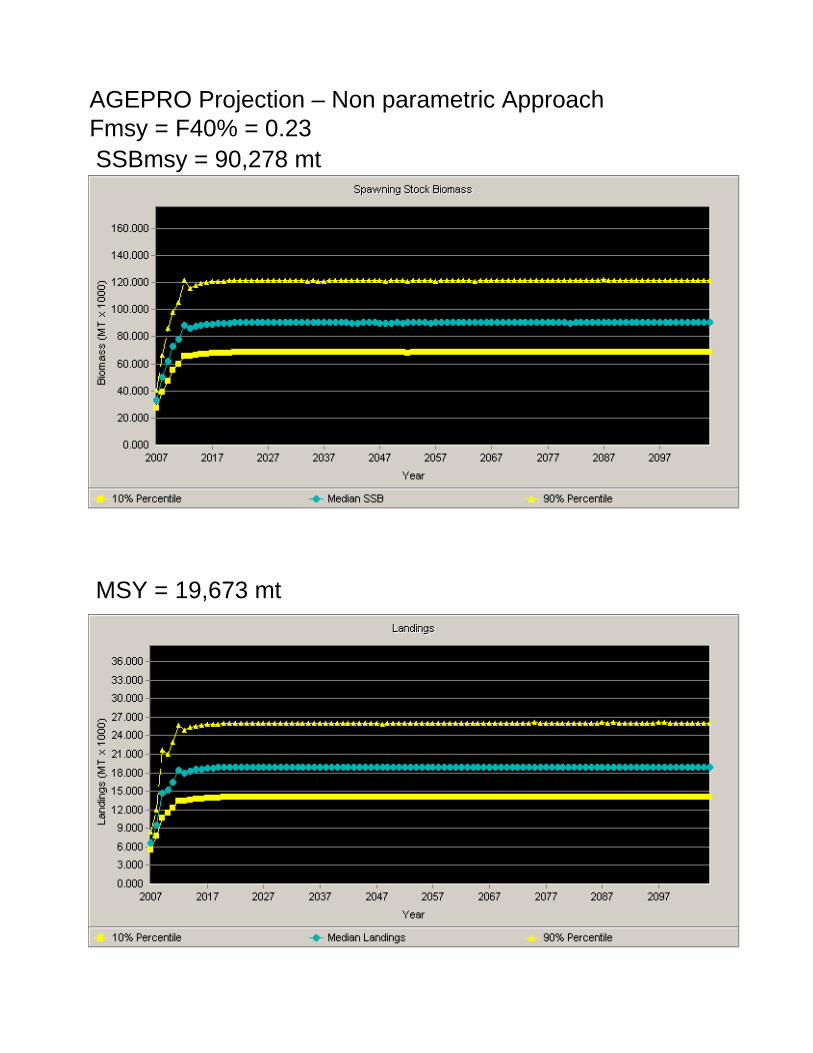
SSBmsy = 90,278 mt
MSY = 19,673 mt
AGEPRO Projection – Non parametric ApproachFmsy = F40% = 0.23

SSBmsy = 90,278 mt
MSY = 19,673 mt
AGEPRO Projection – Non parametric ApproachFmsy = F40% = 0.23

SSBmsy = 71,150 mt
MSY = 14,936 mt
AGEPRO Projection – Non parametric ApproachFmsy = F40% = 0.23

Summary
MSY-based Reference Points (NEFSC 2002)
MSY = 16,600 mtSSBMSY = 82, 830 mtFMSY = 0.23
Revised Reference Points (This meeting)Projections
BH Y&SSB/R Non Par ParMSY 15,691 10,294 14,936 19,673SSBmsy 60,304 51,408 71,150 78,413Fmsy 0.28 0.23