draft parking study 072814 - park...
TRANSCRIPT
DOWNTOWN PARKING NEEDS ASSESSMENT UPDATE
CITY OF OMAHA OMAHA, NEBRASKA Prepared for: City of Omaha Parking Division October 15, 2014
FINAL REPORT
CITY OF OMAHA DOWNTOWN PARKING NEEDS ASSESSMENT UPDATE OCTOBER 15, 2014
TABLE OF CONTENTS
EXECUTIVE SUMMARY ................................................................................................................................................. 1 Study Purpose ........................................................................................................................................................ 1 Conclusions ........................................................................................................................................................... 1 Current Conditions .......................................................................................................................................... 1 Future Conditions ............................................................................................................................................. 2 INTRODUCTION ............................................................................................................................................................ 3 Project Scope ....................................................................................................................................................... 3 Description of Study Area ................................................................................................................................... 4 EXISTING CONDITIONS ................................................................................................................................................ 5 Parking Inventory ................................................................................................................................................... 6 Parking Occupancy ............................................................................................................................................. 7 Effective Supply ................................................................................................................................................... 11 Current Parking Adequacy ............................................................................................................................... 12 Old Market On-Street Parking ........................................................................................................................... 13 Summary of Current Parking Conditions ......................................................................................................... 14 FUTURE CONDITIONS ................................................................................................................................................. 15 2030 Plan .............................................................................................................................................................. 15 Future Parking Demand Calculations ............................................................................................................. 16 Projected Future Parking Adequacy ............................................................................................................... 18 New Office Tower ............................................................................................................................................... 20 Exhibit 1: Downtown Study Area ...................................................................................................................................................... 4 Exhibit 2: Historical Unemployment Rates ...................................................................................................................................... 5 Exhibit 3: Study Area Parking Supply by Location and Type – 2014 .......................................................................................... 6 Exhibit 4: Parking Inventory ............................................................................................................................................................... 6 Exhibit 5: Weekday Parking Occupancy ....................................................................................................................................... 7 Exhibit 6: Evening Parking Occupancy .......................................................................................................................................... 7 Exhibit 7: Daytime Occupancy ........................................................................................................................................................ 8 Exhibit 8: Evening Occupancy ......................................................................................................................................................... 9 Exhibit 9: Current Parking Occupancy by Study Area Zone ..................................................................................................... 10 Exhibit 10: Effective Parking Supply Summary ............................................................................................................................. 11 Exhibit 11: Current Parking Effective Supply by Zone ................................................................................................................. 11 Exhibit 12: Weekday Daytime Current Parking Adequacy by Zone ....................................................................................... 12 Exhibit 13: Weekday Evening Current Parking Adequacy by Zone ........................................................................................ 12 Exhibit 14: Old Market – Average Length of Stay for On-Street Parking ............................................................................ 13 Exhibit 15: Potential Future Developments within the Study Area – 2030 Plan ...................................................................... 15 Exhibit 16: Projected Weekday and Evening Parking Adequacy ........................................................................................... 17 Exhibit 17: Projected Weekday Day Parking Demand .............................................................................................................. 18 Exhibit 18: Projected Weekday Evening Parking Demand ....................................................................................................... 19 Exhibit 19: Potential Development Sites – 350,000 Sq. Ft. Office Tower ................................................................................. 20
CITY OF OMAHA DOWNTOWN PARKING NEEDS ASSESSMENT UPDATE OCTOBER 15, 2014
1
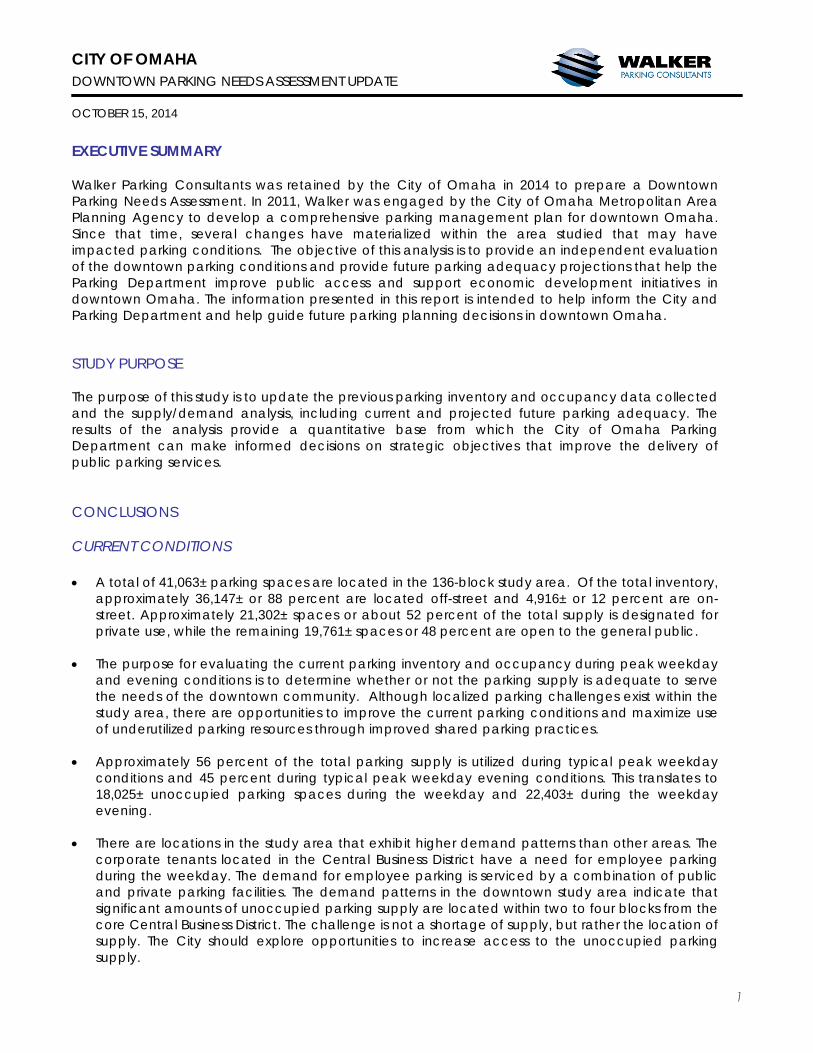
EXECUTIVE SUMMARY Walker Parking Consultants was retained by the City of Omaha in 2014 to prepare a Downtown Parking Needs Assessment. In 2011, Walker was engaged by the City of Omaha Metropolitan Area Planning Agency to develop a comprehensive parking management plan for downtown Omaha. Since that time, several changes have materialized within the area studied that may have impacted parking conditions. The objective of this analysis is to provide an independent evaluation of the downtown parking conditions and provide future parking adequacy projections that help the Parking Department improve public access and support economic development initiatives in downtown Omaha. The information presented in this report is intended to help inform the City and Parking Department and help guide future parking planning decisions in downtown Omaha. STUDY PURPOSE The purpose of this study is to update the previous parking inventory and occupancy data collected and the supply/demand analysis, including current and projected future parking adequacy. The results of the analysis provide a quantitative base from which the City of Omaha Parking Department can make informed decisions on strategic objectives that improve the delivery of public parking services. CONCLUSIONS CURRENT CONDITIONS A total of 41,063± parking spaces are located in the 136-block study area. Of the total inventory,
approximately 36,147± or 88 percent are located off-street and 4,916± or 12 percent are on-street. Approximately 21,302± spaces or about 52 percent of the total supply is designated for private use, while the remaining 19,761± spaces or 48 percent are open to the general public.
The purpose for evaluating the current parking inventory and occupancy during peak weekday
and evening conditions is to determine whether or not the parking supply is adequate to serve the needs of the downtown community. Although localized parking challenges exist within the study area, there are opportunities to improve the current parking conditions and maximize use of underutilized parking resources through improved shared parking practices.
Approximately 56 percent of the total parking supply is utilized during typical peak weekday conditions and 45 percent during typical peak weekday evening conditions. This translates to 18,025± unoccupied parking spaces during the weekday and 22,403± during the weekday evening.
There are locations in the study area that exhibit higher demand patterns than other areas. The
corporate tenants located in the Central Business District have a need for employee parking during the weekday. The demand for employee parking is serviced by a combination of public and private parking facilities. The demand patterns in the downtown study area indicate that significant amounts of unoccupied parking supply are located within two to four blocks from the core Central Business District. The challenge is not a shortage of supply, but rather the location of supply. The City should explore opportunities to increase access to the unoccupied parking supply.
CITY OF OMAHA DOWNTOWN PARKING NEEDS ASSESSMENT UPDATE OCTOBER 15, 2014
2
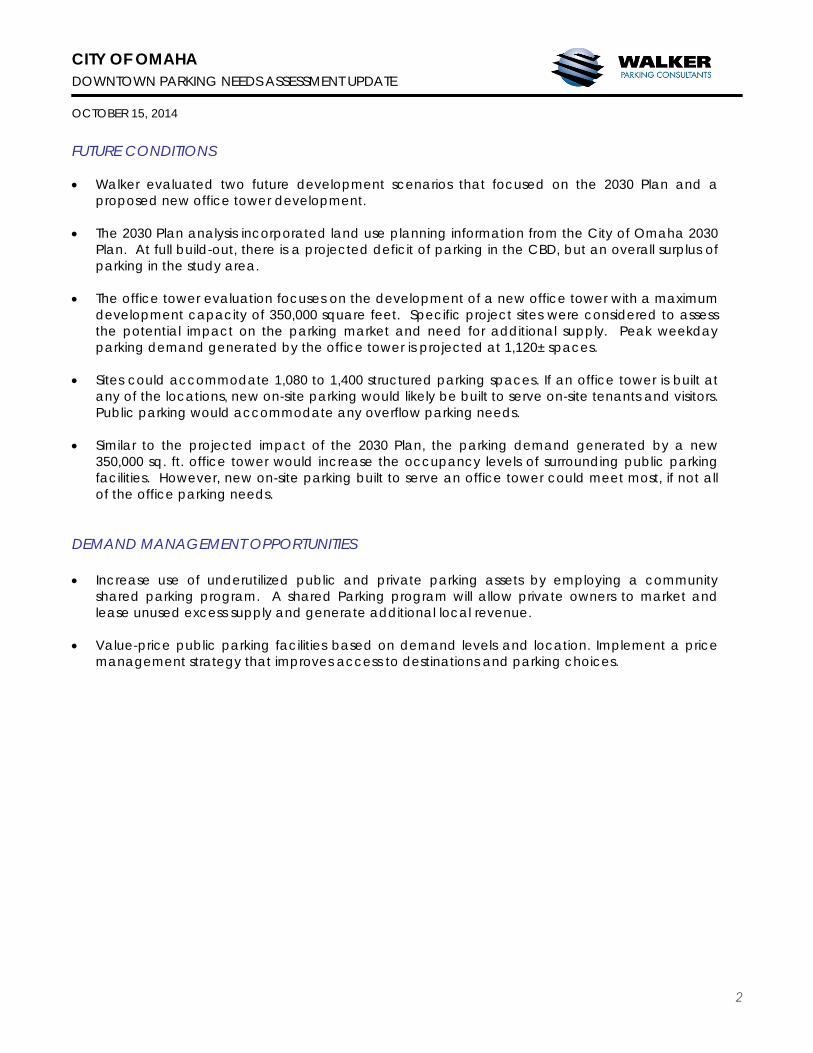
FUTURE CONDITIONS Walker evaluated two future development scenarios that focused on the 2030 Plan and a
proposed new office tower development.
The 2030 Plan analysis incorporated land use planning information from the City of Omaha 2030 Plan. At full build-out, there is a projected deficit of parking in the CBD, but an overall surplus of parking in the study area.
The office tower evaluation focuses on the development of a new office tower with a maximum development capacity of 350,000 square feet. Specific project sites were considered to assess the potential impact on the parking market and need for additional supply. Peak weekday parking demand generated by the office tower is projected at 1,120± spaces.
Sites could accommodate 1,080 to 1,400 structured parking spaces. If an office tower is built at any of the locations, new on-site parking would likely be built to serve on-site tenants and visitors. Public parking would accommodate any overflow parking needs.
Similar to the projected impact of the 2030 Plan, the parking demand generated by a new
350,000 sq. ft. office tower would increase the occupancy levels of surrounding public parking facilities. However, new on-site parking built to serve an office tower could meet most, if not all of the office parking needs.
DEMAND MANAGEMENT OPPORTUNITIES Increase use of underutilized public and private parking assets by employing a community
shared parking program. A shared Parking program will allow private owners to market and lease unused excess supply and generate additional local revenue.
Value-price public parking facilities based on demand levels and location. Implement a price
management strategy that improves access to destinations and parking choices.

CITY OF OMAHA DOWNTOWN PARKING NEEDS ASSESSMENT UPDATE OCTOBER 15, 2014
3
INTRODUCTION One of Downtown Omaha’s defining characteristics is its focus on being a place where the community comes together to live, work and play. Within this vibrant economic environment, the public parking assets are a critical component of a larger network of mobility and accessibility options made available to the public. The recently formed City of Omaha Parking Department provides public access to over 4,600 parking spaces through five parking structures, seven parking lots and more than 4,900 on-street parking spaces. Maintaining this public infrastructure is important to the continued success of the downtown community. The Parking Department intends to continue delivering parking services by ensuring that it operates in an efficient and financially sustainable manner with an emphasis on maximizing the use of existing resources. To this end, the Parking Department is working to improve access to downtown destinations, increase the use of underutilized public parking facilities, and continually pursue ways to improve the overall delivery of parking services. PROJECT PURPOSE The purpose of this analysis is to quantify downtown Omaha’s current and future parking needs. The objective is to provide an independent evaluation of the downtown parking conditions and provide information that helps the Parking Department improve public access to downtown Omaha. As the City and Parking Department plan for further downtown economic growth and increasing demand for public parking, this study intends to address the following questions: 1. What is the current parking adequacy in downtown Omaha?
2. What is the future parking adequacy in downtown Omaha?
PROJECT SCOPE The project scope includes the following key tasks.
DATA COLLECTION ANALYSIS
Obtain from the City master and development plans of significant projects located within the Study Area, downtown employment data, and downtown residential data.
Model parking demand with the Study Area
including the impacts of proposed developments identified in the Master Plan or specifically identified by the City.
Update inventory of on-street and off-street parking
spaces in the Study Area.
Analyze the existing and future parking demand
and break down into study area zones, taking into consideration current parking counts, existing land uses, and proposed developments.
Perform a parking space occupancy count survey for
all public and private parking faculties located with the Study Area during weekday business hours and Friday evening hours.
Quantify parking adequacy in each zone and on a
block-by-block basis under existing and future conditions, including a five- to ten-year planning horizon.

CITY OF OMAHA DOWNTOWN PARKING NEEDS ASSESSMENT UPDATE OCTOBER 15, 2014
4
DESCRIPTION OF STUDY AREA The study area is defined for the purpose of this analysis as the geographical area generally bound by Cummings Street to the north, Leavenworth Street to the south, the Missouri River to the east, and 24th Street to the west. The geographical area defined as the study area represents two market components; one from which the majority of existing and potential parking patrons will be drawn, and another in which the primary parking resources are located. The 136-block study area is not uniform in size or shape, nor does it extend equally in all directions. Rather, the study area generally encompasses the central business district of downtown Omaha and is organized into fourteen (14) subareas or market zones. A map of the study area is presented in the following exhibit. Exhibit 1: Downtown Study Area
CITY OF OMAHA DOWNTOWN PARKING NEEDS ASSESSMENT UPDATE OCTOBER 15, 2014
5
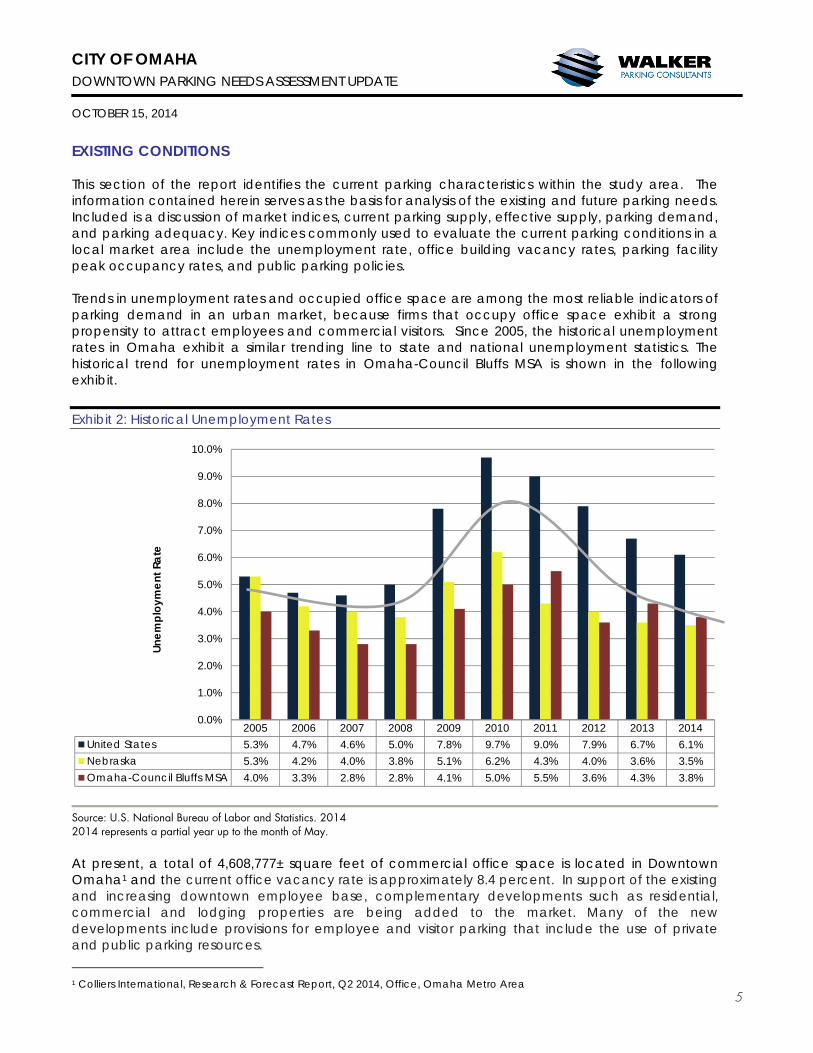
EXISTING CONDITIONS This section of the report identifies the current parking characteristics within the study area. The information contained herein serves as the basis for analysis of the existing and future parking needs. Included is a discussion of market indices, current parking supply, effective supply, parking demand, and parking adequacy. Key indices commonly used to evaluate the current parking conditions in a local market area include the unemployment rate, office building vacancy rates, parking facility peak occupancy rates, and public parking policies. Trends in unemployment rates and occupied office space are among the most reliable indicators of parking demand in an urban market, because firms that occupy office space exhibit a strong propensity to attract employees and commercial visitors. Since 2005, the historical unemployment rates in Omaha exhibit a similar trending line to state and national unemployment statistics. The historical trend for unemployment rates in Omaha-Council Bluffs MSA is shown in the following exhibit. Exhibit 2: Historical Unemployment Rates
2005 2006 2007 2008 2009 2010 2011 2012 2013 2014United States 5.3% 4.7% 4.6% 5.0% 7.8% 9.7% 9.0% 7.9% 6.7% 6.1%Nebraska 5.3% 4.2% 4.0% 3.8% 5.1% 6.2% 4.3% 4.0% 3.6% 3.5%Omaha-Council Bluffs MSA 4.0% 3.3% 2.8% 2.8% 4.1% 5.0% 5.5% 3.6% 4.3% 3.8%
0.0%
1.0%
2.0%
3.0%
4.0%
5.0%
6.0%
7.0%
8.0%
9.0%
10.0%
Unem
ploy
men
t Rat
e
Source: U.S. National Bureau of Labor and Statistics. 2014 2014 represents a partial year up to the month of May. At present, a total of 4,608,777± square feet of commercial office space is located in Downtown Omaha1 and the current office vacancy rate is approximately 8.4 percent. In support of the existing and increasing downtown employee base, complementary developments such as residential, commercial and lodging properties are being added to the market. Many of the new developments include provisions for employee and visitor parking that include the use of private and public parking resources.
1 Colliers International, Research & Forecast Report, Q2 2014, Office, Omaha Metro Area
CITY OF OMAHA DOWNTOWN PARKING NEEDS ASSESSMENT UPDATE OCTOBER 15, 2014
6
Garage17,39942%
Surface Lot18,74846%
On-Street4,91612%
Parking Type
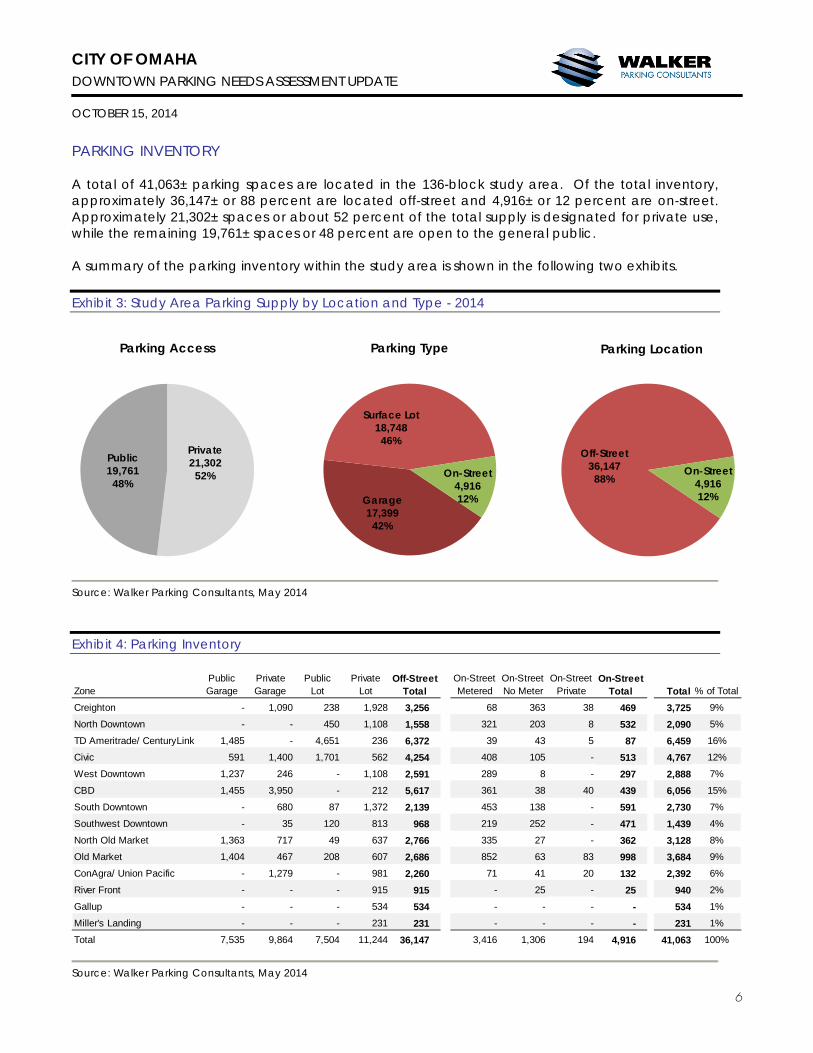
PARKING INVENTORY A total of 41,063± parking spaces are located in the 136-block study area. Of the total inventory, approximately 36,147± or 88 percent are located off-street and 4,916± or 12 percent are on-street. Approximately 21,302± spaces or about 52 percent of the total supply is designated for private use, while the remaining 19,761± spaces or 48 percent are open to the general public. A summary of the parking inventory within the study area is shown in the following two exhibits. Exhibit 3: Study Area Parking Supply by Location and Type - 2014
Private21,30252%
Public19,76148%
Parking Access
Source: Walker Parking Consultants, May 2014 Exhibit 4: Parking Inventory
ZonePublic Garage
Private Garage
Public Lot
Private Lot
Off-Street Total
On-Street Metered
On-Street No Meter
On-Street Private
On-Street Total Total % of Total
Creighton - 1,090 238 1,928 3,256 68 363 38 469 3,725 9%
North Downtown - - 450 1,108 1,558 321 203 8 532 2,090 5%
TD Ameritrade/ CenturyLink 1,485 - 4,651 236 6,372 39 43 5 87 6,459 16%
Civic 591 1,400 1,701 562 4,254 408 105 - 513 4,767 12%
West Downtown 1,237 246 - 1,108 2,591 289 8 - 297 2,888 7%
CBD 1,455 3,950 - 212 5,617 361 38 40 439 6,056 15%
South Downtown - 680 87 1,372 2,139 453 138 - 591 2,730 7%
Southwest Downtown - 35 120 813 968 219 252 - 471 1,439 4%
North Old Market 1,363 717 49 637 2,766 335 27 - 362 3,128 8%
Old Market 1,404 467 208 607 2,686 852 63 83 998 3,684 9%
ConAgra/ Union Pacific - 1,279 - 981 2,260 71 41 20 132 2,392 6%
River Front - - - 915 915 - 25 - 25 940 2%
Gallup - - - 534 534 - - - - 534 1%
Miller's Landing - - - 231 231 - - - - 231 1%
Total 7,535 9,864 7,504 11,244 36,147 3,416 1,306 194 4,916 41,063 100%
Source: Walker Parking Consultants, May 2014
Off-Street 36,14788%
On-Street4,91612%
Parking Location
CITY OF OMAHA DOWNTOWN PARKING NEEDS ASSESSMENT UPDATE OCTOBER 15, 2014
7
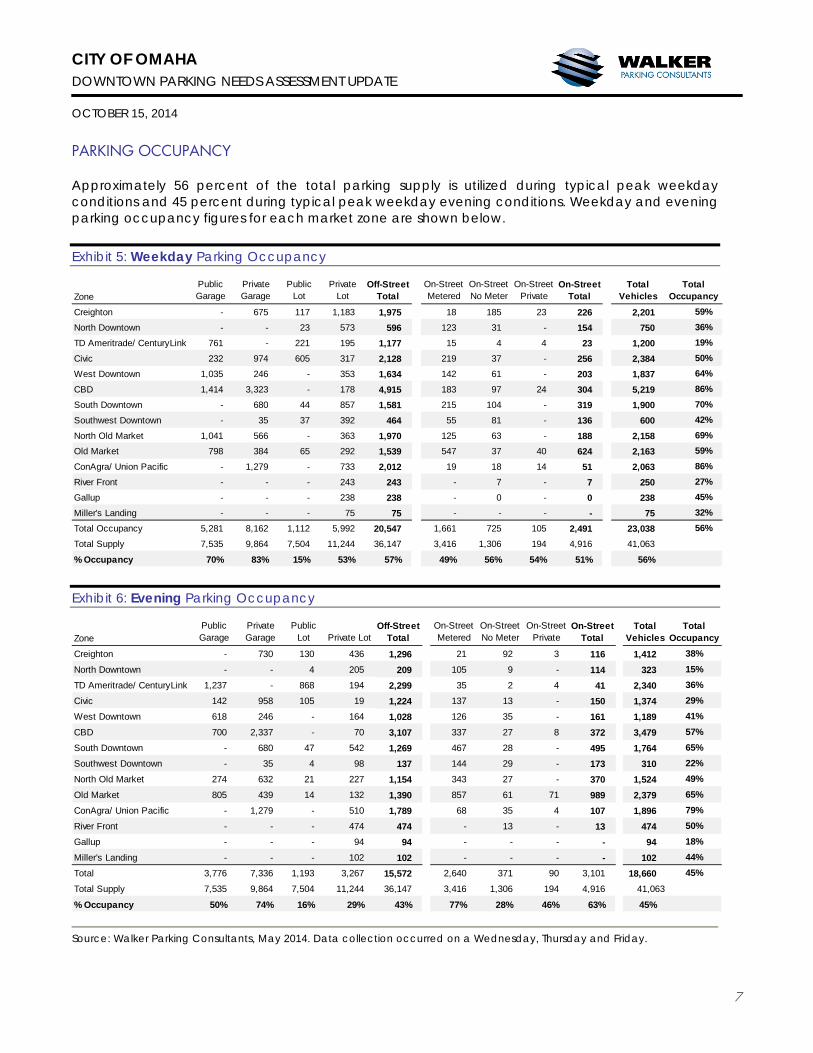
PARKING OCCUPANCY Approximately 56 percent of the total parking supply is utilized during typical peak weekday conditions and 45 percent during typical peak weekday evening conditions. Weekday and evening parking occupancy figures for each market zone are shown below. Exhibit 5: Weekday Parking Occupancy
ZonePublic Garage
Private Garage
Public Lot
Private Lot
Off-Street Total
On-Street Metered
On-Street No Meter
On-Street Private
On-Street Total
Total Vehicles
Total Occupancy
Creighton - 675 117 1,183 1,975 18 185 23 226 2,201 59%
North Downtown - - 23 573 596 123 31 - 154 750 36%
TD Ameritrade/ CenturyLink 761 - 221 195 1,177 15 4 4 23 1,200 19%
Civic 232 974 605 317 2,128 219 37 - 256 2,384 50%
West Downtown 1,035 246 - 353 1,634 142 61 - 203 1,837 64%
CBD 1,414 3,323 - 178 4,915 183 97 24 304 5,219 86%
South Downtown - 680 44 857 1,581 215 104 - 319 1,900 70%
Southwest Downtown - 35 37 392 464 55 81 - 136 600 42%
North Old Market 1,041 566 - 363 1,970 125 63 - 188 2,158 69%
Old Market 798 384 65 292 1,539 547 37 40 624 2,163 59%
ConAgra/ Union Pacific - 1,279 - 733 2,012 19 18 14 51 2,063 86%
River Front - - - 243 243 - 7 - 7 250 27%
Gallup - - - 238 238 - 0 - 0 238 45%
Miller's Landing - - - 75 75 - - - - 75 32%
Total Occupancy 5,281 8,162 1,112 5,992 20,547 1,661 725 105 2,491 23,038 56%
Total Supply 7,535 9,864 7,504 11,244 36,147 3,416 1,306 194 4,916 41,063
% Occupancy 70% 83% 15% 53% 57% 49% 56% 54% 51% 56% Exhibit 6: Evening Parking Occupancy
ZonePublic Garage
Private Garage
Public Lot Private Lot
Off-Street Total
On-Street Metered
On-Street No Meter
On-Street Private
On-Street Total
Total Vehicles
Total Occupancy
Creighton - 730 130 436 1,296 21 92 3 116 1,412 38%
North Downtown - - 4 205 209 105 9 - 114 323 15%
TD Ameritrade/ CenturyLink 1,237 - 868 194 2,299 35 2 4 41 2,340 36%
Civic 142 958 105 19 1,224 137 13 - 150 1,374 29%
West Downtown 618 246 - 164 1,028 126 35 - 161 1,189 41%
CBD 700 2,337 - 70 3,107 337 27 8 372 3,479 57%
South Downtown - 680 47 542 1,269 467 28 - 495 1,764 65%
Southwest Downtown - 35 4 98 137 144 29 - 173 310 22%
North Old Market 274 632 21 227 1,154 343 27 - 370 1,524 49%
Old Market 805 439 14 132 1,390 857 61 71 989 2,379 65%
ConAgra/ Union Pacific - 1,279 - 510 1,789 68 35 4 107 1,896 79%
River Front - - - 474 474 - 13 - 13 474 50%
Gallup - - - 94 94 - - - - 94 18%
Miller's Landing - - - 102 102 - - - - 102 44%
Total 3,776 7,336 1,193 3,267 15,572 2,640 371 90 3,101 18,660 45%
Total Supply 7,535 9,864 7,504 11,244 36,147 3,416 1,306 194 4,916 41,063
% Occupancy 50% 74% 16% 29% 43% 77% 28% 46% 63% 45%
Source: Walker Parking Consultants, May 2014. Data collection occurred on a Wednesday, Thursday and Friday.

CITY OF OMAHA DOWNTOWN PARKING NEEDS ASSESSMENT UPDATE OCTOBER 15, 2014
8
The following two exhibits provide a visual depiction of the parking occupancy levels during a typical weekday and evening on a block-by-block basis. Exhibit 7: Daytime Occupancy
Source: Walker Parking Consultants, May 2014 Weekday parking demand is most intense near major downtown office building with low
vacancy rates located in the core Central Business District and near the Creighton University campus.
While localized areas of intense demand exist (Red), there are also localized areas with a significant number of unoccupied parking spaces (Green).

CITY OF OMAHA DOWNTOWN PARKING NEEDS ASSESSMENT UPDATE OCTOBER 15, 2014
9
Exhibit 8: Evening Occupancy
Source: Walker Parking Consultants, May 2014 Evening parking demand is most intense near the Old Market and Central Business District.
Similar to the daytime, while there are localized areas of high demand (Red), there are also
areas with a significant amount of unoccupied supply (Green).
CITY OF OMAHA DOWNTOWN PARKING NEEDS ASSESSMENT UPDATE OCTOBER 15, 2014
10
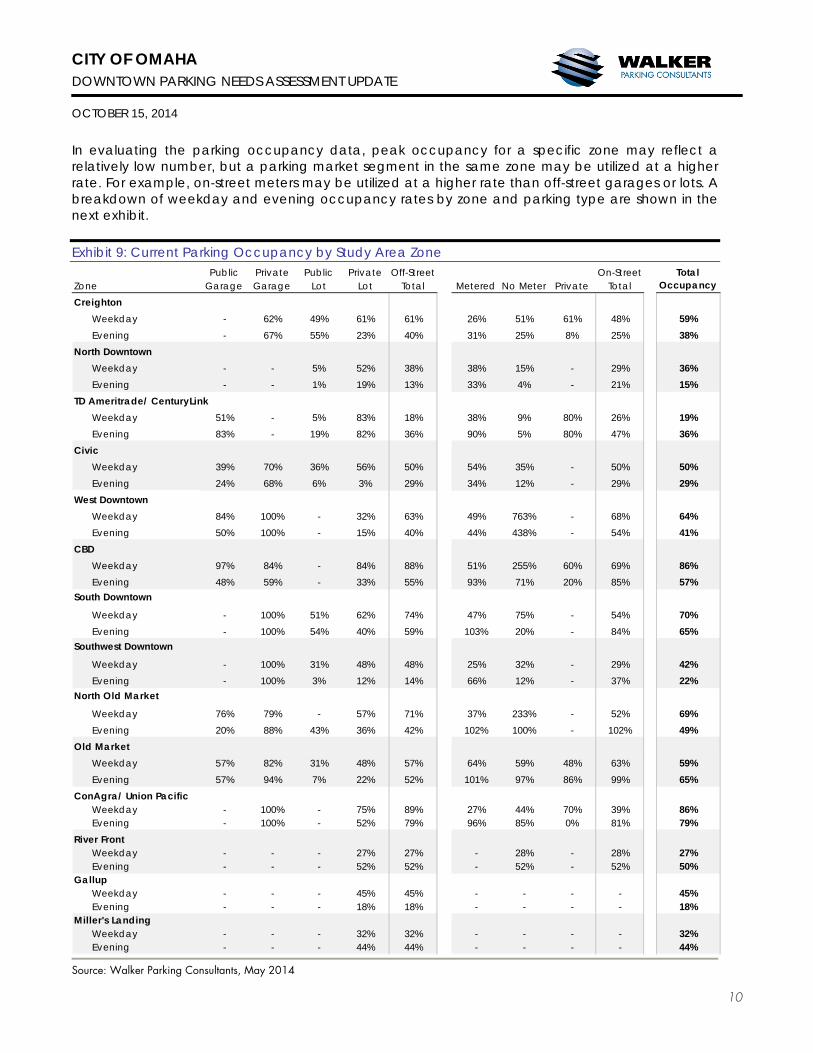
In evaluating the parking occupancy data, peak occupancy for a specific zone may reflect a relatively low number, but a parking market segment in the same zone may be utilized at a higher rate. For example, on-street meters may be utilized at a higher rate than off-street garages or lots. A breakdown of weekday and evening occupancy rates by zone and parking type are shown in the next exhibit. Exhibit 9: Current Parking Occupancy by Study Area Zone
ZonePublic
GaragePrivate Garage
Public Lot
Private Lot
Off-Street Total Metered No Meter Private
On-Street Total
Total Occupancy
CreightonWeekday - 62% 49% 61% 61% 26% 51% 61% 48% 59%Evening - 67% 55% 23% 40% 31% 25% 8% 25% 38%
North DowntownWeekday - - 5% 52% 38% 38% 15% - 29% 36%Evening - - 1% 19% 13% 33% 4% - 21% 15%
TD Ameritrade/ CenturyLinkWeekday 51% - 5% 83% 18% 38% 9% 80% 26% 19%Evening 83% - 19% 82% 36% 90% 5% 80% 47% 36%
CivicWeekday 39% 70% 36% 56% 50% 54% 35% - 50% 50%Evening 24% 68% 6% 3% 29% 34% 12% - 29% 29%
West DowntownWeekday 84% 100% - 32% 63% 49% 763% - 68% 64%Evening 50% 100% - 15% 40% 44% 438% - 54% 41%
CBDWeekday 97% 84% - 84% 88% 51% 255% 60% 69% 86%Evening 48% 59% - 33% 55% 93% 71% 20% 85% 57%
South Downtown
Weekday - 100% 51% 62% 74% 47% 75% - 54% 70%Evening - 100% 54% 40% 59% 103% 20% - 84% 65%
Southwest Downtown
Weekday - 100% 31% 48% 48% 25% 32% - 29% 42%Evening - 100% 3% 12% 14% 66% 12% - 37% 22%
North Old Market
Weekday 76% 79% - 57% 71% 37% 233% - 52% 69%Evening 20% 88% 43% 36% 42% 102% 100% - 102% 49%
Old MarketWeekday 57% 82% 31% 48% 57% 64% 59% 48% 63% 59%Evening 57% 94% 7% 22% 52% 101% 97% 86% 99% 65%
ConAgra/ Union PacificWeekday - 100% - 75% 89% 27% 44% 70% 39% 86%Evening - 100% - 52% 79% 96% 85% 0% 81% 79%
River FrontWeekday - - - 27% 27% - 28% - 28% 27%Evening - - - 52% 52% - 52% - 52% 50%
GallupWeekday - - - 45% 45% - - - - 45%Evening - - - 18% 18% - - - - 18%
Miller's LandingWeekday - - - 32% 32% - - - - 32%Evening - - - 44% 44% - - - - 44%
Source: Walker Parking Consultants, May 2014
CITY OF OMAHA DOWNTOWN PARKING NEEDS ASSESSMENT UPDATE OCTOBER 15, 2014
11
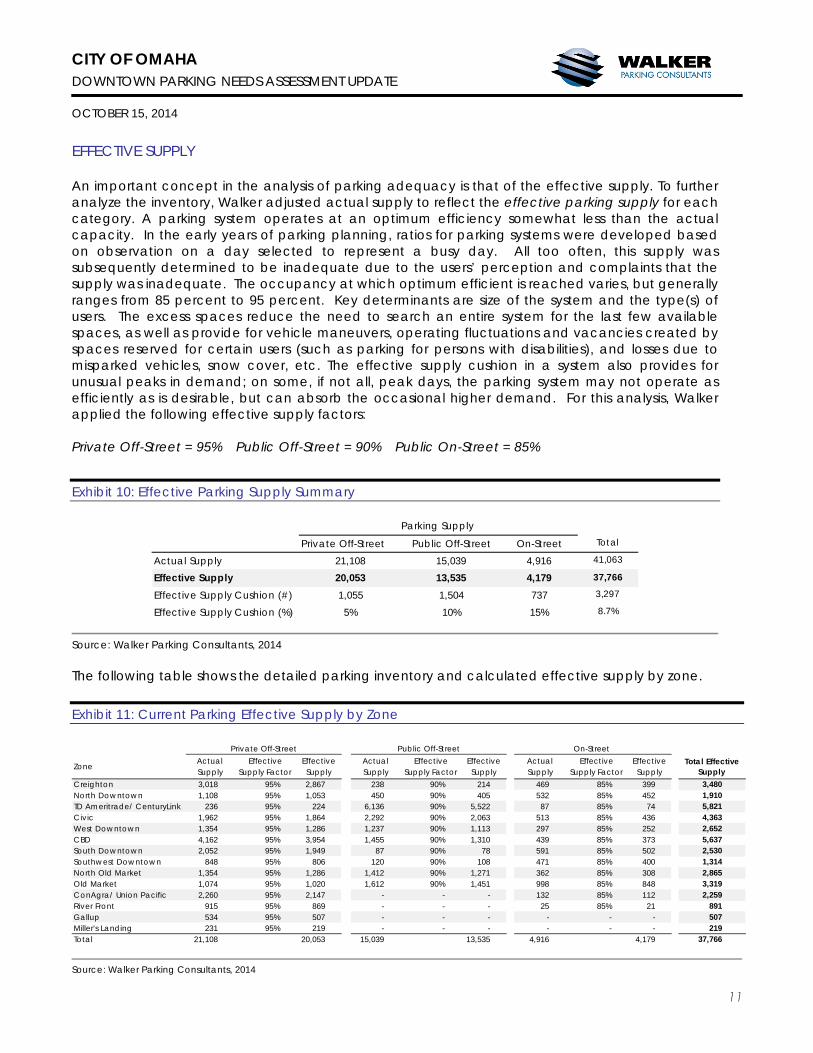
EFFECTIVE SUPPLY An important concept in the analysis of parking adequacy is that of the effective supply. To further analyze the inventory, Walker adjusted actual supply to reflect the effective parking supply for each category. A parking system operates at an optimum efficiency somewhat less than the actual capacity. In the early years of parking planning, ratios for parking systems were developed based on observation on a day selected to represent a busy day. All too often, this supply was subsequently determined to be inadequate due to the users’ perception and complaints that the supply was inadequate. The occupancy at which optimum efficient is reached varies, but generally ranges from 85 percent to 95 percent. Key determinants are size of the system and the type(s) of users. The excess spaces reduce the need to search an entire system for the last few available spaces, as well as provide for vehicle maneuvers, operating fluctuations and vacancies created by spaces reserved for certain users (such as parking for persons with disabilities), and losses due to misparked vehicles, snow cover, etc. The effective supply cushion in a system also provides for unusual peaks in demand; on some, if not all, peak days, the parking system may not operate as efficiently as is desirable, but can absorb the occasional higher demand. For this analysis, Walker applied the following effective supply factors: Private Off-Street = 95% Public Off-Street = 90% Public On-Street = 85%
Exhibit 10: Effective Parking Supply Summary
Private Off-Street Public Off-Street On-Street Total
Actual Supply 21,108 15,039 4,916 41,063
Effective Supply 20,053 13,535 4,179 37,766
Effective Supply Cushion (#) 1,055 1,504 737 3,297
Effective Supply Cushion (%) 5% 10% 15% 8.7%
Parking Supply
Source: Walker Parking Consultants, 2014 The following table shows the detailed parking inventory and calculated effective supply by zone. Exhibit 11: Current Parking Effective Supply by Zone
ZoneActual Supply
Effective Supply Factor
Effective Supply
Actual Supply
Effective Supply Factor
Effective Supply
Actual Supply
Effective Supply Factor
Effective Supply
Total Effective Supply
Creighton 3,018 95% 2,867 238 90% 214 469 85% 399 3,480North Downtown 1,108 95% 1,053 450 90% 405 532 85% 452 1,910TD Ameritrade/ CenturyLink 236 95% 224 6,136 90% 5,522 87 85% 74 5,821Civic 1,962 95% 1,864 2,292 90% 2,063 513 85% 436 4,363West Downtown 1,354 95% 1,286 1,237 90% 1,113 297 85% 252 2,652CBD 4,162 95% 3,954 1,455 90% 1,310 439 85% 373 5,637South Downtown 2,052 95% 1,949 87 90% 78 591 85% 502 2,530Southwest Downtown 848 95% 806 120 90% 108 471 85% 400 1,314North Old Market 1,354 95% 1,286 1,412 90% 1,271 362 85% 308 2,865Old Market 1,074 95% 1,020 1,612 90% 1,451 998 85% 848 3,319ConAgra/ Union Pacific 2,260 95% 2,147 - - - 132 85% 112 2,259River Front 915 95% 869 - - - 25 85% 21 891Gallup 534 95% 507 - - - - - - 507Miller's Landing 231 95% 219 - - - - - - 219Total 21,108 20,053 15,039 13,535 4,916 4,179 37,766
Private Off-Street Public Off-Street On-Street
Source: Walker Parking Consultants, 2014
CITY OF OMAHA DOWNTOWN PARKING NEEDS ASSESSMENT UPDATE OCTOBER 15, 2014
12
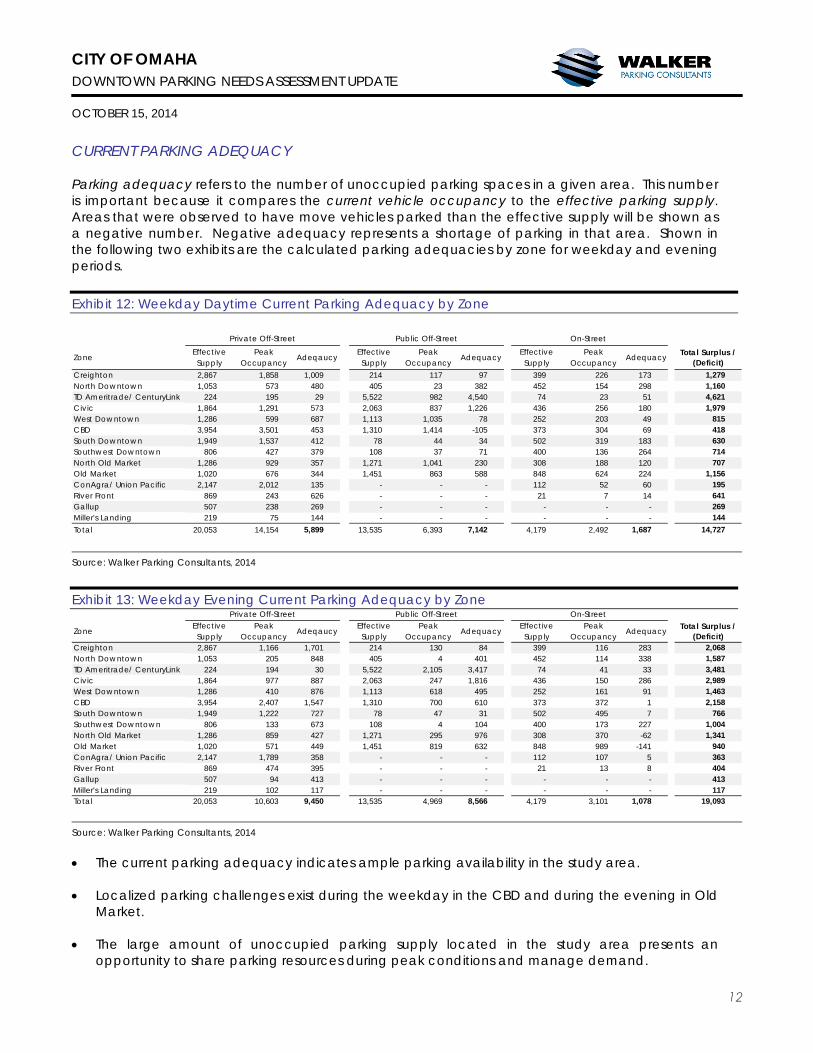
CURRENT PARKING ADEQUACY Parking adequacy refers to the number of unoccupied parking spaces in a given area. This number is important because it compares the current vehicle occupancy to the effective parking supply. Areas that were observed to have move vehicles parked than the effective supply will be shown as a negative number. Negative adequacy represents a shortage of parking in that area. Shown in the following two exhibits are the calculated parking adequacies by zone for weekday and evening periods.
Exhibit 12: Weekday Daytime Current Parking Adequacy by Zone
ZoneEffective Supply
Peak Occupancy
AdeqaucyEffective Supply
Peak Occupancy
AdequacyEffective Supply
Peak Occupancy
Adequacy Total Surplus / (Deficit)
Creighton 2,867 1,858 1,009 214 117 97 399 226 173 1,279North Downtown 1,053 573 480 405 23 382 452 154 298 1,160TD Ameritrade/ CenturyLink 224 195 29 5,522 982 4,540 74 23 51 4,621Civic 1,864 1,291 573 2,063 837 1,226 436 256 180 1,979West Downtown 1,286 599 687 1,113 1,035 78 252 203 49 815CBD 3,954 3,501 453 1,310 1,414 -105 373 304 69 418South Downtown 1,949 1,537 412 78 44 34 502 319 183 630Southwest Downtown 806 427 379 108 37 71 400 136 264 714North Old Market 1,286 929 357 1,271 1,041 230 308 188 120 707Old Market 1,020 676 344 1,451 863 588 848 624 224 1,156ConAgra/ Union Pacific 2,147 2,012 135 - - - 112 52 60 195River Front 869 243 626 - - - 21 7 14 641Gallup 507 238 269 - - - - - - 269Miller's Landing 219 75 144 - - - - - - 144Total 20,053 14,154 5,899 13,535 6,393 7,142 4,179 2,492 1,687 14,727
Private Off-Street Public Off-Street On-Street
Source: Walker Parking Consultants, 2014
Exhibit 13: Weekday Evening Current Parking Adequacy by Zone
ZoneEffective Supply
Peak Occupancy
AdeqaucyEffective Supply
Peak Occupancy
AdequacyEffective Supply
Peak Occupancy
Adequacy Total Surplus / (Deficit)
Creighton 2,867 1,166 1,701 214 130 84 399 116 283 2,068North Downtown 1,053 205 848 405 4 401 452 114 338 1,587TD Ameritrade/ CenturyLink 224 194 30 5,522 2,105 3,417 74 41 33 3,481Civic 1,864 977 887 2,063 247 1,816 436 150 286 2,989West Downtown 1,286 410 876 1,113 618 495 252 161 91 1,463CBD 3,954 2,407 1,547 1,310 700 610 373 372 1 2,158South Downtown 1,949 1,222 727 78 47 31 502 495 7 766Southwest Downtown 806 133 673 108 4 104 400 173 227 1,004North Old Market 1,286 859 427 1,271 295 976 308 370 -62 1,341Old Market 1,020 571 449 1,451 819 632 848 989 -141 940ConAgra/ Union Pacific 2,147 1,789 358 - - - 112 107 5 363River Front 869 474 395 - - - 21 13 8 404Gallup 507 94 413 - - - - - - 413Miller's Landing 219 102 117 - - - - - - 117Total 20,053 10,603 9,450 13,535 4,969 8,566 4,179 3,101 1,078 19,093
Private Off-Street Public Off-Street On-Street
Source: Walker Parking Consultants, 2014 The current parking adequacy indicates ample parking availability in the study area.
Localized parking challenges exist during the weekday in the CBD and during the evening in Old
Market.
The large amount of unoccupied parking supply located in the study area presents an opportunity to share parking resources during peak conditions and manage demand.

CITY OF OMAHA DOWNTOWN PARKING NEEDS ASSESSMENT UPDATE OCTOBER 15, 2014
13
OLD MARKET ON-STREET PARKING The on-street parking in the Old Market area is highly utilized during a typical evening. The spaces are used by patrons, employees and residents of the area. In 2012, new automated on-street meters that accept credit/debit card and coin payment were installed to improve parking management and offer patrons a higher level of service and convenience. Since the installation, the Parking Department also implemented a new mobile application payment option that offers greater convenience for the end users. The on-street meters are enforced from 8:30AM to 5:00PM, Monday through Friday and the time limits and rates include three options; 2 hours at $1.00 per hour, 3 hours at $0.75 per hour, and 10 hours at $0.25 per hour. Walker conducted field observations to determine the average duration a car is parked on-street in the central area of the Old Market. The average length of stay was approximately two hours on a weekday between the hours of 10:00AM and 5:00PM. The average length of stay increased to approximately two hour and thirty minutes during a Friday between the hours of 12:00PM and 11:00PM. In addition to Walker’s field observations, the Parking Department provided the following on-street parking data that coincides with Walker’s field observations. Exhibit 14: Old Market – Average Length of Stay for On-Street Parking
90.52% 6.56%
Old MarketWeekday
<3 Hours
>3 Hours
>4 Hours
>5 Hours
>6 Hours
Source: City of Omaha Parking Department 2014
84.46%
12.14%
Old MarketWeekend
<3 Hours
>3 Hours
>4 Hours
>5 Hours
>6 Hours
CITY OF OMAHA DOWNTOWN PARKING NEEDS ASSESSMENT UPDATE OCTOBER 15, 2014
14
SUMMARY OF CURRENT CONDITIONS The purpose for evaluating the current parking inventory and occupancy during peak weekday
and evening conditions is to determine whether or not the parking supply is adequate to serve the needs of the downtown community. Although localized parking challenges exist within the study area, there are opportunities to improve the current parking conditions and maximize use of underutilized parking resources through improved shared parking practices.
Peak weekday parking demand occurs between the hours of 10:00 AM and 1:00 PM. During that
period, the overall parking occupancy is 56 percent. With a total parking supply of 41,063± spaces, during peak weekday conditions there are approximately 44 percent or 18,025± unoccupied spaces in the downtown study area.
There are locations in the study area that exhibit higher demand patterns than other areas. The
corporate tenants located in the Central Business District have a need for employee parking during the weekday. The demand for employee parking is serviced by a combination of public and private parking facilities. The demand patterns in the downtown study area indicate that significant amounts of unoccupied parking supply are located within four to six blocks from the core Central Business District. The challenge is not a shortage of supply, but rather the location of supply.
CITY OF OMAHA DOWNTOWN PARKING NEEDS ASSESSMENT UPDATE OCTOBER 15, 2014
15
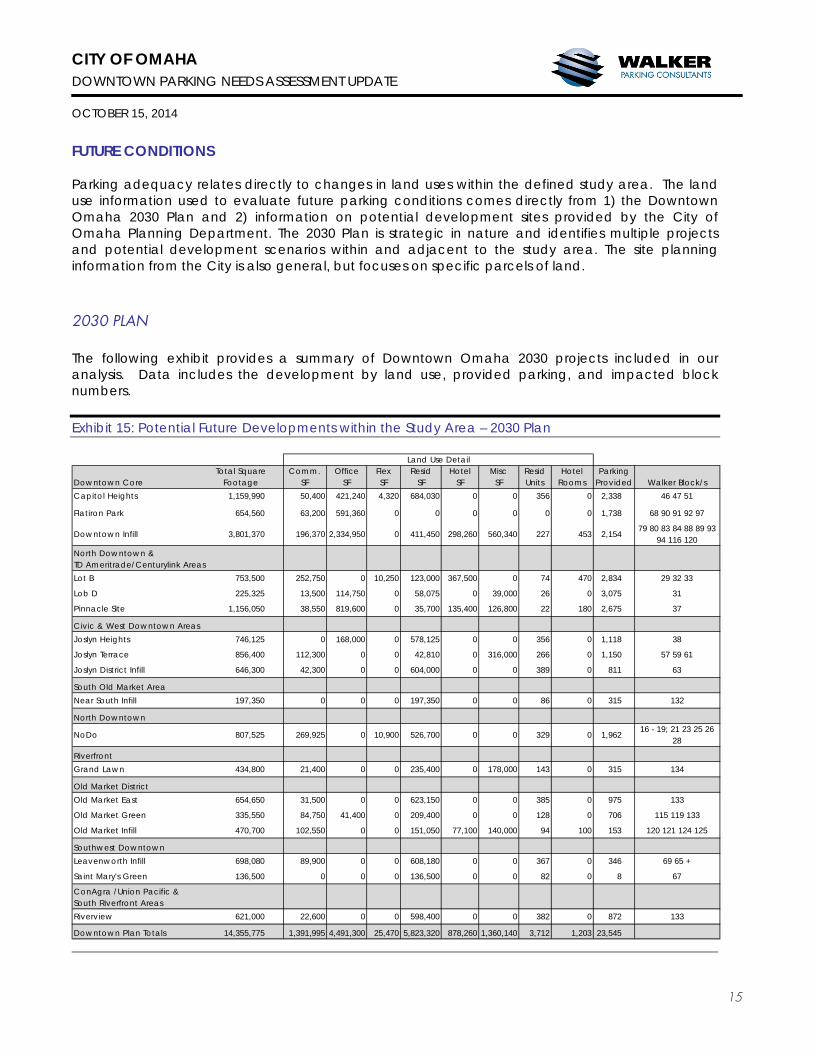
FUTURE CONDITIONS Parking adequacy relates directly to changes in land uses within the defined study area. The land use information used to evaluate future parking conditions comes directly from 1) the Downtown Omaha 2030 Plan and 2) information on potential development sites provided by the City of Omaha Planning Department. The 2030 Plan is strategic in nature and identifies multiple projects and potential development scenarios within and adjacent to the study area. The site planning information from the City is also general, but focuses on specific parcels of land. 2030 PLAN The following exhibit provides a summary of Downtown Omaha 2030 projects included in our analysis. Data includes the development by land use, provided parking, and impacted block numbers. Exhibit 15: Potential Future Developments within the Study Area – 2030 Plan
Downtown CoreTotal Square
FootageComm.
SFOffice
SFFlex SF
Resid SF
Hotel SF
Misc SF
Resid Units
Hotel Rooms
Parking Provided Walker Block/s
Capitol Heights 1,159,990 50,400 421,240 4,320 684,030 0 0 356 0 2,338 46 47 51
Flatiron Park 654,560 63,200 591,360 0 0 0 0 0 0 1,738 68 90 91 92 97
Downtown Infill 3,801,370 196,370 2,334,950 0 411,450 298,260 560,340 227 453 2,15479 80 83 84 88 89 93
94 116 120
Lot B 753,500 252,750 0 10,250 123,000 367,500 0 74 470 2,834 29 32 33
Lob D 225,325 13,500 114,750 0 58,075 0 39,000 26 0 3,075 31
Pinnacle Site 1,156,050 38,550 819,600 0 35,700 135,400 126,800 22 180 2,675 37
Civic & West Downtown AreasJoslyn Heights 746,125 0 168,000 0 578,125 0 0 356 0 1,118 38
Joslyn Terrace 856,400 112,300 0 0 42,810 0 316,000 266 0 1,150 57 59 61
Joslyn District Infill 646,300 42,300 0 0 604,000 0 0 389 0 811 63
South Old Market AreaNear South Infill 197,350 0 0 0 197,350 0 0 86 0 315 132
North Downtown
NoDo 807,525 269,925 0 10,900 526,700 0 0 329 0 1,96216 - 19; 21 23 25 26
28
Riverfront Grand Lawn 434,800 21,400 0 0 235,400 0 178,000 143 0 315 134
Old Market DistrictOld Market East 654,650 31,500 0 0 623,150 0 0 385 0 975 133
Old Market Green 335,550 84,750 41,400 0 209,400 0 0 128 0 706 115 119 133
Old Market Infill 470,700 102,550 0 0 151,050 77,100 140,000 94 100 153 120 121 124 125
Southwest DowntownLeavenworth Infill 698,080 89,900 0 0 608,180 0 0 367 0 346 69 65 +
Saint Mary's Green 136,500 0 0 0 136,500 0 0 82 0 8 67
ConAgra /Union Pacific & South Riverfront AreasRiverview 621,000 22,600 0 0 598,400 0 0 382 0 872 133
Downtown Plan Totals 14,355,775 1,391,995 4,491,300 25,470 5,823,320 878,260 1,360,140 3,712 1,203 23,545
Land Use Detail
North Downtown & TD Ameritrade/Centurylink Areas
CITY OF OMAHA DOWNTOWN PARKING NEEDS ASSESSMENT UPDATE OCTOBER 15, 2014
16
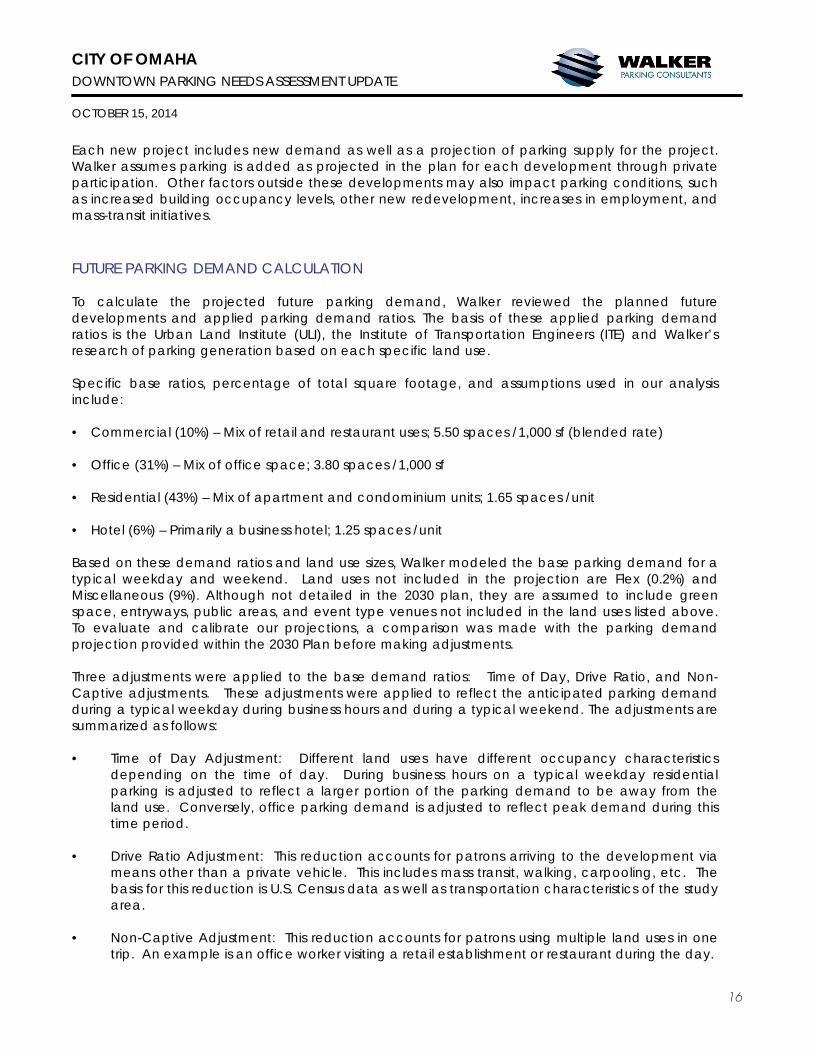
Each new project includes new demand as well as a projection of parking supply for the project. Walker assumes parking is added as projected in the plan for each development through private participation. Other factors outside these developments may also impact parking conditions, such as increased building occupancy levels, other new redevelopment, increases in employment, and mass-transit initiatives. FUTURE PARKING DEMAND CALCULATION To calculate the projected future parking demand, Walker reviewed the planned future developments and applied parking demand ratios. The basis of these applied parking demand ratios is the Urban Land Institute (ULI), the Institute of Transportation Engineers (ITE) and Walker’s research of parking generation based on each specific land use. Specific base ratios, percentage of total square footage, and assumptions used in our analysis include: • Commercial (10%) – Mix of retail and restaurant uses; 5.50 spaces /1,000 sf (blended rate) • Office (31%) – Mix of office space; 3.80 spaces /1,000 sf • Residential (43%) – Mix of apartment and condominium units; 1.65 spaces /unit • Hotel (6%) – Primarily a business hotel; 1.25 spaces /unit Based on these demand ratios and land use sizes, Walker modeled the base parking demand for a typical weekday and weekend. Land uses not included in the projection are Flex (0.2%) and Miscellaneous (9%). Although not detailed in the 2030 plan, they are assumed to include green space, entryways, public areas, and event type venues not included in the land uses listed above. To evaluate and calibrate our projections, a comparison was made with the parking demand projection provided within the 2030 Plan before making adjustments. Three adjustments were applied to the base demand ratios: Time of Day, Drive Ratio, and Non-Captive adjustments. These adjustments were applied to reflect the anticipated parking demand during a typical weekday during business hours and during a typical weekend. The adjustments are summarized as follows: • Time of Day Adjustment: Different land uses have different occupancy characteristics
depending on the time of day. During business hours on a typical weekday residential parking is adjusted to reflect a larger portion of the parking demand to be away from the land use. Conversely, office parking demand is adjusted to reflect peak demand during this time period.
• Drive Ratio Adjustment: This reduction accounts for patrons arriving to the development via
means other than a private vehicle. This includes mass transit, walking, carpooling, etc. The basis for this reduction is U.S. Census data as well as transportation characteristics of the study area.
• Non-Captive Adjustment: This reduction accounts for patrons using multiple land uses in one
trip. An example is an office worker visiting a retail establishment or restaurant during the day.

CITY OF OMAHA DOWNTOWN PARKING NEEDS ASSESSMENT UPDATE OCTOBER 15, 2014
17
The Downtown Omaha 2030 Plan provides an overview of potential developments within the study area. These developments account for more than 14 million square feet of development. The largest portion of which are residential units (+3,700 units), followed by office space (+4.4 million sf). In addition to the new land uses, a portion of parking for the developments is included; although not sufficient to meet all of the projected parking demand of each of the developments. Residential parking presents its own unique challenges, such as reserved parking and limited potential for sharing with other land uses. Commercial space includes both retail and restaurant space, both of which have very different demand ratios and peak hours of usage. Based on the data, overall future parking is projected to be ade qu at e dur ing a w e e k d a y day and weekday evening in all but the CBD Zone. The CBD or Downtown Core r epresents over 5.6 million square feet of development or about a third of the developments listed in the 2030 Plan. A summary of the projected impact of the 2030 Plan on weekday day and evening parking conditions is provided in the following exhibit. As shown, the most notable impacts to parking from the 2030 Plan are projected to occur in the CBD, South Downtown and Old Market areas of downtown Omaha. Exhibit 16: Projected Weekday and Evening Parking Adequacy
ZoneProjected Demand
Projected Peak Occupancy
Projected Demand
Projected Peak Occupancy
Creighton 1,722 46% 1,469 39%North Downtown 2,590 53% 2,368 47%TD Ameritrade/ CenturyLink 5,581 42% 4,355 31%Civic 6,636 65% 4,318 43%West Downtown 2,500 70% 2,786 61%CBD 9,386 150% 4,959 76%South Downtown 5,054 135% 3,433 75%Southwest Downtown 2,352 65% 1,929 50%North Old Market / Old Mark 6,812 85% 5,383 67%ConAgra/ Union Pacific 3,243 73% 3,558 80%River Front 477 40% 767 61%Gallup 238 45% 67 13%Miller's Landing 4 3% 29 13%Total 46,595 73% 35,421 53%
Weekday Daytime Weekday Evening
Note: Assumes parking and all developments within 2030 Plan come to fruition. No other growth is assumed. Source: Walker Parking Consultants 2014, Downtown Omaha 2030 Plan
Land Use Summary – Downtown Omaha 2030 Plan
Hotel6%
Commercial10%
Misc & Flex10%
Office31%
Residential43%

CITY OF OMAHA DOWNTOWN PARKING NEEDS ASSESSMENT UPDATE OCTOBER 15, 2014
18
PROJECTED FUTURE PARKING ADEQUACY The projected weekday and evening parking adequacy is shown in the next two exhibits. Exhibit 17: Projected Weekday Day Parking Demand
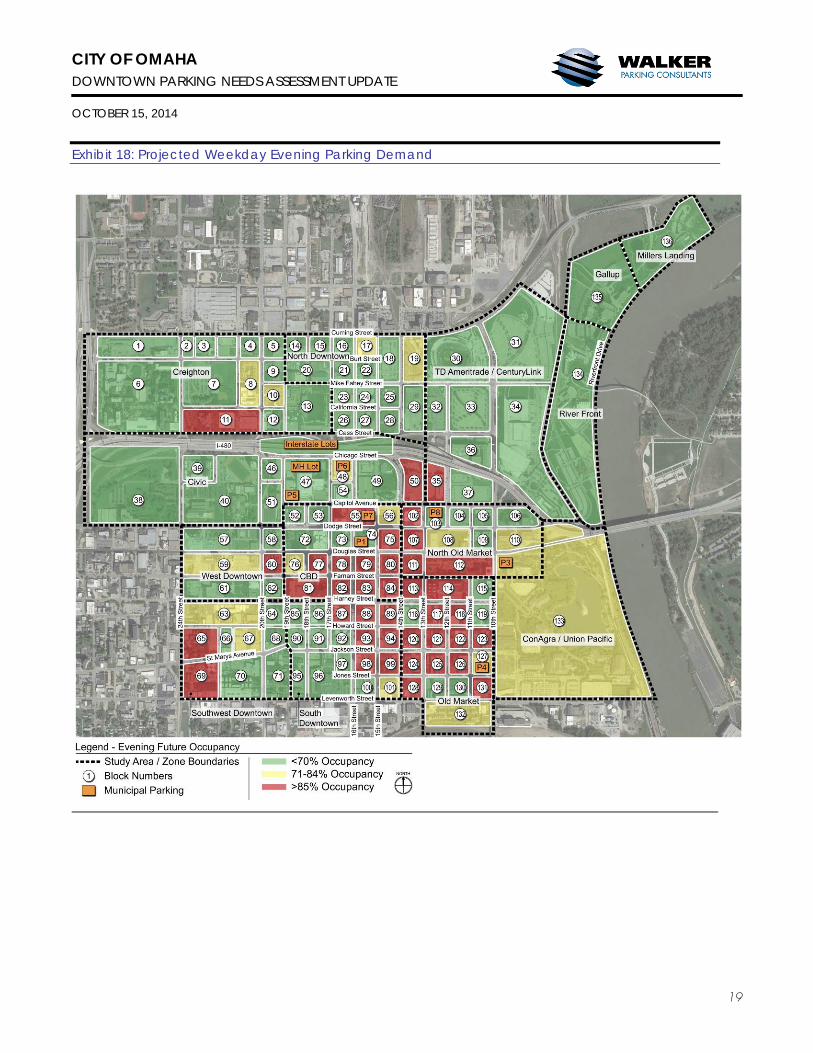
At full build-out, there is a projected deficit of parking in the CBD, but an overall surplus of
parking in the study area.
CITY OF OMAHA DOWNTOWN PARKING NEEDS ASSESSMENT UPDATE OCTOBER 15, 2014
19
Exhibit 18: Projected Weekday Evening Parking Demand
CITY OF OMAHA DOWNTOWN PARKING NEEDS ASSESSMENT UPDATE OCTOBER 15, 2014
20
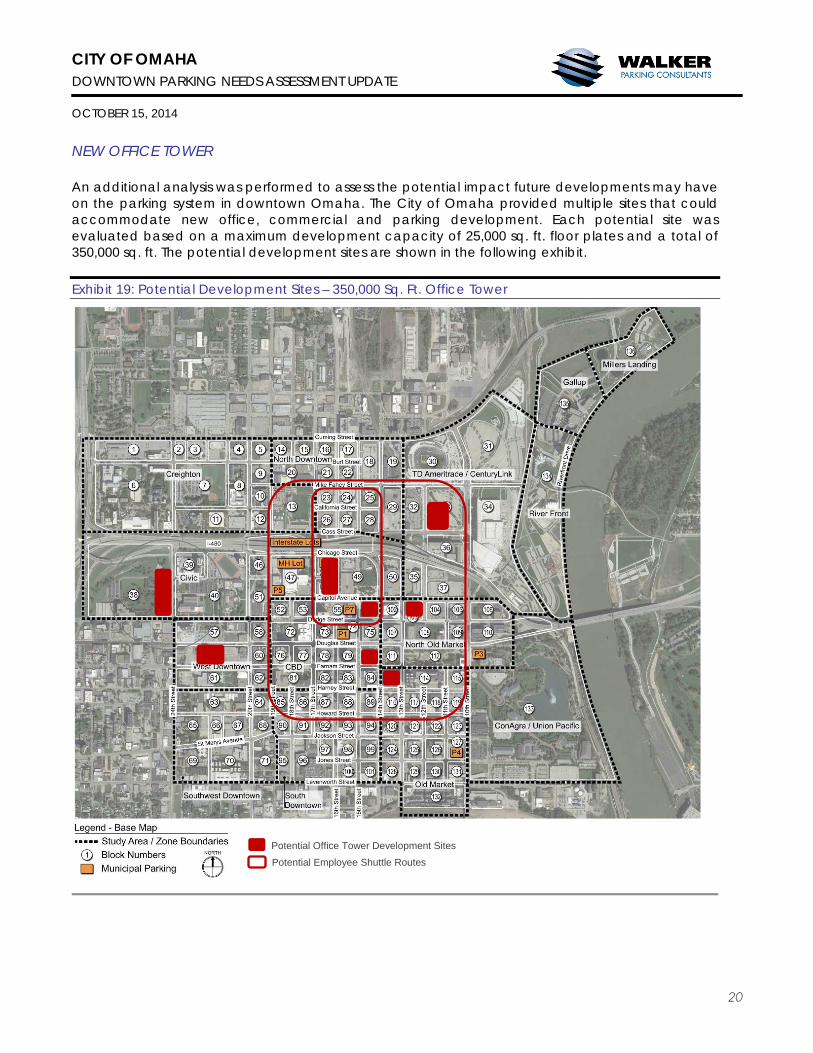
NEW OFFICE TOWER An additional analysis was performed to assess the potential impact future developments may have on the parking system in downtown Omaha. The City of Omaha provided multiple sites that could accommodate new office, commercial and parking development. Each potential site was evaluated based on a maximum development capacity of 25,000 sq. ft. floor plates and a total of 350,000 sq. ft. The potential development sites are shown in the following exhibit. Exhibit 19: Potential Development Sites – 350,000 Sq. Ft. Office Tower
Potential Office Tower Development Sites
Potential Employee Shuttle Routes
CITY OF OMAHA DOWNTOWN PARKING NEEDS ASSESSMENT UPDATE OCTOBER 15, 2014
21
All locations offer opportunities to leverage the existing parking supply and mitigate building new parking.
Peak weekday parking demand is projected at 1,120± spaces. Assumes 95 percent building occupancy rate.
A downtown transit circulator available to all downtown employees could materially increase access to unoccupied parking areas and reduce the need to build structured parking in the near-term.
Sites could accommodate 1,080 to 1,400 structured parking spaces. If an office tower is built at
any of the locations, new on-site parking would likely be built to serve on-site tenants and visitors. Public parking would accommodate any overflow parking needs.
Similar to the projected impact of the 2030 Plan, the parking demand generated by a new
350,000 sq. ft. office tower would increase the occupancy levels of surrounding public parking facilities. However, new on-site parking built to serve an office tower could meet most, if not all of the office parking needs.
