draft noise study report
TRANSCRIPT

DRAFT NOISE STUDY REPORT
West Bay Parkway (CR 388) Segment 2 From SR 79 to SR 77 Bay County, Florida
FPID #424464-3 -22-01
Prepared For: Florida Department of Transportation
District 3 Post Office Box 607
Chipley, Florida 32428
April 2011

i Traffic Noise Analysis Draft Noise Study Report
August 2010
EXECUTIVE SUMMARY
The Florida Department of Transportation is conducting a Project Development and Environment (PD&E) Study along County Road (CR) 388 for the development of roadway improvements from SR 79 to SR 77 in Bay County. The project length is approximately 12.0 miles. The objective of the PD&E Study is to provide documented environmental and engineering analyses which will help the Florida Department of Transportation (FDOT) and the Federal Highway Administration (FHWA) reach a decision on the type, conceptual design, and location of the necessary improvements within the study area to accommodate future transportation needs in a safe and efficient manner. This Noise Study Report (NSR) documents the effect of the proposed project on traffic noise levels. Specifically, the study evaluates the traffic noise levels at the sensitive sites identified during field review, documents predicted noise levels at the sensitive sites, and addresses noise abatement considerations for any noise sensitive site that approaches or exceeds the Noise Abatement Criteria (NAC). The study was prepared in accordance with Title 23 CFR Part 772, Procedures for Abatement of Highway Traffic Noise and Construction Noise and using methodology established by the FDOT in the PD&E Manual, Part 2, Chapter 17 (April 18, 2007). For the Design Year (2035) Build conditions, two noise sensitive sites are predicted to experience traffic noise levels that approach or exceed the NAC. No sites are predicted to experience a substantial increase in traffic noise levels. Both of the impacted sites are single-family homes. Noise abatement measures were considered for the sites predicted to experience traffic noise levels that approach or exceed the NAC. None of the barrier configurations with optimized lengths or heights were found to be potentially feasible and cost reasonable abatement measures for traffic noise impacts attributable to this project. Based on the analysis performed to date, it is estimated that no abatement can be provided for all of the impacted noise sensitive sites while still being in the cost-feasible range. In this evaluation, noise barriers were modeled along the proposed right-of-way of the segments adjacent to the impacted noise sensitive sites. To be considered feasible and cost-reasonable, a noise barrier must provide at least a 5 decibel (using an “A” -scale dBA) reduction to the affected noise sensitive sites at a cost below $42,000 per residence.

ii Traffic Noise Analysis Draft Noise Study Report
August 2010
Table of Contents
Section Title Page 1.0 Introduction .................................................................................................................... 1-1
1.1 Alternatives Considered ....................................................................................... 1-1 1.2 Typical Sections ................................................................................................... 1-4
1.2.1 Suburban Typical Section .............................................................. 1-4 1.2.2 Urban Typical Section .................................................................... 1-4
2.0 Methodology ................................................................................................................... 2-1
2.1 Model and Noise Metrics ..................................................................................... 2-1 2.2 Traffic Data .......................................................................................................... 2-1 2.3 Noise Abatement Criteria .................................................................................... 2-2 2.4 Noise Sensitive Sites ............................................................................................ 2-3 2.5 Noise Abatement Consideration .......................................................................... 2-6
2.5.1 Traffic Management Measures ....................................................... 2-6 2.5.2 Alignment Modification ................................................................. 2-6 2.5.3 Property Acquisition ...................................................................... 2-6 2.5.4 Land Use Controls .......................................................................... 2-6 2.5.5 Noise Barriers ................................................................................. 2-7
3.0 Results ............................................................................................................................. 3-1
3.1 Noise Monitoring ................................................................................................. 3-1 3.2 Predicted Noise Levels ........................................................................................ 3-2
3.2.1 Noise Sensitive Site: State Road 77/CR 388 Intersection .............. 3-2 3.2.2 Noise Sensitive Sites: Burnt Mill Creek ........................................ 3-2 3.2.3 Noise Sensitive Site: Crooked Creek ............................................. 3-2 3.2.4 State Road 79/CR 388 Intersection ................................................ 3-3 3.2.5 Noise Barrier Analysis ................................................................... 3-3
4.0 Conclusions ..................................................................................................................... 4-1 5.0 Public Coordination ....................................................................................................... 5-1 6.0 Construction Noise And Vibration ............................................................................... 6-1 7.0 REFERENCES ............................................................................................................... 7-1

iii Traffic Noise Analysis Draft Noise Study Report
August 2010
List of Figures
Figure Title Page
1-1 Project Location ......................................................................................................... 1-2 1-2 Project Alternatives .................................................................................................... 1-3 1-3 Typical Sections ......................................................................................................... 1-5 2-1 Existing Land Use ...................................................................................................... 2-5
List of Tables
Table Title Page
2-1 Common Noise Levels ............................................................................................. 2-1 2-2 Traffic Table ............................................................................................................. 2-2 2-3 FHWA Noise Abatement Criteria .............................. Error! Bookmark not defined. 2-4 CR 388 Design Year Noise Contours ....................................................................... 2-7 3-1 Noise Monitoring and Model Verification ............................................................... 3-1 3-2 Noise Barrier Evaluation for Receiver R8 ............................................................... 3-3 3-3 Noise Barrier Evaluation for Receiver R9 ............................................................... 3-4 3-4 Noise Barrier Evaluation for Receiver R11 ............................................................. 3-4 3-5 Noise Barrier Evaluation for Receiver R12 ............................................................. 3-4 3-6 Alternatives Involvement with Potential Noise Sensitive Sites ............................... 3-5 3-7 Total Alternative Involvement with Potential Noise Sensitive Sites ....................... 3-5
Appendices
Appendix Title Page
A Predicted Noise Levels ............................................................................................. A-1 B Project Aerials ............................................................................................................B-1

iv Traffic Noise Analysis Draft Noise Study Report
August 2010
List of Acronyms
ADT Average Daily Traffic CR County Road
dB decibels dBA decibels using an “A”-scale FDOT Florida Department of Transportation FHWA Federal Highway Administration NAC Noise Abatement Criteria NSA Noise Study Area NSR Noise Study Report PD&E Project Development and Environment SR State Road TNM Traffic Noise Model

1-1 Traffic Noise Analysis Draft Noise Study Report
August 2010
1.0 INTRODUCTION
This PD&E Study is for the proposed improvements to CR 388 from SR 79 to SR 77. FDOT proposes to name CR 388 from SR 79 to SR 77 and its potential westward extension to SR30 (US 98) in Walton County as the West Bay Parkway. West Bay Parkway, Segment 1 is the section from SR 30 (US 98) in Walton County to SR 79 in Bay County. Segment 1 improvements will be described and evaluated in a separate PD&E Study and are not covered in this report. The proposed improvements to CR 388 from SR 79 to SR 77 covered in this noise report will be referred to as the West Bay Parkway, Segment 2 throughout this document. The project length is approximately 12.0 miles. This area is shown in Figure 1-1. The project proposes to expand the existing two-lane facility to four lanes utilizing both suburban and urban typical sections and a right of way width that varies from 162-169 feet minimum. Beyond capacity improvements, the proposed project includes sidewalks, a multiuse trail, and drainage improvements. This Noise Study Report will provide an analysis of the predicted noise levels for the alternatives through the project area as well as noise abatement considerations for noise sensitive sites impacted by these alignments.
1.1 ALTERNATIVES CONSIDERED
Six viable study alternatives will be further investigated. These alternatives are shown on Figure 1-2.

1-2 Traffic Noise Analysis Draft Noise Study Report
August 2010
Figure 1-1: Project Location

1-3 Traffic Noise Analysis Draft Noise Study Report
August 2010
Figure 1-2: Project Alternatives

1-4 Traffic Noise Analysis Draft Noise Study Report
August 2010
1.2 TYPICAL SECTIONS
1.2.1 Suburban Typical Section
This typical section utilizes a 55 mph design speed within 169’ of right-of-way and includes a 30’ raised median and two 12’ travel lanes with a 5’ paved shoulder along the outside and a 4’ paved shoulder along the median. A 5’ sidewalk is provided on the left side of the roadway and a 12’ multi-use trail is provided on the right side of the roadway. This typical section is shown in Figure 1-3.
1.2.2 Urban Typical Section
This typical section utilizes a 55 mph design speed within 162’ of right-of-way and includes a 30’ raised median and two 12’ travel lanes with 6.5’ bicycle lanes and Type E curb and gutter in each direction. A 5’ sidewalk is provided on the left side of the roadway and a 12’ multi-use trail is provided on the right side of the roadway. The primary difference in typical section widths between the high speed urban and suburban is that the suburban generally uses ditches rather than storm sewer for storm water conveyance, requiring a wider border and overall right-of-way width. This typical section is shown in Figure 1-3.

1-5 Traffic Noise Analysis Draft Noise Study Report
August 2010
Figure 1-3: Typical Sections

2-1 Traffic Noise Analysis Draft Noise Study Report
August 2010
2.0 METHODOLOGY
2.1 MODEL AND NOISE METRICS
The study was prepared in accordance with Title 23 CFR Part 772, Procedures for Abatement of Highway Traffic Noise and Construction Noise1 using methodology established by the FDOT in the PD&E Manual2, Part 2, Chapter 17 (April 2007). Noise levels were predicted using the FHWA Traffic Noise Model (TNM), version 2.5. All measured and predicted noise levels are expressed in decibels (dB) using the A-weighting scale (dBA). This scale most closely approximates the response characteristics of the human ear to traffic noise. Examples of common noise levels are listed in Table 2-1. All noise levels are reported as hourly equivalent noise levels (LAeq1h), which can be compared directly to criteria levels established by FHWA. The LAeq1h is defined as the equivalent steady-state sound level that, in a given hourly period, contains the same acoustic energy as the time-varying sound for the same hourly period. Table 2-1: Common Noise Levels
Noise Source Sound Level (dBA) Subject Impression Jet Aircraft take off 120 Uncomfortably Loud
Heavy Truck/Motorcycle 90 Very Loud Food Blender 90 Very Loud
Lawn Mower/Vacuum 70 Moderately Loud Light Auto Traffic/Dishwasher 50 Quiet
Quiet urban (night/Library 30 Very Quiet Acoustic Test Chamber 10 Just Audible
0 Threshold of Hearing Sources: Synthesized from Texas Department of Transportation, Guidelines for Analysis and Abatement of Highway Traffic Noise, June 1996 (Change1, July 1997) and League for the Hard of Hearing (http://www.lhh.org/noise/decibel.htm)
2.2 TRAFFIC DATA
Traffic noise is heavily dependent on traffic speed, with the amount of noise generated by traffic increasing as the vehicle speed increases. Traffic data for year 2008 and the design year (2035) was reviewed to determine maximum traffic volumes that would allow traffic to flow at speeds consistent with established speed limits. To simulate “worst-case” conditions, Level of Service C or demand traffic volume, whichever is less, was modeled. Traffic volumes used in the analysis are summarized in Tables 2-2.

2-2 Traffic Noise Analysis Draft Noise Study Report
August 2010
Table 2-2: Traffic Table
CR 388 Roadway Segments Average Daily Traffic Speed (miles per hour)Level of Service “C” Demand Year 2008 Existing Condition
CR 388 300' East of SR 79, West Bay 15,100 2,500 55
CR 388 West of Airport Entrance Access 15,100 3,900 55
CR 388 300' West of SR 77 15,100 3,900 55
Year 2035 No Build ConditionsCR 388 300' East of SR 79, West Bay
15,100 31,000 55
CR 388 West of Airport Entrance Access 15,100 38,900 55
CR 388 300' West of SR 77 15,100 38,600 55
Year 2035 Build ConditionsCR 388 300' East of SR 79, West Bay
45,400 31,000 55
CR 388 West of Airport Entrance Access 45,400 38,900 55
CR 388 300' West of SR 77 45,400 38,600 55
Source: West Bay Parkway Draft Traffic Technical Memorandum A peak hour factor (K-factor) of 10.16 percent and a directional factor (D-factor) of 54.99 percent were used to reduce the Average Daily Traffic (ADT) volumes to hourly directional volumes. The hourly volumes were divided into three vehicle classifications (i.e., cars, heavy trucks, and medium trucks). All roadway segments utilized a heavy and medium truck split of 3.87 and 2.66 percent of the hourly vehicle volume respectively.
2.3 NOISE ABATEMENT CRITERIA
The FHWA has established noise levels at which noise abatement must be considered for various categories of noise sensitive sites. These noise levels are referred to as the Noise Abatement Criteria (NAC). As shown in Table 2-3, the NAC vary according to the activity category. Noise abatement measures are considered when predicted traffic noise levels for design year Build conditions approach or exceed the NAC. The FDOT defines “approach” as within 1 dBA of the FHWA criteria.

2-3 Traffic Noise Analysis Draft Noise Study Report
August 2010
Table 2-3: FHWA Noise Abatement Criteria Activity
Category Leq(h) Description of Land Use Activity Category
A 57 (Exterior)
Lands on which serenity and quiet are of extraordinary significance and serve an important public need and where the preservation of those qualities is essential if the area is to continue to serve its intended purpose.
B 67 (Exterior)
Picnic areas, recreation areas, playgrounds, active sports areas, parks, residences, motels, hotels, schools, churches, libraries, and hospitals.
C 72 (Exterior)
Developed lands, properties, or activities not included in Categories A or B.
D -- Undeveloped lands.
E 52 (Interior)
Residences, motels, hotels, public meeting rooms, schools, churches, libraries, hospitals, and auditoriums.
Source: 23 CFR Part 772, Procedures for Abatement of Highway Traffic Noise and Construction Noise, FHWA, 2001. Noise abatement must also be considered when a substantial increase in traffic noise will occur as a direct result of the transportation project. The FDOT defines a substantial increase as an increase of 15 or more dBA above the existing noise level as a direct result of the transportation improvement project in question.
2.4 NOISE SENSITIVE SITES
Noise sensitive sites are any property (owner-occupied, rented, or leased) where frequent human use occurs and where a lowered noise level would be of benefit. The existing land use in the study area (Figure 2-1) is a mix of primarily Residential, Timberland, and Undeveloped Areas. State Road 77/CR 388 Intersection: One residence is located in close proximity to the southwest quadrant of the intersection. The residence is located approximately 450 feet from the middle of the intersection. This single residence is surrounded by forest. This area is shown in Appendix B on sheet 1. Burnt Mill Creek: The area around Burnt Mill Creek adjacent to CR 388 consists of mostly single family residences and timberland. Most all of the residences except for one reside on the east side of Burnt Mill Creek. Residences extend from adjacent to CR 388 to the north for approximately 0.25 mile and to the south for 1.2 miles in this area. This area is shown in Appendix B on sheet 2. Crooked Creek: The area around Crooked Creek adjacent to CR 388 consists of single family residences in the southeast quadrant of the Crooked Creek/CR 388 intersection. Besides one residence in the northeast quadrant, all of the residences are located south of CR 388. The RiverCamps subdivision development, located south of CR 388 between SR 79 and Crooked Creek, is under construction with most of the built areas nearest to SR 79. This area is shown in Appendix B on sheet 3. State Road 79/CR 388 Intersection:

2-4 Traffic Noise Analysis Draft Noise Study Report
August 2010
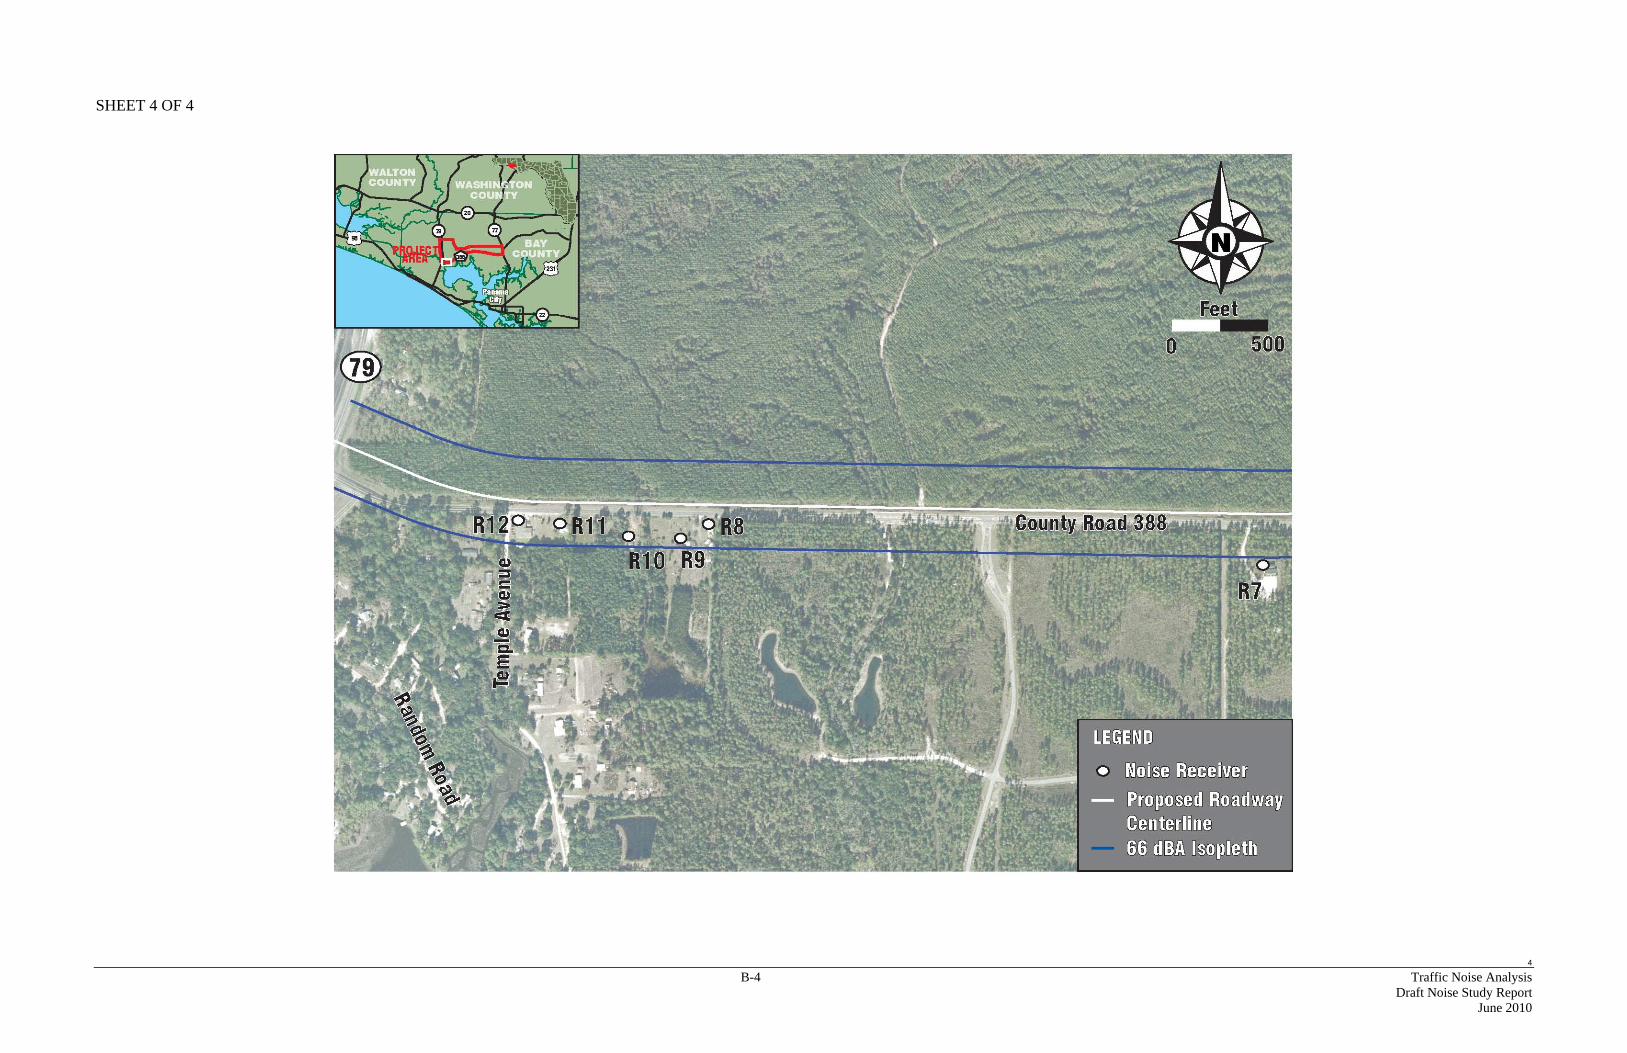
The area around the intersection of SR 79/CR 388 has all of the existing residential development south of CR 388. This area is the location of the most concentrated noise sensitive sites as multiple residences and one church are adjacent to the southern portion of CR 388. This area is shown in Appendix B on sheet 4. In addition to existing noise sensitive sites, a traffic noise evaluation must also consider sites that have been planned, designed and programmed. Consistent with the FDOT PD&E Manual, sites that have been granted a building permit prior to the date of public knowledge (i.e., date that the environmental document has been approved by the FHWA) should be evaluated as existing noise sensitive sites. Though an initial analysis has been completed, a complete land use review will be performed during the design phase to identify noise sensitive sites that may have received a building permit subsequent to this noise study but prior to the date of public knowledge. If the review identifies noise sensitive sites that have been permitted prior to this date, then those sites will be evaluated for traffic noise and abatement considerations at that time. Receiver points representing the noise sensitive sites were located in accordance with the PD&E Manual as follows: • Residential receiver sites were placed at the edges of buildings closest to the major traffic
noise source. • Where more than one noise sensitive site was clustered together, a single receiver site was
analyzed as representative of the group. • Ground floor receiver sites were assumed to be 5 feet above the ground elevation.

2-5 Traffic Noise Analysis Draft Noise Study Report
August 2010
Figure 2-1: Existing Land Use

2-6 Traffic Noise Analysis Draft Noise Study Report
August 2010
2.5 NOISE ABATEMENT CONSIDERATION
As stipulated by 23 CFR 772, noise abatement must be considered at all noise sensitive sites that are predicted to approach/exceed the NAC or where a substantial increase attributable to the project is predicted to occur. Abatement measures to be considered include traffic management measures, alignment modifications, property acquisition, land use controls, and noise barriers.
2.5.1 Traffic Management Measures
As an abatement technique, traffic management measures include modified speed limits or prohibition of certain vehicle types. Modifying the speed limit would reduce the capacity of the New Access Roadway to service forecasted traffic volumes. As a public use corridor used to transport goods and support businesses, prohibiting truck traffic is not a viable option to reduce traffic noise. Therefore, traffic management measures are not considered a feasible abatement technique for this project.
2.5.2 Alignment Modification
Alignment modification involves orientating and/or constructing the roadway at a sufficient distance from the noise sensitive areas so as to minimize traffic noise. Since the preferred alternative was chosen based on improving the existing roadway the ability to provide modifications was limited. Benefits from noise reduction that may occur as a result of a particular alignment modification will be considered along with other environmental, engineering, and cost factors for the selection of the preferred alternative.
2.5.3 Property Acquisition
The acquisition of property to provide noise buffers is not feasible for several reasons, the most prominent being the exorbitant cost of land acquisition. Further development in the area continues to increase making the availability of vacant land in proximity to noise sensitive sites unlikely.
2.5.4 Land Use Controls
Land use controls can be used to minimize traffic noise in future developments or areas where development occurs. As a part of this process, the planning officials can take into account the presence of the New Access Roadway. The distance to the 66 dBA noise contour for the Design Year (2035) Build condition is provided in Table 2-4. Local planning officials can use the noise contour information in an effort to avoid development of noise sensitive land uses on currently undeveloped lands in their study.

2-7 Traffic Noise Analysis Draft Noise Study Report
August 2010
Table 2-4: CR 388 Design Year Noise Contours
Typical Section Distance to the 66 dBA Noise Contour1
Urban 166 feet Suburban 166 feet
1 Distance from the proposed nearest edge of travel lane.
2.5.5 Noise Barriers
Noise barriers reduce noise levels by blocking the sound path between a roadway and a noise sensitive site. To effectively reduce traffic noise, a noise barrier must be relatively long, continuous (with no intermittent openings) and of sufficient height. Noise barriers located along the right-of-way line will be evaluated for heights ranging from 8 to 22 feet in 2-foot increments. For each height, the length of a barrier will be optimized to minimize cost while trying to maintain at least a 5 dBA reduction at noise sensitive sites that have predicted noise levels which approach or exceed the NAC. For a noise barrier to be considered feasible and cost-reasonable, the following minimum conditions should be met: • A noise barrier must provide a minimum noise reduction of at least 5 dBA with a design goal
of 7 dBA or more. • The cost of the noise barrier should not exceed $42,000 per benefited noise sensitive site.
This is the reasonable cost limit established by the FDOT. A benefited noise sensitive site is defined as a site that would experience at least a five dBA reduction as a result of providing a noise barrier. The current unit cost used to evaluate economic reasonableness is $30 per square foot, which covers barrier materials and labor.
Noise barriers were evaluated for each noise study area (NSA) which contains one or more noise sensitive sites with a predicted noise level that approaches or exceeds the NAC for the Design Year (2035) Build conditions, or are predicted to experience a substantial increase in noise levels above Existing conditions. An NSA that provides the greatest possibility for feasible and cost reasonable abatement may be substituted for individual NSA’s. At each potential noise barrier location, the feasibility (i.e., at least a 5 dBA reduction can be achieved) of the proposed barrier will be established. If feasible, then the cost-reasonableness will be evaluated. At some locations, noise barriers may benefit residences with a predicted noise level less than 66 dBA. Since abatement consideration at these residences is not required, noise barrier lengths or heights will not be increased to benefit these sites. However, if benefited because of the proximity to an affected residence, these sites are included when determining cost per benefited noise sensitive site. This methodology is consistent with FHWA guidance. After determining the amount of noise reduction and cost, other factors such as community desires, adjacent land uses, land use stability, antiquity, predicted noise level increases, safety considerations, drainage issues, utility conflicts, maintenance requirements, and construction

2-8 Traffic Noise Analysis Draft Noise Study Report
August 2010
issues may also be considered when evaluating the feasibility and reasonableness of providing noise barriers.

3-1 Traffic Noise Analysis Draft Noise Study Report
August 2010
3.0 RESULTS
3.1 NOISE MONITORING
Noise monitoring was performed on February 18 of 2010, for the purpose of verifying noise predictions generated by TNM. The noise monitoring followed procedures documented in Measurement of Highway-Related Noise3 (FHWA, 1996). Noise measurements were obtained using a Larson Davis 820SLM noise monitor. The monitor was calibrated at 114.0 dB and was checked prior to each monitoring trial by a Larson Davis CAL200 calibrator. All monitoring events were ten minutes in duration consistent with the PD&E Manual. Site selection for the noise monitoring was dependent on the location of noise sensitive sites and access to monitoring sites where traffic data could be simultaneously recorded. Traffic volumes by vehicle classification (i.e., cars, medium trucks, heavy trucks) were documented for each 10-minute monitoring event. Average traffic speeds for each vehicle type were determined by sampling with a radar gun. A noise prediction was generated for each monitoring event using TNM. The predicted and monitored noise levels for each event are provided in Table 3-1. The decibel variance between predicted and measured noise levels at each monitoring site was equal to or less than three dBA. Therefore, the noise model verification was within the accepted level of accuracy documented in FDOT’s PD&E Manual.
Table 3-1: Noise Monitoring and Model Verification
Location Trial # Time/Date*
Field Measured
Level (dBA)
Computer Predicted
Level (dBA)
Decibel Variance
(dBA)
Monitoring Site #1 – North of existing CR 388, 3,550 feet east of the intersection of Airport Road. 50 feet from edge of
pavement
1 3:00 2/18/10 65.5 62.9 2.6 2 3:11 2/18/10 62.5 62.9 0.4 3 3:20 2/18/10 62.8 62.9 0.1
Monitoring Site # 2 – North of existing CR 388, 3,662 feet west of the intersection of Airport Road. 50 feet from edge of
pavement
1 3:48 2/18/10 63.1 62.6 0.5 2 3:59 2/18/10 63.2 62.6 0.6 3 4:10 2/18/10 61.9 62.6 0.7
* Listed in Central Standard Time

3-2 Traffic Noise Analysis Draft Noise Study Report
August 2010
3.2 PREDICTED NOISE LEVELS
Noise levels were predicted at 11 receiver locations representing 10 residences (i.e. single family homes) and 1 church along the project’s alternatives. Predicted noise levels for the modeled noise sensitive sites are provided in Appendix A. The locations of the receivers identified in Appendix A are depicted on the aerials found in Appendix B along with monitoring locations and the 66 dBA isopleths.
3.2.1 Noise Sensitive Site: State Road 77/CR 388 Intersection
One receiver (R1) representing one residence was evaluated in close proximity to the southwest quadrant of this intersection. It was evaluated under Activity Category B of the NAC. Compared to existing conditions, the noise level for the Design Year (2035) Build condition was predicted to increase by 4.5 dBA. Therefore, this site is not expected to experience a substantial increase in traffic noise as a result of the proposed project but will be projected as an impacted site. The noise level at receiver R1 is predicted to approach or exceed the NAC for the Design Year Build condition. Receiver R1 will be included with Alternatives 1, 3, and 6. The predicted noise levels for the receiver representing this noise sensitive site can be found in tabular format in Appendix A.
3.2.2 Noise Sensitive Sites: Burnt Mill Creek
Three receivers representing 3 residences were evaluated to the north and south of CR 388. The residences are single-family homes and were evaluated under Activity Category B of the NAC. Receivers R2 and R4 represent residences located to the south of CR 388 adjacent to Burnt Mill Creek and receiver R3 represents the receiver to the north. Compared to existing conditions, the noise level for the Design Year (2035) Build condition was predicted to increase by 8.6 dBA or less. Therefore, these sites are not expected to experience a substantial increase in traffic noise as a result of the proposed project but will be projected as an impacted site. The noise level at receivers R2, R3, and R4 are predicted to approach or exceed the NAC for the Design Year Build condition. Receivers R2, R3, and R4 will be included in all of the proposed Alternatives. The predicted noise levels for these receivers representing these noise sensitive sites can be found in tabular format in Appendix A.
3.2.3 Noise Sensitive Site: Crooked Creek
Receiver R5 and R6 each represent a single residence located to the south of CR 388. Both receivers were evaluated under Activity Category B of the NAC. The noise level at receivers R5 and R6 are predicted to approach or exceed the NAC for the Design Year Build condition. Compared to existing conditions, the noise level for the Design Year (2035) Build condition is predicted to increase by 8.5 dBA or less for these receivers. Therefore, these sites are not expected to experience a substantial increase in traffic noise as a result of the proposed project.

3-3 Traffic Noise Analysis Draft Noise Study Report
August 2010
The predicted noise levels for these receivers representing these noise sensitive sites can be found in tabular format in Appendix A.
3.2.4 State Road 79/CR 388 Intersection
Receivers R7, R8, R9, R10, R11, and R12 are located south of CR 388 in close proximity to the State Road 79/CR 388 Intersection. Receiver R7 is located approximately 0.9 miles east of the intersection and Receivers R8, R9, R11, and R12 range from 0.25 to 0.40 miles east of the intersection. All of these receivers listed above are single family residences except the church represented by R12. The noise level at these receivers is predicted to approach or exceed the NAC for the Design Year Build condition on all receivers listed above except R7. Compared to existing conditions, the noise level for the Design Year (2035) Build condition is predicted to increase by 10.4 dBA or less for these receivers. Therefore, it is not expected to experience a substantial increase in traffic noise as a result of the proposed project. The predicted noise level for these receivers representing these noise sensitive sites can be found in tabular format in Appendix A.
3.2.5 Noise Barrier Analysis
Noise barrier analysis was not conducted for receivers R7 and R10 as the evaluation requires an uninterrupted noise barrier and this would impede the access to these residences by blocking access to CR 388. Four receivers representing four residences were evaluated to the south of CR 388 in close proximity to the SR 79 and CR 388 intersection. The residences are single-family homes and were evaluated under Activity Category B of the NAC. Noise barrier analysis was conducted in FHWA Traffic Noise Model (TNM), version 2.5. The results of the barrier analysis are provided in Table 3-2 to 3-5. A single, uninterrupted noise barrier for two locations was analyzed. The corresponding noise receivers were identified as R8 and R9, and R11 and R12. These barriers are along the right-of-way (exact location would be determined during the design phase) is predicted to not provide at least a 5 dBA reduction to each receiver of the impacted residences at barrier heights between 8 and 10-feet. Further barrier analysis was not completed because of the cost-feasibility being exceeded. All six viable alternatives were evaluated for barrier analysis.
Table 3-2: Noise Barrier Evaluation for Receiver R8
Barrier Height
(ft)
Barrier Length1
(ft)
Number of Benefited Residences Average Noise
Reduction (dBA)
Total Cost4
Cost per Benefited ResidenceImpacted2 Not
Impacted3 Total
8 300 2* 0 2 4.5 $72,000 $36,00010 300 2* 0 2 5.4 $90,000 $45,000

3-4 Traffic Noise Analysis Draft Noise Study Report
August 2010
1 Variation in the barrier length is a result of optimizing the length for a particular height. 2 Residences with a predicted noise level that approaches or exceeds the NAC. 3 Residences with a predicted noise level that does not approach the NAC. 4 Unit cost of $30 per square foot. * Receivers 8 and 9
Table 3-3: Noise Barrier Evaluation for Receiver R9
Barrier Height
(ft)
Barrier Length1
(ft)
Number of Benefited Residences Average Noise
Reduction (dBA)
Total Cost4
Cost per Benefited ResidenceImpacted2 Not
Impacted3 Total
8 300 2* 0 2 2.9 $72,000 $36,00010 300 2* 0 2 4.1 $90,000 $45,000
1 Variation in the barrier length is a result of optimizing the length for a particular height. 2 Residences with a predicted noise level that approaches or exceeds the NAC. 3 Residences with a predicted noise level that does not approach the NAC. 4 Unit cost of $30 per square foot. * Receivers 8 and 9
Table 3-4: Noise Barrier Evaluation for Receiver R11
Barrier Height
(ft)
Barrier Length1
(ft)
Number of Benefited Residences Average Noise
Reduction (dBA)
Total Cost4
Cost per Benefited ResidenceImpacted2 Not
Impacted3 Total
8 300 2* 0 2 3.8 $72,000 $36,00010 300 2* 0 2 4.1 $90,000 $45,000
2 Residences with a predicted noise level that approaches or exceeds the NAC. 3 Residences with a predicted noise level that does not approach the NAC. 4 Unit cost of $30 per square foot. * Receivers 11 and 12
Table 3-5: Noise Barrier Evaluation for Receiver R12
Barrier Height
(ft)
Barrier Length1
(ft)
Number of Benefited Residences Average Noise
Reduction (dBA)
Total Cost4
Cost per Benefited ResidenceImpacted2 Not
Impacted3 Total
8 300 2* 0 2 3.9 $72,000 $36,00010 300 2* 0 2 4.3 $90,000 $45,000
1 Variation in the barrier length is a result of optimizing the length for a particular height. 2 Residences with a predicted noise level that approaches or exceeds the NAC. 3 Residences with a predicted noise level that does not approach the NAC. 4 Unit cost of $30 per square foot. * Receivers 11 and 12

3-5 Traffic Noise Analysis Draft Noise Study Report
August 2010
Table 3-6: Alternatives Involvement with Potential Noise Sensitive Sites
Receiver Alternatives Impacted Receiver* (Y/N)
R1 1, 3, 6 Y R2 1, 2, 3, 4, 6, 7 Y R3 1, 2, 3, 4, 6, 7 Y
R4** 1, 2, 3, 4, 6, 7 Y R5 1, 2 Y R6 1, 2 Y R7 1, 2 N R8 1, 2 Y R9 1, 2 Y R10 1, 2 Y R11 1, 2 Y R12 1, 2 Y
* Refers to receivers over 66 dba ** Identified as relocation Table 3-7: Total Alternative Involvement with Potential Noise Sensitive Sites
Alternative Total Impacted Receivers*
1 10 2 9 3 3 4 2 6 3 7 2
*Refers to receivers over 66 dba

4-1 Traffic Noise Analysis Draft Noise Study Report
August 2010
4.0 CONCLUSIONS
For the Design Year (2035) No Build conditions, no noise sensitive sites are predicted to experience traffic noise levels that approach or exceed the NAC. Refer to Table 3-7 for the total alternative involvement with the Design Year (2035) Build Alternatives. A land use review will be implemented again during the project’s design phase to identify noise sensitive sites that have received a building permit after August 1, 2010, but prior to the date of public knowledge (i.e., date that the project’s environmental document is approved). If the review identifies noise sensitive sites that have been permitted prior to the date of public knowledge, then the noise sensitive sites will be evaluated for traffic noise and abatement considerations, if needed.

5-1 Traffic Noise Analysis Draft Noise Study Report
August 2010
5.0 PUBLIC COORDINATION
A Public Information Workshop was held on May 13, 2010 at the Woodlawn United Methodist Church 219 North Alf Coleman Road. The workshop was held to present the alternatives being considered and to provide the public with an opportunity to express their views regarding the project. Among the comments received, none were regarding traffic noise. Local officials can promote compatibility between land development and highways. A copy of this report will be provided to local agencies responsible for controlling land use. The 66 dBA noise contour previously described in Section 2.5.4 and other predicted noise levels provided in this report can be used to restrict development of exterior land uses associated with residences, motels, schools, churches and recreational facilities which would be considered incompatible with traffic noise generated from the preferred alternative for the proposed improvement. Local officials can use the noise contour data to establish compatible development of currently undeveloped parcels or compatible redevelopment in areas where land use changes.

6-1 Traffic Noise Analysis Draft Noise Study Report
August 2010
6.0 CONSTRUCTION NOISE AND VIBRATION
Construction of roadway improvements may have a temporary impact on noise-sensitive sites adjacent to the project corridor. Trucks, earth moving equipment, pumps, and generators are sources of construction noise and vibration. Construction noise and vibration impacts will be minimized by adherence to the FDOT Standard Specifications for Road and Bridge Construction.

7-1 Traffic Noise Analysis
Draft Noise Study Report June 2010
7.0 REFERENCES
1. Title 23 CFR Part 772, Procedures for Abatement of Highway Traffic Noise and
Construction Noise; Federal Highway Administration; May 2005. 2. PD&E Manual, Part 2, Chapter 17, Florida Department of Transportation; Tallahassee,
Florida; April 2007. 3. Measurement of Highway-Related Noise; Federal Highway Administration; Springfield,
VA; May 1996.

APPENDICES

APPENDIX A PREDICTED NOISE LEVELS

1
A-1 Traffic Noise Analysis
Draft Noise Study Report August 2010
CR 388 SEGMENT TWO PREDICTED NOISE LEVELS
Receiver Identification
2010 Existing (dBA)
2035 No-Build (dBA)
2035 Build (dBA)
Difference between Existing
and Build (dBA)
Site to be Considered for
Abatement?
State Road 77/CR 388 Intersection R1 63.3 63.3 67.8 4.5 Yes
Burnt Mill Creek R2 63.3 63.3 71.9 8.6 Yes R3 63.3 63.3 71.3 8.0 Yes R4* 63.3 63.3 71.5 8.2 Yes
Crooked Creek R5 62.7 62.7 69.9 7.2 Yes R6 62.7 62.7 71.2 8.5 Yes
State Road 79/CR 388 Intersection R7 62.7 62.7 63.7 1.0 No R8 62.7 62.7 73.1 10.4 Yes R9 62.7 62.7 68.5 5.8 Yes R10 62.7 62.7 69.1 6.4 Yes R11 62.7 62.7 72.0 9.3 Yes R12 62.7 62.7 73.1 10.4 Yes
*Identified as relocation

1
APPENDIX B PROJECT AERIALS

1
B-1 Traffic Noise Analysis Draft Noise Study Report
June 2010
SHEET 1 OF 4

2
B-2 Traffic Noise Analysis Draft Noise Study Report
June 2010
SHEET 2 OF 4

3
B-3 Traffic Noise Analysis Draft Noise Study Report
June 2010
SHEET 3 OF 4
4
B-4 Traffic Noise Analysis Draft Noise Study Report
June 2010
SHEET 4 OF 4