draft -fiswg - face recognition systems operation
TRANSCRIPT

1
Disclaimer: 2
3 As a condition to the use of this document and the information contained herein, the 4 Facial Identification Scientific Working Group (FISWG) requests notification by e-mail 5 before or contemporaneously to the introduction of this document, or any portion 6 thereof, as a marked exhibit offered for or moved into evidence in any judicial, 7 administrative, legislative, or adjudicatory hearing or other proceeding (including 8 discovery proceedings) in the United States or any foreign country. Such notification 9 shall include: 1) the formal name of the proceeding, including docket number or similar 10 identifier; 2) the name and location of the body conducting the hearing or proceeding; 11 and 3) the name, mailing address (if available) and contact information of the party 12 offering or moving the document into evidence. Subsequent to the use of this document 13 in a formal proceeding, it is requested that FISWG be notified as to its use and the 14 outcome of the proceeding. Notifications should be sent to: [email protected] 15
Redistribution Policy: 16
FISWG grants permission for redistribution and use of all publicly posted documents 17 created by FISWG, provided that the following conditions are met: 18
Redistributions of documents, or parts of documents, must retain the FISWG cover 19 page containing the disclaimer. 20
Neither the name of FISWG, nor the names of its contributors, may be used to endorse 21 or promote products derived from its documents. 22
Any reference or quote from a FISWG document must include the version number (or 23 creation date) of the document and mention if the document is in a draft status. 24

Version 1.0 2021.05.28
FISWG Face Recognition Systems Operation Assurance: Image Quality Assessment 1
This document includes a cover page with the FISWG disclaimer
25
Purpose 26
This document provides guidelines and techniques to help administrators of automated 27
face recognition systems (FRS) produce advanced and accurate recognition statistics on 28
the face recognition systems. 29
The intended audience of this document is system owners, system users, and system 30
administrators of existing automated face recognition systems. Outside the scope of this 31
document are include, but not necessarily limited to system setup, system tuning, 32
workflow management and improvement, and proof of concept pilots. 33
This document is a follow on from the FISWG documents: 34
• “Understanding and Testing for Face Recognition Systems Operation Assurance” 35
• “Face Recognition Systems Operation Assurance: Identity Ground Truth” 36
The issues presented in this document form a base for other considerations and 37
advanced topics when testing (e.g., system setup and tuning) which will be covered in 38
future FISWG documents. 39
1. Scope 40
1.1 The scope of this document is to provide a detailed process and examples of 41
Face Recognition Systems Operation Assurance: Image Quality Assessment

Version 1.0 2021.05.28
FISWG Face Recognition Systems Operation Assurance: Image Quality Assessment 2
This document includes a cover page with the FISWG disclaimer
how testing for variations in facial image quality can be used in adjusting operational 42
workflows. Testing for and verifying scoring variations when image quality varies is key 43
so that facial search system workflows can be properly adjusted. 44
2. Referenced Documents 45
2.1 ANSI/NIST-ITL Standard Homepage: 46
http://www.nist.gov/itl/iad/ig/ansi_standard.cfm 47
2.2 P. Grother, M. Ngan, K. Hanaoka “NISTIR 8271 DRAFT SUPPLEMENT Face 48
Recognition Vendor Test (FRVT) Part 2: Identification” 49
https://pages.nist.gov/frvt/reports/1N/frvt_1N_report.pdf 50
3. Terminology 51
3.1 Definitions: 52
3.1.1 doppelganger, n–an apparition or double of a living person. 53
3.1.2 false accept rate, n–see definition false match rate definition. 54
3.1.3 false match rate, n–the proportion of the completed biometric non-mated 55
comparison trials that result in a false match. This is also referred to as false acceptance 56
rate and does not include errors from images which do not create valid templates. 57
3.1.4 false non-match rate. n–the proportion of the completed biometric mated 58
comparison trials that result in a false non-match. This is also referred to as false reject 59
rate and does not include errors from images which do not create valid templates. 60

Version 1.0 2021.05.28
FISWG Face Recognition Systems Operation Assurance: Image Quality Assessment 3
This document includes a cover page with the FISWG disclaimer
61
62
63
64
65
66
67
68
69
3.2 Acronyms:
3.2.1 CMC–cumulative match characteristic
3.2.2 DET–detection error tradeoff
3.2.3 FAR–false accept rate
3.2.4 FMR–false match rate
3.2.5 FNMR–false non-match rate
3.2.6 FR–facial recognition
3.2.7 FRR–false reject rate
3.2.8 FRS–facial recognition system
3.2.9 ROC–receiver operating characteristics 70
4. Background71
4.1 When doing accuracy profiling, a critical step is to understand how image quality 72
affects the processing of the imagery to be enrolled or searched. Regardless of the 73
specific facial biometric algorithm used, there will be some facial imagery which causes 74
facial localization errors which then produce biometric templates of no operational value. 75
4.2 Most of the work in these processes is on creating the testing frameworks and 76
understanding how to repeatedly run tests, make corrections, and do retesting with what 77
has been learned. Once the frameworks and the processing are understood, then the 78
agency can make diligent progress, but it takes time and focus. The outcomes are worth 79
the time spent as you begin to understand how the data interacts with the algorithms 80
which give the agency the ability to trust the solution and not just assume the data is 81
invalid. 82

Version 1.0 2021.05.28
FISWG Face Recognition Systems Operation Assurance: Image Quality Assessment 4
This document includes a cover page with the FISWG disclaimer
4.3 Setting up frameworks to do enrollment and searching recording results is fairly 83
mechanical as you learn the facial algorithms and the data sets to develop proper 84
profiling. Understanding the data and building frameworks to analytically qualify the 85
results is not trivial but must be done so effective operational metrics can be derived and 86
applied. 87
5. Data Set 88
5.1 Care should be taken in selecting data sets to profile. It is recommended to 89
select data sets which: 90
5.1.1 Have operational relevancy; 91
5.1.2 Have consistent image quality aspects: type of capture, size of images, subject 92
poses, etc.; 93
5.1.3 Have sufficient identities and images to test with. This decision will be agency 94
specific; and 95
5.1.4 Include associated identity truth information. 96
5.2 The data set used for this document is the Labeled Faces in the Wild (LFW) data 97
set available at: http://vis-www.cs.umass.edu/lfw/ See section “LFW Data Set 98
Information” at http://vis-www.cs.umass.edu/lfw/#information and the referenced 99
paragraph 2.2 document (NISTIR 8271 DRAFT SUPPLEMENT Face Recognition Vendor 100
Test (FRVT) Part 2: Identification) for more information. Conceptually any other facial 101
data set with identity ground truth can be used. 102

Version 1.0 2021.05.28
FISWG Face Recognition Systems Operation Assurance: Image Quality Assessment 5
This document includes a cover page with the FISWG disclaimer
5.3 LFW is a widely used open source data set which will work well for this specific 103
document. Information on this data set includes: 104
5.3.1 Has smaller but consistent image sizes and file formats; 105
5.3.2 Has over 5,700 identities and over 13,000 images; 106
5.3.3 Has a wide range of subjects: sex, pose, lighting, etc.; and 107
5.3.4 Has stated identity ground truth errors. 108
6. Image Quality Assessment Process 109
6.1 Step 1 - Ensure the data set to use has verified ground truth. 110
6.2 Step 2 - Extract the facial image quality from all images to enroll and search. 111
The image quality metrics to use will be vendor dependant. Care should be taken to 112
select the quality metric(s) which have the largest value in doing an image quality 113
assessment. Vendor specific quality metrics will have different numeric ranges and will 114
have vendor specific usability ranges. Consulting with the provider of the facial algorithm 115
is recommended. 116
6.3 Step 3 - Enroll the facial images into a facial gallery for searching. 117
6.4 Step 4 - Search the facial images against the facial gallery. The number of 118
candidates returned for this document was 50. This number may vary with agency 119
specifics. Do not use any scoring thresholds. 120
6.5 Step 5 - Segment facial search results based on the facial image quality of the 121
probe. 122
6.6 Step 6 - For each segmentation group of the search results plot the biometric 123
performance results and compare them. This document uses these plots: 124

Version 1.0 2021.05.28
FISWG Face Recognition Systems Operation Assurance: Image Quality Assessment 6
This document includes a cover page with the FISWG disclaimer
6.6.1 FAR: False accept scoring 125
6.6.2 FRR: False reject scoring 126
6.6.3 DET: Detection error tradeoff 127
6.6.4 CMC: Cumulative Match Curve 128
6.7 Step 7: Determine if targeted image quality assessments can be done before 129
enrollment or searching to see if improper facial localization has occurred which caused 130
facial templates to be created which were of no operational value and should have either 131
been manually reviewed or simply not processed. 132
7. Image Quality Assessment Process Step Outputs 133
7.1 Step 2 Outputs: 134
7.1.1 When this was done with the LFW data set the following facial metrics were 135
recorded: 136
137 Figure 1: LFW Interpupillary Distance (pixels) 138
0200400600800
10001200140016001800
1 3 5 7 9 11 13 15 17 19 21 23 25 27 29 31 33 35 37 39 41 43 45 47 49M
ore
Freq
uenc
y
IPD
LFW IPD Histogram

Version 1.0 2021.05.28
FISWG Face Recognition Systems Operation Assurance: Image Quality Assessment 7
This document includes a cover page with the FISWG disclaimer
139 Figure 2: LFW Quality (linear Y axis) 140
141
142 Figure 3: LFW Quality (logarithmic Y axis) 143
0100200300400500600700800900
-90
-60
-30 0 30 60 90 120
150
180
210
240
270
300
330
360
390
420
450
480
Mor
e
Freq
uenc
y
Quality
LFW Quality Histogram
1
10
100
1000
-90
-60
-30 0 30 60 90 120
150
180
210
240
270
300
330
360
390
420
450
480
Mor
e
Freq
uenc
y
Quality
LFW Quality Histogram

Version 1.0 2021.05.28
FISWG Face Recognition Systems Operation Assurance: Image Quality Assessment 8
This document includes a cover page with the FISWG disclaimer
7.1.2 The LFW images were then enrolled and searched. Based on the image quality 144
histograms three segments were selected: 145
7.1.2.1 All search results 146
7.1.2.2 All searches with a quality less than 0 147
7.1.2.3 All searches with a quality between 0 and 100 148
7.1.2.4 All searches with a quality greater than 100 149
7.2 Step 6 Outputs: 150
7.2.1 Once the accuracy plots were created, they could be analyzed. 151
7.2.2 FAR and FRR were analyzed first. 152
FAR
Threshold 153
Figure 4: LFW FAR Imposter Scores (logarithmic Y axis) 154
Version 1.0 2021.05.28
FISWG Face Recognition Systems Operation Assurance: Image Quality Assessment 9
This document includes a cover page with the FISWG disclaimer
FRR
Threshold 155
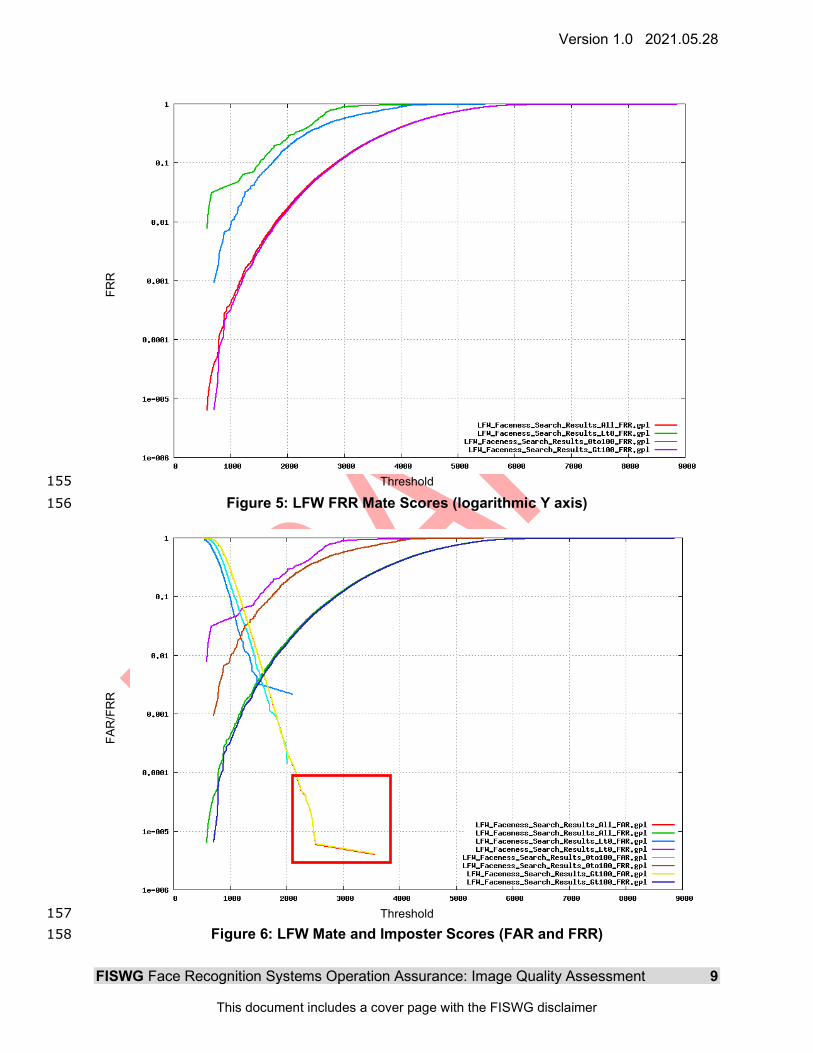
Figure 5: LFW FRR Mate Scores (logarithmic Y axis) 156
FAR
/FR
R
Threshold 157
Figure 6: LFW Mate and Imposter Scores (FAR and FRR) 158
Version 1.0 2021.05.28
FISWG Face Recognition Systems Operation Assurance: Image Quality Assessment 10
This document includes a cover page with the FISWG disclaimer
7.2.3 Notes on Step 6 FAR and FRR analysis: 159
7.2.3.1 The overall imposter (FAR) scoring in Figures 4 and 6 was relatively 160
consistent regardless of probe image quality with high values of ~2500. 161
7.2.3.2 The higher imposter (FAR) scoring in Figures 4 and 6 (red box) was due to 162
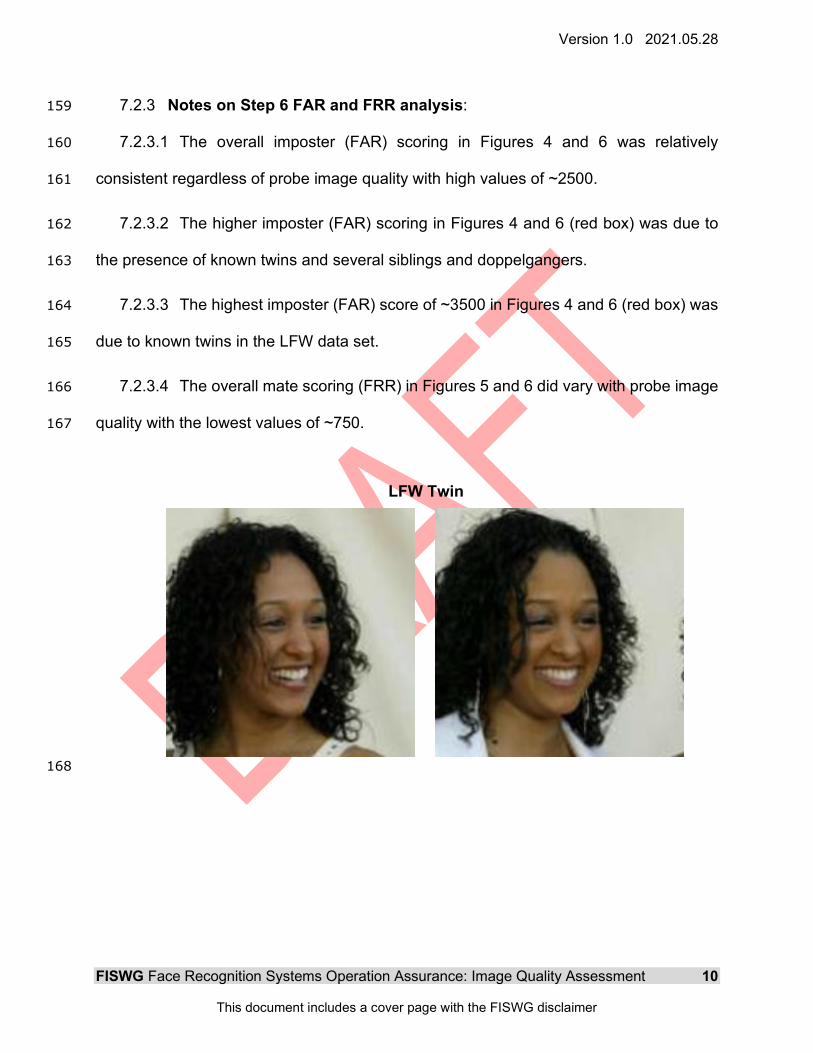
the presence of known twins and several siblings and doppelgangers. 163
7.2.3.3 The highest imposter (FAR) score of ~3500 in Figures 4 and 6 (red box) was 164
due to known twins in the LFW data set. 165
7.2.3.4 The overall mate scoring (FRR) in Figures 5 and 6 did vary with probe image 166
quality with the lowest values of ~750. 167
LFW Twin
168

Version 1.0 2021.05.28
FISWG Face Recognition Systems Operation Assurance: Image Quality Assessment 11
This document includes a cover page with the FISWG disclaimer
LFW High Scoring Imposters
The images above are siblings
The images above are doppelgangers
169
Version 1.0 2021.05.28
FISWG Face Recognition Systems Operation Assurance: Image Quality Assessment 12
This document includes a cover page with the FISWG disclaimer
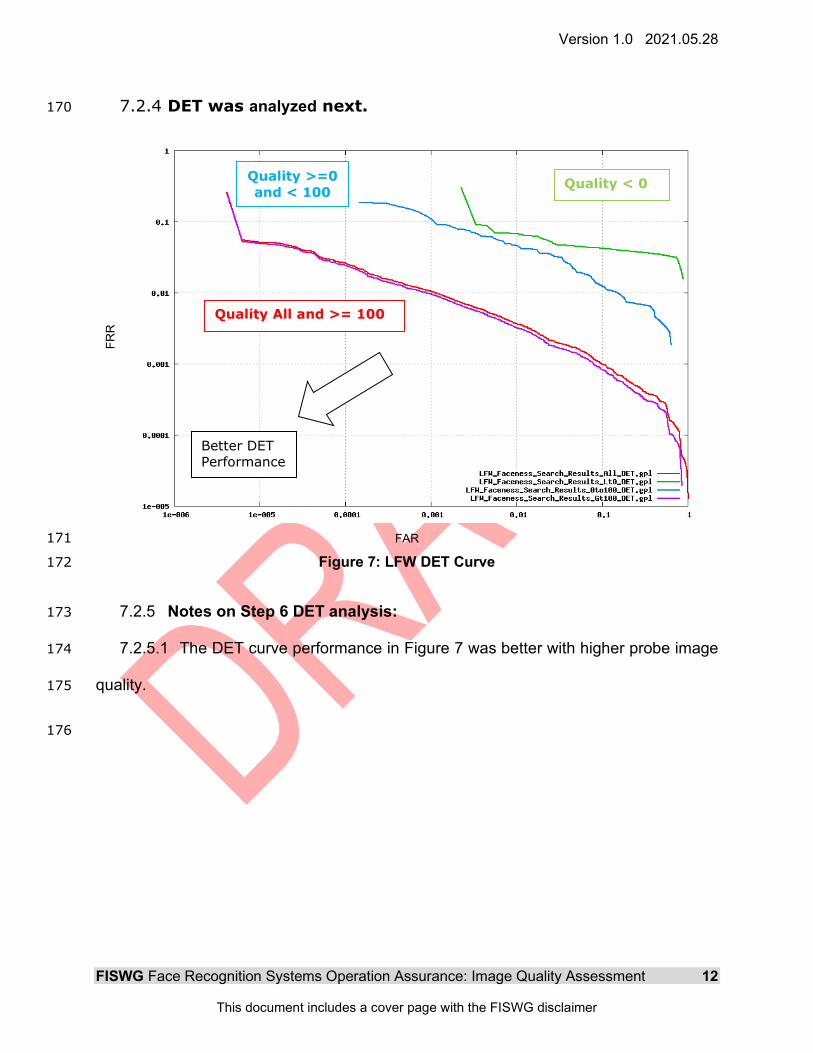
7.2.4 DET was analyzed next. 170 FR
R
FAR 171
Figure 7: LFW DET Curve 172
7.2.5 Notes on Step 6 DET analysis: 173
7.2.5.1 The DET curve performance in Figure 7 was better with higher probe image 174
quality. 175
176
Better DET Performance
Quality All and >= 100
Quality < 0 Quality >=0 and < 100

Version 1.0 2021.05.28
FISWG Face Recognition Systems Operation Assurance: Image Quality Assessment 13
This document includes a cover page with the FISWG disclaimer
7.2.6 CMC was analyzed next. 177
178
Iden
tific
atio
n R
ate
Rank 179
Figure 8: LFW CMC Curve 180
7.2.7 Notes on Step 6 CMC analysis: 181
7.2.7.1 The CMC curve performance in Figure 8 was better with higher probe image 182
quality. 183
7.2.8 Perhaps the largest outcome of this testing is presented in the CMC curves and 184
can be described as follows: 185
7.2.8.1 The lowest image quality plots (< 0) have a 100% CMC point at a search 186
results candidate of ~27. 187
7.2.8.2 The medium image quality plots (>= 0 and < 100) has a 100% CMC point at 188
Quality < 0 Quality >=0 and < 100
Quality All and >= 100
Better CMC Performance

Version 1.0 2021.05.28
FISWG Face Recognition Systems Operation Assurance: Image Quality Assessment 14
This document includes a cover page with the FISWG disclaimer
a search results candidate of ~13. 189
7.2.8.3 The highest image quality plots (>= 100) has a 100% CMC point at a search 190
results candidate of ~10. 191
7.2.8.4 So, in order to achieve the 100% CMC point for all image quality variations 192
the number of candidates a human examiner must review is ~27. 193
7.2.8.5 If the overall image quality can be improved through proper image quality 194
assessment during enroll and searching, then it would be possible to lower number of 195
candidates a human examiner must review to achieve a desired 100% CMC point. 196
7.3 Step 7 Outputs: 197
7.3.1 The search probes where then analyzed to locate low quality imagery so the 198
candidate lists returned could be reviewed to see if any mates were returned. 199
This probe had 51 mates in the gallery. Only one was returned at rank 3. The probe quality was -186.
Version 1.0 2021.05.28
FISWG Face Recognition Systems Operation Assurance: Image Quality Assessment 15
This document includes a cover page with the FISWG disclaimer
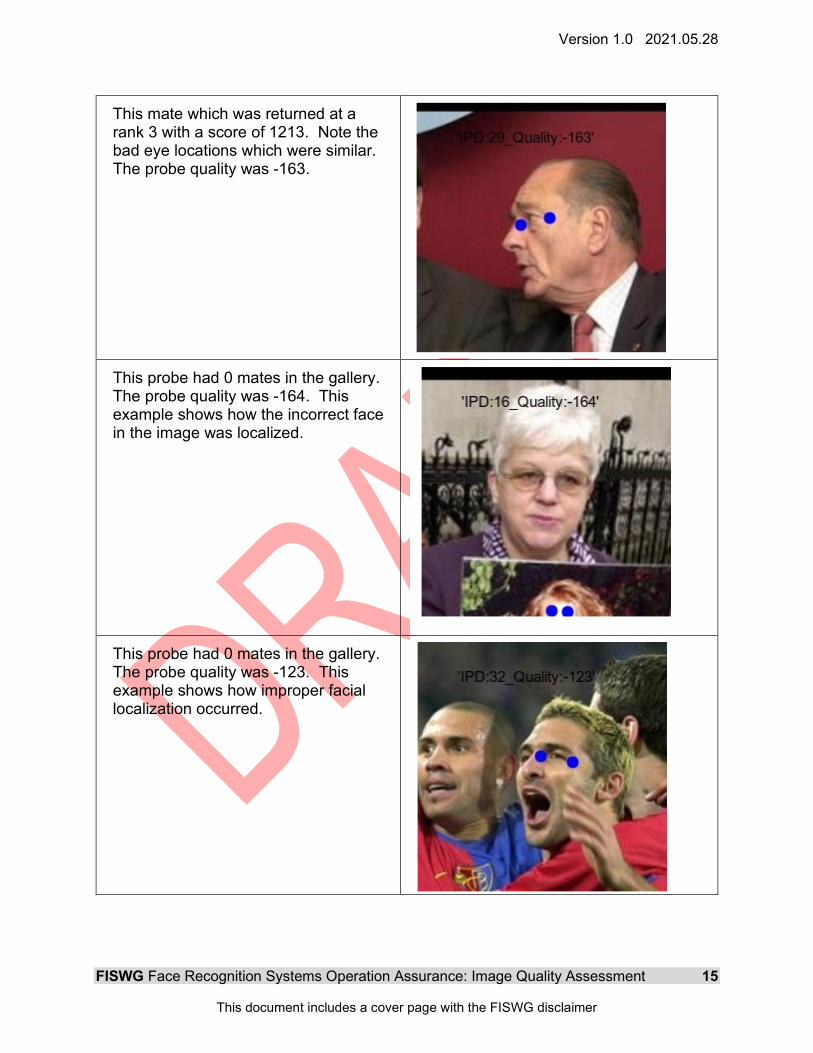
This mate which was returned at a rank 3 with a score of 1213. Note the bad eye locations which were similar. The probe quality was -163.
This probe had 0 mates in the gallery. The probe quality was -164. This example shows how the incorrect face in the image was localized.
This probe had 0 mates in the gallery. The probe quality was -123. This example shows how improper facial localization occurred.

Version 1.0 2021.05.28
FISWG Face Recognition Systems Operation Assurance: Image Quality Assessment 16
This document includes a cover page with the FISWG disclaimer
This probe had 7 mates in the gallery. Only two were returned. The probe quality was -84.
This mate which was returned at a rank 26 with a score of 575.
This probe had 530 mates in the gallery. No mates were returned. The probe quality was -19.

Version 1.0 2021.05.28
FISWG Face Recognition Systems Operation Assurance: Image Quality Assessment 17
This document includes a cover page with the FISWG disclaimer
This probe had 8 mates in the gallery. No mates were returned. The probe quality was 22.
8. Image Quality Assessment Outcomes 200
8.1 Based on this data set and the testing process documented here: 201
8.1.1 Facial search performance is affected by facial image quality which will be 202
vendor dependent. Various image quality metrics needed to be analyzed to profile the 203
facial image quality into specific ranges of interest. 204
8.1.2 The ability to segment search results based on facial image quality is shown. 205
8.1.3 Mates and imposter scoring profiles can change with mates being more 206
susceptible to image quality issues. 207
8.1.4 FAR, FRR, DET and CMC curves were utilized in these processes. 208
8.1.5 How the facial image quality scoring and resultant operational ramifications 209
need to be profiled to properly locate low scoring mates in search results which have 210
lower image quality. 211
8.1.6 Detecting and correcting low quality facial imagery which could be manually 212
corrected could improve overall facial accuracy. 213
8.1.7 Enrolling and searching all facial imagery without attention to image quality will 214

Version 1.0 2021.05.28
FISWG Face Recognition Systems Operation Assurance: Image Quality Assessment 18
This document includes a cover page with the FISWG disclaimer
negatively affect facial workflows. 215
FISWG documents can be found at: www.FISWG.org 216