draft economic development strategic plan for … ca draft . economic development strategic plan...
TRANSCRIPT

FEBRUARY 2017
ECONOMIC DEVELOPMENT STRATEGIC PLAN ROSAMOND, CA
DRAFT

ROSAMOND, CA DRAFT
ECONOMIC DEVELOPMENT STRATEGIC PLAN PAGE | I
ACKNOWLEDGEMENTS TIP Strategies would like to thank the many individuals who participated in the creation of this Economic Development Strategic Plan. We are especially grateful to the community and business leaders in Rosamond who contributed their time and input throughout this planning process. Their expertise helped us gain a deep understanding of the community’s assets and opportunities. We are also thankful for the US Department of Defense Office of Economic Adjustment for their visionary investments and support which helped make this project a reality. We also want to thank the leadership and staff of Kern County and the Kern EDC for their essential support, guidance, and feedback during the development of this plan.
MOJAVE KEY STAKEHOLDERS
This is an incomplete list and will need to be completed before the document is finalized and released.
KERN COUNTY PROJECT TEAM
TIP STRATEGIES CONSULTING TEAM
CHABIN CONCEPTS CONSULTING TEAM
Dennis Shoffner, Civic Outreach Director, Edwards Public Affairs Edwards Air Force Base
Michelle R. Perry, Base Community Planner, 412th Civil Engineer Group Edwards Air Force Base
Bill Deaver Edwards Community Alliance
Danny A. Bazzell, General Manager Flight Test Museum
Name, Title Organization
Name, Title Organization
Name, Title Organization
Supervisor Zach Scrivner, Chairman of the Kern County Board of Supervisors & 2nd District Supervisor Teresa Hitchcock, Assistant County Administrative Officer for Policy & Economic Development Thomas Brown, Administrative Analyst Richard Chapman, President & CEO, Kern Economic Development Corporation Ryan Rush, Field Representative, Office of Supervisor Zach Scrivner
Tom Stellman, President/CEO John Karras, Senior Consultant Meredith Eberle, Project Support
Audrey Taylor, President & CEO Vicki Doll, Principal Fawn McLaughlin, Principal, FJMcLaughlin & Associates

ROSAMOND, CA DRAFT
PAGE | II
CONTENTS ECONOMIC DEVELOPMENT STRATEGIC PLAN............................................................................................ 1
INTRODUCTION ................................................................................................................................... 1 2017-2021 IMPLEMENTATION ............................................................................................................... 3 2017 IMPLEMENTATION, ROSAMOND STRATEGY .................................................................................. 4 30-60-90 DAY LAUNCH SCHEDULE ...................................................................................................... 10
APPENDIX A: ECONOMIC ASSESSMENT & SWOT ANALYSIS .................................................................... 11 SWOT ANALYSIS ............................................................................................................................... 11 BUSINESS, INDUSTRY, & EMPLOYMENT TRENDS ................................................................................... 12 WORKFORCE TRENDS & CHARACTERISTICS ......................................................................................... 22 COMMUTING PATTERNS..................................................................................................................... 27
Image Credits: Cover image courtesy Edwards Airforce Base.

ROSAMOND, CA DRAFT
ECONOMIC DEVELOPMENT STRATEGIC PLAN PAGE | 1
ECONOMIC DEVELOPMENT STRATEGIC PLAN
INTRODUCTION
Kern County and community leaders in the unincorporated community of Rosamond, California completed a visioning effort for the community’s downtown business area in 2011. The project area is bordered by Rosamond Boulevard (north), Orange Street (south), 20th Street (west), and Sierra Highway (east).
The three-month project built on previous countywide planning processes. The Rosamond vision planning process consisted of stakeholder interviews followed by a daylong workshop and design charrette. The draft Vision Plan was presented at a second workshop in June and the final document, Rosamond Downtown Business District Community Vision Plan, was presented to the community in July 2011.
In 2014, Kern County applied for and received funding from the Department of Defense’s Office of Economic Adjustment for an economic diversification study intended to guide investment in the east county area. Besides a regional East Kern Economic Diversification Plan, the project included an economic development strategy for each of the participating communities, Rosamond among them.
Rather than start anew and to make the best use of the grant funds and community members’ time, the consulting team proposed—and the County and community agreed—that the best approach was to revisit and update the 2011 Rosamond Downtown Business District Community Vision Plan.
From July through September, the consulting team met individually and with groups to:
discuss and update the status of each of the recommended action items in the 2011 Vision Plan;
confirm that the vision and goals are still valid; and
prioritize unfinished and/or new projects.
2016 REAFFIRMATION OF ROSAMOND VISION
The following characteristics, taken directly from the 2011 Rosamond Downtown Business District Community Vision Plan (page 3-1), summarize the community’s vision for the project area and were affirmed by community members in 2016.
LAND USE AND CHARACTER
Restaurant Row: add café seating facing the town square.
INFRASTRUCTURE AND CIRCULATION IMPROVEMENTS
Enhance pedestrian connections: expand opportunities for safe routes to schools and future connections to regional trail networks.
PROJECTS AND BIG IDEAS
Create a gathering place: divert Diamond Street to a square, playhouse, and plaza.

ROSAMOND, CA DRAFT
ECONOMIC DEVELOPMENT STRATEGIC PLAN PAGE | 2
PROGRAMS AND POLICIES
Enhance residential streetscape: implement a fencing program for all residential properties.
SITUATIONAL ANALYSIS
The following findings are taken from the 2011 visioning project, 2016 site visits, focus groups, community meetings, and personal interviews.
There is a lack of available and improved land to accommodate future growth; less than 10% of Kern County land is available for development.
Kern County’s population is forecasted to reach 1 million by 2020. Rosamond’s population is expected to increase by 3.6% by 2020.
Desired physical and policy improvements to downtown are safety-related as well as economic. Improvements in the 2011 and 2017 plans include sidewalks and curbs, street lighting, parking, traffic calming, improved building facades, landscaping, parks, and education programs.
Desired additions to downtown include places for youth and community gatherings (farmer markets, festivals, concerts, etc.), and hometown retailers (small movie theatre, shops).
Challenges in the business district include the recent increase of medical marijuana dispensaries, limited visibility of downtown business district to draw travelers, ability to increase tax revenue, business leakage to Lancaster, and vacant land.
There is a significant opportunity to capitalize on the commuter traffic (to/from EAFB, Lancaster, Palmdale, greater Los Angeles) by developing new retail, restaurants, and housing in Rosamond.

ROSAMOND, CA DRAFT
ECONOMIC DEVELOPMENT STRATEGIC PLAN PAGE | 3
2017-2021 IMPLEMENTATION
Given that Rosamond has no dedicated staff and very limited resources, community organizations and volunteers made excellent progress on the 2011 Vision Plan. Two of the highest priority items—street lighting and diagonal parking—were accomplished. Many other projects are underway.
Rosamond depends heavily on community-minded volunteers and the County of Kern to complete the priority projects and enact and enforce policy. The action items presented here are intended to help Rosamond volunteers and community organizations work cooperatively with County elected officials and staff to continue moving forward towards the downtown vision established in 2011, an improved business climate, and expanded economic opportunities.
The following pages outline the projects that were identified as priority (within 5 years) in the 2011 Rosamond Vision Plan. This 2017 implementation plan documents the accomplishments that have been made to date and lists the actions recommended for 2017. These implementation actions are in keeping with the original 2011-2021 Vision Plan and the priorities that were agreed upon at the July 2016 Rosamond community meeting (listed below).
Lighting on Diamond Street
Enforced speed limit on Diamond Street
Regulate medical marijuana dispensaries
Skateboard park
Youth Center on C Street
National Main Street Program
Code Compliance
Downtown Zoning
Attention from KEDC on industrial development
Bank/Financial Institution
Restrooms at community center on Diamond Street

ROSAMOND, CA DRAFT
ECONOMIC DEVELOPMENT STRATEGIC PLAN PAGE | 4
2017 IMPLEMENTATION, ROSAMOND STRATEGY
Each of the 2011 actions are accompanied by documentation of their original priority as assigned in 2011, progress from 2011 to 2016, and any new activities needed to move the actions forward in 2017. The following symbols are used to provide an at-a-glance description of the status for each action:
2011-16 STATUS No Activity Completed Underway
2017 ACTIONS Actions Assigned No Actions Required
ACTION 1: Establish a unified wayfinding signage plan.
2017 ACTION ITEMS
Continue conversations with County offices and reinforce Rosamond’s interest in a wayfinding signage plan.
ACTION 2: Design and establish a central pedestrian plaza with amenities.
A $10,000 grant from the RenewBiz program and community equipment donations built a stage. Rosamond is currently pursuing a $1 million grant for a covered outdoor community center and a venue to host events, farmers markets, concerts, etc. The facilities will be located on the Chamber-owned lot next to their office. Rosamond will need County assistance to maintain the park.
2017 ACTION ITEMS
Upon successful grant award, work with the County to develop and issue an RFP for site and building plans and construction.
Reach an agreement with the County to maintain the park.
ACTION 3: Incorporate parks and recreation (gym, swimming pool).
Rosamond Community Services Water District opened the swim park for the 2016 summer season (May through August).
2017 ACTION ITEMS
Meet with Water District to determine their plans for making the park available in 2017.
ACTION 4: Explore possibility of Sheriff’s Substation in downtown.
A Sheriff Substation was located in Rosamond at the time of the initial community meeting (July 2016). Subsequently it has closed, and activities are handled out of the Mojave Substation (14 miles away) until a new Rosamond location can be found. The community has seen an increase in property crime and drug activity over the last two years.
2011 PRIORITY
2011-16 STATUS
2017 ACTIONS
Now
2011 PRIORITY
2011-16 STATUS
2017 ACTIONS
1-5 Yrs
2011 PRIORITY
2011-16 STATUS
2017 ACTIONS
1-5 Yrs
2011 PRIORITY
2011-16 STATUS
2017 ACTIONS
Now

ROSAMOND, CA DRAFT
ECONOMIC DEVELOPMENT STRATEGIC PLAN PAGE | 5
2017 ACTION ITEMS
Continue to lobby the County and Sheriff’s Department for a local substation. Collect data on property and personal crimes to support the need. Identify an appropriate location and help to secure a substation downtown.
ACTION 5: Explore reducing the Sierra Highway speed limit to 25 mph.
At the July 2016 meeting, the community agreed that reducing the speed limit on Sierra Highway, a major commuter road, was not feasible. A greater concern is that, even with the newly completed build outs, speeding problems on Diamond Street still need to be addressed.
2017 ACTION ITEMS
Discuss potential solutions and estimate costs with Sheriff’s Department, County Roads, and Traffic Engineers. Present two or three of the most viable traffic calming techniques to the County for consideration on Diamond Street. For example:
Speed bumps or rumble strips approaching intersections have been found to be more effective than flashing warning signs at crosswalks.
Changes in pavement color and texture and raised crossings can be attractive and effectively slow traffic. Center medians, planters, and trees create a pinch point for traffic, narrow drivers’ visual fields, and reduce
pedestrian crossing distances. Marked bike lanes serve to narrow the roadway.
ACTION 6: Connect downtown to regional bike routes.
No bike routes are established, but they are under consideration by Kern County Walk Ride. The County is applying for a grant and will consider adding Rosamond bike paths to the plan.
2017 ACTION ITEMS
Continue conversations with County offices and reinforce Rosamond’s interest in establishing bike routes.
ACTION 7: Establish a youth facility on C Street.
A skateboard park was temporarily located on school district property. Ramps and pieces are in storage and could be installed when a new location is identified.
2017 ACTION ITEMS
Family Faith Center was identified as a possible location for youth activities; contact the Pastor or church leaders to offer assistance.
Identify two or three potential sites for a skateboard park. Work with County Planning and Parks & Recreation Departments to assess traffic, access, parking, visibility,
neighboring uses, property drainage, landscaping needs, security, operations, and management. Identify and contact property owners for potential donation or low-cost property lease.
2011 PRIORITY
2011-16 STATUS
2017 ACTIONS
Now
2011 PRIORITY
2011-16 STATUS
2017 ACTIONS
Now
2011 PRIORITY
2011-16 STATUS
2017 ACTIONS
1-5 Yrs

ROSAMOND, CA DRAFT
ECONOMIC DEVELOPMENT STRATEGIC PLAN PAGE | 6
ACTION 8: Explore opportunity for park/amphitheater
2017 ACTION ITEMS
See Action #2
ACTION 9: Develop a landscape and streetscape master plan for downtown.
Much has been done towards accomplishing this task. Bulb outs and landscaping were installed on Diamond Street corners. Solar streetlights were acquired and an agreement with the County to install and maintain the lights is pending.
2017 ACTION ITEMS
See Action #5
ACTION 10: Prepare an infrastructure needs assessment
2017 ACTION ITEMS
Continue conversations with County offices and elected officials to further document necessary infrastructure improvements.
Approach East Kern County communities to gauge interest in requesting the County prepare and submit an East Kern-specific Comprehensive Economic Development Strategy (CEDS). Infrastructure projects must be included in an EDA-approved CEDS to receive EDA funding.
ACTION 11: Implement diagonal parking with landscaping buffers on Diamond Street.
2017 ACTIONS:
Continue action as described in 2011 Vision Plan.
ACTION 12: Explore additional stop signs throughout downtown.
2017 ACTIONS:
Continue action as described in 2011 Vision Plan.
ACTION 13: Determine appropriate locations for right and left turn lanes.
2017 ACTIONS:
Continue action as described in 2011 Vision Plan.
ACTION 14: Incorporate bicycle lanes and bicycle/pedestrian improvements.
2017 ACTIONS:
Continue action as described in 2011 Vision Plan.
2011 PRIORITY
2011-16 STATUS
2017 ACTIONS
1-5 Yrs
2011 PRIORITY
2011-16 STATUS
2017 ACTIONS
1-5 Yrs
2011 PRIORITY
2011-16 STATUS
2017 ACTIONS
1-5 Yrs
2011 PRIORITY
2011-16 STATUS
2017 ACTIONS
1-5 Yrs
2011 PRIORITY
2011-16 STATUS
2017 ACTIONS
1-5 Yrs
2011 PRIORITY
2011-16 STATUS
2017 ACTIONS
1-5 Yrs
2011 PRIORITY
2011-16 STATUS
2017 ACTIONS
1-5 Yrs

ROSAMOND, CA DRAFT
ECONOMIC DEVELOPMENT STRATEGIC PLAN PAGE | 7
ACTION 15: Improve pedestrian connectivity with multi-use paths on Sierra Highway.
2017 ACTIONS:
Continue action as described in 2011 Vision Plan.
ACTION 16: Explore additional public transit stops.
2017 ACTION ITEMS
Continue conversations with County offices and elected officials to reinforce Rosamond’s interest in continued safety and traffic calming improvements.
ACTION 17: Initiate a downtown small business recruitment program.
2017 ACTIONS:
Continue action as described in 2011 Vision Plan.
ACTION 18: Develop a self-initiated Main Street Program.
2017 ACTIONS:
Continue action as described in 2011 Vision Plan.
ACTION 19: Encourage community events and festivals.
2017 ACTIONS:
Continue action as described in 2011 Vision Plan.
ACTION 20: Establish public art/art in-lieu of fees.
2017 ACTION ITEMS
Continue conversations with County offices, elected officials, KEDC, GAVEA, and SBDC to reinforce Rosamond’s interest in creating a dynamic business district with a mix of national chains and locally owned shops and amenities for residents and commuters.
ACTION 21: Implement a residential fencing program.
2017 ACTION ITEMS
See Action #30.
ACTION 22: Develop façade improvement program
The Chamber is promoting a new cycle of the RenewBIZ grant program in which $300,000 was allocated for this endeavor.
2017 ACTION ITEMS
Continue promoting and take full advantage of allocated funds. Offer assistance where appropriate and necessary by connecting grantees with County resources (SBDC,
contractors, volunteers, etc.).
2011 PRIORITY
2011-16 STATUS
2017 ACTIONS
1-5 Yrs
2011 PRIORITY
2011-16 STATUS
2017 ACTIONS
1-5 Yrs
2011 PRIORITY
2011-16 STATUS
2017 ACTIONS
Now
2011 PRIORITY
2011-16 STATUS
2017 ACTIONS
Now
2011 PRIORITY
2011-16 STATUS
2017 ACTIONS
Now
2011 PRIORITY
2011-16 STATUS
2017 ACTIONS
1-5 Yrs
2011 PRIORITY
2011-16 STATUS
2017 ACTIONS
1-5 Yrs
2011 PRIORITY
2011-16 STATUS
2017 ACTIONS
1-5 Yrs

ROSAMOND, CA DRAFT
ECONOMIC DEVELOPMENT STRATEGIC PLAN PAGE | 8
ACTION 23: Promote educational opportunities and programs.
2017 ACTION ITEMS
Continue conversations with the County, elected officials, K-12 schools, and Cerro Coso Community College to reinforce Rosamond’s interest in expanding the educational programs for students and itinerate workers.
ACTION 24: Review zoning code, and identify changes to allow preferred development.
2017 ACTIONS:
Continue action as described in 2011 Vision Plan.
ACTION 25: Prepare architectural design guidelines.
2017 ACTIONS:
Continue action as described in 2011 Vision Plan.
ACTION 26: Implement a rural preservation policy to maintain small lot residential development.
2017 ACTIONS:
Continue action as described in 2011 Vision Plan.
ACTION 27: Implement an outdoor dining ordinance.
2017 ACTIONS:
Continue action as described in 2011 Vision Plan.
ACTION 28: Create energy-efficient development guidelines.
2017 ACTION ITEMS
Continue conversations with County staff and elected officials to see to it that zoning changes, codes, and policies are made according to the 2011 Vision Plan and 2017 updated priorities.
ACTION 29: Develop policy to regulate medical marijuana dispensary locations.
2017 ACTIONS:
Continue action as described in 2011 Vision Plan.
ACTION 30: Enforce code compliance in residential neighborhoods.
Community meeting participants voiced frustration at the difficulties faced by County officers in their code enforcement and compliance efforts.
2011 PRIORITY
2011-16 STATUS
2017 ACTIONS
1-5 Yrs
2011 PRIORITY
2011-16 STATUS
2017 ACTIONS
1-5 Yrs
2011 PRIORITY
2011-16 STATUS
2017 ACTIONS
1-5 Yrs
2011 PRIORITY
2011-16 STATUS
2017 ACTIONS
1-5 Yrs
2011 PRIORITY
2011-16 STATUS
2017 ACTIONS
1-5 Yrs
2011 PRIORITY
2011-16 STATUS
2017 ACTIONS
1-5 Yrs
2011 PRIORITY
2011-16 STATUS
2017 ACTIONS
1-5 Yrs
2011 PRIORITY
2011-16 STATUS
2017 ACTIONS
1-5 Yrs

ROSAMOND, CA DRAFT
ECONOMIC DEVELOPMENT STRATEGIC PLAN PAGE | 9
2017 ACTION ITEMS
Continue lobbying County staff and elected officials to enforce new and existing regulations put in place to ensure the safety of Rosamond residents, workers, businesses, and visitors.
Present potential solutions to the County. For example, as part of (or in lieu of) code compliance for the “No Dumping” signs, demonstrate Rosamond residents’ support for a residential fencing program.
In light of a recent increase of medical marijuana dispensaries in downtown Rosamond, enlist the Sheriff Department and lobby the County to enact and enforce zoning and codes to limit or eliminate the sale of medical marijuana in residential neighborhoods and the downtown business district.
ACTION 31: Incorporate a community college presence.
An Antelope Valley College satellite campus was established at the Rosamond High School for engineering courses, GED completion, and other coursework.
2017 ACTIONS:
Continue action as described in 2011 Vision Plan.
ACTION 32: Attract developers for small retail/commercial businesses.
Dollar Store, Rite Aid, Walgreens have established locations in Rosamond.
2017 ACTION ITEMS
Enlist the Kern Economic Development Corporation (KEDC) and the Greater Antelope Valley Economic Alliance (GAVEA) in efforts to attract developers and commercial and industrial employers.
Make sure KEDC and GAVEA know the types of companies, employers, and services that are needed and desired in Rosamond (e.g. a bank).
Notify KEDC and GAVEA of properties (land and buildings) that are available for sale or development. Be available to assist KEDC and GAVEA with data collection, proposals, and site visits for prospective new
businesses.
2011 PRIORITY
2011-16 STATUS
2017 ACTIONS
5-10 Yrs
2011 PRIORITY
2011-16 STATUS
2017 ACTIONS
5-10 Yrs

ROSAMOND, CA DRAFT
ECONOMIC DEVELOPMENT STRATEGIC PLAN PAGE | 10
30-60-90 DAY LAUNCH SCHEDULE
The following launch schedule is provided as a guide to organizing and initiating 2017 activities.
30 DAYS
Organize for Implementation.
Establish a chairperson and task force for the top three to five projects.
Rosamond depends on community volunteers to successfully implement these activities. To avoid “volunteer burn-out” engage as many people as you can. Those who are already involved in the economic and community development of Rosamond should look for every opportunity to invite others to participate. Allow for varying levels of participation and time commitment. Consider inviting participation from: business owners, commercial property owners, retirees, students, and workers (including commuters).
For each task force, establish a profile that will inform potential volunteers of the services, knowledge or expertise needed; the time commitment required (hours per day or month, for X number of weeks or months); and opportunities to donate services, tools, or products.
60–90 DAYS
Meet with relevant partners.
Chairpersons and at least one member of the task force should contact the external partners that are relevant to the successful implementation of the projects (e.g.: County departments, District Supervisor, KEDC, GAVEA, School District, individuals, etc.) to review the projects, action items, schedules, and timelines. The objective is to get buy-in and establish reasonable timelines for accomplishing the activities.
QUARTERLY
Communicate with residents, local businesses, external partners, and Kern County Supervisors and Departments on the status of implementation, including any challenges the task force is having. Brainstorm possible solutions.
ANNUALLY
Monitor achievements, update statuses, record performance metrics, and reaffirm or establish new goals/projects.

ROSAMOND, CA DRAFT
ECONOMIC DEVELOPMENT STRATEGIC PLAN PAGE | 11
APPENDIX A: ECONOMIC ASSESSMENT & SWOT ANALYSIS To provide a foundation for the planning process, TIP conducted an assessment of demographic and economic factors that impact Rosamond’s competitiveness. Our economic assessment provides a quantitative understanding of the demographic and economic trends impacting the community. Except where specified, the data in this section is for the 93560 ZIP Code, which covers Rosamond.
SWOT ANALYSIS
In addition to our review of economic and demographic data, our understanding of Rosamond was informed by discussions with local community and business leaders. Based on this work, as well as our experience working in communities across the US, we have developed an analysis of the community’s strengths, weaknesses, opportunities, and threats, commonly referred to as a SWOT analysis. The results of this analysis are outlined below.
STRENGTHS
Proximity to Edwards AFB, Mojave Air & Spaceport, and Lancaster/Palmdale Rosamond Municipal Advisory Council Willow Springs International Raceway
• Exotic Feline Breeding Compound
WEAKNESSES
• Lack of municipal city government is a barrier because it limits resources (financial and political) available to influence local economic development
OPPORTUNITIES • Rosamond Vision Plan recommendations and funding for improvements • Rosamond Boulevard pedestrian path • Planned development of new Flight Test Museum
THREATS
• Unregulated “pot shops” proliferating throughout community were identified as a significant threat during the September community meeting in Rosamond
ROSAMOND, CA DRAFT
ECONOMIC DEVELOPMENT STRATEGIC PLAN PAGE | 12
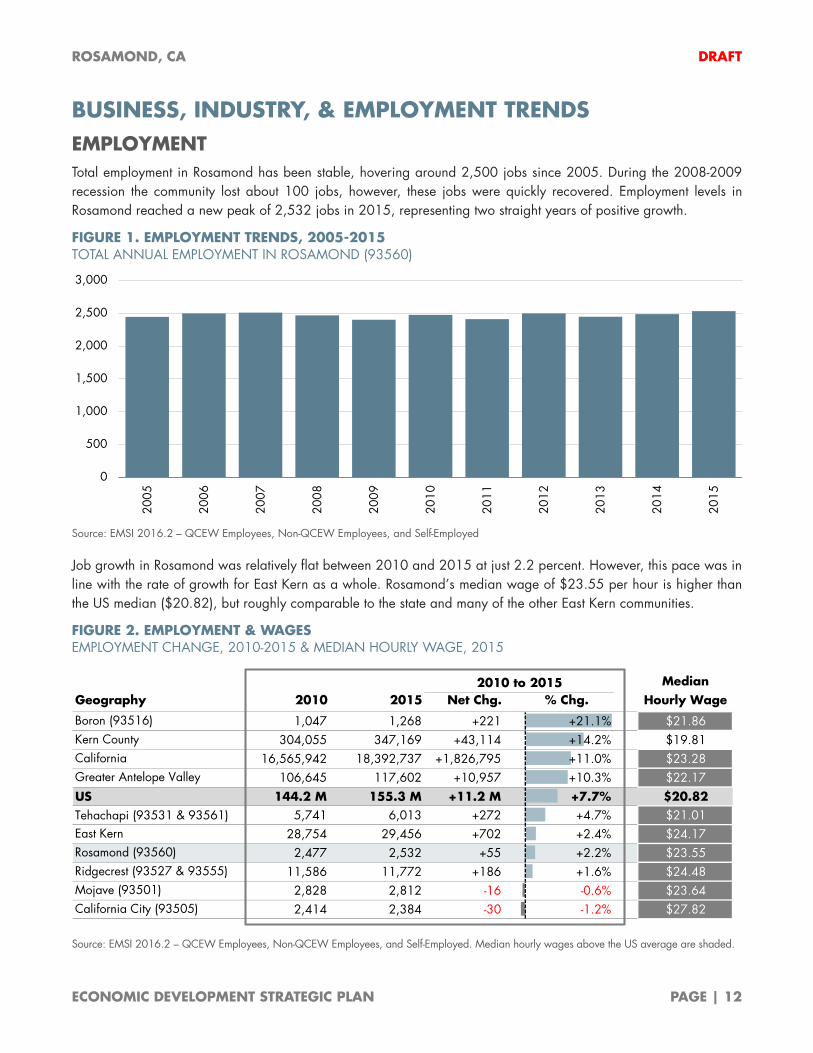
BUSINESS, INDUSTRY, & EMPLOYMENT TRENDS EMPLOYMENT Total employment in Rosamond has been stable, hovering around 2,500 jobs since 2005. During the 2008-2009 recession the community lost about 100 jobs, however, these jobs were quickly recovered. Employment levels in Rosamond reached a new peak of 2,532 jobs in 2015, representing two straight years of positive growth.
FIGURE 1. EMPLOYMENT TRENDS, 2005-2015 TOTAL ANNUAL EMPLOYMENT IN ROSAMOND (93560)
Source: EMSI 2016.2 – QCEW Employees, Non-QCEW Employees, and Self-Employed
Job growth in Rosamond was relatively flat between 2010 and 2015 at just 2.2 percent. However, this pace was in line with the rate of growth for East Kern as a whole. Rosamond’s median wage of $23.55 per hour is higher than the US median ($20.82), but roughly comparable to the state and many of the other East Kern communities.
FIGURE 2. EMPLOYMENT & WAGES EMPLOYMENT CHANGE, 2010-2015 & MEDIAN HOURLY WAGE, 2015
Source: EMSI 2016.2 – QCEW Employees, Non-QCEW Employees, and Self-Employed. Median hourly wages above the US average are shaded.
0
500
1,000
1,500
2,000
2,500
3,000
2005
2006
2007
2008
2009
2010
2011
2012
2013
2014
2015
Median Geography 2010 2015 Net Chg. % Chg. Hourly Wage
Boron (93516) 1,047 1,268 +221 +21.1% $21.86Kern County 304,055 347,169 +43,114 +14.2% $19.81California 16,565,942 18,392,737 +1,826,795 +11.0% $23.28Greater Antelope Valley 106,645 117,602 +10,957 +10.3% $22.17US 144.2 M 155.3 M +11.2 M +7.7% $20.82Tehachapi (93531 & 93561) 5,741 6,013 +272 +4.7% $21.01East Kern 28,754 29,456 +702 +2.4% $24.17Rosamond (93560) 2,477 2,532 +55 +2.2% $23.55Ridgecrest (93527 & 93555) 11,586 11,772 +186 +1.6% $24.48Mojave (93501) 2,828 2,812 -16 -0.6% $23.64California City (93505) 2,414 2,384 -30 -1.2% $27.82
2010 to 2015

ROSAMOND, CA DRAFT
ECONOMIC DEVELOPMENT STRATEGIC PLAN PAGE | 13
Annual job growth in Rosamond has generally followed the overall trend in East Kern, alternating between net losses (2011 and 2013) and net gains (2012, 2014, and 2015). In 2015, the rate of job growth in Rosamond ranked second-fastest among East Kern communities. With an increase of 1.8 percent from 2014, Rosamond’s growth rate was behind that of California City (3.3 percent), but comparable to the East Kern rate.
FIGURE 3. EMPLOYMENT TRENDS, 2010-2015 ANNUAL JOB GROWTH RATE (PERCENT CHANGE FROM PRIOR YEAR)
Source: EMSI 2016.2 – QCEW Employees, Non-QCEW Employees, and Self-Employed
-4.0%
-3.0%
-2.0%
-1.0%
0.0%
1.0%
2.0%
3.0%
4.0%
5.0%
6.0%
2010
2011
2012
2013
2014
2015
Rosamond (93560) East Kern Kern County Greater Antelope Valley US

ROSAMOND, CA DRAFT
ECONOMIC DEVELOPMENT STRATEGIC PLAN PAGE | 14
Federal government and education employment in Rosamond accounts for more than half of all jobs in the community. In addition to the public sector, Rosamond stands out with a higher share of jobs in arts, entertainment, and recreation industries and a lower share of jobs in healthcare compared to East Kern.
FIGURE 4. INDUSTRY DISTRIBUTION (% OF TOTAL), 2015 COMPARISON OF ROSAMOND (93560) WITH SELECTED GEOGRAPHIES AND US
Source: EMSI 2016.2 – QCEW Employees, Non-QCEW Employees, and Self-Employed Note: Figures exclude military and unclassified employment. Education includes public schools, colleges, and universities. Healthcare & social assistance includes public hospitals. The three largest industries in each geography are highlighted.
NAICS Code & Description East Kern Kern County
Greater Antelope
Valley US
9011 Federal govt. (civilian) 31.9% 21.1% 2.9% 7.5% 1.9%
61 Education 21.1% 8.0% 8.8% 8.0% 9.4%
44-45 Retail trade 9.9% 10.4% 9.7% 15.9% 10.6%
72 Lodging, restaurants, & bars 8.2% 8.3% 6.6% 10.5% 8.5%
71 Arts, entertainment, & recreation 5.2% 1.2% 0.9% 0.8% 1.7%
23 Construction 3.9% 3.0% 6.2% 4.6% 5.4%
81 Personal & other services 3.5% 4.7% 3.6% 5.7% 4.9%
53 Property sales & leasing 2.4% 1.7% 1.2% 1.8% 1.7%
62 Healthcare & social assistance 2.3% 9.3% 10.5% 19.2% 13.3%
22 Utilities 2.2% 0.8% 0.3% 0.3% 0.4%
31-33 Manufacturing 1.8% 4.6% 4.3% 3.0% 8.2%
56 Admin. & support services 1.8% 5.3% 4.6% 5.5% 6.3%
42 Wholesale trade 1.6% 1.5% 2.8% 1.5% 3.9%
54 Professional services 1.5% 8.2% 3.6% 5.9% 6.4%
48-49 Transportation & warehousing 1.4% 2.3% 2.9% 2.7% 3.4%
9039 Local govt. 0.6% 2.9% 3.8% 2.8% 3.6%
11 Agriculture & forestry 0.2% 0.0% 18.0% 0.1% 1.3%
21 Mining (incl. oil & gas) 0.2% 2.4% 3.4% 0.6% 0.5%
51 Information 0.2% 0.5% 0.8% 0.9% 1.9%
52 Finance & insurance 0.2% 1.5% 1.7% 2.0% 3.9%
9029 State govt. 0.2% 1.7% 2.2% 0.6% 1.5%
55 Corporate & regional offices 0.0% 0.3% 1.0% 0.1% 1.4%
Rosamond (93560)

ROSAMOND, CA DRAFT
ECONOMIC DEVELOPMENT STRATEGIC PLAN PAGE | 15
Location quotient (LQ) analysis can provide an understanding of an area’s relative strengths. A review of LQs for Rosamond confirms the community’s high employment concentrations in the federal government sector, as evidenced by its LQ of 16.83. Other industry sectors with above-average levels of employment in the community include utilities (LQ of 6.66); arts, entertainment, and recreation (3.15); education (2.24), and property sales and leasing (1.41). By contrast, Rosamond’s relatively low LQ of 0.22 for professional services suggest there may be room for expansion in this sector. The professional services sector encompasses a range of firms that provide services requiring specific skills and expertise (such as legal advice, accounting, scientific services, and others) and which play a key role in the support of other sectors.
FIGURE 5. CONCENTRATION OF EMPLOYMENT BY SECTOR, 2015 LOCATION QUOTIENT (LQ) ANALYSIS BY SECTOR, US=1.00
Source: EMSI 2016.2 – QCEW Employees, Non-QCEW Employees, and Self-Employed Note: Figures exclude military and unclassified employment. Education includes public schools, colleges, and universities. Healthcare & social assistance includes public hospitals. LQs greater than 1.25 are presumed to show competitive advantage and are highlighted.
NAICS Code & Description East Kern Kern County
Greater Antelope
Valley US
9011 Federal govt. (civilian) 16.83 11.23 1.55 4.03 1.00
22 Utilities 6.66 2.23 0.87 0.81 1.00
71 Arts, entertainment, & recreation 3.15 0.72 0.58 0.53 1.00
61 Education 2.24 0.85 0.94 0.85 1.00
53 Property sales & leasing 1.41 1.03 0.72 1.07 1.00
72 Lodging, restaurants, & bars 1.00 1.02 0.82 1.26 1.00
44-45 Retail trade 0.97 1.05 0.96 1.51 1.00
81 Personal & other services 0.67 0.90 0.70 1.15 1.00
23 Construction 0.64 0.50 1.05 0.86 1.00
48-49 Transportation & warehousing 0.42 0.70 0.89 0.78 1.00
42 Wholesale trade 0.39 0.38 0.70 0.37 1.00
56 Admin. & support services 0.27 0.81 0.71 0.85 1.00
9029 State govt. 0.25 1.19 1.58 0.38 1.00
31-33 Manufacturing 0.23 0.52 0.51 0.35 1.00
54 Professional services 0.22 1.20 0.53 0.90 1.00
62 Healthcare & social assistance 0.18 0.70 0.79 1.44 1.00
9039 Local govt. 0.17 0.81 1.08 0.77 1.00
52 Finance & insurance 0.09 0.37 0.42 0.51 1.00
21 Mining (incl. oil & gas) 0.07 4.93 6.15 1.31 1.00
51 Information 0.05 0.30 0.50 0.49 1.00
11 Agriculture & forestry 0.02 0.02 14.89 0.07 1.00
55 Corporate & regional offices 0.00 0.20 0.67 0.07 1.00
Rosamond (93560)
LOCATION QUOTIENT (LQ) ANALYSIS is a statistical technique used to suggest areas of relative advantage based on a region’s employment base. LQs are calculated as an industry’s share of total local employment divided by the same industry’s share of employment at the national level. If the local industry and national industry are perfectly proportional, the LQ will be 1.00. LQs greater than 1.25 are presumed to indicate a comparative advantage; those below 0.75 suggest areas of weakness but may also point to opportunities for expansion or attraction.
ROSAMOND, CA DRAFT
ECONOMIC DEVELOPMENT STRATEGIC PLAN PAGE | 16
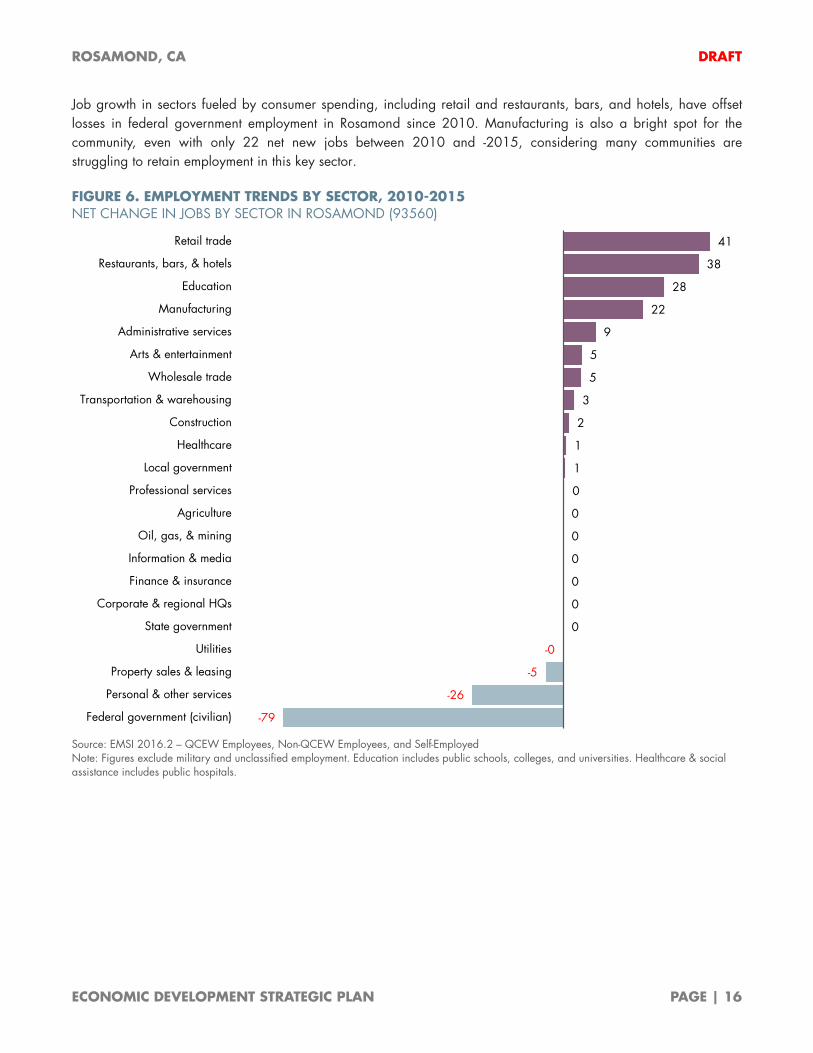
Job growth in sectors fueled by consumer spending, including retail and restaurants, bars, and hotels, have offset losses in federal government employment in Rosamond since 2010. Manufacturing is also a bright spot for the community, even with only 22 net new jobs between 2010 and -2015, considering many communities are struggling to retain employment in this key sector.
FIGURE 6. EMPLOYMENT TRENDS BY SECTOR, 2010-2015 NET CHANGE IN JOBS BY SECTOR IN ROSAMOND (93560)
Source: EMSI 2016.2 – QCEW Employees, Non-QCEW Employees, and Self-Employed Note: Figures exclude military and unclassified employment. Education includes public schools, colleges, and universities. Healthcare & social assistance includes public hospitals.
41
38
28
22
9
5
5
3
2
1
1
0
0
0
0
0
0
0
-0
-5
-26
-79
Retail trade
Restaurants, bars, & hotels
Education
Manufacturing
Administrative services
Arts & entertainment
Wholesale trade
Transportation & warehousing
Construction
Healthcare
Local government
Professional services
Agriculture
Oil, gas, & mining
Information & media
Finance & insurance
Corporate & regional HQs
State government
Utilities
Property sales & leasing
Personal & other services
Federal government (civilian)

ROSAMOND, CA DRAFT
ECONOMIC DEVELOPMENT STRATEGIC PLAN PAGE | 17
RETAIL LEAKAGE
Rosamond households spend an estimated $237 million annually on retail and food and beverage purchases. A comparison with estimated sales by local retailers suggest the majority of that spending (72 percent) is occurring outside the community. Nearly all retail categories where data is available for the 93560 ZIP Code are experiencing leakage outside the community, suggesting a number of opportunities for starting or expanding a retail business. The most significant market opportunities for capitalizing on unmet demand based on these estimates are motor vehicles and parts ($40 million), general merchandise ($33 million), and food and beverage stores ($15 million).
FIGURE 7. RETAIL GAP ANALYSIS ROSAMOND (93560)
Retail Sector NAICS
Estimated Retail Sales
of Area Stores (Supply)
Estimated Retail Purchases of
Area Residents (Demand)
Retail Leakage/ Surplus
Leakage/ Surplus Percent
Total Retail Sales Incl. Food & Drink $66,392,308 $236,868,007 -$170,475,699 72.0%
Motor Vehicle & Parts Dealers 441 $8,682,736 $48,562,202 -$39,879,466 82.1%
Automobile Dealers 4411 $6,792,972 $40,410,426 -$33,617,454 83.2%
Other Motor Vehicle Dealers 4412 $439,651 $5,338,843 -$4,899,192 91.8%
Auto Parts, Accessories & Tire Stores 4413 $1,450,113 $2,812,933 -$1,362,820 48.4%
Furniture & Home Furnishings Stores 442 $588,904 $7,238,183 -$6,649,279 91.9%
Furniture Stores 4421 $588,904 $4,053,277 -$3,464,373 85.5%
Home Furnishings Stores 4422 $0 $3,184,906 -$3,184,906 100.0%
Electronics & Appliance Stores 443 $409,429 $11,238,878 -$10,829,449 96.4%
Bldg Materials, Garden Equip. & Supply Stores 444 $2,728,512 $9,570,568 -$6,842,056 71.5%
Bldg Material & Supplies Dealers 4441 $2,286,474 $8,542,360 -$6,255,886 73.2%
Lawn & Garden Equip & Supply Stores 4442 $442,038 $1,028,208 -$586,170 57.0%
Food & Beverage Stores 445 $26,151,516 $40,685,960 -$14,534,444 35.7%
Grocery Stores 4451 $25,193,604 $34,953,134 -$9,759,530 27.9%
Specialty Food Stores 4452 $457,115 $3,728,948 -$3,271,833 87.7%
Beer, Wine & Liquor Stores 4453 $500,797 $2,003,878 -$1,503,081 75.0%
Health & Personal Care Stores 446 $2,688,900 $14,211,374 -$11,522,474 81.1%
Gasoline Stations 447 $7,852,258 $13,464,772 -$5,612,514 41.7%
Clothing & Clothing Accessories Stores 448 $531,617 $14,264,525 -$13,732,908 96.3%
Clothing Stores 4481 $531,617 $10,330,774 -$9,799,157 94.9%
Shoe Stores 4482 $0 $1,548,877 -$1,548,877 100.0%
Jewelry, Luggage & Leather Goods Stores 4483 $0 $2,384,874 -$2,384,874 100.0%
continued, next page

ROSAMOND, CA DRAFT
ECONOMIC DEVELOPMENT STRATEGIC PLAN PAGE | 18
FIGURE 7. RETAIL GAP ANALYSIS (continued)
Retail Sector NAICS
Estimated Retail Sales
of Area Stores (Supply)
Estimated Retail Purchases of
Area Residents (Demand)
Retail Leakage/ Surplus
Leakage/ Surplus Percent
Sporting Goods, Hobby, Book & Music Stores 451 $688,240 $6,266,372 -$5,578,132 89.0%
Sporting Goods/Hobby/Musical Instr Stores 4511 $451,928 $5,438,978 -$4,987,050 91.7%
Book, Periodical & Music Stores 4512 $236,312 $827,394 -$591,082 71.4%
General Merchandise Stores 452 $401,814 $33,100,575 -$32,698,761 98.8%
Department Stores Excluding Leased Depts. 4521 $0 $22,055,539 -$22,055,539 100.0%
Other General Merchandise Stores 4529 $401,814 $11,045,036 -$10,643,222 96.4%
Miscellaneous Store Retailers 453 $1,765,765 $11,021,244 -$9,255,479 84.0%
Florists 4531 $58,899 $412,672 -$353,773 85.7%
Office Supplies, Stationery & Gift Stores 4532 $108,750 $1,571,971 -$1,463,221 93.1%
Used Merchandise Stores 4533 $116,709 $735,569 -$618,860 84.1%
Other Miscellaneous Store Retailers 4539 $1,481,407 $8,301,032 -$6,819,625 82.2%
Nonstore Retailers 454 $4,140,550 $5,076,090 -$935,540 18.4%
Electronic Shopping & Mail-Order Houses 4541 $1,532,702 $4,144,513 -$2,611,811 63.0%
Vending Machine Operators 4542 $0 $119,965 -$119,965 100.0%
Direct Selling Establishments 4543 $2,607,848 $811,612 $1,796,236 221.3%
Food Services & Drinking Places 722 $9,762,067 $22,167,264 -$12,405,197 56.0%
Full-Service Restaurants 7221 $5,023,220 $12,358,793 -$7,335,573 59.4%
Limited-Service Eating Places 7222 $4,738,847 $8,966,489 -$4,227,642 47.1%
Special Food Services 7223 $0 $471,915 -$471,915 100.0%
Drinking Places - Alcoholic Beverages 7224 $0 $370,067 -$370,067 100.0%
Source: ESRI Community Analyst

ROSAMOND, CA DRAFT
ECONOMIC DEVELOPMENT STRATEGIC PLAN PAGE | 19
HOUSING INDICATORS
The distribution of owner-occupied (53.0%) and renter-occupied (30.5%) housing in Rosamond is similar to East Kern as a whole, and not much different from the US. Rosamond’s vacancy rate of 16.5 percent falls above the US, but below several other communities in the region. Rosamond was the only East Kern community with median rents estimated to be in excess of $800 per month. At $842, the community’s estimated median rent is also not far from the median contract rent of $896 for the Greater Antelope Valley and is perhaps related to newer housing in the area.
FIGURE 8. HOUSING CHARACTERISTICS SELECTED INDICATORS, RANKED BY % VACANT
Source: US Census Bureau, 2010-2014 American Community Survey 5-Year Estimates (accessed via ESRI Community Analyst). Shaded figures are above the US average (median rent) or more recent than US (median year built).
Total Median Median Yr. Housing % Owner % Renter Contract Structure
Geography Units Occupied Occupied % Vacant Rent Built
Boron (93516) 1,259 39.2% 27.8% 33.0% $561 1959California City (93505) 6,117 48.1% 28.7% 23.3% $638 1991Mojave (93501) 2,360 42.8% 39.0% 18.2% $571 1975East Kern 48,191 53.2% 29.4% 17.4% $725 1984Rosamond (93560) 7,307 53.0% 30.5% 16.5% $842 1992Tehachapi (93531 & 93561) 13,334 59.5% 24.6% 15.9% $774 1987Ridgecrest (93527 & 93555) 15,985 56.2% 29.8% 14.0% $701 1980US 132.7 M 56.3% 31.2% 12.5% $767 1976Greater Antelope Valley 172,738 56.2% 32.0% 11.9% $896 1986Kern County 287,775 51.2% 38.4% 10.4% $746 1981California 13,781,929 50.1% 41.4% 8.5% $1,138 1974

ROSAMOND, CA DRAFT
ECONOMIC DEVELOPMENT STRATEGIC PLAN PAGE | 20
MARKET ACCESS
Businesses operating in Rosamond have access to growing markets in the region. Nearly 639,000 people live in a one-hour drive time from the community, a 5 percent gain in population from 2010. There are 13.6 million people living within a two-hour drive time from Rosamond and 27.5 million within four hours.
FIGURE 9. DRIVE TIME MAP: ROSAMOND ZIP CODES WITHIN 1-, 2-, & 4-HOUR DRIVE TIMES FROM ROSAMOND
Source: ESRI Community Analyst

ROSAMOND, CA DRAFT
ECONOMIC DEVELOPMENT STRATEGIC PLAN PAGE | 21
Rosamond’s one-hour drive time market was tied for the second-fastest growth rate (5.2 percent) between 2010 and 2016 among the East Kern communities included in this analysis. The one-hour drive time population increased by more than 31,000 people, second only to Tehachapi in numeric terms.
FIGURE 10. MARKET ACCESS POPULATION LIVING IN ZIP CODES WITHIN 1-, 2-, & 4-HOUR DRIVE TIMES OF EACH COMMUNITY
1 HOUR
2 HOURS
4 HOURS
Source: ESRI Community Analyst
Geography Net Chg. % Chg.
Tehachapi 874,066 929,606 +55,540 +6.4%
Rosamond 607,199 638,756 +31,557 +5.2%
Mojave 544,491 569,639 +25,148 +4.6%
California City 414,164 431,520 +17,356 +4.2%
Boron 372,399 391,943 +19,544 +5.2%
Ridgecrest 46,832 48,136 +1,304 +2.8%
2010 2016
2010 to 2016
Geography Net Chg. % Chg.
Rosamond 13,059,979 13,559,907 +499,928 +3.8%
Mojave 9,373,018 9,736,283 +363,265 +3.9%
Boron 6,908,695 7,224,771 +316,076 +4.6%
California City 5,252,195 5,478,493 +226,298 +4.3%
Tehachapi 4,654,457 4,858,354 +203,897 +4.4%
Ridgecrest 1,198,858 1,253,281 +54,423 +4.5%
2010 2016
2010 to 2016
Geography Net Chg. % Chg.
Rosamond 26,280,775 27,518,233 +1,237,458 +4.7%
Boron 26,216,513 27,476,390 +1,259,877 +4.8%
Mojave 25,936,745 27,170,207 +1,233,462 +4.8%
California City 25,856,592 27,084,228 +1,227,636 +4.7%
Ridgecrest 25,365,524 26,586,529 +1,221,005 +4.8%
Tehachapi 25,049,873 26,203,551 +1,153,678 +4.6%
2010 2016
2010 to 2016
ROSAMOND, CA DRAFT
ECONOMIC DEVELOPMENT STRATEGIC PLAN PAGE | 22
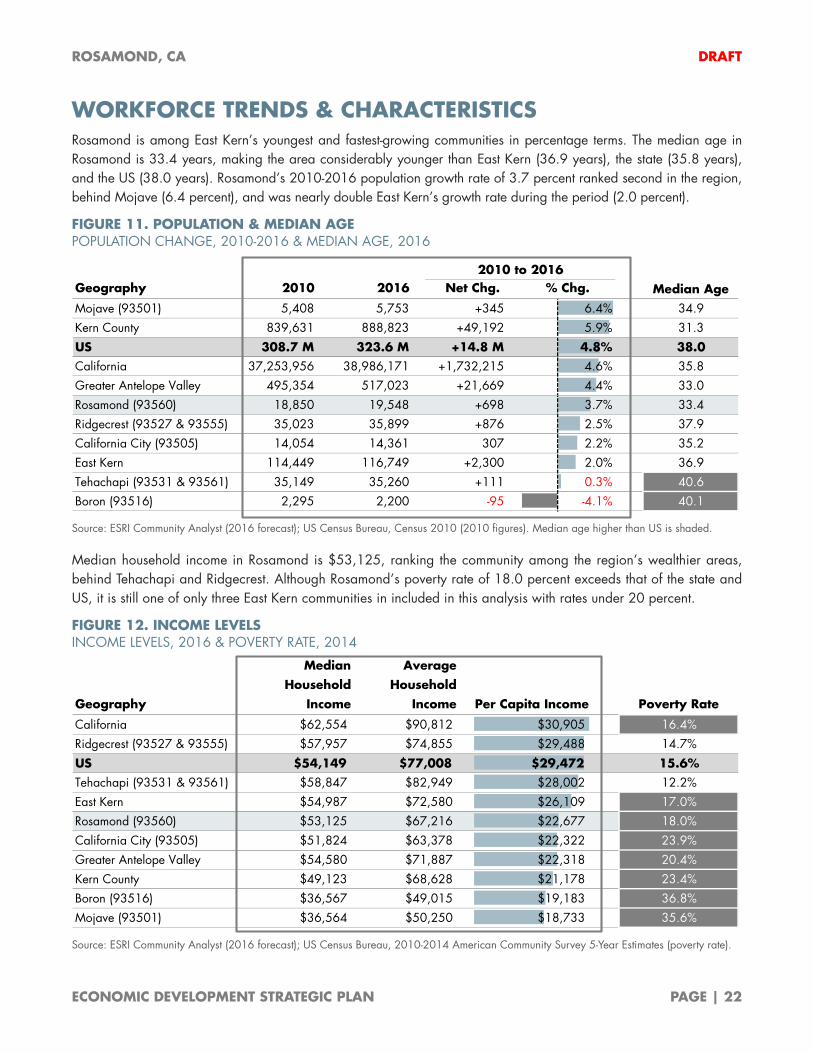
WORKFORCE TRENDS & CHARACTERISTICS Rosamond is among East Kern’s youngest and fastest-growing communities in percentage terms. The median age in Rosamond is 33.4 years, making the area considerably younger than East Kern (36.9 years), the state (35.8 years), and the US (38.0 years). Rosamond’s 2010-2016 population growth rate of 3.7 percent ranked second in the region, behind Mojave (6.4 percent), and was nearly double East Kern’s growth rate during the period (2.0 percent).
FIGURE 11. POPULATION & MEDIAN AGE POPULATION CHANGE, 2010-2016 & MEDIAN AGE, 2016
Source: ESRI Community Analyst (2016 forecast); US Census Bureau, Census 2010 (2010 figures). Median age higher than US is shaded.
Median household income in Rosamond is $53,125, ranking the community among the region’s wealthier areas, behind Tehachapi and Ridgecrest. Although Rosamond’s poverty rate of 18.0 percent exceeds that of the state and US, it is still one of only three East Kern communities in included in this analysis with rates under 20 percent.
FIGURE 12. INCOME LEVELS INCOME LEVELS, 2016 & POVERTY RATE, 2014
Source: ESRI Community Analyst (2016 forecast); US Census Bureau, 2010-2014 American Community Survey 5-Year Estimates (poverty rate).
Geography 2010 2016 Net Chg. % Chg.
Mojave (93501) 5,408 5,753 +345 6.4% 34.9Kern County 839,631 888,823 +49,192 5.9% 31.3
US 308.7 M 323.6 M +14.8 M 4.8% 38.0California 37,253,956 38,986,171 +1,732,215 4.6% 35.8Greater Antelope Valley 495,354 517,023 +21,669 4.4% 33.0Rosamond (93560) 18,850 19,548 +698 3.7% 33.4Ridgecrest (93527 & 93555) 35,023 35,899 +876 2.5% 37.9California City (93505) 14,054 14,361 307 2.2% 35.2East Kern 114,449 116,749 +2,300 2.0% 36.9Tehachapi (93531 & 93561) 35,149 35,260 +111 0.3% 40.6Boron (93516) 2,295 2,200 -95 -4.1% 40.1
2010 to 2016Median Age
Median AverageHousehold Household
Geography Income Income Per Capita Income Poverty Rate
California $62,554 $90,812 $30,905 16.4%Ridgecrest (93527 & 93555) $57,957 $74,855 $29,488 14.7%
US $54,149 $77,008 $29,472 15.6%Tehachapi (93531 & 93561) $58,847 $82,949 $28,002 12.2%East Kern $54,987 $72,580 $26,109 17.0%Rosamond (93560) $53,125 $67,216 $22,677 18.0%California City (93505) $51,824 $63,378 $22,322 23.9%Greater Antelope Valley $54,580 $71,887 $22,318 20.4%Kern County $49,123 $68,628 $21,178 23.4%Boron (93516) $36,567 $49,015 $19,183 36.8%Mojave (93501) $36,564 $50,250 $18,733 35.6%

ROSAMOND, CA DRAFT
ECONOMIC DEVELOPMENT STRATEGIC PLAN PAGE | 23
Rosamond’s household income distribution largely mirrors East Kern; however, it has a larger share of households at the lower end of the scale. Approximately 16 percent of households in Rosamond have household incomes below $15,000, a considerably larger portion than East Kern (13.5 percent). Rosamond also has a slightly smaller share of households with incomes above $100,000 (22.2 percent) compared to East Kern as a whole (24.0 percent).
FIGURE 13. HOUSEHOLD INCOME DISTRIBUTION SHARE OF HOUSEHOLDS BY SELECTED INCOME CATEGORIES
Source: 2010-2014 American Community Survey 5-Year Estimates (DP-02).
Rosamond’s age distribution tracks closer to Kern County and the Greater Antelope Valley than it does East Kern. Ten percent of Rosamond’s population is age 65 or older and 29 percent is under the age of twenty.
FIGURE 14. AGE STRUCTURE SHARE OF POPULATION BY SELECTED AGE GROUPS
Source: ESRI Community Analyst
12.5%
10.9%
13.0%
13.9%
13.5%
16.2%
20.1%
17.4%
18.3%
22.1%
18.5%
18.1%
13.3%
12.0%
14.1%
14.6%
12.9%
12.9%
30.0%
28.9%
31.6%
28.7%
31.1%
30.6%
13.4%
15.4%
14.3%
12.2%
15.6%
14.5%
10.6%
15.4%
8.7%
8.4%
8.4%
7.7%
0% 20% 40% 60% 80% 100%
US
California
GreaterAntelope Valley
Kern County
East Kern
Rosamond (93560)
$0 to $15k $15k to $35k $35k to $50k $50k to $100k $100k to $150k $150k+
26%
26%
30%
32%
26%
29%
21%
22%
23%
24%
21%
23%
39%
38%
37%
34%
38%
37%
15%
13%
11%
10%
14%
10%
0% 20% 40% 60% 80% 100%
US
California
GreaterAntelope Valley
Kern County
East Kern
Rosamond (93560)
Youth (0 to 19) Young adults (20 to 34) Experienced working age (35 to 64) Seniors (65+)

ROSAMOND, CA DRAFT
ECONOMIC DEVELOPMENT STRATEGIC PLAN PAGE | 24
Rosamond’s educational attainment levels generally trail the region, state, and US. Roughly 11 percent of Rosamond residents age 25 or older have a bachelor’s degree or higher, compared with 18.5 percent of East Kern adult residents and roughly 30 percent for the state and US. However, like the East Kern region, Rosamond has a significant share of adult residents that have completed some level of postsecondary education, including associates degrees, suggesting an important area of skilled workers and a potential focus for local workforce development efforts.
FIGURE 15. EDUCATIONAL ATTAINMENT HIGHEST LEVEL OF ATTAINMENT, POPULATION AGE 25+
Source: 2010-2014 American Community Survey 5-Year Estimates (DP-02).
Rosamond’s labor force participation rate of 56.6 percent is among the higher rates found in the East Kern region. The most recent unemployment rate available from the US Census Bureau for Rosamond is 12.9 percent (2014), which is higher than state and national rates, but comparable to East Kern as a whole.
FIGURE 16. LABOR FORCE & UNEMPLOYMENT LABOR FORCE, UNEMPLOYMENT & LABOR FORCE PARTICIPATION RATES
Source: US Census Bureau, 2010-2014 American Community Survey 5-Year Estimates.
13.7%
18.5%
20.8%
27.0%
15.9%
22.1%
28.0%
20.7%
27.0%
26.4%
26.9%
28.6%
29.1%
29.8%
35.9%
31.4%
38.7%
38.5%
29.3%
31.0%
16.2%
15.2%
18.5%
10.8%
0% 20% 40% 60% 80% 100%
US
California
GreaterAntelope Valley
Kern County
East Kern
Rosamond (93560)
Less than High School HS Diploma/GED Some College (incl. Associate's) Bachelor's or Above
Labor Force
Population Unemployment ParticipationGeography Age 16+ Labor Force Unemployment Rate Rate
Boron (93516) 1,664 627 165 26.3% 37.7%California City (93505) 10,595 5,751 1,345 23.4% 54.3%Mojave (93501) 3,928 2,210 497 22.5% 56.3%Greater Antelope Valley 373,976 209,844 27,778 13.2% 56.1%Kern County 630,972 372,092 49,041 13.2% 59.0%Rosamond (93560) 14,843 8,401 1,085 12.9% 56.6%East Kern 88,971 49,097 6,020 12.3% 55.2%California 29,934,838 19,108,876 2,084,564 10.9% 63.8%Ridgecrest (93527 & 93555) 27,036 16,835 1,668 9.9% 62.3%US 248.8 M 159.0 M 14.5 M 9.1% 63.9%Tehachapi (93531 & 93561) 28,197 13,570 1,118 8.2% 48.1%

ROSAMOND, CA DRAFT
ECONOMIC DEVELOPMENT STRATEGIC PLAN PAGE | 25
Education, training, and library occupations comprise the largest share of employment in Rosamond, accounting for 15 percent of the community’s job base. This figure is more than twice the share the occupational group represents in the region, and nearly three times its share of total state and US employment. The next two largest occupational groupings are office and administrative support (10.7 percent) and food services (9.4 percent).
FIGURE 17. OCCUPATIONAL DISTRIBUTION (% OF TOTAL), 2015 COMPARISON OF ROSAMOND (93560) WITH SELECTED GEOGRAPHIES AND US
Source: EMSI 2016.2 – QCEW Employees, Non-QCEW Employees, and Self-Employed Note: Figures exclude military and unclassified employment. The three largest occupations in each geography are highlighted.
SOC Code & Description25 Education, Training, & Library 15.2% 6.0% 6.2% 5.6% 5.8%
43 Office & Administrative Support 10.7% 12.9% 11.2% 15.4% 15.4%
35 Food Preparation & Serving Related 9.4% 7.8% 6.5% 10.2% 8.4%
13 Business & Financial Operations 8.3% 7.5% 3.5% 4.9% 5.0%
41 Sales & Related 7.3% 8.4% 8.1% 12.1% 10.3%
49 Installation, Maintenance, & Repair 5.2% 5.5% 4.2% 3.6% 3.8%
53 Transportation & Material Moving 5.1% 6.2% 7.5% 5.8% 6.6%
17 Architecture & Engineering 5.1% 6.1% 2.2% 2.3% 1.7%
11 Management 4.7% 5.0% 4.9% 5.0% 5.5%
29 Healthcare Practitioners & Technical 4.1% 4.8% 3.9% 6.6% 5.4%
33 Protective Service 3.9% 4.0% 3.0% 2.2% 2.3%
47 Construction & Extraction 2.9% 3.4% 6.0% 3.8% 4.5%
39 Personal Care & Service 2.9% 3.6% 3.0% 4.5% 4.0%
37 Building/Grounds Cleaning & Maint. 2.5% 3.0% 3.1% 3.7% 3.9%
51 Production 2.4% 3.6% 3.6% 3.1% 6.1%
15 Computer & Mathematical 2.3% 3.7% 1.4% 2.5% 2.7%
27 Arts, Design, Entertainment, & Media 2.2% 1.5% 1.1% 1.3% 1.8%
19 Life, Physical, & Social Science 2.1% 2.0% 0.9% 1.1% 0.8%
31 Healthcare Support 1.4% 1.8% 2.0% 3.0% 2.8%
21 Community & Social Service 1.3% 2.1% 1.9% 2.4% 1.6%
23 Legal 0.6% 0.4% 0.4% 0.6% 0.8%
45 Farming, Fishing, & Forestry 0.4% 0.5% 15.4% 0.2% 0.8%
Rosamond (93560) East Kern Kern County
Greater Antelope
Valley US

ROSAMOND, CA DRAFT
ECONOMIC DEVELOPMENT STRATEGIC PLAN PAGE | 26
Location quotient (LQ) analysis reveals several important occupational groups where Rosamond has significantly higher job concentrations compared to the US, including many science, technology, education, and math (STEM) fields. Jobs in architecture and engineering, for example, are approximately three times more concentrated in Rosamond than the US as a whole (with an LQ of 3.02). Other occupational groups with LQs indicating above-average levels of concentration in Rosamond include education, training, and library (2.62); life, physical and social sciences (2.56); protective service (1.74); business and financial operations (1.67); installation, maintenance and repair (1.36); and arts, design, entertainment, and media (1.25).
FIGURE 18. CONCENTRATION OF EMPLOYMENT BY OCCUPATION, 2015 LOCATION QUOTIENT (LQ) ANALYSIS BY MAJOR GROUP, US=1.00
Source: EMSI 2016.2 – QCEW Employees, Non-QCEW Employees, and Self-Employed Note: Figures exclude military and unclassified employment. LQs greater than 1.25 are presumed to show competitive advantage and are highlighted.
SOC Code & Description17 Architecture & Engineering 3.02 3.66 1.32 1.35 1.00
25 Education, Training, & Library 2.62 1.04 1.06 0.97 1.00
19 Life, Physical, & Social Science 2.56 2.45 1.07 1.31 1.00
33 Protective Service 1.74 1.76 1.32 0.98 1.00
13 Business & Financial Operations 1.67 1.51 0.70 0.98 1.00
49 Installation, Maintenance, & Repair 1.36 1.43 1.10 0.93 1.00
27 Arts, Design, Entertainment, & Media 1.25 0.83 0.60 0.72 1.00
35 Food Preparation & Serving Related 1.12 0.93 0.78 1.22 1.00
11 Management 0.86 0.92 0.90 0.92 1.00
15 Computer & Mathematical 0.84 1.36 0.51 0.92 1.00
21 Community & Social Service 0.82 1.29 1.18 1.46 1.00
53 Transportation & Material Moving 0.77 0.94 1.13 0.89 1.00
29 Healthcare Practitioners & Technical 0.75 0.88 0.73 1.22 1.00
41 Sales & Related 0.71 0.82 0.78 1.17 1.00
39 Personal Care & Service 0.71 0.90 0.74 1.11 1.00
43 Office & Administrative Support 0.70 0.84 0.73 1.00 1.00
23 Legal 0.68 0.52 0.43 0.67 1.00
47 Construction & Extraction 0.64 0.76 1.33 0.84 1.00
37 Building/Grounds Cleaning & Maint. 0.64 0.78 0.81 0.95 1.00
45 Farming, Fishing, & Forestry 0.54 0.62 20.11 0.27 1.00
31 Healthcare Support 0.51 0.65 0.72 1.08 1.00
51 Production 0.39 0.59 0.58 0.51 1.00
Rosamond (93560) East Kern Kern County
Greater Antelope
Valley US
ROSAMOND, CA DRAFT
ECONOMIC DEVELOPMENT STRATEGIC PLAN PAGE | 27
COMMUTING PATTERNS
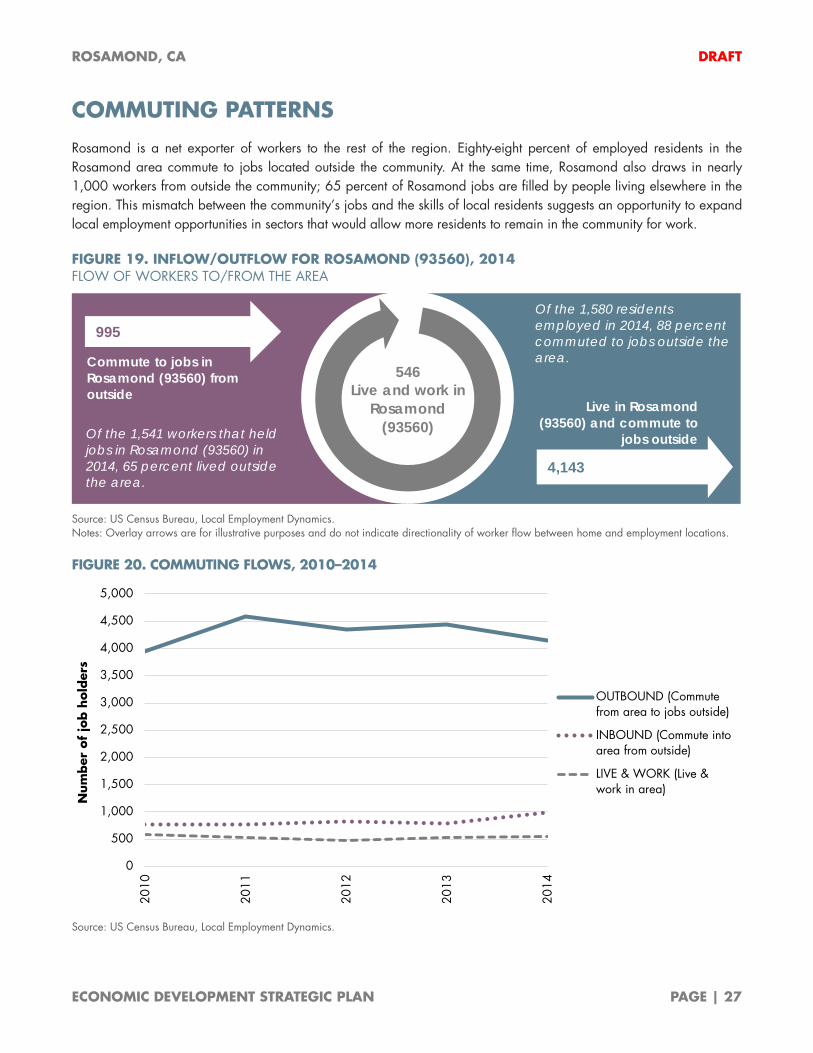
Rosamond is a net exporter of workers to the rest of the region. Eighty-eight percent of employed residents in the Rosamond area commute to jobs located outside the community. At the same time, Rosamond also draws in nearly 1,000 workers from outside the community; 65 percent of Rosamond jobs are filled by people living elsewhere in the region. This mismatch between the community’s jobs and the skills of local residents suggests an opportunity to expand local employment opportunities in sectors that would allow more residents to remain in the community for work.
FIGURE 19. INFLOW/OUTFLOW FOR ROSAMOND (93560), 2014 FLOW OF WORKERS TO/FROM THE AREA
Source: US Census Bureau, Local Employment Dynamics. Notes: Overlay arrows are for illustrative purposes and do not indicate directionality of worker flow between home and employment locations.
FIGURE 20. COMMUTING FLOWS, 2010–2014
Source: US Census Bureau, Local Employment Dynamics.
0
500
1,000
1,500
2,000
2,500
3,000
3,500
4,000
4,500
5,000
2010
2011
2012
2013
2014
Num
ber
of
job h
old
ers
OUTBOUND (Commutefrom area to jobs outside)
INBOUND (Commute intoarea from outside)
LIVE & WORK (Live &work in area)
546 Live and work in
Rosamond (93560)
995
Commute to jobs in Rosamond (93560) from outside
Of the 1,541 workers that held jobs in Rosamond (93560) in 2014, 65 percent lived outside the area.
4,143
Live in Rosamond (93560) and commute to
jobs outside
Of the 1,580 residents employed in 2014, 88 percent commuted to jobs outside the area.

ROSAMOND, CA DRAFT
ECONOMIC DEVELOPMENT STRATEGIC PLAN PAGE | 28
Roughly three-quarters of people who work in Rosamond (76 percent) travel less than twenty-five miles during their commutes. However, that figure has declined slightly since 2010, when 80 percent of workers traveled this distance. Likewise, the share of those traveling twenty-five or more miles to work in Rosamond increased from 21 percent in 2010 to 24 percent in 2014.
Employed Rosamond residents are also traveling longer distances. The share of Rosamond residents commuting at least twenty-five miles to work has increased from 42 percent in 2010 to 49 percent in 2014. The majority of commuters are inbound from or outbound to a southward destination.
FIGURE 21. DISTANCE TRAVELED, 2010 VS. 2014 SHARE OF JOBHOLDERS
PEOPLE WHO WORK IN ROSAMOND (93560)
EMPLOYED PEOPLE WHO LIVE IN ROSAMOND (93560)
Source: US Census Bureau, Local Employment Dynamics.
FIGURE 22. DIRECTION TRAVELED FROM WORK TO HOME, 2014 SHARE OF PEOPLE THAT WORK IN ROSAMOND (93560)
Source: US Census Bureau, Local Employment Dynamics.
FIGURE 23. DIRECTION TRAVELED FROM HOME TO WORK, 2014 SHARE OF PEOPLE THAT LIVE IN ROSAMOND (93560)
Source: US Census Bureau, Local Employment Dynamics.
47%
33%
7%
14%
39% 37%
9%15%
Less than 10miles
10 to 24miles
25 to 50miles
Greater than50 miles
2010 2014
15%
42%
9%
33%
14%
37%
10%
39%
Less than 10miles
10 to 24miles
25 to 50miles
Greater than50 miles
2010 2014
North6%
Northeast8%
East6%
Southeast12%
South37%
Southwest10%
West9%
Northwest12%
North 6%Northeast
5%
East7%
Southeast11%
South42%
Southwest7%
West4%
Northwest18%

ROSAMOND, CA DRAFT
ECONOMIC DEVELOPMENT STRATEGIC PLAN PAGE | 29
FIGURE 24. SELECTED JOBHOLDER CHARACTERISTICS, 2014 SHARE OF WORKERS BY TYPE OF COMMUTING FLOW
AGE
Internal jobholders, or people living and working in the Rosamond area, are more likely to be older workers (55+) compared to outbound and inbound commuters. Inbound commuters are more likely to be younger.
EARNINGS
Outbound commuters are more likely to be in higher-wage jobs compared to internal jobholders and inbound commuters. Approximately 44 percent of Rosamond residents commuting outside the area for work are in jobs that earn $3,333 or more per month, compared to 23 percent of people living and working in Rosamond (internal jobholders) and 26 percent of inbound commuters.
INDUSTRY CLASS
Commuting data suggests that many residents of the Rosamond area are commuting elsewhere for jobs in the manufacturing sector and other goods producing industries. Approximately 22 percent of outbound commuters are in goods producing industries, compared to 4 percent of internal jobholders and 5 percent of inbound commuters. An estimated 87 percent of people living and working in Rosamond are in the service sector.
Source: (all above) US Census Bureau, Local Employment Dynamics
22.0%
23.9%
27.4%
53.5%
55.2%
52.1%
24.5%
20.9%
20.5%
Internal job holders
Outbound commuters
Inbound commuters
29 years or younger 30 to 54 years 55 years or older
39.9%
21.1%
36.8%
37.2%
34.6%
37.0%
22.9%
44.3%
26.2%
Internal job holders
Outbound commuters
Inbound commuters
$1,250 per month or less $1,251 to $3,333 per month More than $3,333 per month
3.7%
22.1%
5.2%
9.5%
19.8%
15.8%
86.8%
58.1%
79.0%
Internal job holders
Outbound commuters
Inbound commuters
Goods-producing Trade, transportation, and utilities All other services

ROSAMOND, CA DRAFT
ECONOMIC DEVELOPMENT STRATEGIC PLAN PAGE | 30
Rosamond is a net importer of workers in arts and entertainment jobs and a net exporter of workers in every other major sector. In addition to healthcare, which has a net outbound flow in excess of 500 workers, employed Rosamond residents are drawn in large numbers to outside employment opportunities in manufacturing, retail, and government.
FIGURE 25. DAILY NET INFLOW/OUTFLOW OF WORKERS BY SECTOR, 2014 NET INBOUND/OUTBOUND COMMUTING FLOWS BY SECTOR
Source: US Census Bureau, OnTheMap Application, and LEHD Origin-Destination Employment Statistics
Net Inbound (net commuting into Rosamond (93560))
Net Outbound (net commuting out from Rosamond (93560))
-512
-468
-309
-281
-202
-199
-178
-167
-153
-149
-125
-105
-75
-72
-66
-48
-33
-27
-10
31
Healthcare
Manufacturing
Retail Trade
Government
Restaurants, bars, & hotels
Construction
Administrative services
Transportation & warehousing
Wholesale Trade
Agriculture
Education
Professional services
Finance & insurance
Personal & other services
Information & media
Oil, gas, & mining
Utilities
Corporate & regional HQs
Property sales & leasing
Arts & entertainment

ROSAMOND, CA DRAFT
ECONOMIC DEVELOPMENT STRATEGIC PLAN PAGE | 31
More than one-half of workers employed in the Rosamond area (93560) live in Rosamond (34.5 percent) or city of Lancaster (20.7 percent). Palmdale is the only other city with more than 100 residents working in Rosamond. Lancaster also draws a significant portion of its workforce from the Rosamond area. More than 900 employed Rosamond residents—20 percent of the total—commute to jobs located in the city of Lancaster.
FIGURE 26. LABORSHED & COMMUTE SHED DESTINATIONS, 2014 TOP 10 PLACES IN ROSAMOND’S LABORSHED (WHERE WORKERS LIVE) & COMMUTE SHED (WHERE EMPLOYED RESIDENTS WORK)
WHERE ROSAMOND (93560) WORKERS LIVE
WHERE EMPLOYED ROSAMOND (93560) RESIDENTS WORK
Source: US Census Bureau, Local Employment Dynamics Note: The commuting patterns analysis was conducted for the 93560 ZIP Code, not the Rosamond CDP, in order to be consistent with other data elements presented in this report. The discrepancy between the number of workers that live in the Rosamond CDP (532) and the number of employed Rosamond residents that work in the Rosamond CDP (536) is a result of the difference in the boundaries of the two geographies.
City (Place) Count Share1 Rosamond CDP, CA 532 34.5%
2 Lancaster city, CA 319 20.7%
3 Palmdale city, CA 144 9.3%
4 Los Angeles city, CA 45 2.9%
5 California City city, CA 32 2.1%
6 Quartz Hill CDP, CA 25 1.6%
7 Mojave CDP, CA 24 1.6%
8 Tehachapi city, CA 22 1.4%
9 Golden Hills CDP, CA 19 1.2%
10 San Diego city, CA 11 0.7%All Other Locations 368 23.9%
Total 1,541 100.0%
City (Place) Count Share1 Lancaster city, CA 927 19.8%
2 Rosamond CDP, CA 536 11.4%
3 Palmdale city, CA 387 8.3%
4 Los Angeles city, CA 241 5.1%
5 Bakersfield city, CA 189 4.0%
6 Mojave CDP, CA 181 3.9%
7 Santa Clarita city, CA 106 2.3%
8 Edwards AFB CDP, CA 76 1.6%
9 Fresno city, CA 62 1.3%
10 California City city, CA 49 1.0%All Other Locations 1,935 41.3%
Total 4,689 100.0%
