draft - e-frame european framework for measuring progress
TRANSCRIPT

Project SSH.2011.6.2-1 290520
Deliverable 2.1 1/64 15th May 2012
“European Framework for Measuring Progress” e-Frame
www.eframeproject.eu
SP1-Cooperation Coordination and support actions (Coordinating actions)
FP7 SSH-2011-3
Grant Agreement Number 290520 SSH.2011.6.2-1
Deliverable 2.1 Dissemination level: PU
Title: Stocktaking report on subjective wellbeing Authors: Saamah Abdallah (nef) and Sorcha Mahony (nef)
15th May 2012
Project SSH.2011.6.2-1 290520
Deliverable 2.1 2/64 15th May 2012
Deliverable 2.1
Stocktaking report on subjective wellbeing
Summary
This report is the output of a stocktaking of subjective well-being measurement in Europe. We have reviewed the different approaches to measuring subjective well-being, carried out a stock-taking of the different surveys that include subjective well-being measures around Europe and explored their characteristics, and interviewed selected individuals within National Statistics Institutes to understand their positions regarding subjective well-being and, if they are collecting such data, find out how it is being used. This report concludes with a series of recommendations to those advocating for subjective well-being data, or researching it, on how to better improve the quality and usefulness of the data.

Project SSH.2011.6.2-1 290520
Deliverable 2.1 3/64 15th May 2012
Contents
Introduction ............................................................................................................................................... 3 1. Background on Subjective Well-Being ..................................................................................................... 5
What are measures of Subjective Well-Being? ........................................................................................ 5 History of Subjective Well-Being measurement ...................................................................................... 5 Why measure Subjective Well-Being....................................................................................................... 7
2. Approaches to measuring Subjective Well-Being ..................................................................................... 9 Evaluative approaches to measuring well-being...................................................................................... 9 Hedonic approaches to measuring well-being ....................................................................................... 11 Eudaimonic approaches to measuring well-being ................................................................................. 12 Choosing or combining? ....................................................................................................................... 15
3. Subjective Well-Being measurement in Europe today ........................................................................... 18 Overview .............................................................................................................................................. 18 Survey types ......................................................................................................................................... 19 Countries .............................................................................................................................................. 20 SWB questions asked ............................................................................................................................ 20 Accompanying data .............................................................................................................................. 24 Question order ..................................................................................................................................... 26 Frequency ............................................................................................................................................ 27 Timing …………. ...................................................................................................................................... 28 Size ………. ............................................................................................................................................. 28 Age range ............................................................................................................................................. 28 Response rates ..................................................................................................................................... 28 Mode ………. .......................................................................................................................................... 29
4. Views on Subjective Well-Being in European NSIs ................................................................................. 30 Arguments for and against subjective well-being .................................................................................. 30 Different measures of subjective well-being ......................................................................................... 33 Uses to date ......................................................................................................................................... 33
5. Recommendations ................................................................................................................................ 36 References................................................................................................................................................ 40 Annex 1 – Items and scales used in measuring subjective well-being ........................................................ 44 Annex 2 – Complete list of surveys............................................................................................................ 54

Project SSH.2011.6.2-1 290520
Deliverable 2.1 4/64 15th May 2012
Introduction
This report is the first output of the e-Frame (European Framework for Measuring Progress) project.1 e-Frame is a major international project which aims to provide a European framework for the debate over the measure of well-being and progress. The project involves a broad range of activities including conferences and workshops, as well as the development of guidelines. It is led by two major European National Statistical Institutes (NSIs), ISTAT (in Italy) and the CBS (in the Netherlands), and includes amongst the partners two other NSIs (the French INSEE and the UK ONS), the OECD, and several universities and civil society organisations. It is funded by the EU FP7 Work Programme.
Six years ago, subjective well-being (hereafter SWB) was an area that was mostly beyond the remit of NSIs. When data were collected, it tended not to have a high profile. However, recent years have seen SWB rise up both the priority lists for NSIs and the agenda for policy-makers and politicians. In 2013, all EU countries will be collecting data on SWB in major social surveys as part of the EU-SILC (Survey of Individual Living Conditions).
For Task 2 of Work Package 2, nef (the new economics foundation) was charged with carrying out a stock-taking of SWB measurement in Europe. This report presents the results of that stock-taking, including the following sub-tasks:
1. A review of the different approaches to measuring SWB
2. Identification of surveys including SWB measures within Europe, and an analysis of their different properties
3. Selected interviews with NSIs to understand their position with regards SWB measurement and the use of their data
Section 1 presents some background on how SWB has got to where it is today, and why it is seen by many to be important to measure. Section 2 outlines the various approaches and theoretical frameworks for measuring SWB that are active within Europe and around the world. Section 3 presents the findings of our review of SWB data collection within Europe to date. Section 4 covers the small set of interviews and discussions that we had with staff involved in official statistics bodies working on SWB. Section 5 presents recommendations for further work emerging from these findings, aimed at those developing and promoting SWB measurement.
It is important to highlight that this report is intended to be read in parallel with the OECD Guidelines on the Measurement of Subjective Well-being, which will cover a range of issues including why NSIs should measure SWB, how they should measure SWB, and how measures of SWB can be used in policy. These Guidelines are due to be published later in 2012.
1 Website: www.eframeproject.eu

Project SSH.2011.6.2-1 290520
Deliverable 2.1 5/64 15th May 2012
1. Background on Subjective Well-Being What are measures of Subjective Well-Being?
The well-being of present and future generations is cited as the objective of the 2006 European Sustainable Development Strategy (EU, 2006), and indeed several other official government documents. For most people, well-being is a phenomenon best understood at the individual level – it captures how people feel, how they are doing and how their lives are. It is a slightly different essence to it than the concept of quality-of-life, which is more about the objective conditions which people experience and which contribute to their well-being.
What counts as a measure of subjective well-being is being more tightly defined. For example, the forthcoming Encyclopaedia of Quality of Life Research defines subjective well-being as:
“The personal perception and experience of positive and negative emotional responses and global and specific cognitive evaluations of satisfaction with life. … Simply, SWB is the individual evaluation of quality of life (QOL)”2
Meanwhile, the OECD Guidelines frame it as:
“all of the various evaluations, positive and negative, that people make of their lives and the affective reactions of people to their experiences”
In simple terms, subjective well-being can be understood as how people understand their lives to be going.
History of Subjective Well-Being measurement
The organised measurement of SWB can be traced back to straight after World War II. From 1946, in the USA, the American Institute for Public Opinion (which would later become Gallup) included a happiness item “In general, how happy would you say you are”, asking people to respond on a three-point scale. Data from these surveys serve as the earliest representative samples in time series on SWB, and were used, for example, in Richard Easterlin’s seminal paper on well-being and economic growth in 1974 (Easterlin, 1974).
The Eurobarometer started collecting data on life satisfaction in 1974, with the item “On the whole how satisfied are you with the life you lead?” on a 4-point scale.
In 1984, the semi-official German Socio-Economic Panel included the question “How satisfied are you at present with your life, all things considered?” on a scale of 0 to 10. The panel survey reaches around 13,500 individuals each year.
However, it was only in 1985 when SWB entered official data collection, as part of Statistics Canada’s new General Social Survey. Items on life satisfaction, happiness and a range of domain satisfaction questions were included and have been collected regularly since then. Sample sizes were between 10,000 and 15,000 to start with, but were then augmented to over 25,000 in 1999 (see Barrigton-Leigh, in press, for an example of a study using this data).
In the 1980s, the first truly international surveys began to measure SWB. The World Values Survey, first conducted in 1981, includes the life satisfaction question “All things considered, how satisfied are you with your life as a whole these days?” on a scale of 1 to 10.
The World Values Survey continues today, but was supplanted as the largest international source of SWB data by the Gallup World Poll in 2006. The World Poll surveys over 1000 people in over 150 countries which
2 Proctor C (in press)

Project SSH.2011.6.2-1 290520
Deliverable 2.1 6/64 15th May 2012
represent 98% of the world’s population. The World Poll has, at times, included the life satisfaction question, but it has more consistently incorporated what is known as Cantril’s Ladder of Life, which asks people to rate their life on a scale of 0 to 10, where 0 is the worst possible life and 10 the best possible life. The World Poll includes a broad range of other well-being questions, including several on negative and positive affect, and others on what might be considered eudaimonic well-being (see Section 2).
The pace of change shifted in 2007, with two conferences on the broader ‘Beyond GDP’ agenda – one at the European Parliament, and one organised in Istanbul by the OECD. These two conferences brought into the mainstream discussions around measuring progress, and SWB was a key part of both. In the European Parliament, for example, Stavros Dimas, then Commissioner for Environment described achieving ‘happiness’ as a critical social challenge, whilst Pier Carlo Padoan, Deputy Secretary General of the OECD, noted the need for subjective well-being indicators to measure progress.3
In the same year, prior to the conference in Brussels, the European statistics agency Eurostat had already commissioned a study entitled “Feasibility study for Well-Being Indicators”.4 At the outset, the possibility of using subjective measures was considered, and the Steering Group of the study soon acknowledged that any complete set of well-being indicators would have to include both subjective and objective measures. The final critical review concluded that “subjective measures are [generally] more valid for assessing matters of subjective substance”; “including both types of measures is an enriching way to look at well-being; and that choosing only one type or another diminishes the usefulness of the indicator set.”
The Beyond GDP movement in general, and also subjective well-being measurement, received a real boost, with the publication of the Stiglitz Commission report in September 2009. The Commission, officially entitled the Commission for the Measurement of Economic Performance and Social Progress, was convened by the French President Nicolas Sarkozy at the beginning of 2008, and included 5 Nobel Prize winners, including Daniel Kahneman, who had already been exploring SWB measures for over 10 years (e.g. Schkade & Kahneman,1998). Whilst the media portrayal of the Stiglitz Commission report being all about measuring happiness were not accurate, recommendations to measure subjective well-being were definitely part of the work. For example, Recommendation 10 says that “Measures of both objective and subjective well-being provide key information about people’s quality of life. Statistical offices should incorporate questions to capture people’s life evaluations, hedonic experiences and priorities in their own survey.”
It is widely acknowledged that the Stiglitz Commission led to a step change in the uptake of alternative indicators, including SWB. It was not long before a wide range of other countries began initiatives to explore the measurement of progress, and SWB has been key to several of them, including the UK Office for National Statistics’ Measuring National Well-Being Programme, and, in Italy, the NSI ISTAT’s Benessure Equo e Sostenibile (Equitable and sustainable well-being). Meanwhile, in Autumn 2010, the Director Generals of the European National Statistics Institutes signed the Sofia Memorandum, which also references the need for subjective measures of quality of life (despite some opposition from some stakeholders). Eurostat itself, in conjunction with the French statistics office, INSEE, set up the Sponsorship Group for Measuring Progress, Well-Being and Sustainable Development in 2010. In November 2011 the Group’s Final Report was adopted by the European Statistical System Committee, including a further commitment to on-going subjective well-being measurement.
In January 2012, the official regulations regarding the 2013 EU-SILC Well-Being module were passed by the European Commission, including a range of questions on SWB, including the key life satisfaction question.
3 See the summary notes on the Beyond GDP conference for more details (www.beyond-gdp.eu/download/bgdp-summary-notes.pdf) 4 The final report can be found here: http://epp.eurostat.ec.europa.eu/portal/page/portal/gdp_and_beyond/documents/Feasibility_study_Well-Being_Indicators.pdf

Project SSH.2011.6.2-1 290520
Deliverable 2.1 7/64 15th May 2012
Why measure Subjective Well-Being
That there is a need to measure well-being is not in any doubt. The well-being of present and future generations is cited as the objective of the 2006 European Sustainable Development Strategy (EU, 2006). A central message of the Stiglitz Commission report was to a call to ‘shift emphasis from measuring economic production to measuring people’s well-being’. (Stiglitz et al., 2009, pg. 12). Eurostat and many European countries have framed their programmes for measuring progress around the word ‘well-being’.
So the next question is whether subjective well-being should be part of the measurement of well-being. The OECD’s forthcoming Guidelines on the Measurement of Subjective Well-being has an excellent section on this question, but here we briefly summarise a number of points to highlight the importance of including SWB measures in official data collection.
First, and perhaps most fundamentally, it is important to remember that well-being itself is inherently subjective. It refers to a property of human beings, i.e. it is people that ‘have’, or don’t ‘have’ well-being. Other things associated with well-being (such as good income, work, education and housing) are properly understood as drivers of well-being, not well-being itself. Of course, acknowledging that well-being is inherently subjective should not be taken as a claim that health is inherently subjective – it isn’t. Health is distinct from well-being, although the two are clearly related (and sometimes mistakenly conflated); health can be understood as a key determinant of well-being, and there is growing evidence that high well-being can lead to positive health outcomes (for example, see Diener and Chan 2011). ‘Health’ refers to an objective state and as such requires objective measures, such as the presence or absence of disease.
Given that well-being is inherently subjective (people are the ones that experience well-being or not), it follows that the measurement of well-being should be based on people’s own – subjective – judgements. Consider a situation where somebody asks you a series of questions about your life (your income, your job, your education, your marital status), and then, based on your responses tells you – ‘I conclude that you have high well-being’. They may be right, but they might equally be wrong – you might not feel pleased at all with your life for some other reason. The validity of their judgement can only be tested based on your assessment of your well-being. It may well be the case that doctors are best able to assess whether someone has an illness or not, and that economists are best able to assess whether an economy is healthy or not, but when it comes to well-being, people themselves are best able to judge and report on their feelings about, and experiences of, life. As Helliwell and Wang put it in the World Happiness Report:
“The most fundamental indicator of your happiness is how happy YOU feel, not whether others see you smiling, your family thinks you are happy, or you have all the presumed material advantages of a good life”5
Second, feeling like life is going well is universally desirable – a claim for which there is now a good deal of evidence (Ryan and Deci 2001). Of course, not everyone will agree on the means of achieving the goal of their ‘life going well’ – for example, for some it might entail living in the country-side, for others it might entail living in a town or city – but it is clear that the end goal is universal; most people have a desire to flourish in their own lives.
Third, taking seriously people’s own judgements about their well-being is more democratic than simply assuming that because certain objective things are in place (concerning for example income, work, education and marital status) a person will have positive feelings and function well. Giving others (researchers, politicians or other expert groups) the authority to make assessments of people’s well-being (even if based on objective evidence) begs questions about who is best placed to make such judgements and on what basis, and could easily lead to paternalism.
5 Helliwell & Wang (2012), pg. 21

Project SSH.2011.6.2-1 290520
Deliverable 2.1 8/64 15th May 2012
Fourth, survey results show that happiness is important to people. In the UK, a survey conducted by a leading market research agency in 2006 found that 81% of people supported the idea that Government’s primary aim should be the ‘greatest happiness’ rather than the ‘greatest wealth’.6 In France, the French think tank ‘La Fabrique Spinoza’ reports that 75% of survey respondents think that a measure of well-being which combines objective measures with levels of satisfaction would be valuable to guide policy makers.7 Given the importance that people place on happiness – and in keeping with the principles of democracy – it follows that measurement of it should form a part of overall measurement of well-being.
Fifth, subjective well-being data can be put to valuable use, in particular in the area of improving policy. It can help to optimise decision-making at each phase of the policy-cycle including: understanding the population, developing policy proposals, detailed design and implementation and policy review and evaluation (Section 3 of nef’s report Measuring our Progress provides a more detailed discussion). For example, data showing that unemployed people report lower subjective well-being scores over and above what might be expected from the loss of income, alongside data showing that unemployment has a long term ‘scarring’ effect, together with evidence that the overall impact of inflation is less than the impact of unemployment on subjective well-being, would give policy makers a good sense of what is at stake when managing the trade-off between, say, policies that will decrease unemployment and reduce inflation.
Another key example of how subjective well-being can help in policy-making is cost-benefit analysis. Policy-makers often rely on quantitative tools to help value the likely impact of different policies or interventions. Until now, it has been very difficult to quantify ‘soft’ outcomes on people’s lives, meaning that countable outcomes (e.g. income and number of jobs) have tended to carry greater weight. Subjective well-being measures provide a way of quantifying these softer outcomes, and a metric which allows both hard and soft outcomes to be assessed in the same terms. These assessments can be integrated into cost-benefit analyses, a technique which is being considered by the UK Treasury (see Fujiwara and Campbell 2011).
The influence on policy can be broader and more general than that as well. There is now a pervasive sense that we need a new way of measuring progress. The Italian statistics office ISTAT talks of the need for a ‘statistical constitution’.8 Including subjective well-being measures in official data collection (rather than as part of an academic endeavour) is in line with this. SWB offers a simple, overarching way to capture multiple issues, and provides an overall sense of whether life is getting better or worse, and whether some people’s lives are better than others. Other potential approaches include creating large sets of indicators of issues deemed important, or an index which combines these indicators into a single number.
But, whilst the former approach may be useful for raising the profile of new issues such as social capital, their complexity means that there is a risk that such sets of indicators are likely to remain relatively marginal in policy-making, particularly when set against strong single indicators such as GDP. Conversely, combining lots of different domains and issues into a single indicator can be accused of being arbitrary (who decides what domains are important and how they are weighted?) and conceptually incoherent (how does one meaningfully combine data on different dimensions?).
6 Data from a poll carried out by GfK NOP in 2006 on behalf of the BBC, reported at http://news.bbc.co.uk/1/hi/programmes/happiness_formula/4771908.stm 7 www.fabriquespinoza.org/wp-content/uploads/2012/03/CSA-pour-La-Fabrique-Spinoza-1200-205-Les-Fran%C3%A7ais-et-le-bonheur.pdf/ 8 http://www.misuredelbenessere.it/fileadmin/upload/Indicatori_di_misurazione_del_benessere__-_22_feb_2012_-_Testo_dell_audizione.pdf

Project SSH.2011.6.2-1 290520
Deliverable 2.1 9/64 15th May 2012
2. Approaches to measuring Subjective Well-Being
Various approaches to measuring SWB have been put forward, some focussing on evaluation of life, others on emotions, and others on what is often called eudaimonic well-being, psychological well-being or flourishing. Whilst these are often presented as competitors (e.g. Dolan et al., 2006, in their review for the UK Department for Environment, Food and Rural Affairs), more recent thinking has seen them as complementary (e.g. Thompson and Marks, 2008). The forthcoming OECD Guidelines considers all three main approaches to SWB as useful.
This chapter builds on the OECD Guidelines and other earlier reviews of SWB measurement, summarising the main approaches identified, offering a brief summary of each, and concluding with a suggestion for how these different approaches might be brought together.
Evaluative approaches to measuring well-being
Evaluative approaches to well-being capture individuals’ appraisals of their own lives – either as a whole or with reference to particular aspects of it. In this sense they attempt to capture cognitive judgements as opposed to feelings. Below we discuss three of the main forms of evaluative approaches to measuring subjective well-being in use today.
Life satisfaction & satisfaction scales
Measuring life satisfaction is one of the most common evaluative approaches to assessing people’s well-being. Whilst it has not been possible to identify the origins of the single life satisfaction measure, it is thought to have been used initially in various ‘values’ and ‘quality of life’ surveys in the 1960s and 1970s, and to have intellectual roots in mental health and other psychological research (Heinz-Herbert Noll, personal communication). Life satisfaction measurement involves individuals making a cognitive judgement and reporting on their satisfaction with life as a whole. Measuring life satisfaction typically entails asking a single question, with an 11-point response scale (0-10) from very dissatisfied to very satisfied.
Satisfaction with life scales – the most prominent of which was developed by Ed Diener and colleagues (see Diener et al. 1985) – also assess global cognitive evaluations of life in the general population. Unlike the single life satisfaction question, the Satisfaction With Life Scale is a 5-item instrument with a 7-point response scale for each item. Including several questions to measure the same construct is a standard psychometric technique to reduce the risk that scores are overly influenced by statistical noise related to individual questions (for example, if a particular word is interpreted differently by some respondents, or translated differently in some countries).
Single item life satisfaction measures are the most widely used measures of SWB – partly because of the appeal of seemingly being able to assess SWB overall with a single question which places little burden on respondents and surveys. Life satisfaction has been included in global surveys such as the World Values Survey and, at times, in the Gallup World Poll, as well as in many national surveys, including the longstanding British Household Panel Survey (now the Understanding Society survey), and the French SILC survey. The vast majority of academic papers studying SWB and its determinants have operationalised the concept using life satisfaction, meaning that it is the best understood indicator.
According to Dolan et. al.: “where there is a commitment to the routine assessment of SWB, a global measure of life satisfaction on a 0-10 scale should provide reliable information in many policy contexts.”
The Satisfaction With Life Scale is recognised as being a more reliable and valid measure of SWB (see for example Dolan et. al. 2006 and Pavot and Diener 2008). However, its extra length means that it has not been used in any official national level surveys.

Project SSH.2011.6.2-1 290520
Deliverable 2.1 10/64 15th May 2012
Ladder of life approach
A further evaluative approach to measuring well-being is to use the ‘ladder of life’, and most typically the Cantril Ladder, developed by Hadley Cantril in 1965 and also known as Cantril’s Self-Anchoring Scale. This entails asking respondents to imagine a ladder with steps numbered from 0 to 10, with 10 representing the best possible life for them and 0 the worst, and then report on which step of the ladder they stand at the present time.
Whilst the ladder of life is decades old, it has only recently started being used extensively, most notably in the Gallup World Poll, which is the largest international survey including measures of SWB, reaching over 150 countries representing 98% of the world’s population.
There has been some suggestion that responses to this measure may be more driven by consideration of economic factors, and that it is more susceptible to comparison effects, as the question asks one to compare with some ‘ideal’ (for example Helliwell 2008). One study reported that the ladder of life correlates with GDP more than life satisfaction (Diener et al., 2010). However, recent analyses have found that, when using matched countries, the ladder of life does not in fact correlate with material measures such as income or GDP any more than life satisfaction does (for example Helliwell and Wang 2012), leading its earlier critics to suggest that it should be used together with life satisfaction as measures of broadly the same construct.
Overall happiness
It is important to mention another category of evaluative measures – those that use the word happiness. Indeed, as has been noted in Chapter 1, the first items to assess SWB referred to happiness. These items are distinct from the hedonic items that will be discussed in the next section of this chapter, as they ask respondents to assess their happiness with their life overall, rather than over a recent time period. As such, they have been found to behave as other evaluative items such as life satisfaction measures, rather than hedonic measures (Diener et al, 2010).
Domain satisfaction
Measuring domain satisfaction is also a relatively widespread evaluative approach to assessing well-being subjectively. In contrast to requiring respondents to make a judgement about their life as a whole, this approach enables respondents to make judgements about particular aspects of their lives (for example their health or their personal relationships) and thereby provides researchers and policy makers with more detailed information than a single, global measure. Particularly prominent here is the Personal Well-being Index – developed by Cummins and colleagues (see International Well-Being Group 2006) – which covers eight domains of life (intended to be amenable to both objective and subjective measurement).
The Index has been used for several years in Australia as the Australian Unity Wellbeing Index, and has been tested in other countries including Hong Kong and the Netherlands (Survey on Perceptions). The UK has also tested a similar approach in a recent Opinion Survey, with 8 domain satisfactions. The EU SILC Well-Being module has also ultimately opted for an approach like this, including 8 ‘satisfaction with’ items, alongside life satisfaction.
Domain satisfactions clearly correlate with overall life evaluation (see, for example, Dolan et al. 2006). They can be made to link with theoretical frameworks (for example Rahman et. al. 2005) and measurement frameworks such as those proposed in the OECD’s Better Life Initiative and the European Statistical System’s Sponsorship Group on Measuring Progress, Well-being and Sustainable Development, both of which structure quality of life into a similar set of domains.

Project SSH.2011.6.2-1 290520
Deliverable 2.1 11/64 15th May 2012
Research suggests that cultural biases that influence subjective questions may be strongest when more general questions such as life satisfaction are asked, and less strong when more specific questions such as domain satisfactions are asked (Diener et al. 2000).
Lastly, domain satisfaction measures offer policy-makers easy-to-use data in that the domains identified often map onto clear policy areas (e.g. health or education).
However, they can be criticised for precisely this reason – i.e., that they do not encourage holistic thinking in the same way that overall measures do. Also, they are open to the criticism that the choice of domains identified is arbitrary (for example see Rojas 2007). If the choice is made by ‘experts’, then it may represent a particular view of what is important to life, which may not entirely tally with the views of the group whose well-being is being assessed. Lastly, there is quite strong inter-correlation between the different measures, suggesting that there is a latent ‘satisfaction’ factor which determines an individual’s response to all the items (ibid.).
Hedonic approaches to measuring well-being
Whilst evaluative approaches ask people to ‘judge’ something about their lives overall, hedonic approaches encourage respondents to provide a ‘snapshot’ of how they feel at a given moment. This, to some extent, addresses a problem with evaluative measures that rely on people remembering their experiences. As noted in the OECD Guidelines, “the so-called ‘peak-end rule’ states that a person’s evaluation of an event is based largely on the most intense (peak) emotion experienced during the event and by the last (end) emotion experienced, rather than the average or integral of emotional experiences over time”.
Some academics, for example the Noble Prize winner Daniel Kahneman, have argued that the focus on SWB measurement should be on immediate ‘on-line’ experience. If we were able to sum the hedonic experience of an individual over their lifetime, then we would have a good assessment of their overall well-being.
Experience sampling and Day reconstruction
The purest form of hedonic well-being measurement is the Experience Sampling Method (ESM). This method entails respondents recording what they are doing and how they are feeling either at random or at set points throughout the day, usually using electronic devices, for the duration of study (which can be a matter of weeks). This can provide excellent fine-grained data on the activities and contexts which lead to higher immediate levels of SWB.
However, ESM comes with its own set of issues – not least the expense and potential burden placed on respondents (Dolan et al. 2006). The Day Reconstruction Method (DRM) – used most prominently by Daniel Kahneman and colleagues – was developed as a means of countering some of the problems associated with ESM. DRM entails respondents writing a diary of the main events from the previous day and assessing them according to their experiences of a range of emotions.
Affect is typically measured in terms of positive and negative affect. Measures of positive affect aim to capture experiences of emotions such as happiness, joy and contentment, whilst measures of negative affect aim to capture negative emotions such as sadness, fear and anxiety.
Recommendations have been made to integrate DRM into official time use surveys. The Princeton Affect and Time Use Survey developed by Alan Krueger and Daniel Kahneman, and administered by Gallup, is an example of how this could be done (Krueger et al., 2009).
However, whilst this is more practicable than ESM, it is still a costly and time-consuming survey device, unlikely to be incorporated into official statistical systems on a very frequent basis.

Project SSH.2011.6.2-1 290520
Deliverable 2.1 12/64 15th May 2012
Affect measures
Because of this, simpler retrospective affect measures, not connected to given moments of time, are much more widespread. Respondents are typically asked to assess the degree to which they have experienced a range of different emotional states over a certain period of time (e.g. yesterday, over the past week, fortnight, month etc.).
Measures like this are found in the Gallup World Poll, the UK’s Survey of Public Attitudes and Behaviours toward the Environment, and the German Socio-Economic Panel Survey. The UK Integrated Household Survey uses a slightly different of this type of question to look at one positive emotion (happiness) and one negative emotion (anxiety).
There is a lot of overlap between such affect measures and mental health scales. Both include items assessing positive and negative affect, although mental health scales tend to focus more on the latter. For example, Wave 3 of the European Social Survey used a set of 15 questions based on the Centre for Epidemiological Studies Depression Scale (CESD-20) – 9 were negative emotions, and 6 were positive ones.
Several health surveys in Europe include sets of questions of this type. The European Quality of Life Survey included 5 positive affect items in 2007. The European Health Interview Survey incorporates ten questions from the SF-36 tool. The EU SILC Well-Being Module will use a subset of five of these ten items
Affect measures can provide policy-makers with a different picture to evaluative measures. Diener et al. (2010), for example, found that they are less driven by income and material conditions, and more by social factors than evaluative measures.
One potential advantage of hedonic measures (particularly DRM) is in terms of dealing with cultural biases. According to one study by Alan Kreuger and colleagues, the difference between France and the USA in terms of average life satisfaction disappears when one uses DRM. The conclusion they draw is that the French are subject to recall biases whereby they tend to reflect on the more negative aspects of their lives when asked to assess their lives overall, but that their emotional experience is comparable to that of Americans.
Eudaimonic approaches to measuring well-being
Whilst evaluative approaches to measuring well-being entail capturing cognitive judgements about life overall or particular aspects of it, and hedonic approaches aim to assess feelings or emotional states, eudaimonic approaches to measuring well-being aim to capture psychological functioning, the fulfilment of human potential, or a ‘life worth having’ (Camfield and Skevington, 2008). Within this broad category, there are a number of approaches, each of which can be understood as having a slightly different emphasis.
The term ‘eudaimonic’ can be traced to Aristotle, and was a direct critique of the hedonic tradition of happiness (Bok 2010). Aristotle argued that the good life was not just about happiness, but about doing good and being virtuous. The original meaning of this term is now not common – few would argue that someone is happy simply by being virtuous. But those supporting eudaimonic approaches argue that what one does is central to SWB, and that a broader range of constructs should be captured when measuring SWB.
Psychological, or flourishing, approaches
Psychological approaches to measuring well-being aim to capture the extent to which respondents have good psychological functioning. Within this category, there are a number of different approaches, each of which entails a slightly different focus and a concomitant difference in recommended measurements.

Project SSH.2011.6.2-1 290520
Deliverable 2.1 13/64 15th May 2012
Carol Ryff identifies six dimensions of psychological well-being: autonomy, environmental mastery, personal growth, positive relations with others, purpose in life and self-acceptance (see Ryff 1989). The related measurement tools – the ‘psychological well-being scales’ – entail self-report scales designed to assess individual well-being at a given moment within each dimension. There is a long, medium and short scale, and in each of these respondents rate statements using a six-point scale. Keyes (2002) builds on Ryff’s work, and introduces the term ‘flourishing’.
Felicia Huppert and Timothy So operationalise ‘functioning’ by attempting to identify the opposite of depression (Huppert and So 2011). The ten features of ‘positive well-being’ which they identify are: competence, emotional stability, engagement, meaning, optimism, positive emotion, positive relationships, resilience, self-esteem and vitality. This approach has been used important in the development of the well-being modules of the European Social Survey (Wave 3, and Wave 6 – forthcoming).
Martin Seligman, often seen as the founder of positive psychology, proposes the following five elements: positive emotion, engagement, relationships, meaning and purpose, and accomplishment, or PERMA (see Seligman 2011). These elements are measured both objectively and subjectively, and for the subjective measures there are a number of recommended questionnaires pertaining to each of the five elements.
Self-determination theory, a body of psychological work which emerged from research on motivation, identifies what it describes as three basic psychological needs - autonomy, competence and relatedness (Deci and Ryan 1980). It makes the case that flourishing requires these three needs to be met (Ryan et al. 2008) and the authors argue that hedonic and evaluative measures assess epiphenomena of well-being. A key feature of this theory is that it claims universality – i.e. that the three needs are at the heart of well-being for cultures all around the world. Self-determination theory has not been systematically operationalised in any official national survey to date, though it did play a central role in Eurostat’s Feasibility Study for Well-Being Indicators.9
When it comes to population-level data collection, however, the most successful operationalisation of the psychological approach is the Warwick and Edinburgh Mental Well-Being Survey (WEMWBS; Tennant et al., 2007). WEMWBS is a scale of 14 positively worded items, with five response categories, which covers most aspects of positive mental health in the current literature, and which measures hedonic as well as eudaimonic aspects. A shorter 7-item version has also been developed (Stewart-Brown et al., 2009). Warwick and Edinburgh Universities were commissioned to develop this in 2006, and it has been academically validated as having good psychometric properties, good validity and reliability with the ability to distinguish between population groups. It has been widely used in population surveys in the UK and elsewhere, including in the Health Survey for England in 2011 and the new UK Understanding Society survey.
The Understanding Society survey includes another set of questions (the GHQ-12) which can be seen as assessing some elements of psychological well-being. Aside from these two examples, no systematic assessments of psychological well-being have been included in any official surveys. Having said that, an item on feeling the things you do are worthwhile has been taken from Wave 3 of the European Social Survey and included in the UK’s large scale Integrated Household Survey, and the EU SILC Well-Being Module.
Several reasons have been put forward to measuring functioning, as well as feelings (nef, 2011). Firstly, the interpretation of data can be made more meaningful. As we outline in the ‘dynamic’ model on the following page, good functioning is integral to ‘converting’ the resources that people have available to them into positive overall feelings. A eudaimonic approach helps policy-makers to understand the mediating factors at work in this overall relationship.
9 http://epp.eurostat.ec.europa.eu/portal/page/portal/gdp_and_beyond/documents/Feasibility_study_Well-Being_Indicators.pdf

Project SSH.2011.6.2-1 290520
Deliverable 2.1 14/64 15th May 2012
Another key advantage of measuring functioning is that improved functioning can lead to other positive outcomes, beyond immediate happiness or satisfaction. For example, there is growing evidence that increased feelings of autonomy lead to improved health outcomes (see Coggins et. al. 2007); and that social relations can improve one’s chances of finding a job (see Stoneman and Anderson 2006).
Assessing functioning as well as feelings may also address the common concern regarding the sensitivity of subjective well-being measures (such as life satisfaction) that do not appear to change much over time at the national level (see Johns and Ormerod 2007). In fact, this commonly heard critique is not borne out by the evidence, as meaningful increases in life satisfaction have indeed been found at the national level (see Stevenson and Wolfers 2008), but, it is fair to say that a single question on a 0–10 scale is likely to be less sensitive than a range of indicators.
Lastly, the idea of pursuing eudaimonic well-being appeals to those who do not believe that well-being is just about feeling good and that meaning, purpose, social relations and other aspects of functioning are important in their own right (Forgeard, 2008). The idea of eudaimonia can trace its roots to Greek philosophy, and is built on evidence that some broad categories of functioning (e.g. feeling autonomous or having good relationships) are universally desirable and valuable to people (Ryan & Deci, 2001).
Of course, the obvious argument against eudaimonic measures is that they require too much data collection to be cost-effective. Secondly, as noted in the OECD Guidelines, consensus has not emerged on how to operationalise eudaimonic well-being, whether it should eb considered multi-dimensional or uni-dimensional and, if the former, what the key dimensions are.
Capabilities approach
The capabilities approach – developed by Amartya Sen (and expanded by Martha Nussbaum) – is about the extent to which people have opportunities to function – or to ‘be someone or do something’ (e.g. read, write, be healthy, care for others). Within this approach, capabilities are the set of options from which a person can realistically choose in any given situation. (Other key concepts in this approach are: functioning – when an option is realised; and conversion factors – the factors [personal, social and environmental] that govern the conversion of resources into capabilities.)
In terms of measurement, Nussbaum has developed a list of ten ‘central human capabilities’ each containing constructs that could be measured; life, bodily health, bodily integrity, senses imagination and thought, emotions, practical reason, affiliation, other species, play and control over one’s environment. However, this list has not been operationalised in terms of measurement indices. Also, although Sen’s work on capabilities had a direct influence on the creation of the Human Development Index, Sen himself does not advocate a particular set of measures. Rather, he believes that in the interests of democracy and diversity, this should be done through processes of public engagement in particular contexts which will vary in their geographic, political, economic, environmental, social and cultural settings.
The main issues in the debate around using the capabilities approach to inform well-being measurement are: whether to measure capabilities (the genuine options that people have) or functionings (the things that people actually do, given the opportunities they have); and whether to use objective or subjective measures.
In terms of the first of these debates, it is argued that the government’s role is to provide the conditions for flourishing. If people choose not to, that is their choice. For example, if people chose not to work, even when jobs are available, that is their decision. However, there is a body of evidence which suggests that people are often very bad at what is called ‘affective forecasting’ – i.e. predicting the emotional outcomes of their decisions (Wilson and Gilbert 2003). So an individual might chose not to work and rely on benefits, without realising that this would probably lead to lowering their well-being. Whilst governments might not, and should not, directly influence people’s decisions, how people make their decisions is not something exogenous to society – education and the media being two clear shapers of our values and aspirations.

Project SSH.2011.6.2-1 290520
Deliverable 2.1 15/64 15th May 2012
As for the debate between subjective and objective approaches, Robeyns and van der Veen (2007) argue for the prioritisation of objective measures.
A further contribution to the capabilities approach comes from Paul Anand. In his work – responding to the purported lack of statistics to measure capabilities at the individual level – Anand seeks to demonstrate the extent to which the measurement of human capabilities is achievable, and explores techniques for such measurement. He and his colleagues have attempted to operationalize Sen's and Nussbaum’s capabilities approach by developing indicators of capabilities across a wide range of life domains (consistent with theoretical and methodological conventions used in household surveys), including in the areas of health, housing, safety, poverty assessment and quality of life, and have put forward a set of survey questions corresponding to each of Nussbaum’s capabilities and their sub-components (see Anand et. al. 2009, p.132). Their research has also focused on the extent to which the capabilities measured in their suggested survey instrument are covariates of life satisfaction, and found that many are.
In a similar vein to Anand (and explicitly inspired by him), Luc van Ootegem and colleagues also explore the capability approach as a framework for researching well-being. As part of the Well-Be-Be project (“Towards theoretically sound and democratically legitimate indicators of Well-being in Belgium”), and taking Sen’s idea that a particular set of measures should be developed democratically – through public engagement processes – van Ootegem investigates the applicability of the capabilities framework, and finds that it can indeed be fruitfully applied. Their ‘well-being triangle’ model, based on the capability-functioning approach (with capabilities at the bottom, achieved functionings in the middle and valuations at the top), alongside Anand’s seven ‘life domains’ (happy life, achievement of goals and dreams, healthy life, education, information and culture, social life, environment and personal integrity), has driven the well-being questions in the survey on well-being in Flanders.
Having, loving, being approach
The ‘having, loving, being’ approach, originally formulated by Eric Allardt, deals with the extent to which people’s ‘basic needs’ for having, loving and being are met (Allardt 1993). ‘Having’ refers to the material resources and living conditions needed for a basic standard of living (such as income, housing and health), as well as the conditions necessary for these to be in place. ‘Loving’ refers to peoples’ needs for social relationships, networks, emotional support and social integration. ‘Being’ refers to the need for recognition, participation and belonging. The having, loving and being model was originally designed as the basis for the comparative Scandinavian Welfare Study (1972), and its basic principles underlie the indicator system therein.
The influence of Allardt’s ‘having, loving, being’ approach stretches across Europe, being used in the framework of Eurofound’s European Quality of Life Survey. For example, in discussing the drivers of well-being, Eurofound reports that household composition has an influence on satisfaction levels, and the conclusion drawn is that “it is not only material aspects – having – which make up a good life, but also the quality of social relations, and particularly intimate relations within the family. This reiterates the famous formula of Eric Allardt (1993), that quality of life “is the sum of having, loving, and being” (Eurofound 2005).
Choosing or combining?
The above sections have attempted to summarise the main arguments for and against the different approaches to measuring SWB. However, we do not intend to recommend any particular one over another in this document. For further discussions of this, relevant resources include Ryan & Deci (2001), Diener et al. (2010), nef (2011), Dolan & Metcalfe (2011), Helliwell & Wang (2012) and the forthcoming OECD Guidelines.
Indeed a popular approach emerging is to treat the different approaches as complementary rather than competing. The dynamic model of well-being developed by nef as part of the UK Government Office for

Project SSH.2011.6.2-1 290520
Deliverable 2.1 16/64 15th May 2012
Science’s Foresight Project on Mental Capital and Well-Being in 2008 integrates different approaches to measuring well-being as shown in Figure 1 (an adapted version). Ed Diener and Daniel Kahneman (2010) have reconciled their differences to advocate a combined hedonic-evaluative approach, which has gained considerable favour. And the forthcoming OECD Guidelines consider all three main approaches to SWB as useful.
The model describes how an individual’s external conditions (bottom left) – such as their income, employment status, housing and social context – act together with their personal resources (bottom right) – such as their health, resilience and optimism – to allow them to function well (middle) in their interactions with the world and therefore experience positive emotions (top). As can be seen in the diagram, the various approaches sketched out above can be mapped onto particular elements of the model. For example: evaluative and hedonic approaches relate to ‘good feelings day-to-day and overall’ (top box); eudaimonic or psychological approaches relate to ‘good functioning and satisfaction of needs’ (middle box); the ‘having, loving, being’ approach relates to both ‘good functioning/ satisfaction of needs’ and ‘external conditions’ (middle and bottom left boxes); and the capabilities approach relates to ‘good functioning and satisfaction of needs’, and ‘external conditions’ (middle and bottom left boxes).
Evaluative & Hedonic-------------
Eudaimonic/ psychological----------
Having, loving, being----------------- |
|
| |
Figure 1: Adapted dynamic model of well-being (adapted from Thompson & Marks, 2008)
Of course, which SWB measures are used and how they are used depends on what they are being used for. Single overall measures such as life satisfaction or indices made from hedonic or eudaimonic indicators are powerful communication tools and provide an overall sense of how a population group or society as a whole are doing, but they do not on their own make clear which policy levers can help improve well-being. That information can come from the disaggregated data from more detailed SWB indicators, or indeed
Overall evaluation
Good feelings day-to-day
Personal resources
e.g. health, resilience, optimism, self-esteem
External conditions
e.g. material conditions, social capital
Good functioning and satisfaction of needs
e.g. to be autonomous, competent, safe and secure,
connected to others
Capabilities

Project SSH.2011.6.2-1 290520
Deliverable 2.1 17/64 15th May 2012
from analysis of SWB in conjunction with other objective indicators measuring the ‘drivers’ of well-being (as discussed under ‘Accompanying Data’ in the following chapter). When this information is used, one starts to get a picture of what can be done to improve well-being.

Project SSH.2011.6.2-1 290520
Deliverable 2.1 18/64 15th May 2012
3. Subjective Well-Being measurement in Europe today
Overview
Thirty-four official and semi-official surveys were found in Europe which included some SWB questions. Several of these surveys were already known to the research team. To identify national surveys, a systematic attempt to contact individuals working in all official statistics offices in the EU was made by the e-Frame team, to ask if they have any survey tools including SWB items. Contacts were identified in 18 out of the 27 EU member states, as well as Norway and Switzerland. Most of these came from the Task Force involved in the development of the EU-SILC Well-Being Module for 2013,10 or from the Task Force on measuring Quality of Life which formed part of the joint Eurostat/INSEE Sponsorship Group on Measuring Progress, Well-Being and Sustainable Development.11
Countries with SWB items (11)
Countries with no SWB items (8)
Countries that did not respond (2)
Countries we were unable to contact (8)
Austria Belgium Finland France Germany Ireland Italy Netherlands Poland Switzerland United Kingdom
Czech Republic Denmark Lithuania Luxembourg Romania* Slovakia Spain Sweden
Malta Norway
Bulgaria Cyprus Estonia Greece Hungary Latvia Portugal Slovenia
Table 1: SWB assessment in the EU, Switzerland and Norway
* In the case of Romania, there are no official government surveys, but there is one survey administered by the Romanian Institute for Quality of Life, a government-funded semi-official body.12
Table 1 lists countries based on whether they have SWB items in any of their official surveys or not.
Of the 34 survey or survey modules we reviewed:
22 were conducted by official national statistical bodies (including those belonging to Austria, Belgium, France, Ireland, Italy, the Netherlands, Poland, Switzerland and the UK).
5 were conducted by national official bodies that are not statistics offices (examples in the UK, Finland, Germany, Belgium (Flanders) and Romania)
10 The EU-SILC Well-Being Module regulations can be found here: http://epp.eurostat.ec.europa.eu/portal/page/portal/income_social_inclusion_living_conditions/documents/tab/Module%202013/Guidelines%202013%20Module%20-ver%20March%202012.pdf 11 Information available at http://epp.eurostat.ec.europa.eu/portal/page/portal/pgp_ess/about_ess/measuring_progress 12 http://www.iccv.ro/oldiccv/english/newsite/index.htm

Project SSH.2011.6.2-1 290520
Deliverable 2.1 19/64 15th May 2012
2 were conducted or co-ordinated by Eurostat
2 were conducted by other official EU bodies (namely DG COMMS and Eurofound)
2 Europe-wide surveys were conducted by academic bodies
1 was conducted by the UNECE (and reached 13 countries)
Survey types
Ten of the surveys identified were explicitly health surveys (or health modules of other surveys). These included the European Health Information Survey and a range of national health surveys. The nations of Great Britain (Scotland, Wales and England) each have a different health survey, which we have counted separately. Other countries with health surveys include Austria, Belgium, Ireland, Italy, Netherlands, and Switzerland.
Eight surveys or survey modules specifically refer to well-being or quality of life. This number includes three pan-European surveys: the European Social Survey (well-being module), the European Quality of Life Survey and the Well-Being module of EU-SILC. The French NSI INSEE and the Polish NSI GUS have specifically developed modules on well-being or quality of life. The former, is the “feelings, attitudes and quality of life” module attached to one of the waves of SILC in France. The latter is a Polish survey on “quality of life and social cohesion”.
The other two national well-being/quality of life surveys are the Finnish Well-Being and Services survey conducted by the National Institute for Health and Welfare and the Romanian Diagnosis of the Quality of Life.
Five surveys can be described as general social surveys, which attempt to cover a broad range of social issues. These include the core of the European Social Survey, the UK Understanding Society survey, the German Socio-Economic Panel Survey, the Dutch survey on Social Cohesion and the Belgian Socio-cultural changes in Flanders survey. Of these, only the Dutch survey is conducted by an NSI. One can also consider the Polish survey to be part of this group as it covers both quality of life and social cohesion.
Two further surveys can be considered as surveys of perceptions or attitudes. These include the Eurobarometer, and the Dutch Survey on Perceptions.
Five surveys were focussed on material living conditions. These included three SILC instruments –French, Austrian and Swiss; as well as the Dutch Integrated Survey on Living Conditions (SLI). The Bank of Italy also carries out a large Survey on Household Income and Wealth.
One survey identified in the UK (the Survey of Public Attitudes and Behaviours toward the Environment) focuses on environmental attitudes and behaviours.
The remaining two surveys can be considered ‘general’ household surveys, which tend to be larger in sample size, but containing less detail on specific issues. The National Survey for Wales is a large-scale survey covering a range of issues. The Integrated Household Survey administered in the UK to 450,000 individuals brings together various surveys including the Labour Force Survey and Annual Population Survey.
It is worth pointing out that our search focused on surveys interviewing adults. We made no systematic attempt to identify surveys for children, which we believe would be a very worthwhile, though separate project. Having said that, some of the surveys we identified did include children (e.g. the English and Welsh Health Surveys interviewed children down to 8 years old). The European Regional Office for the WHO has

Project SSH.2011.6.2-1 290520
Deliverable 2.1 20/64 15th May 2012
carried out one survey measuring the SWB of children in Europe (Currie et al. 2004), which was used in UNICEF’s Report Card 7 on children’s well-being (UNICEF, 2007).13
Countries
As we have noted, 11 countries in Europe conduct official national surveys, with a further 1 country conducting a semi-official survey. However, there are large differences in the number of surveys conducted by each country. The UK, with its devolved statistical system, has the largest number (7), including 3 health surveys, and 2 general large surveys. The Netherlands has 4 surveys and Italy 3.The only large EU country that does not have any national survey including SWB data is Spain, with the next largest without any data being Portugal and Greece.
SWB questions asked
All three main categories of SWB measures are asked amongst the 34 surveys.
Life Satisfaction
Evaluative measures are the best represented. 18 surveys (just over half) ask a variation of the standard life satisfaction question. However, it should be noted that there is very little consistency in terms of the wordings used. Only two wordings could be confirmed to exist in more than one survey:
“All things considered, how satisfied are you with your life as a whole nowadays? Please answer using this card, where 0 means extremely dissatisfied and 10 means extremely satisfied.” (used in the ESS core, the Defra survey and the Flemish survey)
and
“Overall, how satisfied are you with your life nowadays?” (used in the UK ONS survey, and two Welsh surveys)
However, of course, it should be noted that translations may have made it difficult to identify where the same question is being asked in different languages.
All except three surveys used a 0-10 or 1-10 scale, which is favourable given the recommendation that longer scales are better for accommodating cultural biases in response styles.14
One further survey used the Satisfaction with Life Scale, which is a 5-item scale developed to measure the same concept as life satisfaction. Whilst, as noted earlier, such a scale might provide more reliable data, it has probably not been popular amongst NSIs as it requires five questions to be inserted into surveys to measure one concept, rather than just one life satisfaction question.
With so many different life satisfaction questions, comparing results from different countries may prove problematic, and we would recommend a process of standardisation or analysis to assess what the outcome of these differences are in terms of response patterns.
13 For further information on measuring SWB in children, we suggest contacting The Children’s Society (http://www.childrenssociety.org.uk/what-we-do/research/well-being-1) who are conducting quarterly surveys of children’s well-being in the UK. 14 This comes from a review of cultural biases produced for Eurostat as part of the ‘Analysis, implementation and dissemination of well-being indicators’ study currently being carried out by nef, IDEA Consult and other organisations. The review is not yet publicly available.

Project SSH.2011.6.2-1 290520
Deliverable 2.1 21/64 15th May 2012
In any case, the predominance of life satisfaction as a question and the fact that it has been used successfully in so many official surveys, lends weight to the argument for it being used as a first step towards SWB measurement in other large instruments, such as the EU-SILC core.
Happiness
Five surveys included evaluative happiness items, all on 0-10 or 1-10 scales. In all except one of these surveys, the happiness item was included alongside a life satisfaction item.
As noted in Chapter 2, evaluative happiness items behave similarly to life satisfaction items and so it is not clear what additional information they contribute. The options of either a) dropping the evaluative happiness question or b) transforming the evaluative happiness question into a hedonic positive affect question, should be considered.
Domain Satisfactions
15 surveys include a set of domain satisfaction questions, including the majority of surveys that ask life satisfaction. No standard set of domain satisfaction questions appeared to be dominant in Europe. The Personal Well-Being Index (PWI) developed by Professor Robert Cummins as a standardised set has been used worldwide, but it appears that it has not been adopted systematically in Europe – only one survey, the Dutch Survey on Perceptions, explicitly identifies itself as using the PWI set.
The most common domains identified in the domain satisfaction questions included: personal relationships (10 surveys), work or main activity (10 surveys), housing (8 surveys) and health (8 surveys). The appendix provides a full list of domains identified in the surveys.
The number of domains in each survey varies, from only 3 items in some, to over 10 in others.
Whilst each country will have different priorities, there would be value in a standardised core of domain satisfaction items so as to help comparison across countries. Whilst the Personal Well-Being Index may be an appropriate option, it seems necessary to ask why NSIs have not favoured the use of this set to date, with length possibly being an issue.
SF-10
The SF-10 is a set of 10 items taken from the Short-Form (36) Health Survey, developed by the RAND Corporation in the USA in the late 1980s, based on a range of pre-existing instruments. There is a large literature associated with the measure, with over 4000 publications to date.15 The SF-10 is a set of mental health questions, including items that measure positive and negative affect. Some items can be interpreted as measuring vitality, although that is not their original intention. As such it straddles two categories of measures – hedonic and eudaimonic.
We identified 2 surveys using the entire SF-10, including the European Health Interview Survey, and 6 further surveys that appeared to use subsets of the SF-10, including the SILC Well-Being Module. With the exception of the SILC Well-Being Module and one other survey, all of the other surveys using the SF-10 or adaptations of it were Health Surveys. It is not clear how the subsets were selected in these 6 surveys, nor whether there is much consistency regarding which items are used in each subset.
It is commendable that the statistics community has taken to the use of this well-established instrument for measuring people’s experience of their lives. We feel that the extent of the use of this instrument may have been ignored by some of those working on SWB – it being seen as a mental health tool – and would
15 See http://www.sf-36.org/tools for more information.

Project SSH.2011.6.2-1 290520
Deliverable 2.1 22/64 15th May 2012
recommend that the SWB community explore the behaviour of this tool in further, and contrast it with other tools such as the life satisfaction question, and other instruments derived from mental health measurement such as the CESD (Centre for Epidemiological Studies Depression Scale). We also suggest that some attempt at standardising the use of this tool across Europe be made, with the European Health Interview Survey and the SILC Well-Being Module potentially being useful mechanisms to this end. On the other hand, the SF-10’s time frame (last four weeks), has been criticised as being too long for a hedonic measure – this criticism needs to be explored further.
Other positive and negative affect questions
Ten other surveys employed some other set of negative and/or positive affect items. Some of these, such as those used in the European Social Survey Well-Being Module and the Defra survey, are based on the CESD scale (see above). Generally these surveys include both positive and negative affect items, although the UNECE only include negative items, whilst the Health Survey for England only includes positive ones. In general, negative items dominate mixed sets.
GHQ-12 & WEMWBS
A couple of standardised question sets covering what can be seen as psychological or ‘eudaimonic’ well-being have become established in the UK. The GHQ-12 (General Health Questionnaire) was developed in 1972, and has been used in the British Household Panel Survey since its inception in 1991. It is a mix of positively and negatively worded items which relate to eudaimonic concepts such as sense of value and resilience. Whilst we have categorised it as a eudaimonic measure, it was originally developed as a mental health tool and does not comprehensively cover the range of concepts that have been labelled as eudaimonic. It also includes a couple of items (feeling unhappy and depressed, and feeling reasonably happy) which are clearly hedonic. The GHQ-12 has been carried into the Understanding Society survey in the UK, and has also been introduced into the English, Scottish and Belgian Health surveys.
WEMWBS (the Warwick Edinburgh Mental Well-Being Scale) is a 14-item set of questions for measuring psychological well-being. Unlike the GHQ-12, it can be clearly identified as a eudaimonic measure and was designed specifically for this purpose. It covers a broad range of constituent concepts, such as optimism, self-esteem, vitality, engagement, resilience, autonomy, and social relations. However, the producers of the scale have developed it as a uni-dimensional measure, and do not advocate its use to measure these concepts separately. A short version (SWEMWBS) with 7-items has also been used. To date, all the population-level surveys using the WEMWBS or SWEMWBS were in the UK – the Understanding Society survey, and the English and Scottish health surveys. However, the survey has been translated and validated in other languages.
We would recommend that survey developers outside the UK might want to explore the potential use of these two instruments.
Other eudaimonic questions
A range of other questions that can be considered eudaimonic were included in 14 other surveys. For 3 surveys, this is just a single question on feeling that what you do in life is worthwhile (the UK Integrated Household Survey, and the two Welsh surveys). This single item is intended to represent eudaimonia in general. Following this example, the SILC Well-Being Module also includes this question, as well as some questions on social relationships. The item is an adaptation of one used in the European Social Survey well-being module, where it is asked alongside a range of other eudaimonic items. The WHOQOL-Bref instrument used in a couple of surveys (see below) also includes a question on finding life meaningful, a related concept

Project SSH.2011.6.2-1 290520
Deliverable 2.1 23/64 15th May 2012
Other eudaimonic concepts covered in the surveys include:
Social relationships
Vitality
Engagement
Self-esteem
Optimism
Self-efficacy
Autonomy
Opportunities for growth
Resilience
Overall, generally there is little consistency in the eudaimonic questions included in the surveys. WEMWBS, the meaning question used in the UK surveys and the SILC Well-Being Module, and those questions that can be considered to be eudaimonic within the GHQ-12 and the SF-10 are the only questions asked regularly. None of these are based on a theoretical multi-dimensional model of eudaimonic well-being, such as the ones listed in Chapter 2. Substantial work needs to be done in this area.
Firstly, a decision needs to be made as to whether eudaimonic well-being is best treated by NSIs as unidimensional or multi-dimensional. The WEMWBS tool has been found to be best interpreted as unidimensional (Stewart-Brown et al, 2009), but larger sample sizes might reveal value in treating is as multi-dimensional in the future. nef has already explored multi-dimensionality to some extent in the National Accounts of Well-Being based on the European Social Survey (Michaelson et al, 2009), and in unpublished work carried out in the development of the European Quality of Life Survey. Different aspects of eudaimonic well-being were found to be differentially influenced by different types of determinant variables such as family, income and activities. Some of the models for measuring flourishing described in Chapter 2 have also demonstrated multi-dimensionality for their measures (e.g. Ryff & Keyes, 1995). The implication is that policy-makers monitoring eudaimonic well-being from a multi-dimensional perspective might be led towards different policy recommendations.
Of course, once multi-dimensionality has been established, the next decision that needs to be made is which dimensions are the most important to capture. Some of the criteria that will be relevant for determining this include:
universality (which dimensions can be considered important to everyone, or at least most people within a population)
orthogonality with other dimensions
WHOQOL-Bref
The other pre-existing instrument seen in the European surveys, is the World Health Organisation Quality of Life Survey (WHOQOL-Bref). It is used in two surveys, the Austrian Health Information Survey and the Finnish Well-Being and Services Survey. The WHOQOL-Bref is a 26-item instrument developed in 1993. Whilst it is a measure of quality of life, not subjective well-being, the definition of quality of life employed by its developers includes a strong focus on subjective well-being:
“An individual’s perception of their position in life, in the context of the culture and value systems in which they live, and in relation to their goals, expectations, standards, and concerns. It is a broad ranging concept,

Project SSH.2011.6.2-1 290520
Deliverable 2.1 24/64 15th May 2012
affected in a complex way by the person’s physical health, psychological state, level of independence, social relationships, and their relationship to salient features of their environment.”16
As a result, the instrument itself includes a range of questions covering all three dimensions of SWB including some evaluative questions on different domains, two hedonic questions, and a range of eudaimonic questions, including on meaning, engagement, vitality and self-esteem. It is considered by some writers to be ‘more subjective’ than an instrument such as the SF-36 (which the SF-10 is based on; WHOQOL Group, 1995), and the psychological elements of the WHOQOL have been shown to correlate with measures of negative affect (Aigner et al., 2006).
Without questioning the value of the tool as a measurement of quality of life, it would still be valuable to assess how well it measures SWB, by comparing WHOQOL scores with those resulting from SWB measures, and exploring its relationships with policy-relevant variables.
Accompanying data
To maximize the value of SWB data, it needs to be collected in surveys alongside other measures. This will allow analysts to determine what is important to people’s well-being. In particular measures of the conditions of people’s lives and their activities will be valuable, because these are things which are more immediately sensitive to policy. The more accompanying data we have, the more we will build a picture of how to improve people’s well-being, and the interactions between different variables. For example, what are the characteristics of people who are resilient to the negative impacts on well-being of low income or poor health? Also, it will allow us to assess the relative impacts of different factors on people’s well-being. For example what is the relative impact of not having access to green space, compared to not having access to local services? What are the relative effects of working too long, compared to low income?
Some of the kinds of accompanying data available in the surveys explored were:
Health – Self-assessed health, range of physical health conditions (e.g. cardiovascular disease, diabetes, etc.), mental health, disability, BMI, health service use, health-related behaviours such as drinking, smoking, diet and physical activity.
Financial circumstances – Income, material deprivation, savings, debt, expenditure, property, insurance and pensions.
Social relationships – Family, household composition, social contact, social support.
Activities – Social and political engagement, volunteering, leisure activities (including physical activities), socio-cultural activities, media and internet use, religious activities.
Attitudes and values – Political attitudes, environmental attitudes, identity, values, priorities, religion, institutional and social trust, perceptions of society.
Employment – Employment status, sector, job, hours worked, work-life balance, working conditions, job satisfaction.
Local environment – Safety, local neighbourhood, access to services.
Public serves – Use of public services and satisfaction with public services
Housing – Housing conditions, tenure
Education
Other – Life events, environmental behaviours
16 WHOQOL Group (1995)

Project SSH.2011.6.2-1 290520
Deliverable 2.1 25/64 15th May 2012
These accompanying variables provide an incredibly rich background for analysing SWB. Researchers would be advised to explore the table to consider which surveys may be useful to study questions they are exploring.
We are also able to combine these findings, with a literature review carried out for Eurostat which explored different potential drivers of SWB and assessed the evidence base for a relationship.17 That review lead to recommendations on which policy-relevant drivers should be explored further, particularly in the European context.
Together, these two pieces of work allow us to produce four lists:
1. Factors for which there is clear evidence of a relationship with SWB.
- Income
- Employment status and job security
- Housing conditions
- Health
- Community and social activities
- Support from friends and family
- Trust (general and towards institutions)
- Social exclusion
- Social contact
- Feelings of safety & experience of crime
- Debt
- Commuting time
- Noise pollution
The recommendation here is that data is collected for these factors by NSIs so that they have a clearer picture of how they affect populations in their country.
2. Factors for which some evidence of a relevance to SWB has been found, but which needs consolidating – and the data is available in the surveys reviewed here.
- Material deprivation (in particular as operationalised by the Europe 2020 indicator)
- Housing conditions (including tenure, dwelling type, overcrowding and quality of dwelling)
- Working hours (long working hours are known to have a negative effect on SWB, but what counts as long?) and working conditions
- BMI (body mass index)
- Socio-cultural activities
- Physical activity
17 Review is part of part of the ‘Analysis, implementation and dissemination of well-being indicators’ study currently being carried out by nef, IDEA Consult and other organisations. The review is not yet publicly available.

Project SSH.2011.6.2-1 290520
Deliverable 2.1 26/64 15th May 2012
For the above determinants of SWB, there is still need for more analysis so as to better understand relationships, or explore their universality. Fortunately, for some of these, the data is indeed available in some of the surveys we have reviewed here and the recommendation is that analysts explore their relevance using this data.
3. Factors for which evidence of a relevance to SWB has been found, but which needs consolidating – but the data is not available in the surveys reviewed here.
- Temporary work contracts
- Informal care
- Diet
- Expenditure patterns
- Problems with sleep
- Quality of education
For the above determinants, further analysis is also required, but data was not available.
4. Factors which have been found to be important to SWB, and for which data would be best collected from sources other than surveys.
Lastly, it is worth highlighting a few SWB drivers for which data may be best collected through means other than surveys. NSIs can use location markers such as postcodes to match this data with survey data and therefore analyse impacts. Factors include:
- Air & noise pollution
- Recorded crime rates
- Green space
- Local services
- Mean neighbourhood income (so as to assess relative income)
- Urbanisation levels
Of course, there may well be further determinants of SWB which are not identified here.
At the same time, countries which already collect SWB data in multiple surveys should seek to harmonise the measures used (Michaelson et al., forthcoming) so as to allow the different relationships with well-being to be brought together within a common framework. In the UK, for example, the 4 ‘ONS’ questions incorporated into the Integrated Household Survey have also been included into the Welsh Health Survey, but not the Scottish or English ones.
Question order
SWB questions, particularly general ones such as life satisfaction or happiness are sensitive to context effects – i.e. trivial factors which might systematically bias people’s responses. One of the simplest and most easy to monitor are question order effects. Responses to general SWB questions may be influenced by the immediately preceding questions, as they focus the respondent’s mind on particular aspects of their

Project SSH.2011.6.2-1 290520
Deliverable 2.1 27/64 15th May 2012
life. So, for example, if a survey asks about life satisfaction immediately after asking about someone’s health, their response to the life satisfaction question is likely to be more influenced by their health, as this is what they have just been thinking about. As a result, much stronger correlations between health and life satisfaction will be seen than if the life satisfaction question were asked before the questions on health (see OECD Guidelines for more on this issue).
The OECD Guidelines will recommend that general questions such as life satisfaction are asked at the beginning of surveys.
Looking at the 36 surveys we have reviewed, only one survey respected this recommendation – the Eurobarometer. The National Survey for Wales asks life satisfaction after a question on whether the respondent speaks Welsh, which we doubt to have an impact on responses. All other surveys ask the life satisfaction question after questions on quite specific aspects of life which are likely to influence their response including questions on material conditions, exposure to physical violence, and social exclusion.
The UK ONS are investigating the order effect of subjective well-being questions through conducting split samples of the four ONS headline questions in different orders. The results of this analysis will be available in November 2012.
Two recommendations can emerge from this picture. Firstly, we echo the OECD’s call for general SWB questions to be included at the beginning of surveys where possible, or after neutral questions if not. Secondly, a recommendation goes out to researchers to use the opportunity of different surveys to explore further the impacts of question order on responses. Is there a way to ‘control’ for question order effects? To what extent do question order effects affect other types of SWB questions such as the GHQ-12?
Frequency
The most frequent survey covered was the Eurobarometer, which is carried out at least twice a year. Fifteen other surveys are (or were) annual, some of them with large enough samples to analyse the data based on quarters or months (for example the UK Integrated Household Survey).
However, several other surveys were less than annual. Four surveys were carried out every two-to-three years, 9 surveys every 4 or more years, and 4 surveys are or were, for the time being, one-offs, including the SILC Well-Being Module in 2013. The European Social Survey Well-Being module has been carried out once so far (the core survey is carried out every two years), and will be repeated, with alterations, this year, but there is no guarantee of it being repeated again in the future.
Typically it is the Health surveys which are less frequent, often every five years.
What is a suitable frequency for the collection of SWB data? One might think that more frequent data collection is, by necessity, best. This is mostly true, although there is some suggestion, based on data from the Gallup-Healthways Survey in the USA which samples 1000 individuals a day, that fluctuations in well-being over very short periods (e.g. days or weeks) are likely to be less interesting to policy-makers as they are probably shaped more by news stories and the national mood, than by ‘real’ factors such as unemployment levels (Abdallah, 2011).
Annual fluctuations may also often seem to be arbitrary – an argument for even less regular data collection, but this may be a result of the small sample sizes that are typical of most surveys for which we have substantial longitudinal data, such as the Eurobarometer. In any case, with such large annual fluctuations, there is even greater need for frequent data collection so as to be able to decipher general long-trend amidst the short-term noise (see Chapter 3 of the OECD Guidelines for more on this issue).
Ultimately, the trade-off, in terms of cost, is between sample size and frequency. We suggest analysing the two longitudinal surveys with the largest samples in Europe - the British Household Panel Survey and German Socio-Economic Panel Survey, comparing the quality of the data when given years are omitted

Project SSH.2011.6.2-1 290520
Deliverable 2.1 28/64 15th May 2012
from the data set, versus when sample sizes are reduced by omitting subsets of the sample. In this way, a better understanding of the optimal trade-off can be determined.
The other factor to consider, of course is timeliness, with frequent data collection being advantageous.
Timing
Another important context factor which influences SWB responses is weather. Reported life satisfaction is substantially reduced on days during cloudy weeks (Barrington-Leigh, 2008). To ensure that the particular weather of one day does not unduly influence responses, surveys should therefore be carried out over several days, rather than all at once. Furthermore, they should be carried out at the same time of year each wave of the survey.
This does typically tend to be the case, as the table shows. If survey results are to be comparable between countries, however, it is also desirable for different countries to collect data at the same time of the year. This would be particularly valuable for surveys such as the European Health Interview Survey and the SILC Well-Being Module, but unfortunately that is not the case.
The optimal technique for data collection in terms of timing, would be for on-going data collection throughout the year, as is typical of most national Labour Force Surveys. This would ensure that the final figures produced can be considered representative for the year and are not influenced unduly by typical news events or weather conditions.
Size
Sample sizes vary considerably in the surveys reviewed, from 1,000 per country for the Eurobarometer, to 200,000 adults for the UK Integrated Household Survey. The SILC Well-Being Module will be the first survey to collect standardized data across the EU for large sample sizes. The European Health Interview Survey has between 2,000 and 35,000 respondents in each country. Other large national surveys worth noting are the Italian Health Conditions Survey (140,000 respondents), the UK Understanding Society survey (100,000), the Italian ‘Everyday life aspects’ survey (50,000), the French 2010 SILC instrument (25,000), the German Socio-Economic Panel (20,000) and the Swiss and Welsh Health Surveys (around 18,500 each).
Age range
As noted at the beginning of this report, we have not sought to identify surveys that particularly look to assess children’s SWB, although we know that very few exist.
Amongst the adult-focused surveys we looked at, different age ranges were employed, with the youngest self-reporting respondents being included in the UK Understanding Society survey (10+), the Dutch Health Survey (12+) and the Scottish, English and Welsh Health Surveys (13+). Two Italian surveys include 14 year olds in their samples.
Beyond that, 9 surveys sample at 15 years old and over (including cross-European surveys such as the European Health Interview Survey, the European Social Survey and the Eurobarometer), 8 sample at 16 years old and over, and a further 8 at 18 years old and over.
Response rates
Response rates ranged from just over 50% in some countries in some of the cross-European surveys (such as the Eurobarometer and the European Health Interview Survey), to 86% in the Swiss SILC instrument.

Project SSH.2011.6.2-1 290520
Deliverable 2.1 29/64 15th May 2012
Mode
Mode is another important context factor which might influence responses, and so it would be valuable for standardization to emerge across Europe.
The dominant mode for the surveys covered to date is face-to-face interviewing, either pen-and-paper or computer assisted (14 surveys). 1 survey was found to be conducted by phone, whilst 6 surveys were self-complete (at least for the SWB questions). 12 of the remaining surveys employed mixed methods either depending on the part of the survey, or the country.
The ONS has investigated mode effects on its monthly Opinions Survey, comparing face-to-face administered questions with self-completion (ONS, 2011). They found little difference in responses to their life satisfaction question, their question on feeling worthwhile and their question on feeling happy, but greater rates of anxiety were reported with self-completion than face-to-face (3.7 on a scale of 0-10 for self-completion, compared to 3.2 for face-to-face). It is likely that there is a social desirability bias at play for this negatively worded question when an interviewer is present, something which should be avoided. On the other hand, self-completion produced much lower response rates (77% versus around 99% for face-to-face), an effect which was particularly pronounced in older respondents. This is also something which should be avoided. Combined, these findings suggest that face-to-face interviews are preferable for most questions, but there may be some, more sensitive items, where self-completion is preferable.

Project SSH.2011.6.2-1 290520
Deliverable 2.1 30/64 15th May 2012
4. Views on Subjective Well-Being in European NSIs
This chapter is based on contributions from staff working in official statistics at NSIs, Eurostat and the OECD. Contributions were gathered through face-to-face conversations, phone calls and emails. To maintain anonymity, we will not identify the individuals who have contributed (except in one case, where a contribution was made by way of a published paper). The organisations were:
BFS (Swiss NSI) CBS (Dutch NSI) CSO (Irish NSI) Destasis (German NSI) GUS (Polish NSI) INE (Spanish NSI) INSEE (French NSI) ISTAT (Italian NSI) ONS (UK NSI) Statistics Austria Statistics Finland Statistics Slovakia Eurostat OECD Statistics Directorate
As can be seen this includes a mixture of organisation that are collecting data on SWB (BFS, CBS, CSO, GUS, INSEE, ISTAT, ONS, Statistics Austria, Eurostat) and those that are not (Destasis, INE, Statistics Finland, Statistics Slovakia). Having said that, it is likely that those who responded to our emails requesting information were likely to have been those who were more sympathetic to SWB than those who did not respond.
Our research questions were:
What are the arguments for and against SWB data collection that are voiced by NSIs?
Which measures have gained more or less favour?
What is being done with SWB data that is being collected to date?
Arguments for and against subjective well-being
There is still clearly some debate in NSIs regarding the collection of SWB data. Discussion of SWB variables was described as creating “very high tensions” and the discussion on SWB prior to the signing of the Sofia Memorandum by DGINS was described as “very heated” and a “very very big fight”.
Nevertheless contributors who have been advocating the use of SWB measures felt that the fight had largely been won, and that, for the most part, they expected NSIs in Europe would be collecting some SWB data. The SILC Well-Being Module, of course, is a key element of this. Indeed discussions at the Task Force for the Module made it clear that there were more advocates than sceptics of SWB collection, which ensured that those who were relatively neutral accepted the majority position.

Project SSH.2011.6.2-1 290520
Deliverable 2.1 31/64 15th May 2012
We found this shift when receiving the following comments from NSIs that, to date, had not been vocal supporters of SWB:
“Measures of subjective well-being should be included into a data collection of NSI’s on quality of life.” [Destasis, Germany]
“If national statistical offices wish to give their users a comprehensive view, they have to / should pay attention also to the measurement of the subjective well-being.” [Statistics Slovakia]
“According to [our] approach, subjective measures are regarded as an indispensable and crucial element in multidimensional measurement and the analysis of the quality of life.” [GUS, Poland]18
Nevertheless, one contributor felt it was important to highlight that SWB data cannot be seen as a replacement to objective measures:
“However, we think that subjective measures cannot totally replace objective indicators of the various domains of quality of life.” [Destasis, Germany]
Arguments for subjective well-being
We do not intend to provide a comprehensive review of all the arguments for subjective well-being. The OECD Guidelines will provide plenty of these. It is simply worth highlighting a couple of comments made by some of the NSIs who are ‘new’ to SWB.
Firstly, as highlighted in a couple of the quotes above, SWB data is seen to be needed to ensure that NSIs are getting a comprehensive view of quality of life.
“It is assumed that subjective indices of the quality of life will constitute an integral part of the public statistics information system in the area of social indicators. This will allow a more comprehensive analysis of the social situation and thereby will give a greater practical significance of those analyses for the purposes of social policy.” [GUS, Poland]
A second valuable point was also made by this contributor:
“It is often very difficult or even impossible to perform so-called objective measurement of many elements included in the quality of life.” [GUS, Poland]
In other words, subjective measures are in some cases not an alternative option, but indeed the only option.
Nevertheless, several concerns were noted which are covered below.
Quality of data
Unsurprisingly, data quality was mentioned by a few contributors. Question marks included worries about the reliability of data, and the perception that it doesn’t go up or down over time.
However, it is worth noting that none of the contributors actually expressed this concern themselves – rather they identified it as being a concern of other people, and a concern which they felt was unfounded. For example, one contributor argued that NSIs should not reject SWB on the grounds of data quality, but rather should work to improve that quality [Statistics Slovakia]. She cited the OECD Guidelines as a tool for working to better SWB data collection methods.
18 This quote comes from a paper (Szukiełojć-Bieńkuńska, 2010) by a staff member at the Polish NSI, that was sent to us when we asked for views from the organisation.

Project SSH.2011.6.2-1 290520
Deliverable 2.1 32/64 15th May 2012
Implications for policy and politics
Another concern mentioned (again, not by people who held this view themselves), is that there is no appropriate place for SWB in policy and politics. One contributor noted that there is a ‘fear’ that SWB might be misused by politicians [Statistics Slovakia]. Another contributor said that some people believe that government’s role should not be to interfere with well-being, but rather to protect the disadvantaged [Eurostat]. Lastly, there was a concern that policy associated with SWB might be seen as ‘utopian’ or ‘Brave New World’ [OECD]
Duties of statisticians
A parallel concern to that regarding the duties of policy-makers, is that statisticians do not have a role in collecting SWB data:
“Some consider statisticians should focus on ‘pure statistics’.” [Statistics Slovakia]
A concrete example of this concern is the Czech NSI, which legally is not allowed to collect information on people’s opinions.
Data collection issues
A specific concern raised by one NSI, was that staff working for an NSI, seen to be official representatives of the government, would be met with ‘hostility and incredulity’ if asking whether respondents felt ‘happy’ in the context of the recession.
“I … asked a number of very experienced Field Interviewers about their perceptions of the [SWB] questions and they were very uncomfortable with the nature of the question, indicated a preference for not having to ask the questions and foresaw quite a lot of difficulty with this part of the questionnaire.”
The contributor noted an increase in verbal assaults and threats of physical assault against field interviewers, and believed that asking interviewees about SWB might provoke such assaults.
A related point was made by another contributor specifically in relation to hedonic measures, which she felt placed “high and uncertain demands on data collection” [Statistics Slovakia]. The contributor worried that such questions might be a challenge for NSI interviewers.
There is some evidence which suggests that some of these concerns may not be unfounded. The UK ONS has recently carried out a qualitative study on how the SWB questions included in the Integrated Household Survey are perceived by respondents (Ralph et al, 2011). This study found that some respondents were unclear as to why a government official is asking about SWB.
The study identified a specific problem related to questions asking people to say how they felt in the last day. Respondents felt it strange and mistaken for a survey to be asking about the previous day, as they felt that that day may not be ‘representative’ of their life in general. Of course, the ONS asks this question with the intention of combining data from several thousand respondents, and so the particularly good or bad days of any given individual will not influence the overall results. However, the study recommended the inclusion of a short phrase asking respondents to focus on the last day even if it was atypical, which appeared to neutralise these concerns. This suggests that slight changes to wordings may be important to deal with the concerns raised by the other NSIs.

Project SSH.2011.6.2-1 290520
Deliverable 2.1 33/64 15th May 2012
Critics of subjective well-being
Is it possible to characterise who is likely to be a critic of SWB, and who an advocate? One contributor highlighted that opinions tended to be personal rather than national, and that very few countries had a consensus position on SWB (with France in support and some Nordic countries against being the main exceptions to this rule) [Eurostat].
More important than nationality, is background [Eurostat], with a rough split between social scientists who are, generally, more supportive, and macro-economic statisticians who are, generally, less supportive. As a result, groups which are dominated by social statisticians (such as the SILC Well-Being Module Task Force) have tended to come out in favour of SWB, whereas those that are more mixed (such as the Sponsorship Group Task Force on Quality of Life) have been more cautious. A couple of contributors highlighted that the Task Force’s outputs were “a compromise between the positions presented by the Group’s members” [GUS, Poland]. According to one contributor, members wanted to stick to things that are “objective, measurable, that cannot be influenced by individual feelings, emotions, etc.” [Eurostat]
In relation to this, it is worth noting that, politically in the current economic crisis, politicians have demonstrated a greater interest in economic indicators than social ones, which heightens the position of economic statisticians versus social statisticians, who attract less political interest.
Different measures of subjective well-being
Where respondents expressed or commented on a preference for one approach to measuring SWB over another, it was consistently a preference for evaluative measures over hedonic measures. For example:
“In our opinion life satisfaction should be seen as the central category of the various potential measures of well-being. Compared with overall life satisfaction we assess questions … on positive and negative emotions [to] be stronger affected by individual differences in mentality as well as cultural differences between countries.” [Destasis, Germany]
We have already noted the concerns of one contributor that collecting data on hedonic well-being will be more taxing for field interviewers [Statistics Slovakia]. These views had been noted by one of the advocates of SWB measurement, who felt that NSIs felt more comfortable with evaluative measures than hedonic measures. “Happiness is seen as more normative than life satisfaction” [OECD]
It is worth noting, as the OECD contributor did, that these concerns are not consistent with the research base. This suggests that, if anything, within Europe, it is evaluative measures that are more likely to be influenced by cultural biases than hedonic measures.19
Furthermore, as we have noted in Chapter 4, many NSIs have been collecting data on predominantly hedonic measures such as the SF-10 for several years.
Uses to date
We were keen to paint a picture of how SWB data is being used in Europe to date and asked several NSIs who had reasonably established data collection what they knew about how their data was being used by other parts of government.
19 This was covered in the review on cultural biases for Eurostat (see earlier footnote). One useful reference is Krueger et al. (2009)
Project SSH.2011.6.2-1 290520
Deliverable 2.1 34/64 15th May 2012
UK
The UK has had an interest in SWB for several years, with publications by government departments exploring the determinants of subjective well-being as early as 2002 (Dolan et al, 2006; Donavan and Halpern, 2002).
Defra (the Department for the Environment, Food and Rural Affairs) incorporated evaluative, hedonic and eudaimonic measures of SWB into their Sustainable Development Indicator set in 2007, and published annual reports including this data for four years.20
We spoke to one individual in the UK, who was involved in the Measuring National Well-Being programme, and therefore the new Integrated Household Survey. According to this contributor, policy-makers are already exploring how to use SWB data, and a couple of examples were given:
Staff at the Cabinet Office (which has an overarching policy role) have developed a tool for exploring how different policies might affect SWB. The tool makes a distinction between impacts which fit within traditional policy-making remits, and those which are perhaps not normally considered by policy-makers.
The Treasury has produced a supplement to the ‘Green Book’ (the standard document for policy assessment and evaluation), which explores how soft-outcomes can be incorporated into cost-benefit analyses using SWB data.
One concrete example of a policy change has been around sentencing guidelines, which now take into consideration the emotional impact of thefts, rather than just the monetary value of stolen/damaged goods.
Italy
ISTAT is currently working on a document summarising the use of SWB in the country to date. Some examples of use include:
Use of subjective health measures in Adjusted Life Expectancy measure
Analysis of domain satisfaction data by regional governments
Inclusion within framework for measuring progress, in BES (Benessere Equo e Sostenibile)
Austria
The Austrian Lebensministerium (the Ministry of Environment and Agriculture) commissioned a large study from Statistics Austria, with funding from Eurostat, to explore quality of life in the country (Statistics Austria, 2010). It used data from the Austrian SILC instrument (which includes life satisfaction) and the Austrian Health Information Survey (which includes hedonic measures).
The purpose of the study was to raise the profile of SWB measurement in the country, and it was aimed at people working in both well-being and sustainable development. It has also attracted interest in regional policy.
The contributor doubted that the study has led to any concrete policy yet, but does believe that there is a chance it might influence the Ministry’s policies on rural development, given the key finding that people in rural areas had higher SWB than people in urban areas.
20 http://sd.defra.gov.uk/progress/national/

Project SSH.2011.6.2-1 290520
Deliverable 2.1 35/64 15th May 2012
France
A paper has been written by INSEE exploring the life satisfaction data from their 2010 SILC instrument (Godefroy, 2011). Beyond this, staff at the NSI report that they are unaware of any other use by policy-makers of their data. They felt that it was still too early, given that data has only been available since 2011.
The Netherlands
The contributor at CBS reported that there has been little interest in SWB within the Dutch government to date. They are now setting up an initiative to get more attention for the data that exists. Activity at the moment centres around getting a clear picture of the possible users within policy, and organising meetings to explore potential use of the data. A short paper has also been written by the CBS exploring some of the health-related drivers of SWB (De Jonge et al, 2009).
Switzerland
Life satisfaction is incorporated into the Swiss MONET Sustainable Development indicator set.21
Others
The Polish, Finnish and Irish statistics offices reported no uses of their SWB data to date. The Polish NSI is preparing an analytical report based on the data from the Quality of Life and Social Cohesion Survey.
21 http://www.bfs.admin.ch/bfs/portal/fr/index/themen/21/02/ind32.approach.3201.html

Project SSH.2011.6.2-1 290520
Deliverable 2.1 36/64 15th May 2012
5. Recommendations
The purpose of this study is to review the measurement of SWB in Europe today. In doing so we have provided a unique oversight of the surveys currently collecting data, and how this data is being used.
This final chapter draws together some of the findings to make some recommendations. Firstly we make two recommendations for issues to be explored at the e-Frame Conference in Paris ion June 2012:
Eudaimonic well-being – The eudaimonic perspective has not been fully integrated into some of the mainstream initiatives on measuring progress. We suggest that the Conference take seriously this perspective so as to determine how best to measure eudaimonic well-being, including consideration of whether it is multi-dimensional or not.
Well-being determinants – What are the key determinants of well-being? Where can further research be carried out to better understand these relationships? Which determinants should be regularly included in conjunction with SWB data collection? This should be a key area for research and the Conference would provide an excellent platform for developing a research agenda in this area.
We also make several recommendations to standardise and harmonise SWB measurement and ensure maximum utility. The recommendations are intended for analysts and researchers in the field of SWB, both in academia, but also in national statistics offices. We do not make direct recommendations for what measures to include in future surveys – such recommendations will be found in the OECD’s forthcoming Guidelines.
Standardise the life satisfaction question – No less than 13 different wordings of the life satisfaction question were found in Europe. Sometimes the differences are very subtle, but even such small changes of wording can influence responses. A clear recommendation is for those collecting life satisfaction across Europe to come together and agree on wordings, particularly in the run-up to the SILC Well-Being Module. In any case, the successful use of life satisfaction in 18 of the surveys sampled here, suggests that it is ready for use in further large-scale surveys such as the EU SILC core.
The role of happiness – Five evaluative happiness questions were found in the European surveys. This may be valuable for academic surveys but, if space is limited and only the evaluative construct is of interest, then one could drop these items. If survey designers want to measure hedonic well-being, then these questions need to be adapted.
A harmonised domain satisfaction core set – Domain satisfaction questions are prolific across Europe, and cover a wide range of topics. Whilst we do not recommend that the same set of domain satisfaction questions is used by all countries, it may be valuable for a core set of domain satisfaction questions to be harmonised.
Exploration of the SF-10 and WHOQOL – The SF-10 instrument and subsets of it are used in a large number of surveys across Europe. It is probably fair to say that it has been disregarded by many promoters of SWB. We would recommend that researchers explore further the behaviour of this instrument to determine whether it is an acceptable operationalisation of hedonic well-being, how it relates to policy-relevant factors, and the implications of the time frame it asks respondents to think about (the last four weeks). There would also be some value in understanding what has been the impact on the overall scale of selecting subsets from it, as many of the surveys we have reviewed have done. Similar analysis would be valuable for the WHOQOL-Bref instrument.
Project SSH.2011.6.2-1 290520
Deliverable 2.1 37/64 15th May 2012
Establish the multi-dimensionality of eudaimonic well-being – Consensus on the multi-dimensionality of eudaimonic well-being has still not been reached, despite several findings supporting this idea. Systematic research is required to develop a set of items to measure different policy-relevant aspects of eudaimonic well-being.
Well-being determinants – The review of surveys revealed that a wide range of other variables are often collected alongside subjective well-being data. Based on this, and a review of well-being drivers carried out for Eurostat we are able to identify:
o Factors which are known to be important to SWB, and should therefore be monitored by NSIs.
o Factors for which some evidence of a relevance to SWB has been found, but which needs consolidating – and the data is available in the surveys reviewed here. Analysts would do well to explore this data.
o Factors for which some evidence of a relevance to SWB has been found, but which needs consolidating – but the data is not available in the surveys reviewed here.
o Factors which have been found to be important to SWB, and for which data would be best collected from sources other than surveys.
Question order effects – The OECD Guidelines will make a clear argument for putting life satisfaction and general SWB questions at the beginning of surveys. Here we suggest that researchers acknowledge that, to date this has not been the case, and that it would be valuable to explore ways in which question order effects may be controlled for, and to what extent question order effects different types of SWB question.
Frequency and sample size – Optimally, large sample sizes should be collected annually or even more frequently (though day-to-day or week-to-week variation is likely to not be policy-relevant). For situations where resources are scarce, we recommend analysis of the largest longitudinal data sets available in Europe (the British Household Panel Survey and the German Socio-Economic Panel Survey) to identify the trade-off between frequency and sample size in terms of data quality.
Timing – Ideally, data should be collected throughout the year. Where this is not possible, consistent timing is important to avoid seasonal effects shaping results.
Making the case for SWB – Our interviews with NSIs suggest that concerns about data quality may be waning away, and where they are reported, they may not be the central concern. More important, it seems, are concerns about how SWB data might be used in policy and how to manage data collection. Advocates of SWB would do well to focus on these issues.
Identifying supporters – There is still a divide between social and economic statisticians, with the latter typically more suspicious of SWB measures. Advocates need to be aware of this. In particular, they need to consider how to make the case for SWB more favourable for economic statisticians.
Presenting the value of different types of SWB – It appears that life satisfaction and evaluative measures have been broadly accepted by NSIs. The same cannot be said for hedonic or eudaimonic measures. We think it important that the evidence on the validity and crucially the value of these different measures be brought to the fore.
Mode – Preliminary research by the ONS, suggests that face-to-face interviews lead to higher response rates, but that they may also enhance social desirability biases for particularly sensitive questions.
Lastly, a simple recommendation – make sure the data is used! There is plenty of SWB data in Europe which does not appear to have been brought to the attention of policy analysts. This data could provide vital lessons both on how to measure SWB and on how it can be used for policy.

Project SSH.2011.6.2-1 290520
Deliverable 2.1 38/64 15th May 2012
References
Abdallah S (2011) Pursuing Rising National Well-being: A Sisyphean Challenge? nef working paper #3. Available at www.neweconomics.org/publications/pursuing-rising-national-well-being
Allardt E (1993) ‘Having, Loving, Being: An Alternative to the Swedish Model of Welfare Research’ In M Nussbaum and A Sen (eds) The Quality of Life (Oxford: Oxford University Press).
Anand, P., Hunter, G., Carter, I., Dowding, K., Guala, F. and Van Hees, M. (2009). The Development of Capability Indicators. Journal of Human Development and Capabilities, 10: 1, 125 -152.
Barrington Leigh C (2008) ‘Weather as a transient influence on survey-reported satisfaction with life’ MPRA Paper No 25736, http://mpra.ub.uni-muenchen.de/25736/
Barrington Leigh C (in press) ‘The Quebec convergence and Canadian life satisfaction 1985-2008’. Available at http://wellbeing.ihsp.mcgill.ca/publications/Barrington-Leigh-DRAFT-Quebec.pdf
Bok, S. (2010). Exploring Happiness. Yale: Yale University Press.
Boulanger, P.-M., Lefin, A.-L., Ruwet, C., Bauler, T., Gerard, A., Prignot, N., Van Ootegem, L. And S. Spillemaeckers (2011). Toward theoretically sound and democratically legitimate indicators of wellbeing for Belgium. Science for a Sustainable Development Final Report. Brussels: Belgian Science Policy.
Camfield L & Skevington S (2008) ‘On subjective well-being and quality of life’ Journal of Health Psychology 13:764.
Coggins, T., Cooke, A., Friedli, L., Nicholls, J., Scott-Samuel, A. & Stansfield, J. (2007). The Mental Well-being Impact Assessment Toolkit. North West: Care Services Improvement Partnership.
Currie, C., Roberts, C., Morgan, A., Smith, R., Settertobulte, W., Samdal, O. and Barnekow Rasmussen, V. (Eds) (2004). Young People’s Health in Context. Health Behaviour in School-age Children Study’ (HBSC): International report from the 2001/2002 study. Copenhagen: WHO Regional Office for Europe.
De Jonge T, Hupkens C & Bruggink J (2009) ‘Living a happy, healthy and satisfying life’. Statistics Netherlands
Deci, E. and Ryan, R. (1980). Self-determination theory: When mind mediates behavior. Journal of Mind and Behavior 1, 33–43.
Diener, E. and Chan, M. Y. (2011). Happy People Live Longer: Subjective Well-Being Contributes to Health and Longevity. Applied Psychology: Health and Well-being, 3(1), 1-43.
Diener, E., Emmons, R. A., Larsen, R. J., and Griffin, S. (1985). The Satisfaction with Life Scale. Journal of Personality Assessment, 49, 71-75.
Diener E., Scollon S., Oishi S., Dzokoto V. and Suh E. (2000). Positivity and the construction of life satisfaction judgements: Global happiness is not the sum of its parts’. Journal of Happiness Studies 1:159-176
Diener, E. and Kahnemann, D. (2010). Income’s Association with Judgments of Life Versus Feelings. In E. Diener, J. F. Helliwell and D. Kahneman (Eds.) International Differences in Well-Being. Oxford: Oxford University Press.
Diener E, Helliwell J &Kahneman D (2010) International Differences in Wellbeing (New York: Oxford University Press).

Project SSH.2011.6.2-1 290520
Deliverable 2.1 39/64 15th May 2012
Dolan, P. and Metcalfe, R. (2011). Comparing measures of subjective wellbeing and views about the role they should play in policy. London: Office for National Statistics.
Dolan, P., Peasgood, T. and White, M. (2006). Review of research on the influence of personal well-being and application to policy making. London: Defra.
Donovan N & Halpern D (2002) ‘Life satisfaction: the state of knowledge and implications for government’ London: Prime Minister’s Strategy Unit.
Easterlin R (1974) ‘Does economic growth improve the human lot? Some empirical evidence. In P. A. David and M. W. Reder (Eds), Nations and Households in Economic Growth: Essays in Honour of Moses Abramovitz. New York: Academic Press, Inc.
EU (2006) Renewed EU Sustainable Development Strategy. Available at http://register.consilium.europa.eu/pdf/en/06/st10/st10917.en06.pdf
Eurofound (2005) Quality of Life in Europe (report). Available at: http://www.eurofound.europa.eu/pubdocs/2004/105/en/1/ef04105en.pdf
Eurostat (2010) Feasibility study for well-being indicators. Available at http://epp.eurostat.ec.europa.eu/portal/page/portal/gdp_and_beyond/documents/Feasibility_study_Well-Being_Indicators.pdf
Forgeard, M., Jayawickreme, E., Kern, M. & Seligman, M. (2011). Doing the right thing: Measuring wellbeing for public policy. International Journal of Wellbeing, 1, 79–106. p.97.
Fujiwara, D. and Campbell, R. (2011). Valuation Techniques for Social Cost-Benefit Analysis: Stated Preference, Revealed Preference and Subjective Well-being Approaches. A Discussion of the Current Issues. London: HM Treasury and DWP.
Godefroy P (2011) ‘Life-satisfaction: French people give themselves an average score of 7 out of 10’ (Paris:INSEE)
Helliwell, J. F. & Wang, S. (2012) ‘The state of world happiness’ In J Heliwell, R Layard & J Sachs (eds) World Happiness Report (The Earth Institute: New York)
Helliwell, J. F. (2008). Life Satisfaction and Quality of Development (National Bureau of Economic Research Working Paper Series, 14507). Massachusetts: NBER.
Huppert, F. A. and So, T. T. C. (2011). Flourishing Across Europe: Application of a New
Conceptual Framework for Defining Well-Being. Social Indicators Research, December, pp.1-25.
International Wellbeing Group (2006). Personal Wellbeing Index. Melbourne: Australian Centre on Quality of Life, Deakin University
Johns, H. and Ormerod, P. (2007). Happiness, economics and public policy. London: Institute of Economic Affairs.
Keyes C (2002) ‘The mental health continuum: From languishing to flourishing in life’ Journal of Health and Behaviour Research 43:207-222.
Krueger A, Kahneman D, Fischler D, Schkade D, Schwarz N & Stone A (2009) ‘Time use and subjective well-being in France and the U.S.’ Social Indicators Research 93:7-18.
Michaelson J, Abdallah S, Steuer N, Thompson S & Marks N (2009) National Accounts of Well-being (London: nef)
Michaelson J, Seaford C, Abdallah S & Marks N (forthcoming) ‘Measuring what matters’ In F Huppert and C Cooper (eds) Interventions and Policies to Enhance Wellbeing
nef (2011) Measuring our Progress (London: nef)

Project SSH.2011.6.2-1 290520
Deliverable 2.1 40/64 15th May 2012
Nussbaum, M.C. (2000) Women and Human Development: The Capabilities Approach. Cambridge University Press, Cambridge.
ONS (2011) Measuring Subjective Wellbeing in the UK, Investigation of subjective well-being data from the ONS Opinions Survey. Available at http://www.ons.gov.uk/ons/rel/wellbeing/measuring-subjective-wellbeing-in-the-uk/investigation-of-subjective-well-being-data-from-the-ons-opinions-survey/index.html
Orley J, Saxena S & Herrman H (1998) ‘Quality of life and mental illness. Reflections from the perspective of the WHOQOL’ British Journal of Psychiatry 172:291-293.
Pavot, W., & Diener, E. (2008). The Satisfaction With Life Scale and the emerging construct of life satisfaction. Journal of Positive Psychology, 2, 137-152.
Proctor C (in press) ‘Subjective wellbeing’ in A Michalos (ed) Encyclopaedia of Quality of Life Research. Springer.
Rahman T., Mittelhammer R. C., and Wandschneider P. (2005). Measuring the Quality of Life across Countries: A Sensitivity Analysis of Well-Being Indices - Research Paper No. 2005/06. Helsinki: United Nations University – World Institute for Development Economics Research
Ralph K, Palmer K & Olney J (2011) ‘Subjective well-being: A qualitative investigation of subjective well-being questions’. Produced for the Office of National Statistics Technical Advisory Group for Measuring National Well-Being.
Robeyns, I. and van der Veen, R. (2007). Sustainable quality of life: Conceptual analysis for a policy-relevant empirical specification. MNP Report 550031006/2007. Netherlands: Netherlands Environmental Assessment Agency.
Rojas, M. (2007). Life Satisfaction and Satisfaction in Domains of Life: Is it a Simple or a Simplified Relationship? Journal of Happiness Studies, 7, 467-497.
Ryan, R. and Deci, E. (2001). On happiness and human potentials: A review of research on hedonic and eudaimonic well-being. Annual Review of Psychology, 52, 141–166.
Ryan, R., Huta, V., & Deci, E. (2008). Living well: A self-determination theory perspective on eudaimonia. Journal of Happiness Studies, 9,139–170.
Ryff, C. D. (I989). Happiness is everything, or is it? Explorations on the meaning of psychological well-being. Journal of Personality and Social Psychology, 57, 1069-1081.
Ryff C& Keyes C (1995) ‘The structure of psychological well-being revisited’ Journal of Personality and Social Psychology 69(4):719-727
Schkade, D., & Kahneman, D. (1998). Does living in California make people happy? A focusing illusion in judgments of life satisfaction. Psychological Science, 9 , 340-346.
Seligman, M. (2011). Flourish: A New Understading of Happiness and Well-Being – and How to Achieve Them. London: Nicholas Brealy Publishing
Sen, A. K. (1985). Commodities and Capabilities. Oxford: Oxford University Press
Statistics Austria (2010) ‘Projekt Wohlbefinden’ Available in German at www.nachhaltigkeit.at/article/articleview/84924/1/25770.
Stevenson, B. & Wolfers, J. (2008). Economic growth and subjective well-being: Reassessing the Easterlin Paradox. Brookings Papers on Economic Activity, Spring 2008.
Stewart-Brown S, Tennant A, Tennant R, Platt S, Parkinson J & Weich S (2009) ‘Internal construct validity of the Warwick-Edinburgh Mental Well-Being Scale (WEMWBS): a Rasch analysis using data from the Scottish Health Education Population Survey’ Health and Quality of Life Outcomes 7(15)

Project SSH.2011.6.2-1 290520
Deliverable 2.1 41/64 15th May 2012
Stiglitz, J.E., Sen, A. and Fitoussi, J.P. (2009). Report by the Commission on the Measurement of Economic Performance and Social Progress. OECD. Retrieved from http://www.stiglitz-sen-fitoussi.fr/
Stoneman, P. & Anderson, B. (2006). Social Capital, Quality of Life, Employment and ICTs. Chimera Working Paper 2006-04. Ipswich: University of Essex.
Szukiełojć-Bieńkuńska A (2010) ‘Subjective measures in multidimensional quality of life measurement. The example of Poland’ Paper prepared for DGINS 2010 Conference, Sofia.
Tennant R, Hiller L, Fishwick R, Platt S, Joseph S, Weich S, Parkinson J, Secker J, Stewart-Brown S (2007) ‘The Warwick-Edinburgh Mental Well-being Scale (WEMWBS): development and UK validation’ Health and Quality of Life Outcomes 5:63.
Thompson S & Marks N (2008) Measuring well-being in policy: issues and applications. Report commissioned by the Foresight Project on Mental Capital and Well-being, UK Government Office for Science.
WHOQOL Group (1995) ‘The World Health Organization Quality of Life Assessment (WHOQOL): Position paper from the World Health Organization’ Social Science and Medicine 41(10):1403–1409.
Wilson, T. D. and Gilbert, T. D. (2003). Affective Forecasting. Advances in Experimental Social Psychology 35: 345–411.

Project SSH.2011.6.2-1 290520
Deliverable 2.1 42/64 15th May 2012
Annex 1 – Items and scales used in measuring SWB
This annex presents most of the main items and scales used to measure SWB in official or large unofficial surveys in Europe. Where a survey uses a very large number of items/scales, the survey is included as a separate annex.
For several surveys, we were unable to find precise wordings or appropriate translations of the relevant questions. However, this list provides a strong indication of the main domains covered and the numbers of surveys asking satisfaction questions about them.
We have categorised the items according to the dimensions of subjective well-being outlined in Chapter 3 – i.e. evaluative, hedonic and eudaimonic. A final group of items at the end of the Annex include scales which mix different dimensions. Evaluative
A. Life Satisfaction 1) “All things considered, how satisfied are you with your life as a whole nowadays? Please
answer using this card, where 0 means extremely dissatisfied and 10 means extremely satisfied.” [ESS core; Survey of Public Attitudes and Behaviours Towards the Environment –UK (Defra), Belgium – socio-cultural changes, Scottish Health Survey]
2) “All things considered, how satisfied would you say you are with your life these days? Please tell me on a scale of 1 to 10, where 1 means very dissatisfied and 10 means very satisfied.” [EQLS]
3) “On the whole, are you very satisfied, fairly satisfied, not very satisfied or not at all satisfied with the life you lead?” (4-point scale) [Eurobarometer (76)]
4) “Overall, how satisfied are you with your life these days?” (11 point scale) [EU-SILC Well-Being Module]
5) “Overall, how satisfied are you with your life nowadays?” (11 point scale) [Integrated Household Survey - UK (ONS), National Health Survey for Wales, Welsh Health Survey]
6) “In conclusion, we would like to ask you about your satisfaction with your life in general. Please answer according to the following scale: 0 means "completely dissatisfied",10 means "completely satisfied". How satisfied are you with your life, all things considered?” [GSOEP]
7) “On a scale from 0 (not at all satisfied) to 10 (very satisfied), rate your satisfaction concerning… your life at the present time” [SILC, France]
8) “In general, are you satisfied with your life so far? (Pre 2012: Extremely satisfied, very satisfied, somewhat satisfied, neutral, not satisfied. From 2012: 0-10 scale). [Health Survey Netherlands and Social Cohesion survey, Netherlands]
9) “Considering the whole situation, how satisfied are you with your everyday life?” 1) Very dissatisfied, 2) Dissatisfied, 3) Neither dissatisfied nor satisfied, 4) Satisfied, 5) Very satisfied [Romanian Diagnosis of the Quality of Life Survey]
10) Austrian Health Information Survey - question on life satisfaction: Details of this question wording are currently unavailable [Health Information Survey, Austria]
Project SSH.2011.6.2-1 290520
Deliverable 2.1 43/64 15th May 2012
11) Polish Quality of Life and Social Cohesion Survey - question on life satisfaction: Details of this question wording are currently unavailable [Quality of Life and Social Cohesion Survey – Poland]
12) “Attualmente, quanto si ritiene soddisfatto della sua vita nel complesso?” Dia un voto da 0 a 10 (0 per niente soddisfatto, 10 molto soddisfatto) [Everyday Life Aspects, Italy]
13) “De manière générale, dans quelle mesure êtes-vous satisfait de votre vie, sì 0 sìgnifie ‘pas du tout satisfait’ et 10 ‘tout à fait satisfait’?” [Switzerland FSO SILC]
14) Satisfaction with Life Scale: “Below are five statements that you may agree or disagree with. Using the 1 - 7 scale below, indicate your agreement with each item by placing the appropriate number on the line preceding that item. Please be open and honest in your responding.” (7 - Strongly agree, 6 – Agree, 5 - Slightly agree, 4 - Neither agree nor disagree, 3 - Slightly disagree, 2 – Disagree, 1 - Strongly disagree.)
a. In most ways my life is close to my ideal. b. The conditions of my life are excellent. c. I am satisfied with my life. d. So far I have gotten the important things I want in life. e. If I could live my life over, I would change almost nothing.
[Survey on Perceptions, Netherlands]
B. Happiness (overall) 1) “Taking all things together, how happy would you say you are?” (0 to 10 scale, where 0 is
‘extremely unhappy’ and 10 is ‘extremely happy’) [ESS core; Health Survey England]
2) “Taking all things together on a scale of 1 to 10, how happy would you say you are? Here 1 means you are very unhappy and 10 means you are very happy.” [EQLS]
3) “Do you consider yourself to be a happy person?” (Pre 2012: Very happy, happy, not happy not unhappy, unhappy, very unhappy. From 2012: 0-10 scale) [Health Survey Netherlands and Social Cohesion Survey, Netherlands]
4) "Considering all aspects of your life, how happy would you say you are?” (1 to 10 scale, where 1 means “very unhappy”, 10 means “very happy” and the values in between represent intermediate states) [SHIW-BI]

Project SSH.2011.6.2-1 290520
Deliverable 2.1 44/64 15th May 2012
C. Domain satisfaction Relationships (personal, family, friends): covered in at least 10 surveys [EQLS, EU SILC, Generations and Gender Survey - UNECE, GSOEP – Germany, Survey on Perceptions – Netherlands, Everyday Life Aspects Survey – Italy, French SILC, National Survey for Wales, Survey of Public Attitudes and Behaviours toward the Environment - Defra UK, Quality of Life and Social Cohesion Survey – Poland, Socio-cultural changes in Flanders - Belgium] Work/ Job/Main activity: covered in at least 10 surveys [EQLS, EU-SILC, GSOEP - Germany, Everyday Life Aspects Survey - Italy, French SILC, National Survey for Wales, Quality of Life and Social Cohesion Survey – Poland, Austrian SILC, Survey of Public Attitudes and Behaviours toward the Environment - Defra UK, Socio-cultural changes in Flanders - Belgium] Accommodation/ Dwelling/ Housing: covered in at least 8 surveys [EQLS, EU-SILC, GSOEP – Germany, Integrated Survey on Living Conditions - Netherlands, Austrian SILC, French SILC, Survey of Public Attitudes and Behaviours toward the Environment - Defra UK, Socio-cultural changes in Flanders - Belgium] Health (physical, mental): covered in at least 8 surveys [EQLS, GSOEP – Germany, Survey on Perceptions – Netherlands, Everyday Life Aspects Survey – Italy, National Survey for Wales, Survey of Public Attitudes and Behaviours toward the Environment - Defra UK, Quality of Life and Social Cohesion Survey – Poland, Socio-cultural changes in Flanders - Belgium] Living/ local environment/ area: covered in at least 6 surveys [EU-SILC, Integrated Survey on Living Conditions – Netherlands, Everyday Life Aspects – Italy, National Survey for Wales, Survey of Public Attitudes and Behaviours toward the Environment - Defra UK, Socio-cultural changes in Flanders - Belgium] Financial/ economic Situation: covered in at least 5 surveys [EU-SILC, Integrated Survey on Living Conditions – Netherlands, Everyday Life Aspects Survey – Italy, National Survey for Wales, Quality of Life and Social Cohesion Survey - Poland] Standard of Living: covered in at least 5 surveys [EQLS, Survey on Perceptions - Netherlands, Survey of Public Attitudes and Behaviours toward the Environment - Defra UK, Quality of Life and Social Cohesion Survey – Poland, Socio-cultural changes in Flanders - Belgium] Time Use: covered in at least 4 surveys [EU-SILC, National Survey for Wales, Quality of Life and Social Cohesion Survey – Poland, Socio-cultural changes in Flanders - Belgium] Free time: covered in at least 4 surveys [GSOEP, Germany, Everyday Life Aspects – Italy, Austrian SILC, Survey of Public Attitudes and Behaviours toward the Environment - Defra UK, Socio-cultural changes in Flanders - Belgium] Sleep: covered in at least 3 surveys [GSOEP – Germany, Health Information Survey – Austria, Well-being and Services Survey - Finland] Leisure/ Hobbies: covered in at least 3 surveys [French SILC, Survey of Public Attitudes and Behaviours toward the Environment - Defra UK, Socio-cultural changes in Flanders - Belgium]

Project SSH.2011.6.2-1 290520
Deliverable 2.1 45/64 15th May 2012
Income (personal or household): covered in at least 3 surveys [GSOEP – Germany, Austrian SILC, Socio-cultural changes in Flanders - Belgium] Education: covered in at least 3 surveys [EQLS, Integrated Survey on Living Conditions, Netherlands, Austrian SILC, Survey of Public Attitudes and Behaviours toward the Environment - Defra UK] Government/ Democracy in the country: covered in at least 2 surveys [GSOEP – Germany, Integrated Survey on Living Conditions – Netherlands] Achieving in Life/ Achieving Goals: covered in at least 2 surveys [Survey on Perceptions – Netherlands, Survey of Public Attitudes and Behaviours toward the Environment - Defra UK] Community connectedness/ feeling part of a community: covered in at least 2 surveys [Survey on Perceptions, Netherlands, Survey of Public Attitudes and Behaviours toward the Environment - Defra UK] Future Security: covered in at least 2 surveys [Survey on Perceptions – Netherlands; , Survey of Public Attitudes and Behaviours toward the Environment - Defra UK] Household Tasks/ Housework: covered in at least 2 surveys [GSOEP – Germany, Generations and Gender Survey, UNECE] Social life: covered in at least 1 survey [EQLS] Commuting Time: covered in at least 1 survey [EU-SILC] Recreational and green areas: covered in at least 1 survey [EU-SILC] Available Childcare: covered in at least 1 survey [GSOEP – Germany] Safety: covered in at least 1 survey [Survey on Perceptions – Netherlands] Spirituality/ Religion: covered in at least 1 survey [Survey on Perceptions – Netherlands] Society: covered in at least 1 survey [Integrated Survey on Living Conditions – Netherlands] Children: covered in at least 1 survey [National Survey for Wales] Ability to influence what happens in your life: covered in at least 1 survey [Survey of Public Attitudes and Behaviours toward the Environment - Defra UK]
Hedonic D. General Hedonic
1) “How much of the time during the last month has your health or your mood interfered in
your social activities, in your family and with friends?” “How do you usually describe yourself?” (Very happy, quite happy, quite unhappy, unhappy, desperate)

Project SSH.2011.6.2-1 290520
Deliverable 2.1 46/64 15th May 2012
[Health Survey - Italy]
2) “Please tell me how frequently did you experience the next items during the previous week
(seldom or never, sometimes, often most or all of the time)”
a. I felt that I could not shake off the blues even with help from my family or friends b. I felt depressed c. I thought my life had been a failure d. I felt fearful e. I felt lonely f. I had crying spells g. I felt sad
[Generations and Gender Survey - UNECE]
3) “Overall, how happy did you feel yesterday? Please give your answer on a scale of 0 to 10, where 0 is ‘not at all happy’ and 10 is ‘completely happy’”
“On a scale where 0 is 'not at all anxious' and 10 is 'completely anxious', overall, how anxious did you feel yesterday?”
[IHS – ONS, National Health Survey for Wales, Welsh Health Survey]
4) Defra questions “How often felt like this over the past two weeks?” (Never, At least once, On a few days, Most days, Every day)
a. Happy or contented b. Depressed
[Survey of Public Attitudes and Behaviours towards the Environment – UK (Defra)]
5) “I will now read to you a number of feelings. Please indicate for each feeling how often or rarely you experienced this feeling in the last four weeks. How often have you felt …
– angry? …................................ – worried? …............................. – happy? …............................... – sad? …...................................
(Very Rarely, Rarely Occasionally, Often, Very Often) [GSOEP – Germany]
6) Mental Health Index (5 items)
Details of these questions are currently unavailable
[Survey on Perceptions Netherlands]

Project SSH.2011.6.2-1 290520
Deliverable 2.1 47/64 15th May 2012
7) “People’s life includes better and less good moments. How do you characterise your condition in the past days:
a. Unhappy, even desperate b. Quite big sorrows c. I have this feeling that ‘something is wrong’, I had some troubles d. Generally I feel good, although I had small problems e. I feel good, I don’t have any problems f. I’m fully happy, I have big pleasures
[Diagnosis of the Quality of Life – Romania]
Eudaimonic E. WEMWBS
1) SWEMWBS: (on a scale ‘none of the time’, ‘rarely’, ‘some of the time’, ‘often’, ‘all of the time’)
a. I’ve been feeling optimistic about the future b. I’ve been feeling useful c. I’ve been feeling relaxed d. I’ve been dealing with problems well e. I’ve been thinking clearly f. I’ve been feeling close to other people g. I’ve been able to make up my mind about things
[Understanding Society]
2) WEMWBS: (on a scale ‘none of the time’, ‘rarely’, ‘some of the time’, ‘often’, ‘all of the time’)
a. I’ve been feeling optimistic about the future b. I’ve been feeling useful c. I’ve been feeling relaxed d. I’ve been feeling interested in other people e. I’ve had energy to spare f. I’ve been dealing with problems well g. I’ve been thinking clearly h. I’ve been feeling good about myself i. I’ve been feeling close to other people j. I’ve been feeling confident k. I’ve been able to make up my own mind about things l. I’ve been feeling loved m. I’ve been interested in new things n. I’ve been feeling cheerful
[Health S. England; Health S. Scotland]
F. Meaning 1) “To what extent do you feel your life to be meaningful?” (On a scale of 1-5, where 1 = Not at
all and 5 = An extreme amount) [Well-being and Services Survey – Finland]

Project SSH.2011.6.2-1 290520
Deliverable 2.1 48/64 15th May 2012
2) “Overall, to what extent do you feel that the things you do in your life are worthwhile? Please give your answer on a scale of 0 to 10, where 0 is ‘not at all worthwhile’ and 10 is ‘completely worthwhile’” [ONS, National Health Survey for Wales, Welsh Health Survey, SILC Well-Being module]
3) “I generally feel that what I do in life is valuable and worthwhile” (Definitely agree, Tend to
agree, Neither agree nor disagree, Tend to disagree, Definitely disagree) [Defra UK]
4) See WHOQOL survey.
G. Social relationships 1) “I am going to read out six statements about your current experiences. Please indicate for
each of them to what extent they have applied to you recently. (yes, more or less, no)
a. There are plenty of people that I can lean on in case of trouble b. I experience a general sense of emptiness c. I miss having people around d. There are many people that I can count on completely e. Often, I feel rejected f. There are enough people that I feel close to
[Generations and Gender Survey]
2) “Do you have someone close to you with whom you can talk about personal things?” (Definitely, Maybe, No) “How often felt like this over the past two weeks - Spent time together with family” (Never, At least once, On a few days, Most days, Every day) “How often felt like this over the past two weeks - Spent time together with friends” (Never, At least once, On a few days, Most days, Every day) “How often felt like this over the past two weeks - Involved in social activities in your local area” (Never, At least once, On a few days, Most days, Every day) “How often felt like this over the past two weeks – Lonely” (Never, At least once, On a few days, Most days, Every day)
[Survey of Public Attitudes and Behaviours toward the Environment - Defra UK]
3) “How often do you feel lonely? Does it happen Very often, Quite often, Sometimes, Never?“
[Swiss Health Survey]
4) “Do you have anyone to discuss personal matters with?” (Yes, No) “Do you have any relative, friend or neighbours that you can ask for help?” (Yes, No)

Project SSH.2011.6.2-1 290520
Deliverable 2.1 49/64 15th May 2012
[EU-SILC]
H. Self-esteem
1) “In general I feel positive about myself” (Definitely agree, Tend to agree, Neither agree nor disagree, Tend to disagree, Definitely disagree)
[Defra UK]
2) “I have a positive attitude toward myself” (7 point scale from ‘does not apply to me at all’ to ‘applies to me perfectly’) [GSOEP - Germany]
I. Optimism 1) “I am optimistic when I think about my future” (0-10 scale where 0 means “I do not agree at
all”, and 10 means “I totally agree”)
[French Feelings, Attitudes and Quality of Life Module]
2) “I feel optimistic about my future” (Definitely agree, Tend to agree, Neither agree nor disagree, Tend to disagree, Definitely disagree)
[Defra UK]
J. Other
1) “How often felt like this over the past two weeks?” (Never, At least once, On a few days, Most days, Every day)
a. Engaged or focused in what you are doing b. Energised or lively c. Everything you did was an effort d. Sleep was restless e. Unsafe or threatened f. Involved in leisure activities/hobbies
[Defra UK]
Mixed Both these tools can be considered a mix of hedonic and eudaimonic measures.
K. SF-10 & variations of SF-10 1) SF-10: “How much of the time, during the past 4 weeks…” (on a scale ‘all of the time’, ‘most
of the time’, ‘some of the time’, ‘a little of the time’, ‘none of the time’)
a. Did you feel full of life? b. Have you been very nervous? c. Have you felt so down in the dumps that nothing could cheer you up? d. Have you felt calm and peaceful? e. Did you have a lot of energy?

Project SSH.2011.6.2-1 290520
Deliverable 2.1 50/64 15th May 2012
f. Have you felt down-hearted and depressed? g. Did you feel worn out? h. Have you been happy? i. Did you feel tired?
[EHIS]
2) SF-10 subset:
a. Being very nervous b. Feeling down in the dumps c. Feeling calm and peaceful d. Feeling down-hearted and depressed e. Being happy
[EU SILC 2013; Welsh Health Survey, Swiss Health Survey]
3) SF-10 subset:
a. Feeling full of life b. Feeling calm and peaceful c. Having a lot of energy d. Feeling worn out e. Being happy f. Feeling tired
[Irish QNHS]
4) SF-10 subset:
a. Feeling full of life b. Being very upset c. Feeling so depressed that nothing could cheer you up d. Feeling peaceful and calm e. Feeling you have a lot of strength and energy for action f. Feeling sad, depressed or blue g. Feeling exhausted h. Feeling happy
[Polish QoL and Social Cohesion Survey]
5) ‘Mental Health Index’, probably based on SF-10. How much of the time in the last month have you felt:
a. peaceful and serene? b. full of energy? c. dispirited and sad? d. very agitated? e. irremediably down in the dumps? f. happy? g. vibrant and glazy? h. exhausted? i. tired?
[Health Conditions Survey Italy]

Project SSH.2011.6.2-1 290520
Deliverable 2.1 51/64 15th May 2012
L. GHQ-12 1) “Have you recently..” (on the scale ‘better than usual’, ‘same as usual’, ‘less than
usual’, ‘much less than usual’)
a. Been able to concentrate on whatever you’re doing b. Lost much sleep over worry c. Felt that you are playing a useful part in things d. Felt capable of making decisions about things e. Felt constantly under strain f. Felt you couldn’t overcome your difficulties g. Been able to enjoy your normal day to day activities h. Been able to face up to your problems i. Been feeling unhappy and depressed j. Been losing confidence in yourself k. Been thinking of yourself as a worthless person l. Been feeling reasonably happy, all things considered
[Understanding Society; Health S. England, Health S. Scotland, Belgian Health Interview Survey]

Project SSH.2011.6.2-1 290520
Deliverable 2.1 1/64 15th May 2012
Annex 2 – Complete list of surveys
Survey
Country / ies
SWB types (and questions) Accompanying data
Question order Frequency Timing Size Sampling
Age range
Response rate Mode Translation
Comments (assumes demographics)
If a general item like life satisfaction or happiness is asked, what does it come after?)
EU-SILC (Well-Being Module)
all Evaluative (life sat, domain sats), hedonic (selection from SF-10: nervous, down in dumps, calm/ peaceful, downhearted/ depressed, happy), eudaimonic (meaning, social relationships). See EU-SILC Well-Being module questionnaire.
Household, social exclusion, labour, housing, physical security, satisfaction with some external conditions (e.g. green space)
Varies by country, according to core survey.
one-off, 2013; with intention to repeat every 5/6 years
varies across countries
Minimum effective sample size: 270,000 in total
Varies by country 16+ Varies according to country
Varies according to country - PAPI, CAPI, CATI, self-complete and proxy interviews allowed, PAPI and CAPI preferred.
No formal arrangements
European Health Interview Survey
all intended for second wave, 20 in 1st wave
SF-10 [includes Hedonic (positive and negative affect) and eudaimonic (vitality)]
BMI; self-perceived health; activities that have been reduced because of health problems; long-standing illnesses or health problems; smoking behaviour; alcohol consumption
After question on pain.
every 5 years. 1st wave 2006-9 (depending on country), 2nd wave planned 2014
varies across countries
1,955 - 35,000 depending on country
Varies by country 15+ 54.3-95.5% Varies according to country - PAPI, CAPI, CATI, self-complete
Uses protocol proposed by Eurostat; native speaking translator (working in health/ social stats field) translates questions and concepts, then a native-speaking checker checks questions against concepts. Initial translation and checker's view brought together for final translation. 3rd party expert makes decision if there is disagreement..

Project SSH.2011.6.2-1 290520
Deliverable 2.1 2/64 15th May 2012
European Quality of Life Survey
all Many items, including evaluative (life sat, domain sats, happiness), hedonic (positive affect) and eudaimonic. Particular focus on social exclusion. See EQLS questionnaires for more details (EQLS3 includes an additional 3 hedonic, negative affect, questions)
Income and financial situation, education, housing and local environment, family relations, work, health, work-life balance, social participation, quality of social services and quality of society
Life sat after a series of questions related to social exclusion (in EQLS 2) Happiness after question asking people to rate importance of 7 different aspects of life (in EQLS 2)
every 4 years (2003/ 2007/2011)
EQLS 2: Most countries Sep - Nov 2007. EQLS 3: Sep 2011 - Feb 2012
1000 - 2000 per country
Random sample of administrative units, then random walks, households contacted 4 times
18+ 58% F2F Multi-layered process, involving questionnaire review, pre-test, 5-phase translation process and validation of new questionnaire elements, review of trend questions and pilot stage. Each stage subject to approval and documented in project’s technical reports. All new questionnaire elements translated by two independent local translators. The two versions were compared, back-translated and checked. The final version was checked and approved by Eurofound. An extra quality check was performed which consisted of both new and trend questions being proof read and evaluated by EQLS experts appointed by Eurofound or experts appointed by GfK EU3C
Eurobarometer all Evaluative (life sat) In core: Attitudes towards European institutions and policies, socio-political orientations, household. In modules: special topics, such as environment, technology, health or family issues, social or ethnic exclusion.
Life sat 1st question
2-5 times per year
Autumn, Spring
1000 (except Germany: 1500, Luxembourg: 600, United Kingdom 1300 including 300 in Northern Ireland).
Random sample of administrative units, then random walks, households contacted 2 times
15+ 50-70% mostly F2F Back-translation

Project SSH.2011.6.2-1 290520
Deliverable 2.1 3/64 15th May 2012
European Social Survey
most Evaluative (life sat, happiness), Eudaimonic (social relationships)
Trust in institutions; national, ethnic, religious identity; political engagement; health and security; socio-political, moral and social values; education and occupation; social capital; financial circumstances; household.
Life sat after question on position on left/right spectrum. Happiness after "Is [country] made a worse or a better place to live by people coming to live here from other countries?"
every 2 years
Oct - Feb (awaiting confirmation)
Min 1500 (or 800 for countries with population below 2m)
Varies by country 15+ 70% F2F Translation overseen by National Co-ordinators. The translation team in ESS Central Co-ordinating Team (based at GESIS) provide guidance, based on TRAPD approach (Translation, Review, Adjudication, Pre-testing and Documentation) and partial TVF (Translation and Verification Follow-up)
European Social Survey (well-being modules)
most Many items, including evaluative, hedonic (positive and negative affect) and eudaimonic. See ESS3 questionnaire.
(see above) N/A sporadic, one in 2006, one in2012
(see above) (see above)
(see above) 15+ 70% F2F (see above)
Generations and Gender Survey, UNECE
13 Evaluative (domain sats dotted throughout in relevant sections - division of household tasks, maternal relationship, paternal relationship). Hedonic (negative affect). Eudaimonic (social relationships).
Household, children, partnerships, parents and parental home, fertility, activity, income, household possessions, income, values, attitudes,
N/A Every 3 years
Not specified
Varies by country
Varies by country 18-79 Varies by country
F2F Back translation recommended

Project SSH.2011.6.2-1 290520
Deliverable 2.1 4/64 15th May 2012
Health Information Survey (in principle based on EHIS - used preliminary version of EHIS wave 1)
Austria WHO QoL BREF. [includes Evaluative (including questions - sometimes worded as satisfaction - on quality of life, health, housing, relationships, leisure, finance, local environment, transport). Hedonic (enjoy life, negative affect). Eudaimonic (meaning, engagement, safety, vitality, self-esteem)]. Plus questions based on SF-10 [includes Hedonic (positive and negative affect) and eudaimonic (vitality)]
Occupation, health, physical capability, health-related behaviour
N/A 2006. Next one 2014 then every 5 years
Mar 2006 - Feb 2007
14,474 Stratified probability, systematic random
15+ 63.1% CAPI WHOQOL has been translated into German according to the WHO international standards, including forward and backward translations, focus group discussions, and finally testing in a pilot study and as well as in international research
SILC Austria Austria Evaluative (life sat, domain sats - main activity, income, housing)
Housing, material deprivation, income, self-produced food, health, education, work
Life sat comes after three domain sats, which are all material focussed (see to the left)
Annual, since 2004
Mar - Aug/Sep
4,500 HHs One stage, stratified probability sample for the first wave households, integrated cross-sectional and longitudinal rotational design with a 4-year panel component.
16+ First wave households: 62-65%. Follow up households: 82-90%, depending upon rotation and year of survey
CAPI/ CATI N/A
Socio-cultural changes in Flanders
Belgium Evaluative (life sat, domain sats - house, neighbourhood, income, work, health, leisure, free time, time use, standard of living, social relations),
Values, social trust, membership of organisations, volunteering, health, social connections, dwelling, neighbourhood, political attitudes, trust in government, leisure time.
After questions on frequency of different free-time activities
Annual Mar/Apr - Jun/Jul
2,500 Includes all residents in Flanders and 'Flemish addresses' in Brussels. Stratified 2-stage random sampling procedure following regional
18+ 58% F2F N/A

Project SSH.2011.6.2-1 290520
Deliverable 2.1 5/64 15th May 2012
Rotating modules with topics including attitudes towards environmental, social inequality, gender roles, and various minority groups, lifelong learning, informal care.
stratification. 1st stage: PSU are clusters of addresses in postcodes. The number of clusters for each postcode is proportional to the province population. 2nd stage: Uses National Register, random selection. No substitution allowed, but some oversampling in certain postcodes which have low response rates.
Belgian Health Interview Survey (will incorporate the EHIS2013-14 questionnaire within this)
Belgium Eudaimonic (GHQ-12) Health, social contacts, health-related behaviours, physical activity, attitudes towards end of life.
After question on experience of physical violence
2001, 2004, 2008
Continuous - throughout the year
11,254 3 stage, stratified 15+ 55-65% depending on year
Self-complete (for SWB questions)
Used standard translation procedure proposed by Eurostat (and for some instruments use validated translation).
Well-Being and Services
Finland WHO QoL BREF. [Includes Evaluative (including questions - sometimes worded as satisfaction - on quality of life, health, housing, relationships, leisure, finance, local environment, transport). Hedonic
Socio-economic situation, housing, social relationships, health, health-service use
After questions on informal care
2004, 2006, 2009
September - October
4306 Systematic random sampling from stats Finland population register
18+ 80% First CAPI, followed by postal self complete. WHO-QoL BREF items in CAPI. For 80+ year olds all F2F.
WHOQOL has been translated into Finnish according to the WHO international standards, including forward and backward translations, focus group discussions, and finally testing in a pilot study and as well as in international research

Project SSH.2011.6.2-1 290520
Deliverable 2.1 6/64 15th May 2012
(enjoy life, negative affect). Eudaimonic (meaning, engagement, safety, vitality, self-esteem)].
French 2010 SILC ('Statistics on Resources and Living Conditions')
France Evaluative (life sat, domain sats: dwelling, work, leisure, relationships)
Work, savings, debt, indicators of material deprivation, dwelling, living environment, health.
Life sat after Domain sats
Annual May-Jun 25,000 Panel survey (rotating sample renewed by one-ninths each time)
16+ 83% (in 2011)
CAPI N/A
French Feelings, attitude and Quality of Life module 2010 (part of French SILC wave 3)
France Eudaimonic (optimism, trust, + whether consider self lucky)
Priorities (work, leisure, family, friends, volunteering, sleep), attitude to risk , attitude to future, attitude to illness (access to treatment), neighbourhood safety, time management, comparisons with others, employment. + vignettes which require judgement about their personal satisfaction.
N/A One-off - 2010
May - July 2,000 No details specified (respondents will have been part of a panel)
16+ 64% (2010)
Self-complete N/A
German Socio-Economic Panel Survey
Germany Evaluative (life sat, domain sats: health, sleep, job, housework, household income, personal income, dwelling, free time, family life, childcare if kids, democracy in Germany), hedonic (angry, worried, happy, sad),
Housing, health, values.
Life sat is final question, after "Has your family situation changed [in last year]?" Affect and self-esteem questions
Annual Feb - Sep but mainly Spring
20,000 Multistage random sampling, regionally clustered
16+ Varies according to wave and sub-sample; between 60.6% - 70%
F2F + self complete
For 'foreigner samples': translations are made by native speakers. For Turkish and Russia translation made in both directions.

Project SSH.2011.6.2-1 290520
Deliverable 2.1 7/64 15th May 2012
eudaimonic (self-esteem)
after "When other people wrong me I try to just forgive and forget".
Quarterly National Household Survey , Health Module
Ireland Based on SF-10. [Includes Hedonic (positive and negative affect) and eudaimonic (vitality)]
Employment (including occupation, industry, hours worked), health service use.
At end, after questions on health service use
2010, Q3 Jun- Aug 15,673 (for swb module)
2-stage sample design. First stage: sample of 2,600 small areas (approximately 75 dwelling per area) selected at county level to proportionately represent eight strata reflecting population density. Second stage: 15 households are surveyed in each block. Households are asked to take part in the survey for five consecutive quarters and are then replaced by other households in the same block.
18+ 85.2% CAPI N/A
Survey on Household Income and Wealth, Bank of Italy (SHIW-BI)
Italy Evaluative (happiness) Household, savings, property, debt, expenditure, insurance and pensions, work
After "In what year did you and your spouse/partner begin living together?" for married or living with partner, or
Every 2 years
No particular time of year
24,000 (tho swb questions not asked of all - see banca d'italia documentation)
Multi-stage, stratified + panel (54%)
Not specified
56.1% CAPI (80%), PAPI (20%)
N/A

Project SSH.2011.6.2-1 290520
Deliverable 2.1 8/64 15th May 2012
after "Did you have any children (still alive) not residing with you on 31 December 2008?" or after "Do you have a spouse/partner living permanently outside Italy?"
Everyday life aspects ("Aspetti della vita quotidiana")
Italy Evaluative (life sat, domain sats: economic situation, health, family relations, relations with friends, free time, local environment, work)
Trust, Social interaction
Life sat (Qu. 27.1) - follows the question on whether you have paid for services by people working in paranormal services.
Annual 1st quarter 50,000 2 stage stratified sample
14+ 80% Self-complete (for SWB questions)
N/A
Health Conditions Survey (Italy)
Italy Mental health index, probably adaptation of SF-10 including hedonic and eudaimonic (vitality).
Work conditions; health; external services; household; economic resources; opinions on public services
After question about physical pain
Every 5 years (starting 1980, last one 2004-5), next one Sep 2012.
Every 3 months (to check season effects)
140,000 From municipal registry lists with random selection criterion
14+ (for self-report SWB questions)
Information not available
Self-complete (for SWB questions)
N/A

Project SSH.2011.6.2-1 290520
Deliverable 2.1 9/64 15th May 2012
Social Cohesion Netherlands
Evaluative (life sat, happiness)
Voting behaviour, religion, health status, health service use, voluntary work, activities in spare time, social contacts, internet use, neighbourhood, political participation, trust, social capital
After questions on voluntary work and informal help
Annual (except 2011)
Feb - Apr and Jul - Oct
3000 Two-stage sample from population except for people living in institutions
15+ 60.9% CAPI N/A
Survey on Perceptions with PWI (Onderzoek Belevingen), 2010
Netherlands
Evaluative (SWLS, domain sats - PWI). Hedonic (Mental Health Index)
Voting behaviour, religion, health status, health-related attitudes, health service use, healthy behaviours, BMI, physical activity.
After "do you donate or receive a donor organ, which groups have more right to an organ?"
One-off - 2010
Oct 2010 - Jan 2011
3,402 Two-stage sample from whole population except for people living in institutions
18+ 59.3% CAWI, re-approach by CATI, further re-approach by CAPI.
Back translation for PWI
Integrated survey on Living Conditions (SLI). A follow-up questionnaire after the survey on culture (CV).
Netherlands
Evaluative (domain sats)
Housing , safety, social relations, time use, skills, health, spending, environment
After question on whtether respondents have been the victim of crime.
Annual Sep 2010 - May 2011
The complete sample for CV consisted of 5200 persons. Of them, 2000 also completed the SLI questionnaire
Two-stage sample from population except for people living in institutions
18+ 56% for CV F2F for CV survey, self-complete for SLI
N/A
Health Survey Netherlands
Evaluative (life sat, happiness)
2 parts. Part 1: Background info (sex, date of birth), Health Care, Health, Life style. Part 2: Life style, sensitive questions (drug use, alcohol, smoking)
After questions on smoking.
From 2012 and hopefully onwards
Continuous 15,000 Two-stage sample from whole population except for people living in institutions
Some specific questions are only asked at 12+ population and 18+ population.
60% (about 65% on the first part, and 55% on the second part)
Part 1 - mixed-mode design: CAWI, followed by CATI or CAPI (depending on availability of telephone numbers). Part 2 self complete (except for those
N/A

Project SSH.2011.6.2-1 290520
Deliverable 2.1 10/64 15th May 2012
who did the first part via CAWI: they get the second part also via CAWI).
Quality of Life and Social Cohesion Survey, Poland
Poland Evaluative (life sat, domain sats - work, education, family, relationships, financial situation, living conditions, free time, health), further set based on SF-10 [includes Hedonic (positive and negative affect) and eudaimonic (vitality)]
Skills, economic activity, health, mental health, social relationships, participation, use of free time, political opinions
Information not available
2011, then every 4-5 years
Feb-Mar 13,300 Information not available
16+ Information not available
Information not available
N/A
Diagnosis of the Quality of Life (Romanian Institute for Quality of Life Research)
Romania Evaluative (life sat, domain sats - health, family relations, dwelling, environment quality, working conditions, neighbour relations, income, local services), hedonic (negative and positive)
Demographics, perceptions of changes in Romania (living standards, advantage/disadvantage post 1989 , Leisure, Household expenses, household income, societal conflict, household assets, property ownership, fears, several questions on satisfaction with local services
Life sat after "If you were aggressed in the street or public areas, to what extent would you count on other people's help?"
2003, 2006, 2010
During one month (unspecified)
2000+ Multi-stage stratified random sample
18+ Information not available
F2F N/A
FSO SILC Switzerland
Evaluative (life sat) Social exclusion, material deprivation, physical and social environment, housing, education, labour, health, (health status, access to health care, values, social
After question on ease of access to primary medical services
Annual. Mar - Jul 17,000 At random from the NSI's register of private telephone connections.
15+ About 86% Phone N/A

Project SSH.2011.6.2-1 290520
Deliverable 2.1 11/64 15th May 2012
network, childcare. Yearly modules have included further information housing (2007), debt and finance (2008), material deprivation (2009), intra-household sharing of resources (2010), intergenerational transmission of disadvantages (2011)
Swiss Health Survey
Switzerland
Based on SF-10 [includes Hedonic (positive and negative affect)]. Eudaimonic (loneliness, self-efficacy, autonomy, opportunities for growth)
Physical and mental health, accidents, disability, financial resources, job security, social relations, housing, physical environment, positive life experiences, physical activity, dietary habits, health-related behaviours, health insurance, health service use.
After questions on physical health
Every five years.
Continuous.
18,760 (in 2007)
2 stage randomized sampling (household then target person) by region / canton.
15+ 66.2% Phone followed by self complete
For SF-10, follows a standard protocol involving multiple forward and backward translation, qualitative and quantitative testing to evaluate the quality of the translation and conceptual equivalence. Also psychometric testing (http://www.sf-36.org/tools/SF36.shtml#TRANS)
Survey of Public Attitudes and Behaviours toward the Environment, Defra
UK Evaluative (life sat, domain sats), hedonic (positive and negative affect), eudaimonic (engagement, vitality, social relationships)
Environmental attitudes and behaviours; volunteering behaviours; social and cultural activities. In one survey, diet as well.
2009 and before, life sat after "Do you have a garden?" 2010/ 2011, life sat after question about green behaviour
Annual from 2007 to 2010
Last one Mar 2011
1,769 Based on address system from TNS (market-research company), cross referenced to census, quota sampling
16+ N/A (use quota sampling so keep going till quota filled)
CAPI N/A

Project SSH.2011.6.2-1 290520
Deliverable 2.1 12/64 15th May 2012
Scottish Health Survey
UK Evaluative (life sat), eudaimonic (GHQ-12, WEMWBS), other (stress at work) [Above relates to adults. Children had the Strengths and Difficulties qnnre]
Household, health, health service use, healthy behaviours, physical activity, diet, mental health (depression, anxiety, worry - as diagnostic)
Life sat after question on informal care for sick, disabled or frail person. GHQ12 and WEMWBS after questions on alcohol consumption.
Annual, 2008-2011, 2012-2015
Continuous 7,425 adults and 1,793 children (in 2010)
2-stage stratified probability sampling. Design with data zones selected at the first stage and addresses (delivery points) at the second using Postcode Address File. Three samples: main, child boost and health board boost
13+ (for self-report SWB questions)
63% CAPI, self-complete, CASI
N/A
National Survey for Wales
UK ONS 4 (See Welsh Health Survey; NB interviewers instructed not to ask these of those using languages other than English), Evaluative (domain sats: personal relationships, physical health, mental wellbeing, work situation, financial situation, area, time use, children).
Public services, internet use, health, housing tenure, household.
After question on use of Welsh language
Annual Continuous 14,500 aim
Random, stratified by Local Authority using Postcode Address File
16+ 70% aim F2F If needed, Welsh-speaking interviewer sent.
Integrated Household Survey (General Lifestyle Survey, Living Cost and Food Survey, Labour Force / Annual Population Survey
UK ONS 4. Evaluative (life sat), hedonic (happy, anxious), eudaimonic (feeling worthwhile)
Household, accommodation, tenure, national identity, religion, health, smoking, work.
After question on sexual identity
Annual Each month
450000 (200,000 directly questioned adults 16+)
Clustered and unclustered/ multi-stage stratified and one-stage sampling using Postcode Address File (composite survey, so depends on component)
16+ 64.9% (April 2009 - March 2010)
F2F and phone N/A
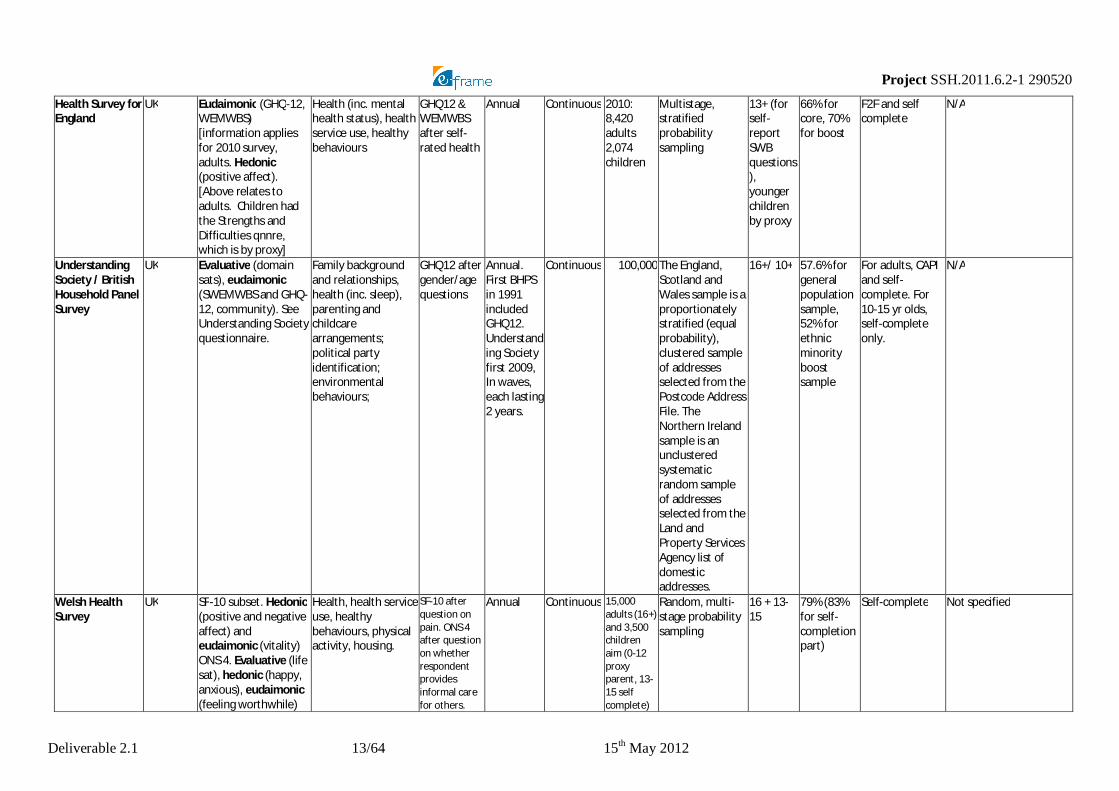
Project SSH.2011.6.2-1 290520
Deliverable 2.1 13/64 15th May 2012
Health Survey for England
UK Eudaimonic (GHQ-12, WEMWBS) [information applies for 2010 survey, adults. Hedonic (positive affect). [Above relates to adults. Children had the Strengths and Difficulties qnnre, which is by proxy]
Health (inc. mental health status), health service use, healthy behaviours
GHQ12 & WEMWBS after self-rated health
Annual Continuous 2010: 8,420 adults 2,074 children
Multistage, stratified probability sampling
13+ (for self-report SWB questions), younger children by proxy
66% for core, 70% for boost
F2F and self complete
N/A
Understanding Society / British Household Panel Survey
UK Evaluative (domain sats), eudaimonic (SWEMWBS and GHQ-12, community). See Understanding Society questionnaire.
Family background and relationships, health (inc. sleep), parenting and childcare arrangements; political party identification; environmental behaviours;
GHQ12 after gender/age questions
Annual. First BHPS in 1991 included GHQ12. Understanding Society first 2009, In waves, each lasting 2 years.
Continuous 100,000 The England, Scotland and Wales sample is a proportionately stratified (equal probability), clustered sample of addresses selected from the Postcode Address File. The Northern Ireland sample is an unclustered systematic random sample of addresses selected from the Land and Property Services Agency list of domestic addresses.
16+/ 10+ 57.6% for general population sample, 52% for ethnic minority boost sample
For adults, CAPI and self-complete. For 10-15 yr olds, self-complete only.
N/A
Welsh Health Survey
UK SF-10 subset. Hedonic (positive and negative affect) and eudaimonic (vitality) ONS 4. Evaluative (life sat), hedonic (happy, anxious), eudaimonic (feeling worthwhile)
Health, health service use, healthy behaviours, physical activity, housing.
SF-10 after question on pain. ONS 4 after question on whether respondent provides informal care for others.
Annual Continuous 15,000 adults (16+) and 3,500 children aim (0-12 proxy parent, 13-15 self complete)
Random, multi-stage probability sampling
16 + 13-15
79% (83% for self-completion part)
Self-complete Not specified