draft community impacts assessment - tn
TRANSCRIPT
PELLISSIPPI PARKWAY EXTENSION (SR 162)
FROM SR 33 (OLD KNOXVILLE HIGHWAY) TO US 321/SR 73/LAMAR
ALEXANDER HIGHWAY
BLOUNT COUNTY, TN
TDOT PROJECT NO. # 05097- 1226-04 PIN 101423.00
DRAFT COMMUNITY IMPACTS ASSESSMENT
MAY 2009
PREPARED FOR: TENNESSEE DEPARTMENT OF TRANSPORTATION PREPARED BY: PARSONS BRINCKERHOFF NASHVILLE, TN


Table of Contents
1.0 PROJECT DESCRIPTION ..............................................................................3
2.0 POPULATION, RACE, ETHNICITY, AND AGE..............................................8 2.1 POPULATION.................................................................................................8 2.2 RACE ............................................................................................................10 2.3 AGE...............................................................................................................10
3.0 INCOME AND POVERTY STATUS ..............................................................12
4.0 HOUSING CHARACTERISTICS...................................................................12
5.0 BUSINESS ACTIVITY/EMPLOYMENT CENTERS.......................................16 5.1 EDUCATIONAL ATTAINMENT....................................................................16
6.0 PUBLIC FACILITIES, SCHOOLS AND INSTITUTIONS ..............................17 6.1 SCHOOLS.....................................................................................................17 6.2 CHURCHES/CEMETERIES..........................................................................17 6.3 PARKS AND RECREATION ........................................................................17
7.0 POLICE, FIRE, EMERGENCY MANAGEMENT SERVICES AND PUBLIC SERVICE.......................................................................................................18
8.0 UTILITIES .....................................................................................................18
9.0 EXISTING/FUTURE LAND USES AND PRESENT/FUTURE ZONING........19 9.1 RESIDENTIAL ..............................................................................................19
9.1.1 Past Development .............................................................................19 9.1.2 Development in the Study Area .........................................................26
9.2 COMMERCIAL..............................................................................................26 9.3 INDUSTRIAL.................................................................................................26 9.4 ZONING ........................................................................................................26 9.5 FUTURE LAND USE.....................................................................................27
10.0 COMMUNITY STABILITY AND NEIGHBORHOOD COHESION .................29
11.0 FARMLAND IMPACTS .................................................................................30
12.0 TOURISM......................................................................................................30
13.0 TITLE VI AND ENVIRONMENTAL JUSTICE ...............................................31
14.0 COMMUNITY IMPACTS ASSESSMENT LEGAL AUTHORIZATION ..........31
Pellissippi Parkway Extension Draft Page i

Community Impact Assessment-Pellissippi Parkway Extension
List of Tables
Table 2-1: Historical Population and Projections 1970-2025 ........................................................8 Table 2-2: Population Projections 2010 and 2020 ......................................................................10 Table 2-3: 2000 Population by Race and Hispanic Origin .........................................................11 Table 2-4: 2000 Population By Age ...........................................................................................11 Table 4-1: Income Measures and Persons Living Below Poverty Level ....................................13 Table 4-2 Housing Characteristics.............................................................................................13 Table 5-1: 2009 Labor Force Estimates for Tennessee and Blount County ..............................16 Table 11-1: Farmland in Blount County .....................................................................................30
List of Figures
Figure 1-1: Regional Location......................................................................................................3 Figure 1-2: Study Area.................................................................................................................4 Figure 1-3: Alternatives to be Evaluated in the DEIS...................................................................7 Figure 2-1: U.S. Census Tracts and Block Groups in Project Area: ............................................9 Figure 4-1: Percent Minority Population.....................................................................................14 Figure 4-2: Percent Population Below Poverty ..........................................................................15 Figure 9-1: Single-Family Residential Structures Added in 1950’s............................................20 Figure 9-2: Single-Family Residential Structures Added in 1960’s............................................21 Figure 9-3: Single-Family Residential Structures Added in 1970’s............................................22 Figure 9-4: Single-Family Residential Structures Added in 1980’s............................................23 Figure 9-5 Single-Family Residential Structures Added in 1990’s.............................................24 Figure 9-6: Blount County Single-Family Residential 2000-2005 ..............................................25 Figure 9-7: Conceptual Land Use Map – Blount County ...........................................................28
PELLISSIPPI PARKWAY EXTENSION Page ii

Community Impact Assessment-Pellissippi Parkway Extension
1.0 PROJECT DESCRIPTION Pellissippi Parkway (State Route (SR) 162) is a major northwest/southeast route connecting Interstate 40 (I-40)/I-75 and SR 33 in Knox and Blount Counties, Tennessee. Pellissippi Parkway (designated as I-140) between I-40/I-75 and SR 33 was designed and built in four sections between 1987 and 2005. The section of Pellissippi Parkway between SR 33 and US 321/SR 73 is the remaining undeveloped portion of the parkway that was identified in the State’s 1986 Urgent Highway Needs Plan. The Tennessee Department of Transportation (TDOT) proposes to extend the existing Pellissippi Parkway from SR 33 to US 321/SR 73 in the cities of Alcoa and Maryville and in unincorporated Blount County. The length of the proposed extension is approximately 4.5 miles. The regional location is shown in Figure 1-1, and the project area is illustrated on
Figure 1-1: Regional Location
The project is proposed by TDOT to: • Provide travel options for motorists to the existing radial roadway network;
• Enhance regional transportation system linkages;
• Assist in achieving acceptable traffic flows (level of service) on the local transportation network; and
• Enhance roadway safety on the roadway network, including the Maryville core.
PELLISSIPPI PARKWAY EXTENSION Page 3

Community Impact Assessment-Pellissippi Parkway Extension
Figure 1-2: Study Area
In April 2006, TDOT initiated an Environmental Impact Statement (EIS) for the project with the publication of a formal Notice of Intent (NOI) to prepare an EIS in the Federal Register. Public and agency scoping was conducted in the Spring, Summer and Fall of 2006. At that time, TDOT asked the public to provide input on the purpose and need for the project and to identify potential alternatives and corridors for consideration in the Draft EIS. Additional public meetings
PELLISSIPPI PARKWAY EXTENSION Page 4

Community Impact Assessment-Pellissippi Parkway Extension
were held in November 2007 and February 2008 to gather public input on the refined purpose and need and potential project corridors and alternatives. An initial range of alternatives and corridors were developed as a result of public comments and input from local and regional agencies, including the Knoxville Regional Transportation Planning Organization (TPO). The alternatives and corridors were refined based on windshield reviews and reviews of existing data sources including Geographic Information Systems (GIS) information from local, state and federal agencies. Based on the results of the screening analysis and application of evaluation criteria, public input during the 2007 and 2008 public meetings and comment periods, and participating agency comments and concurrence, TDOT has determined the following alternatives that will be carried forward, refined and evaluated in the DEIS. The Build Alternatives (A, C and D) are shown on Figure 1-3. • No-Build Alternative: The No-Build Alternative would not extend Pellissippi Parkway
beyond its existing terminus at SR 33. However, the No-Build Alternative would include projects in the study area that are identified in the Knoxville Region Long Range Transportation Plan (LRTP) 2005 to 2030, including those projects listed below:
▬ Improving SR 33, including widening to four lanes and making intersection improvements at Brown School Road;
▬ Improving sections of US 411, including adding a center turn lane and reconstructing substandard two-lane sections;
▬ Reconstructing substandard two-lane sections of Peppermint Hills Road, Sam Houston School Road, and Ellejoy Road;
▬ Constructing new six-lane Relocated Alcoa Highway; and
▬ Improving Alcoa Highway (SR 115) by adding turn lanes and traffic signals and widening four-lane sections to six-lanes.
• Extend Pellissippi Parkway in one of two option alignments:
Under the Build Alternative, existing Pellissippi Parkway would be extended from SR 33 to US 321, as a four-lane divided roadway, with interchanges at SR 33, US 411 and US 321. The two alternate alignments under consideration for the DEIS, Alternative A and Alternative C, are described below:
▬ Alternative A: This alternative alignment generally follows the corridor identified and investigated in the 2002 Environmental Assessment (EA) and selected as the preferred alternative. This alternative starts on the east side of SR 33, opposite the existing half interchange of Pellissippi Parkway and SR 33. From this terminus, the route follows a generally easterly and southeasterly path to Wildwood Road, passing through former farmlands that are now the site of the proposed Pellissippi Center Research and Development Park. Alternative A also runs west of Mount Lebanon Road in this area. After crossing Wildwood Road, the alignment continues in a generally southerly direction, crossing Brown School Road, US 411 east of the Davis Ford Road intersection with US 411, and Davis Ford Road, and then passing along the northeastern edge of the Kensington Place mobile home park. The alignment intersects with US 321 just east of Flag Branch. Alternative A is approximately 4.38 miles in length.
PELLISSIPPI PARKWAY EXTENSION Page 5

Community Impact Assessment-Pellissippi Parkway Extension
▬ Alternative C: This alternative shares the route of Alternative A from SR 33 to the vicinity of Brown School Road, at which point Alternative C diverges to the east. Alternative C then runs in a southeasterly direction, crossing US 411 about 0.6 mile east of Alternative A. It continues southeasterly to cross Davis Ford Road and proceeds southerly, crossing Centennial Church Road about 500 feet west of Helton Road, crossing John Helton Road and terminating with US 321 at Hubbard School Road. The alternative is approximately 4.68 miles in length.
• Upgrade Existing Two-Lane Network – Corridor D: The alternative concept of upgrading a two-lane network of existing roads to serve as a two-lane connection between SR 33 and US 321 emerged during the course of this study based on discussions with the public about travel needs and environmental concerns. This upgraded network was seen as a way to improve some of the currently deficient two-lane roads in the study area and provide a more direct connection between SR 33 and US 321 east of Maryville without having a new freeway-type facility. A route using portions of the existing Sam Houston School Road, Peppermint Road, Hitch Road, and Helton Road was identified. Under this alternative, now referred to as Alternative D, an improved two-lane roadway with adequate shoulders would be constructed using the existing roadway alignment where possible, while straightening curves and realigning intersections and using new location to provide a continuous route with a 50 mile per hour design speed. The length of this corridor is approximately 5.77 miles.
PELLISSIPPI PARKWAY EXTENSION Page 6

Community Impact Assessment-Pellissippi Parkway Extension
Figure 1-3: Alternatives to be Evaluated in the DEIS
PELLISSIPPI PARKWAY EXTENSION Page 7

Community Impact Assessment-Pellissippi Parkway Extension
2.0 POPULATION, RACE, ETHNICITY, AND AGE The project area is within U.S. Census Tracts 109 (Block Groups 1, 2, and 5) and Census Tract 110 (Block Group 1). Figure 2-1 shows the Census Tracts and Block Groups graphically. The following sections describe the characteristics of the population by using data from the U.S. Census, University of Tennessee Center for Business and Economic Research, and the Tennessee Advisory Council on Intergovernmental Relations (TACIR).
2.1 Population Since 1970, Blount County has experienced double digit population growth over each 10-year Census period and its growth rates have exceeded those of the overall Knoxville region and the State as a whole (see Table 2-1). The county grew 22 percent between 1970 and 1980 and nearly 11 percent between 1980 and 1990. In 2000, the County was home to nearly 106,000 people, an increase of more than 23 percent since 1990. In the region, Blount County’s growth is only surpassed by that of its neighbor to the east, Sevier County, which grew by nearly 40 percent between 1990 and 2000 even though its population size remains lower than that of Blount County.
Blount County’s growth is expected to continue, by 2025, Blount County is predicted to have nearly 144,000 residents, an annual growth rate of approximately 1.4 percent. Sevier County is expected to nearly double its population between 2000 and 2025, at which time it will have roughly the same population as Blount County.
Table 2-1: Historical Population and Projections 1970-2025
Geographic area 1970 1980 1990 2000 2025 Tennessee 3,926,018 4,607,294 4,877,185 5,689,283 7,559,531 Period Growth Rate 17.4% 5.9% 16.7% 32.9% Average Annual Growth 1.7% 0.6% 1.7% 1.3% Knoxville Region 503,067 594,857 634,423 747,300 1,042,680 Period Growth Rate 18.2% 6.7% 17.8% 39.5% Average Annual Growth 1.8% 0.7% 1.8% 1.6% Blount County 63,744 77,770 85,969 105,823 143,707 Period Growth Rate 22.0% 10.5% 23.1% 35.8% Average Annual Growth 2.2% 1.1% 2.3% 1.4% Sevier County 28,241 41,418 51,043 71,170 137,345 Period Growth Rate 46.7% 23.2% 39.4% 93.0% Average Annual Growth 4.7% 2.3% 3.9% 3.7%
Source: 2000. TACIR and UT Center for Business and Economic Research, Population Projects for the State of Tennessee, 2005 to 2025. December 2003. The Tennessee Department of Health has also made projections regarding the population in Tennessee and Blount and Sevier Counties. Table 2 summarizes the Department of Health’s population projections. The TN Department of Health does predict growth in Tennessee and Blount and Sevier Counties. However, this growth is projected to occur at a slower rate than the growth rate projected by the TACIR and UT Center for Business and Economic Research.
PELLISSIPPI PARKWAY EXTENSION Page 8

Community Impact Assessment-Pellissippi Parkway Extension
Figure 2-1: U.S. Census Tracts and Block Groups in Project Area:
PELLISSIPPI PARKWAY EXTENSION Page 9
Community Impact Assessment-Pellissippi Parkway Extension
PELLISSIPPI PARKWAY EXTENSION Page 10
2.2 Race Of the 13,074 people living in the two census tracts that cover the project area, approximately 97 percent are white, and approximately 3 percent are minorities. Of the 3 percent, the largest group of minorities is Black/African-American, followed by Hispanic, Asian/Pacific Islander, American Indian, and Other. For Census Tract 110, the population of Asian/Pacific Islander is higher than the Hispanic population. Minority residents are fairly dispersed across the two census tracts, though the highest concentration is seen in Census Tract 109. Both census tracts have a concentration of minorities that are less than Blount County and Tennessee’s concentration of minorities (4.4 and 2.3 percents versus 6.0 and 22.0 percents, respectively).
The Block Groups in the project all have a concentration of minorities that are less than Blount County and Tennessee’s concentration of minorities. Table 3 and Figure 3 summarize the race characteristics in the project area.
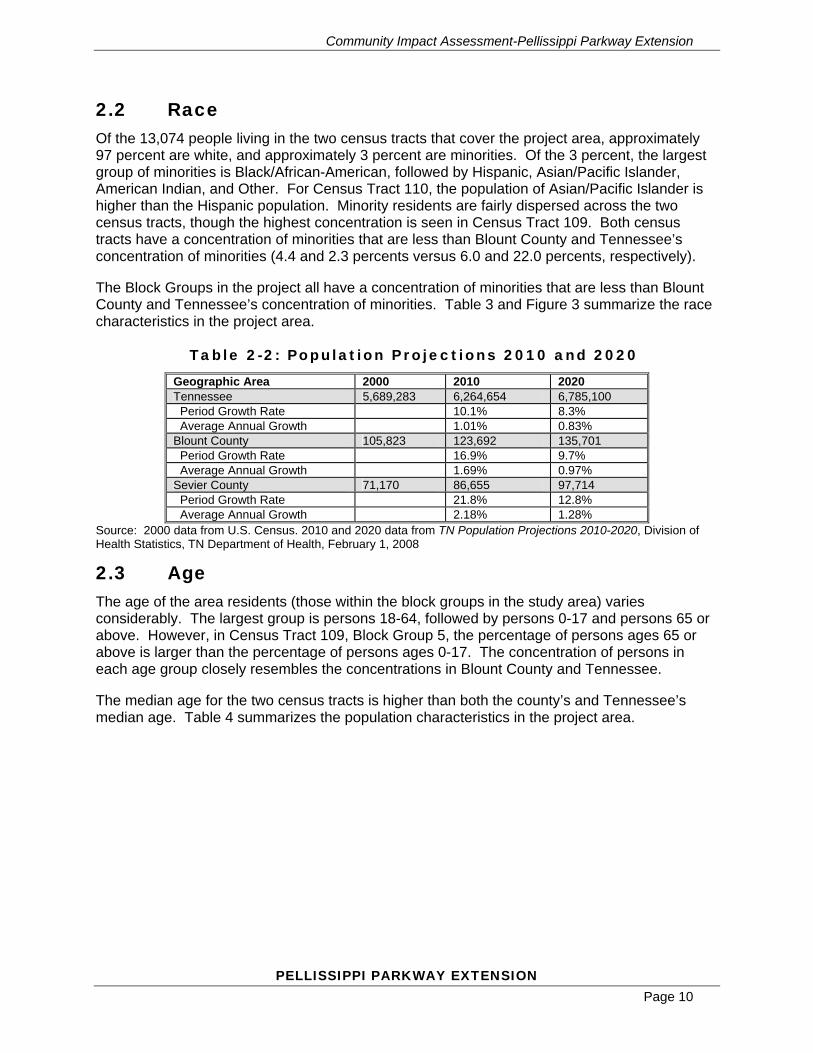
Table 2-2: Population Projections 2010 and 2020
Geographic Area 2000 2010 2020 Tennessee 5,689,283 6,264,654 6,785,100 Period Growth Rate 10.1% 8.3% Average Annual Growth 1.01% 0.83% Blount County 105,823 123,692 135,701 Period Growth Rate 16.9% 9.7% Average Annual Growth 1.69% 0.97% Sevier County 71,170 86,655 97,714 Period Growth Rate 21.8% 12.8% Average Annual Growth 2.18% 1.28%
Source: 2000 data from U.S. Census. 2010 and 2020 data from TN Population Projections 2010-2020, Division of Health Statistics, TN Department of Health, February 1, 2008
2.3 Age The age of the area residents (those within the block groups in the study area) varies considerably. The largest group is persons 18-64, followed by persons 0-17 and persons 65 or above. However, in Census Tract 109, Block Group 5, the percentage of persons ages 65 or above is larger than the percentage of persons ages 0-17. The concentration of persons in each age group closely resembles the concentrations in Blount County and Tennessee.
The median age for the two census tracts is higher than both the county’s and Tennessee’s median age. Table 4 summarizes the population characteristics in the project area.

Community Impact Assessment-Pellissippi Parkway Extension
Census Tract 109 Census Tract 110 Tennessee Blount County Census Tract 109 Block Group 1 Block Group 2 Block Group 5 Census Tract 110 Block Group 1 Number % Number % Number % Number % Number % Number % Number % Number %
Total Population 5,689,283 100 105,823 100 5,105 100 1,768 100 748 100 926 100 7,969 100 2,506 100 Ages 0 to 17 1,398,521 24.6 24,130 22.8 1,131 22.2 456 25.8 152 20.3 185 20.0 1,613 20.2 605 24.1 Ages 18 to 64 3,587,451 63.1 66,779 63.1 3,141 61.5 1,141 64.5 496 66.3 532 57.5 4,854 60.9 1,550 61.9
Ages 65 or above 703,311 12.4 14,914 14.1 833 16.3 171 9.7 100 13.4 209 22.5 1,502 18.8 351 14.0
Median Age 35.9 -- 38.4 -- 39.4 -- N/A -- N/A -- N/A -- 42.8 -- N/A --
PELLISSIPPI PARKWAY EXTENSION Page 11
Table 2-3: 2000 Population by Race and Hispanic Origin
Census Tract 109 Census Tract 110
Tennessee Blount County Census Tract
109 Block Group 1 Block Group 2 Block Group 5 Census Tract 110 Block Group 1
# % # % # % # % # % # % # % # %
Total Population 5,689,283 100 105,823 100 5,105 100 1,768 100 748 100 926 100 7,969 100 2,506 100
Total Hispanic 123,838 2.2 1,120 1.1 49 1 0 0 0 0 0 0 34 0.4 0 0
White 4,505,930 79.2 99,596 94.1 4,887 95.7 1,682 95.1 704 94.1 882 95.2 7,747 97.2 2,426 96.8
Hispanic (White) 57,380 1 645 0.6 29 0.6 0 0 0 0 0 0 25 0.3 30 1.2 Black 928,204 16.3 3,052 2.9 72 1.4 0 0 0 0 44 4.8 52 0.7 0 0
Hispanic (Black) 4,605 0.1 25 0.02 0 0 0 0 0 0 0 0 0 0 0 0
American Indian 13,820 0.2 282 0.3 13 0.3 0 0 0 0 0 0 28 0.4 17 0.7 Hispanic (American Indian) 1,332 0.02 26 0.02 0 0 0 0 0 0 0 0 0 0 0 0
Asian/Pacific Islander 57,887 1 785 0.7 48 0.9 86 4.9 0 0 0 0 41 0.5 0 0
(Hispanic) Asian/Pacific Islander
980 0.02 1 0 0 0 0 0 0 0 0 0 0 0 0 0
Other 4,780 0.1 54 0.05 0 0 0 0 44 5.9 0 0 2 0.03 33 1.3
Hispanic (Other) 51,256 1 309 0.3 15 0.3 0 0 0 0 0 0 1 0.01 0 0
Total Minority1 1,244,082 22 6,299 6 226 4.4 86 4.9 44 5.9 44 4.8 183 2.3 33 2
Table 2-4: 2000 Population By Age
Source: 2000 Census 1 Total Minority is the sum of all persons other than white-non-Hispanic. Hispanics may be of any race, so also are included in applicable race categories.
Source: 2000 Census
Community Impact Assessment-Pellissippi Parkway Extension
PELLISSIPPI PARKWAY EXTENSION Page 12
3.0 INCOME AND POVERTY STATUS In Tennessee, the median household income is $36,360. Median household income levels in Blount County, the census tracts and most of the block groups are higher than the statewide average. However, the median household income in Census Tract 109, Block Group 5 is lower than the statewide average ($27,734 vs. $36,360).
Per capita income rates are higher that than the statewide average of $19,393 for Blount County and Census Tract 109. Census Tract 110 has a per capita income rate of 7 percent below the statewide average. The per capita income rates for Census Tract 109, Block Groups 2 and 5, and Census Tract 110, Block Group 1, are also lower than the statewide per capita income. Table 5 and Figure 4 summarize the income and poverty status information in the project area.
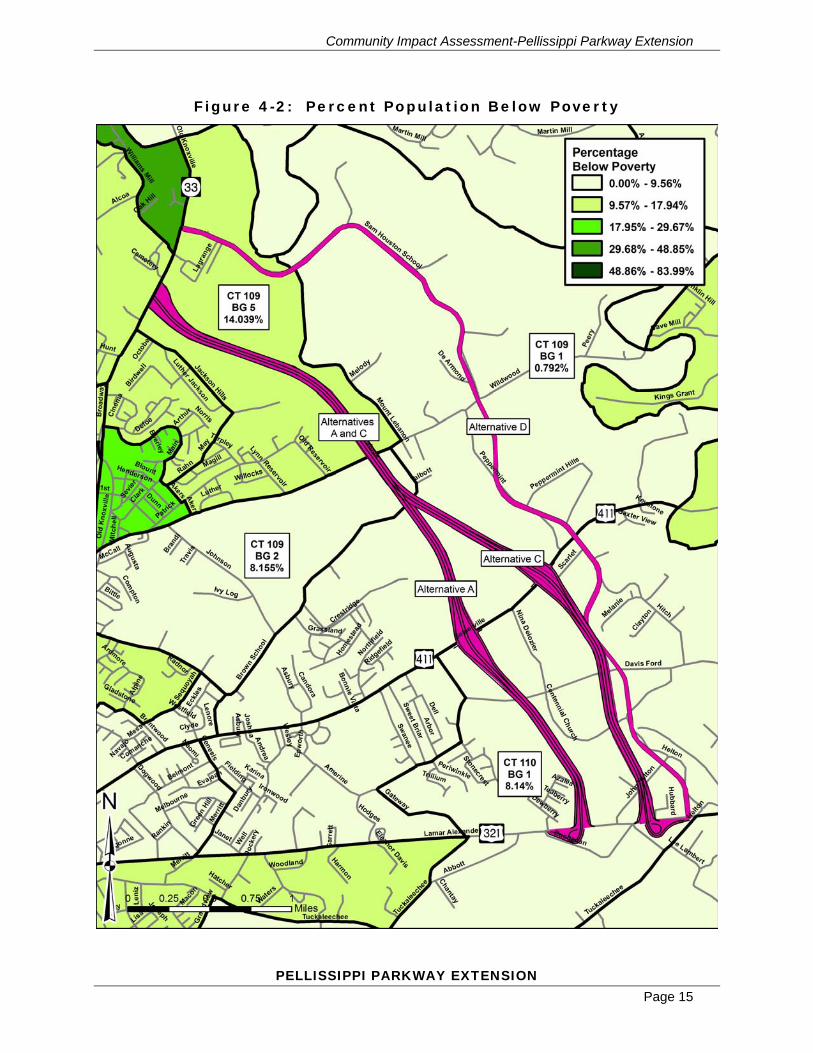
The statewide average of people below the poverty level is 13.1 percent. In Blount County, Census Tract 109, and Census Tract 110, the number of persons below the poverty level is less than the statewide average. Only one block group in the project area has a percentage of population below the poverty level that is greater than the statewide average and the county, Census Tract 109, Block Group 5.
4.0 HOUSING CHARACTERISTICS According to the 2000 Census, the median housing value in Blount County is higher than the statewide median housing value ($93,000 compared to $103,900). A review of the median rent values for Blount County, Census Tract 109, and Census Tract 110 are lower than the statewide average of $505 per month. In addition, the median rent in all of the block groups is lower than the state and county’s median rent. The statewide average for homeownership rates is 69.6%. For Blount County, Census Tract 109, Census Tract 110, and most of the block groups, the homeownership averages are higher. Census Tract 109, Block Group 5, has a slightly lower homeownership rate (68.7%). Table 6 summarizes the housing characteristics in the project area.

Community Impact Assessment-Pellissippi Parkway Extension
Census Tract 109 Census Tract
110
Tennessee Blount County
Census Tract 109
Block Group 1
Block Group 2 Block Group 5
Census Tract 110 Block Group 1
Total Households 2,439,443 47,059 2,267 651 340 477 3,403 1,003 Median Home Value $93,000 $103,900 $96,100 $142,100 $88,800 $87,800 $109,900 $105,900
Homeownership Rate1 69.6% 75.9% 78.7% 83.4% 78.6% 68.7% 81.5% 87.5% Median Rent $505 $450 $419 $384 $367 $305 $437 $370
Census Tract 109 Census Tract 110 Tennessee Blount County
Census Tract 109 BG 1 BG 2 BG 5
Census Tract 110 BG 1
Number % Number % Number % Number % Number % Number % Number % Number % Median
H.H. Income1
$36,360 N/A $37,862 N/A $37,328 N/A $56,705 N/A $38,145 N/A $27,734 N/A $36,798 N/A $38,571 N/A
Per Capita
Income2 $19,393 N/A $19,416 N/A $20,818 N/A $20,443 N/A $17,374 N/A $17,621 N/A $18,045 N/A $18,117 N/A
Persons below
poverty level3
746,789 13.1 10,084 9.7 432 7.5 14 0.8 61 8.2 130 14 582 7.5 204 8.1
Table 4-1: Income Measures and Persons Living Below Poverty Level
Table 4-2 Housing Characteristics
PELLISSIPPI PARKWAY EXTENSION
2 Percent based on difference between the study area and county and the same figure for the state
Page 13
3 Percent based on persons for whom poverty status is determined.
Source: 2000 Census
1 Based on occupied housing units
Source: 2000 Census
1 H.H. = Household

Community Impact Assessment-Pellissippi Parkway Extension
Figure 4-1: Percent Minority Population
PELLISSIPPI PARKWAY EXTENSION Page 14
Community Impact Assessment-Pellissippi Parkway Extension
Figure 4-2: Percent Population Below Poverty
PELLISSIPPI PARKWAY EXTENSION Page 15

Community Impact Assessment-Pellissippi Parkway Extension
5.0 BUSINESS ACTIVITY/EMPLOYMENT CENTERS
Blount County’s employment is largely dominated by the services and trade sector. In addition, over 100 manufacturing plants are in Blount County. Blount County’s largest employer is Denso Manufacturing of Tennessee, an automotive parts supplier, with 3,000 employees. The second and third largest employers are Alcoa Inc. followed by Blount Memorial Hospital.
According to the U.S. Census Bureau, approximately 63.5 percent of the available labor force works in Blount County. The Tennessee Department of Labor and Workforce Development reported that as of February 2009, the labor force within Blount County was 62,930 individuals with an unemployment rate of 9.6 percent compared to that of Tennessee, which had an average unemployment rate of 9.1 percent in February 2009 (see Table 7).
The project area is primarily in a suburban/rural area composed of agricultural and residential land. There is one commercial development located at the southern end of Alternatives C and D, The Misty View driving range is off John Helton Road. There is also a small cluster of commercial development at the beginning of Alternative D where it intersects with SR 33 (e.g. Nursery, Pond Shop, etc.). The majority of commercial uses are adjacent to the project area along US 129/Alcoa Highway, I-140, US 411/SR 35, Lamar Alexander Parkway and in downtown Maryville.
Table 5-1: 2009 Labor Force Estimates for Tennessee and Blount County
Geographic Area
Total Labor Force
Employed Unemployed Unemployment Rate (%)
Tennessee 3,052,300 2,776,000 276,300 9.1
Blount County 62,930 56,890 6,040 9.6
Source: Tennessee Department of Labor and Workforce Development, February 2009 Labor Force Estimates
Note: All numbers are seasonally adjusted.
5.1 Educational Attainment According to the U.S. Census Bureau, the Tennessee high school graduation is 76.9 percent. In 2000, the Blount County high school graduation rate was slightly higher at 78.4 percent. In addition, 11.6 percent of the population of Blount County has obtained some type of higher-education (e.g. associate degree, bachelor’s degree, master’s degree, professional school degree, or doctorate degree).
PELLISSIPPI PARKWAY EXTENSION Page 16
Community Impact Assessment-Pellissippi Parkway Extension
6.0 PUBLIC FACILITIES, SCHOOLS AND INSTITUTIONS
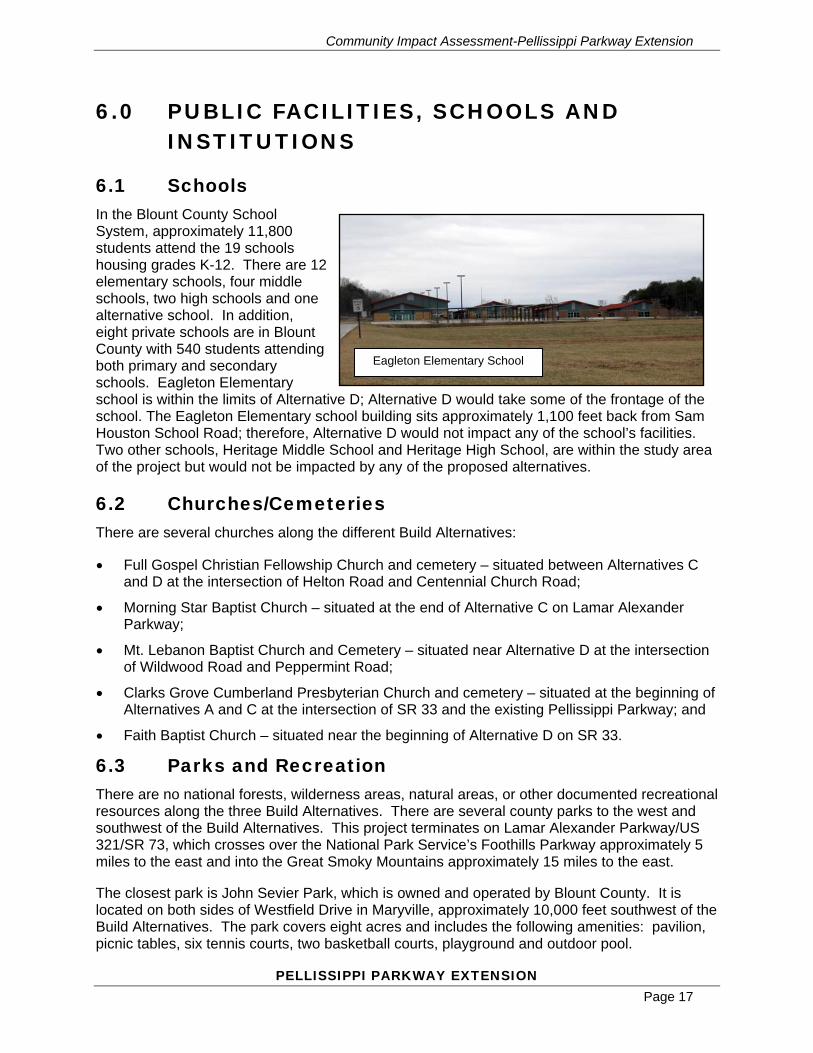
6.1 Schools In the Blount County School System, approximately 11,800 students attend the 19 schools housing grades K-12. There are 12 elementary schools, four middle schools, two high schools and one alternative school. In addition, eight private schools are in Blount County with 540 students attending both primary and secondary schools. Eagleton Elementary school is within the limits of Alternative D; Alternative D would take some of the frontage of the school. The Eagleton Elementary school building sits approximately 1,100 feet back from Sam Houston School Road; therefore, Alternative D would not impact any of the school’s facilities. Two other schools, Heritage Middle School and Heritage High School, are within the study area of the project but would not be impacted by any of the proposed alternatives.
Eagleton Elementary School
6.2 Churches/Cemeteries There are several churches along the different Build Alternatives:
• Full Gospel Christian Fellowship Church and cemetery – situated between Alternatives C and D at the intersection of Helton Road and Centennial Church Road;
• Morning Star Baptist Church – situated at the end of Alternative C on Lamar Alexander Parkway;
• Mt. Lebanon Baptist Church and Cemetery – situated near Alternative D at the intersection of Wildwood Road and Peppermint Road;
• Clarks Grove Cumberland Presbyterian Church and cemetery – situated at the beginning of Alternatives A and C at the intersection of SR 33 and the existing Pellissippi Parkway; and
• Faith Baptist Church – situated near the beginning of Alternative D on SR 33.
6.3 Parks and Recreation There are no national forests, wilderness areas, natural areas, or other documented recreational resources along the three Build Alternatives. There are several county parks to the west and southwest of the Build Alternatives. This project terminates on Lamar Alexander Parkway/US 321/SR 73, which crosses over the National Park Service’s Foothills Parkway approximately 5 miles to the east and into the Great Smoky Mountains approximately 15 miles to the east.
The closest park is John Sevier Park, which is owned and operated by Blount County. It is located on both sides of Westfield Drive in Maryville, approximately 10,000 feet southwest of the Build Alternatives. The park covers eight acres and includes the following amenities: pavilion, picnic tables, six tennis courts, two basketball courts, playground and outdoor pool.
PELLISSIPPI PARKWAY EXTENSION Page 17

Community Impact Assessment-Pellissippi Parkway Extension
7.0 POLICE, FIRE, EMERGENCY MANAGEMENT SERVICES AND PUBLIC SERVICE
Law enforcement in Blount County is administered by the Blount County Sheriff’s Department. The Blount County Sheriff’s Department is located in Maryville. Other cities within Blount County also have their own police departments, including the City of Maryville, City of Alcoa, and the City of Townsend. The Tennessee Highway Patrol is also coordinated with when appropriate.
Blount County also has several fire departments that will respond dependent on the location of the incident within the county. These fire departments include the Blount County Fire Department, the City of Maryville Fire Department, the City of Alcoa Fire Department, the City of Townsend, the City of Seymour, the City of Greenback, and the City of Friendsville.
Ambulance service for Blount County is provided by Rural/Metro Ambulance Services. Rural/Metro Ambulance Services has offices in both the cities of Maryville and Alcoa. Ten ambulances are staffed for emergency calls as well as two support units. The Blount County Rescue Squad is also available to respond to emergency calls. This organization is completely staffed by volunteers and is in the City of Alcoa. Primarily, the Blount County Rescue Squad deals with operating the “jaws of life” in vehicular accidents. Other capabilities include water rescue services, lost or missing person searches, steep or mountainous terrain searches, and free standby medical services at local schools or community events.
Blount County Memorial provides medical services for Blount County. The hospital is approximately 2.5 miles southwest of the project area in the City of Maryville along US 321. The hospital has approximately 334 beds and is complete with a Level-3 Trauma Room. Several associated medical centers are dispersed throughout Blount County.
8.0 UTILITIES Electricity in Blount County is provided by the Cities of Alcoa and Maryville. Blount County residents not within the Maryville or Alcoa city limits can obtain electricity from Fort Loudon Electric Cooperative. Natural gas for the area is provided by Atmos Energy.
Water in Blount County is provided by the Cities of Alcoa and Maryville. In some areas of the county, water is provided by South Blount Utility District. The source of the county’s water is the Little River Watershed, which covers an area of 380 square miles including most of Blount County as well as portions of Sevier and Knox Counties.
Sewer service is provided by the Cities of Alcoa and Maryville and extends in some areas beyond the city limits. Those Blount County residents outside of Alcoa’s and Maryville’s service area use septic systems.
PELLISSIPPI PARKWAY EXTENSION Page 18

Community Impact Assessment-Pellissippi Parkway Extension
PELLISSIPPI PARKWAY EXTENSION Page 19
9.0 EXISTING/FUTURE LAND USES AND PRESENT/FUTURE ZONING
9.1 Residential 9.1.1 Past Development
As shown in Table 1, Blount County’s population has been growing since 1970 and is projected to grow another 35.5 percent between 2000 and 2025. As the county becomes more populated, the land has become more densely settled. The overall percentage of people who are living in urban areas (areas with sewer and public water) has increased. In 1990, approximately 52 percent of the population lived in urban areas. By 2000, the share of the County’s population living in urban areas had increased to nearly 64 percent.
In order to keep pace with the population growth, the number of housing units in Blount County has more than doubled over the last 30 years. In 2000, there were more than 47,000 housing units in the County, which represents a 116 percent increase from 1970, in which there were only 22,000 housing units available.
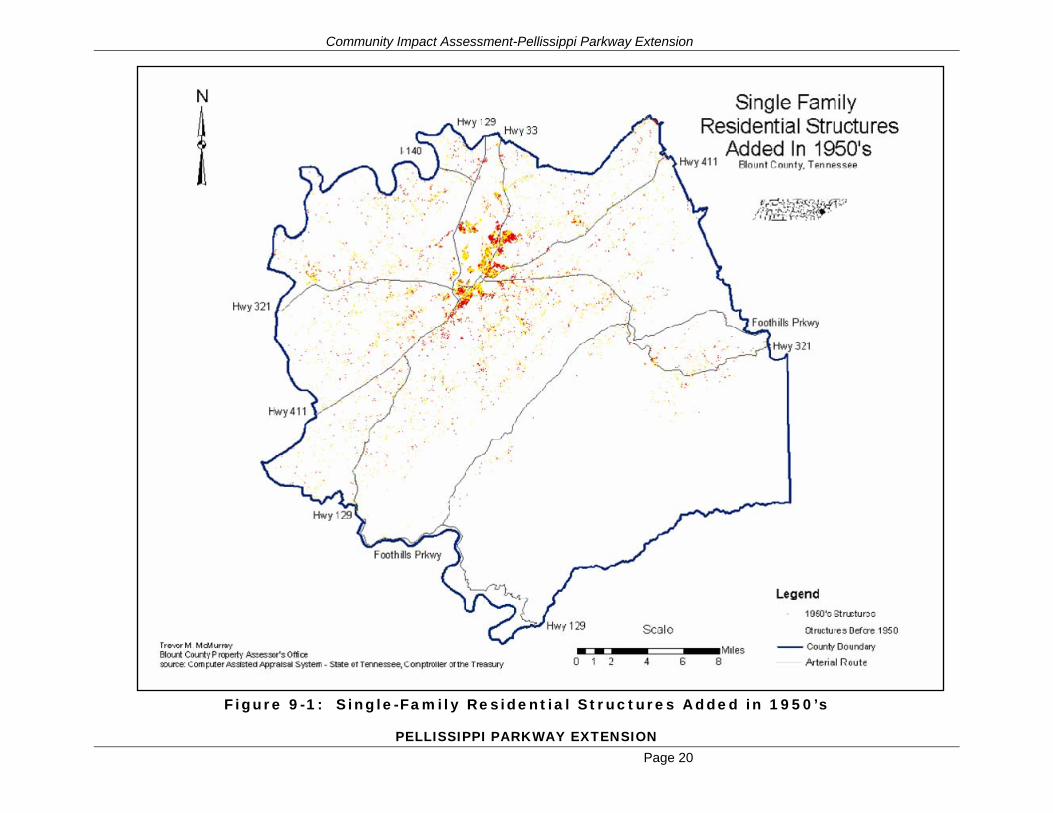
Blount County’s Planning Department has tracked residential development in the County since the 1950’s. The Planning Department has prepared graphical representations of the residential development between 1950 and 2005, which are provided in Figures 5 - 10. Each dot on the figures represents a residential structure. For each decade represented by the individual maps, yellow dots represent homes that already existed, while the red dots represent new residential structures that were constructed during the decade. While growth is occurring throughout the counties, the majority of the growth is within the urban areas (i.e. cities of Alcoa and Maryville).
The following highlights the major growth locations during the last 50 years:
• 1950’s (Figure 5) – Residential growth is seen along the western side of SR 33/Old Knoxville Highway and along the eastern side of SR 33 towards Sevierville Road in Eagleton Village. Homes are also developing along the eastern side of Broadway/US 411 in Maryville.
• 1960’s (Figure 6) – Residential growth continues along the eastern side of SR 33 and north and south of Sevierville Road. Growth also continues south of Lamar Alexander Parkway along the eastern edge of Broadway and US 411 in Maryville.
• 1970’s (Figure 7) – Residential growth continues to move in an easterly direction from SR 33 along the north and south sides of Sevierville Road. Strong growth can also be seen continuing south along US 411. A pocket of homes are developed to the west of US 411, just south of the Alcoa Bypass and homes continue to develop east of US 411 moving farther east towards Montvale Road. During this time, a pocket of homes also begins to appear towards the Knox County border between I-140 and US 129.
• 1980’s (Figure 8) – Residences continue to be constructed east of SR 33, primarily between Sevierville Road and Lamar Alexander Parkway. Homes also continue to develop in Maryville east along US 411. During this decade, a cluster of homes is built near Montvale Station Road and Montvale Road.
Community Impact Assessment-Pellissippi Parkway Extension
Figure 9-1: Single-Family Residential Structures Added in 1950’s
PELLISSIPPI PARKWAY EXTENSION Page 20

Community Impact Assessment-Pellissippi Parkway Extension
PELLISSIPPI PARKWAY EXTENSION Figure 9-2: Single-Family Residential Structures Added in 1960’s
Page 21

Community Impact Assessment-Pellissippi Parkway Extension
Figure 9-3: Single-Family Residential Structures Added in 1970’s
PELLISSIPPI PARKWAY EXTENSION Page 22

Community Impact Assessment-Pellissippi Parkway Extension
Figure 9-4: Single-Family Residential Structures Added in 1980’s
PELLISSIPPI PARKWAY EXTENSION Page 23

Community Impact Assessment-Pellissippi Parkway Extension
PELLISSIPPI PARKWAY EXTENSION Figure 9-5 Single-Family Residential Structures Added in 1990’s
Page 24

Community Impact Assessment-Pellissippi Parkway Extension
Figure 9-6: Blount County Single-Family Residential 2000-2005
Page 25
PELLISSIPPI PARKWAY EXTENSION

Community Impact Assessment-Pellissippi Parkway Extension
• 1990’s (Figure 9) – Residential growth continues east along Sevierville Road and south along US 411.
• 2000 to 2005 (Figure 10) – Residential growth continues to extend along major corridors.
9.1.2 Development in the Study Area
Residential development in the study area is primarily composed of single-family dwellings, with some mobile homes and condominiums. Subdivisions along the proposed Build Alternatives include:
• Jackson Hills Subdivision and Eagleton Village - between SR 33 and Wildwood, west of Alternatives A and C;
• Whittenberg Estates and Sweet Grass Plantation (developing subdivision) - between Alternatives A and C/D, north and south of Davis Ford Road, respectively;
• Kensington Place Trailer Park - north of Lamar Alexander Parkway, west of Alternative A
• Edgewood Acres - beginning of Alternative D off SR 33;
• Crommell Village Condo’s - west of Alternative D, north of Wildwood Road;
• Peppermint Hills Subdivision –east of Alternative D, north of Wildwood Road;
• Twelve Oaks – east of Alternatives C and D off Melanie Drive;
• Tara Estates – between Alternatives C and D, south of Sevierville Road;
• Misty View Subdivision – east of Alternatives C and D, south of Davis Ford Road
9.2 Commercial The project corridor is primarily low density suburban, with areas shifting from rural to suburban. Commercial uses are generally at the beginning and end of the project alternatives. The majority of commercial uses are located adjacent to the project area along US 129/Alcoa Highway and to the west, I-140, US 411/SR 35, Lamar Alexander Parkway and in downtown Maryville.
9.3 Industrial Most of the industrial development is centered in Maryville and Alcoa and along I-140, US 129, and US 321. One industrial development is within the project area, Clayton Industries, where the Build Alternatives intersect with SR 33.
9.4 Zoning Both Blount County and the Cities of Maryville and Alcoa enforce zoning and land use ordinances. Both cities have an Urban Growth Boundary (UGB), as established in the Maryville Urban Growth Plan (April 1999) and the City of Alcoa’s 2025 Comprehensive Plan (May 9, 2006). The proposed Build Alternatives are located within the UGB for Alcoa and Maryville. Also, Blount County participates in the National Flood Insurance Program (NFIP).
PELLISSIPPI PARKWAY EXTENSION Page 26
Community Impact Assessment-Pellissippi Parkway Extension
PELLISSIPPI PARKWAY EXTENSION Page 27
9.5 Future Land Use The Blount County Planning Commission’s Blount County Policies Plan focuses largely on preserving the rural and suburban residential nature of the larger part of Blount County. Medium and low density residential development is encouraged; however, commercial development is prescribed to be allowed only by exception along major corridors and key intersections. The plan emphasizes preserving the rural, small town and natural character of Blount County and strongly supports zoning regulations, including more innovative regulations such as mixed-use and rezoning to guide land use decisions. The plan also includes a policy objective which encourages the location of development in areas where adequate utilities and infrastructure already exist or can be economically extended. This plan is considered a companion to the Conceptual Land-use Plan (described below), and further indicates that the area surrounding the proposed Pellissippi Parkway Extension is expected to develop, given its proximity to the Cities of Maryville and Alcoa. The extension of the roadway would complement the anticipated future growth by enhancing the transportation infrastructure of the area.
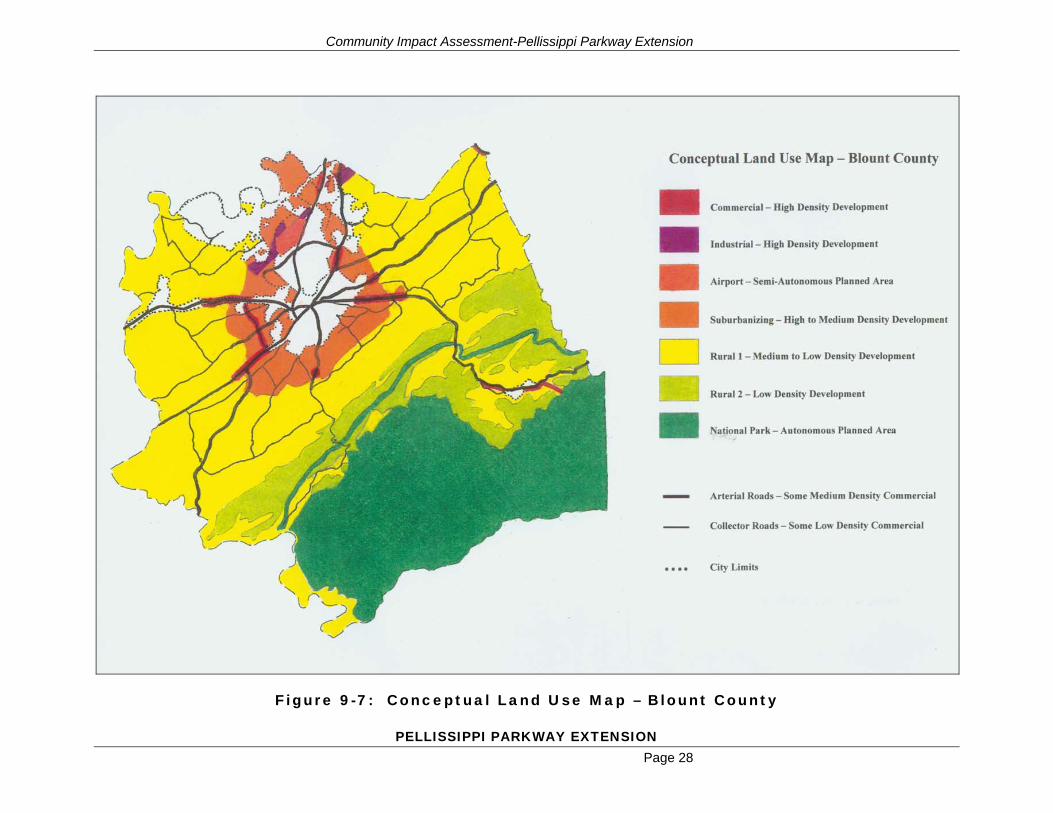
The Conceptual Land-Use Plan defines the type of development (commercial, industrial, residential, rural) and lays down the expectations of the potential shape of each of these land uses. For instance, commercial development is expected in the plan to be allowed to grow as needed, while industrial development is expected to be concentrated around the cities of Alcoa and Maryville. The Conceptual Land-Use Plan contains a Land Use Plan Map that shows the County divided into various types of development categories from rural low-density to commercial high-density (Figure 11). Land around the proposed Pellissippi Parkway Extension is in the “Suburbanizing – High to Medium Density” category. It is expected that land in this category will be developed and annexed by the cities as growth occurs in the County.
The Conceptual Land-Use Plan is consistent with the Growth Plan (August 14, 2007) developed for Public Chapter 1101. The proposed area of the Pellissippi Parkway Extension is within the UGB, which shows land projected to develop over the next 20 years) developed for the Growth Plan.
The Blount County Growth Strategy and the City of Maryville Growth Strategy were developed as implementation resources for managing and guiding future development and to identify related impacts of this development on the County. These studies build on the guiding policies of the Blount County Policies Plan and the Maryville 2010 Comprehensive Plan. It was completed in 2005. This strategy indicates the following, which relate to anticipated land development and the need for infrastructure enhancements in the area of the proposed Pellissippi Parkway Extension:
• Population in Blount County is expected to increase consistently between 2005 and 2050. Using the moderate level projections, an increase in population of more than 30% is expected in Blount County between 2000 and 2020.
• Increases in housing density allowances are recommended to accommodate the anticipated population growth in adherence to smart growth strategies.
• Increasing population and density will put continued pressure on the transportation system. Improvements will need to be made to the existing system, and new roads and alternative transportation systems will need to be explored.
Community Impact Assessment-Pellissippi Parkway Extension
Figure 9-7: Conceptual Land Use Map – Blount County
Page 28
PELLISSIPPI PARKWAY EXTENSION

Community Impact Assessment-Pellissippi Parkway Extension
• The County should coordinate with Alcoa and Maryville to fund and build arterial road segments that will create a connected system of major roads to serve developed and developing areas.
• Developing residential subdivisions should be connected to the state highway system; new roads may need to be built to accomplish this connection.
• The timing of development should be matched with the provision of adequate infrastructure.
• Some of the traffic congestion problems facing Maryville and Blount County are related to the lack of circumferential access around Maryville. Improving circumferential travel will alleviate some of the congestion through downtown Maryville.
• The completion of Pellissippi Parkway from SR 33 to US 321 is assumed as a necessary transportation improvement in this study. If the extension is not built, another connector road is recommended for the area.
• When combined with appropriate land use regulations, the recommended transportation improvements need not contribute to urban sprawl.
10.0 COMMUNITY STABILITY AND NEIGHBORHOOD COHESION
Community stability and neighborhood cohesion is the term that describes the social network and actions that provide satisfaction, security, camaraderie, support, and identity to members of a community or neighborhood. While the residential development in the relatively rural study area is scattered, cohesion within the communities themselves (small towns and cities) appears to be strong. There are several churches in the project area and adjacent to the project area, which indicate strong inter-neighborhood bonds.
Adverse impacts to communities and neighborhoods along the corridor may result from the construction of a new arterial route between SR 33 and US 321. Potential adverse affects include splitting neighborhoods, isolating portions of the community by creating a physical barrier separating residents from community facilities, generating new development or changing the character of development patterns, or causing increases/decreases in property values.
Alternative A would displace five single-family units, none of which are located within an established neighborhood. Alternative A would terminate along Lamar Alexander Parkway adjacent to the Kensington Place Trailer Park. No mobile homes would be displaced, but Alternative A could result in visual and noise impacts to the neighborhood. This alternative could disrupt rural residential communities by physically dividing the dispersed residents in the area.
Alternative C would displace 25 single-family residents and one mobile home. Alternative C would split the Tara Estates subdivision off Sevierville Road and could disrupt community cohesion and interaction with long time residents who have lived in the community for years.
Alternative D would displace 21 single-family residences (several of which are located in the Peppermint Hills Subdivision and Tara Estates) and three mobile homes. Alternative D would likely disrupt the community cohesion for residents in the Peppermint Hills Subdivision and the Tara Estates subdivision and could disrupt interaction with long time residents who have lived in the community for years.
PELLISSIPPI PARKWAY EXTENSION Page 29

Community Impact Assessment-Pellissippi Parkway Extension
11.0 FARMLAND IMPACTS Table 8 shows that since 1982, the amount of farmland in Blount County has remained relatively stable. In 1982, approximately 31 percent of the County’s 560 square miles was farmland; 25 years later (2007), the amount of farmland had decreased slightly to approximately 27 percent of total land. Overall, approximately 11 percent of the more than 111,000 acres of farmland has been lost over the 250 year period between 1982 and 2007. The size of the average farm has seen a six percent decline. The average size of a farm in Blount County in 2007 was 85 acres, which is a slight increase since 2002 (81 acres).
Financially, the market value of agricultural products sold, including both crops and livestock has increased nearly 21 percent to approximately $17 million since 1987.
Table 11-1: Farmland in Blount County
1982 1992 2002 2007 % Change
(1982-2007)
Land in Farms (acres) 111,029 96,181 105,148 98,403 -11% Land in Farms - Average size of farm (acres)
91 95 81 85 -6%
Source: Census of Agriculture, 1982, 1992, 2002, 2007
12.0 TOURISM Tourism is extremely important to the regional economy. Blount County includes part of the Great Smoky Mountains National Park (GSMNP). The City of Townsend is the southwestern gateway to the GSMNP. In addition, the Pellissippi Parkway Extension is approximately 15 miles west of the GSMNP. It is estimated that two million people visit Cade’s Cove within the GSMNP each year, which is easily accessible from Townsend. Other attractions in Blount County include Tuckaleechee Cavern in Townsend, the Blackberry Farms Bed and Breakfast in Walland, and Lake Loudon on the western border of the county.
The Tennessee Department of Tourist Development is one of the leaders among state organizations in the United States tourism industry. In 2007, Tennessee's tourism generated a $14.2 billion economic impact to the state's economy, another $1 billion increase for the second consecutive year. More than 184,700 Tennesseans are now employed in the state's tourism industry. Payroll generated by direct travel spending grew 6.6% to $5.4 billion in 2007. Tennessee's overnight and day-trip visitors provided $1.1 billion in state and local sales tax revenues which accounts for another billion in tax revenues for the second consecutive year. (Source: http://state.tn.us/tourdev/about.html)
Tourism is also an important part of the economy in Blount County. In 2007, Blount County ranked sixth in Tennessee for visitor spending with the highest increase in East Tennessee. Tourism expenditures were approximately $276 million, which is an 8.8 percent increase over 2006. Nearly 3,000 people were employed in the tourism industry in the County in 2007, with an annual payroll of approximately $76 million. Annual local sales tax receipts for Blount County in 2007 were more than $9 million. (Source: http://www.blountchamber.com/helpcenter/focus.html#blount)
PELLISSIPPI PARKWAY EXTENSION Page 30

Community Impact Assessment-Pellissippi Parkway Extension
13.0 TITLE VI AND ENVIRONMENTAL JUSTICE The U.S. Census (2000) figures show that Blount County have substantially lower poverty rate (9.7 percent) than Tennessee (13.1 percent). The U.S. Census (2000) figures also show that there is approximately six percent minority population in Blount County, which is less than Tennessee’s 22 percent minority population.
All of the block groups in the project area have minority populations that are less than Tennessee and Blount County.
The entire block groups, but one, have a smaller population below the poverty level when compared to Tennessee and Blount County. However, approximately 14 percent of Census Tract 109, Block Group 5’s population is below the poverty level.
The project would not disproportionately adversely impact low-income or minority communities protected under the environmental justice order.
Under a Title VI analysis, if any of the proposed optional improvements and possible rights-of-way discussed above is used, this assessment finds no evidence or indication of discrimination on the basis of race, color, national origin, age, sex, or disability.
Any possible environmental justice issues could be minimized by staged acquisition over a longer period of time. Community input was gathered during ongoing coordination with the population in the project area to facilitate discussions and suggested ways to minimize adverse impacts.
14.0 COMMUNITY IMPACTS ASSESSMENT LEGAL AUTHORIZATION
This report has been prepared under the authorization and is intended to meet the requirements of the following laws and regulations:
• Transportation Efficiency Act for the 21st Century (TEA-21) • National Environmental Policy Act of 1969 (NEPA) • Title VI of the Civil Rights Act of 1964 and related statutes • Federal-Aid Highway Act of 1970, 23USC 109(h) • Environmental Impact and Related Procedures (1987), 23 USC 771 • Guidance for Preparing and Processing Environmental and Section 4(f) Documents, TA
6640.8A (1987) • Executive Order (EO) 12898 on Environmental Justice (1994) • Department of Transportation Order on Environmental Justice (1997) • Farmland Protection Policy Act (1981), as amended in 1994 (7 CFR 658) • Uniform Relocation Assistance and Real Property Acquisition Policies Act (1970, referred to
as the “Uniform Act”), as amended in 1987 • Federal Highways Administration Environmental Policy Statements (1990 and 1994) • Recommendations of the President’s Council on Sustainable Development
PELLISSIPPI PARKWAY EXTENSION Page 31