draft 2018 tri-cities metropolitan area park and ride report
TRANSCRIPT

2018 Tri-Cities Metropolitan Area Park and Ride Report
DRAFT

P.O. Box 217Richland WA 99354
509.943.9185www.bfcog.us
Benton-Franklin Council of Governments
Americans with Disabilities Act (ADA)Adopted in 1990, the Americans with Disabilities Act prohibits discrimination against individuals with disabilities in all areas of public life, as an addition to Section 504 of the Rehabilitation Act of 1973. Transportation is included in the Act. It ensures equal opportunity and access to goods and services.
Following 29 USC 794, no otherwise qualified individual with a disability shall, solely by reason of their disability, be excluded from participation in, be denied benefits of, or be subjected to discrimination under any program or activity receiving Federal financial assistance.
Title VIBenton‐Franklin Council of Governments hereby gives public notice that it is the policy of the agency to assure full compliance with Title VI of the Civil Rights Act of 1964, the Civil Rights Restoration Act of 1987, Executive Order 12898 on Environmental Justice, and related statutes and regulations in all programs and activities. Title VI requires that no person in the United States of America shall, on the grounds of race, color, sex, or national origin, be excluded from the participation in, be denied the benefits of, or be otherwise subjected to discrimination under any program or activity for which BFCG receives federal financial assistance.
Title VI NoticeAny person who believes they have been aggrieved by an unlawful discriminatory practice under Title VI has a right to file a formal complaint with BFCG. Any such complaint must be in writing and filed with the BFCG Title VI Coordinator within one hundred eighty (180) days following the date of the alleged discriminatory occurrence.
Title VI Complaint Forms may be obtained from BFCG at no cost by calling (509) 943‐9185. If information is needed in another language, please contact BFCG at (509) 943‐9185. Access the complete document on the BFCG website.
Si se necesita información en otro idioma, por favor contacte a BFCG (509) 943‐9185.
2018 Park and Ride Report Draft 3
TAble oF ConTenTsDRAFT ......................................................................................... 1Introduction ............................................................................... 4Section 1 - Background ............................................................. 5Tri-Cities Park and Ride Facilities ...........................................................................................................5History of the Park and Ride System in the Tri-Cities.....................................................................8
Section 2 - Existing Conditions ................................................. 9System Change since the 2007 Report ...............................................................................................9Park and Ride System Use ......................................................................................................................9Ben Franklin Transit Vanpool System ..................................................................................................16Additional Capacity to be Added to System ....................................................................................17Summary ......................................................................................................................................................17
Section 3 - Assessing Need, Locating Demand ....................... 18Assessing Need ...........................................................................................................................................182015 Regional Travel Demand Model .................................................................................................18The American Community Survey .......................................................................................................21Locating Current Need and Future Demand ...................................................................................24Locating Current Need .............................................................................................................................24Locating Future Demand ........................................................................................................................24
Section 4 - Site Selection Guidelines & Recommendations ... 29Site Selection Guidelines .......................................................................................................................29Proximity to Commuter Corridors .......................................................................................................29Surrounding Land Uses ............................................................................................................................29Traffic Volumes/Traffic Flow/Access ....................................................................................................29General System Recommendations ....................................................................................................30Park and Ride Lot Phasing Recommendations ................................................................................30Conclusion ....................................................................................................................................................31
Appendix .................................................................................... 32Comments and Responses .....................................................................................................................32
TAble oF ConTenTs

2018 Park and Ride Report Draft 4
InTRoDuCTIon
In 2007, the Benton-Franklin Council of Governments (BFCG) issued the Tri-Cities Metropolitan Area Park and Ride Report. The report included a history of the metropolitan area park and ride system, a review of existing conditions, and presented data on population growth and location, as well as predicted location of future employment. This update will examine the existing park and ride system update and evaluate system-wide data and identify where future demand may occur.
The update contains four parts:
• Section One presents background information on park and ride systems in general and tracks the development of the park and ride system in the Tri-Cities.
• Section Two reviews existing conditions of the metropolitan system, and presents data concerning usage of the current park and ride lot system.
• Section Three reviews commute choice decision data from the American Community Survey, and population data from the the State Office of Financial Management, as well as the 2015 BFCG Regional Travel Demand Model to assess potential need for new sites. It also identifies areas of potential unmet demand.
• Section Four contains recommendations for some next steps in the development of the park and ride system in the metropolitan Tri-City area.

2018 Park and Ride Report Draft 5
Tri-Cities Park and Ride FacilitiesPark and ride facilities have been a vital component of the transportation demand management tool kit for decades. Due to the multiple effects of increased congestion on local streets and highways they are the subject of increased interest. These locations serve as a transfer site for persons switching modes of travel from single occupant vehicle, bicycle or as a pedestrian to a carpool, vanpool or mass transit.
In the Tri-Cities area, a primary distinguishing characteristic for the system is whether a facility is a park and ride lot or a park and pool lot. Park and ride lots are facilities where individuals have the option to transfer modes to public transportation and use transit as a segment of their journey, often ending at work. Park and pool lots, a subset of park and ride lots, are parking facilities where individual drivers meet to transfer to carpools and vanpools. Each type of facility may address both purposes, but park and pool lots are not necessarily served by public transportation.
The term “park and ride” will be used throughout the remainder of the report to represent both types of facilities unless otherwise specified. Figure 1-1 on page 6 contains information concerning ownership, facility type and date of construction of park and ride lots in Benton and Franklin Counties. As shown, ownership of most metropolitan area park and ride lots is primarily split between the Washington State Department of Transportation (WSDOT) and Ben Franklin Transit (BFT). Figure 1-2 on page 7 shows the location of park and ride lots in the metropolitan area. The ID numbers in the left column of Figure 1-1 correspond to site numbers on the map.
Distinguishing between the two, WSDOT facilities are primarily park and pool lots adjacent to major roadway intersections such as SR 240/SR 224 or I-182/Queensgate Drive, and are sited for the convenience of the vanpool and carpool user. Also, development of the WSDOT facilities generally preceded that of the BFT lots.
BFT park and ride facilities are located at transit centers in their respective communities and function as supplements to the transit centers. The focus of the facility is on the transit user rather than the commuter, though commuters may use them.
A distinction between the Tri-City area system and park and ride systems in other metropolitan areas is that the Tri-Cities system provides centralized parking facilities for vanpools and carpools. In many metropolitan areas, park and ride lots provide parking for transfer to a public transit system to journey to work. Ben Franklin Transit’s service and route system are not designed to provide transportation from these facilities to work sites, though BFT riders may use transit to get to work locations served by the fixed route system.
seCTIon 1 - bACkgRounD

2018 Park and Ride Report Draft 6
Site ID# Facility Facility Owner Facility Type
Year Built Comments
1Stacy Street Transit Center - Prosser
BNSF RR Lease to Prosser/ BFT Park & Ride 2003 Stacy Street & 7th Street
2Kiona Park & Ride - I-82 & SR 224 Interchange WSDOT Park & Pool 1983 Exit #96 on I-82;
3Horn Road off SR 240 - Benton County U.S. Government Park & Pool Hanford Route 10 off SR 240
4 Benton City Transit Center Benton City Park & Ride 2002 9th Street & Dale Avenue
5 SR 240 & SR 224 - Richland WSDOT Park & Pool 1982SR 224 & Terminal Drive - Entrance on Terminal Drive
6West Richland Transit Center W. Richland/ BFT Park & Ride 1989 SR 224 & Flat Top Park
7Stevens Drive & Spengler Road Port of Benton Park & Pool
BFT lease arrangement with Port of Benton
8Knight Street Transit Center - Richland BFT Park & Ride 1989 Knight Street & Goethals Drive
9SR 240 & Columbia Park Trail WSDOT Park & Ride 1982 Across from Ben Franklin Transit
10Columbia Park Trail & Tulip Lane WSDOT Park & Ride 1986
Entrance off Columbia Park Trail on Tulip Lane
11Ed Frost Transit Center - Kennewick BFT Park & Pool 1987
West Clearwater Avenue & North Huntington Street
12West 27th Avenue & South Union Street - Kennewick Kennewick Park & Pool 1992
Adjacent to Roundabout; Includes lot across street
13SR 395 & North Yelm Street - Kennewick WSDOT Park & Pool
On West Falls Avenue west of North Yelm Street
14TRAC Center, 6600 Burden Boulevard - Pasco Franklin County Park & Pool
BFT lease arrangement with Franklin County
15North 22nd Avenue Transit Center - Pasco BFT Park & Ride 1989 Park Street & North 22nd Avenue
Figure 1-1: 2017 Tri-Cities Area Park and Ride System

2018 Park and Ride Report Draft 7
9
8
7
6 5
4
3
2
1
15
14
13
12
11
10
Sources: Esri, HERE, DeLorme, USGS, Intermap, INCREMENT P, NRCan, Esri Japan, METI, Esri China(Hong Kong), Esri Korea, Esri (Thailand), MapmyIndia, NGCC, © OpenStreetMap contributors, and theGIS User Community
±
0 105Miles
Figure 1-2: Location of Tri-Cities Area Park and Ride Facilities

2018 Park and Ride Report Draft 8
History of the Park and Ride System in the Tri-CitiesMajor influences in the development of the park and ride system in the Tri-Cities metropolitan area are BFT and WSDOT. In 1982 BFT was formed and began sponsoring a pilot vanpool program in the Tri-Cities with the now defunct Washington State Energy Office (WSEO) . Prior to that date no publicly organized ridesharing activities were available in the area.
At that time, the Federal Department of Energy (DOE) maintained a bus system to transport employees to select work sites on the Hanford Reservation. In the private sector, Rockwell Hanford Operations had conducted some organized ridesharing efforts. Additionally, informal ride matching arrangements, in some instances by employers, in others among fellow employees, were in use at some locations.
Because of the Hanford Reservation’s employment presence in the community, and it’s relatively distant location, many Hanford employees - carpoolers and vanpoolers - met informally throughout the Tri-Cities metropolitan area. Often, parking locations were selected along arterial corridors on private property such as churches or shopping centers, or state right-of-way, particularly in the Richland Wye area. As ridesharing activities increased throughout the Tri-Cities due to BFT promotion of its vanpooling program, it was recognized that formal parking arrangements for commuters was necessary. In response, in 1982, WSDOT created two park and pool lots in the Tri-Cities.
During 1984 and 1985, the Benton-Franklin Governmental Conference, in association with BFT, began the task of evaluating the availability of parking facilities for commuters and identifying locations for parking facilities to meet the demand created by the increased awareness and utilization of ridesharing whether by carpooling, vanpooling or express bus service.
Also in 1984, BFT initiated commuter bus service to areas of the Hanford Reservation not provided service through DOE. In the mid 1990’s the DOE discontinued their commuter bus service and BFT was able to fill the gap with an aggressive vanpool program.
In 2000, with the passage of Initiative 695 and elimination of the motor vehicle excise tax, 45% of BFT operating revenue was eliminated. As a result of decisions made to configure a financially viable transit system based on the revised budget, commuter bus services to Hanford and to the Boise Cascade facility in Walla Walla County were discontinued. Although BFT funding was restored through a voter-approved sales tax increase in 2002, those commuter services were not resumed.
As shown in Figure 1-1 on page 6, Tri-Cities Metropolitan Area Park and Ride Facilities, BFT, WSDOT and others have added to the inventory over time.

2018 Park and Ride Report Draft 9
System Change since the 2007 ReportNew facilities have been added to the system, and existing lots have been modified since the 2007 report. Formerly, the West Richland Transit Center was two distinct parcels, a gravel surface parking lot and an adjacent paved Ben Franklin Transit transfer facility. These were combined into a single facility. Also, a lot located next to the BFT Administration Building on Columbia Park Trail was decommissioned as part of a BFT campus redesign and the WSDOT facility across the street was expanded. The facility at Columbia Park Trail and Tulip Lane has been improved with asphalt paving, lighting and a bus shelter.
Park and Ride System Use Currently, the Tri-Cities metropolitan area park and ride system is comprised of 15 lots in Benton and Franklin Counties. The following tables and figures contain data about current and historical usage of the Tri-Cities metropolitan area park and ride system gathered by BFCG staff through quarterly inventories. BFCG has performed a quarterly vehicle count of park and ride sites since 2011. Facilities are surveyed over one day, in mid-week in the middle of the month. The Site ID numbers listed in the left hand column of Figure 2-3 on page 10 and Figure 2-4 on page 11 correspond to the numbered locations on Figure 2-5 on page 12.
Figure 2-4 shows average annual quarterly occupancy data for park and ride facilities in the metropolitan area between the years 2013 to 2017, five-year average occupancy data and percentage, as well as the lots ranked A through D based on that percentage. The table shows individual lots have averaged between 8 percent and 75 percent occupancy while three lots have averaged greater than 60 percent occupancy and three lots have averaged less than 20 percent during that period. Figure 2-4 also indicates the metropolitan area system itself has had an average occupancy rate of 40 percent for the five-year period.
Shared qualities among the three sites with a rating of “A” are easy access and a visible location. Those same factors are present in the sites with a “B” rating. In contrast, the three facilities rated “D”: SR 240 & Route 10 (#3), Knight Street Transit Center (#8), and Columbia Park Trail & Tulip Lane (#10) all have challenges with either access, visibility or both.
Though common traits are found among the three facilities with highest average occupancy, it is important to note the capacity of each site as well. The Kiona Park & Ride (#2) outside of Benton City is a small facility, West 27th Street & South Union Street (#12) in southeast Kennewick is a mid-size site, while SR 240 & Columbia Park Trail (#9) in the center of the urban area is the second largest facility, yet each was rated an “A”.
In addition to capacity, a second factor that varies among the three top ranked sites is location in the metropolitan area. Figure 2-5, based on the Table, maps the location of area facilities and indicates their five year average percent of occupancy. Of the three lots rated “A”, Site #2 is outside Benton City, Site #9 is in the center of the urban area, and Site #12 is located in the southeast corner of Kennewick near the edge of the urban area.
seCTIon 2 - exIsTIng ConDITIons

2018 Park and Ride Report Draft 10
Site ID Facility Capacity 2013 2014 2015 2016 20175 Year
Average5 Year
Average % Grade1 Stacy Street Transit Center - Prosser 20 9 13 12 11 12 11 57% B2 **Kiona Park & Ride - I-82 & SR 224 Interchange 30/49 30 29 27 20 25 26 75% A3 SR 240 & Route 10 on Hanford Site - Benton County 18 5 6 2 2 2 3 18% D4 Benton City Transit Center 37 20 21 22 14 13 18 49% B5 SR 240 & SR 224 - Richland 89 49 45 32 21 40 37 42% B6 West Richland Transit Center 154 63 67 71 68 59 66 43% B7 Stevens Drive & Spengler Road 350 102 95 93 96 116 100 29% C8 Knight Street Transit Center - Richland 33 4 2 3 8 14 6 19% D9 SR 240 & Columbia Park Trail 249 179 181 170 161 167 171 69% A
10 Columbia Park Trail & Tulip Lane 139 6 4 3 14 29 11 8% D11 Ed Frost Transit Center - Kennewick 135 59 55 56 49 48 53 39% C12 West 27th Avenue & South Union Street - Kennewick 50 40 36 29 22 30 31 63% A13 SR 395 & North Yelm Street - Kennewick 39 19 19 15 17 18 17 44% B14 TRAC Center, 6600 Burden Boulevard - Pasco 150 53 48 40 33 46 44 29% C15 North 22nd Avenue Transit Center - Pasco 50 21 22 20 6 15 16 33% C
Total Average Annual Quarterly Occupancy 1543/1562 657 640 594 540 632 613Percent Annual Average Quarterly Occupancy 43% 41% 38% 35% 41% 40% 40% B
Annual Average Quarterly Occupancy
Figure 2-3: Tri-Cities Metropolitan Area Park and Ride System Average Annual Occupancy
A 60% or greaterB 40% to 60%C 20% to 40%D Less than 20%
*
*
**Kiona Park & Ride - I-82 & SR 224 Interchange Park & Ride lot capacity increased by 19 slots from 30 to 49 in 2016.

2018 Park and Ride Report Draft 11
Site ID Facility Capacity 2013 2014 2015 2016 2017 5 Year Average1 Stacy Street Transit Center - Prosser 20 45% 64% 61% 55% 59% 57%2 Kiona Park & Ride - I-82 & SR 224 Interchange 30 100% 96% 88% 40% 50% 75%3 SR 240 & Route 10 on Hanford Site - Benton County 18 26% 31% 11% 11% 11% 18%4 Benton City Transit Center 37 55% 56% 58% 39% 36% 49%5 SR 240 & SR 224 - Richland 89 55% 51% 36% 26% 45% 42%6 West Richland Transit Center 154 41% 44% 46% 44% 38% 43%7 Stevens Drive & Spengler Road 350 29% 27% 27% 27% 33% 29%8 Knight Street Transit Center - Richland 33 13% 7% 9% 15% 42% 19%9 SR 240 & Columbia Park Trail 249 72% 72% 68% 64% 67% 69%
10 Columbia Park Trail & Tulip Lane 139 4% 3% 2% 10% 21% 8%11 Ed Frost Transit Center - Kennewick 135 44% 41% 41% 51% 36% 39%12 West 27th Avenue & South Union Street - Kennewick 50 79% 72% 58% 45% 60% 63%13 SR 395 & North Yelm Street - Kennewick 39 47% 47% 39% 42% 46% 44%14 TRAC Center, 6600 Burden Boulevard - Pasco 150 35% 32% 27% 18% 31% 29%15 North 22nd Avenue Transit Center - Pasco 50 41% 43% 39% 12% 30% 33%
Total Average Annual Occupancy 1543 43% 41% 38% 35% 41% 40%
A 60% or greaterB 40% to 60%C 20% to 40%D Less than 20%
Figure 2-4: Metropolitan Area Park and Ride System 5 Year Average Annual Quarterly Graded Occupancy 2013-2017
Annual Average Quarterly Occupancy Grade

Figure 2-5: Metropolitan Area Park and Ride System 5 Year Average Annual Quarterly Occupancy 2013-2017
!
!
!
!
!!
!
!
!!
!
!
!
!
!9
8
7
6 5
4
3
2
1
15
14
13
12
11
10
Sources: Esri, HERE, DeLorme, USGS, Intermap, INCREMENT P, NRCan, Esri Japan, METI, Esri China(Hong Kong), Esri Korea, Esri (Thailand), MapmyIndia, NGCC, © OpenStreetMap contributors, and theGIS User Community
0 105Miles
5 Year Annual QuarterlyOccupancy Grade Scale
! A - 60% or Greater
! B - 40% to 60%
! C - 20% to 40%
! D - Less than 20%

2018 Park and Ride Report Draft 13
Figure 2-4 on page 11 shows each facility’s annual occupancy “grade” and percent of occupancy over the five year period from 2013 until 2017. One of the facilities which had a five year average rating of “A” sustained the grade over the entire five years: #9 – SR 240 and Columbia Park Trail. The only other facility consistent over the five years was Lot #7 – Stevens and Spengler, which graded a “C” each year. All other lots flipped between two grades except #8 – Knight Street Transit Center and #11 – Ed Frost Transit Center, which varied from “B” through “D” over the time period. It’s also true that though three facilities averaged a “D” for the five years, none were rated a “D” every year. Finally, the metropolitan system itself averaged a “B” for the five years but received a “C” twice.
Figure 2-6 on page 14, Figure 2-7 on page 14, and Figure 2-8 on page 15 show additional parsing of the park and ride inventory data.
Figure 2-6 shows the annual system occupancy rate has been in the range of 40 percent for the years 2013 to 2017.
Figure 2-7, in greater detail, shows total system occupancy on a quarterly basis for the same period. The Metropolitan Area system was at its five-year low point in December 2016 and has rebounded to near its five-year high in December 2017.
Figure 2-8 shows data about individual lots in the park and ride system. As before, the numbers along the base of the graph correspond to those in Figure 2-3 on page 10. Figure 2-8 shows 2017 average quarterly occupancy, 2013-2017 average quarterly occupancy and capacity for each site in the system.

2018 Park and Ride Report Draft 14
Figure 2-7: Quarterly Park and Ride Lots Occupancy 2013-2017
Figure 2-6: Annual Percent of Park and Ride Lots Occupancy 2013-2017
0
100
200
300
400
500
600
700
800
Park and Ride Lots Occupancy 2013-2017 (Quarterly)
43% 41%38%
35%
41%
0%
5%
10%
15%
20%
25%
30%
35%
40%
45%
2013 2014 2015 2016 2017
Park and Ride Lots Occupancy 2013-2017

2018 Park and Ride Report Draft 15
Figure 2-8: Occpancy and Capacity by Lot, 2013-2017
0
50
100
150
200
250
300
350
400
1 2 3 4 5 6 7 8 9 10 11 12 13 14 15
Occupancy and Capacity by Lot, 2013-2017
2017 Average Quarterly Usage Capacity 2013-2017 Average Quarterly Usage

2018 Park and Ride Report Draft 16
Ben Franklin Transit Vanpool SystemThe development of both the Ben Franklin Transit vanpool system and the metropolitan area park and ride system are linked in time. The effectiveness of the BFT vanpool program directly influenced growth of the park and ride system in the Tri-Cities. Figure 2-9 showing data concerning vanpool mileage and ridership from 2012- 2016, is relevant to a discussion of park and ride lot occupancy.
Figure 2-6 on page 14 shows a gradual decline in system-wide park and ride lot occupancy between 2013 and 2016, then an uptick in 2017. Figure 2-9 shows a similar downward trend in vanpool usage between 2013 and 2016. Perhaps vanpool ridership in 2017 influenced that increase and data will reflect that fact.
0
200,000
400,000
600,000
800,000
1,000,000
1,200,000
1,400,000
-
500,000
1,000,000
1,500,000
2,000,000
2,500,000
3,000,000
3,500,000
4,000,000
4,500,000
5,000,000
2012 2013 2014 2015 2016
Ride
rs
Mile
s
BFT Vanpool Mileage and Ridership
Total Miles Total Ridership
Figure 2-9: BFT Vanpool Mileage and Ridership, 2012-2016

2018 Park and Ride Report Draft 17
Additional Capacity to be Added to SystemCurrently, capacity increases to the system are proposed. Ben Franklin Transit has submitted a Regional Mobility Grant (RMG) application to the Washington State Department of Transportation for construction of three park and ride lots. The facilities would be sited in: west Pasco in the area of the Interstate 182 interchange at Road 100; east Pasco in the area near Downtown Pasco; and the Queensgate area near Kennedy Road and Duportail Street in Richland.
Additionally, the City of Prosser is considering submission of an RMG application for an additional park and ride lot an upcoming grant cycle. .
Summary As of 2017, the Tri-Cities area park and ride system is comprised of 15 lots from the Stacy Street Transit Center in Prosser to the North 22nd Avenue Transit Center in Pasco. Figure 2-8 on page 15 shows graphically, and Figure 2-3 on page 10 and Figure 2-4 on page 11 show numerically the comparative efficiency of each facility.
The metropolitan system averaged 40 percent occupancy for the years 2013 through 2017 and was evaluated as a “B” grade in three years but received a “C” twice. Inventory data evaluated on a yearly basis show a decline in park and ride use from 2013 until 2016, while quarterly evaluation of the same data reveal some fluctuation between increases and decreases. Inventory data for each quarter of 2017 show an increase in use. This trend may or may not continue.
Section Three reports on a variety of data to determine whether park and ride lot demand might increase in the future and if it will, where the demand may occur.

2018 Park and Ride Report Draft 18
seCTIon 3 - AssessIng neeD, loCATIng DemAnD
Section Three references data from several sources to assess future need for park and ride facilities in the Tri-Cities and identify potential areas to locate new facilities. Output from the BFCG 2015 Regional Travel Demand Model provides metropolitan area demographic and transportation system-statistics for the years 2015-2040. American Community Survey data estimates journey to work percentages for carpool/vanpool and single occupant vehicle commuters in the Tri-Cities over the past six years. Additionally, Model output identifies areas of the Tri-Cities forecast to experience the largest population increases between 2015 and 2040 and Ben Franklin Transit data indicates where vanpools park overnight.
Assessing NeedReviews of some existing conditions and trends in the Tri-Cities and in Benton and Franklin counties give an idea of whether or not park and ride demand might be expected to increase in the future. 2015 Regional Travel Demand ModelThe 2015 Regional Travel Demand Model (Model) is a tool developed for Transition 2040, the 2017 Metropolitan and Regional Transportation Plan (Plan). The Model uses detailed population, housing and employment data coupled with complex software to determine future effects of change on the transportation system. Figure 3-1 through Figure 3-3 are based on data from the Model.
Figure 3-2 on page 19 shows growth and total percent change in three different demographic characteristics between 2015 and 2040 in the Tri-Cities metropolitan area. Figure 3-2 on page 19 graphs the same data. It is critical to note that this data was developed in cooperation with the planning departments of all metropolitan area jurisdictions.
Figure 3-3 on page 20 shows system-wide transportation data generated by the Model.
Figures 3-1 and 3-3 present metropolitan area-wide change in seven variables between 2015 and 2040. Six of those variables may be used to evaluate future demand on the transportation system. One variable, Total Miles, evaluates supply, or new road miles, for the transportation system.
All of the summary data identified as “% Change” in Figure 3-1 and Figure 3-3 will result in additional congestion and reinforce the need for increased emphasis on transportation demand management measures in the Tri-Cities. This includes vanpooling, carpooling, and park and ride facilities. As an example, population and employment are forecast to increase by 50 percent, and vehicle hours of travel by 67 percent, while new road mileage on the transportation network is predicted to increase by only one percent over the next 25 years.

2018 Park and Ride Report Draft 19
Scenario Year Total Population Housing Units EmploymentBase Year 246,054 92,885 91,823
2025 292,052 106,705 110,283 2035 337,174 119,992 127,616 2040 369,700 124,845 137,776
% Change 50% 34% 50%
Figure 3-1: Tri-Cities Metropolitan Area Demographic Data
-
50,000
100,000
150,000
200,000
250,000
300,000
350,000
400,000
Total Population Housing Units Employment
Metropolitan Area Planning Forecast
Base Year 2025 2035 2040
Figure 3-2: Tri-Cities Metropolitan Area Demographic Data Graph

2018 Park and Ride Report Draft 20
*VMT: Total Vehicle Distance of Travel VHT: Total Vehicle Hours of Travel Total Vehicle Flow: Total Vehicle Volumes on Network Links/Segments Total Miles: Total Length of Transportation Network per Scenario
Scenario VMT VHT Total Vehicle Flow Total MilesBase Year 6,119,755.20 222,400.71 32,483,990.44 1,352.66 2025 6,817,609.08 265,048.08 37,513,067.34 1,364.87 2035 7,630,203.90 332,051.81 42,158,124.10 1,366.23 2040 7,960,449.97 370,415.18 44,187,665.26 1,372.68 % Change 30% 67% 36% 1%
Figure 3-3: BFCG Regional Travel Demand Model Output Summary

2018 Park and Ride Report Draft 21
The American Community SurveyThe American Community Survey (ACS) is a national survey administered by the Census Bureau that uses continuous measurement methods. In this survey, a series of monthly samples produce annual estimates for the same small areas (census tracts and block groups) formerly surveyed through the decennial census long-form sample. Data from ACS five-year estimates are presented here.
Figure 3-4 through Figure 3-6 summarize ACS five-year estimates for the years 2007-2011 to 2012-2016 in Benton and Franklin Counties and the RTPO. The table sourced for this data used the term “carpool” for all multi-passenger single vehicle commute trips.
Figure 3-4 shows the estimated number of workers aged sixteen and over – the workforce in Benton and Franklin Counties. The data shows steady growth in both Counties over the time period.
Figure 3-5 shows the percent of workers who drove alone to work over the same time period as Figure 3-4. The percent of workers who drove alone increased over the six-year period, with the drivers who commuted alone in Franklin County increasing at a faster rate than Benton County.
Figure 3-6 shows the percent of workers who carpooled to work from 2011-2016. Carpool ridership decreased over the period, though Franklin County did experience an increase in 2016.
ACS data was collected, for percent of population who used transit for their journey to work, but tables not developed, Transit as a choice for a work trip was estimated at 2 percent of the workers in each county in during the 2007-2011 period. The total dropped to one percent for each subsequent period up to and including 2012-2016.
Like transit, data on bicycling and walking as a journey to work was gathered, but no tables developed. In both counties, each time period reported showed an estimate of less than .5 (one-half of one percent) of workers chose to commute to work by cycling, and less than 2.5 percent walked.
The data presented in the previous two sections describe conditions that will lead to growth in congestion. Although the Tri-Cities metropolitan area does not yet experience significant, prolonged periods of congestion, it is subject to delay in select areas during morning and evening peak hour travel times.
Population growth and an increase in work force size will likely lead to increased congestion. Single occupancy vehicle commuting as well as vehicle hours, vehicle miles traveled and work force size increase over time. If these trends and forecasts continue, demand for additional capacity and additional park and ride lots will increase.

2018 Park and Ride Report Draft 22
Implementation of transportation demand management solutions will help alleviate pressure on the road system. Commuters who carpool are likely candidates for use of park and ride facilities.
Source - S0802: Means Of Transportation To Work By Selected Characteristics- American Community Survey 5-Year Estimates, 2011-2016
020,00040,00060,00080,000
100,000120,000140,000
2011 2012 2013 2014 2015 2016Benton County 77,011 78,557 79,516 80,178 80,705 82,498Franklin County 30,514 32,245 33,373 34,919 35,819 36,851RTPO 107,525 110,802 112,889 115,097 116,524 119,349
Benton and Franklin County and RTPO Workforce - 2011-2016
Benton County Franklin County RTPO
Figure 3-4: Benton and Franklin Counties and RTPO Workforce - 2011-2016

2018 Park and Ride Report Draft 23
65
70
75
80
85
2011 2012 2013 2014 2015 2016Benton County 77 78 79 80 81 82Franklin County 72 74 76 79 82 81RTPO 76 77 78 80 81 81
Percent of Workers Who Drove Alone: 2011-2016
Benton County Franklin County RTPO
Figure 3-5: Percent of Workers Who Drove Alone: 2011-2016
0
5
10
15
20
2011 2012 2013 2014 2015 2016Benton County 14 13 12 11 11 11Franklin County 18 17 16 14 12 14RTPO 15 14 13 12 11 12
Percent of Workers Who Carpooled: 2011-2016
Benton County Franklin County RTPO
Figure 3-6: Percent of Workers Carpooled: 2011-2016
2018 Park and Ride Report Draft 24
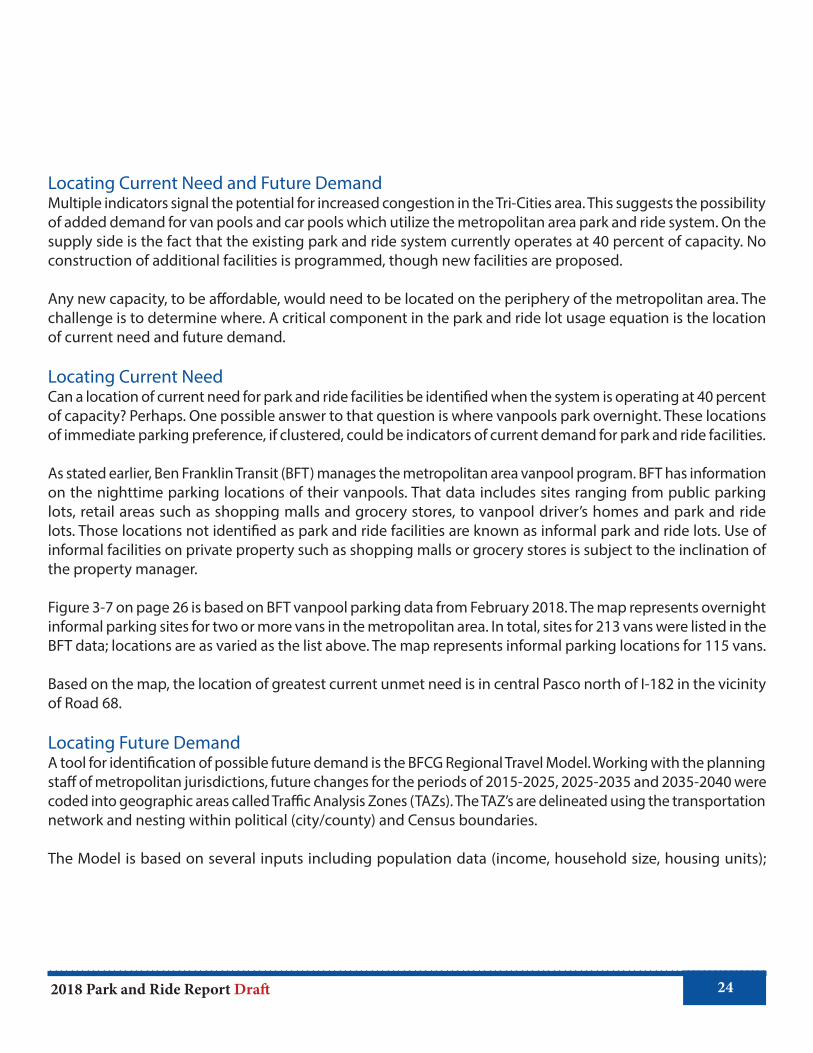
Locating Current Need and Future Demand Multiple indicators signal the potential for increased congestion in the Tri-Cities area. This suggests the possibility of added demand for van pools and car pools which utilize the metropolitan area park and ride system. On the supply side is the fact that the existing park and ride system currently operates at 40 percent of capacity. No construction of additional facilities is programmed, though new facilities are proposed.
Any new capacity, to be affordable, would need to be located on the periphery of the metropolitan area. The challenge is to determine where. A critical component in the park and ride lot usage equation is the location of current need and future demand.
Locating Current NeedCan a location of current need for park and ride facilities be identified when the system is operating at 40 percent of capacity? Perhaps. One possible answer to that question is where vanpools park overnight. These locations of immediate parking preference, if clustered, could be indicators of current demand for park and ride facilities.
As stated earlier, Ben Franklin Transit (BFT) manages the metropolitan area vanpool program. BFT has information on the nighttime parking locations of their vanpools. That data includes sites ranging from public parking lots, retail areas such as shopping malls and grocery stores, to vanpool driver’s homes and park and ride lots. Those locations not identified as park and ride facilities are known as informal park and ride lots. Use of informal facilities on private property such as shopping malls or grocery stores is subject to the inclination of the property manager.
Figure 3-7 on page 26 is based on BFT vanpool parking data from February 2018. The map represents overnight informal parking sites for two or more vans in the metropolitan area. In total, sites for 213 vans were listed in the BFT data; locations are as varied as the list above. The map represents informal parking locations for 115 vans. Based on the map, the location of greatest current unmet need is in central Pasco north of I-182 in the vicinity of Road 68.
Locating Future Demand A tool for identification of possible future demand is the BFCG Regional Travel Model. Working with the planning staff of metropolitan jurisdictions, future changes for the periods of 2015-2025, 2025-2035 and 2035-2040 were coded into geographic areas called Traffic Analysis Zones (TAZs). The TAZ’s are delineated using the transportation network and nesting within political (city/county) and Census boundaries.
The Model is based on several inputs including population data (income, household size, housing units);

2018 Park and Ride Report Draft 25
employment data (employment type, business type) and the transportation network (interstates, highways, major/minor arterials). The transportation network has three main attributes: number of lanes, capacity and speed.
Current housing and employment data are coded into each TAZ. Growth in, and location of, future population increases are forecast through housing units and household population. Increases in the magnitude, location and types of future employment are also estimated. The location of population growth can be used as an indicator of need for siting park and ride lots because many journey to work trips begin at home.
Additional population represents new trip origins, and significant new concentrations of population could signal potential park and ride need. Review of TAZs where those increases, and associated new journey-to-work trips are clustered could identify potential demand for new park and ride lots.
Figure 3-8 on page 27 and Figure 3-9 on page 28 show population increase and location by TAZ associated with different time horizons for the Model. Current undeveloped or sparsely populated areas are expected to absorb the majority of additional residential growth. Specifically, those areas are located near the fringes of developed metropolitan areas.
Figure 3-8 shows the magnitude and location of forecast population increases in the metropolitan area in the decade from 2015 to 2025. The largest population increases are projected to be in the Horn Rapids and South Badger areas of Richland, the Southridge area of Kennewick and Road 68 and Broadmoor areas of Pasco.
Figure 3-9 shows metropolitan area forecast population increase during the years 2025 to 2040. The areas of largest population increase mirror those in the earlier decade: the Horn Rapids and South Badger areas of Richland, the Southridge area of Kennewick and Road 68 and Broadmoor areas of Pasco.
Section Four presents guidelines that may be used for preliminary identification of park and ride facility location. It also includes general system-wide recommendations to enhance the efficiency of the metropolitan transportation system and discusses possible future location decisions for park and ride facilities in the metropolitan area.

2018 Park and Ride Report Draft 26
Figure 3-7: Select Vanpool Parking Sites
Sources: Esri, HERE, DeLorme, USGS, Intermap, INCREMENT P, NRCan, Esri Japan, METI, Esri China(Hong Kong), Esri Korea, Esri (Thailand), MapmyIndia, NGCC, © OpenStreetMap contributors, and theGIS User Community
±
0 105Miles
Vanpool Parking Non Park & Ride Number of Vans
2 - 3
4 - 6
7 - 13
14 - 20
21 - 28
¯

2018 Park and Ride Report Draft 27
2015 - 2025Population Growth
No Growth
1 - 250
251 - 500
501 - 1,000
1,001 - 2,000
2,001 +
Transportation Network
¯
Population growth allocated by Traffic Analysis Zone (TAZ)0 105 Miles
Population Forecast: 2015 - 2025Figure 3-8: Population Forecast 2015-2025

2018 Park and Ride Report Draft 28
2025 - 2040Population Growth
No Growth
1 - 250
251 - 500
501 - 1,000
1,001 - 2,000
2,001 +
Transportation Network
¯
Population growth allocated by Traffic Analysis Zone (TAZ)0 105 Miles
Population Forecast: 2025 - 2040Figure 3-9: Population Forecast 2025-2040
2018 Park and Ride Report Draft 29
seCTIon 4 - sITe seleCTIon guIDelInes & ReCommenDATIons
This section presents guidelines that may assist in preliminary identification of park and ride facility location. It also includes recommendations concerning the overall transportation system. Following, based on discussion in Section Three, it identifies general areas of potential future demand for the metropolitan area park and ride system.
Site Selection Guidelines This section presents guidelines for identification of park and ride locations.
The first step in the site selection process is to identify areas where a park and ride may be feasible. This is largely a common-sense approach, based on existing conditions, such as:
• Informal park-and-ride activity • Proximity to a principal arterial, highway or interstate interchange. • Density of residential areas • Traffic volumes, both average daily traffic and peak hour. • Availability of property and capacity, both current and future.• Facilities are generally located upstream of traffic congested areas near a commuter route.
Proximity to Commuter Corridors The location of the facility relative to a “main” arterial providing access to an ultimate destination may affect usage to some degree.
Surrounding Land UsesLand uses surrounding potential park and ride lots can have beneficial or adverse effects on its utilization. Close proximity to retail sales outlets, such as shopping centers, grocery or convenience stores and service stations, can have a positive effect on utilization of park and ride lots. Location of park and ride lots adjacent to stores, particularly grocery stores or gas stations, may increase their retail sales.
Industrial or low-income areas where activity levels may be low while cars are parked at a park and ride lot, may have a detrimental effect on lot utilization. Security needs for park and ride lots amid these land uses, whether actual or perceived, will determine the acceptability of the parking facility by the commuting public.
It seems most practical to site parking facilities in areas with a secure setting and nearby residential or commercial activities.
Traffic Volumes/Traffic Flow/Access Direct access on a highly traveled arterial, rather than to a side street, can impede the flow of traffic. Reduced

2018 Park and Ride Report Draft 30
travel speeds increase the accident potential and reduce desire to use the lot. A preferred site would have close proximity to a commuter arterial; however, access would be via a secondary street and an existing intersection.
General System Recommendations1. Vigorously promote vanpools and carpools as an alternative to driving alone. Ben Franklin Transit, the
Washington State Department of Transportation (WSDOT) and the Benton-Franklin Council of Governments should engage in an ongoing advertising campaign promoting the advantages of vanpooling and carpooling.
2. Assure bicycle and pedestrian access to park and ride facilities. Assure secure parking for bicycles is available at park and ride facilities.
3. Encourage completion of connected bicycle and pedestrian systems throughout the Tri-Cities. Funding is available through state and federal agencies to complete development of active transportation systems in the metropolitan area. Biking and walking are low cost and reliable alternatives to single occupant vehicle travel. However, absent a convenient, connected system these modes will not be utilized to their fullest potential.
4. The Council of Governments, through its position as lead agency for the Metropolitan Planning Organization (MPO), should work with its membership and the Tri-Cities at large to plan for and implement additional Transportation Demand Management measures in the Tri-Cities.
5. The BFCG and MPO member jurisdictions should work with WSDOT to identify whether implementation of Intelligent Transportation System solutions are viable and reasonable tools to help address congestion in the Tri-Cities.
Park and Ride Lot Phasing RecommendationsShort-Range Recommendations
1. Road 68/Broadmoor Area – Pasco: These two adjacent areas show significant population increase in both 2015-2025 and 2025-2040 time periods as well as being the location of the greatest number of BFT vanpool vans using informal park and ride lots. This suggests a near term need for at least one new park and ride facility in this area.
2. Southridge Area – Kennewick: According to Model data, this area shows substantial growth in both periods under discussion. The estimated growth in the period from 2015-2025 is greater than other areas, while growth in the second period is comparable to others.

2018 Park and Ride Report Draft 31
Mid-Range Recommendations:1. Horn Rapids Area – Richland: This area shows considerable predicted growth in the period from 2015
to 2025 and even more in the period from 2025 to 2040. Additionally, the area is comparatively isolated from the rest of Richland and residents have no alternative options for park and ride lots.
2. South Badger Area - Richland: Like the Horn Rapids area, the South Badger area shows notable forecast population increase in the period from 2015-2025 but even greater increase in the period of 2025-2040. Unlike Horn Rapids, residents of the South Badger area have access to existing park and ride facilities in the metropolitan area.
Long-Range Recommendations1. Northeast Pasco - Currently, twenty vanpools travel from the Tri-Cities to Coyote Ridge Correctional
Facility in Connell. Nine vanpool vans park at the Pasco Wal-Mart. The number of current and potential vanpool users traveling between the Tri-Cities and Connell indicates the need for a park and ride lot in northeast Pasco.
ConclusionThe Tri-Cities metropolitan area contains a mature, well distributed park and ride system. The system is notably differentiated from most in the United States by the fact that its target market is vanpools and carpools rather than transit commuters.
The current system is underutilized. To realize the benefits of existing capacity, Ben Franklin Transit, WSDOT and BFCG in cooperation with cities, Chambers of Commerce, and local media should work to increase public awareness of vanpools and carpools as an alternative to single occupant vehicle travel.
Population and employment forecasts, coupled with trend data generated by the Regional Travel Model indicate the likelihood of increased traffic and congestion on the metropolitan area street system. This report has suggested additional park and ride locations to help manage those volumes.
Vanpools, carpools and park and ride facilities are valuable components the Tri-Cities metropolitan area Transportation Demand Management tool kit. Time will tell if these tools are used wisely and effectively in the Tri-Cities.

2018 Park and Ride Report Draft 32
AppenDIx
From: Bill Barlow Sent: Tuesday, July 24, 2018 7:28 AM To: Geoff Wagner; Len Pavelka Cc: Tanna Dole Subject: RE: 2018 Draft Tri-Cities Metropolitan Area Park & Ride Report The only comment I had on the P&R Report addresses BFT’s proposed P&R lot location in west Pasco. Here is text from our Draft 2018-2023 Transit Development Plan. Similar text is in the BFT Regional Mobility Grant application. : Multimodal Transit Hub - The West Pasco Multimodal Transit Hub will help to address projected peak hour overcapacity of the I-182 Columbia River Bridge crossing (see Figure 19 – note Road 100 P&R site proximity to I-182 Bridge). BFCOG 2040 analysis predicts the I-182 peak hour bridge traffic will reach Level of Service D, even after proposed year 2040 road improvements have been completed. BFCOG has identified Road 68/Broadmoor as a short-range P&R solution, based on 2040 density and current vanpool formation trends. However, land near Road 100 in Pasco is more affordable and could be purchased for occupancy of a larger 300 commuter parking stall facility, which would accommodate at least 20 new vanpools. BFT will work with the Pasco City Planning Department, during the Comprehensive Plan review period, to locate the ideal piece of property that could fully utilize a large capacity commuter parking lot.
Reply: The BFCG endorsed Ben Franklin Transit’s Regional Mobility Grant application and is looking forward to additions to the Tri-Cities park and ride system. We believe that on a regional scale, the proposed location of BFT’s West Pasco Multimodal Transit Hub is equivalent to the location suggested in this
Comments and Responses

2018 Park and Ride Report Draft 33
From: Bill Barlow Sent: Tuesday, July 24, 2018 7:28 AM To: Geoff Wagner; Len Pavelka Cc: Tanna Dole Subject: RE: 2018 Draft Tri-Cities Metropolitan Area Park & Ride Report The only comment I had on the P&R Report addresses BFT’s proposed P&R lot location in west Pasco. Here is text from our Draft 2018-2023 Transit Development Plan. Similar text is in the BFT Regional Mobility Grant application. : Multimodal Transit Hub - The West Pasco Multimodal Transit Hub will help to address projected peak hour overcapacity of the I-182 Columbia River Bridge crossing (see Figure 19 – note Road 100 P&R site proximity to I-182 Bridge). BFCOG 2040 analysis predicts the I-182 peak hour bridge traffic will reach Level of Service D, even after proposed year 2040 road improvements have been completed. BFCOG has identified Road 68/Broadmoor as a short-range P&R solution, based on 2040 density and current vanpool formation trends. However, land near Road 100 in Pasco is more affordable and could be purchased for occupancy of a larger 300 commuter parking stall facility, which would accommodate at least 20 new vanpools. BFT will work with the Pasco City Planning Department, during the Comprehensive Plan review period, to locate the ideal piece of property that could fully utilize a large capacity commuter parking lot.
Reply: The BFCG endorsed Ben Franklin Transit’s Regional Mobility Grant application and is looking forward to additions to the Tri-Cities park and ride system. We believe that on a regional scale, the proposed location of BFT’s West Pasco Multimodal Transit Hub is equivalent to the location suggested in this
The BFCG endorsed Ben Franklin Transit’s Regional Mobility Grant application and is looking forward to additions to the Tri-Cities park and ride system. We believe that on a regional scale, the proposed location of BFT’s West Pasco Multimodal Transit Hub is equivalent to the location suggested in this report. It is grounded in a detailed consideration of current land use in the area, a factor which was not a component of our analysis.