draft 2018-48 long-term infrastructure strategy plan... · draft 2018-48 long-term infrastructure...
TRANSCRIPT

Draft 2018-48 Long-term
Infrastructure Strategy
Hamilton City Council

DRAFT 2018-48 LONG-TERM INFRASTRUCTURE STRATEGY
1
Contents
KEY TERMS 2
ABOUT THE STRATEGY 3
COMMUNITY OUTCOMES AND INFRASTRUCTURE CHALLENGES 4
OUR INFRASTRUCTURE CHALLENGES AND FOCUS AREAS 8
EXTERNAL FACTORS 24
USING PARTNERSHIP OPPORTUNITIES 27
THE COUNCIL’S PLAN 29
Water 35
Wastewater 41
Stormwater 47
Transport 53
Parks and Green Spaces 59
Community and Event Facilities 65
GENERAL ASSUMPTIONS 72
APPENDIX 1 - ASSUMPTIONS FOR USEFUL LIVES OF ASSETS 74
APPENDIX 2 - ASSUMPTIONS FOR LEVELS OF SERVICE 81
APPENDIX 3 - ASSUMPTIONS FOR RENEWAL OF ASSETS 86
APPENDIX 4 - ASSUMPTIONS FOR GROWTH IN DEMAND 92
APPENDIX 5 – IDENTIFYING SIGNIFICANT CAPITAL EXPENDITURE DECISIONS 95
APPENDIX 6 – DATA RELIABILITY AND FINANCIAL CONFIDENCE 96

HAMILTON CITY COUNCIL
Key terms
Activity management plan (AMP)
A long-term plan which is a written representation of the
intended asset management programmes over the whole life
the assets to provide a specific level of service in the most
cost-effective manner.
Service level
The amount or quality of a service or activity that is provided
to the community. Also referred to as ‘level of service’.
Renewal
A replacement of an existing asset at the end of its useful life.
Core network infrastructure
Infrastructure that relates to the water, wastewater,
stormwater or transportation networks.
Financial strategy
The Council’s agreed long-term approach to financial
management as contained in the 10-Year Plan.
Strategic infrastructure
Significant infrastructure that is required to allow the
development of growth cells or ongoing development of
within the city. Is generally provided by the Council.
Local infrastructure
Infrastructure that is required to provide services within a
development, generally provided by developers. This can be
either public infrastructure vested in the Council or private
infrastructure.
Community infrastructure Infrastructure and buildings required for provision of
community services such as aquatic facilities, playgrounds and
libraries.
Public infrastructure
Infrastructure that is owned and managed by the Council or
another public entity. Public infrastructure may have been
constructed by developers and vested in the Council.
Private infrastructure
Infrastructure that is not owned or managed by the Council or
another public entity.
HIF
Housing Infrastructure Fund is a central government backed
funding arrangement that provides 10-year interest free
funding for specified growth projects.

DRAFT 2018-48 LONG-TERM INFRASTRUCTURE STRATEGY
3
About the Strategy
The purpose of the 30-year Infrastructure Strategy (the Strategy) is to identify significant
infrastructure challenges for Hamilton City Council (the Council) over the next 30 years, and to
identify the principal options for managing those challenges and the implications of those options.
Providing and maintaining the Council’s infrastructure requires good asset management practices
and strategic thinking, and this Strategy assists the Council in taking a long-term view of Hamilton’s
infrastructure needs. The Strategy is an indicative estimate of the Council’s future infrastructure
needs. It is not a budget and by itself does not commit the Council to any future project, cost or
timing. It is a statement of current assumptions and thinking on what infrastructure will be required
to address the major issues facing the City over the next 30 years.
The Strategy outlines the Council’s approach to managing and investing in the City’s infrastructure
including what will be required, when, and how much it will cost across the following infrastructure
categories:
• Water
• Wastewater
• Stormwater
• Transport
• Parks and Green spaces
• Community and Events Facilties
The Strategy categories draws together information from 12 infrastructure related Activity
Management Plans (AMPs) of the Council.
Figure 1: Infrastructure Strategy Categories

HAMILTON CITY COUNCIL
4
Community outcomes and
Infrastructure challenges
Community Outcomes are the outcomes that the Council aims to achieve in meeting the current and
future needs of communities for good-quality local infrastructure, local public services, and
performance of regulatory functions.
The Outcomes have a role to play in strategic direction setting and help in prioritising improvements
to activities and services by the Council.
The Council has identified three community outcomes, and each have implications for the provision
and maintenance of infrastructure for the City.
Figure 2: Community Outcomes
To deliver the Community Outcomes, the Council needs to focus its infrastructure investments
wisely.
The following three challenges and six focus areas are the most important infrastructure matters for
the Council to address.
A great river city
•Our city embraces its natural environment and has green spaces, features and community facilities that make it a great place to live, work, play and visit.
A city that embraces growth
•Our city has infrastructure that meets our current demands, supports growth and helps build a strong economy.
A council that is best in business
•Our council is customer focussed, financially sustainable and has the best people delivering the best outcomes for the city.

DRAFT 2018-48 LONG-TERM INFRASTRUCTURE STRATEGY
5
Figure 3: Infrastructure Challenges and Focus Areas
The above diagram provides the structure for the discussion in this Strategy.
• Each challenge and focus area is discussed in the following section of this Strategy. The
discussion identifies significant capital decisions that are anticipated over the next 30 years
and options that will need to be considered as part of these decisions.
• The key external factors that may impact infrastructure investment opportunities and
timing are discussed in the External Factors section.
• Examples of types of partnerships and the challenges and opportunities that the Council
faces using them for delivery of infrastructure is discussed in the Using Partnership
Opportunities section.

HAMILTON CITY COUNCIL
6
Significant capital
expenditure decisions
required
There are significant decisions on capital expenditure anticipated over the next 30 years to address
the above challenges and focus areas. The decisions are represented on the timeline in the next
page.

DRAFT 2018-48 LONG-TERM INFRASTRUCTURE STRATEGY
7
Figure 4: Significant Capital Expenditure Decisions

HAMILTON CITY COUNCIL
8
Our infrastructure challenges
and focus areas
Challenge 1: Looking after our assets
The Council actively looks after our existing assets through operations, maintenance and renewals.
To ensure that this is done well the Council has the following three focus areas:
• Delivering the renewals programme - Assets are renewed (replaced) when they reach the
end of their useful life to ensure that the levels of service are maintained,
• Responding to increased standards - Assets are maintained and upgraded to ensure that
we meet all relevant standards and resource consent conditions,
• Improving critical infrastructure resilience - Assets are managed to ensure that the
network is resilient and can be relied on to deliver the required service.
Focus Area: Delivering the renewals programme
Hamilton is a relatively young city as much of its development has taken place in the last 50 years.
This means that its infrastructure is aging but still comparatively young when compared to other
large New Zealand cities. While there is a still a lot of life remaining in much of the public
infrastructure, there is always a need to keep maintaining and replacing infrastructure that has short
lives.
Determining the optimal time that assets should be renewed is often complex. Some assets are
visible and can be observed daily by staff and or contractors. Other assets may be underground
where it is difficult to forecast when they may fail. The Council can limit unplanned failure of assets
by renewing assets earlier, but for many assets this is not necessary or prudent. Renewing some
assets after they fail can be more expensive and therefore renewal on failure is not necessarily
regarded as good practice. An unplanned failure may have a significant impact on the end user if the
service provided by the asset is interrupted – particularly for critical assets.
The Council uses updated condition assessment data with relevant asset life expectancy rates to
forecast an asset’s likely end of life and to forecast future renewal requirements. Renewals
forecasts have been prepared with critical assets in mind to ensure that assets that are most critical
for the delivery of the service or pose the greatest risk through an unplanned failure are renewed at
the appropriate time.
It is usual that not all the potential works forecast can be afforded within available funding. The
budgeting process prioritises expenditure on maintaining and renewing existing assets before
creating new ones. This focus to look after existing assets is reflected in the following financial
principle that the Council used in the development of the 2018-28 10-Year Plan:
The Council will look after existing assets i.e. the Council will fund maintenance and renewals as
per approved Activity Management Plans.
The initial renewals forecasts that were produced using information from the Activity Management
Plans ranged from $45m per annum to $60m per annum over the first 10 years. To aid in limiting
spikes in financial requirements and to assist in the delivery of the renewals, the programme has

DRAFT 2018-48 LONG-TERM INFRASTRUCTURE STRATEGY
9
been ‘smoothed’ over the 10 years to approximately $49m per year. Any risks and implications of
this smoothing were considered during this process and minimised. The Council has fully funded the
renewals programme in the budget for the Draft 2018-28 10-Year Plan.
For the three-year period from 2014 to 2017 the annual spend on renewals was $31.3m (budget
$33.5m). As the assets have aged and our asset data has improved, the required renewal works has
increased significantly for the next 30 years.
From 2018/19 to 2027/28 the average renewals requirement is $49m (uninflated) and this increases
slightly to an average of $55m (uninflated) from 2028/29 to 2048/49. The increase from 2028/29 is
due to the large number of stormwater pipes that are due to come to the end of their useful life at
this stage.
Figure 5: Forecast renewals – 30 Years
Forecasts in graph are gross and inflated
SIGNIFICANT CAPITAL EXPENDITURE DECISION:
RRRREPLACING WORN OUT ASEPLACING WORN OUT ASEPLACING WORN OUT ASEPLACING WORN OUT ASSETSSETSSETSSETS
At each 10-Year Plan, the Council needs to confirm the level of funding it will provide for the renewal
of its existing assets. Through the 2018-28 10-Year Plan process, the Council decided to fund the
renewal of assets to the level recommended by the Council staff.
Key options for decisions include:
• Whether there are assets that the Council chooses not to renew in the future
• The degree to which the forecasted renewal requirements are funded through each 10-Year
Plan.
$0m
$20m
$40m
$60m
$80m
$100m
$120m
$140m
Actual / Projected 10-Year Plan budget Annual indicative estimates
Decision:
Every 3 years

HAMILTON CITY COUNCIL
10
Key Relevant Projects and Programmes: Project/Programme Type Y1-3 Y4-10 Y11-20* Y-21-30*
Community Renewals R $27m $75m $160m $190m
Corporate Renewals R $21m $43m $45m $55m
H3 Renewals R $11m $27m $80m $80m
Transportation Renewals R $49m $118m $320m $350m
Water, Wastewater, Stormwater and Solid
waste Renewals
R $44m $151m $230m $420m
*Financial estimates beyond year 10 in these table have been rounded up to nearest $5m for values up to $50m and nearest $10m for
values over $50m. This is reflect the uncertainty of long-term financial estimates.
Focus Area: Responding to increasing standards
Recent experience and future forecasts indicate that costs associated with complying with required
standards are sizeable and significantly more than inflation. This is particularly the case in relation
to:
• Increasing seismic performance standards for structures and buildings
• Renewal of resource consents and compliance with Healthy Rivers
• Drinking water standards
There are both capital and operating impacts from increasing compliance. The budget forecasts in
the 10 -Year Plan and timing and scale of significant decisions in this Strategy have been built on
current legislation and known changes to standards that are expected. There has been no allowance
for standards that will change where there is currently no indication.
Seismic Performance
In recent years, Hamilton has been reclassified as being in a seismic risk zone of medium (increased
from low). As we better understand seismic risk and asset condition, we may need to invest more in
our existing assets to bring them up to an acceptable standard.
In many cases the Council’s buildings are not at modern standards. While the condition of these
building assets may be assessed as being in good condition, the configuration or nature of the assets
are often considered inadequate for delivery of the desired service levels to the community.
The Council has determined its preferred approach to seismic performance of its buildings through
adoption of a policy in 2017. The policy outlines the pace of assessments that will be undertaken on
the Council owned facilities. It also sets out a process for managing buildings when they are
identified through assessments as being earth-quake prone (that is less than 34% of the New
Building Standard). Funding provision has been made in the 10-year plan to improve seismic
performance of the following buildings / facilities:
• Water Treatment Plant
• Wastewater Treatment Plant
• Artspost
• Waterworld Aquatic Facility
The Council also considers the seismic performance of key large infrastructure for the City. Focus to
date has been on the following assets:
• Six bridges in the City were identified in a high-level screening as requiring a detailed
seismic assessment. These assessments are being progressed. All identified seismic
resilience deficiencies will be addressed in the first 3 years of the 10-Year Plan.
• The City’s reservoirs have been assessed and a programme seismic strengthening work has
been included as part of the 2018-28 10-Year Plan.

DRAFT 2018-48 LONG-TERM INFRASTRUCTURE STRATEGY
11
SIGNIFICANT CAPITAL EXPENDITURE DECISION:
SSSSEISMIC STRENGTHENINGEISMIC STRENGTHENINGEISMIC STRENGTHENINGEISMIC STRENGTHENING WORKWORKWORKWORK
The Council will gain more information about the likely seismic performance of infrastructure and
buildings as more assessments are undertaken over coming years. At that point, the Council will
need to make decisions on the pace and extent of upgrade if required from these assessment works.
Budget provision will need to be made at the relevant 10-Year Plan or Annual Plan funding rounds.
Key options for decisions include:
• Whether there are assets that the Council chooses not to retain and therefore won’t require
seismic strengthening.
• The pace at which any upgrades are required and planned for.
Key Relevant Projects and Programmes:
Project/Programme Type Y1-3 Y4-10 Y11-20 Y-21-30
ArtsPost Seismic Strengthening LOS $6m
Bridge Seismic Strengthening LOS $2m
Wastewater Treatment Plant Seismic
Strengthening
LOS $1m $6m
Water Reservoir and Treatment Plan Seismic
Strengthening
LOS $1m $6m
Resource Consents
There are many resource consents in place to allow the Council to carry out current and future
activities. Most of the consents will need to be renewed before the expiry dates to ensure ongoing
compliance with the relevant regulatory requirements (particularly the operational Waikato
Regional Plan). The estimated costs associated with the renewal of the resource consents has been
included as part of the forecasted renewals where this has been possible. However, in the case of
the water take and wastewater discharge it is expected that there will be works needed at the
treatment plant and associated assets to ensure that the Council continues to comply with
increasing environmental standards.
Resource consents for discharge of treated wastewater, discharge to air and use of river outfall
structure are due for renewal in 2027. Renewal of these consents may be subject to new, and more
stringent regulatory measures that will require careful planning well ahead of time.
SIGNIFICANT CAPITAL EXPENDITURE DECISION:
WWWWORKS FOR THE ORKS FOR THE ORKS FOR THE ORKS FOR THE NEW NEW NEW NEW WASTEWATER CONSENT RWASTEWATER CONSENT RWASTEWATER CONSENT RWASTEWATER CONSENT RENEWAL IN ENEWAL IN ENEWAL IN ENEWAL IN 2027202720272027
Like the renewal of the water take consent, the Council will need to renew its consent for
discharging treated wastewater into the Waikato River by 2027. The extent of the works required
following consent renewal to meet any new compliance regime is currently unknown. It is
recommended that a strategy be determined for the approach to be taken for the consent renewal.
This will need to be done within as soon as practicable.
Decision:
2018
Decision:
2019
HAMILTON CITY COUNCIL
12
Key options for decisions include:
• Operating within current consent conditions until consent renewal required in 2027 and
then start making improvements once conditions of the new condition are known.
• Start making investments and improvements ahead of consent renewal date and in
anticipation of new conditions.
Key Relevant Projects and Programmes: Project/Programme Type Y1-3 Y4-10 Y11-20 Y-21-30
Wastewater Treatment Plant Compliance LOS $5m $14m $25m $35m
Wastewater Treatment Plant Upgrade Growth $19m $8m $80m $90m
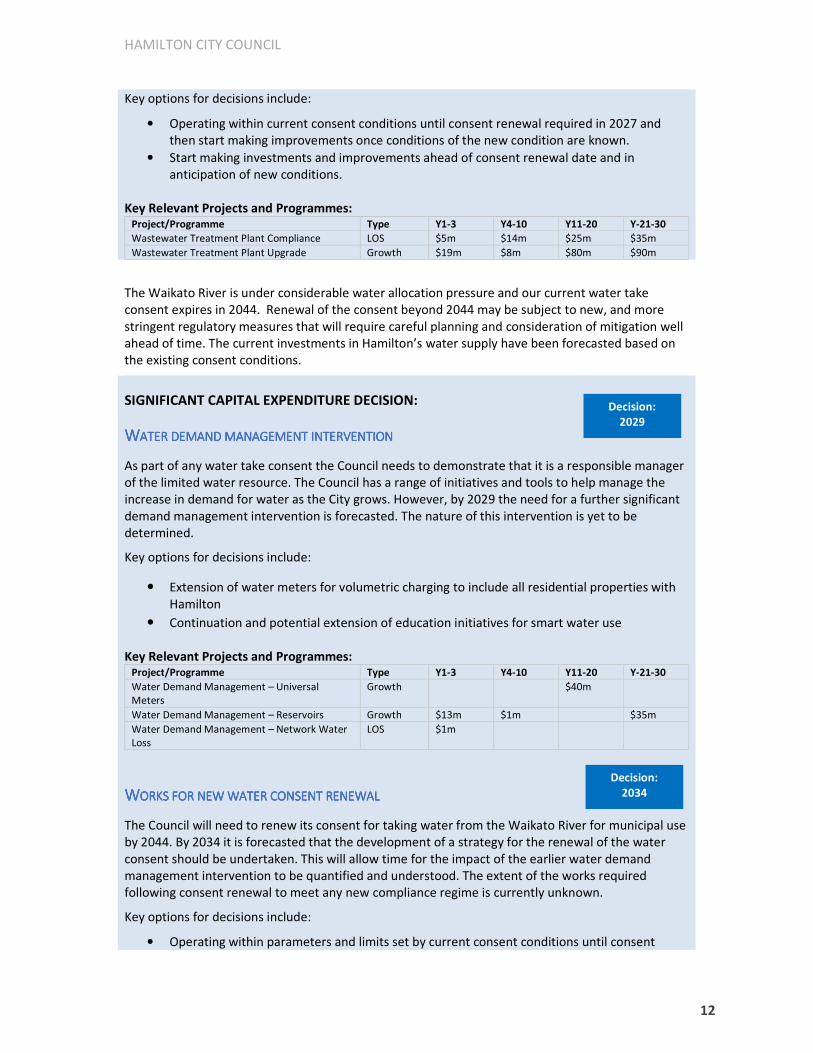
The Waikato River is under considerable water allocation pressure and our current water take
consent expires in 2044. Renewal of the consent beyond 2044 may be subject to new, and more
stringent regulatory measures that will require careful planning and consideration of mitigation well
ahead of time. The current investments in Hamilton’s water supply have been forecasted based on
the existing consent conditions.
SIGNIFICANT CAPITAL EXPENDITURE DECISION:
WWWWATER DEMAND MANAGEMEATER DEMAND MANAGEMEATER DEMAND MANAGEMEATER DEMAND MANAGEMENT INTERVENTION NT INTERVENTION NT INTERVENTION NT INTERVENTION
As part of any water take consent the Council needs to demonstrate that it is a responsible manager
of the limited water resource. The Council has a range of initiatives and tools to help manage the
increase in demand for water as the City grows. However, by 2029 the need for a further significant
demand management intervention is forecasted. The nature of this intervention is yet to be
determined.
Key options for decisions include:
• Extension of water meters for volumetric charging to include all residential properties with
Hamilton
• Continuation and potential extension of education initiatives for smart water use
Key Relevant Projects and Programmes: Project/Programme Type Y1-3 Y4-10 Y11-20 Y-21-30
Water Demand Management – Universal
Meters
Growth $40m
Water Demand Management – Reservoirs Growth $13m $1m $35m
Water Demand Management – Network Water
Loss
LOS $1m
WWWWORKS FOR ORKS FOR ORKS FOR ORKS FOR NEW NEW NEW NEW WATER CONSENT RENEWAWATER CONSENT RENEWAWATER CONSENT RENEWAWATER CONSENT RENEWALLLL
The Council will need to renew its consent for taking water from the Waikato River for municipal use
by 2044. By 2034 it is forecasted that the development of a strategy for the renewal of the water
consent should be undertaken. This will allow time for the impact of the earlier water demand
management intervention to be quantified and understood. The extent of the works required
following consent renewal to meet any new compliance regime is currently unknown.
Key options for decisions include:
• Operating within parameters and limits set by current consent conditions until consent
Decision:
2029
Decision:
2034

DRAFT 2018-48 LONG-TERM INFRASTRUCTURE STRATEGY
13
renewal required in 2044
• Start making investments and improvements ahead of consent renewal date and in
anticipation of new conditions.
Key Relevant Projects and Programmes: Project/Programme Type Y1-3 Y4-10 Y11-20 Y-21-30
Water Treatment Plant Compliance LOS $3m $4m $10m $15m
Drinking Water Standards
Hamilton’s water supply is fully compliant with the current New Zealand Drinking Water Standards,
the Health Act and has a comprehensive approved and audited Water Safety Plan in place that
identifies potential risk and details how they are managed.
The Council’s water supply has been assess as having a Ministry of Health ‘Aa’ grading which
indicates our water supply, treatment process and distribution system is managed to ensure there is
an extremely low risk of contamination occurring to the drinking water the Council provides the
Hamilton community.
Following the Havelock North water supply contamination event that occurred in August 2016, the
Government initiated an Inquiry. Two Inquiry reports have been released which have identified
recommended improvements to the way in which drinking water supplies are managed nationally.
These will likely lead to increased Drinking Water Standards, particularly in relation to bore water
compliance criteria.
As Hamilton already provides appropriate and effective treatment it not anticipated that the current
treatment processes will require immediate improvement. However, it is likely that there will be a
need for new training and competency requirements for Council staff.
Staff are continuing to monitor Government response to understand any potential implications
resulting from this Inquiry and any future changes to standards.
Focus Area: Improving critical infrastructure resilience
It is important that in an unexpected event the City can get critical infrastructure back up and
running quickly to ensure that the public health and safety is maintained.
Studies1 have shown that the most likely hazards that pose the greatest risk in terms of potential loss
of human life, social disruption, economic cost and infrastructure damage for Hamilton are:
• Earthquake
• Severe wind
• Drought
Currently, we are dependent on the Waikato River as our single source of water and draw from a
single treatment plant. If the Waikato River was not available for use, there are very limited options
for supply of water to the City. Being able to access an alternative water source and a second water
treatment plant is considered the best way to improve resiliency of the water supply for the City in
the long term.
1 An overview of natural hazards for the Hamilton City Council – Waikato Regional Council Technical Report
2014/04, August 2015
HAMILTON CITY COUNCIL
14
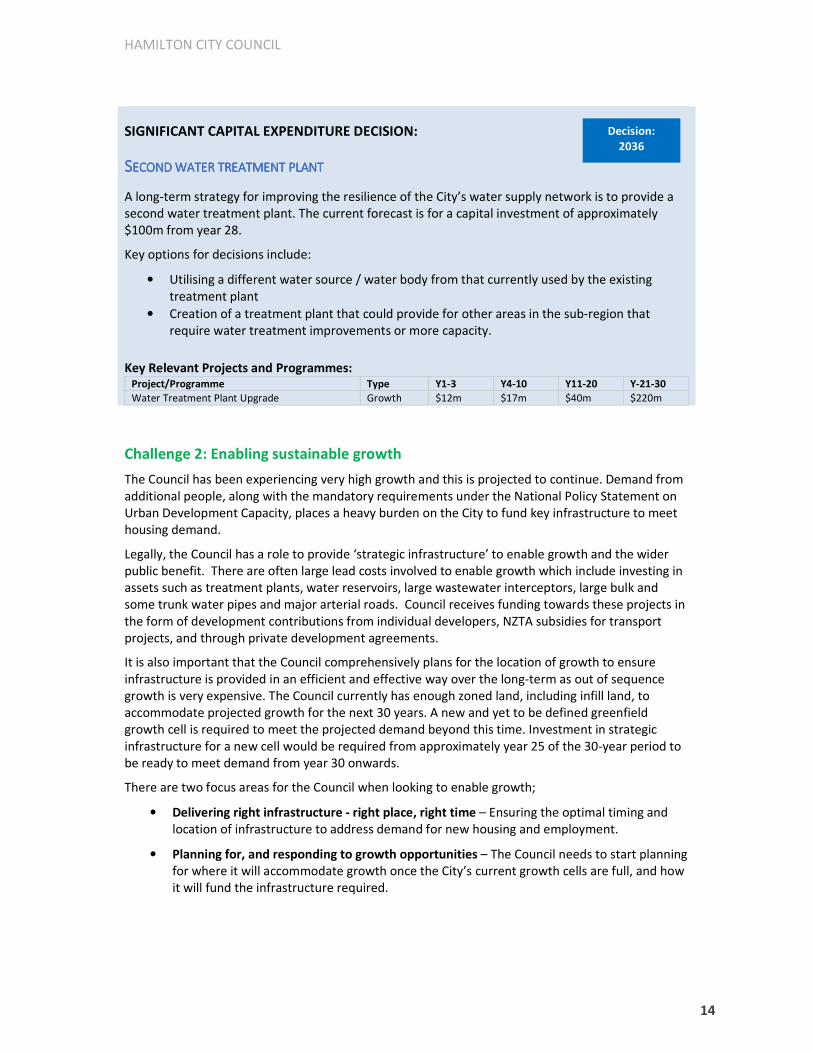
SIGNIFICANT CAPITAL EXPENDITURE DECISION:
SSSSECOND WATER TREATMENECOND WATER TREATMENECOND WATER TREATMENECOND WATER TREATMENT PLANTT PLANTT PLANTT PLANT
A long-term strategy for improving the resilience of the City’s water supply network is to provide a
second water treatment plant. The current forecast is for a capital investment of approximately
$100m from year 28.
Key options for decisions include:
• Utilising a different water source / water body from that currently used by the existing
treatment plant
• Creation of a treatment plant that could provide for other areas in the sub-region that
require water treatment improvements or more capacity.
Key Relevant Projects and Programmes: Project/Programme Type Y1-3 Y4-10 Y11-20 Y-21-30
Water Treatment Plant Upgrade Growth $12m $17m $40m $220m
Challenge 2: Enabling sustainable growth
The Council has been experiencing very high growth and this is projected to continue. Demand from
additional people, along with the mandatory requirements under the National Policy Statement on
Urban Development Capacity, places a heavy burden on the City to fund key infrastructure to meet
housing demand.
Legally, the Council has a role to provide ‘strategic infrastructure’ to enable growth and the wider
public benefit. There are often large lead costs involved to enable growth which include investing in
assets such as treatment plants, water reservoirs, large wastewater interceptors, large bulk and
some trunk water pipes and major arterial roads. Council receives funding towards these projects in
the form of development contributions from individual developers, NZTA subsidies for transport
projects, and through private development agreements.
It is also important that the Council comprehensively plans for the location of growth to ensure
infrastructure is provided in an efficient and effective way over the long-term as out of sequence
growth is very expensive. The Council currently has enough zoned land, including infill land, to
accommodate projected growth for the next 30 years. A new and yet to be defined greenfield
growth cell is required to meet the projected demand beyond this time. Investment in strategic
infrastructure for a new cell would be required from approximately year 25 of the 30-year period to
be ready to meet demand from year 30 onwards.
There are two focus areas for the Council when looking to enable growth;
• Delivering right infrastructure - right place, right time – Ensuring the optimal timing and
location of infrastructure to address demand for new housing and employment.
• Planning for, and responding to growth opportunities – The Council needs to start planning
for where it will accommodate growth once the City’s current growth cells are full, and how
it will fund the infrastructure required.
Decision:
2036

DRAFT 2018-48 LONG-TERM INFRASTRUCTURE STRATEGY
15
Focus Area: Delivering right infrastructure – right place, right time
One of the Council’s main roles is to determine the optimal timing and location of infrastructure to
enable Hamilton to grow. This means investing in efficient and effective infrastructure solutions at
the right time.
In the 2015-25 10-Year Plan, the Council pushed out some of the biggest strategic infrastructure
investments to beyond the 10-Year Plan horizon as the forecasted growth could be accommodated
within the serviced land. The acceleration of growth means that it is no longer feasible to continue
deferring these projects.
The Council must balance the need to provide adequate available serviced land for development
with affordability. Investing in the right strategic infrastructure too early results in infrastructure
that is underutilised yet still incurs costs to the ratepayer, while providing strategic infrastructure
too late may result in sub-optimal solutions that may be costly to maintain and operate or growth
potential not being realised.
It is not feasible for the Council to ‘opt out’ of investing in infrastructure for growth. Growth will
happen, so it’s important that we manage how we deliver infrastructure to balance what people
need and the impact of today’s decisions over the long term.
All areas inside the City (except Templeview) are already zoned for development and have structure
plans in place, meaning development can occur in accordance with the District Plan. Relying on
private developers to deliver strategic infrastructure can lead to ad-hoc infrastructure that doesn’t
link well to the existing network and ends up costing the Council more to fix in the long run. Other
potential negative consequences for the Council and the City may include:
• Making further development more expensive, and possibly preventing adjacent land from
being developed.
• Increased operating costs to the Council to maintain a network of piecemeal vested assets.
• Impacts on current service levels (such as traffic congestion) caused by the cumulative
effects of individual developments.
• Legal challenges where developers consider the Council’s lack of investment unreasonable
particularly where development can only be mitigated by significant infrastructure (e.g. a
Waikato River bridge) that is beyond the capacity of any one developer to provide.
• Inhibition of growth where no individual developer can reasonably fund significant
infrastructure on their own.
• New housing and business land development would not be enabled, which would erode our
competitive and comparative advantage as a City.
• Fragmented growth on multiple fronts leads to inefficiencies in infrastructure provision.
Land is unable to be unlocked due to constraints by infrastructure sized only for previous
individual developments resulting in the Council needing to retrofit infrastructure to allow
greater capacity. Infrastructure investments also need to be duplicated across the City to
allow for growth on multiple fronts.
The Draft 2018-28 10-Year Plan and this Strategy propose to initially focus greenfield investment in
strategic infrastructure to unlock the Peacocke growth cell. This investment in infrastructure is
forecasted in the next 5 years to create the necessary strategic infrastructure to enable residential
development deep into the Peacocke greenfield area. $289m of the direct investment required for
enabling Peacocke development is proposed to be funded through the Government Housing
Infrastructure Fund (HIF) loan. This includes:

HAMILTON CITY COUNCIL
16
• Construction of a new bridge over the Waikato River which is the extension of Wairere Drive
into Peacocke
• Construction of the connecting arterial roading network
• Strategic investments in wastewater and water infrastructure
• Purchase of some land for future parks in the Peacocke area.
The HIF loan is a 10-year interest free loan from the government to build specific, approved projects.
Support through the HIF loan to fund the initial strategic infrastructure for this area means the
Peacocke area will be able to grow faster with incremental pipe and road extensions as required.
This option also provides access to a further $112 million in funding from the NZ Transport Agency
on the transport projects in the first phase of the development.
Further investment in infrastructure for the Peacocke growth cell will continue beyond the next 10
years. This forecasted expenditure has been timed to align with the anticipated development of the
growth cell and release of sections to the market. However, this pace is largely determined by the
development community and will be dependent on market conditions at the time.
As well as regenerating the south of the City, an added benefit of investing in Peacocke is that
infrastructure investments also advance work on the Southern Links road network – a regionally
significant roading project.
While Peacocke requires significant investment, over the long-term this will support a much higher
number of new homes for the City than other current greenfield growth cell options such as
Rotokauri.
In addition to the infrastructure to unlock Peacocke, the Council is also proposing investing in other
infrastructure to address demand for housing and employment land, including:
• Projects needed to accommodate increasing demand, such as upgrading the water and
wastewater treatment plants, completing the Ring Road and intersection with Cobham
Drive
• Development already committed to and under contract.
• Completing work in Rototuna. The main strategic infrastructure is largely complete. Still
required are some community essentials like turning undeveloped reserve land into usable
parks, Rototuna Town Centre, upgrading water mains and upgrading rural roads to urban
standards.
• Investment in strategic infrastructure to support residential and employment development
in Ruakura
• Investment to support the ongoing incremental growth in the first stage of Rotokauri for
residential and employment land uses.
Substantial investment in strategic infrastructure for the Rotokauri greenfield cell is forecasted
within the 10-Year Plan but following the major investment in Peacocke in the first few years.
Investment in the strategic stormwater solution for Rotokauri is the most significant capital decision
to allow the future full development of the growth cell. The forecast expenditure for a strategic
stormwater solution for Rotokauri is more than $100m. The first of this expenditure is forecasted at
the end of the Draft 2018-28 10-Year Plan. The financial impact on developments for this growth cell
is potentially substantial given that the benefits from this large infrastructure project are localised to
new sections in Rotokauri and therefore costs are spread over relatively few new sections.
DRAFT 2018-48 LONG-TERM INFRASTRUCTURE STRATEGY
17
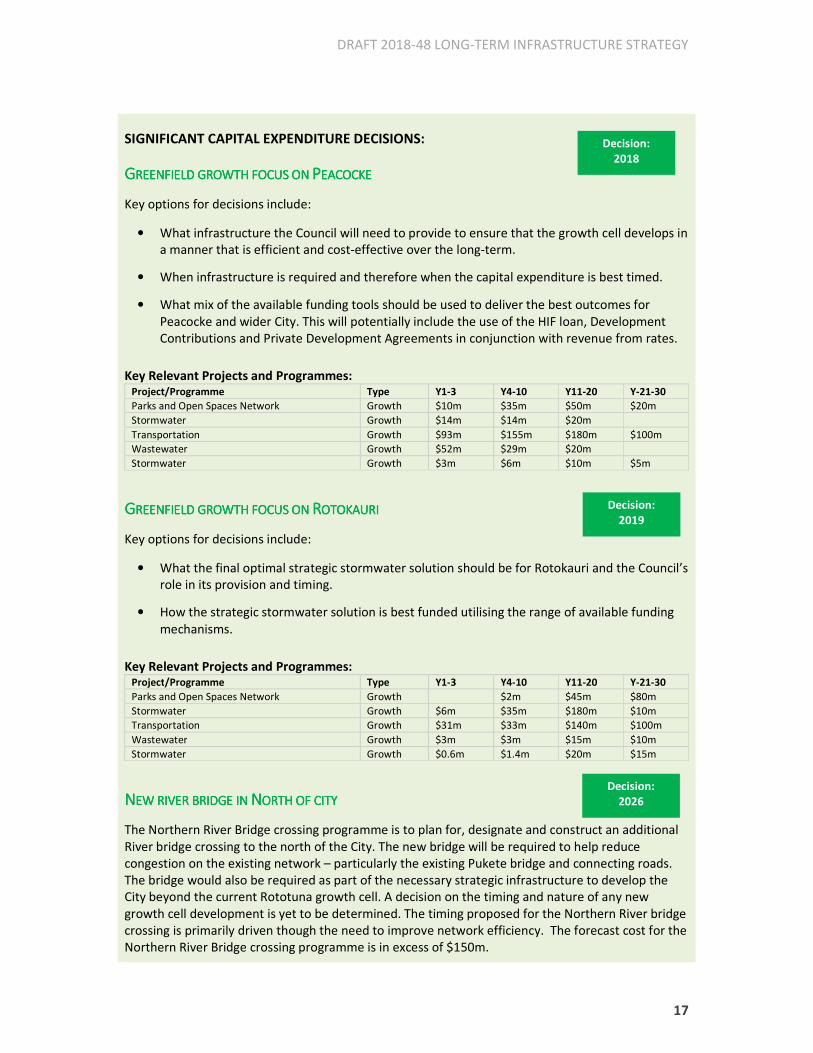
SIGNIFICANT CAPITAL EXPENDITURE DECISIONS:
GGGGREENFIELD GROWTH FOCREENFIELD GROWTH FOCREENFIELD GROWTH FOCREENFIELD GROWTH FOCUS ONUS ONUS ONUS ON PPPPEACOCKEEACOCKEEACOCKEEACOCKE
Key options for decisions include:
• What infrastructure the Council will need to provide to ensure that the growth cell develops in
a manner that is efficient and cost-effective over the long-term.
• When infrastructure is required and therefore when the capital expenditure is best timed.
• What mix of the available funding tools should be used to deliver the best outcomes for
Peacocke and wider City. This will potentially include the use of the HIF loan, Development
Contributions and Private Development Agreements in conjunction with revenue from rates.
Key Relevant Projects and Programmes: Project/Programme Type Y1-3 Y4-10 Y11-20 Y-21-30
Parks and Open Spaces Network Growth $10m $35m $50m $20m
Stormwater Growth $14m $14m $20m
Transportation Growth $93m $155m $180m $100m
Wastewater Growth $52m $29m $20m
Stormwater Growth $3m $6m $10m $5m
GGGGREENFIELD GROWTH FOCREENFIELD GROWTH FOCREENFIELD GROWTH FOCREENFIELD GROWTH FOCUS ON US ON US ON US ON RRRROTOKAURIOTOKAURIOTOKAURIOTOKAURI
Key options for decisions include:
• What the final optimal strategic stormwater solution should be for Rotokauri and the Council’s
role in its provision and timing.
• How the strategic stormwater solution is best funded utilising the range of available funding
mechanisms.
Key Relevant Projects and Programmes: Project/Programme Type Y1-3 Y4-10 Y11-20 Y-21-30
Parks and Open Spaces Network Growth $2m $45m $80m
Stormwater Growth $6m $35m $180m $10m
Transportation Growth $31m $33m $140m $100m
Wastewater Growth $3m $3m $15m $10m
Stormwater Growth $0.6m $1.4m $20m $15m
NNNNEW RIVER BRIDGE IN EW RIVER BRIDGE IN EW RIVER BRIDGE IN EW RIVER BRIDGE IN NNNNORTH OF CITYORTH OF CITYORTH OF CITYORTH OF CITY
The Northern River Bridge crossing programme is to plan for, designate and construct an additional
River bridge crossing to the north of the City. The new bridge will be required to help reduce
congestion on the existing network – particularly the existing Pukete bridge and connecting roads.
The bridge would also be required as part of the necessary strategic infrastructure to develop the
City beyond the current Rototuna growth cell. A decision on the timing and nature of any new
growth cell development is yet to be determined. The timing proposed for the Northern River bridge
crossing is primarily driven though the need to improve network efficiency. The forecast cost for the
Northern River Bridge crossing programme is in excess of $150m.
Decision:
2018
Decision:
2019
Decision:
2026

HAMILTON CITY COUNCIL
18
Key options for decisions include:
• When timing for construction of the bridge is optimal.
• The route for the roading approaches and location of the bridge – this will be as part of the
designation process.
• What opportunities exist for the funding of the infrastructure.
Key Relevant Projects and Programmes: Project/Programme Type Y1-3 Y4-10 Y11-20 Y-21-30
Northern River Crossing Growth $5m $120m $50m
WWWWIDEN AND UPGRADE IDEN AND UPGRADE IDEN AND UPGRADE IDEN AND UPGRADE BBBBOUNDARY OUNDARY OUNDARY OUNDARY RRRROAD OAD OAD OAD //// MMMMILL ILL ILL ILL SSSST CORRIDORT CORRIDORT CORRIDORT CORRIDOR
The Cross-city connector programme is a series of strategic investments in the existing transport
major arterial cross city connector to improve transport outcomes (safety, travel choice, efficiency).
The Cross-city connector requires investment as the City grows to ensure that the critical route
remains effective. The programme of investment is forecasted to begin during the 2018-28 10-year
period and the full programme is forecast to cost in excess of $180m.
Key options for decisions include:
• The scope and nature of the individual projects as they move from concept into planning
phase.
• The timing and sequence of the individual projects.
Key Relevant Projects and Programmes: Project/Programme Type Y1-3 Y4-10 Y11-20 Y-21-30
Cross City Connector Growth $6m $90m $90m
WWWWIDENING IDENING IDENING IDENING (4(4(4(4----LANESLANESLANESLANES)))) OF OF OF OF RRRRING ING ING ING RRRROADOADOADOAD
In the next couple of years, the Ring Road will be completed with the construction of the Cobham
Drive interchange. Over later years of this strategy there is a need to increase capacity through 4-
laning sections of the existing Ring Road. A programme of 4-laning has been included in the 30-year
forecasts over a 10-year period from 2025 to approximately 2035.
Key options for decisions include:
• The scope and design of the roading improvements as they move from concept into
planning phase.
• The timing and sequence of the individual roading improvement projects that make up the
Ring Road 4-laning programme.
Key Relevant Projects and Programmes: Project/Programme Type Y1-3 Y4-10 Y11-20 Y-21-30
Ring Road 4-Laning Growth $150m
Decision:
2026
Decision:
2025

DRAFT 2018-48 LONG-TERM INFRASTRUCTURE STRATEGY
19
Focus Area: Planning for and responding to growth opportunities
The Council influences how the City grows by deciding what areas can grow and what order it will
focus its investment in strategic infrastructure; and how much infrastructure to enable growth it will
plan for.
The Council has a strong history of strategic planning for growth. The Hamilton Urban Growth
Strategy (HUGS) has set out the Council’s approach to growth, including the sequencing and timing
of new greenfield growth cells in different areas of the City. HUGS aims to manage growth by
establishing an increasingly compact City where land and infrastructure can be provided and used
efficiently while ensuring a good quality of environment and urban form.
The Council’s District Plan also promotes an increasingly sustainable urban form for Hamilton to
accommodate the expected growth over the next 30-40 years. Structure Plans and Master Plans are
in place for the City’s existing growth cells and provide a diverse range of housing options to
accommodate Hamilton’s growing population in a way that delivers quality outcomes.
Beyond Hamilton, the Future Proof strategy sets out the sequencing and timing proposed for
residential and industrial growth in the Waikato, Waipa and Hamilton sub-region. The sequencing
and timing of infrastructure has been thought through extensively. Each of the Future Proof
partners plays a role in meeting the projected demands in the sub-region. If Hamilton does not
accommodate its share of the growth, this could lead to additional unplanned growth outside of the
City boundaries.
The 2018-28 10-Year Plan and this Strategy have been developed based on the continued delivery of
HUGS, and delivering on the settlement pattern agreed to through Future Proof.
Based on current growth projections, the City has enough zoned land within its existing growth cells
to provide for projected growth for the next 30 years, however will need to begin making decisions
to address longer term growth within the timeframe of this strategy.
There are currently two large capital expenditure ‘peaks’ forecasted within the first period:
• Years 1 – 5 reflects the start of investment in strategic infrastructure to unlock new
greenfield capacity in the Peacocke growth cell
• Years 8 – 15 reflects investment in strategic infrastructure to progress the remainder of the
Rotokauri greenfield growth cell
Based on decisions about the location and timing of long-term growth, the Council will need to
invest in more strategic growth infrastructure beyond what is currently planned for and shown in the
30-Year indicative estimates. This will require additional capital investment in the period from year
25 onwards to ensure that there is sufficient greenfield capacity for growth beyond the 30-year
horizon. This would likely result in the creation of a third ‘peak’ in growth related capital for
delivering growth over the next 30 years.
Land availability and funding options will be key factors influencing where and how the Council plans
and responds to growth opportunities over the long-term.
Land availability
The Council has strategic urban boundary agreements in place with neighbouring councils to bring
additional land within the City boundaries based on certain triggers in the future. These agreements
relate to some of the land areas that is adjoining the current City boundary. There are other areas
that are not under any agreement that could also be considered for transfer into the City. A number
of these areas have land owners and developers that have expressed interest in progressing
developments and bringing these to market.

HAMILTON CITY COUNCIL
20
Having a good long-term supply of land under the Council jurisdiction will simplify strategic land
management and decision-making for strategic infrastructure provision.
With many options available to the City for future development it is important to have a plan of how
the Council sees the City developing and the relative benefits of different areas. While an update to
the long-term urban development plan is timely over the next couple of years, the Council must
remain flexible and able to respond to opportunities to develop areas if they provide positive
outcomes for the City and are affordable.
Funding
The funding of strategic infrastructure has become a major issue for local councils across New
Zealand that are experiencing high demands for growth. This challenge is driving the need for new
and innovative funding and delivery models.
A number of these models are currently being considered by central and local government:
• the use of a special purpose vehicle – ‘crown infrastructure partners’ - to fund infrastructure
on behalf of local government and enter into agreements directly with developers to repay
the costs;
• the potential for an Urban Development Authority to enable developments to be built more
quickly;
• public private partnerships, where funding is provided by a private entity but ownership of
assets is retained by councils.
These new tools, and Government Policy to increase housing supply (including affordable housing),
are going to require a much more responsive and flexible approach to planning for growth by
Council, as they all have the potential to impact on the sequence and timing of the long-term growth
of the City. Future Proof and HUGS (and other planning processes) will need to adapt and take an
enabling approach, while still looking to plan for a balanced supply/demand profile and good urban
planning outcomes.
This may introduce risk, but these new tools will hopefully allow councils to mitigate and share that
risk with other equity funders of infrastructure.
It is also possible that in the future, Council may not own all strategic infrastructure, for example
these may be provided by 3rd parties under PPP arrangements with access gained under long term
contracts.
SIGNIFICANT CAPITAL EXPENDITURE DECISIONS:
GGGGROWTH FOCUS ON FUTURROWTH FOCUS ON FUTURROWTH FOCUS ON FUTURROWTH FOCUS ON FUTURE GREENFIELD CELLE GREENFIELD CELLE GREENFIELD CELLE GREENFIELD CELL
Over the next couple of years, the Council needs to examine and decide on the relative benefits of
the options that exist for long-term future development in and around the City. This would allow the
Council to be clear on the benefits and costs that would be traded off if specific land uses were
enabled.
Through the Council’s proposed investments in Peacocke and Rotokauri over the next 15 years,
there will be significant capacity for residential development. However, based on current projections
for demand this capacity will be used up by the end of the next 30 years.
New greenfield growth opportunities will be required. Different options for the funding of strategic
infrastructure should be considered as part of this process.
Decision:
2019

DRAFT 2018-48 LONG-TERM INFRASTRUCTURE STRATEGY
21
Key options for decisions include:
• Updating the existing Hamilton Urban Growth Strategy to indicate the Council’s long-term
future greenfield preferences and indicative long-term funding timeframes for strategic
infrastructure investments. Options for new growth cells include but not limited to:
o HT1 – North of Rototuna
o R2 – North of Ruakura
o HT2 – North of Rapa / Pukete
o Southern Links area
o Templeview
o Other areas not currently within the City boundaries.
Key Relevant Projects and Programmes:
There are currently no projects or programmes in this Strategy to enable the development of
additional long-term future growth cells (other than Peacocke, Ruakura and Rotokauri) due to
uncertainty on priority. A detailed analysis of the costs and benefits of new growth cells will be
carried out in coming years prior to decisions on future growth cell priorities are made.
Challenge 3: Meeting Expectations for Improvements
While water, wastewater, stormwater are important for public health it is often open spaces,
community facilities, services and events that make Hamilton an enjoyable and desirable place to be.
Over recent years there has been little development of new community infrastructure as other
priorities have been the Councils focus. The 2018-28 10-Year Plan has seen an increase in the level of
investment in community infrastructure from previously planned in the 2015-25 10-Year Plan. This
is on top of the increased budget for renewing existing assets and basic open spaces in new growth
areas.
The Access Hamilton Strategy seeks to improve a range of transport outcomes including safety,
increased travel choice and economic efficiency of the transport network. As a result, there are
many options for the investing of limited funding.
There is a lot of uncertainty around the future expenditure for new community infrastructure and
transportation improvements due to the discretionary nature of these assets. Is this the reason that
there is no significant decisions and limited capital expenditure shown beyond year 10 in this
Strategy.
The focus areas for the Council when looking to meeting expectations for city improvements is;
• Prioritising new community infrastructure – The Council needs to balance the community
expectations for new community infrastructure with timing of improvements that are
affordable.
• Prioritising transport improvement – The Council needs to balance the community
expectations for improvements to the transport system with timing that is affordable.
Focus Area: Prioritising city improvements
The Council has written and approved many plans and strategies that have proposed projects
detailed within the document to deliver on its outcomes. These documents are aspirational and
have led to an increase in customer expectations for new community infrastructure and services.
Some of the projects have been undertaken, others are being progressed through the 2018-28 10-

HAMILTON CITY COUNCIL
22
Year Plan, other plans remain unfunded and have not been included in the budget for the next 10-
years.
Significant plans and strategies that have had limited implementation to date include:
• Central City Transformation Plan
• River Plan
• Frankton Neighbourhood Plan
• Hamilton East Neighbourhood Plan
• Biking Plan
• Hamilton Gardens Development Programme
• Playgrounds of the Future
• Hamilton Arts Agenda and Theatres
• Open Spaces Plan
• Libraries Strategic Plan
• Access Hamilton Strategy
Every 3 years, the Council makes decisions about the investment priorities it has for the City in the
10-Year Plan. Ahead of the next 10-Year Plan, the relative priorities for improvements to the City
should be confirmed. This may result in changes being made to the current plans and strategies so
that public expectations about the extent of likely improvements and timeframes are appropriately
managed.
The Council is continually looking for smart and innovative ways to deliver projects. A key
consideration in prioritising City improvement projects is the opportunity available for the
partnering with other organisations for delivery and funding. The land area of Hamilton is small, the
second smallest Council area in New Zealand. This means that Hamilton provides a lot of community
infrastructure that is used by people who live out of the City. New funding models are required for
community infrastructure that ensure that everyone pays their fair share of costs. These are further
discussed in the Using Partnership Opportunities section.
SIGNIFICANT CAPITAL EXPENDITURE DECISIONS:
PPPPRIORITISING NEW RIORITISING NEW RIORITISING NEW RIORITISING NEW CCCCOMMUNITYOMMUNITYOMMUNITYOMMUNITY IIIINFRASTRUCTURE NFRASTRUCTURE NFRASTRUCTURE NFRASTRUCTURE
Understanding the relative priority of potential improvements and new facilities is beneficial for
planning. This allows the targeting of available funding and to allow other potential partners to
understand the Council priorities.
Key options for decisions include:
• Which of the current plans and strategies are priorities for implementation
• Identify the partnership opportunities for projects and whether these are a priority for the
Council to progress
• How much funding will / can be made available through budget processes for City
improvement projects
Key Relevant Projects and Programmes*: Project/Programme Type Y1-3 Y4-10 Y11-20 Y-21-30
Central City Transformation Plan – Garden Place
Development
LOS $4m
Decision:
2019

DRAFT 2018-48 LONG-TERM INFRASTRUCTURE STRATEGY
23
Cemeteries Management Plan LOS/
Growth
$1m $5m $3m $1m
Rototuna Community Facilities Growth $11m $9m
Hamilton Gardens Development Programme LOS $4m $3m
Libraries Strategic Plan LOS $1m $2m
Parks and Open Spaces Plans LOS/
Growth
$21m $5m $30m
River Plan LOS $8m $5m $20m $25m
Zoo Master Plan LOS $2.7m $1m $25m $30m
Peacocke Community Facility Growth $25m
PPPPRIORITISING TRANSPORRIORITISING TRANSPORRIORITISING TRANSPORRIORITISING TRANSPORT IMPROVEMENTST IMPROVEMENTST IMPROVEMENTST IMPROVEMENTS
The Council’s Access Hamilton strategy outlines the direction for investment in transport
improvements. Similarly, to prioritising new City improvements, there are more projects requiring
investment than current budgets allow. Therefore, a continual process of prioritisation and decision-
making on the programme is required. This will allow for flexible and optimised investments to be
made. The Council should consider the subsidy and third-party opportunities in determining the
programme of best benefit for Hamilton. For example, if there is increased central government
support and funding for passenger rail then the Council should consider its response to this new
opportunity. These decisions can be ongoing but will need to be formalised through 10-Year Plan
and Annual Plan budgeting processes.
Key options for decisions include:
• Which of the current projects and programmes are highest priority for implementation
• Identify the partnership opportunities for projects / programmes and whether these are a
priority for the Council to progress
• How much funding will / can be made available through budget processes for transport
improvement projects
Key Relevant Projects and Programme*: Project/Programme Type Y1-3 Y4-10 Y11-20 Y-21-30
Access Hamilton Projects – Economic
Development
Growth $1m $32m
Access Hamilton Projects – Safety LOS/
Growth
$21m $44m
Access Hamilton Projects – Travel Choice LOS/
Growth
$44m $93m $32m $42m
* There were some new community and transport improvements shown in the Activity Management
Plans that were not funded as part of the 2018-28 10-Year Plan. Due to the uncertainty, around
whether these projects will ever go ahead these unfunded projects have not been rephrased into
Year 11-15 in the above tables. Then the Council has decided which plans and strategies will be
implemented there will be more clarity around which projects should form part of future
Infrastructure Strategies.
Decision:
2019

HAMILTON CITY COUNCIL
24
External factors
There are many external factors that will impact how the Council delivers infrastructure in the
future. Although these factors are generally beyond the control of the Council, it is important that
we continue to monitor and respond to them to ensure that our infrastructure plans take advantage
of new opportunities, and remains fit for purpose.
Figure 6: Infrastructure External Factors
Population Growth
Hamilton has been experiencing very high growth and this is projected to remain strong into the
future.
The Council is using population projections produced by University of Waikato’s National Institute of
Demographic and Economic Analysis (NIDEA) as the basis for developing the 10-Year Plan and
Infrastructure Strategy.
People aged 60 years and above constitute Hamilton’s fastest growing age group. This has been
factored into the population projections and impacts that this will have on our services.
Under the NIDEA projection that has been selected, the Council is needing to provide strategic
infrastructure to enable 12,500 new dwellings over the next 10 years, and 32,000 dwellings over the
next 30 years. Currently there are approximately 58,000 dwellings in Hamilton.
Government requires the Council through the National Policy Statement on Urban Development
Capacity (NPS) to provide for a level of new development that is greater than the forecasted
demand. The NPS requires a margin above projected demand (NIDEA projection) of 20% in the short
term and 15% in the longer term. This is intended to keep supply ahead of demand to maintain
housing affordability.
Population Growth
Climate Change & Sustainability
Technological Advancements
Government Priorities & Legislation

DRAFT 2018-48 LONG-TERM INFRASTRUCTURE STRATEGY
25
Figure 7: Historical and Projected new dwellings
To meet these demands, new greenfield areas are required for housing development within the next
10-years. At the same time, development is also anticipated to occur within the existing City.
The Council monitors population change through official statistics and produces regular growth
activity reports to assist in managing growth and provision of infrastructure. If there are significant
changes to the growth forecasted in the 10-Year Plan, the Council can accelerate or slow its
investment in infrastructure through Annual Plans. An assessment of growth is undertaken at each
Annual Plan as well as more fundamentally as part of developing each 10-Year Plan.
Climate Change & Sustainability
In New Zealand, changes in climate, such as temperature and rainfall, are already occurring. These
changes will occur to differing extents in different places.
Climate change is considered as part of the Council’s long-term asset management planning
processes. Current models predict storms of greater frequency and intensity in the future for
Hamilton. This will particularly impact the Council’s water, wastewater and stormwater assets. The
Council staff review new studies and guidance as part of their ongoing planning for assets.
Examples of programmes that planned over the next 30 years which will assist in mitigating the
effects of climate change:
• extensive catchment erosion control works for stormwater in gully systems
• wastewater storage throughout the existing network.
Technological Advancements
Technology can have a large impact on the type and timing of infrastructure required. It can also be
used to help deliver services differently and alter what infrastructure is required.
Managing infrastructure systems in a smarter way could reduce the need to construct new assets in
the face of increasing demand. Also, technology can increase the effective capacity of our
infrastructure, reduce maintenance and operating costs and improve reliability and safety.
0
5,000
10,000
15,000
20,000
25,000
30,000
35,000
40,000
45,000
0
200
400
600
800
1,000
1,200
1,400
20092011201320152017201920212023202520272029203120332035203720392041204320452047
New Dwellings By Year (Projection) New Dwellings By Year (Historical)
Cumulative New Dwellings

HAMILTON CITY COUNCIL
26
New technology may increase the demand for certain infrastructure, redefine how we use
infrastructure, or even lead to an entirely new infrastructure system. This would need to be
supported by an accessible and sustainable charging infrastructure system.
Council’s planning for technological change is driven through:
• the Smart Hamilton programme has been funded in the 10-Year Plan to examine how
technology can transform the city and how it operates.
• new technologies being incorporated into relevant Activity Management Plans as part of
their 3-yearly review.
Changing Government Priorities & Legislation
With the Government change in 2017, there will be changes to policy and priorities over the next
few years. This will likely include changes to central government expectations, requirements and
priorities for the delivery of infrastructure. Policy changes can have a significant impact on what
investments Council makes through incentivising services and types of infrastructure through
funding mechanisms and targeted use of subsidies
Council is working closely with relevant Government Ministers and officials to understand changes in
policy direction as quickly as possible in an effort to respond to any new opportunities. A deliberate
focus is being put on strengthening relationships and looking for opportunities to be innovative in
service and infrastructure delivery.
Other policy changes cannot easily be anticipated and so current planning is generally undertaken
based on the current and known policy priorities and legislation.

DRAFT 2018-48 LONG-TERM INFRASTRUCTURE STRATEGY
27
Using partnership
opportunities
The Council cannot alone provide all of Hamilton’s infrastructure and community needs. The Council
continually looks for opportunities to partner with others to provide services and infrastructure. Key
partners involved in the delivery of infrastructure include:
• Community and Philanthropic Organisations
• Developers
• Other local Councils – Waikato and Waipa District Councils and Waikato Regional Council
• Central Government
The Council will consider the partnership opportunities that exist for projects when it is prioritising
what infrastructure investment decisions to progress within strategies and plans.
Community and Philanthropic Organisations
There are opportunities to partner with other organisations to provide services and community
infrastructure. A recent example of this is that the Council contributed funding to the development
of the Rototuna Indoor Recreation Centre (renamed The Peak), in partnership with the Ministry of
Education and Rototuna High School. This facility provides indoor court space for competitive and
community sports such as netball, basketball and volleyball. An annual operating grant is paid
annually for the operation of the centre, but the Council do not own the facility.
There are other new services and facilities that are planned as part of the 2018-28 10-Year Plan that
have Council contribution but are not traditional models of the Council owned assets and service
delivery. These projects or opportunities include:
• Partnering with The University of Waikato for the development of a further indoor
recreation facility. The Council may make operational grants to help construct and operate
the facility.
• Partnering with Momentum Waikato on the Waikato Regional Theatre project. The Council
is looking at providing an operating grant to support the building of a new performing arts
theatre in Hamilton.
• Partnering with community organisations to fund ongoing development of the Hamilton
Gardens.
• Investigating a public private partnership for construction and operation of a new aquatic
facility in Rototuna Town Centre
• Joint funding with private land owners for proposed upgrade to Garden Place.
Developers
The development community is a key partner in delivering infrastructure for growth. While the
Council may undertake some strategic infrastructure projects for growth, the timing of growth
projects is largely set by when a developer or group of developers undertake their investment and
make the land available for the market.
The Council works closely with developers to ensure as much as possible the planning for
expenditure on growth related infrastructure is timed to match developer’s intentions.

HAMILTON CITY COUNCIL
28
For core network growth projects, the Council provides strategic infrastructure projects when it is
reasonable for only the Council to provide due to the project scale or because the infrastructure
services a large area or multiple developments. The majority of other core network infrastructure
will be provided by developers.
Other Local Councils and Waikato Regional Council
The Council’s community infrastructure and event facilities are largely sub-regional in function –
providing services that are used by many from outside Hamilton. While this relationship can provide
an economic benefit to the City, this also comes at considerable cost to city ratepayers who
predominately fund these facilities.
The Waikato Plan outlines areas where local government and other partners can work together to
deliver infrastructure more efficiently. Continuing work on models for funding of sub-regional and
regional facilities should remain a priority for the future.
Changes to current arrangements to ensure that regional funding of proposed new community
facilities that have a catchment larger than Hamilton are being explored.
There are also opportunities to grow the capacity and resilience of water and wastewater
infrastructure through projects that service the sub-region, rather than just the City or a single
district. Before any councils invest in major new infrastructure capacity, the benefits of shared
projects and investment should be explored.
Central Government
Central government partners with the Council on providing and funding infrastructure that have
benefits that are beyond the local area.
Over recent years, central government and the Council have partnered on constructing the Ring
Road in anticipation of the Hamilton section of the Waikato Expressway project. The Hamilton
section of the Waikato Expressway is scheduled for completion in 2019/20. The Council will work
with central government on this project and in some cases, co-invest in the final parts of the
strategic transport network with this piece of key national infrastructure.
In 2017 the Government offered five cities experiencing high population growth, access to the HIF
loan. Across the five councils a total of $1 billion is available interest free for 10 years for
infrastructure that enable housing growth. Hamilton has been allocated a proportion of the HIF loan
to assist with the works needed to open up the Peacocke growth cell. This provides substantial
financial benefit comprising of interest savings totalling approximately $70 million over the 10 years.

DRAFT 2018-48 LONG-TERM INFRASTRUCTURE STRATEGY
29
The Council’s Plan
MOST LIKELY SCENARIO
This strategy provides the overview of Council’s most likely scenario for the management of its
infrastructure. This scenario has been determined by:
• Including the funded capital and operating budget forecasts from the draft 2018-28 10-Year
Plan. The timing of projects and budget provisions have been informed by the 30-Year
AMPs.
• Identifying projects through the 10-Year Plan that are unable to fit within the financial
provision set by the Financial strategy. These projects are assumed to be required in the
future and this is reflected in the Financial Strategy.
• Using the assumptions for levels of service, demand and renewals as outlined in Appendices
2-5 of this Strategy.
• The preferred options for the significant capital decisions discussed in the Infrastructure
challenges and focus areas section of this Strategy are those that are included in the draft
10-Year Plan budget (where applicable).
The plans and forecasts for the first 3 years have the most detail and confidence as the greatest
amount of planning has taken place. The investments identified between 4 and 10 years are an
outline and have a reasonable degree of confidence. The forecasts beyond year 10 should be viewed
as indicative estimates and will be developed further as time passes and more information is
obtained.
Changes to the requirements and management of infrastructure is expected to occur and the
Council will consider the appropriate approach as part of the future relevant 10-Year Plan process.
This uncertainty and need for ongoing refinement is acknowledged in the tiered framework for
forecast expenditure contained in the Local Government Act.
Table 1: Forecast expenditure required in the Local Government Act (LGA) 2002
Period of forecast expenditure Description of required forecast in LGA
Years 1-3 In detail
Years 4-10 In outline
Years 11+ An indicative estimate
The forecasted expenditure is significantly higher than historical expenditure. For each of the next
five years, the forecasted annual capital expenditure is over $150m. The most significant driver of
this expenditure is the investment required in infrastructure to strategically service the Peacocke
growth cell. Some of the investment in Peacocke related infrastructure is being funded through the
HIF loan.
The estimated requirement for capital investment over the next 30 years has been prepared and is
shown below.

HAMILTON CITY COUNCIL
30
Figure 8: 30-Year Capital forecasts – Expenditure type
Note: Financial figures are gross and not inflated in this graph to show relativity of expenditure over time.
The forecasted expenditure from 2028 to 2036 is another period where there will be significant
capital investment required. This is due to an investment phase for the further development of the
Rotokauri growth cell.
While there are significant increases in the expenditure forecasted to provide for growth, there is
also a large increase in growth related revenue (through Development Contributions from
developers and new ratepayers). This helps pay for growth and creates some additional capacity for
borrowing.
There is a high likelihood that over time the indicative estimates beyond 10 years in this Strategy will
need to change to reflect:
• changes in assumed growth rates
• changes to standards and compliance requirements not anticipated
• new technologies and options for provision of infrastructure
• new models for the funding and delivery of infrastructure (these may include the Council not
funding and / or owning infrastructure)
• greater certainty about the nature and timing of the projects that are required
• affordability and ability for the Council to deliver the programme.
The Council’s Financial Strategy has been updated through the development of the 2018-28 10-Year
Plan. The Financial Strategy has a 10-Year horizon and helps the Council and the community to
understand the long-term financial impacts and sustainability of the Council’s budget and plans.
The Financial Strategy describes the impact on debt and rates of the Council’s budget. Over the next
10 years debt will remain within a prudent debt to revenue limit of 230% while funding an increased
0
50,000,000
100,000,000
150,000,000
200,000,000
250,000,000
300,000,000
350,000,000
13
/14
14
/15
15
/16
16
/17
17
/18
18
/19
19
/20
20
/21
21
/22
22
/23
23
/24
24
/25
25
/26
26
/27
27
/28
28
/29
29
/30
30
/31
31
/32
32
/33
33
/34
34
/35
35
/36
36
/37
37
/38
38
/39
39
/40
40
/41
41
/42
42
/43
43
/44
44
/45
45
/46
46
/47
47
/48
Renewal Growth Level of Service UNFUNDED
Detail Outline Indicative estimateHistory

DRAFT 2018-48 LONG-TERM INFRASTRUCTURE STRATEGY
31
investment in looking after the Council’s existing assets and building new infrastructure. This is
achieved through a significant increase in revenue over the same period.
Figure 9: Debt to Revenue Ratio
The Council’s Financial Strategy notes that at a debt to revenue ratio below 230%, the Council
maintains its strong credit ratio (AA-) and still provide capacity to fund any unforeseen events. The
debt to revenue ratio figure above includes the HIF loan.
The debt to revenue ratio peaks in year 3 due to an unprecedented forecast capital expenditure on
projects to enable the continued growth of Hamilton. The forecast capital expenditure is lower in
the second 5 years of the 10-Year Plan period. This means that with increased revenues forecast
from rates, development contributions and other fees, that the debt to revenue ratio decreases.
The development of indicative expenditure on assets for the next 30 years has allowed the Council
to gain a preliminary view of the sustainability of its finances and infrastructure for the next 20-
years.
The estimated capital expenditure has been used to project the effect on the Council’s debt to
revenue ratio and the financial strategy debt limit. This has been prepared using the following
assumptions:
• Capital and operating expenditure in years 1-10 as included in the draft 10-Year Plan budget
• The shown unfunded projects from the 10-Year Plan will need to be undertaken and a
provision for these projects is included by equally spreading their value over years 11-15
• Debt to revenue ratio is set at a limit of 230% (as in the draft 10-Year Plan budget) and
remaining the limit into the future.
• Rates increases as in the draft 10-Year Plan (9.5 per cent in years 1 and 2 and 3.8 per cent for
8 years to existing ratepayers). From 2028/29 (year 11) rates decreasing to match the
estimated inflation rate of 2.6 per cent (this is the projected Local Government Cost Index
inflation at 2027/28).
0%
50%
100%
150%
200%
250%
2013 2014 2015 2016 2017 2018 2019 2020 2021 2022 2023 2024 2025 2026 2027 2028
Debt to revenue ratio (actual) Debt to revenue ratio (forecasted)
Debt to revenue limit (existing 10-Year Plan) Debt to revenue limit (2018 Draft 10-Year Plan)

HAMILTON CITY COUNCIL
32
Figure 10: 20 Year Projected Debt to Revenue ratio financial strategy limit
Beyond the next 10 years, the financial estimates indicate that there will be increased demands for
capital expenditure. This is driven by:
• significant expenditure to provide for growth, particularly in the Rotokauri greenfield growth
cell, and
• an allocation made for projects and programmes that have not been included in the Draft
2018-28 10-Year Plan and remain unfunded but are likely to be required in the future.
The reduction of debt to revenue ratio in the years beyond 2035 should be understood within the
context of:
• a need for significant growth-related capital expenditure needed for strategic infrastructure
in the period from 2040 onwards.
• the very high uncertainty of projected debt levels given the assumptions that are needed to
be made in relation to the compounding effects of inflation, rates increase, new assets and
their operation and depreciation.
The Council will manage the long-term sustainability for infrastructure through:
• Seeking capital subsidies for eligible projects.
• Exploring other funding mechanisms that will result in off-balance sheet arrangements for
the Council.
• Reviewing timing and scope as more information becomes available. This reduces
uncertainty.
• Investigating options for new technology as this develops and becomes available.
• Continuing to improve asset management planning to ensure the best possible programme
for managing timing of large projects.
• Working with other agencies to ensure efficient delivery and joint funding opportunities.
• Moderation through future 10-Year Plan and then Annual Plan processes.
• Quality business cases prior to final approval for projects to proceed.
0%
50%
100%
150%
200%
250%
Debt to revenue ratio (forecasted) Debt to revenue ratio (actual)
Debt to revenue limit (existing 10-Year Plan) Debt to revenue limit (2018 Draft 10-Year Plan)

DRAFT 2018-48 LONG-TERM INFRASTRUCTURE STRATEGY
33
Operational expenditure for the 30 years has also been estimated. The forecasts for the first 10
years are from the 2018-28 10-Year Plan and longer-term estimates have been based on applying
inflation and estimated growth factors.
Figure 11: Total infrastructure forecasted operational expenditure each year - 2018-28 10-Year Plan
Figure 12: Total infrastructure forecasted operational expenditure - five yearly periods - 2018-48
OUR APPROACH TO THE MANAGEMENT OF INFRASTRUCTURE ASSETS
Over recent years asset management has been an organisational focus for improvement. The
establishment of the Asset Management Centre of Excellence in 2015 has enabled the increase in
the knowledge of assets and improved capability in asset management practice across the
organisation.
The Asset Management Centre of Excellence identified the following five asset management goals for the Council to determine what aspects of asset management require interventions, and priorities for work to be undertaken:
• The Activity Management Plans drive financial decision making for the Council’s 10-Year
Plan and 30-Year Infrastructure Strategy.
• Accessible, reliable asset data is available; data entry is devolved, repeatable and timely.
• There is a culture of valuing Asset Management - ‘we are an Asset Management business’
0
50
100
150
200
250
300
350
2019 2020 2021 2022 2023 2024 2025 2026 2027 2028
$m
0
500
1,000
1,500
2,000
2,500
2019-23 2024-28 2029-33 2034-38 2039-43 2044-48
$m

HAMILTON CITY COUNCIL
34
• In-house Asset Management expertise is available.
• Maturity level is best practice, where appropriate, with smart thinking applied to core
infrastructure.
Activity Management Plans have been prepared for the Council’s activities that have a high reliance
on assets to deliver services. These plans have been prepared based on standard industry practice
and have been used to forecast the expenditure needed to operate, maintain and renew worn out
assets. The Council uses its Activity Management Plans as an initial basis for its 10 Year Plan and 30
Year Infrastructure Strategy.
The 10-Year Plan balances the forecasted spending needs with ratepayer affordability. This
affordability has been determined by projected rates and other income and prudent debt levels. It is
usual that not all the identified spending requirements in Activity Management Plans can be
afforded within funding available. In these cases, the budgeting process prioritises expenditure on
maintaining and renewing existing asses before creating new ones. On occasions, the Council also
identifies assets that are no longer required. This is generally in conjunction with a decision to stop
or reduce a level of service to the community. The Council considers its service levels for the
community as part of each 10-Year Plan process.
The Council is committed to improving the Activity Management Plans and takes improving asset
management processes and systems seriously. Further investment on improving asset management
will be made in the future to make sure the Council has the right information to make the best
possible decisions on assets.

DRAFT 2018-48 LONG-TERM INFRASTRUCTURE STRATEGY
35
Water
CONTEXT
The City’s water supply system is made up of a single treatment plant, eight reservoirs and over
1,000 kilometres (km) of associated pipe network.
WATER TREATMENT
The treatment plant relies on the Waikato River as a single water source. The plant is capable of
drawing up to 105 million litres of water per day from the river. Between 2.5 and 5.0 per cent of all
water is returned to the river as part of the treatment process. The sustainable peak treatment
capability of the plant is about 78 million litres per day. During summer, peak demand has reached
up to 90 million litres per day and in the evenings a large portion of the demand for water is met
from reservoir storage.
WATER STORAGE
The City has eight reservoirs, providing a total of 112 million litres storage. Water storage equivalent
to peak demand per day is required for emergency purposes. However, as the City grows, additional
reservoir storage will be required for emergency purposes and water supply during peak periods.
WATER DISTRIBUTION
Treated water is pumped from the treatment plant to the reservoirs and users through
approximately 1,100km of pipe network. As is expected in any urban centre, the network is made up
of various pipe materials of different ages, which results in some water loss through leakages. The
leakage in Hamilton is estimated to currently be about 16 per cent of water that is treated.
Council is responsible for the treatment, storage,
distribution and management of the city’s water
supply.
The water treatment plant sources raw water
from the Waikato River and treats it to provide a
high standard of drinking water.
The treated water is pumped to reservoirs from
where it is distributed through a network to
meet the needs of residential and
commercial/industrial properties.

HAMILTON CITY COUNCIL
36
OVERVIEW OF ASSETS
Table 2: Overview of Water assets
Asset group Asset type Purpose and description Quantity Value
$000s
Water
treatment
Civil, structural,
mechanical, electrical
and automation
Treatment plant that treats river
water for human use.
1 62,509
Storage Reservoirs Used to store treated water. To
meet drinking water standards,
we must be able to store enough
water to meet 24 hours of
average water demand.
8 operational 33,612
Network Service connections Pipe that connects the private
water pipe within a property to
the water network.
50,039 42,426
Bulk watermains Bulk watermains carry treated
water from the treatment plant
to the reservoirs.
1,159 km 284,435 Reticulation pipes Pipes of decreasing sizes that
carry treated water from
treatment plant or reservoirs to
properties.
Valves Devices to control the flow of
water from one pipe to the next.
10,081 19,888
Hydrants Above-ground connection that
provides access to a water supply
for the purpose of fighting fires
or for flushing.
6,532 16,598
Meters Measure water use for our
commercials and industrial
customers and bulk water flows
within the network.
3,691 2,508
Backflow Preventers These devices prevent water
from private pipes re-entering
into the water network
284 286
Bulkmain Chambers These are miscellaneous assets
grouped together consisting of
manholes and chambers that
house various valves
16 77
Total value 462,339

DRAFT 2018-48 LONG-TERM INFRASTRUCTURE STRATEGY
37
Figure 13: Bulkwater Network

HAMILTON CITY COUNCIL
38
INDICATIVE ESTIMATES
Capital expenditure
The estimated capital needs for the water supply activity have been prepared for the next 30 years.
The forecasted capital expenditure from year ending 30 June 2019 to 2028 has been included in the
draft 2018-28 10-Year Plan.
Figure 14: Forecasted yearly capital expenditure for Water - 2018-28 10-Year Plan
Figure 15: Forecasted capital expenditure for Water - five yearly periods - 2018-48
$0
$5,000,000
$10,000,000
$15,000,000
$20,000,000
$25,000,000
$30,000,000
$35,000,000
2019 2020 2021 2022 2023 2024 2025 2026 2027 2028Renewal Growth Level of Service Unfunded in 10-YP
$0
$50,000,000
$100,000,000
$150,000,000
$200,000,000
$250,000,000
$300,000,000
$350,000,000
2019 - 2023 2024 - 2028 2029 - 2033 2034 - 2038 2039 - 2043 2044 - 2048
Renewal Growth Level of Service Unfunded in 10-YP

DRAFT 2018-48 LONG-TERM INFRASTRUCTURE STRATEGY
39
Operational expenditure
The forecasted operational expenditure from year ending 30 June 2019 to 2028 has been included in
the draft 2018-28 10-Year Plan. Estimated expenditure beyond 2028 is based on the year 10 forecast
and then adjusted for anticipated future growth of the City.
Operational expenditure includes indirect costs to provide the service to the community such as
depreciation, interest costs and overheads. Forecasted operational expenditure is shown as gross
costs.
Figure 16: Forecasted yearly operational expenditure for Water – 2018-28 10-Year Plan
Figure 17: Forecasted operational expenditure for Water – five yearly periods – 2018-48
0
10
20
30
40
50
60
70
80
90
2019 2020 2021 2022 2023 2024 2025 2026 2027 2028
$m
0
100
200
300
400
500
600
700
2019-23 2024-28 2029-33 2034-38 2039-43 2044-48
$m

HAMILTON CITY COUNCIL
40
Funding of activity
The Water Supply activity is currently funded through a mixture of:
• rates collected in the year of expenditure
• rates to repay loans raised for capital works
• user charges for commercial / industrial and out of City water users, including:
- metered water for non-domestic customers
- metered water for tanker use
- new connections
Figure 18: Water Supply activity funding
Capital projects that are caused by (and provide benefits to) growth areas of the City are part funded
by development contributions.

DRAFT 2018-48 LONG-TERM INFRASTRUCTURE STRATEGY
41
Wastewater
CONTEXT
The City’s wastewater system is comprised of a single centralised wastewater treatment plant, 121
pump stations and over 800km of connecting pipework. The system services over 50,000
households, and provides trade waste services to 4,000 commercial and industrial premises.
WASTEWATER RETICULATION AND PUMP STATIONS
Wastewater is removed from commercial, industrial and residential properties via various pumping
station and pipe networks to the wastewater treatment plant. As is expected in any urban centre,
the network is made up of various pipe materials and ages, which results in some water infiltration.
The City has 121 pump stations which are controlled through a centralised computer system. The
Council has commenced an upgrade programme to achieve a six-hour storage standard for all
wastewater pump stations to provide improved environmental performance in the event of power
or pump failure.
WASTEWATER TREATMENT
The treatment plant is a biological plant that can receive and providing primary treatment for up to
2,000 litres per second of wastewater and up to 600 litres per second for secondary treatment
(nitrogen removal etc.).
Our wastewater treatment plant relies on the Waikato River as the receiving environment for final
treated effluent. The quality of final discharge has improved over time as capital improvements have
occurred on site. There are two principle challenges. Firstly, peak flow into the plant, which is
typically experienced during high rainfall events. Secondly, the health of the biology at the plant,
which can be impacted by external events.
Council is responsible for the collection,
transfer, treatment and disposal of
Hamilton’s wastewater and trade waste.
Wastewater and trade waste are discharged
from properties into a network of gravity and
pressure pipelines, which take the
wastewater to the treatment plant.
At the treatment plant, wastewater is
treated before being discharged into the
Waikato River.
Solids, removed as part of the treatment
process, are currently composted off site and
reused.
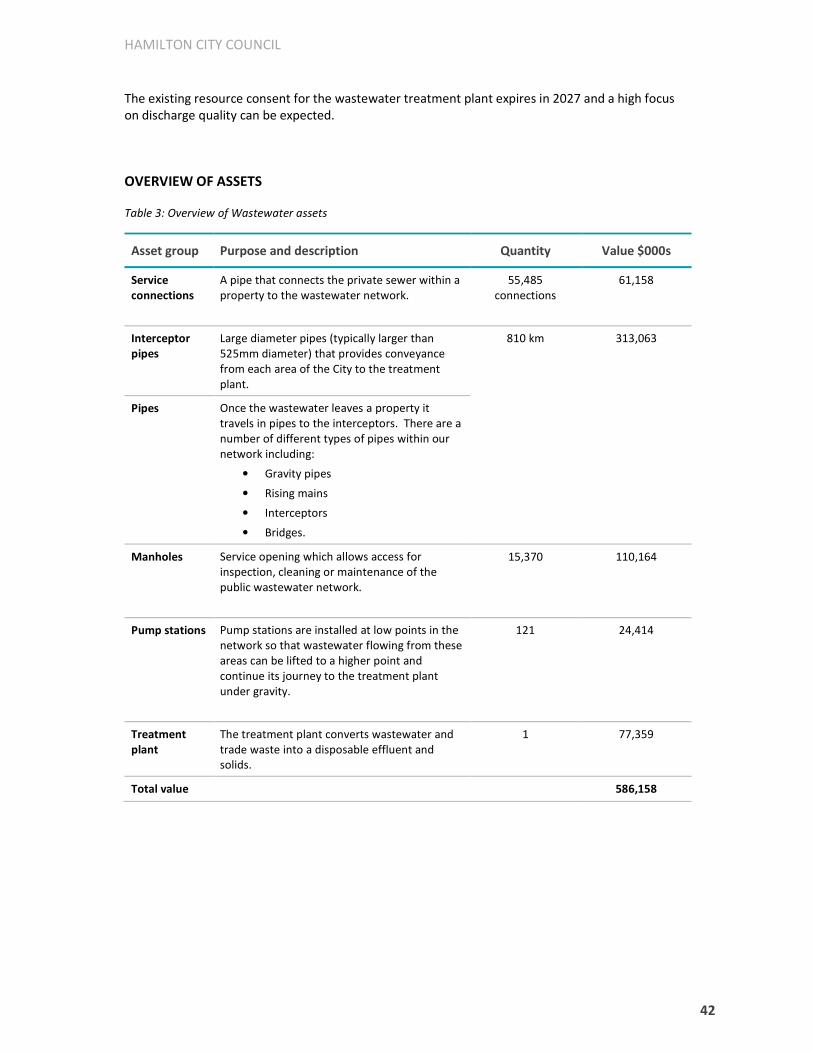
HAMILTON CITY COUNCIL
42
The existing resource consent for the wastewater treatment plant expires in 2027 and a high focus
on discharge quality can be expected.
OVERVIEW OF ASSETS
Table 3: Overview of Wastewater assets
Asset group Purpose and description Quantity Value $000s
Service
connections
A pipe that connects the private sewer within a
property to the wastewater network.
55,485
connections
61,158
Interceptor
pipes
Large diameter pipes (typically larger than
525mm diameter) that provides conveyance
from each area of the City to the treatment
plant.
810 km 313,063
Pipes
Once the wastewater leaves a property it
travels in pipes to the interceptors. There are a
number of different types of pipes within our
network including:
• Gravity pipes
• Rising mains
• Interceptors
• Bridges.
Manholes Service opening which allows access for
inspection, cleaning or maintenance of the
public wastewater network.
15,370
110,164
Pump stations Pump stations are installed at low points in the
network so that wastewater flowing from these
areas can be lifted to a higher point and
continue its journey to the treatment plant
under gravity.
121
24,414
Treatment
plant
The treatment plant converts wastewater and
trade waste into a disposable effluent and
solids.
1 77,359
Total value 586,158

DRAFT 2018-48 LONG-TERM INFRASTRUCTURE STRATEGY
43
Figure 19: Wastewater Network

HAMILTON CITY COUNCIL
44
INDICATIVE ESTIMATES
Capital expenditure
The estimated capital needs for the wastewater activity have been prepared for the next 30 years.
The forecasted capital expenditure from year ending 30 June 2019 to 2028 has been included in the
draft 2018-28 10-Year Plan.
Figure 20: Forecasted capital expenditure for Wastewater each year – 2018-28 10-Year Plan
Figure 21: Forecasted capital expenditure for Wastewater - five yearly periods - 2018-48
$0
$10,000,000
$20,000,000
$30,000,000
$40,000,000
$50,000,000
$60,000,000
$70,000,000
2019 2020 2021 2022 2023 2024 2025 2026 2027 2028Renewal Growth Level of Service Unfunded in 10-YP
$0
$50,000,000
$100,000,000
$150,000,000
$200,000,000
$250,000,000
$300,000,000
$350,000,000
2019 - 2023 2024 - 2028 2029 - 2033 2034 - 2038 2039 - 2043 2044 - 2048
Renewal Growth Level of Service Unfunded in 10-YP

DRAFT 2018-48 LONG-TERM INFRASTRUCTURE STRATEGY
45
Operational expenditure
The forecasted operational expenditure from year ending 30 June 2019 to 2028 has been included in
the draft 2018-28 10-Year Plan. Estimated expenditure beyond 2028 is based on the year 10 forecast
and then adjusted for anticipated future growth of the City.
Operational expenditure includes indirect costs to provide the service to the community such as
depreciation, interest costs and overheads. Forecasted operational expenditure is shown as gross
costs.
Figure 22: Forecasted operational expenditure for Wastewater each year – 2018-28 10-Year Plan
Figure 23: Forecasted operational expenditure for Wastewater - five yearly periods - 2018-48
0
10
20
30
40
50
60
70
80
90
2019 2020 2021 2022 2023 2024 2025 2026 2027 2028
$m
0
100
200
300
400
500
600
700
2019-23 2024-28 2029-33 2034-38 2039-43 2044-48
$m

HAMILTON CITY COUNCIL
46
Current funding of activity
The Wastewater activity is currently funded through a mixture of:
• rates collected in the year of expenditure
• rates to repay loans raised for capital works
• user charges for disposal of trade waste through the wastewater network.
Figure 24: Wastewater activity funding
Capital projects that are caused by (and provide benefits to) growth areas of the City are part funded
by development contributions.

DRAFT 2018-48 LONG-TERM INFRASTRUCTURE STRATEGY
47
Stormwater
CONTEXT
Stormwater is drained from Hamilton’s urban area and is discharged to open drains, streams, lakes
and to the Waikato River.
The system drains an urban catchment of approximately 9,000 hectares (ha) however the total
catchment area draining to the City reach of the Waikato River is much larger at approximately
30,000ha.
Hamilton’s stormwater network services a variety of land uses including:
• residential land uses (e.g. private homes and driveways).
• industrial and commercial land uses (e.g. wholesale and retail outlets, depots,
manufacturing sites, warehouses, workshops).
• roads and car parks.
• community facilities (e.g. Hamilton Lake, Claudelands Event Centre, parks and sports areas,
Waikato Hospital, schools, and tertiary educational institutions).
• runoff from undeveloped catchments.
The stormwater network is also used to dispose of potable water during the maintenance of
reservoirs, and from flushing and testing of fire hydrants.
Stormwater discharge activities require assessment under the Waikato Regional Plan. The Council
has a ‘City-wide’ comprehensive stormwater discharge consent from Waikato Regional Council
(granted in 2011) to divert and discharge stormwater to receiving environments from its existing
urban network for a period of 25 years. The consent also provides a mechanism for allowing
discharges from ‘developing’ catchments through catchment management plans.
Council is responsible for the collection,
transfer and treatment of Hamilton’s
stormwater.
Rainwater that flows from houses and
buildings roofs, footpaths, roads, etc. is
called stormwater and is directed to either
the ground or the stormwater system.
The stormwater system consists of pipes,
channels, treatment devices and open
watercourses, which release water into the
city’s streams, lakes and the Waikato River.

HAMILTON CITY COUNCIL
48
OVERVIEW OF ASSETS
Table 4: Overview of Stormwater assets
Asset group Asset type Purpose and description Quantity Value
$000s
Network Service connections A pipe that connects the private
stormwater pipe within a premise
to the stormwater network.
42,034 63,161
Reticulation pipes Once stormwater leaves a
property it can travel in pipes to
an open watercourse
669km 586,787
Manholes Service opening which allows
assess for inspection, cleaning or
maintenance of the public
stormwater piped network
12,859 85,390
Treatment Treatment / detention
/ flood management
Ponds, wetlands and bunded
areas that treat stormwater and
or detain stormwater during high
rainfall events to protect
downstream properties from
flooding
24 2,895
Assets within
streams and
rivers
Lined open
watercourses
Drains and streams that transport
water to other streams or the
Waikato River
104km 5,218
Outlets and Inlets Located at the end of the pipe,
outlets and inlets prevent erosion
and scouring of the open
watercourse to which
stormwater is discharged
146 837
Other We have a number of other
devices within the network
including soakage trenches,
soakage pits, fish passage
devices, and erosion control
devices
1,577
Total value 745,865

DRAFT 2018-48 LONG-TERM INFRASTRUCTURE STRATEGY
49
Figure 25: Stormwater Network

HAMILTON CITY COUNCIL
50
INDICATIVE ESTIMATES
Capital expenditure
The estimated capital needs for the stormwater activity have been prepared for the next 30 years.
The forecasted capital expenditure from year ending 30 June 2019 to 2028 has been included in the
draft 2018-28 10-Year Plan.
Figure 26: Forecasted capital expenditure for Stormwater each year – 2018-28 10-Year Plan
Figure 27: Forecasted capital expenditure for Stormwater - five yearly periods - 2018-48
$0
$5,000,000
$10,000,000
$15,000,000
$20,000,000
$25,000,000
2019 2020 2021 2022 2023 2024 2025 2026 2027 2028Renewal Growth Level of Service Unfunded in 10-YP
$0
$20,000,000
$40,000,000
$60,000,000
$80,000,000
$100,000,000
$120,000,000
$140,000,000
2019 - 2023 2024 - 2028 2029 - 2033 2034 - 2038 2039 - 2043 2044 - 2048
Renewal Growth Level of Service Unfunded in 10-YP

DRAFT 2018-48 LONG-TERM INFRASTRUCTURE STRATEGY
51
Operational expenditure
The forecasted operational expenditure from year ending 30 June 2019 to 2028 has been included in
the draft 2018-28 10-Year Plan. Estimated expenditure beyond 2028 is based on the year 10 forecast
and then adjusted for anticipated future growth of the City.
Operational expenditure includes indirect costs to provide the service to the community such as
depreciation, interest costs and overheads. Forecasted operational expenditure is shown as gross
costs.
Figure 28: Forecasted operational expenditure for Stormwater each year – 2018-28 10-Year Plan
Figure 29: Forecasted operational expenditure for Stormwater - five yearly periods - 2018-48
0
10
20
30
40
50
60
70
80
90
2019 2020 2021 2022 2023 2024 2025 2026 2027 2028
$m
0
100
200
300
400
500
600
700
2019-23 2024-28 2029-33 2034-38 2039-43 2044-48
$m

HAMILTON CITY COUNCIL
52
Current funding of activity
The Stormwater activity is currently funded through a mixture of:
• rates collected in the year of expenditure
• rates to repay loans raised for capital works
• subsidies for capital works from Waikato Regional Council through Project Watershed.
Figure 30: Stormwater activity funding
Capital projects that are caused by (and provide benefits to) growth areas of the City are part funded
by development contributions.

DRAFT 2018-48 LONG-TERM INFRASTRUCTURE STRATEGY
53
Transport
CONTEXT
Hamilton currently experiences congestion for short periods of the day which is expected to increase
as it continues to grow. The road network also struggles with competing demands of different users
such as pedestrians, cyclists, cars, buses and trucks. Before resorting to new infrastructure, one of
the key approaches is to manage the demand and to ‘make best use of existing capacity’.
Over recent years there has been significant investment in Hamilton’s strategic transport
infrastructure. The focus has been on the completion of the City’s Ring Road and the Te Rapa Bypass.
Over the next few years, focus will be on:
• connections to the central government funded Waikato Expressway
• transport improvements to assist increased mode choice, safety and congestion
• strategic transport infrastructure to support new greenfield development in Peacocke.
Over the longer term, investment is required for providing a further river crossing to the north of the
City and increasing capacity of some critical arterial transport corridors.
The New Zealand Government through the New Zealand Transport Agency (Transport Agency)
partners with the Council by operating the state highways that run through Hamilton and co-
investing with the Council in transport infrastructure and services. The bus service is provided and
managed by the Waikato Regional Council through a partnership with the City. The current
Government has a stated policy focus on passenger rail and the Council will need to consider its role
and investments in relation to this.
Council provides and manages a safe and
efficient transport network for Hamilton which
integrates walking, cycling, buses, private
vehicles and freight.
We also manage on-street parking, clearways
and Council-owned parking buildings and
car-parks.
Our services include operation and maintenance
of the existing network and planning for future
development. We work with the community to
raise awareness of travel options and influence
safe travel behaviour.

HAMILTON CITY COUNCIL
54
OVERVIEW OF ASSETS
Table 5: Overview of Transport assets
Asset group Asset type Purpose and description Quantity Value
$000s
Pavements Roads Roads owned and maintained by the
Council, for use by motor vehicles and
cycles.
677 km 586,728
Footpaths Footpaths (incl. tactitles) for use by
pedestrians and selected low speed
vehicles such as mobility scooters.
Some are ‘shared use’ with cyclists.
1,034km 212,658
Carparks Off street carparks owned and
managed by the Council to provide
parking facility for vehicles.
16 sites
37,000 m2
2,702
Structures Bridges, culverts
and underpasses
Bridges, large culverts and
underpasses to allow for roads and
walkways to continue across
waterways, railways and other roads.
85 92,573
Other structures Guard railing, barriers, retaining walls,
bus shelters, sign gantries and other
minor structures.
651 items and
14km guard
railing
20,626
Road drainage Stormwater
channel and
drainage features
Kerb and channel and features used to
drain water from the roads into the
City’s stormwater system.
107,940
Traffic control
devices
Traffic signals and
information
technology
systems (ITS)
Traffic signals and Intelligent transport
systems are used at road intersections
and pedestrian crossing locations to
provide safe movement opportunity
for conflicting traffic.
81 sites 6,961
Signs Regulatory and informational signs to
warn, inform and guide all road users.
14,454 3,646
Street lights The Council owned and maintained
street lights to improve road safety
and personal security.
17,332 26,897
Traffic Islands Islands on the carriageway that control
the traffic and pedestrian flow e.g.
kerb extension, speed hump, and
pedestrian refuge.
1,318 13,104
Streetscapes Features Assets that add to the amenity value of
the road network, e.g. bollards, bins,
and parking meters.
1,301
Landscaping Planted areas and grassed areas in
traffic islands, carriageway medians
and kerb extensions.
550,700m2 N/A
Verge
Landscaping
Grassed areas in traffic islands and
medians and areas of verges which are
569,620m2 N/A

DRAFT 2018-48 LONG-TERM INFRASTRUCTURE STRATEGY
55
Asset group Asset type Purpose and description Quantity Value
$000s
mowed by the Council.
Buildings Buildings Various properties owned by the
Council for transportation purposes.
9 21,311
Total value 1,096,447
Figure 31: Transport infrastructure

HAMILTON CITY COUNCIL
56
INDICATIVE ESTIMATES
Capital expenditure
The estimated capital needs for the transport activity have been prepared for the next 30 years.
The forecasted capital expenditure from year ending 30 June 2019 to 2028 has been included in the
draft 2018-28 10-Year Plan.
Figure 32: Forecasted capital expenditure for Transport each year – 2018-28 10-Year Plan
Figure 33: Forecasted capital expenditure for Transport – five yearly periods – 2018-48
$0
$20,000,000
$40,000,000
$60,000,000
$80,000,000
$100,000,000
$120,000,000
$140,000,000
$160,000,000
2019 2020 2021 2022 2023 2024 2025 2026 2027 2028Renewal Growth Level of Service Unfunded in 10-YP
$0
$100,000,000
$200,000,000
$300,000,000
$400,000,000
$500,000,000
$600,000,000
2019 - 2023 2024 - 2028 2029 - 2033 2034 - 2038 2039 - 2043 2044 - 2048
Renewal Growth Level of Service Unfunded in 10-YP

DRAFT 2018-48 LONG-TERM INFRASTRUCTURE STRATEGY
57
Operational expenditure
The forecasted operational expenditure from year ending 30 June 2019 to 2028 has been included in
the draft 2018-28 10-Year Plan. Estimated expenditure beyond 2028 is based on the year 10 forecast
and then adjusted for anticipated future growth of the City.
Operational expenditure includes indirect costs to provide the service to the community such as
depreciation, interest costs and overheads. Forecasted operational expenditure is shown as gross
costs.
Figure 34: Forecasted operational expenditure for Transport each year – 2018-28 10-Year Plan
Figure 35: Forecasted operational expenditure for Transport – five yearly periods - 2018-48
0
10
20
30
40
50
60
70
80
90
2019 2020 2021 2022 2023 2024 2025 2026 2027 2028
$m
0
100
200
300
400
500
600
700
2019-23 2024-28 2029-33 2034-38 2039-43 2044-48
$m

HAMILTON CITY COUNCIL
58
Current funding of activity
The Transport activity is currently funded through a mixture of:
• rates collected in the year of expenditure
• rates to repay loans raised for capital works
• subsidies from central government through the New Zealand Transport Agency for:
• operating and maintenance
• renewals
• other capital improvement
The current subsidy from NZ Transport Agency for eligible projects and programmes is at a rate of 51
per cent.
Figure 36: Transport activity funding
Capital projects that are caused by (and provide benefits to) growth areas of the City are part funded
by development contributions.

DRAFT 2018-48 LONG-TERM INFRASTRUCTURE STRATEGY
59
Parks and Green spaces
CONTEXT
Within the Parks and Green Spaces activity, the Council owns and manages over 1,190 hectares of
open space. This includes destination parks, neighbourhood parks, sports parks and natural areas.
Fifty-four hectares at Hamilton Gardens provides a key tourist and local visitor attraction.
The Council has an Open Space Plan which sets the long-term direction for open space in Hamilton.
Hamilton Gardens aspires to continue to provide a world class garden that enhances the City’s
identity, prosperity and quality of life. To achieve this the Council will focus on the development of
Hamilton Gardens’ themed gardens and enhancement of visitor facilities.
For Parks and Green Spaces, the objective is to provide passive and active recreation areas which
meet the needs and expectations of the growing City. This will be achieved through the provision of
popular, diverse playgrounds and increasing the quality and capacity of sports fields.
The Council also operates and maintains one operational cemetery and two heritage cemeteries:
• Hamilton Park Cemetery, including the crematorium and chapel facilities. It operates on 18
hectares, with a further 14 hectares available for future development. A development plan
for Hamilton Park Cemetery was developed in 2014.
• Hamilton West Cemetery opened in 1869 and was closed in 1975.
• Hamilton East Cemetery, opened in 1866, remains open for reserved plot burials and ash
interments.
The Parks and Green Spaces activity provides the
community with an opportunity to access open
space, be involved in active or passive
recreation, enjoy the visual appeal of the city,
utilise public toilets when out and about and use
off-road connections provided by walkways and
cycleways.
Hamilton Gardens provides an important visitor
attraction for the city and amenity value to the
community.

HAMILTON CITY COUNCIL
60
OVERVIEW OF ASSETS
Table 6: Overview of Parks and Green Spaces assets
Asset group Asset type Purpose and description Quantity Value $000s
Land Amenity parks,
sports parks,
natural areas, the
streetscape and
Hamilton Gardens
Land provided for active or passive
recreation, visual appeal and off-road
connections. Includes 54 hectares at
Hamilton Gardens.
1,196ha NA
Buildings Toilets, changing
rooms and other
buildings on parks
To provide publicly accessible toilets,
changing facilities for sporting groups
and other buildings on parks including
houses and work sheds.
106 $31,254
Cemeteries and
Crematorium
Crematorium, chapel, and ancillary
buildings.
12 $2,803
Park
infrastructure
Play space Provides informal and social recreation
spaces for young people to enjoy in a
public setting e.g. skate park and
playgrounds
83 $12,591
Park furniture To provide amenities and features to
ensure that the use and enjoyment of
open spaces e.g. entry points, fences,
seats, artwork, landscapes, and signs.
$17,395
Roads, car parks,
and paths
Provides walking, cycling and vehicle
access to parks.
51 Roads
75 Carparks
83km Paths
$39,482
Sports fields,
drainage and
courts
Sports field assets that provide useable
space for informal and organised sport.
200
$7,376
Other built assets More specialist assets that provide basic
infrastructure and features to ensure
utilisation and enjoyment of open
spaces e.g. water features, bridges,
pergolas and walls.
$35,461
Trees Park and street trees. NA
Cemeteries
infrastructure
Cemeteries and
Crematorium
Burial and crematorium equipment,
memorial beams and berms, park
furniture, signs, carparks and roads.
$5,765
Total value $152,127

DRAFT 2018-48 LONG-TERM INFRASTRUCTURE STRATEGY
61
Figure 37: Parks and Green Spaces

HAMILTON CITY COUNCIL
62
INDICATIVE ESTIMATES
Capital expenditure
The estimated capital needs for the Parks and green spaces activity have been prepared for the next
30 years. The forecasted capital expenditure from year ending 30 June 2019 to 2028 has been
included in the draft 2018-28 10-Year Plan.
Figure 38: Forecasted capital expenditure for Parks and Green Spaces each year – 2018-28 10-Year Plan
Figure 39: Forecasted capital expenditure for Parks and Green Spaces - five yearly periods - 2018-48
$0
$5,000,000
$10,000,000
$15,000,000
$20,000,000
$25,000,000
$30,000,000
$35,000,000
$40,000,000
$45,000,000
2019 2020 2021 2022 2023 2024 2025 2026 2027 2028Renewal Growth Level of Service Unfunded in 10-YP
$0
$20,000,000
$40,000,000
$60,000,000
$80,000,000
$100,000,000
$120,000,000
$140,000,000
$160,000,000
2019 - 2023 2024 - 2028 2029 - 2033 2034 - 2038 2039 - 2043 2044 - 2048
Renewal Growth Level of Service Unfunded in 10-YP

DRAFT 2018-48 LONG-TERM INFRASTRUCTURE STRATEGY
63
Operational expenditure
The forecasted operational expenditure from year ending 30 June 2019 to 2028 has been included in
the draft 2018-28 10-Year Plan. Estimated expenditure beyond 2028 is based on the year 10 forecast
and then adjusted for anticipated future growth of the City.
Operational expenditure includes indirect costs to provide the service to the community such as
depreciation, interest costs and overheads. Forecasted operational expenditure is shown as gross
cost.
Figure 40: Forecasted operational expenditure for Parks and Green Spaces each year – 2018-28 10-Year Plan
Figure 41: Forecasted operational expenditure for Parks and Green Spaces – five yearly periods – 2018-48
0
10
20
30
40
50
60
70
80
90
2019 2020 2021 2022 2023 2024 2025 2026 2027 2028
$m
0
100
200
300
400
500
600
700
2019-23 2024-28 2029-33 2034-38 2039-43 2044-48
$m
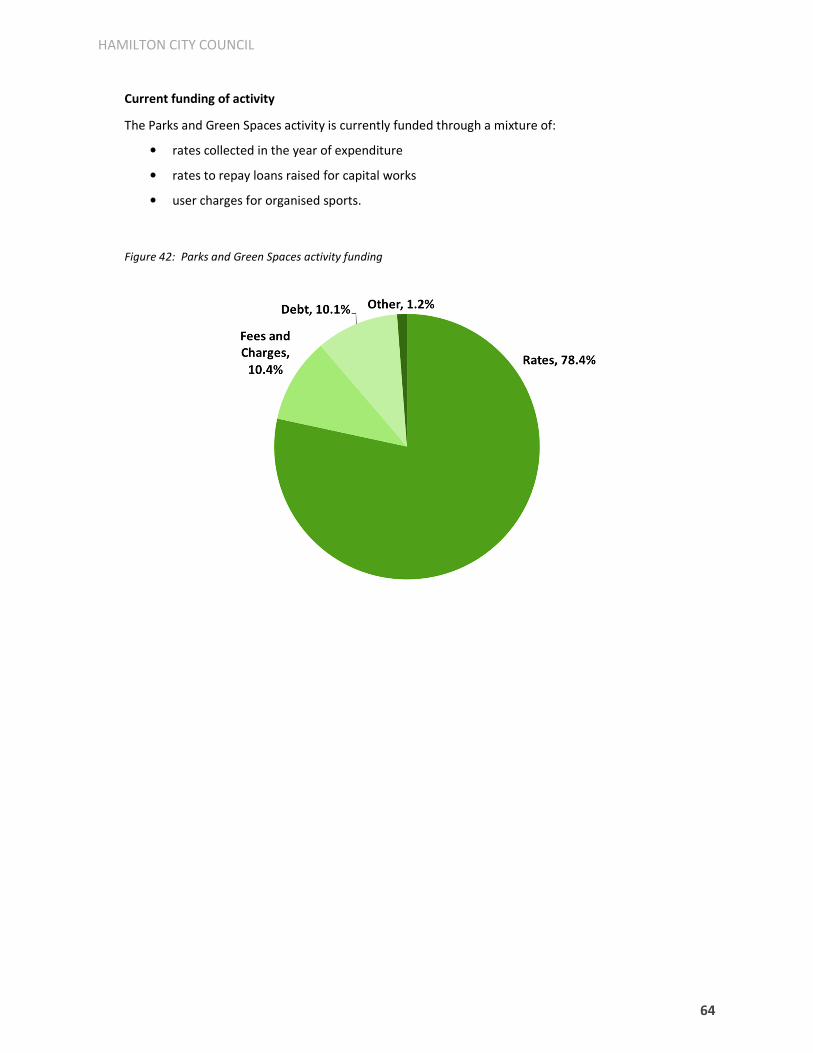
HAMILTON CITY COUNCIL
64
Current funding of activity
The Parks and Green Spaces activity is currently funded through a mixture of:
• rates collected in the year of expenditure
• rates to repay loans raised for capital works
• user charges for organised sports.
Figure 42: Parks and Green Spaces activity funding

DRAFT 2018-48 LONG-TERM INFRASTRUCTURE STRATEGY
65
Community and Events
Facilities
CONTEXT
Aquatic Facilities
Hamilton is the regional hub for many of the aquatic and indoor sporting codes. As such the City
requires facilities to provide for regional and sub-regional competitions and training facilities.
Waterworld, is the Waikato regional centre for swimming and hosts local and national competitions.
It is also a major facility for residents and visitors to Hamilton. Gallagher Aquatic Centre, is a smaller
community pool.
Community Facilities
These facilities enable local organisation and private providers to deliver a variety of community
based resources, services and activities to meet the needs of local communities. In addition, these
provide bookable space for groups and communities to enable social and recreational activities to
occur at a local level.
H3
H3 delivers a diverse range of quality events within the Council owned event facilities across the
following event categories:
• Meet – Meetings, conferences, functions and exhibitions.
• Compete – Sporting events.
• Perform – Performance events such as music, dance, comedy.
Events are delivered from the following facilities:
• Theatres (Founders Theatre) – currently closed pending final funding decisions on the new
Regional Theatre proposal.
• Stadiums (Waikato Stadium and Seddon Park).
• Claudelands (Arena, Conference and Exhibition Centre, The Grandstand, Holman Stand).
Council owns and operates community and
events facilities. These facilities support and
strengthen the community, encourage an active
lifestyle, and promote economic growth through
attracting events and visitors to the city.
These facilities help to make Hamilton be a
modern liveable city where its residents are able
to access library and leisure opportunities and
experience local and international sporting
events and performances.
HAMILTON CITY COUNCIL
66
Hamilton Zoo
The zoo covers 21 hectares of landscaped grounds with another 7 hectares available for future use.
It is home to more than 600 exotic and native New Zealand animals. The unique experience at
Hamilton Zoo allows residents and visitors to enjoy wildlife in a natural setting and encourage
support for wildlife conservation and sustainability of natural resources.
Libraries
Public libraries occupy a central place in the pursuit of information and knowledge, providing
services and facilities as a public good collective resource. The Hamilton Libraries are an in-house
service providing a diverse range of programmes and services to the community. Although the
services provided by libraries have significantly changed over the years the collections continue to
the core element of the service. The collections are divided into two key areas, lending and heritage
(including archives). It delivers it’s services across six libraries.
Waikato Museum
The Waikato Museum cares for, preserves and shares the stories about the objects and taonga of
the Waikato region and beyond. The museum provides exhibitions, public programmes and
education programmes about social history, visual arts, tangata whenua and science. It delivers its
services from three sites:
• The museum building in Grantham Street which houses collections, and offers public
exhibitions, education and public programmes.
• ArtsPost, a retail and community gallery space.
• Beale Cottage, a ‘Category 1’ Historic Place, open for public tours.

DRAFT 2018-48 LONG-TERM INFRASTRUCTURE STRATEGY
67
OVERVIEW OF ASSETS
Table 7: Overview of Community and Events assets
Asset group Asset type Description
Property and
buildings
Aquatic Facilities Waterworld and Gallagher Aquatic Centre with ancillary buildings. The
Municipal Pool is currently inoperative.
Community
Facilities
Enderley Park Community Centre, Celebrating Age Centre, Fairfield Hall,
Old St Peters Hall, Frankton Railway Institute Hall and Te Rapa
Sportsdrome.
H3 - Claudelands Conference Centre, Exhibition Centre and Arena under one roof, the
Grandstand and ancillary buildings.
H3 - FMG Stadium Turf, Grandstands and ticket booths.
H3 - Seddon Park Pavilion and ancillary buildings.
H3 - Founders
Theatre
Theatrical venue for performing arts and entertainment. The theatre is
currently closed.
Hamilton Zoo Main Zoo reception/shop, ancillary buildings, significant animal houses.
Libraries Six libraries. Central library is currently closed.
Waikato Museum Waikato Museum building, ArtsPost, Beale Cottage.
Operational
assets
Aquatic Facilities Pools, hydroslide, dive towers, pool equipment, furniture, water quality
assets, technical, gym, play and aqua education equipment.
Community
Facilities
Furniture and audio-visual and event equipment
H3 Furniture, Technical and Turf equipment
Hamilton Zoo Animal collection, animal enclosures and structures, carparks, roads,
utiliites,furniture and equipment.
Library Lending collections of books, serial items, DVDs, CDs, recordings and
heritage collections. Furniture, technology and library equipment.
Waikato Museum Collections of artwork, taonga and objects. Furniture and equipment.

HAMILTON CITY COUNCIL
68
Figure 43: Community and Events infrastructure

DRAFT 2018-48 LONG-TERM INFRASTRUCTURE STRATEGY
69
INDICATIVE ESTIMATES
Capital expenditure
The estimated capital needs for the Community and Events activity have been prepared for the next
30 years. The forecasted capital expenditure from year ending 30 June 2019 to 2028 has been
included in the draft 2018-28 10-Year Plan.
Figure 44: Forecasted capital expenditure for Community and Events each year – 2018-28 10-Year Plan
Figure 45: Forecasted capital expenditure for Community and Events – five yearly periods – 2018-48
$0
$5,000,000
$10,000,000
$15,000,000
$20,000,000
$25,000,000
$30,000,000
2019 2020 2021 2022 2023 2024 2025 2026 2027 2028
Renewal Growth Level of Service Unfunded in 10-YP
$0
$20,000,000
$40,000,000
$60,000,000
$80,000,000
$100,000,000
$120,000,000
$140,000,000
$160,000,000
$180,000,000
2019 - 2023 2024 - 2028 2029 - 2033 2034 - 2038 2039 - 2043 2044 - 2048
Renewal Level of Service Growth Unfunded in 10-YP
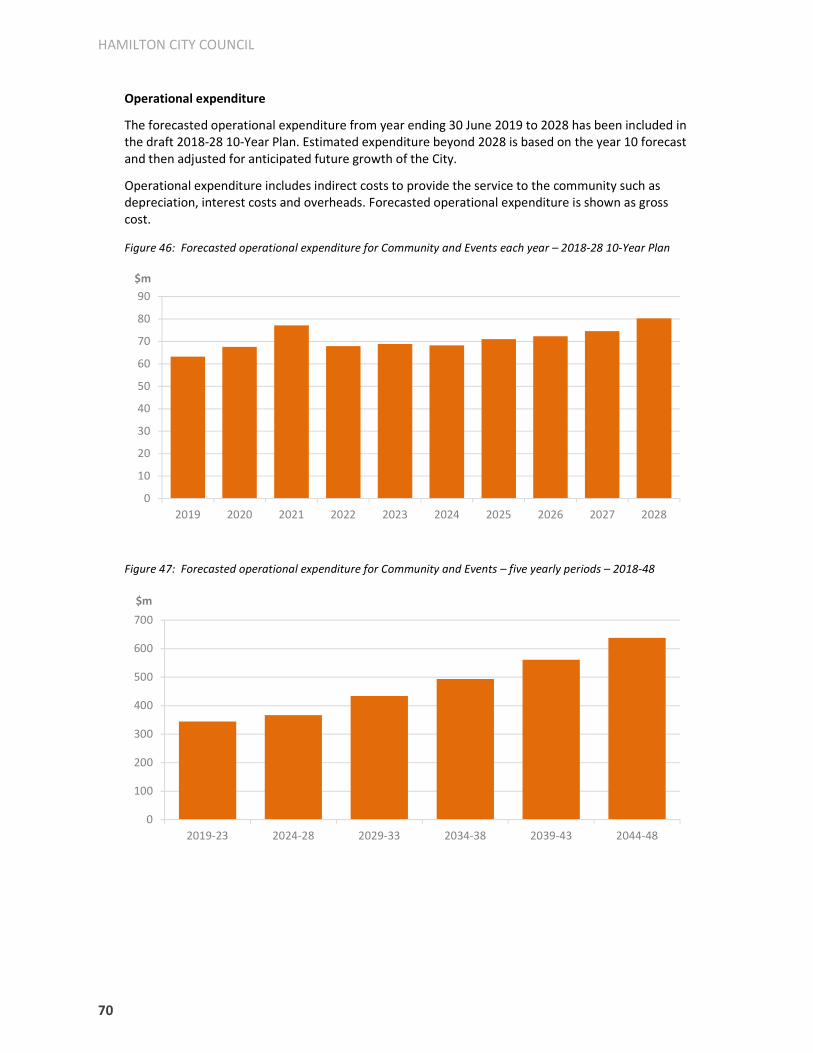
HAMILTON CITY COUNCIL
70
Operational expenditure
The forecasted operational expenditure from year ending 30 June 2019 to 2028 has been included in
the draft 2018-28 10-Year Plan. Estimated expenditure beyond 2028 is based on the year 10 forecast
and then adjusted for anticipated future growth of the City.
Operational expenditure includes indirect costs to provide the service to the community such as
depreciation, interest costs and overheads. Forecasted operational expenditure is shown as gross
cost.
Figure 46: Forecasted operational expenditure for Community and Events each year – 2018-28 10-Year Plan
Figure 47: Forecasted operational expenditure for Community and Events – five yearly periods – 2018-48
0
10
20
30
40
50
60
70
80
90
2019 2020 2021 2022 2023 2024 2025 2026 2027 2028
$m
0
100
200
300
400
500
600
700
2019-23 2024-28 2029-33 2034-38 2039-43 2044-48
$m

DRAFT 2018-48 LONG-TERM INFRASTRUCTURE STRATEGY
71
Current funding of activities
The Community and Events activities are currently funded through a mixture of:
• rates collected in the year of expenditure
• rates to repay loans raised for capital works
• donations
• user charges for services provided and venue hireage.
The graph below shows the proportion of funding for the various activities.
Figure 48: Community and Events activities funding

HAMILTON CITY COUNCIL
72
General Assumptions
The Infrastructure Strategy has been prepared using the following overall assumptions which are
consistent with the significant forecasting assumptions contained in the 2018-28 10-Year Plan.
Table 8: Overall assumptions
Assumption Level of uncertainty and potential impact
All financial information in this
Strategy includes inflation unless
stated otherwise.
High degree of uncertainty as based on long-term inflation forecasts
that are likely to change and errors would have a compounding effect
over time. Increased or decreased inflation could have a material
impact on the accuracy of financial forecasts. This would result in the
need to either decrease or increase funding in order to continue to
deliver the same service levels and programme.
Graphs of forecast capital
expenditure are based on a gross
(total project) costs.
Medium level of uncertainty. Some projects may attract funding from
other sources. These sources may include subsidies, grants or be part
funded by developers. This could have a significant impact on the final
cost of projects to the Council.
Graphs of forecast operational
expenditure are based on
anticipated gross cost to the
Council and include indirect costs
of providing the service (including
depreciation, interest costs and
overheads).
High level of uncertainty as revenue from operational activities is not
included and is difficult to forecast a long term. The potential impact
of this uncertainty is relatively low, as adjustments can be made to
budgets as trends in revenue are monitored and can be predicted
over the shorter term.
Hamilton needs an extra 12,500
houses over the next 10 years and
32,000 over the next 30 years to
meet the housing needs for extra
people
Medium level of uncertainty as based on independent demographic
projections. These could be materially impacted by unforeseen
changes to migration patterns – both international and domestic. This
could significantly alter the nature and timing of infrastructure
required to support growth.
NZ Transport Agency subsidies
continue as currently provided at a
rate of 51% subsidy for eligible
projects in analysis of Long-term
projections of Financial Strategy.
Medium level of uncertainty as based on assumed subsidy rates.
Changes to rates or project eligibility criteria would have a large
impact on the net cost of transport projects for the Council. This
would be particularly significant as there is a large amount of forecast
expenditure on transport over the 30-year period.
There will be no significant changes
to legislation that would impact on
the need for and nature of
infrastructure.
High level of uncertainty as some legislative change is probable over
the 30 years of the Strategy. The potential impact of future changes
could be high if legislation results in additional required expenditure
to comply with new standards, new funding opportunities /
mechanisms or if it requires the Council to deliver higher service levels
than planned at this point.
There will be no significant changes
to technology that would alter how
services are delivered or what
infrastructure is required.
High level of uncertainty as technological advancement is highly likely
over the next 30 years. This could have a major impact on the scope,
timing and costs of anticipated projects as new technologies may
deliver services in different ways through different types of
infrastructure
New resource consents for three
waters activities and the Waikato
High degree of uncertainty as the impact of Healthy Rivers planning
regime is new and was not in place when current consents were

DRAFT 2018-48 LONG-TERM INFRASTRUCTURE STRATEGY
73
Assumption Level of uncertainty and potential impact
River are renewed and with similar
conditions.
gained. If there was a requirement for significantly higher discharge
standards, this will likely result in the need for additional unplanned
expenditure.
There will not be any natural
disasters resulting in widespread
damage or remedial work to the
Council’s infrastructure.
Medium level of uncertainty as natural disasters cannot be foreseen
and can have a significant impact on infrastructure and financial
requirements for remedial works. While the Council is insured for
natural hazards, this would not fully cover the costs of a highly-
damaging event.
There is sufficient capacity within
the professional services and
contractor market to undertake the
capital programme.
High level of uncertainty as there are high levels of forecasted capital
expenditure from other central and local government agencies in the
upper North Island as well as ongoing strong demand for new housing
and development. Impact could be high as budgets may not be
sufficient to undertake the works as planned. Council has included a
higher inflation rate in its budget (specifically forecasted for the sub
region by BERL) to mitigate this risk.
There is no significant change to
service delivery models for any of
the activities in this Strategy.
Medium level of uncertainty as the Council is considering creating a
CCO for the operation and management of water and wastewater
services. However, this is currently on hold as Waipa District Council
are not wanting to progress a CCO option at this point.
Assumptions relating to each infrastructure activity area are provided in Appendices 1 to 4 of this
Strategy.

HAMILTON CITY COUNCIL
74
Appendix 1
ASSUMPTIONS FOR USEFUL LIVES OF ASSETS
Table: 9: Water
Asset group Useful life (years)
Bulkmain chambers 100
Backflow devices 40
Meters 15
Hydrants
Pre-1996
1996 or later
50
75
Aerial mains
Exposed or Aerial Pipes
Ducted Pipes
50
100
Pipes
Asbestos Cement
ALK
PVC – Rider Mains*
PVC - Other
PE, Cast and Ductile Iron Concrete Lined, Stainless Steel, MS
Case Iron
Copper
Ductile Iron
60 – 80
50
45 – 100
100
100
60
40
90
Valves 40-75
Reservoirs
Tanks
Building
Pipework
Electrical and Mechanical
80
15 – 100
15 – 60
15 – 30
Treatment Plant
Civil – Tanks, Building, Pipework, Metalwork
Electrical Services
Instrumentation
Mechanical Services
Pumps and Motors
100
25 – 40
15 - 30
25 – 40
40
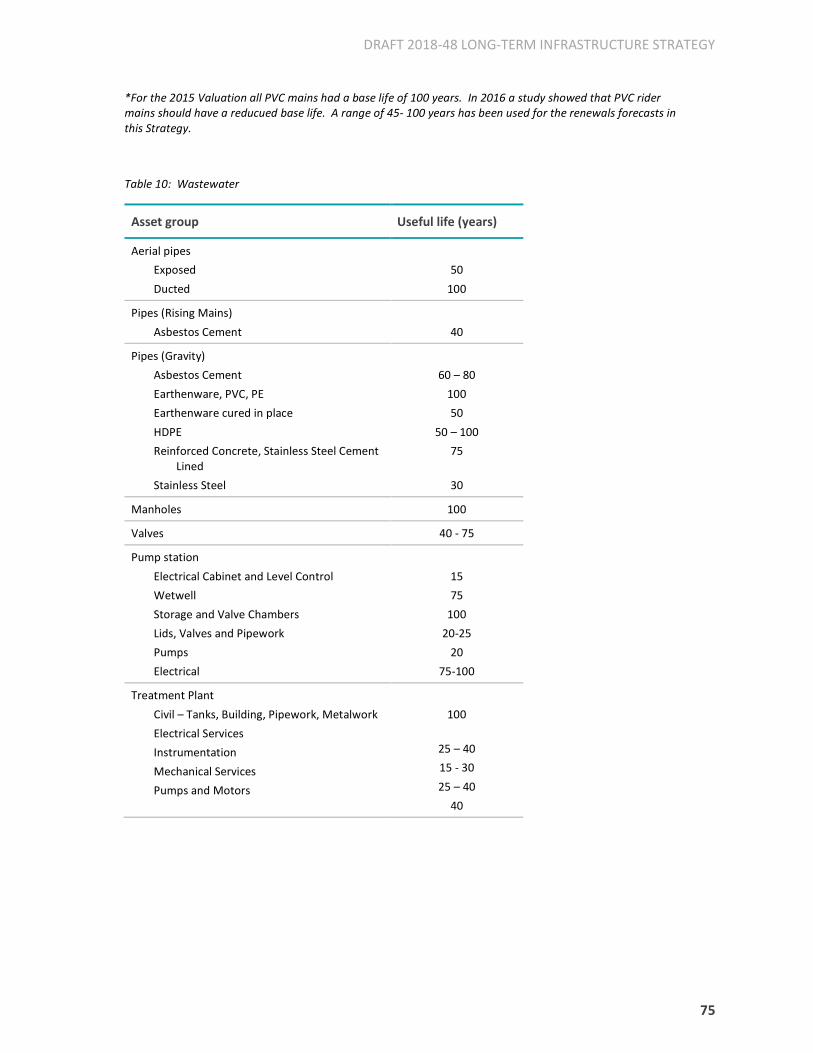
DRAFT 2018-48 LONG-TERM INFRASTRUCTURE STRATEGY
75
*For the 2015 Valuation all PVC mains had a base life of 100 years. In 2016 a study showed that PVC rider
mains should have a reducued base life. A range of 45- 100 years has been used for the renewals forecasts in
this Strategy.
Table 10: Wastewater
Asset group Useful life (years)
Aerial pipes
Exposed
Ducted
50
100
Pipes (Rising Mains)
Asbestos Cement
40
Pipes (Gravity)
Asbestos Cement
Earthenware, PVC, PE
Earthenware cured in place
HDPE
Reinforced Concrete, Stainless Steel Cement
Lined
Stainless Steel
60 – 80
100
50
50 – 100
75
30
Manholes 100
Valves 40 - 75
Pump station
Electrical Cabinet and Level Control
Wetwell
Storage and Valve Chambers
Lids, Valves and Pipework
Pumps
Electrical
15
75
100
20-25
20
75-100
Treatment Plant
Civil – Tanks, Building, Pipework, Metalwork
Electrical Services
Instrumentation
Mechanical Services
Pumps and Motors
100
25 – 40
15 - 30
25 – 40
40
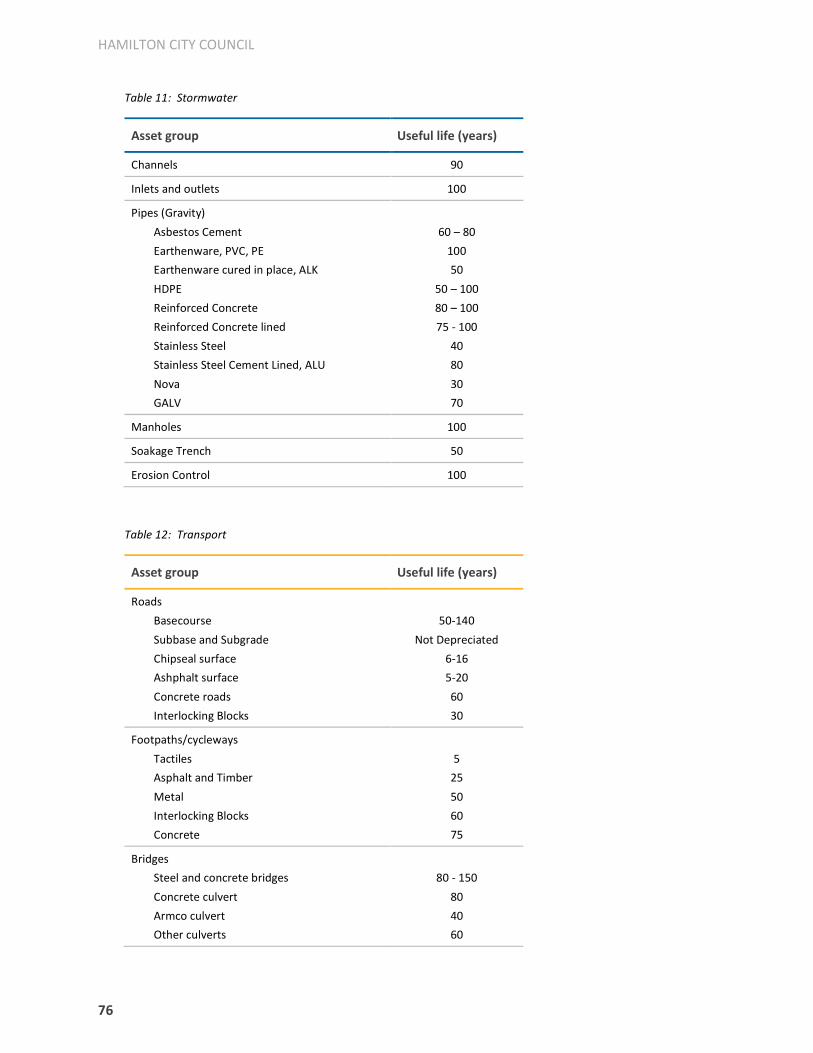
HAMILTON CITY COUNCIL
76
Table 11: Stormwater
Asset group Useful life (years)
Channels 90
Inlets and outlets 100
Pipes (Gravity)
Asbestos Cement
Earthenware, PVC, PE
Earthenware cured in place, ALK
HDPE
Reinforced Concrete
Reinforced Concrete lined
Stainless Steel
Stainless Steel Cement Lined, ALU
Nova
GALV
60 – 80
100
50
50 – 100
80 – 100
75 - 100
40
80
30
70
Manholes 100
Soakage Trench 50
Erosion Control 100
Table 12: Transport
Asset group Useful life (years)
Roads
Basecourse
Subbase and Subgrade
Chipseal surface
Ashphalt surface
Concrete roads
Interlocking Blocks
50-140
Not Depreciated
6-16
5-20
60
30
Footpaths/cycleways
Tactiles
Asphalt and Timber
Metal
Interlocking Blocks
Concrete
5
25
50
60
75
Bridges
Steel and concrete bridges
Concrete culvert
Armco culvert
Other culverts
80 - 150
80
40
60

DRAFT 2018-48 LONG-TERM INFRASTRUCTURE STRATEGY
77
Asset group Useful life (years)
Minor Structures
Bus shelter and fences
Underpasses
20
80
Guardrail and Railing 20 – 25
Retaining Walls
Block wall, cantilever, crib wall, rock
Post and Rail, Sheet Pile
100
50
Drainage – kerb and channel, swales and drains 60-70
Signs 15
Street lights
Pole and Bracket
Light – LED
Light – non-LED
25
50
25
Traffic Signals 15
Features
Bins
Seats and Public Information Sign
Bollards
Cycle Stand
Concrete Block
10
20
25
20 - 30
100
Islands
Raised Platform – Printed
Raised Platform – Paved
All others
20
60
35
Carparks
Basecourse
Subbase and Subgrade
Surface
Concrete
Parking Equipment
110
Not depreciated
10 – 18
60
15

HAMILTON CITY COUNCIL
78
Table 13: Parks and Green Spaces
Asset group Useful life (years)
Access 5-50
Artwork 50
Carparks 7 – 100
Cemetery Burial and Ash Lawn 100
Crematorium Equipment 20 – 40
Electrical 10 – 45
Entry Points 25 – 75
Fences 10 – 100
Furniture 20 – 50
Gates 10 – 50
Gardens 5 – 15
Hardscapes 25 – 50
Irrigations Systems 10 – 30
Lights 25
Landscapes Not Depreciated
Playground Equipment 15 – 50
Plaques 50 – 80
Paths 10 – 50
Roads 10 – 100
River Structures 10 – 50
Security System 10
Sportsfields 7 – 100
Signs 10 – 30
Structures 8 – 100
Stormwater 15 – 80
Turf Drainage 5 – 25
Water Features 10 – 50
Walls 5 - 150
Youth Facility Equipment 30
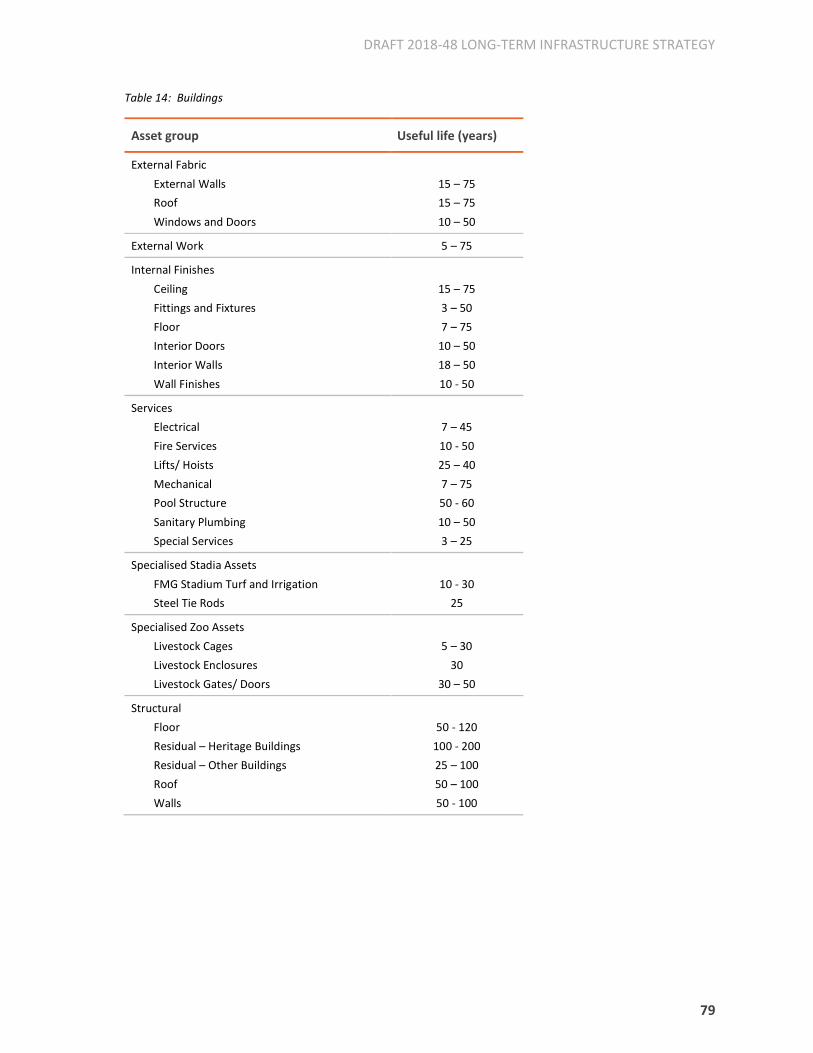
DRAFT 2018-48 LONG-TERM INFRASTRUCTURE STRATEGY
79
Table 14: Buildings
Asset group Useful life (years)
External Fabric
External Walls
Roof
Windows and Doors
15 – 75
15 – 75
10 – 50
External Work 5 – 75
Internal Finishes
Ceiling
Fittings and Fixtures
Floor
Interior Doors
Interior Walls
Wall Finishes
15 – 75
3 – 50
7 – 75
10 – 50
18 – 50
10 - 50
Services
Electrical
Fire Services
Lifts/ Hoists
Mechanical
Pool Structure
Sanitary Plumbing
Special Services
7 – 45
10 - 50
25 – 40
7 – 75
50 - 60
10 – 50
3 – 25
Specialised Stadia Assets
FMG Stadium Turf and Irrigation
Steel Tie Rods
10 - 30
25
Specialised Zoo Assets
Livestock Cages
Livestock Enclosures
Livestock Gates/ Doors
5 – 30
30
30 – 50
Structural
Floor
Residual – Heritage Buildings
Residual – Other Buildings
Roof
Walls
50 - 120
100 - 200
25 – 100
50 – 100
50 - 100

HAMILTON CITY COUNCIL
80
Table 15: Community and Events Operational Assets
Asset group Useful life (years)
Libraries
• Lending Collection
• Heritage Collection
3 - 8
Held in perpetuity
Aquatic Facilities (note: pool structure is included
with building assets)
• Electrical Services
• Plumbing Elements
• Pumps and Heat Exchanger
• Fitness Equipment
10 – 30
20 – 30
10 – 30
7 – 10
Museum
• Public Art
• Collection
• Operational Assets
20 – 50
50 – 100
10 - 30
Events (note: the FMG turf is included with
building assets)
• Technical Equipment
• Turf Equipment
• Plant and Equipment
2 – 20
8 – 15
15 - 20
Park Type assets in community and events are in
line with the Parks and Garden assets
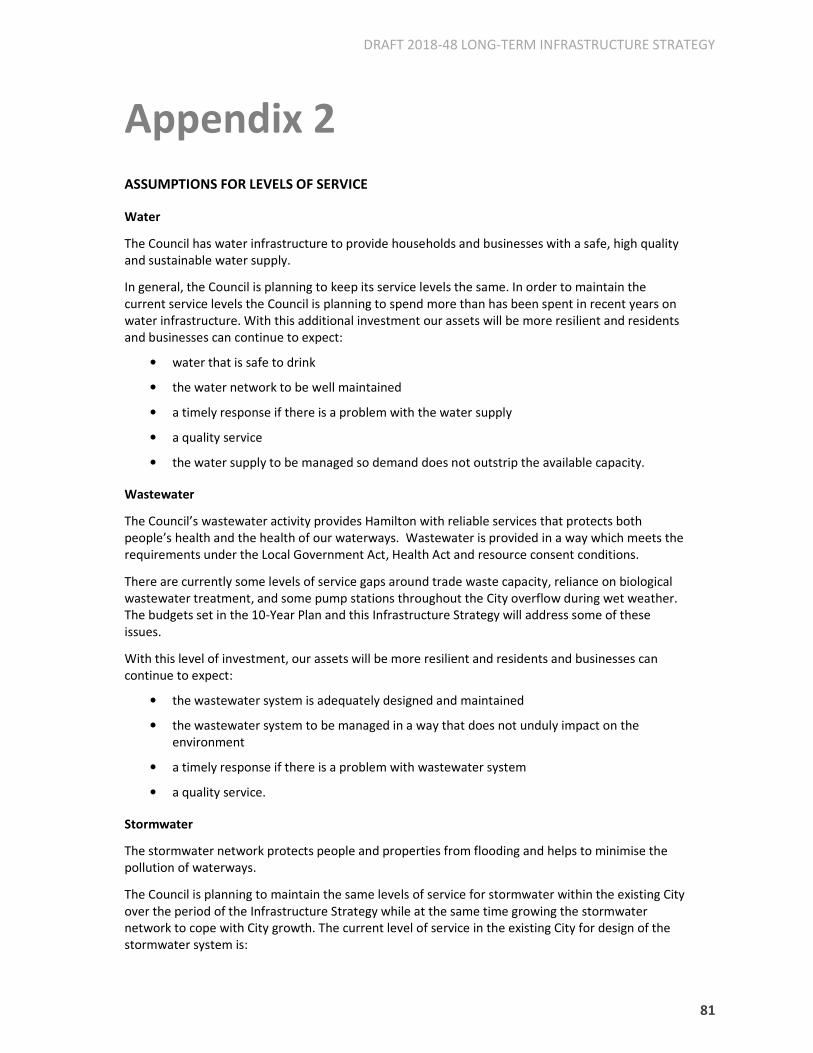
DRAFT 2018-48 LONG-TERM INFRASTRUCTURE STRATEGY
81
Appendix 2
ASSUMPTIONS FOR LEVELS OF SERVICE
Water
The Council has water infrastructure to provide households and businesses with a safe, high quality
and sustainable water supply.
In general, the Council is planning to keep its service levels the same. In order to maintain the
current service levels the Council is planning to spend more than has been spent in recent years on
water infrastructure. With this additional investment our assets will be more resilient and residents
and businesses can continue to expect:
• water that is safe to drink
• the water network to be well maintained
• a timely response if there is a problem with the water supply
• a quality service
• the water supply to be managed so demand does not outstrip the available capacity.
Wastewater
The Council’s wastewater activity provides Hamilton with reliable services that protects both
people’s health and the health of our waterways. Wastewater is provided in a way which meets the
requirements under the Local Government Act, Health Act and resource consent conditions.
There are currently some levels of service gaps around trade waste capacity, reliance on biological
wastewater treatment, and some pump stations throughout the City overflow during wet weather.
The budgets set in the 10-Year Plan and this Infrastructure Strategy will address some of these
issues.
With this level of investment, our assets will be more resilient and residents and businesses can
continue to expect:
• the wastewater system is adequately designed and maintained
• the wastewater system to be managed in a way that does not unduly impact on the
environment
• a timely response if there is a problem with wastewater system
• a quality service.
Stormwater
The stormwater network protects people and properties from flooding and helps to minimise the
pollution of waterways.
The Council is planning to maintain the same levels of service for stormwater within the existing City
over the period of the Infrastructure Strategy while at the same time growing the stormwater
network to cope with City growth. The current level of service in the existing City for design of the
stormwater system is:
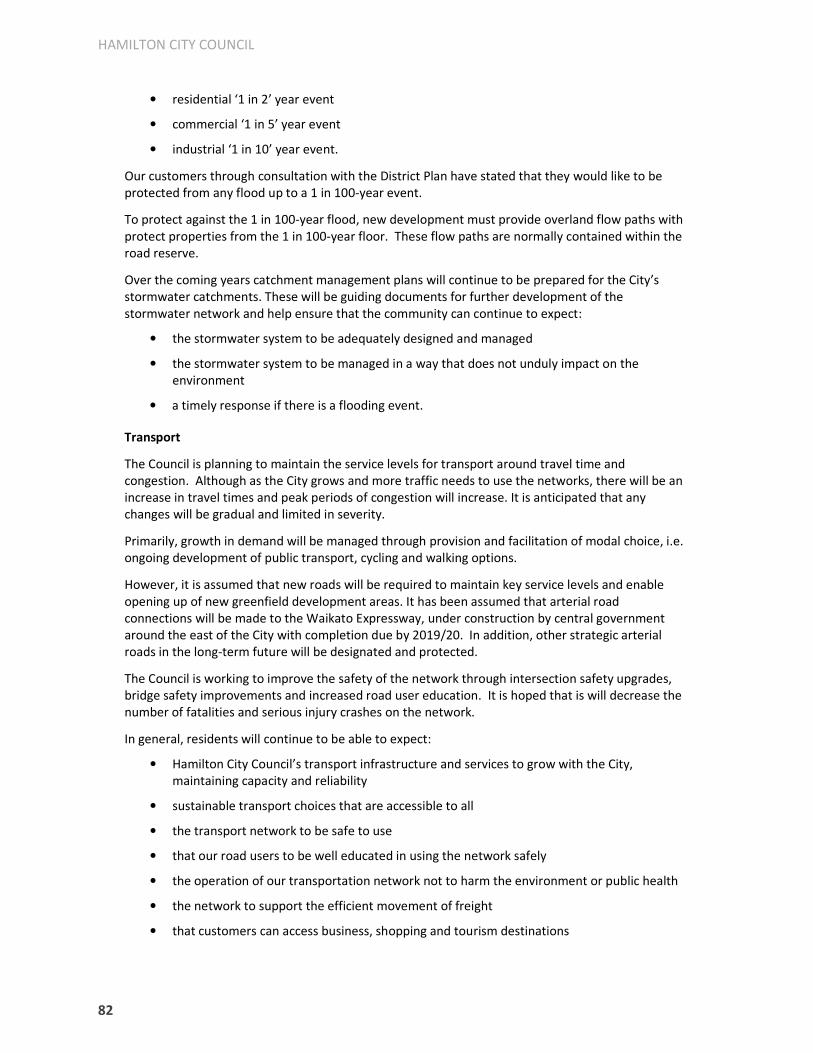
HAMILTON CITY COUNCIL
82
• residential ‘1 in 2’ year event
• commercial ‘1 in 5’ year event
• industrial ‘1 in 10’ year event.
Our customers through consultation with the District Plan have stated that they would like to be
protected from any flood up to a 1 in 100-year event.
To protect against the 1 in 100-year flood, new development must provide overland flow paths with
protect properties from the 1 in 100-year floor. These flow paths are normally contained within the
road reserve.
Over the coming years catchment management plans will continue to be prepared for the City’s
stormwater catchments. These will be guiding documents for further development of the
stormwater network and help ensure that the community can continue to expect:
• the stormwater system to be adequately designed and managed
• the stormwater system to be managed in a way that does not unduly impact on the
environment
• a timely response if there is a flooding event.
Transport
The Council is planning to maintain the service levels for transport around travel time and
congestion. Although as the City grows and more traffic needs to use the networks, there will be an
increase in travel times and peak periods of congestion will increase. It is anticipated that any
changes will be gradual and limited in severity.
Primarily, growth in demand will be managed through provision and facilitation of modal choice, i.e.
ongoing development of public transport, cycling and walking options.
However, it is assumed that new roads will be required to maintain key service levels and enable
opening up of new greenfield development areas. It has been assumed that arterial road
connections will be made to the Waikato Expressway, under construction by central government
around the east of the City with completion due by 2019/20. In addition, other strategic arterial
roads in the long-term future will be designated and protected.
The Council is working to improve the safety of the network through intersection safety upgrades,
bridge safety improvements and increased road user education. It is hoped that is will decrease the
number of fatalities and serious injury crashes on the network.
In general, residents will continue to be able to expect:
• Hamilton City Council’s transport infrastructure and services to grow with the City,
maintaining capacity and reliability
• sustainable transport choices that are accessible to all
• the transport network to be safe to use
• that our road users to be well educated in using the network safely
• the operation of our transportation network not to harm the environment or public health
• the network to support the efficient movement of freight
• that customers can access business, shopping and tourism destinations

DRAFT 2018-48 LONG-TERM INFRASTRUCTURE STRATEGY
83
• the network to be kept in good operating condition
• customer service requests to be responded to promptly
Parks and Green Spaces
Some minor changes have been planned for and expenditure estimates include changes to the
following service levels:
• Improving the quality of the City’s playgrounds over the next 30 years for an improved play
experience. The number of neighbourhood playgrounds will be reduced over this period.
• Increasing the number of public toilets at sports parks.
• Improving the quality of sports fields through improvements to drainage and increased
irrigation, in turn increasing the amount of time fields can be used for organised sports.
• Reintroduction of a planned street tree maintenance and street tree planting renewal
programme to reduce the number of customer complaints and service requests relating to
trees.
• New themed gardens at Hamilton Gardens will be built in line with the Hamilton Gardens
Development Plan.
• The implementation of the Hamilton Park Cemetery Concept Plan. This includes a new
combined Reception, Lounge and Administration facility, public Mausoleum and Committal
Shelter and children’s burial area.
In general, residents will continue to be able to expect:
• a unique garden experience at Hamilton Gardens
• access to a local community space for leisure and arts participation at Hamilton Gardens
• the Nursery to save the Council money so that more plants can used to support the
preservation and enhancement of Hamilton’s natural green environments
• a network of parks for recreation and green space throughout the City
• a well-distributed network of safe and fun playgrounds
• sports fields that are well-maintained and fit for purpose
• public toilets and changing rooms to be safe, maintained and well located
• Hamilton is a green city with parks, trees, beautiful gardens and street plantings
Community and event facilities
The community and event infrastructure covered in this plan helps to make Hamilton a highly
liveable city. This Strategy has been prepared on the assumption the service levels for the following
activities are maintained to the current standard unless stated in the following table

HAMILTON CITY COUNCIL
84
Table 16: Changes in Levels of Service
Activity The community can expect … Planned increases or decreases in the levels of service
Aquatic Facilities • Aquatic Facilities that can be used for local and regional swim
meetings, and person and group fitness
• Learn to Swim and Water Safety Education programmes at out
aquatic facilities
• Access to recreational swimming facilities
• The implementation of the North Arena Learn to Swim
programme is expecting to improve the quality of the swimming
lessons and increase the number of students attending.
Community Facilities • Expect community facilities to be safe and accessible
• No change
H3 • Venues are well utilised and provide multiple opportunities for
people to attend events
• Quality events are provided that people want to attend
• Venues attract national and international events
• Venues and services provide a quality experience for event
attendees
• Venues and services provide a quality experience for hirer’s
• A new Regional theatre is provided by a third party (The Council
contributes operational grants to assist with construction and
ongoing maintenance).
Hamilton Zoo • To see a wide variety of animal species at the Hamilton Zoo
• A safe environment to be provided
• Opportunities to learn about wildlife, living sustainably and
conservation at Hamilton Zoo
• Hamilton Zoo to provide quality animal care and contribute to
protecting and conserving wild animals and plants
• The Zoo Master Plan is implemented progressively and entrance
integrated with the Waiwhakareke Natural Heritage Park.
Library • That libraries to provide programmes and events that support
literacy and promote reader development
• Libraries that are safe welcoming and attractive community
spaces
• New Library at Rototuna to service the North East of the City
• The number of community services offered through the libraries
will increase each year
• The ratio of e-books to print collection items purchased will

DRAFT 2018-48 LONG-TERM INFRASTRUCTURE STRATEGY
85
Activity The community can expect … Planned increases or decreases in the levels of service
• Libraries that provide collections and technology that meet the
communities need for learning
• The Council records to be stored for current and future
generations
• The City’s Heritage Collection to be available for future
generations
increase from 22% to 30% by 2020/21
• The City’s Heritage will be progressively digitised and available
digitally for public access.
Waikato Museum • The Waikato Museum to offer a range of quality exhibitions and
experiences
• Supporting programmes and resources that align to the New
Zealand curriculum
• The Museum to hold public events and programmes
• Waikato Museum to be the guardian/kaitiaki for historically
significant collections including Tainui taonga
• Elements of the Museum Strategic Plan will be implemented
progressively over time with a focus on connecting to Waikato
River.

HAMILTON CITY COUNCIL
86
Appendix 3
ASSUMPTIONS FOR RENEWAL OF ASSETS
GENERAL
An asset is renewed or rehabilitated when it reaches the end of its useful life. A ‘useful life’ is
determined through a combination of the following:
• An assets theoretical useful life as determined by the manufacturer
• Condition of the asset deteriorates to a point where it is no longer economical to maintain
the asset
• When technology that the asset is based on becomes obsolete
• When the asset can no longer carry out the function that it was intended to do
The following asset parameters are assessed in order to develop the renewals programme:
• Material type (either known or assumed)
• Asset Age
• Asset Condition (e.g. sample analysis, visual inspections)
• Asset Performance (e.g. pipe bursts, leaks, valves not working, blockages and flooding)
• Asset Criticality
In addition, other programmes of work assets are considered to ensure the same asset is not
identified for renewal by two different programmes and the timeframes for renewal are aligned. For
example, the footpath replacement programme and water reticulation renewal would be aligned to
ensure that a new footpath was not being dug up to renewal a water pipe.
Occasionally an asset will fail prior to its expected end of life, when this occurs we either:
• Carry out reactive maintenance to immediately return it to service, or
• It is prioritised against the planned programme and renewed accordingly.
WATER, WASTEWATER AND STORMWATER
Significant renewal programmes of work are described in methodology statements for each asset
type as outlined below.
Water Pipes: Material type is the main parameter used in developing the renewals programme, as it
is the predominant factor influencing the anticipated asset life. The renewals programme
methodology only utilises condition data for AC water mains, as this the only data currently
available. Asset performance is assessing using the number of historical failures of an asset e.g. pipe
bursts. Pipe criticality has not been used in the pipe renewal programme but will be considered in
the future. Generally, when a pipe is replaced, all hydrants, valves and connections are also
replaced.
Water Connections: These are normally replaced with the reticulation pipe. We also carry out
connection renewals prior to footpath replacements where there is a need to do so.

DRAFT 2018-48 LONG-TERM INFRASTRUCTURE STRATEGY
87
Water Valves, Hydrants and Meters: This programme is only for those assets that are not due to be
replaced within 10 years of their associated watermain. The programme for renewals has been
determined using past performance. The physical works are undertaken once the annual condition
assessment programme is completed.
Water Backflow Devices: The Health Act requires backflow devised to protect the public supply
must be tested annually. At present there are no comprehensive renewals or testing programme for
testable backflow devices.
Wastewater Pipes: The wastewater pipe renewals programme development and optimisation is
based on a combination of base life, CCTV condition rating, and blockage report from IPS. All
pipelines with four of more blockages were investigated. Also, all the Council grid areas with more
than 20 blockages were investigated along with sites recommended by operations staff. The outputs
and recommendations from the Wastewater Master Plan and Wastewater Hydraulic Model are also
taken into account.
Based on the above, an initial programme has been developed targeting aged pipes within the
reticulation. In the 2015-25 LTP 10 Year Plan a unit rate per metre was assigned to mains to include
the replacement of manholes. In the 2018-28 10 Year Plan the manholes have been programmed
separately and the costs associated with replacement added to the funding requirements. There has
been a programme in place to replace all of the AC rising mains by 2021/22 due to their poor
condition.
There is a large peak of renewals due in 2025, primarily due to a large amount of 1925 Earthenware
(EW) pipes coming to the end of their base life. To reduce the peak the works program has been
spread over a 10 year period. Actual condition of pipes will be taken into consideration to manage
the pace of replacement around this period.
The assets excluded from this renewals forecast are:
• Wastewater Valves as the total value of these is $35,000. Further work is required in
defining these assets in the database.
• Pipe supports for pipe bridges as the data was not available. Currently in IPS, many of these
are listed as assets not owned by City Waters. Refining and verifying this information is one
of the future asset data improvement actions.
Stormwater Pipes: The stormwater pipe renewals programme is based on a combination of base
life, CCTV condition rating, flooding report from IPS, and blockage report from IPS. All pipelines with
four of more blockages were investigated. Also, smaller areas with more than 20 blockages were
investigated along with sites recommended by operations staff. The outputs and recommendations
from the Stormwater Master Plan are also taken into account. Replacement of Stevenage pipes are
prioritised as these have been found to be structurally unsound and at risk of failing earlier than
expected.
Due to the uncertainty over asset age there are peaks in the renewals profile, particularly in 2020.
The renewal forecast has spread this peak over a 10-year period to even out the expenditure profile.
The level of renewals increases significantly after 2040 as this is when pipes installed in the 1960’s
and 1970’s are due for renewal.
The assets excluded from this renewals forecast are:
• Fish Passages –the Operations team is working with other Council departments, NIWA and
Waikato Regional Council to develop the renewals/upgrade programme for fish passages
that are required under the Comprehensive Stormwater Discharge Consent.

HAMILTON CITY COUNCIL
88
• Erosion Protection Assets – There is currently insufficient asset information available to
develop a renewals profile for these assets.
• Open Drains - There is currently insufficient asset information available to develop a
renewals profile for these assets. These will probably not be renewed.
• Planting - There is currently insufficient asset information available to develop a renewals
profile for these assets. Also, a policy of if the replanting will be capital or maintenance
needs to be developed.
Wastewater Pump Stations: The pump station renewals programme is based on:
• Asset age, material type and base life from IPS
• Performance monitoring of pump stations and their faults
• Condition assessment through annual inspections
• Outstanding As-built data affecting the results of the data sets from IPS
• The outputs and recommendations of the Wastewater Master Plan
The majority of the Council pump stations have two or more pumps. Therefore, the Council is able to
allow one pump to fail before it is replaced and have spares available for when unplanned failures
occur.
Water and Wastewater Treatment Plant and Water Reservoirs: A BIM system is being implemented
for treatment plant and reservoirs assets to improve capture of inventory data, maintenance
activities and condition assessments. A 50-year renewal programme was developed using the
following methodology:
• Development of an initial list of projects based on staff knowledge of works that are
required to be done, this will include priority projects as well as requests for improvements.
• Asset data types and quantities will be extracted from Maintenance Connection and the
programme developed based on general life expectancy of those assets types.
• High level scopes were prepared to enable prioritisation and costs estimated to be
developed. The scopes include but not be limited to: whether investigation and design is
required, justification for the works, whether there are any special considerations that may
affect costs e.g. construction complexity or major process isolation, initial estimation of
costs (potentially into categories, high, medium or low).
• The programme was prioritised with input from stakeholders.
• A cost estimate was developed with assistance from external experts.
• Final programme developed.
Once a complete asset register is available for the treatment plant and water reservoirs, it is planned
to develop a component level criticality framework. Key items in terms of consideration are process
criticality, redundancy, resilience and maintenance criticality. When the criticality of the treatment
plants and reservoirs assets is assigned the following policy will be adopted:
• Critical Assets – Planned renewal
• Non-critical Assets – Run to failure.
Resource Consents: The resource consent renewal programme methodology is based on existing
consents and identified required new resource consents. Expiry dates are documented to determine
the financial year in which a new consent is required. It is expected that lodgement of the consent is
done a minimum of six months prior to when the consent is required/expired to ensure continued
use rights. For significant consents such as water takes, funding for detailed investigations and
hearing processes need to be scheduled a minimum of 2 years in advance. Where significant

DRAFT 2018-48 LONG-TERM INFRASTRUCTURE STRATEGY
89
scientific justification to support an Assessment of Environmental Effects (AEE) is required (eg
monitoring program), the schedule should be established a minimum of 3 years in advance.
The renewal of our wastewater discharge consent for the disposal of treated effluent to the Waikato
River from our wastewater treatment plant is planned to commence from 2023/24. The resource
consent lodgement and approval process is expected to take three years at an estimated cost of $1.8
million.
Water and Wastewater Model: Network models are a key tool for assessing network performance,
identifying deficiencies and assessing proposed solutions. It is planned to regularly update the
network models to include updated population projections, amending for any asset additions or
operational changes and recalibration as and when required.
Deferred Renewals
The water supply network renewal programme has identified that there are a number of assets that
have already exceeded their expected lives and have been scheduled for renewal in the first year of
the programme. This peak in renewals is largely due to revised base lives due to improved asset
management information, not that renewals previously identified have not being funded or carried
out. Assumptions on asset construction dates can also create peaks in the age related renewal
profile. Renewals for pipes, valves, hydrants and meters have been smoothed over the first 10 years
of the forecast so that any renewals backlog is addressed by the end of year 10.
TRANSPORT
The maintenance and operation of the transport network is undertaken by the Council’s
Infrastructure Alliance. Where applicable some services are delivered in collaboration with
neighbouring roading authorities, under a Waikato Road Asset Technical Accord (RATA).
Significant renewal programmes of work are described in methodology statements for each asset
type Typically a methodology will include:
• Data collection and preparation –All Faults data may be sourced and RAMM condition
rating, data surveys etc.
• Data analysis and scenario modelling - modelling (e.g. dTIMS) is used to optimise total
investment levels, comparing a range of renewal versus maintenance cost scenarios to find
the lowest total cost option.
• Field validation and model alignment
• Outcome verification
• Final programme formulation
As the transport asset is used over the years, its condition and performance is monitored to ensure
that the asset is replaced at the most cost-effective time. To help in this assessment the Council:
• uses asset age information to identify assets for more detailed assessment
• monitors the performance of assets to help identify where there might be issues
• undertakes physical inspection and technical condition testing of assets
• use customer complaints to identify asset failures
• uses the Waikato Regional Traffic Model to predict future traffic demand, levels of service
and asset improvement requirements

HAMILTON CITY COUNCIL
90
• uses asset condition and performance information to develop maintenance and renewal
programmes to ensure expenditure on assets is done at the most cost-effective time.
The Road Assessment and Maintenance Management (RAMM) database is used to hold and manage
our transport network asset information.
As part of a maturity assessment in 2017 the asset data held in RAMM was assessed as reasonably
reliable and was given a score of intermediate/advanced. There are good processes in place for
maintaining the data held in RAMM.
PARKS AND GREEN SPACES
Better information on the condition and performance of assets in recent years has allowed for more
robust renewal forecasts to be prepared. This information has been used in developing the forecasts
in the Parks and Open Spaces asset management plan (AMP), Hamilton Gardens AMP, The
Cemeteries and Crematorium AMP and subsequent 2018-28 10-Year Plan budgets.
The operational/non-building asset renewal programme for Parks and Green Spaces was created
using the following methodology:
• Staff assessed an initial proposed renewal year based on:
• Asset Condition
• Performance Assessment – in terms of functionality, capacity and utilisation.
• Priority Areas – prioritising high use areas over lower profile and lower use parks.
• Combining Renewals – can we combine renewals for efficiency and impact
• Alignment to Other Projects and key strategies and plans
• Staff Knowledge – taking into account first-hand knowledge of Parks and assets.
• Known deferred renewals
• Round table sessions to evaluate the programme put forward.
• Further Moderation – achievability
o Further moderation took place, identifying renewals that could be deferred, areas of
data uncertainty and opportunities to explore decommissioning assets.
o Finally smoothing and grouping took place. This was to ensure the renewals
programme could be undertaken if funding was secured and impact on the public
was at a minimum. For example, grouping all the renewals in a park in the middle
year as opposed to carrying out renewals each year for three years.
The renewal programme development and moderation process highlighted the volume of assets
that have exceeded their useful lives. This highlighted two points:
• Due to budget constraints some renewals and maintenance of park assets has been deferred
in previous years.
• Useful lives require further refinement to ensure they are accurate.
Overall, the proposed budget for parks and green space asset renewals has increased from the
previous 10-Year Plan. This is generally due to improved asset management data, analysis and
practices. Renewals have been based on up-to-date condition data and improved asset knowledge.
COMMUNITY AND EVENT FACILITIES

DRAFT 2018-48 LONG-TERM INFRASTRUCTURE STRATEGY
91
The Council owns and maintains a significant amount of building infrastructure to deliver its
community and events services to the community. These buildings range in age and use.
Both asset condition and performance information is used to determine when a renewal is required
for the facility.
Appendix 1 is a list of expected lives that have been used for community and event facilities and
other types of assets. These are used as a basis for developing the projected renewal needs.
As the asset is used over the years its condition is monitored to ensure that the asset is replaced at
the most cost-effective time. Decisions on the priority of replacements and renewals of assets are
identified mainly on the basis of:
• periodic reviews of asset condition
• feedback from users on appropriateness of venues and building infrastructure for activities
• need for upgrades to increase or maintain revenue from users.

HAMILTON CITY COUNCIL
92
Appendix 4
ASSUMPTIONS FOR GROWTH IN DEMAND
Water
Infrastructure that is required to provide for growth is forecasted through analysing a combination
of:
• population projections
• hydrological network and process modelling
• capacity reviews at the treatment plant
• strategic network and treatment plant requirements determined through Master Plans
• engagement with central government, regional council and neighbouring councils on future
infrastructure requirements
• developing integrated catchment management plans (ICMPs) which will identify issues and
propose best practicable solutions for growth on a catchment basis.
Key water infrastructure assets that are anticipated to provide for growth include:
• network extensions for greenfield growth cells
• capacity and quality upgrades in the future of our water treatment plant
• new reservoirs to support growth
• specific network capacity improvements within the localised pipe network
• integration of new vested infrastructure into our networks.
Wastewater
Planning for wastewater infrastructure assets to provide for new growth in the City has assumed
that:
• new greenfield areas of the City will be serviced through the main reticulated network and
existing treatment plant rather than standalone wastewater package plants
• wastewater assets from new development will be added to the existing reticulated network
resulting in necessary interceptor and trunk extensions for greenfield growth cells
• capacity upgrades of our water treatment plant will be required to accommodate growth
• there will be a need to increase the capacity of the existing network resulting in the need
for a number of large inline storage tanks.
Projected population and resulting wastewater volumes have been based on the Council’s growth
model using population projections prepared by National Institute of Demographic and Economic
Analysis (University of Waikato).
No allowance has been made for new wet industry in the City as these have unique requirements
that are not known until a specific proposal is put forward for consideration.
Stormwater

DRAFT 2018-48 LONG-TERM INFRASTRUCTURE STRATEGY
93
Integrated catchment management plans are being developed for each of the City’s stormwater
catchments to make sure stormwater infrastructure is planned, developed and managed in the most
efficient and practicable way for the specific catchment. There are different options for dealing with
stormwater and the most efficient approach depends on the specific catchment.
The Council has consent from Waikato Regional Council for its stormwater discharges into the
Waikato River. This consent is for the urban catchments within Hamilton and authorises the
discharge of stormwater from ‘existing’ developed areas. Any new discharges will only be approved
if they are supported by an approved catchment management plan.
The purpose of these plans in relation to stormwater is to:
• provide guidance to developers and regulatory bodies on how stormwater from new
developments will be managed and integrated with other water services and proposed
future land uses.
• minimise the need for stormwater treatment and detention devices.
• propose opportunities for the reuse of stormwater to reduce water demand.
• minimise stormwater and the effects of urbanisation on river and streams.
• lessen flood hazards on private property
• involve other stakeholders (such as tangata whenua, recreational and local interest groups)
who may wish to contribute to the management of the catchment’s waterbodies.
Transport
Transportation demand results from the need for people and goods to move around and through
the City. Key influences include population growth, land use patterns, density and use of alternative
transport options. Projected population and resulting traffic volumes have been based on the
Council’s growth model using population projections prepared by National Institute of Demographic
and Economic Analysis (University of Waikato) and the Waikato Regional Traffic Model (WRTM).
The services we will provide include:
• influencing and managing the transportation aspects of subdivision and land use
development
• encouraging alternative travel choices, so that people can choose to walk or cycle rather
than drive cars
• encouraging the development and use of public transport systems and providing more bus
and high occupancy vehicle priority where appropriate.
• planning ahead to ensure that transport corridors are in place for new growth and that the
existing roads and facilities have the capacity for our increasing population
Planning for transport infrastructure assets to provide for new growth in the City has assumed that:
• development in the existing City will largely be serviced through the current network
• new development in greenfield growth cells may result in the need for capacity and safety
improvements to existing arterial/collector roads
• the growth forecasts and assumed settlement pattern provide uneven demand growth on
the network
• the location of residential growth within the City will influence the way that the residents
access jobs, education and other daily needs

HAMILTON CITY COUNCIL
94
• freight movement is expected to increase over the next 10 years
• with a higher importance being put on healthy lifestyle there is an increase in demand for
walking and cycling facilities.
More detail on specific projects in the Infrastructure challenges and Focus Areas section.
Parks and Green Spaces
Infrastructure required to provide for growth is anticipated through analysing a combination of:
• population projections
• current and future trends for organised sport
• capacity review of sports fields.
Key open space infrastructure assets that are anticipated to provide for growth include:
• Purchase of land for future reserves identified in structure plans and committed to in past
consents. In developing the Infrastructure Strategy it has been assumed the Council will
purchase and develop future parks.
• New playgrounds and toilets are developed in greenfield growth cells
• Development of Rototuna, Mangaiti, Rototuna West and Rotokauri sports parks and Te
Manatu park into a passive park.
Community and event facilities
The community and event related infrastructure provides services to both Hamilton and surrounding
areas. Infrastructure required to provide for growth is anticipated through analysing a combination
of:
• population projections
• current and future trends for passive and active recreation and organised sport
• commissioned research and studies that assess future demand for services and
infrastructure.
Much of the current community and event infrastructure is adequate to meet the needs of a larger
population. However, over the period of the Infrastructure Strategy increases in capacity to meet
demands of growth are required for:
• aquatic facilities
• library services.

DRAFT 2018-48 LONG-TERM INFRASTRUCTURE STRATEGY
95
Appendix 5
IDENTIFYING SIGNIFICANT CAPITAL EXPENDITURE DECISIONS
The following capital decisions relating to infrastructure over the next 30-years have been identified
as significant. These are discussed Our infrastructure challenges and focus areas section.
• Renewal Programme each 10YP
• Seismic Strengthening work
• Water demand management Intervention
• Works for water consent renewal in 2044
• Works for wastewater consent renewal in 2027
• Second water treatment plant
• Greenfield investment focus in Peacocke
• Greenfield investment focus in Rotokauri
• Norther river bridge crossing
• Cross city connector
• 4-Laning Ring road
• Greenfield investment focus in future cell
• Prioritising new City Improvements
• Prioritising Transport Improvements
In considering what capital decisions the Council will need to make in the next 30 years are
significant, the drivers for the projects identified in AMPs and 10-Year Plan draft budget processes
have been considered. Where there are key decisions of the Council that will have a major impact on
driving capital expenditure these have been grouped together – for example the decision to extend
strategic infrastructure into a growth cell to enable new development.
Other projects or programmes have been identified as significant capital decisions given the public
interest of these decisions. These are often projects where there may be obvious public impact or
there has been, or likely to be, significant public involvement in the decision-making process.
Decisions have been identified as significant in this Infrastructure Strategy where there is substantial
effect on:
• Changes to future service levels
• The Council finances
• Ability to reverse a decision.
• Potential for major inconsistency with a prior decision / position of the Council.
• Known high levels of public interest.
• Extent of community that may be impacted.

HAMILTON CITY COUNCIL
96
Appendix 6
DATA RELIABILITY
The following infrastructure grading guidelines have been used to assess the data reliability for the
information that is used for asset management and to create the financial forecasts for this Strategy.
Table 17: Data Reliability Criteria
GRADE LABEL DESCRIPTION
A Highly Reliable Data based on sound records, procedure, investigations and analysis which is
properly documented and recognised as the best method of assessment.
B Reliable Data based on sound records, procedure, investigations and analysis which is
properly documented but has minor shortcomings.
C Uncertain Data based on sound records, procedures, investigation and analysis which are
incomplete or unsupported, or extrapolations from limited sample of which
grade A or B data is available.
D Very Uncertain Data base on unconfirmed verbal report and/or cursory inspection and
analysis.
The data reliability for the assets included in this Strategy are shown in the table below.
Table 18: Data Reliability
ASSET GROUP GRADE COMMENT
WATER
Water Treatment
Plant and
Reservoirs
D Asset data is incomplete, with approximately 80% of civil, mechanical and
structural assets captured. Attribute information such as pump size is missing.
No asset information is available for electrical or SCADA assets. A major
project is underway to capture asset data in BIMS.
Water Network B to C The data for the pipes, hydrants and valves is good. Just minor data missing
such as pipe bridge support data, some bulkmain chamber data and the length
and diameter is assumed for some water services lines.
WASTEWATER
Wastewater
Network
B The data for the pipes and manholes is good. However, depth data not
available for all. The wastewater service lines have not all been entered into
IPS so number, length and diameter have been estimated.
Pump Stations B Data for pump stations has recently added to IPS.
Wastewater
Treatment Plant
C – D Asset data is incomplete, with approximately 80% of civil, mechanical and
structural assets captured. Attribute information such as pump size is missing.
No asset information is available for electrical or SCADA assets. A major
project is underway to capture asset data in BIMS.
STORMWATER
Stormwater
network
B The data for the pipes and manholes is good. However, depth data not
available for all. The stormwater service lines have not all been entered into
IPS so number, length and diameter have been estimated.
Treatment/
Detention Devices
D Asset data is not complete in IPS. The data is contained in various
spreadsheets which were based on site inspections and staff knowledge.
There are no processes in place to ensure these spreadsheets are maintained.

DRAFT 2018-48 LONG-TERM INFRASTRUCTURE STRATEGY
97
ASSET GROUP GRADE COMMENT
TRANSPORT
Transportation
assets
B All transportation assets are held in RAMM and the data is considered to be
reasonably reliable. There are good processes in place for maintaining the
data held in RAMM.
PARKS AND GREEN SPACES
Parks and Open
Spaces, Hamilton
Gardens and
Cemetery Assets
B Most of these assets are recorded in IPS and there are processes around
updating this data.
Crematorium
Assets
C The crematorium assets are not yet recorded in IPS.
COMMUNITY AND EVENT FACILITIES
Aquatic Facilities
operational assets
C - D Some major operational assets are recorded in SPM, however, there is limited
information recorded on many of the assets. Collection of asset data is
planned as part of 2018 renewal project.
Community
Facilities non-
building assets
D Asset data is recorded in a spreadsheet that is updated on an ad hoc basis.
Staff are regularly on-site and carry out informal condition assessment.
H3 plant and
equipment
B Plant and equipment assets have been recorded in a spreadsheet by H3 staff.
There was a robust process for collecting the data and the data set is
considered complete.
Zoo animals A Animal recorded with an appropriate level of information.
Zoo infrastructure B Infrastructure is documented by not yet recorded in IPS.
Zoo furniture and
equipment
C These are recorded in a spreadsheet.
Library lending
collection
A Recorded with sound and robust processes and policy.
Library heritage
collection
B Recorded with improved data, new policy and processes.
Council Archives B Recorded improved data, new policy, processes documentation and active
management.
Library furniture
and equipment
C All assets recorded, however need to improve condition assessment processes.
Library
technology
B Recorded with improved data, process documentation and active
management.
Museum
collection and
public art
B Collections are recorded in Vernon with condition data and asset attributes.
Museum
furniture and
equipment
C Recorded in a spreadsheet.
ALL BUILDINGS
Hierarchy B A new hierarchy has been set up as part of the move of building assets into IPS.
Attribute
Information B Quantity and information derived from on-site surveys and as-builts
Condition B Condition assessments were carried out for all buildings in 2017 using a combination of
external contractors and in-house staff.
Base Life B Base lives are based on industry standards and supplied by SPM and suppliers
Unit Rates B Unit rates are based on industry costs and past renewal costs.
Comments and
Photos B Photos are added at the time of the condition assessment and as required.

HAMILTON CITY COUNCIL
98
FINANCIAL CONFIDENCE
Based on the data reliability and methodology used to calculate them the financial forecasts have
the aggregated confidence level shown in the table below. The confidence level only relates to the
use of the aggregated estimates (i.e. budgets as a whole) for the purpose of long-term financial
planning and should not be attributed to any individual projects for the purposes of project delivery.
The confidence level assessments have been graded using the criteria of the International
Infrastructure Management Manual 2011.
Table 19: Financial Confidence
Activity Confidence level
Years 1-3 Years 4-10 Years 10+
Infrastructure – Maintenance Reliable Reliable Uncertain
Infrastructure – Renewals Highly Reliable Reliable Uncertain
Infrastructure – New Works Reliable Reliable Uncertain
Transport – Maintenance Highly Reliable Reliable Uncertain
Transport – Renewals Highly Reliable Reliable Uncertain
Transport – New Works Reliable Reliable Uncertain
Parks and Green Spaces - Maintenance Highly Reliable Reliable Uncertain
Parks and Green Spaces – Renewals Reliable Reliable Uncertain
Parks and Green Spaces – New Works Reliable Reliable Uncertain
Community and Events Facilities –
Maintenance
Highly Reliable Reliable Uncertain
Community and Events Facilities – Renewals Reliable Reliable Uncertain
Community and Events Facilities – New
Works
Reliable Uncertain Very Uncertain