dr tony munton 6 th december 2012 resources, inputs, outputs and outcomes…… the difference,...
TRANSCRIPT
Dr Tony Munton 6th December 2012
Resources, inputs, outputs and outcomes……The difference, purpose, examples
For the Royal College of Speech and Language Therapists
Annual Scotland Day 2012:Making SLT Count – Generating Evidence on Outcomes


“ We believe that a continuum of universal, targeted and specialistservices designed around the family is needed... Those services do not just happen. They have to be commissioned.”
Bercow, 2008

Exclusive: speech and language therapy suffers drop in scope and quality of services7 July, 2011 | By Crispin DowlerSpeech and language therapists across the UK are reporting serious falls in the scope and quality of their services, as they sustain a “double whammy” of NHS and local authority cuts.
Great Moments in Speech and Language Therapy:John Wayne pioneers the 60 second stutter treatment

Payment by results creates a demand for
EVIDENCE

“There is a time when panic is the appropriate response”
Eugene Kleiner

Does it work?How much does it cost?Do benefits
outweigh costs?
3 questions commissioners ask:
Improving the collection of
consistent and accurate data is
essential to assess the
effectiveness and
cost-benefit of services£

RESOURCES (£)
OUTCOMESINPUTS OUTPUTS
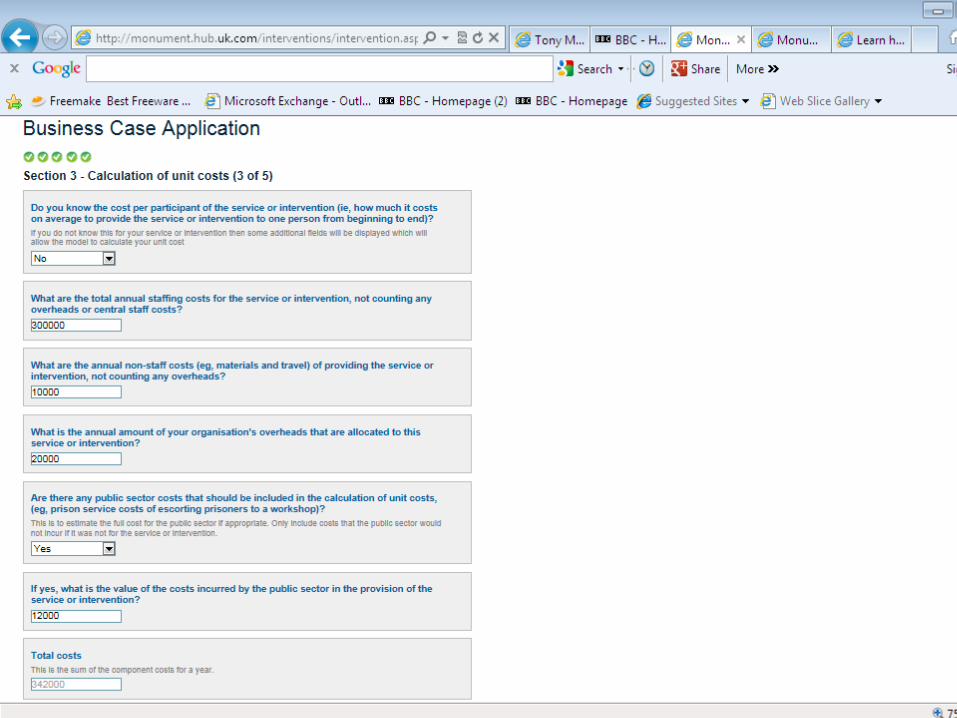
Making a business case:What to measure

RESOURCES (£)
Staff
Non-staff
Overheads
Other public sector
INPUTS
4 FTE counsellors @ £75k including on-costs
Materials and travel
Administrative support, office space etc.
Prison Service
£300,000
£10,000
£20,000
£12,000
TOTAL £342,000

RESOURCES (£)
OUTCOMESINPUTS OUTPUTS
Making a business case:What to measure
£342,000 Staff Non-staff Overheads
Other public sector

OUTPUTS
How many people start the intervention?
How many contact hours does each person receive?
What proportion of people complete the intervention?
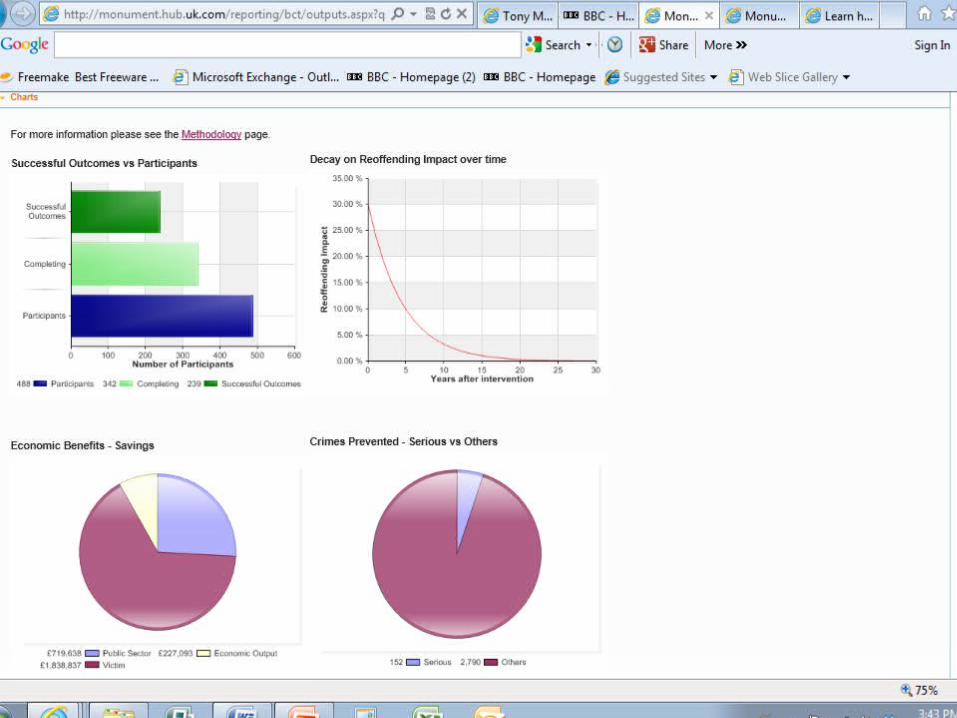
488
36
70% (342 people)

RESOURCES (£)
OUTCOMESINPUTS OUTPUTS
Making a business case:What to measure
£342,000 Staff Non-staff Overheads
Other public sector
342 completed interventions
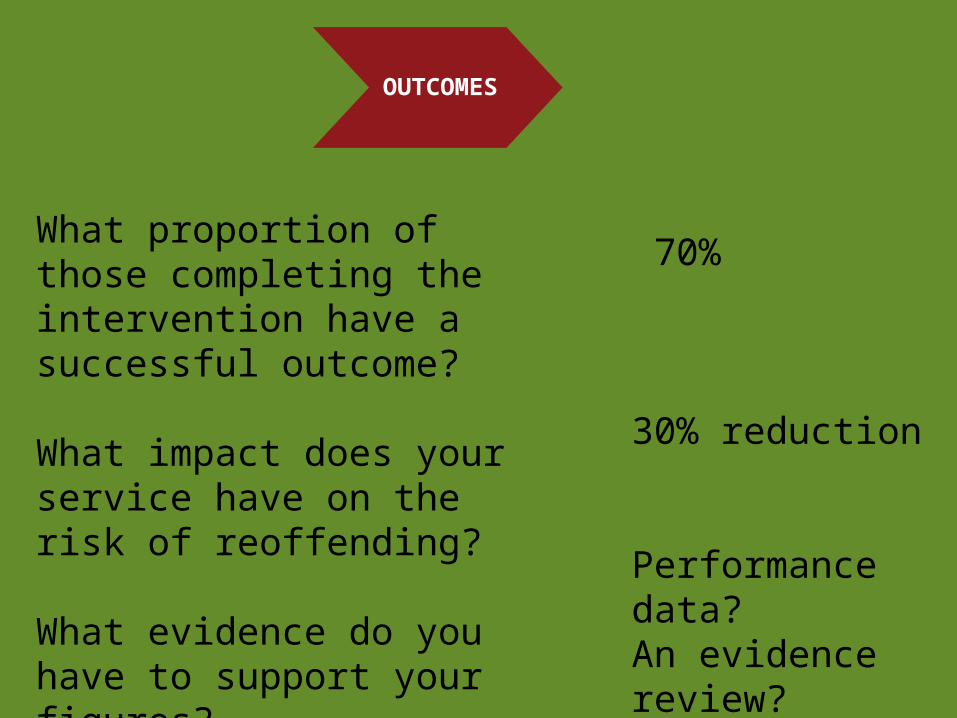
OUTCOMES
What proportion of those completing the intervention have a successful outcome?
What impact does your service have on the risk of reoffending?
What evidence do you have to support your figures?
70%
30% reduction
Performance data?An evidence review?

RESOURCES (£)
OUTCOMESINPUTS OUTPUTS
£342,000 Staff Non-staff Overheads
Other public sector
342 completed interventions
Successful outcomes 70%
Impact on reoffending -30%
Crimes prevented 2,942

Cost Effectiveness/Value for money
RESOURCES (£)
OUTCOMESINPUTS OUTPUTS
£342,000 2,942 fewer crimes

Cost Effectiveness/Value for money
Economic benefits (saving to society)Cost of crime data from the Home Office suggests 2,942 crimes would cost the taxpayer around £2,795,568.
Cost of intervention £342,000
Savings £ 2,795,568
Pounds saved per pound spent £8.14

Cost Effectiveness/Value for money
RESOURCES (£)
OUTCOMESINPUTS OUTPUTS
£342,000 2,942 fewer crimesSaves £2.8m
Pounds saved per pound spent £8.14

http://givingvoiceuk.org/how-to-calculate-the-cost-savings-of-your-local-slt-service-2/

An economic evaluation of speech and language therapy - Dysphagia (executable model)
Version 1
Date 11/23/2010
All copyright pertaining to the Microsoft Excel programme remains with Microsoft. This modification has been prepared under contract to The Matrix Knowledge Group for the Care Services Improvement Partnership. Beyond the input of data as described in the User Guidance notes, the spreadsheet must not be altered in any way without the express permission of The Matrix Knowledge Group.

INPUTS
The below values in amber can be changed to the preference of the user.
Population size (all ages) 61,179,068 Incidence of dysphagia (all ages) 0.10%
Total number of dysphagia patients 62,960
Unit cost of SLT (i.e. 3.2 hours of SLT over 4 weeks, £68 per hour)
£219
Unit cost of NHS care(i.e. 1.3 hours with non-specialised nurse over 4 weeks, £45 per hour)
£58
Use the button below to reset the above inputs to the original values used in the model:

RESULTS
The below values are the results from the changes made to the inputs.
Incremental unit benefit (SLT vs. NHS care) £373
Incremental unit cost (SLT vs. NHS care) £161
Total incremental cost (SLT vs. NHS care) £10,123,484
Total incremental benefit (SLT vs. NHS care) £23,471,544
Net Benefit £13,348,060
Benefit to cost ratio 2.32

Country Level Total number of dysphagia patients
Total cost Total benefit Total net
benefit
England 52,711 £8,475,566 £19,650,806 £11,175,240
Wales 3,081 £495,433 £1,148,674 £653,241
Northern Ireland 1,822 £293,034 £679,407 £386,373
Scotland 5,345 £859,450 £1,992,656 £1,133,206
Total level 62,960 £10,123,484 £23,471,544 £13,348,060
RESULTS The below values are the results from the changes made to the inputs.

Country/Local subgroup
Total population
Incidence of dysphagia
Total number of dysphagic patients
U nit benefits
Unit cost
Unit net benefits
Total cost
Total benefit
Total net benefits
Scotland (by Local Authority) 5,193,900 0.10% 5,345 £373 £161 £212 £859,450 £1,992,656 £1,133,206
Aberdeenshire 243,500 0.10% 251 £373 £161 £212 £40,293 £93,420 £53,127
Edinburgh, City of 477,600 0.10% 492 £373 £161 £212 £79,030 £183,233 £104,203
Glasgow City 588,500 0.10% 606 £373 £161 £212 £97,381 £225,780 £128,399
South Lanarkshire 310,900 0.10% 320 £373 £161 £212 £51,446 £119,278 £67,832
Stirling 88,800 0.10% 91 £373 £161 £212 £14,694 £34,068 £19,374


ev·i·dence /ˈɛvɪdəns/ev-i-duhns
information indicating whether a proposition is true

Contact
Name Dr Tony Munton
Tel +44 (0)20 7060 2475
Email [email protected]
Website www.thertk.co.uk