dr. maryalice stetler stevenson b-all mrd
TRANSCRIPT

B-ALL MRD- The Details are Everything
Maryalice Stetler-Stevenson, M.D., Ph.D. Flow Cytometry Unit, Laboratory of Pathology, CCR, NCI, NIH
DEPARTMENT OF HEALTH & HUMAN SERVICES
National Institutes of Health Bethesda, Maryland 20892
Public Health Service
Flow Cytometry Plays an Important Role in B-ALL MRD Detection
This was elegantly proven in the U.S. Children’s Oncology Group (COG) Studies Determined that flow cytometric MRD was important Determined what level of flow MRD is clinically relevant Validated that this assay can yield the same results across laboratories
The COG, a National Cancer Institute supported clinical trials group, is the world's largest organization devoted exclusively to childhood and adolescent cancer research

Acute Lymphoblastic Leukemia Remains a Leading Cause
of Childhood Death due to Malignancies
Courtesy A Wayne and D. Lee, Nguyen, Leukemia 2008
Survival by Time to Relapse
>36 months
<18 months
18-36 months
http://seer.cancer.gov/csr/1975_2004/
SEER 2000-2004, Age < 20 years
Deaths from Pediatric Cancers
Surv
ival
pro
babi
lity
Years after relapse

Why MRD in ALL?
Source of relapse is MRD, undetected by standard techniques
Defining remission or relapse is more objective when using flow MRD compared to morphology
MRD by flow cytometry best predictor of outcome Early intervention in MRD positive patients can improve
their outcome
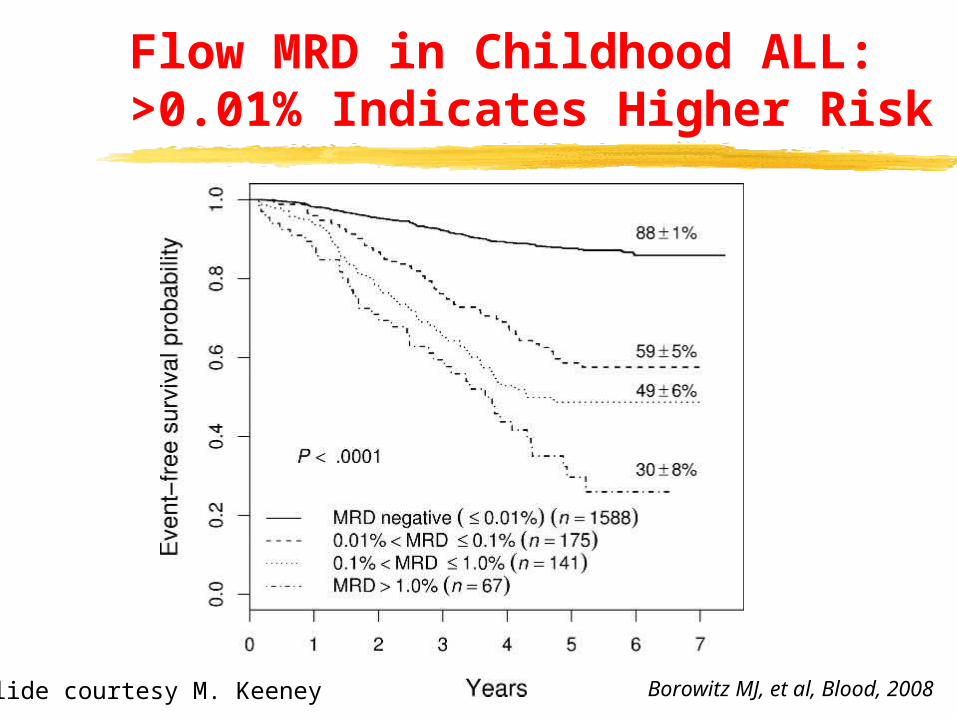
Flow MRD in Childhood ALL: >0.01% Indicates Higher Risk
Borowitz MJ, et al, Blood, 2008Slide courtesy M. Keeney

Day 29 MRD and Event Free Survival
0 2 4 6 8
0.0
0.2
0.4
0.6
0.8
1.0
AALL0331EFS by Day 29 MRD
Years
Eve
nt-fr
ee S
urvi
val P
roba
bilit
y
MRD 0.01%n 41010.01% MRD 0.1%n 5390.1% MRD 1.0%n 3261.0% MRD 10%n 98MRD 10%n 15
P 0.0001
Slide courtesy M. Borowitz

COG STUDIES OF MRD USING FLOW CYTOMETRY
Patients with day 29 MRD >0.01% have a significantly worse prognosis
Therefore flow MRD is a powerful test but can other laboratories perform this test?

Correlation of Results in Two Laboratories
Slide courtesy M. Borowitz

Correlation of Results in Two Laboratories
% MRD +
MRD levelSlide courtesy M. Borowitz

Slide courtesy M. Borowitz
MRD Effect on Outcome is Identical in Both Labs
0 1 2 3 4 5 6
0.0
0.2
0.4
0.6
0.8
1.0
Years
CC
R p
roba
bilit
y
EasternRegionn 143WesternRegionn 141
AALL02320.01%Day29MRD 0.1%
P 0.5857
0 1 2 3 4 5 6
0.0
0.2
0.4
0.6
0.8
1.0
Years
CC
R p
roba
bilit
yEasternRegionn 121WesternRegionn 114
AALL02320.1% Day29MRD 1.0%
P 0.5612

Exporting the Assay to Additional Labs: Issues Identified in MRD Standardization:
Few problems in instrument set up or acquisition Minor compensation issues
Analytical issues Miscalling hematogones Overly tight gating, esp initial B cell gate Fixed gates; Lack of hierarchical gating Artifacts and normal variants
Slide courtesy M. Borowitz
What is the COG Assay?
At diagnosis, careful examination of expressed blast markers that show a distinct pattern, independent from ‘normal’ expression
Flow MRD determined in Day 29 bone marrow to quantify residual blasts (or earlier day 8 peripheral blood) to detect patients with rapid blast clearance
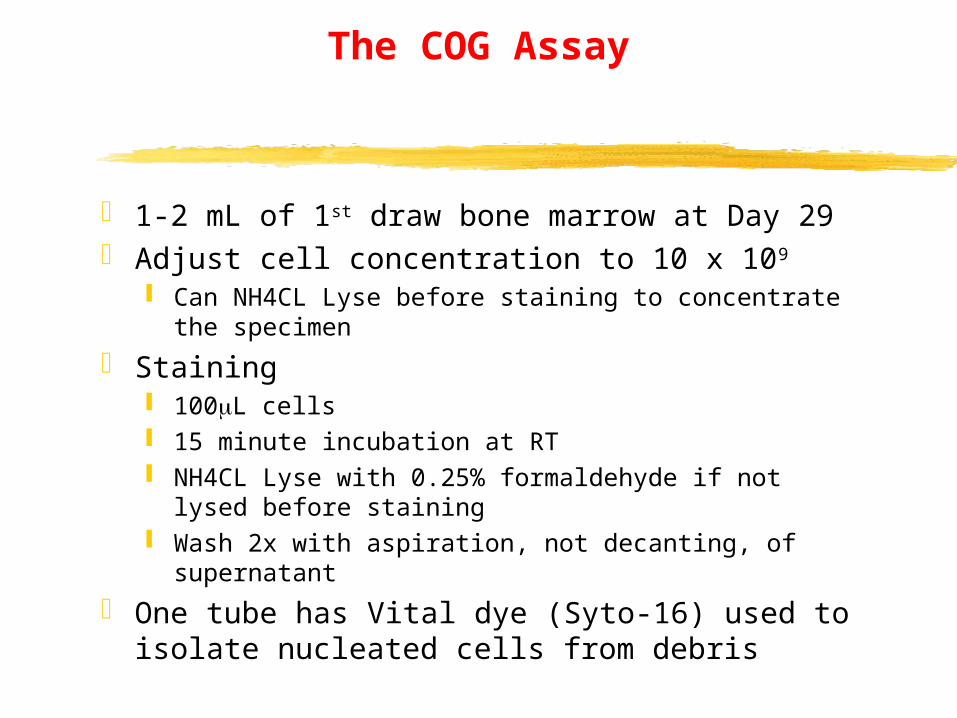
The COG Assay
1-2 mL of 1st draw bone marrow at Day 29 Adjust cell concentration to 10 x 109
Can NH4CL Lyse before staining to concentrate the specimen
Staining 100L cells 15 minute incubation at RT NH4CL Lyse with 0.25% formaldehyde if not lysed before
staining Wash 2x with aspiration, not decanting, of supernatant
One tube has Vital dye (Syto-16) used to isolate nucleated cells from debris

FL1 FL2 FL4 FL5 FL6 FL8
FITC PE Per CP-Cy5.5 PC7 APC
APC-Cy7 or APC-
H7
Tube 1CD20 CD10 CD38* CD19 CD58 CD45*B9E9 J5 HIT2 J3-119 N901 2D1
3ml 10ml 5ml 3ml 10ml 3ml
Tube 2
CD9 CD13/ CD33 CD34* CD19 CD10* CD45*
ALB6SJ1D1
/D3HL60.251
8G12 J3-119 HI10a 2D1
3ml 5ml / 10ml 15ml 3ml 3ml 3ml
Tube 3Syto-16 CD3* CD19 CD71* CD45*S7578 SK7 J3-119 L10.1 2D1
1ml 10ml 3ml 5ml 3ml
The COG Assay Panel

The COG Assay Data Acquisition
Ensure system and all reagents are clean Instrument must be clean with background=0
Acquire minimum of 500,000 but preferably 1x10⁶ cells if sensitivity of 0.01% is target (more cells if target is lower)
Compensation should be checked using either beads or stained cells for each parameter being examined
Collect time as a parameter to allow exclusion of data bursts, or when sample runs dry

Flow Cytometry Detection of B-ALL: The CD45/SSC Blast Gate Approach
CD45 V500
SSC
-A
102
103
104
105
0
65536
131072
196608
262144
CD45 V500
SSC
-A
102
103
104
105
0
65536
131072
196608
262144
Granulocytes
CD45 V500
SSC
-A
102
103
104
105
0
65536
131072
196608
262144
Monocytes
CD45 V500
SSC
-A
102
103
104
105
0
65536
131072
196608
262144
Lymphocytes
CD45 V500
SSC
-A
102
103
104
105
0
65536
131072
196608
262144
nRBCs
CD45 V500
SSC
-A
102
103
104
105
0
65536
131072
196608
262144
Blasts
CD45 V500
SSC
-A
102
103
104
105
0
65536
131072
196608
262144
CD45 V500
SSC
-A
102
103
104
105
0
65536
131072
196608
262144
Blast Gate
CD19 PE
CD
34 A
PC
102 103 104 105
102
103
104
105
Normal BM
Abnormal BM

Flow Cytometry Detection of B-ALL MRD: CD45/SSC vs CD19 Gating Approachs
CD34 APC
SSC
-A
102
103
104
105
0
65536
131072
196608
262144
CD45 V500
SSC
-A
102
103
104
105
0
65536
131072
196608
262144
CD19 PE
SSC
-A
102
103
104
105
0
65536
131072
196608
262144
CD45 V500
SSC
-A
102
103
104
105
0
65536
131072
196608
262144
Blast Gate
CD19 PE
SSC
-A
102
103
104
105
0
65536
131072
196608
262144
CD19 Gate
CD19 PE
CD
34 A
PC
102 103 104 105
102
103
104
105
CD19 PE
CD
34 A
PC
102 103 104 105
102
103
104
105
Normal BM
Abnormal BM

Flow Cytometry Detection of B-ALL MRD:CD19 Gate Cleaner
CD38 PerCP Cy55C
D10
PE
102
103
104
105
102
103
104
105
CD34 APC
CD
13 P
C7
102 103 104 105
102
103
104
105
CD45 V500
SSC
-A
102
103
104
105
0
65536
131072
196608
262144
CD19 PE
SSC
-A
102
103
104
105
0
65536
131072
196608
262144
CD38 PerCP Cy55
CD
10 P
E
102
103
104
105
102
103
104
105
CD34 APCC
D13
PC
7102 103 104 105
102
103
104
105

CD19 PC7
CD
10 P
E
102
103
104
105
102
103
104
105
CD45 AH7
SSC
-A
102 103 104 105
0
65536
131072
196608
262144
CD19 PC7
CD
10 P
E
102
103
104
105
102
103
104
105
CD45 AH7
SSC
-A
102 103 104 105
0
65536
131072
196608
262144
CD19 PC7
SSC
-A
102 103 104 105
0
65536
131072
196608
262144
CD19 PC7
CD
10 P
E
102
103
104
105
102
103
104
105
Flow Cytometry Detection of B-ALL MRD:CD19 Gate Cleaner
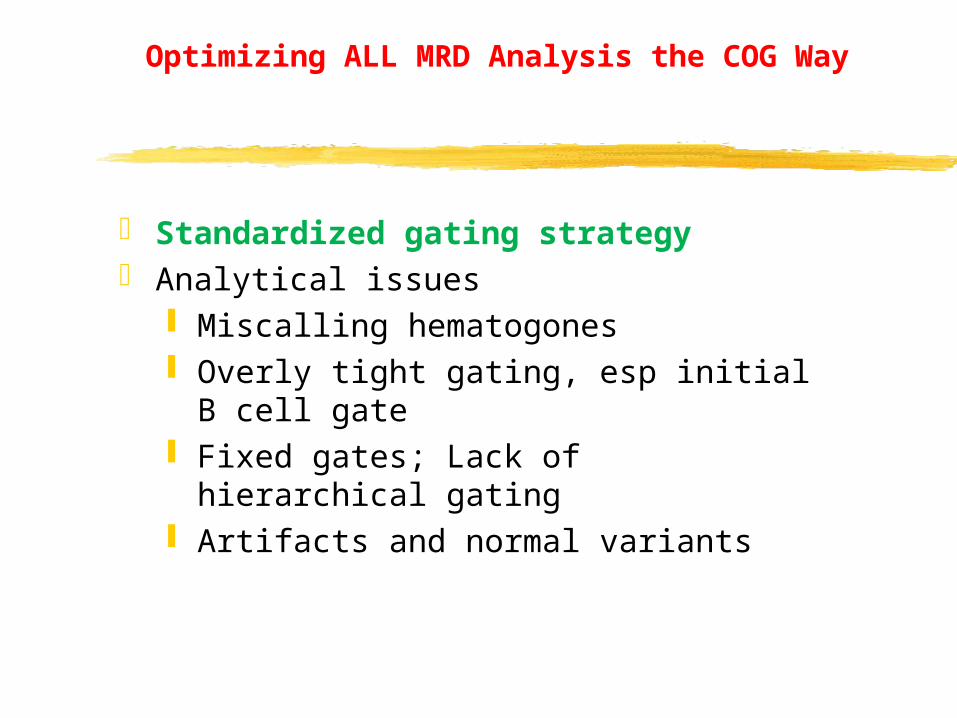
Optimizing ALL MRD Analysis the COG Way
Standardized gating strategy Analytical issues
Miscalling hematogones Overly tight gating, esp initial B cell gate Fixed gates; Lack of hierarchical gating Artifacts and normal variants

Exclude doublets using area versus height forward light scatter
Use Boolean logic to identify population in multiparameter space
The COG Assay Analysis

The COG Gating Strategy for B-ALL MRD:
Time
FSC
-A
0 12500 25000 37500 50000
0
65536
131072
196608
262144
Time 8color
CD19 PC7
SSC
-A
102
103
104
105
0
65536
131072
196608
262144
FSC-A
SSC
-A
0 65536 131072 196608 262144
0
65536
131072
196608
262144
CD45 AH7
CD
19 P
C7
102
103
104
105
102
103
104
105
FSC-A
FSC
-H
0 65536 131072 196608 262144
0
65536
131072
196608
262144
SINGLETS

CD45 AH7
CD
10 P
E
102
103
104
105
102
103
104
105
CD20 FITCC
D38
Per
CP
Cy5
510
210
310
410
5
102
103
104
105
CD45 AH7
CD
19 P
C7
102
103
104
105
102
103
104
105
CD45 AH7
CD
58 A
PC
102
103
104
105
102
103
104
105
CD45 AH7
CD
34 P
erC
P C
y55
102
103
104
105
102
103
104
105
CD45 AH7C
D13
+33
PE10
210
310
410
5
102
103
104
105
The COG Gating Strategy for B-ALL MRD:
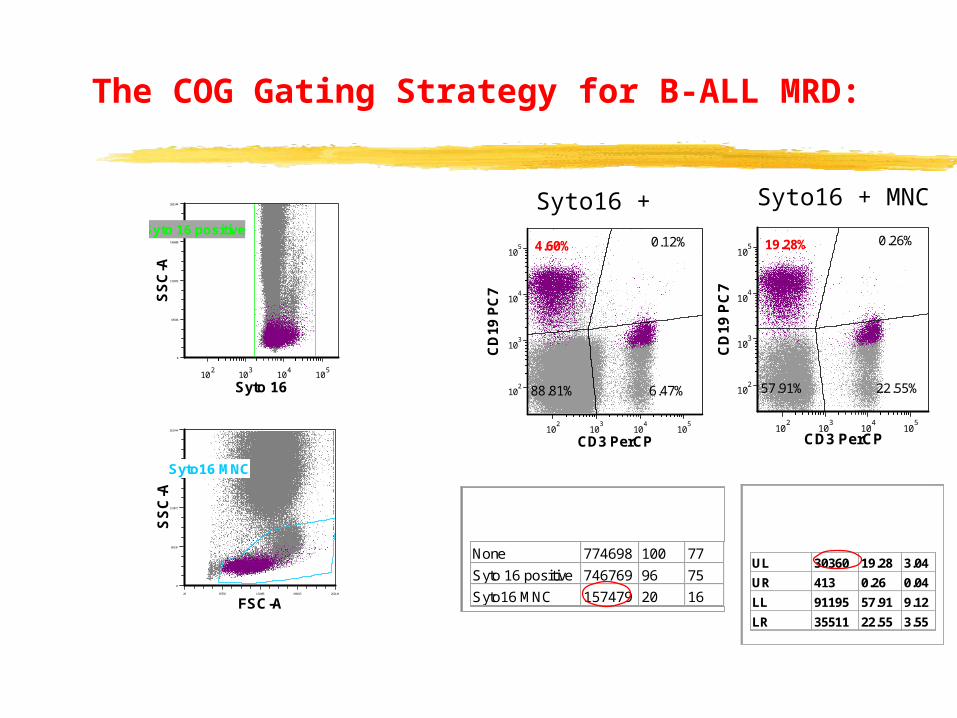
Gate # of Events
% of GatedCells
% of All Cells
None 774698 100 77Syto 16 positive 746769 96 75Syto16 MNC 157479 20 16
Syto 16
SSC
-A
102 103 104 105
0
65536
131072
196608
262144
Syto 16 positive
CD3 PerCP
CD
19 P
C7
102
103
104
105
102
103
104
105 19.28% 0.26%
57.91% 22.55%
FSC-A
SSC
-A
26 65556 131085 196615 262144
0
65536
131072
196608
262144
Syto16 MNC
CD3 PerCP
CD
19 P
C7
102
103
104
105
102
103
104
105
6.47%88.81%
0.12%4.60%
Quadrant
# of Events
% of GatedCells
% ofAll Cells
UL 30360 19.28 3.04UR 413 0.26 0.04LL 91195 57.91 9.12LR 35511 22.55 3.55
The COG Gating Strategy for B-ALL MRD:
Syto16 + Syto16 + MNC
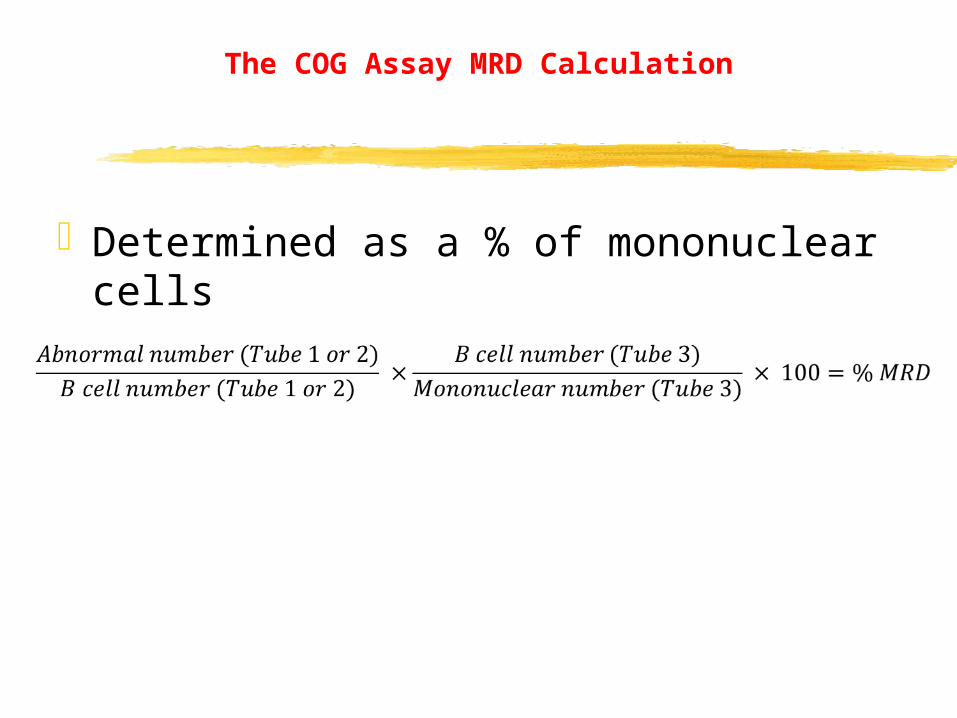
The COG Assay MRD Calculation
Determined as a % of mononuclear cells
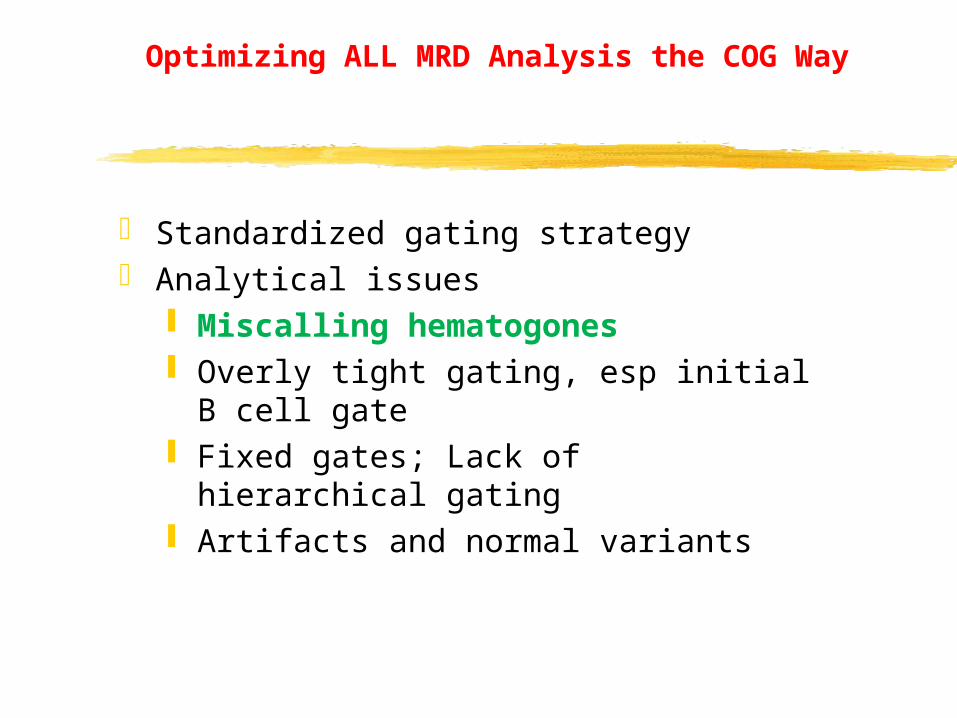
Optimizing ALL MRD Analysis the COG Way
Standardized gating strategy Analytical issues
Miscalling hematogones Overly tight gating, esp initial B cell gate Fixed gates; Lack of hierarchical gating Artifacts and normal variants

B-ALL has an immature B-cell immunophenotype like hematogones and must look carefully at antigen expression to differentiate it from normal hematogones
All hematogones have exactly the same predictable antigen expression B-ALL almost always has at least one antigen with abnormal expression
In Order to Be Able to do B-ALL Flow MRD You Need to First Understand the Phenotype of Normal B-Cell Precursors (Hematogones)

Analysis of ALL MRD: Normal Hematogones
CD20 FITC
CD
58 A
PC
102
103
104
105
102
103
104
105
CD20 FITC
CD
38 P
erC
P C
y55
102
103
104
105
102
103
104
105
CD45 V500
CD
19 P
E
102 103 104 105
102
103
104
105
CD20 FITC
CD
10 P
E
102
103
104
105
102
103
104
105
CD45 V500
SSC
-A
102
103
104
105
0
65536
131072
196608
262144
CD45 AH7
CD
34 P
erC
P C
y55
102
103
104
105
102
103
104
105
CD10 APC
CD
34 P
erC
P C
y55
102
103
104
105
102
103
104
105
CD45 AH7
CD
10 P
E
102
103
104
105
102
103
104
105
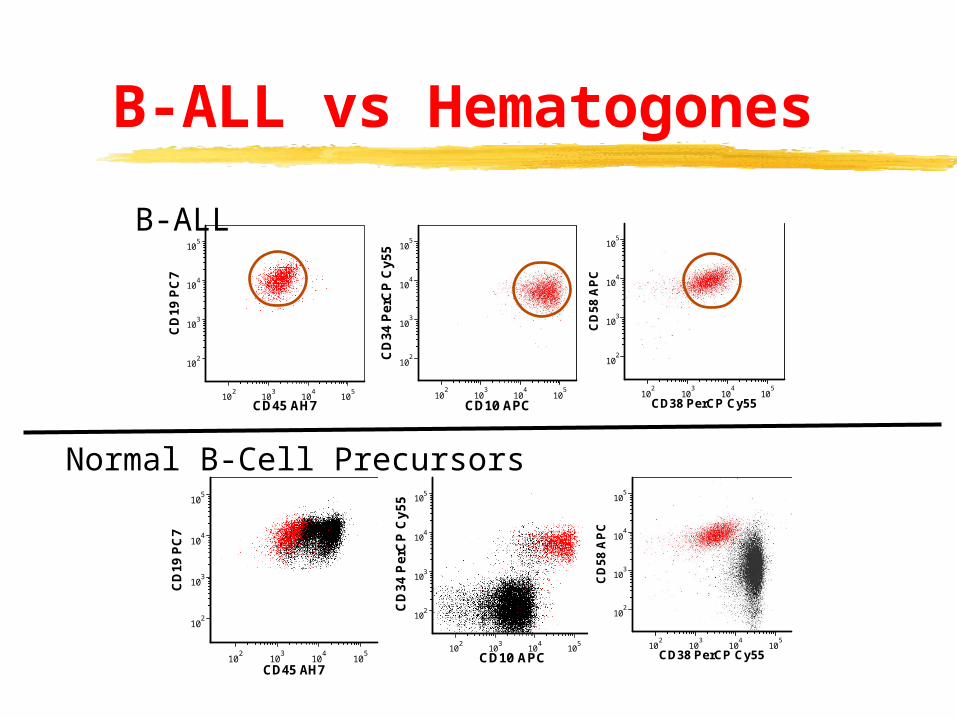
B-ALL vs Hematogones
CD45 AH7
CD
19 P
C7
102
103
104
105
102
103
104
105
CD10 APCC
D34
Per
CP
Cy5
510
210
310
410
5
102
103
104
105
CD38 PerCP Cy55
CD
58 A
PC
102
103
104
105
102
103
104
105
CD45 AH7
CD
19 P
C7
102
103
104
105
102
103
104
105
CD10 APC
CD
34 P
erC
P C
y55
102
103
104
105
102
103
104
105
CD38 PerCP Cy55
CD
58 A
PC
102
103
104
105
102
103
104
105
CD45 AH7
CD
19 P
C7
102
103
104
105
102
103
104
105
CD10 APC
CD
34 P
erC
P C
y55
102
103
104
105
102
103
104
105
CD38 PerCP Cy55
CD
58 A
PC
102
103
104
105
102
103
104
105
Normal B-Cell Precursors
B-ALL

Optimizing ALL MRD Analysis the COG Way
Standardized gating strategy Analytical issues
Miscalling hematogones Overly tight gating, esp initial B cell gate Fixed gates; Lack of hierarchical gating Artifacts and normal variants
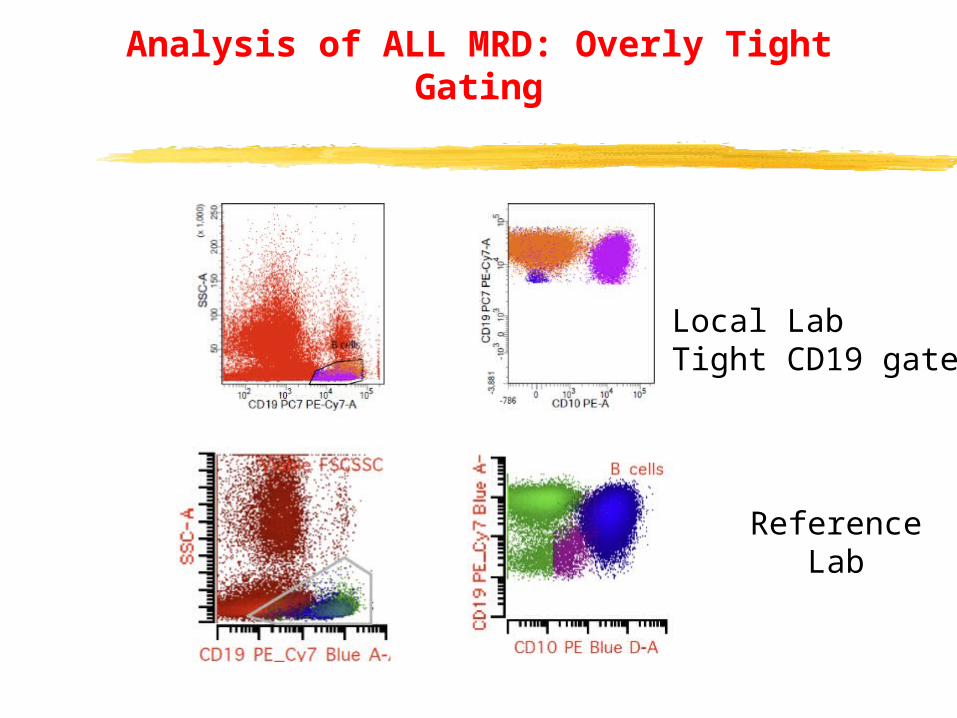
Local LabTight CD19 gate
ReferenceLab
Analysis of ALL MRD: Overly Tight Gating

Optimizing ALL MRD Analysis the COG Way
Standardized gating strategy Analytical issues
Miscalling hematogones Overly tight gating, esp initial B cell gate Fixed gates; Lack of hierarchical gating Artifacts and normal variants

Optimizing ALL MRD Analysis the COG Way: Hierarchical gating
CD19 PC7
CD
10 P
E
102
103
104
105
102
103
104
105
CD45 AH7
SSC
-A
102 103 104 105
0
65536
131072
196608
262144
CD19 PC7
SSC
-A
102
103
104
105
0
65536
131072
196608
262144
FSC-A
SSC
-A
0 65536 131072 196608 262144
0
65536
131072
196608
262144
CD45 AH7
CD
19 P
C7
102
103
104
105
102
103
104
105
FSC-A
FSC
-H
0 65536 131072 196608 262144
0
65536
131072
196608
262144
SINGLETS

Optimizing ALL MRD Analysis the COG Way
Standardized gating strategy Analytical issues
Miscalling hematogones Overly tight gating, esp initial B cell gate Fixed gates; Lack of hierarchical gating Artifacts and normal variants

Normal dim CD10+
Artifact
Optimizing ALL MRD Analysis the COG Way: Artifacts and normal variants

Monitoring Response to Therapy: B-ALL MRDMRD post chemotherapy: 0.6% of cells are ALL
CD19 APC
SSC
-A
102 103 104 105
-59
65492
131043
196593
262144
CD45 PerCP
CD
10 A
PC
102 103 104 105
102
103
104
105
CD45 AH7C
D10
PE
102
103
104
105
102
103
104
105
CD45 AH7
CD
34 P
erC
P C
y55
102
103
104
105
102
103
104
105
CD45 PerCP
CD
34 P
E
102 103 104 105
102
103
104
105
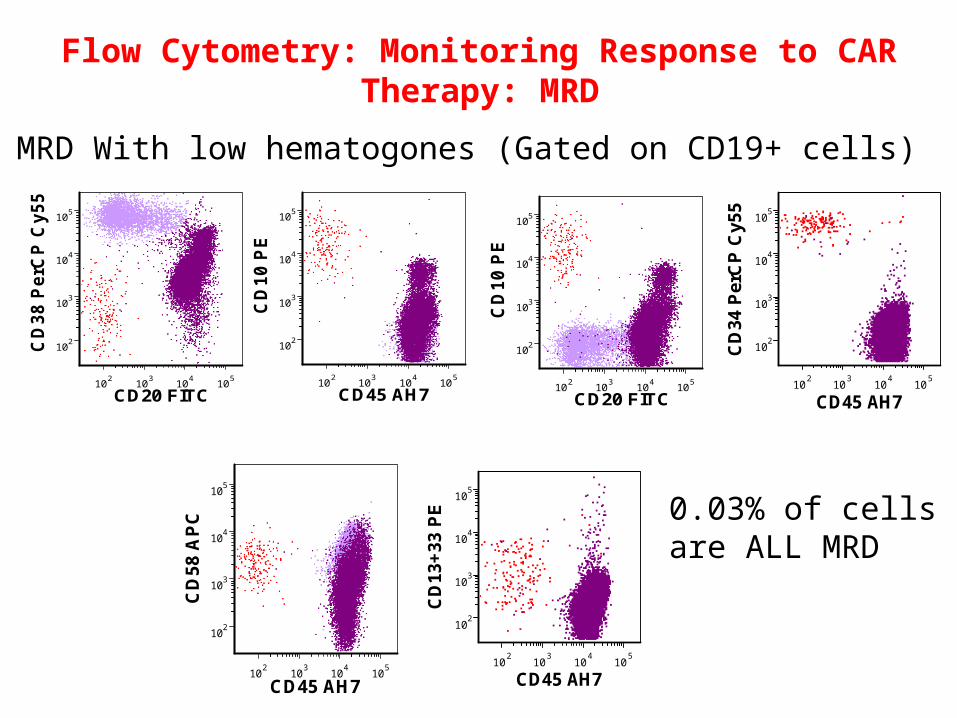
Flow Cytometry: Monitoring Response to CAR Therapy: MRD
MRD With low hematogones (Gated on CD19+ cells)
CD20 FITC
CD
10 P
E
102 103 104 105
102
103
104
105
CD20 FITC
CD
38 P
erC
P C
y55
102 103 104 105
102
103
104
105
CD45 AH7
CD
10 P
E
102 103 104 105
102
103
104
105
CD45 AH7
CD34
Per
CP C
y55
10 2 10 3 104 10 5
102
103
104
105
CD45 AH7
CD
10 P
E
102
103
104
105
102
103
104
105
CD20 FITC
CD
10 P
E
102
103
104
105
102
103
104
105
CD45 AH7
CD
34 P
erC
P C
y55
102
103
104
105
102
103
104
105
CD20 FITC
CD
38 P
erC
P C
y55
102
103
104
105
102
103
104
105
CD45 AH7
CD
58 A
PC
102 103 104 105
102
103
104
105
CD45 AH7
CD13
+33
PE
102
103
104
105
102
103
104
105
0.03% of cells are ALL MRD

When Numerous Hematogones Present B-ALL MRD is Based Upon Difference From Hematogones
CD45 AH7
CD
10 P
E
102
103
104
105
102
103
104
105
CD20 FITC
CD
10 P
E
102
103
104
105
102
103
104
105
CD45 AH7
CD
34 P
erC
P C
y55
102
103
104
105
102
103
104
105
CD20 FITC
CD
38 P
erC
P C
y55
102
103
104
105
102
103
104
105
Knowing hematogone pattern especially important when large number of hematogones
CD20 FITC
CD
38 P
erC
P C
y55
102
103
104
105
102
103
104
105
CD45 AH7
CD
10 P
E
102
103
104
105
102
103
104
105
CD20 FITC
CD
10 P
E
102
103
104
105
102
103
104
105
CD45 AH7
CD
34 P
erC
P C
y55
102 103 104 105
102
103
104
105
ALL MRD=0.02% of cells
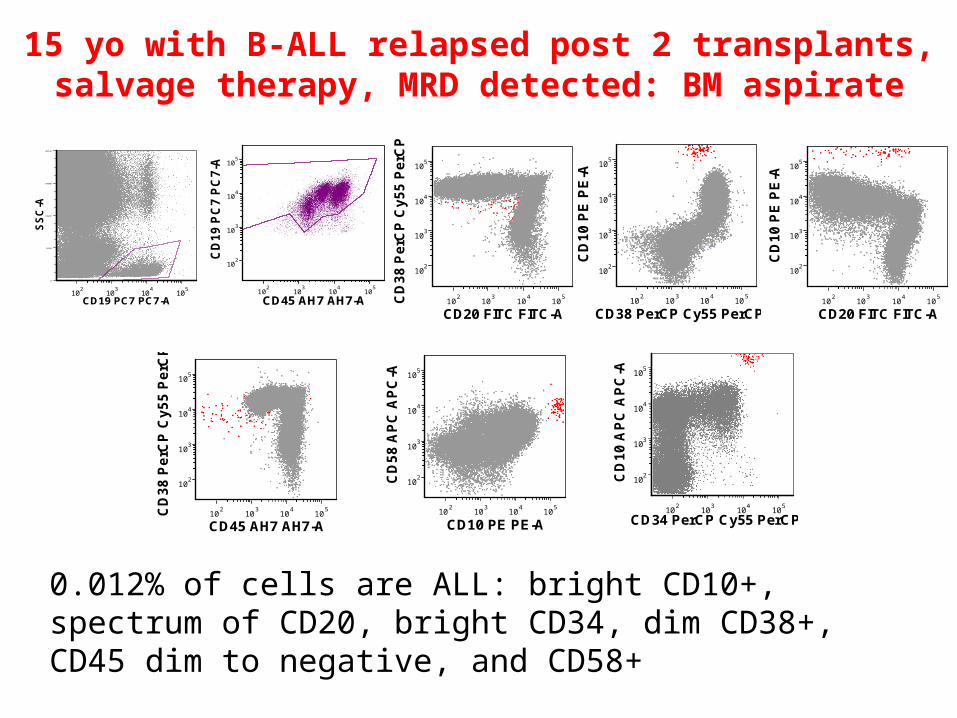
15 yo with B-ALL relapsed post 2 transplants, salvage therapy, MRD detected: BM aspirate
CD19 PC7 PC7-A
SSC
-A
102
103
104
105
0
65536
131072
196608
262144
CD45 AH7 AH7-A
CD
19 P
C7
PC7-
A
102
103
104
105
102
103
104
105
CD34 PerCP Cy55 PerCP-A
CD
10 A
PC A
PC-A
102 103 104 105
102
103
104
105
CD38 PerCP Cy55 PerCP-A
CD
10 P
E PE
-A
10 2 103 10 4 105
102
103
104
105
CD10 PE PE-A
CD
58 A
PC A
PC-A
102 103 10 4 105
102
103
104
105
CD20 FITC FITC-A
CD
38 P
erC
P C
y55
PerC
P-A
102
103
104
105
102
103
104
105
CD20 FITC FITC-A
CD
10 P
E PE
-A
102
103
104
105
102
103
104
105
CD45 AH7 AH7-A
CD
38 P
erC
P C
y55
PerC
P-A
10 2 103 104 105
102
103
104
105
0.012% of cells are ALL: bright CD10+, spectrum of CD20, bright CD34, dim CD38+, CD45 dim to negative, and CD58+

CD45 V500
SSC
-A
102
103
104
105
0
65536
131072
196608
262144
CD20 FITC
CD
38 P
erC
P C
y55
102 10 3 104 10 5
102
103
104
105
CD20 FITC
CD
10 P
E
102
103
104
105
102
103
104
105
CD20 FITC
CD
38 P
erC
P C
y55
102 103 104 105
102
103
104
105
CD38 PerCP Cy55
CD
10 P
E
102
103
104
105
102
103
104
105
18 yo with B-ALL relapsed post transplant: Post therapy BM
SF15 1204 bm_05_L-2.fcs SINGLETS
CD19 PC7
SSC
-A
102
103
104
105
0
65536
1310 72
1966 08
2621 44
SF15 1204 bm_05_L-2.fcs Clean L2 Gate
CD34 PerCP Cy55
CD10
APC
102
103
104
105
102
103
104
105

16 yo with B-ALL relapsed post 2 transplants:
SF14 2203 bm_03_B-4.fcs No Gate
TimeFS
C-A
0 12500 25000 37500 50000
0
65536
131072
196608
262144
Time 8color
SF14 2203 bm_01_S-1.fcs Time 8color
FSC-A
FSC
-H
0 65536 131072 196608 262144
0
65536
131072
196608
262144
SINGLETS
SF14 2203 7aad8_viability.fcs Viability Singlets
7AAD
SSC
-A
102
103
104
105
0
65536
131072
196608
262144
7AAD
7aad SSC Viable
SF14 2203 bm_04_L-1.fcs 8c B CD19 PC7 SSC
CD45 AH7
CD
19 P
C7
102
103
104
105
102
103
104
105 Clean L1 gate
SF14 2203 bm_04_L-1.fcs SINGLETS
CD19 PC7
SSC
-A
102 103 10 4 105
0
65536
131072
196608
262144
SF14 2203 bm_04_L-1.fcs Clean L1 gate
CD45 AH7
CD
10 P
E
102
103
104
105
102
103
104
105
Gate 50.13%
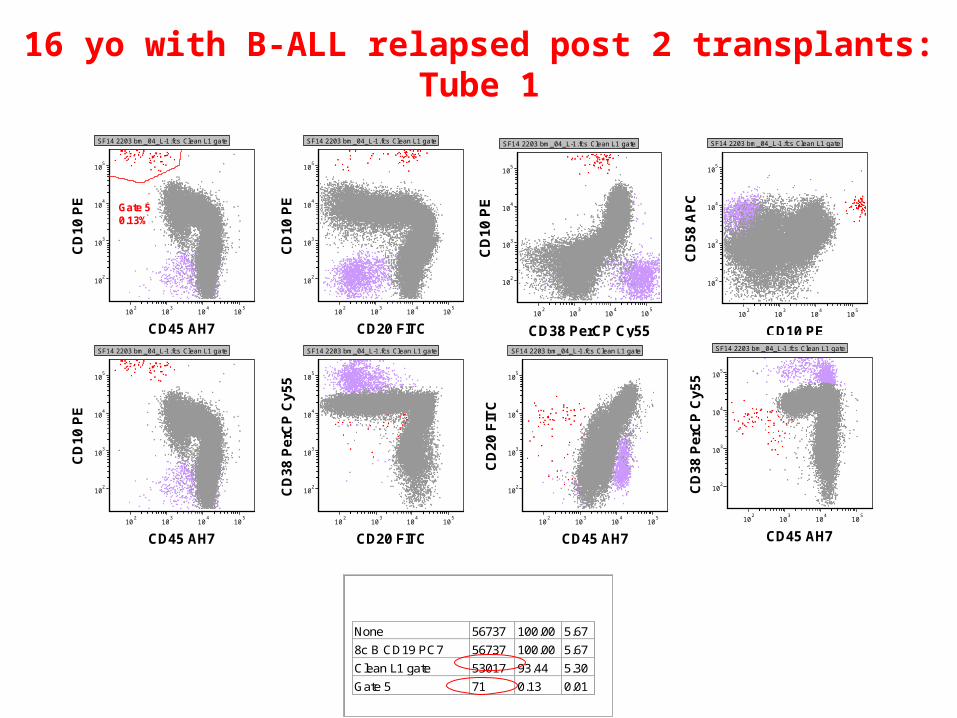
16 yo with B-ALL relapsed post 2 transplants:Tube 1
SF14 2203 bm_04_L-1.fcs Clean L1 gate
CD38 PerCP Cy55
CD
10 P
E
102
103
104
105
102
103
104
105
SF14 2203 bm_04_L-1.fcs Clean L1 gate
CD10 PE
CD
58 A
PC
102
103
104
105
102
103
104
105
SF14 2203 bm_04_L-1.fcs Clean L1 gate
CD45 AH7
CD
10 P
E
102
103
104
105
102
103
104
105
SF14 2203 bm_04_L-1.fcs Clean L1 gate
CD45 AH7
CD
38 P
erC
P C
y55
102
103
104
105
102
103
104
105
SF14 2203 bm_04_L-1.fcs Clean L1 gate
CD45 AH7
CD
20 F
ITC
102
103
104
105
102
103
104
105
SF14 2203 bm_04_L-1.fcs Clean L1 gate
CD20 FITC
CD
38 P
erC
P C
y55
102
103
104
105
102
103
104
105
SF14 2203 bm_04_L-1.fcs Clean L1 gate
CD20 FITC
CD
10 P
E10
210
310
410
5
102
103
104
105
Gate # of Events
% of Gated Cells
% of All Cells
None 56737 100.00 5.678c B CD19 PC7 56737 100.00 5.67Clean L1 gate 53017 93.44 5.30Gate 5 71 0.13 0.01

Gate # of Events
% of Gated Cells
% of All Cells
None 55054 100.00 5.518c B CD19 PC7 55054 100.00 5.51Clean L2 Gate 52028 94.50 5.20Gate 6 75 0.14 0.01
16 yo with B-ALL relapsed post 2 transplants:Tube 2
SF14 2203 bm_05_L-2.fcs L2 Clean gate
CD34 PerCP Cy55
CD
10 A
PC
102
103
104
105
102
103
104
105
SF14 2203 bm_05_L-2.fcs L2 Clean gate
CD34 PerCP Cy55
CD
10 A
PC
102
103
104
105
102
103
104
105
Gate 60.17%
SF14 2203 bm_05_L-2.fcs L2 Clean gate
CD10 APC
CD
9 FI
TC
102
103
104
105
102
103
104
105
SF14 2203 bm_05_L-2.fcs L2 Clean gate
CD13+33 PE
CD
9 FI
TC
102
103
104
105
102
103
104
105

16 yo with B-ALL relapsed post 2 transplants:Tube 3
SF14 2203 bm_06_L-3.fcs Syto16 MNC
CD3 PerCP
CD
19 P
C7
102
103
104
105
102
103
104
105
36.20%32.54%
0.17%31.08%
SF14 2203 bm_06_L-3.fcs Syto 16 positive
FSC-ASS
C-A
26 65556 131085 196615 262144
0
65536
131072
196608
262144
Syto16 MNC
SF14 2203 bm_06_L-3.fcs Syto 16 positive
CD3 PerCP
CD
19 P
C7
102
103
104
105
102
103
104
105 5.80% 0.19%
61.92% 32.10%
ZOOM: SINGLETS SF14 2203 bm_06_L-3.fcs
Syto 16
SSC
-A
102 104 105
0
65536
131072
196608
262144
Syto 16 positive
Gate # of Events
% of GatedCells
% of All Cells
None 977197 100 98Syto 16 positive 974355 100 97Syto16 MNC 177395 18 18
Quadrant # of Events
% of Gated Cells
% of All Cells
UL 55133 31.08 5.51UR 310 0.17 0.03LL 57733 32.54 5.77LR 64219 36.20 6.42

16 yo with B-ALL relapsed post 2 transplants:MRD Calculation
Tube 1: 71 x 55,133 x 100= 0.04253,017 177,395
Tube 2: 75 x 55,133 x 100= 0.04552,028 177,395

14 yo with B-ALL post treatment:
SF15 327 bm_07_L-22.fcs No Gate
Time
FSC-A
0 12500 25000 37500 50000
0
65536
131072
196608
262144
Time 8color
SF15 327 bm_01_S-1.fcs Time 8color
FSC-A
FSC
-H
0 65536 131072 196 608 262 144
0
65536
131072
196608
262144
SINGLETS
SF15 327 bm 7aad_viability.fcs Viability Singlets
7AAD
SSC
-A
102
103
104
105
0
65536
131072
196608
262144
7AAD
7aad SSC Viable
Gate % of GatedCells
None 100
7aad SSC 89
SF15 327 bm_06_L-3.fcs Syto 16 positive
Syto 16
SSC
-A
102
103
104
105
0
65 53 6
131 0 72
196 6 08
262 1 44
Syto 16 positive
SF15 327 bm_06_L-3.fcs Syto16 MNC
CD3 PerCP
CD
19 P
C7
102
103
104
105
102
103
104
105
21.49%39.17%
0.30%39.04%
SF15 327 bm_06_L-3.fcs Syto 16 positive
FSC-A
SSC
-A
26 65556 131085 19661 5 262 144
0
65536
131072
196608
262144
Syto16 MNC
Gate # of Events
% of GatedCells
% of All Cells
None 987677 100 99Syto 16 positive 973451 99 97Syto16 MNC 372088 38 37
Quadrant # of Events
% of Gated Cells
% of All Cells
UL 145756 39.17 14.58UR 1459 0.39 0.15LL 144567 38.85 14.46LR 80306 21.58 8.03

14 yo with B-ALL relapsed post 2 transplants:Tube 1
SF15 327 bm_04_L-1.fcs Clean L1 gate
CD10 PE
CD
58 A
PC
102
103
104
105
102
103
104
105
SF15 327 bm_04_L-1.fcs Clean L1 gate
CD45 AH7
CD
38 P
erC
P C
y55
102
103
104
105
102
103
104
105
SF15 327 bm_04_L-1.fcs Clean L1 gate
CD45 AH7
CD
20 F
ITC
102
103
104
105
102
103
104
105
SF15 327 bm_04_L-1.fcs Clean L1 gate
CD45 AH7
CD
10 P
E
102
103
104
105
102
103
104
105
SF15 327 bm_04_L-1.fcs Clean L1 gate
CD20 FITC
CD
38 P
erC
P C
y55
102
103
104
105
102
103
104
105
SF15 327 bm_04_L-1.fcs Clean L1 gate
CD20 FITC
CD
10 P
E
102
103
104
105
102
103
104
105
SF15 327 bm_04_L-1.fcs CD19 PC7 FSC SSC
CD45 AH7
CD
19 P
C7
102
103
104
105
102
103
104
105
Clean L1 gateSF15 327 bm_04_L-1.fcs SINGLETS
CD19 PC7
SSC
-A
102
103
104
105
0
6553 6
13 10 72
19 66 08
26 21 44
Gate # of Events
% of Gated Cells
% of All Cells
None 92846 100.00 9.288c B CD19 PC7 92846 100.00 9.28Clean L1 gate 92846 100.00 9.28L1 ALL Gate 1 98 0.11 0.01
SF15 327 bm_04_L-1.fcs Clean L1 gate
CD38 PerCP Cy55
CD
10 P
E
102
103
104
105
102
103
104
105

Gate # of Events
% of Gated Cells
% of All Cells
None 90948 100.00 9.098c B CD19 PC7 90948 100.00 9.09Clean L2 Gate 90948 100.00 9.09L2 ALL Gate 89 0.10 0.01
14 yo with B-ALL relapsed post 2 transplants:Tube 2
SF15 327 bm_05_L-2.fcs Gate 1
CD34 PerCP Cy55
CD
13+3
3 PE
102 103 104 105
102
103
104
105
SF15 327 bm_05_L-2.fcs Gate 7
CD45 AH7
CD
34 P
erC
P C
y55
102 10 3 104 105
102
103
104
105
SF15 327 bm_05_L-2.fcs Clean L2 Gate
CD34 PerCP Cy55
CD
10 A
PC
102 103 104 105
102
103
104
105
L2 ALL Gate SF15 327 bm_05_L-2.fcs Clean L2 Gate
CD34 PerCP Cy55
CD
9 FI
TC
102 103 104 105
102
103
104
105
SF15 327 bm_05_L-2.fcs 8c B CD19 PC7 SSC
CD45 AH7
CD
19 P
C7
102
103
104
105
102
103
104
105 Clean L2 Gate
SF15 327 bm_05_L-2.fcs SINGLETS
CD19 PC7
SSC
-A
102 103 104 105
0
65536
131072
196608
262144

14 yo with B-ALL relapsed post 2 transplants:MRD Calculation
Tube 1: 98 x 145,756 x 100= 0.04192,846 372,088
Tube 2: 89 x 145,756 x 100= 0.03890,948 372,088
Summary:
MRD by flow cytometry best predictor of outcome
Early intervention in MRD positive patients can improve their outcome
The COG Assay provides a standardized approach to ALL MRD that can achieve low inter-laboratory variability

Thank you to excellent collaborators:
Dr. Mike Keeney, London Laboratory Services, London Ontario, Canada Dr. Mike Borowitz, Johns Hopkins, Baltimore, Maryland, USA Dr. Constance Yuan, Laboratory of Pathology, NCI, Bethesda, Maryland, USA Mr. Gregory Jasper, Laboratory of Pathology, NCI, Bethesda, Maryland, USA Ms. Catharine McCoy, Laboratory of Pathology, NCI, Bethesda, Maryland, USA