dr. lawrence m. lesser - utep
TRANSCRIPT

“Teaching Statistics for Critical Engagement
Beyond Classroom Walls” ICOTS-9 invited session 7A (see my 6-page paper in ICOTS9 proceedings)
Dr. Lawrence M. Lesser
The University of Texas at El Paso
supported in part by Project UPLIFT (NSF/EHR/DUE #1140690)

presentation outline
• Motivations/importance
• Framework
• Examples
• Benefits
• Future directions
• Q & A

motivations & importance
• Improve our own students’ motivation and
engagement (UCLA study: 40%+ frequently bored in class)
• Supplement/alternative to F2F teaching
• Outreach to the broader public (e.g., ASA, CAUSE, Statistics2013, World of Statistics)
• A way to show “data are not just
numbers, they are numbers with a
context” (Cobb & Moore, 1997)
• Session 7A themes(lifelong learning, etc.)

Informal Science Education classification of
out-of-classroom experiences (Braund & Reiss, 2006)
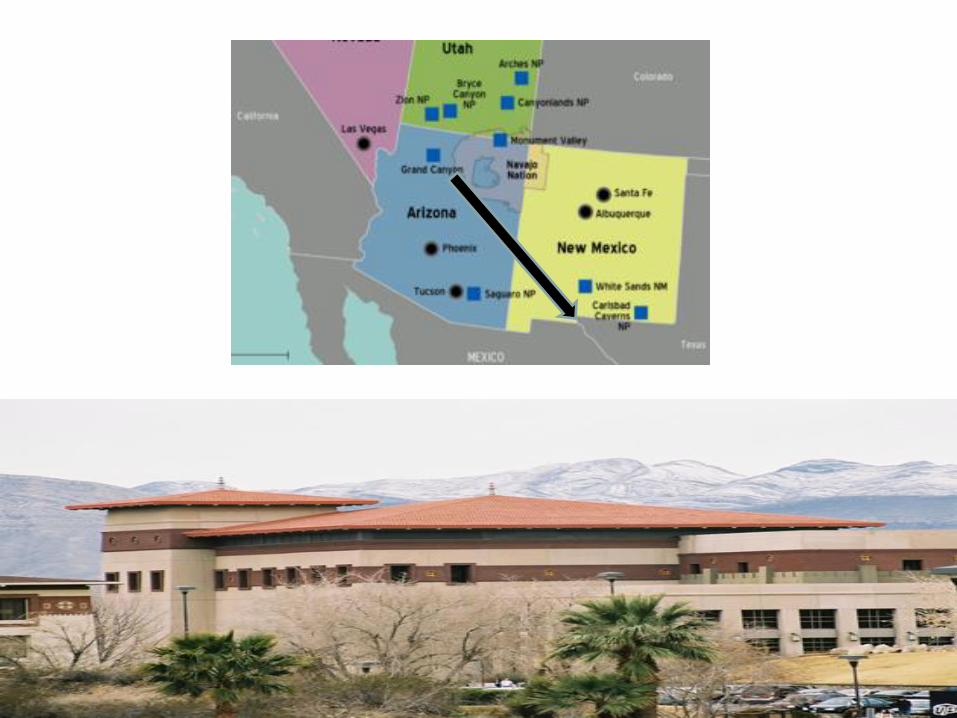
•The actual world
•A presented world
•A virtual world “a synchronous, persistent network of people, represented as avatars,
facilitated by networked computers” (Bell, 2008)

presentation outline
• Motivations/importance
• Framework
• Examples
• Benefits
• Future directions
• Q & A
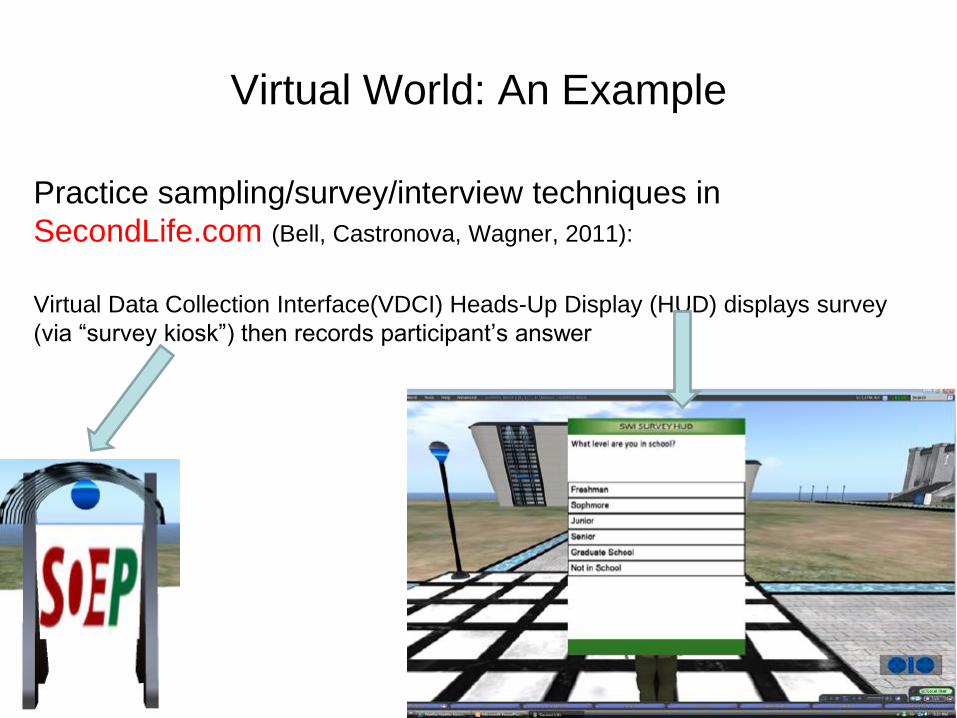
Virtual World: An Example
Practice sampling/survey/interview techniques in
SecondLife.com (Bell, Castronova, Wagner, 2011):
Virtual Data Collection Interface(VDCI) Heads-Up Display (HUD) displays survey
(via “survey kiosk”) then records participant’s answer
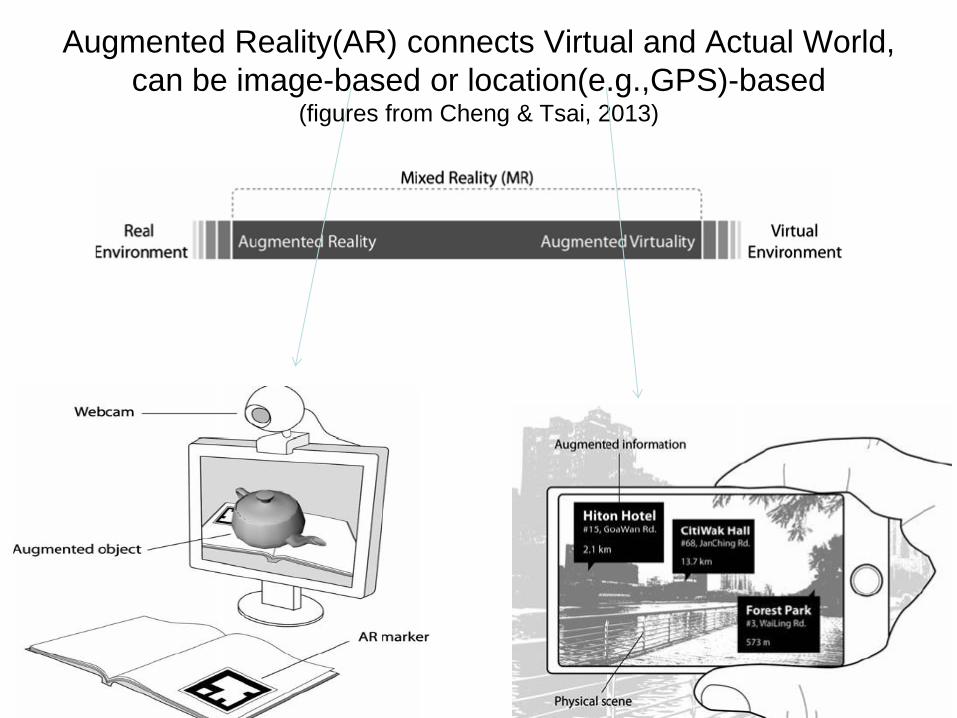
Augmented Reality(AR) connects Virtual and Actual World,
can be image-based or location(e.g.,GPS)-based (figures from Cheng & Tsai, 2013)
ideas for Augmented Reality (AR)
Statistics textbook marker label
activates via webcam capture
a virtual element to explore a 3-D
scatterplot or distribution (by tilting and
rotating the book)
superimpose data on mobile devices
based on position

Presented World example: Museums
Science (e.g., Exploratorium) and
Math (National Museum of Mathematics)
museums now include
statistics/probability exhibits (e.g., MoMath’s Edge FX Galton board
which includes lever that lets you
select where the balls fall)
SANKHYĀ National Museum of Statistics
to open at Univ. of Hyderabad (India)

Presented World example:
Museums/Libraries
Beyond exhibits: classes
Celebration events UNSD launched quinquennial World Statistics Day 2010;
International Year of Statistics 2013 World of Statistics;
February’s Random Acts of Kindness Week:

Presented World: Videos, TV, Radio, Podcasts
COMAP(1989) Against All Odds
statsandstories.net (Miami University)
NBC Learn
Mythbusters (e.g., “3 doors game” episode)
amstat.org/youtube/
Khan Academy

Presented world: my 2012
episode on polls and surveys on local PBS-TV show “Blast Beyond”
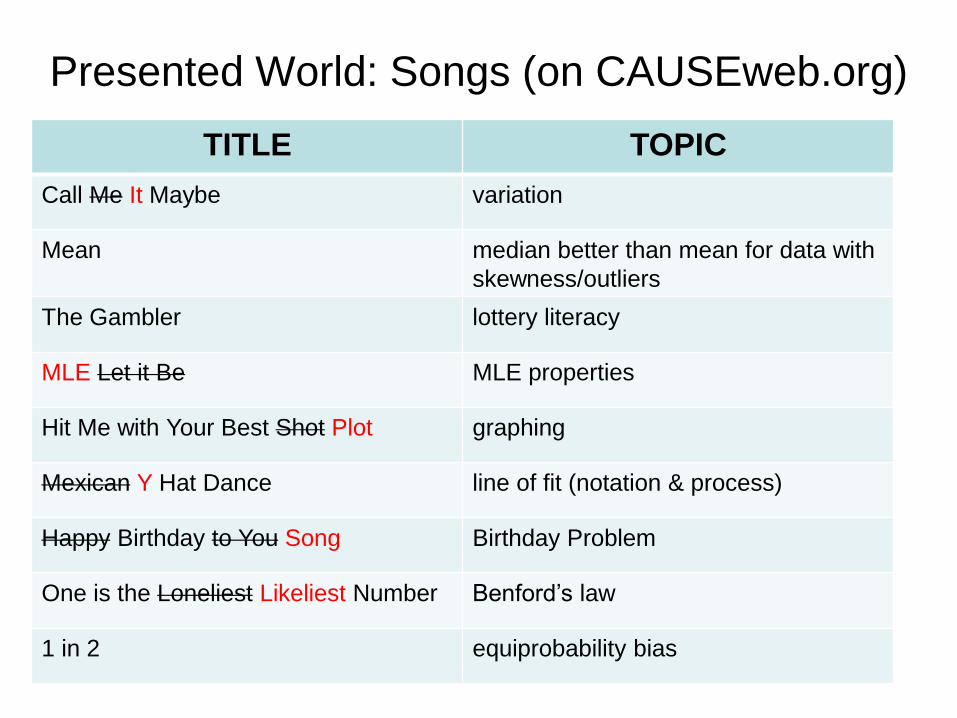
Presented World: Songs (on CAUSEweb.org)
TITLE TOPIC
Call Me It Maybe variation
Mean median better than mean for data with
skewness/outliers
The Gambler lottery literacy
MLE Let it Be MLE properties
Hit Me with Your Best Shot Plot graphing
Mexican Y Hat Dance line of fit (notation & process)
Happy Birthday to You Song Birthday Problem
One is the Loneliest Likeliest Number Benford’s law
1 in 2 equiprobability bias

Actual World example:
Data Collection Field Trips
Relate observations on community walk (Rubel, Chu, Shookhoff, 2011)
to data from http://factfinder2.census.gov,
http://epa.gov/myenvironment/ (air, water, pollutants, etc.),
GIS data from myworldgis.org (Enyedy’s
Community Mapping Project),
Racial Dot Map, etc.
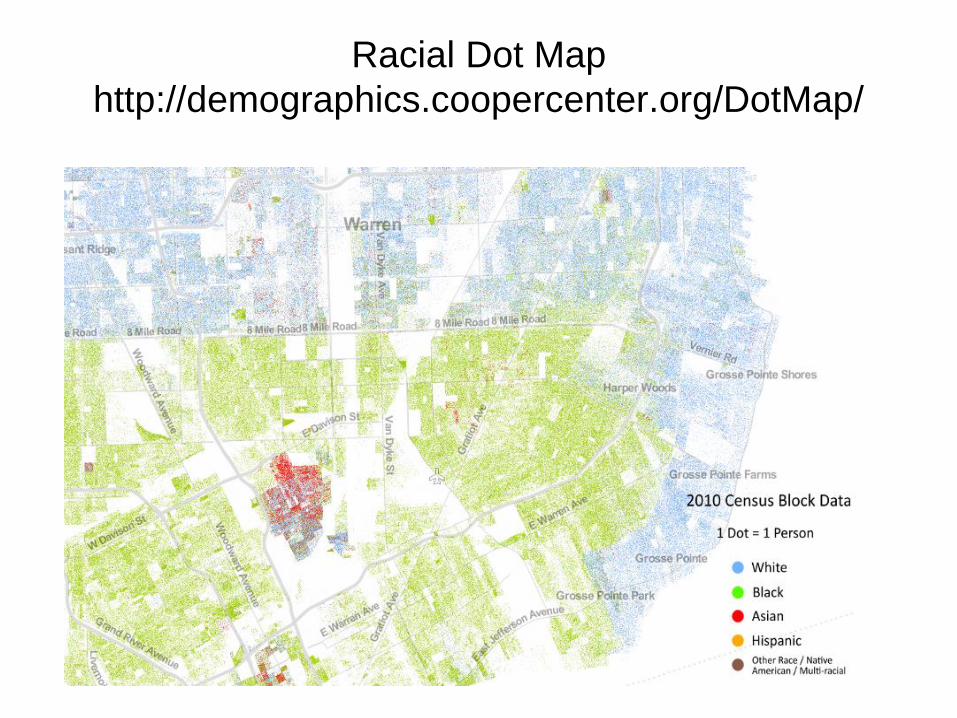
Racial Dot Map
http://demographics.coopercenter.org/DotMap/
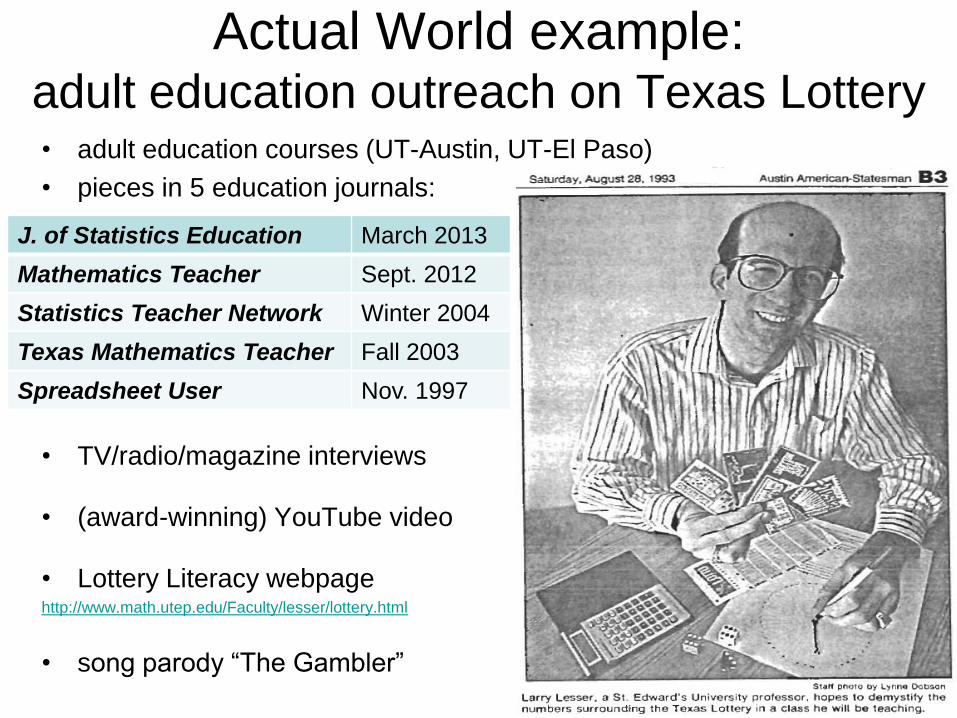
Actual World example: adult education outreach on Texas Lottery • adult education courses (UT-Austin, UT-El Paso)
• pieces in 5 education journals:
• TV/radio/magazine interviews
• (award-winning) YouTube video
• Lottery Literacy webpage http://www.math.utep.edu/Faculty/lesser/lottery.html
• song parody “The Gambler”
J. of Statistics Education March 2013
Mathematics Teacher Sept. 2012
Statistics Teacher Network Winter 2004
Texas Mathematics Teacher Fall 2003
Spreadsheet User Nov. 1997

Actual World example:
culturally relevant family math learning event (Ramirez & McCollough, 2012)

La Lotería questions (Ramirez & McCollough, 2012; Lesser 2013)
• How many ways to win?
• How many different 4x4 boards are there if
the 16 cells must be different and drawn
from a set of 54 images?
• What’s [largest; smallest] number of cards
dealer could call before your board [must;
could] win?
• What’s Pr(neither of first 2 cards called are
on your 4x4 board)?
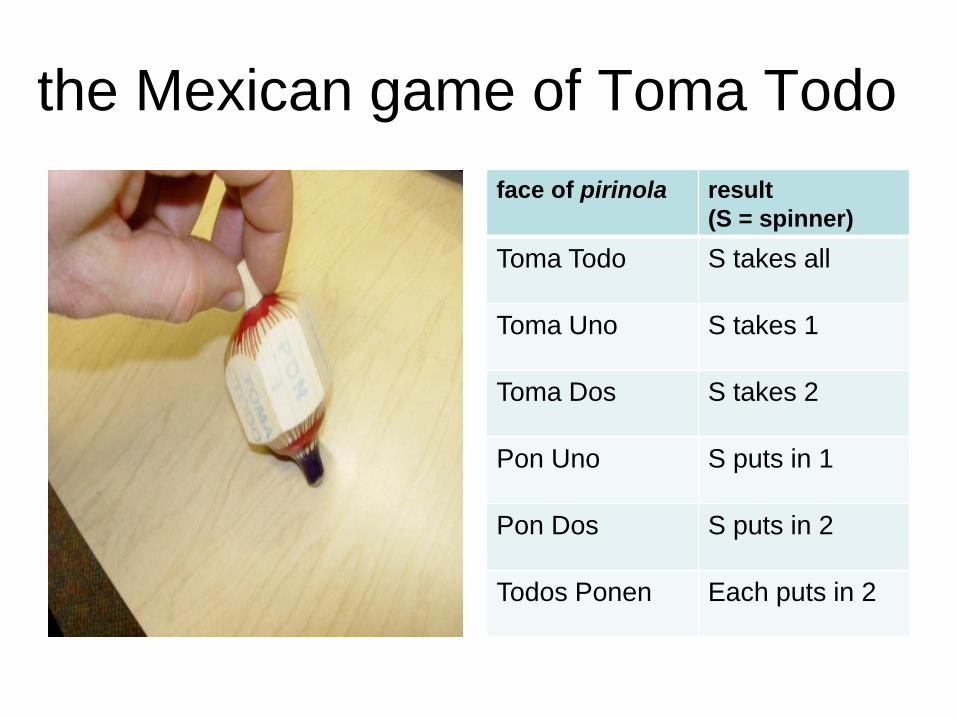
the Mexican game of Toma Todo
face of pirinola result
(S = spinner)
Toma Todo S takes all
Toma Uno S takes 1
Toma Dos S takes 2
Pon Uno S puts in 1
Pon Dos S puts in 2
Todos Ponen Each puts in 2
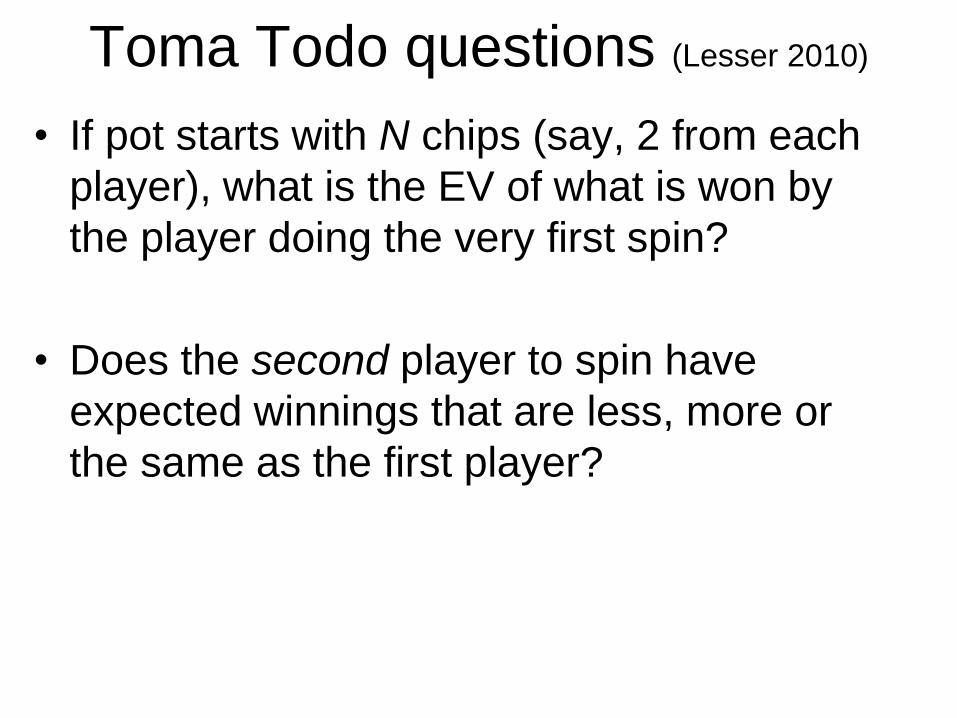
Toma Todo questions (Lesser 2010)
• If pot starts with N chips (say, 2 from each
player), what is the EV of what is won by
the player doing the very first spin?
• Does the second player to spin have
expected winnings that are less, more or
the same as the first player?

(Hanukkah) dreidel game
face of dreidel Action
(S = spinner)
Gimel S gets all
Hay S gets half
Nun nothing
Shin S puts in 1

Actual World example: sports/games
statistics courses on sports (Tabor & Franklin, 2012;
Wiesner, 2013) or a particular sport such as
baseball (Albert, 2003; Rothman, 2012)
Shonda Kuiper’s NSF project “games
with a purpose”: http://web.grinnell.edu/individuals/kuipers/stat2labs/Labs.html

Actual World example:
engaged citizenship
Social justice (e.g., Lesser in March 2007 JSE)
Service learning (e.g., Amy Phelps in Nov. 2012 JSE)
Gapminder.org

presentation outline
• Motivations/importance
• Framework
• Examples
• Benefits
• Future directions
• Q & A

BENEFITS of out-of-class experiences
Students own/control learning by hitting
pause/rewind, take in more info
through multiple input channels (Petty, 2010)
Extended practical work, active learning
Motivation
Contextualize, set up, and increase time
for (flipped) in-class experiences
Hone teacher skills to cultivate engagement,
incorporate questions, make real-world
connections, tailor to student backgrounds

Benefits of out-of-classroom
contexts (Braund & Reiss, 2006)
• Improved development and integration of concepts
• Extended and authentic practical work
• Access to rare material and to “big” science data
• Attitudes to school science: stimulating further
learning
• Social outcomes: collaborative work and
responsibility for learning
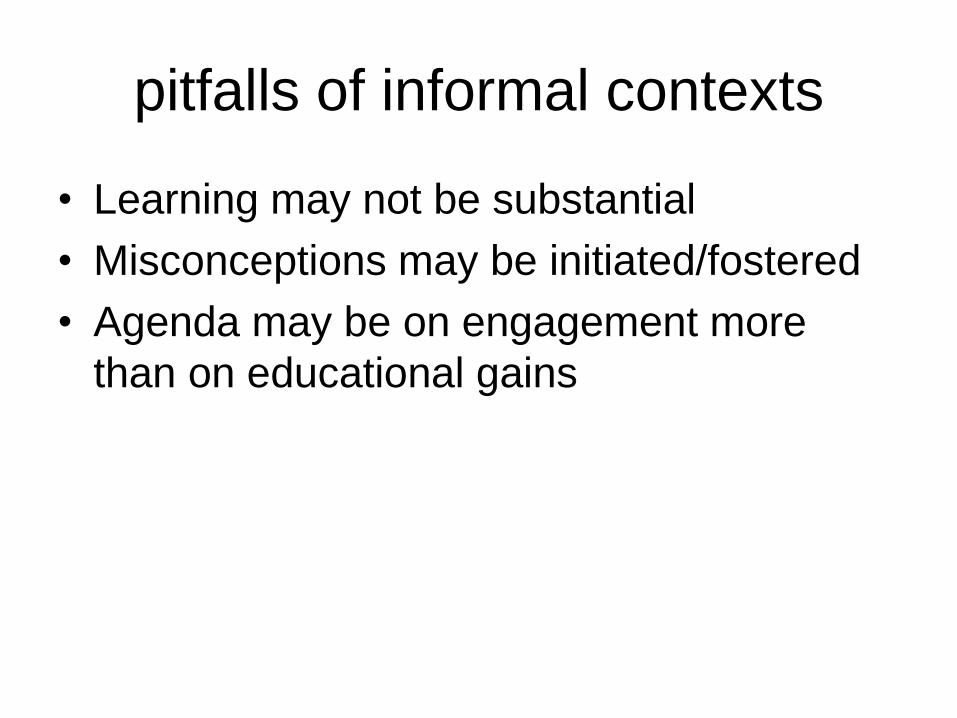
pitfalls of informal contexts
• Learning may not be substantial
• Misconceptions may be initiated/fostered
• Agenda may be on engagement more
than on educational gains

FUTURE DIRECTIONS
Address the pitfalls on the previous slide
Broaden collection (e.g., add non-US
examples)
Give implementation guidelines
Collect data on examples’ effectiveness to
motivate learning, improve attitudes,
decrease anxiety towards statistics [one result (p = .04) from our NSF study:
exposure to songs in LMS increased learning;
see ICOTS9 poster #40 and eCOTS breakout session]

Thank you for coming!
QUESTIONS?
“Teaching Statistics for
Engagement
Beyond Classroom Walls”
Dr. Lawrence M. Lesser
The University of Texas at El Paso


“It’s a Sign: A Connection between
Correlation and Slope” (students randomly assigned to include the red part or not)
The correlation coefficient r tells us something about the
strength and linear relationship of a scatterplot of data.
By strength, we mean how tightly the points cluster
around the regression line (i.e., the line of best fit). All
else being equal, a correlation value of r = .7 (or r = -.7)
generally indicates a stronger linear relationship than a
value such as r = .3 (or r = -.3).
The direction of the relationship has to do with the sign of
r. If r > 0, we have positive correlation, which means
higher values of Y are associated with higher values of
X, and lower values of Y are associated with lower
values of X. In other words, X and Y go up and down
together. Such a scatterplot would be described best
with a line of fit that has a positive slope, and indeed this
is always the case: positive correlation happens when
the regression line slope is positive. Likewise, r < 0
means negative correlation, with X and Y moving in
opposite directions from each other, thus suggesting a
line of fit with a negative slope. Finally, a scatterplot with
no real linear trend at all (i.e., r = 0) would have a line of
fit that is horizontal, which means slope of 0. Whether
positive, negative, or zero, the sign of the correlation r is
the same as the sign of the slope of the line.
Here are lyrics to a song (sung to the tune of the familiar
folk tune “Twinkle, Twinkle Little Star” that helped you
learn the alphabet) to help you rehearse and permanently
acquire this fact in your mind:
Correlation Song (lyric © 2013 Lawrence M. Lesser)
Are points near a line, or far?
What’s the correlation, r?
If the fit supports a line,
Its slope and r would share the sign.
Twinkle, twinkle, you’re a star:
Knowing stats will take you far!
Click on this MP3 file
http://www.causeweb.org/resources/fun/db.php?id=487
so you can hear this 20-second jingle.
Now play it one more time (and sing along!).
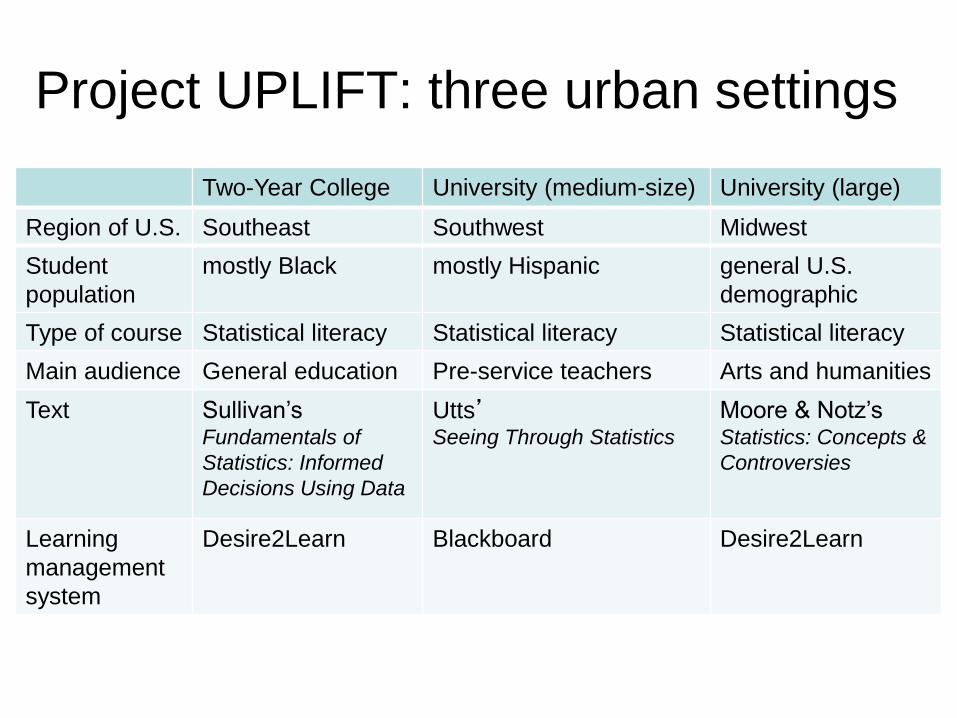
Project UPLIFT: three urban settings
Two-Year College University (medium-size) University (large)
Region of U.S. Southeast Southwest Midwest
Student
population
mostly Black mostly Hispanic general U.S.
demographic
Type of course Statistical literacy Statistical literacy Statistical literacy
Main audience General education Pre-service teachers Arts and humanities
Text Sullivan’s Fundamentals of
Statistics: Informed
Decisions Using Data
Utts’ Seeing Through Statistics
Moore & Notz’s Statistics: Concepts &
Controversies
Learning
management
system
Desire2Learn Blackboard Desire2Learn
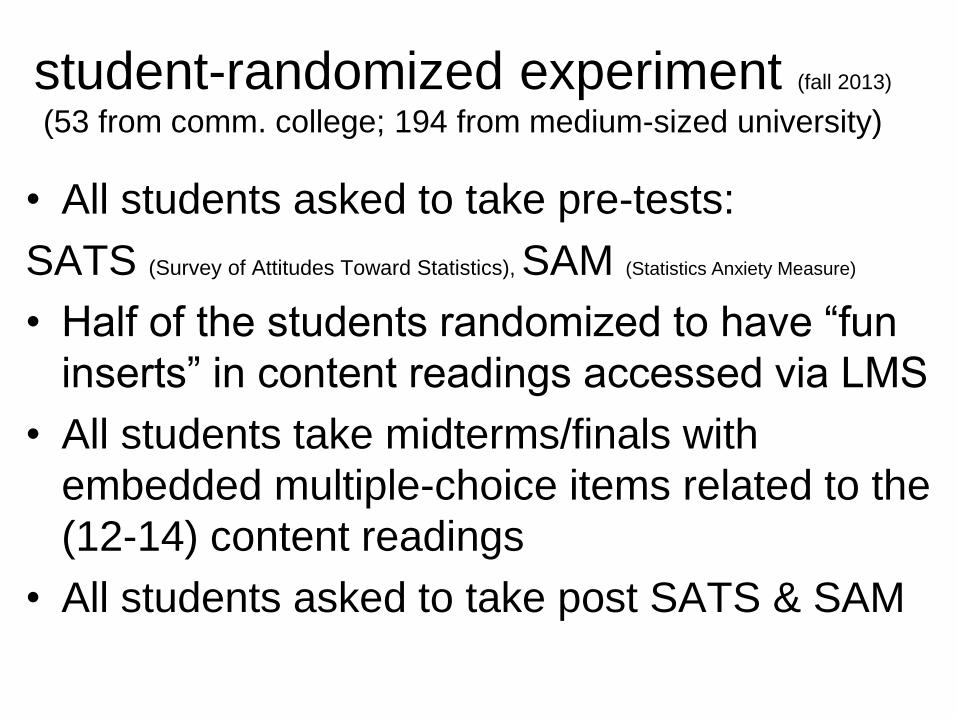
student-randomized experiment (fall 2013) (53 from comm. college; 194 from medium-sized university)
• All students asked to take pre-tests:
SATS (Survey of Attitudes Toward Statistics), SAM (Statistics Anxiety Measure)
• Half of the students randomized to have “fun
inserts” in content readings accessed via LMS
• All students take midterms/finals with
embedded multiple-choice items related to the
(12-14) content readings
• All students asked to take post SATS & SAM
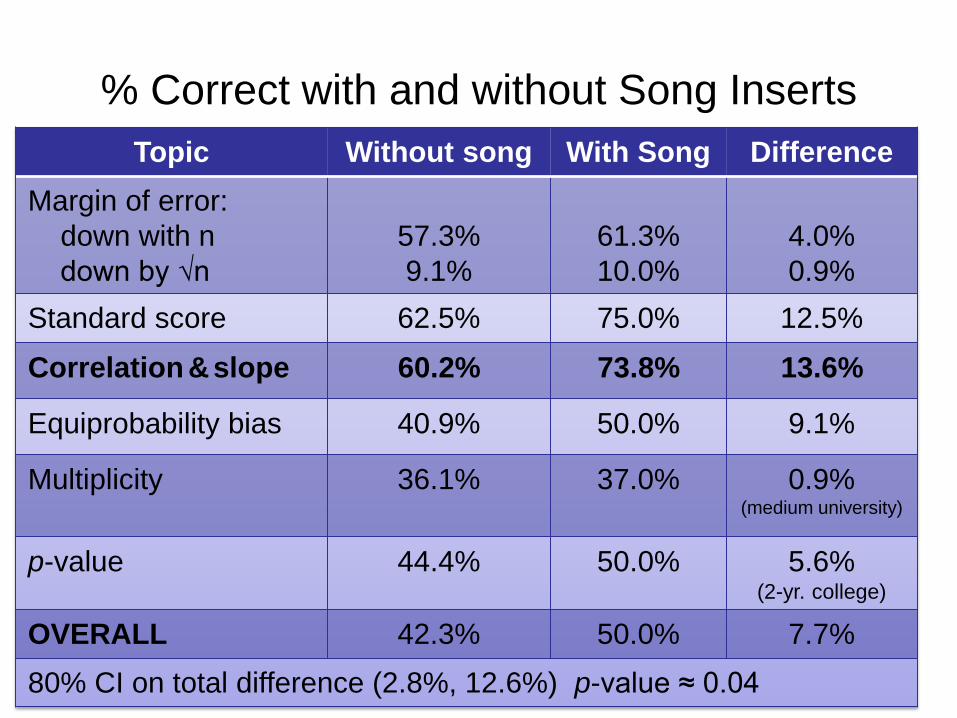
% Correct with and without Song Inserts
Topic Without song With Song Difference
Margin of error:
down with n
down by √n
57.3%
9.1%
61.3%
10.0%
4.0%
0.9%
Standard score 62.5% 75.0% 12.5%
Correlation & slope 60.2% 73.8% 13.6%
Equiprobability bias 40.9% 50.0% 9.1%
Multiplicity 36.1% 37.0% 0.9% (medium university)
p-value 44.4% 50.0% 5.6% (2-yr. college)
OVERALL 42.3% 50.0% 7.7%
80% CI on total difference (2.8%, 12.6%) p-value ≈ 0.04
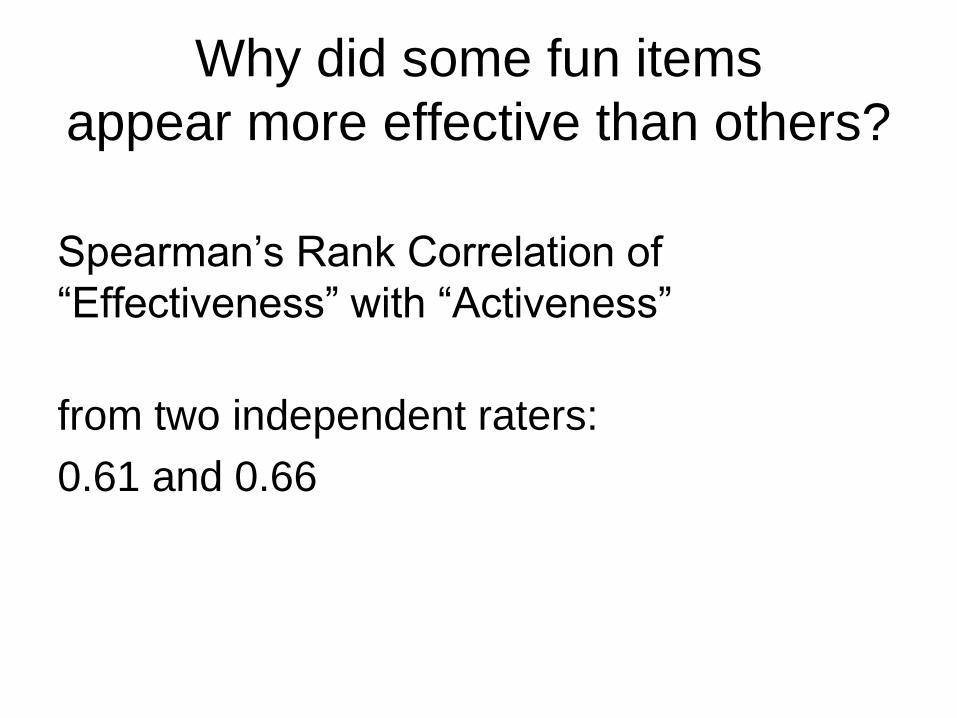
Why did some fun items
appear more effective than others?
Spearman’s Rank Correlation of
“Effectiveness” with “Activeness”
from two independent raters:
0.61 and 0.66