dr. b.d. maxfield office of army demographics then and now active-duty army sedat 2004
TRANSCRIPT

Dr. B.D. Maxfield
Office of Army Demographics
Then and NowThen and Now
Active-Duty ArmyActive-Duty Army
SEDAT 2004SEDAT 2004

Dr. B.D. Maxfield, Office of Army Demographics
11.8
1.9
86.3
13.2
2.3
84.5
13.8
2.4
83.8
0% 20% 40% 60% 80% 100%
Officers
Enlisted
Warrants
Active-Duty Army by Grade
Source: DMDC
FY83 FY93 FY03
2

Dr. B.D. Maxfield, Office of Army Demographics
3.3%
4.7%
2.0%
62.4%27.6%
2.6%
3.8%1.3%
64.0%28.3%
FY83FY83775,260775,260
FY03FY03493,563493,563
FY93FY93568,529568,529
3.3%
9.9%
3.5%
59.3% 24.0%
Active-Duty Army by Race/Ethnicity
Source: DMDC
White Black Hispanic Other*Asian
3* Other includes unknown and Alaskan Native/American Indian
Dr. B.D. Maxfield, Office of Army Demographics
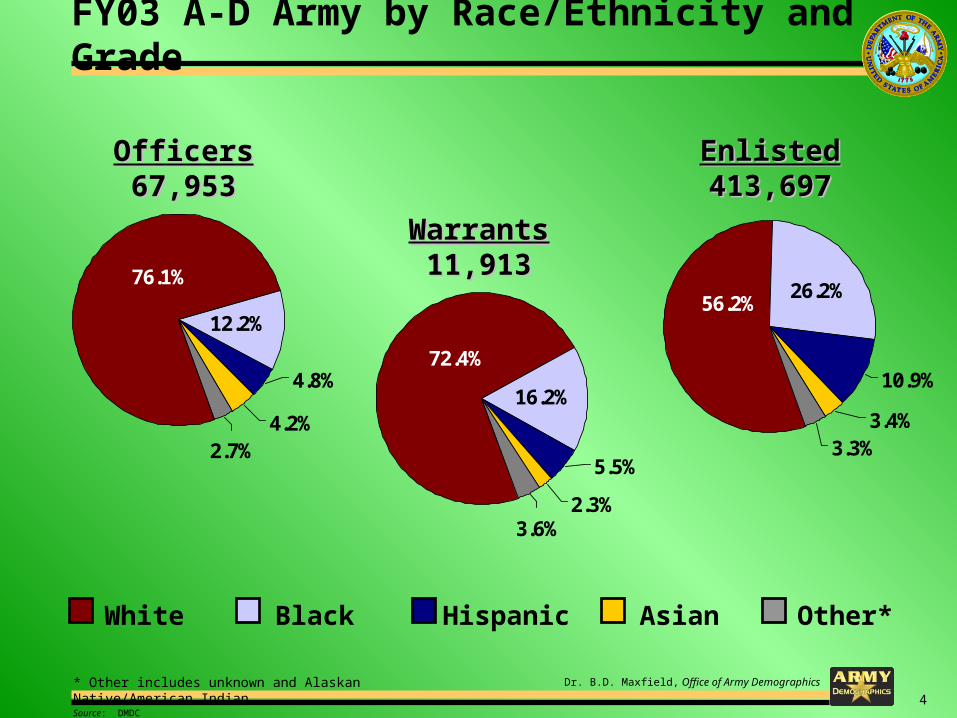
3.3%
10.9%
3.4%
56.2%26.2%
2.7%
4.8%
4.2%
76.1%
12.2%
FY03 A-D Army by Race/Ethnicity and Grade
Source: DMDC
* Other includes unknown and Alaskan Native/American Indian
White Black Hispanic Other*Asian
3.6%
5.5%
2.3%
72.4%
16.2%
OfficersOfficers67,95367,953
EnlistedEnlisted413,697413,697
WarrantsWarrants11,91311,913
4

Dr. B.D. Maxfield, Office of Army Demographics
Enlisted FY83 FY93 FY03Non-Prior Service Accessions 132,731 70,380 69,571
High School Diploma Graduate* 87.6% 94.5% 89.5%
Test Score Category I-IIIA** 61.4% 70.2% 72.7%
Females 12.4% 16.5% 19.2%
Males 87.6% 83.5% 80.8%
0%
20%
40%
60%
80%
100%
HSDG* TSC I-IIIA** Females Males
FY83 FY93 FY03
Army Enlisted Accessions
Source: Enlisted Accessions Division
* Does not include GEDs or GED+
6

Dr. B.D. Maxfield, Office of Army Demographics
FY03 Asians Hispanics Blacks Whites Total (Includes Other/Unknown)
Non-Prior Service Accessions 2,366 8,467 11,050 46,751 69,571
High School Diploma Graduate* 95.1% 94.2% 95.3% 86.9% 89.5%
Test Score Category I-IIIA** 65.1% 57.0% 51.4% 81.2% 72.7%
Females 20.0% 23.3% 33.4% 14.9% 19.2%
Males 80.0% 76.7% 66.6% 85.1% 80.8%
FY03 Army Enlisted Accessions by Race/Ethnicity
Source: Enlisted Accessions Division
0%
20%
40%
60%
80%
100%
HSDG* TSC I-IIIA** Females Males
Asians Hispanics Blacks Whites
* Does not include GEDs or GED+
7

Dr. B.D. Maxfield, Office of Army Demographics
BLACKS 1983 (219,271)
1993(157,046)
2003(118,650)
TOTAL 28.3% 27.6% 24.0%
Officers 9.0% 11.1% 12.2%
Enlisted 31.4% 30.7% 26.2%
Warrants 6.0% 10.6% 16.2%
Blacks in the Army
0%
5%
10%
15%
20%
25%
30%
35%
Officers Enlisted Warrants
1983 1993 2003
Source: DMDC
TOTAL 83 93 03 83 93 03 83 93 03 83 93 03
8

Dr. B.D. Maxfield, Office of Army Demographics
Hispanics 1983 (29,110)
1993(26,668)
2003(48,951)
TOTAL 3.8% 4.7% 9.9%
Officers 1.2% 2.5% 4.8%
Enlisted 4.2% 5.1% 10.9%
Warrants 1.4% 3.0% 5.5%
Hispanics in the Army
0%
5%
10%
15%
20%
25%
30%
35%
Officers Enlisted Warrants
1983 1993 2003
Source: DMDC
TOTAL 83 93 03 83 93 03 83 93 03 83 93 03
9

Dr. B.D. Maxfield, Office of Army Demographics
Asians 1983 (9,701)
1993(11,242)
2003(17,397)
TOTAL 1.3% 2.0% 3.5%
Officers 0.9% 2.1% 4.2%
Enlisted 1.3% 2.0% 3.4%
Warrants 0.6% 1.5% 2.3%
Asians in the Army
0%
5%
10%
15%
20%
25%
30%
35%
Officers Enlisted Warrants
1983 1993 2003
Source: DMDC
TOTAL 83 93 03 83 93 03 83 93 03 83 93 03
10

Dr. B.D. Maxfield, Office of Army Demographics
Females 1983 (75,548)
1993(70,797)
2003(74,907)
TOTAL 9.7% 12.5% 15.2%
Officers 10.2% 14.2% 16.4%
Enlisted 9.9% 12.4% 15.2%
Warrants 1.2% 3.8% 7.1%
Females in the Army
0%
5%
10%
15%
20%
25%
30%
35%
Officers Enlisted Warrants
1983 1993 2003
Source: DMDC
TOTAL 83 93 03 83 93 03 83 93 03 83 93 03
11

Dr. B.D. Maxfield, Office of Army Demographics
Source: DMDC
0%
10%
20%
30%
40%
50%
60%
Whites Blacks Hispanics Asians
Combat Arms Combat Service Combat Service Support
Active-Duty Army Enlisted by CA, CS, CSS and Race/Ethnicity, FY03
Race/Ethnicity Combat Arms
Combat Service
Combat Service Support
Other Total # Enlisted in Army
% of Enlisted Force
Whites 36% 21% 27% 16% 100% 232,350 56.2%
Blacks 16% 15% 52% 17% 100% 108,436 26.2%
Hispanics 29% 16% 39% 16% 100% 45,029 10.9%
Asians 28% 16% 40% 16% 100% 14,244 3.4%
Other/Unknown 28% 16% 38% 18% 100% 13,638 3.3%Note: Percentages in CA, CS, CSS and Other are calculated for each race/ethnic group separately.
12

Dr. B.D. Maxfield, Office of Army Demographics
Active-Duty Army Married by Rank
FY93 (Total Married = 335,450)
FY03 (Total Married = 257,684)
Grades # % # % Officers 54,419 73% 45,700 67% Enlisted 269,871 56% 202,134 49% Warrants 11,160 85% 9,850 83%
Source: DMDC
0%
20%
40%
60%
80%
100%
Officers Enlisted Warrants 93 03 93 03 93 03
Note: Percentages are based on the number of Active-Duty married divided by the TOTAL number of Active-Duty in that specific grade.
TOTAL
59%52%
FY93 FY03
13

Dr. B.D. Maxfield, Office of Army Demographics
Active-Duty Army Families
Marriages FY93 FY03
# % # %
Joint Service Marriages 33,745 10.1%* 26,836 10.4%*
Civilian Marriages 301,705 89.9%* 230,848 89.6%*
Children FY93 FY03
# % # %
Soldiers with Children 277,804 48.9% 232,194 47.0%
Officers 40,449 53.9% 35,813 52.7%
Warrants 9,660 73.6% 9,053 76.0%
Enlisted 227,695 47.4% 187,328 45.3%
Single with Child 32,661 5.7% 38,013 7.7%
Officers/Warrants 2,906 3.3% 3,693 4.6%
Enlisted 29,755 6.2% 34,320 8.3%
* Percentage based on Active-Duty married
Source: DMDC 14

Dr. B.D. Maxfield, Office of Army Demographics
Home of Record of Today’s Army
Source: DMDC
New EnglandNew England
16%18%
13% 31%
14% 3%WestWest
MidwesMidwestt
SouthweSouthwestst
SouthSouth
Mid-Mid-AtlanticAtlantic
15

Dr. B.D. Maxfield, Office of Army Demographics
EO Discrimination Complaints*
* Includes complaints filed via IG and EOA
Source: Human Factors Leadership Division
Equal Opportunity
0
50
100
150
200
250
300
FY00 FY01 FY02 FY03
Complaints Filed
Substantiated
30
247
192
2630
149
20
175
16

Dr. B.D. Maxfield, Office of Army Demographics
Sexual Harassment Complaints*
Source: Human Factors Leadership Division
* Includes complaints filed via IG and EOA
Sexual Harassment
0
50
100
150
200
FY 00 FY 01 FY 02 FY03
Complaints Filed
Substantiated
160 122
127 125
6558 49 48
17

Dr. B.D. Maxfield, Office of Army Demographics
0%
20%
40%
60%
80%
100%
GS 1-4 GS 5-8 GS 9-12 GS/GM13-15
SES
FY83 FY93 FY03
Males Females Males Females Males Females
Grades # % # % # % # % # % # %
GS 1-4 12,497 22.1 44,002 77.9 5,197 25.6 15,139 74.4 4,138 35.1 7,650 64.9
GS 5-8 24,651 32.8 50,500 67.2 18,086 30.6 41,036 69.4 15,847 37.6 26,333 62.4
GS 9-12 61,813 73.7 22,023 26.3 53,144 61.9 32,663 38.1 39,338 58.1 28,418 41.9
GS 13-15/GM 21,122 94.0 1,352 6.0 24,566 83.2 4,959 16.8 19,146 73.6 6,884 26.4
SES 331 97.1 10 2.9 259 92.8 20 7.2 211 82.7 44 17.3
FY 2003
Army Civilians by Grade and Gender
0%
20%
40%
60%
80%
100%
GS 1-4 GS 5-8 GS 9-12 GS/GM13-15
SES
0%
20%
40%
60%
80%
100%
GS 1-4 GS 5-8 GS 9-12 GS/GM13-15
SES
FY 1993
FY 1983
Source: DMDC
Note: Percentages are based on the number in a specific grade divided by the TOTAL number in that specific grade.
MalesFemales
18

Dr. B.D. Maxfield, Office of Army Demographics
Army Reserves by Gender
Source: DMDC
75.7%79.2%
84.1%
20.8%
24.3%
15.9%
0%
10%
20%
30%
40%
50%
60%
70%
80%
90%
1983 1993 2003
Males
Females
Total Army Reserves
Males Females
# % # %
FY83 223,750 84.1 42,438 15.9
FY93 218,590 79.2 57,310 20.8
FY03 160,388 75.7 51,502 24.3
19

Dr. B.D. Maxfield, Office of Army Demographics
Army Reserves Race by Gender, FY03
Source: DMDC
2.2%
10.1%
3.7%
46.9%
37.1%
2.2%
10.6%
4.0%
62.8% 20.4%
* Other includes unknown and Alaskan Native/American Indian
White Black Hispanic Other*Asian
2.1%
10.5%
3.9%
59.0% 24.5%
MaleMale160,388160,388
FemaleFemale51,50251,502
TotalTotal211,890211,890
20

Dr. B.D. Maxfield, Office of Army Demographics
Army National Guard by Gender
87.4%92.3%
94.7%
7.7%12.6%5.3%
0%
20%
40%
60%
80%
100%
1983 1993 2003
Males
Females
Total Army National Guard
Males Females
# % # %
FY83 395,161 94.7 22,017 5.3
FY93 378,533 92.3 31,386 7.7
FY03 306,840 87.4 44,249 12.6
Source: DMDC21

Dr. B.D. Maxfield, Office of Army Demographics
Army National Guard by Race & Gender, FY03
2.7%
7.4%2.5%
62.2%25.2%
2.0%
7.5%
2.2%
75.1%
13.2%
White Black Hispanic Other*Asian
2.0%
7.5%
2.3%
73.5%
14.7%
MaleMale306,840306,840
FemaleFemale44,24944,249
TotalTotal351,089351,089
Source: DMDC
* Other includes unknown and Alaskan Native/American Indian22

Dr. B.D. Maxfield, Office of Army Demographics
Dr. B. D. MaxfieldDr. B. D. MaxfieldChief Chief
Office of Army DemographicsOffice of Army Demographics
E-mail: [email protected]
Web Address: http://www.armyg1.army.mil
POC / Website
23