dr-22-v-ol dr-22-v-02 soils design report - volume ii
TRANSCRIPT

.-
., ...
DR-22-V-Ol
Soils Design Report - Volume IPlant Site Near Surface
DR-22-V-02
Soils Design Report - Volume IIAccess Roads And
Railroad Soils Report
The Title I revisions for these documents
were not available at this time. They will
be sent later for inclusion in this report .

-TABLE OF CONTENTS
Paragraph PageNumber Number
1.0 INTRODUCTION 8
2.0 SCOPE OF WORK 8
3.0 SITE GEOLOGY 8
4.0 EXPLORATION 9
5.0 SITE CONDITIONS 14
6.0 LABORATORY SOIL TESTING 17
7.0 FOUNDATION EVALUATION 28
8.0 LATERAL EARTH PRESSURES 33
9.0 SLOPE STABILITY - 38
10.0 FOUNDATION CONSTRUCTION( 51 39
REFERENCES 45
-
Best Copy AvailablbHoseo
US. DEPARTMENT OF ENERGYWASTE ISOLATION PILOT PLANT
SOILS DESIGN REPORT - VOLUME IPLANT SITE NEAR SURFACE STRUCTURES
~ S.3f.Ji REV. 6.2.1, 6.2.5, 7.3, 10.3, 10.4 &Fiqs. 4, 5 & 6 REISSUED FOR TITLE I
.&. S ~ ~. 7'1 1=Y')~ .to: T
~ £. 7- 5- 7iJ ss I to: FOR CLIENT APPROVAL(; NO. DATE DESCRIPTIONZw~i
BV CHK'O
DOCUMENT NO.
DR-22-V-Ol
SHEET 1 OF 46
OOE
REV.
2

WIPP PROJECT
SOILS DESIGN REPORTVOLUME I
PLANT SITE NEAR SURFACE STRUCTURES
1. INTRODUCTION
2. SCOPE OF WORK
3. SITE GEOLOGY
4. EXPLORATION
4.1 General4.2 Shallow Borings4.3 Geophysical Measurements4.4 Permeability Tests and Observation Wells4.5 Test Pits4.6 Electrical Resistivity
5. SITE CONDITIONS
5.1 Surface Conditions5.2 Near Surface Conditions
5.2.1 Strata5.2.2 Ground Water
6. LABORATORY SOIL TESTING
6.1 Introduction6.2 Classification Tests
6.2.16.2.26.2.36.2.46.2.56.2.6
Sieve and Hydrometer AnalysesAtterberg Limi tsIn-Situ Moisture Content and Unit WeightSpecific GravityMoisture-Density RelationshipRelative Density
6.3 Engineering Properties Tests
......:::.
e:c-6zwti~-L- ~-~--------""':":':'-::;__-=____:_::-~
DOCUMENT NO.DR-22-V-Ol REV._2==--__ SHEET_--.;;;.2__ OF_....;;4;u6"--__

6.3.1
6.3.2
6.3.3
6.3.4
6.3.56.3.66.3.76.3.86.3.9
Unconsolidated Undrained TriaxialCompression TestsConsolidated Undrained TriaxialCompression Tests with Pore PressureMeasurementsConsolidated Drained TriaxialCompression TestsStrain-Controlled Cyclic TriaxialCompression TestsResonant Column Testspermeability TestsConsolidation TestsChemical AnalysisElectrical Resistivity
6.4 Design Engineering Properties
7. FOUNDATION EVALUA~ION
7.1 General7.2 Design Criteria7.3 Foundation Treatment7.4 Net Ultimate Bearing Capacity7.5 Foundation Settlement
7.5.17.5.2
Static SettlementsEarthquake-Induced Settlements
7.6 Foundation on In-Situ Sand
8. LATERAL EARTH PRESSURES
8.1 Introduction8.2 Active Earth Pressure8.3 At Rest Earth Pressure8.4 Passive Earth Pressure8.5 Dynamic Earth Pressure
8.5.18.5.2
GeneralDynamic Lateral Pressure Incrementdue to Seismic Loading
9. SLOPE,: STABILITY''t:\
9.1 Design Criteria and Analysis
CO:'-t!lzwt~Cii":'-L-----~~~--------___:"=_____::;_--::_:__;7""---
DOCUMENT NOpR-22-V-Ol REV.---t2_____ SHEET__3 OF 46
(

10. FOUNDATION CONSTRUCTION
10.110.210.3
10.4
Site GradingExtent of Excavation and BackfillDewatering, Slope Protectionand Excavation InspectionStructural Backfill
r:o-6zw
B:i~
REFERENCESTABLESFIGURES
-DOCUMENT NO. DR-22-Y-Ol REV._....l!o2'----_ SHEET_~4 _ OF 46

List of Tables
No.
1
2
3
4
5
6
7
8
9
10
11
12
13
14
15
16
Summary of Laboratory Test Results
Engineering Properties of In-Situ Soil and Shallow Rock
Engineering Properties of Sand Backfill
Design Properties of In-Situ Soil and Shallow Rock
Design Properties of Sand Backfill
Seismic Velocities and Elastic Moduli
Design Dynamic and Static Shear and Elastic Moduli
Relative Density of In-Situ Sand
010 Size and Coefficient of Uniformity of Tested SandBackfill
Chemical Analyses of Foundation Materials
Plate Load Test Results
Net Applied Pressures and Net Ultimate BearingPressures
Settlement of Foundations
Field Resistivity Survey
Laboratory Resistivity
pH, Sulphates and Chlorides (Samples from ResistivityTest Locations)
C';'-Clzw&:i~-L---- -~--__=_---......::::.:.-_:__:-~-_=_""'A'T-~
DOCUMENT NO.DR-22-V-Ol REV._.;...2__ SHEET__5~__ OF 46

List of Figures
No.
1 Site Exploration Plot Plan
2 Isopach Map - Upper Sand
3 Contours of Top of Mescalero Caliche
4 Contours of Top of Gatuna Formation
5 Near Surface Soil Profiles, West-East
6
7
8
9
10
11
12
13
14
15
l6{a)
l6{b)
l6{c)
Near Surface Soil Profiles, South-North
Excavation and Backfill - Plan and Sections
Standard Penetration Test vs Depth
Plate Load Test Data
Natural Moisture Content and Unit Weight vs Depth
Grain Size Distribution - Upper Sand
Grain Size Distribution - Caliche
Grain Size Distribution - Gatuna
Atterberg Limits vs Depth
Undrained Shear Strength vs Depth - UndisturbedSamples
Effective Strength Envelopes CD TestsUpper Sand - Compacted Samples
Effective Strength Envelopes CU and CD TestsCaliche - Compacted Samples
Effective Strength Envelopes CU and CD TestsGatuna - Compacted Samples
DOCUMENT NO.DR- 22-V-Ol

List of Figures
No.
17
18
19
20
21
22
Effective Strength Envelopes CD TestsUpper Sand - Undisturbed Samples
Effective Strength Envelopes ell and CD TestsCaliche - Undisturbed Samples
Effective Strength Envelopes CU and CD TestsGatuna - Undisturbed Samples
Variation of Shear Moduli with Strain - CompactedSand
variation of Shear Moduli with Strain - Caliche
Variation of Shear Moduli with Strain - Gatuna
Damping Ratios vs Strain - Compacteo Sand
Damping Ratios vs Strain - Caliche
Net Bearing Pressures vs Settlements
23
24
25
26
Damping Ratios vs Strain Gatuna
2728
Induced Shear Strain Profile
Static and Dynamic Lateral Earth Pressures
(t
"~LDiiCiUMioo:;Cimb~~:Q1==Ri:V::=~2==~:::=::='-liiiEET.==7C==-OF-=~===DOCUMENT NO.DR- 22 -V-01 REV._..::....__ SHEET_--,-__ OF 46

1. INTRODUCTION
Volume I of the soils design report presents theresults of foundation studies for the surfacestructures' at the Waste Isolation Pilot Plant (WIPP)located in southern New Mexico about 26 miles east ofCarlsbad in eastern Eddy County. The results ofstudies for the access roads and railroad will be'presented in Volume II of the soils design report.
To develop information for this report, a fieldexploration program, laboratory testing andengineering analyses were performed during November1978 through May 1979.
The locations of the borings and test pits used inthe evaluations are shown on Figure 1. The logs ofall borings and test pits together with the resultsof all field and laboratory tests are contained inthe series of reports by Sergent, Hauskins & Beckwithwhich are in Reference 16 to this report. The soiltest results are summarized in Table 1.
2. SCOPE OF WORK
This report summarizes the soil and foundationinvestigations made to evaluate the near surfaceconditions at the WIPP site. The foundationinvestigations consisted of drilling, excavating andsampling the near surface soils and rock, conductingfield and laboratory tests, and performingengineering analyses to develop foundationrecommendations for the near surface structures.
The results of the field exploration and laboratorytesting programs, site conditions, foundationevaluation as well as recommendations for earthworkconstruction are provide~ in the report.
3. SITE GEOLOGY
OF _ ....4......6<--__SHEET__8__REV.__2,;"..-_
The WIPP site is located near the eastern edge of thePecos Valley section of the Southern Great Plainsphysiographic province. The site lies on a calicheand sand covered drainage ~ivide separating two~'solution-erosional features, Nash Draw four mile tothe west and San Simon Swale eight miles to the ei\J~lSurface runoff from the si te drains west into li:as :' ", j
,.Draw, eventually reaching the Pecos River, abou~' I
miles southwest of the site. .P/---
Recent windblown sand and partly stabilized sanddunes blanket most of the site area. The sand isbelieved to have been moved westward from the nighPlains, where the inferred source material, the sandyOgallala Formation, is abundant. A hard, resistantduricrust or caliche (Mescalero Caliche) is typically
DOCUMENT NO. DR-22-V-Ol
c:<-ozw
f':'-6( z
w
l:iiii~-
4 .
4.1
present beneath the sand blanket. The caliche formednear the surface through capillary rise ofcarbonate-laden water. The caliche is anaccumulation of calcareous ana clastic materialcemented with calcite and silica. Its resistance toweathering in the nry climate has protected the moreerodible underlying strata from exposure.
The caliche has developed upon the surface of theunderlying bedrock called the Gatuna Formation. TheGatuna Formation is the only Pleistocene deposit atthe WIPP site assigned a formal stratigraphic name.The Gatuna Formation consists of a fine-grained,reddish-brown sandstone with some conglomeratelenses. The Gatuna Formation is tentatively assigneaa Kansan age and the caliche formed upon it aYarmouthian (interglacial) age; that is, the calicheformed starting about 500,000 years ago.
The WIPP site is within seismic Zone 1, according tothe Uniform Building Code, 1976. Within this zone,seismic risk is defined such that minor damage may beexpected; distant earthquakes may cause damage tostructures with fundamental periods greater than 1.0second; and earthquake parameters typical of thoseassociated with intensities of V and VI on theModified Mercalli scale are appropriate. The resultsof seismic analysis of the site by Sandia (1) haveshown that the Design Basis Earthquake accelerationis less than or equal to 0.06g. For additionalconservatism, however, a Design Basis Earthquakeacceleration of O.lg is used for foundationevaluation as concluded in the Seismic EvaluationReport (2).
EXPLORATION
General
The near surface exploration program has beenneveloped by Bechtel and carried out by Sergent,Hauskins and Beckwith. Bechtel soil engineers andgeologists observea drilling, sampling and testingoperations. The purpose of the exploration was toestablish the near surface conditions at the site and
,to determine static and dynamic properties of~/. soil and rock to develop foundation design
requirements for the surface structures. Bo h"itfield and laboratory work \1ere done unt1er aQul~t... ".Assurance Program in conformance with the appltc&P.requirements of ANSI N45.2 as modified by NRC.Regulatory Guide 1.28. ~
The near-surface exploration program for the plantsite was conaucted in two stages. Stage I includeddrilling, sampling and testing of 52 shallow boringsnumbered B-1 through B-24 and B-26 through B-53 and
...::~.;.
DOCUMENT NO. DR-22-V-Ol REV.__2__ SHEET_---o::9__ OF_....;4;.;:6~__

one deep boring numbered B-54. Nine shallow boringswere drilled for a seismic cross-hole and downhole
-- survey which was conducted by Harding Lawson andAssociates. In addition, a seismic refraction surveywas made in shallow holes along grid lines,permeability tests were performed and 11 observationwells were installed at various depths in selectedborings for ground water studies at the site.
Stage II included excavation, sampling and testing of5 test pits numbered TP-l through TP-5 at the plantsite. Plate load tests were made at selected depthsin test pits TP-3 and TP-5. In addition, electricalresistivity measurements were conducted at sixlocations numbered R-l through R-6 to determine thecorrosion potential in the upper materials.
The locations of all the borings, observation wells,seismic refraction survey lines, test pits andelectrical resistivity tests are shown on Figure 1.Geologic profiles showing the different strataincluding some of the significant engineeringproperties are shown on Figures 5 and 6.
4.2 Shallow Borings
The shallow borings were nrilled during the period ofNovember 1978 to January 1979. The borings wereadvanced with Central Mine Equipment rotary drillrigs, Model 55, using 6-1/2 inch hollow stern augersand NX core barrels. The number of drill rigs inoperation varied from one to two. Air pressure wasused during drilling and sampling in the shallowborings without use of water or drilling mud. Atotal of 52 borings were ,drilled to a maximum depthof 100 feet.
nc
The initial 24 borings numbered B-1 through B-24 weredrilled to depths of 24.5 to 100 feet on a gridpattern shown on Figure 1. In addition thin-walledtube samples were taken at selected depths. Th"borings were advanced at least 15 feet into t ~~ \Gatuna Formation. ~h~
21 additional borings numbered B-26 through B 46,~i )drilled to depths between 26 and 100 feet at p /~ocations for the surface structur~s. Boringsnumbered B-26 through B-40 were sampled and coredinto the Gatuna Formation to a mini~um depth of 15feet. Six borings numbered B-41 through B-46 weredrilled to a depth of 100 feet for the cross-hole anddownhole seismic survey. Borings numbered B-8, B-32and B-34 were also used for the seismic survey.Finally, seven additional borings numbered B-47through B-53 were drilled to depths of 15 to 30feet. Five of these borings numbered B-47 throughB-51 were drilled at the plant site to obtain
r:oc;zw
ti~-L.-----=-::~~':":__-- ------~_::o_--~-
nnrllUUIT un DR-22-V-Ol a~v 2 ~UC~T 10

additional tube samplesFormation for laboratoryB-53 were drilled at thewere sampled and cored 15Formation.
in the caliche and Gatunatesting. Borings B-S2 andsewage treatment plant, andfeet into the Gatuna
r:o-6zw
,:.,
-
I~I-
Standard penetration tests with split spoon sampling,thin-walled Shelby tube samples, ann NX cores wereobtained in these borings at selected intervals.
Standard penetration tests with split spoon samplingwere made in the sand and caliche, and in someborings in the upper portion of the Gatuna Formation.The standard penetration tests were performed inaccordance with ASTM 0-1586 with a split barrelsampler 1-3/8 inch 1.0. and 2 inch 0.0. The resultsof standard penetration tests are shown on Figure 8.The average percent recovery for the split spoonsamples was 95 for the upper sand, 86 for thecaliche, and 79 for the Gatuna Formation.
Thin-walled tube samples were obtained in the sand,caliche, and in the top 6 feet of the GatunaFormation. The tube samples were taken with aPitcher sampler equipped with a 2-7/8 inch 1.0. thinwalled Shelby tube.
Difficulties were encountered in the field duringPitcher sampling of the caliche and Gatuna Formation.In addition, some of the samples were unsuitable fortesting when extruded in the laboratory.
In the sand stratum, 11 Pitcher samples wereattempted; 10 of those were successful. The averagepercent recovery for the sand samples was 91. Allthe Pitcher samples of sand that were extruded in thelaboratory were suitable for testing.
Pitcher sampling of the caliche and Gatuna Formationwas less successful because it was hard for thesampler to advance in these strata. In the caliche,69 Pitcher samples were attempted but only 50 ofthose were successful~ The average recovery of thecaliche samples was 64 percent. When extruded in thelaboratory only 83 percent of the caliche sampleswere found suitable for testing. In the GatunaFormation, 68 Pitcher samples were atte~pted·~t only61 of those were successful. The aver~ge,p'e~Qv~y ofthe Gatuna samples was 68 percent. When ~~tl~\e~ inthe laboratory only 44 percent of the ~~~am~leswere found suitable for testing.
The effects of sample disturbance on the tes r~sults
and on selection of design properties for foun~ationevaluation are discussed in detail in Sections 6, 7and 9.
DOCUMENT NO. DR-22-V-Ol REV.__2__ SHEET__l_l __ OF_..;;z4~6~__

NX size rock cores were obtained in the GatunaFormation in accordance with ASTM D-2113.
All borings were grouted with cement grout uponcompletion of sampling and testing.
4.3 Geophys ical Surveys.
A seismic refraction survey was made by Sergent,Hauskins & Beckwith in December 1978 as part of thenear surface exploration at the site. The locationsof the seismic survey lines are shown on Figure 1,and the detailed results of the refraction survey arepresented in Reference 3. In addition, a seismiccross-hole and downhole survey was performed byHarding Lawson and Associates in January 1979 in nineshallow borings to determine compressional and shearwave velocities of the near surface materials to adepth of 100 feet. The nine seismic borings are inthree arrays as shown on Figure 1. The results ofthe cross-hole and downhole seismic survey arepresented in Reference 4, and are summarized in Table6 of this report.
The compresssional and shear wave velocities measuredin the cross-hole survey were used to determine thedynamic elastic ?roperties of the near surfacematerials.
4.4 Permeability Tests and Observation Wells
Permeability tests were performed in selected shallowborings in the upper sand, caliche and GatunaFormation. These tests were done in accordance withthe Bureau of Reclamation procedure designation E-18.In addition, well permeameter tests (Bureau ofReclamation designation E-19) were performed in theupper sand at the site. Results of the fieldpermeability tests indicated that the upper sand hasa high permeability in the range of 1170 to 6460ft/yr (1.1 x 10⁻³ to 6.2 x 10- 3 em/sec). Although,~~the caliche is fractured it was found to be ,relatively impermeable with permeabilities in t eM \\range of 14 to 240 ft/yr (1.4 x 10⁻⁶ to 2.3 x 0- )em/sec), and therefore acts as an aquiclude. T e /Gatuna Formation is about one order of magnitude less /~'
permeable than the upper sand and has permeabil it i /in the range of 70 to 1860 ft/yr (6.A x 10-5 to 1.8 x10⁻³ em/sec.)
12SHEETREV.__2 _
Eleven observation wells were installed at the site,ten in shallow borings to depths between 8 and 53feet and one in the deep boring B-54 at a depth of195 feet. These observation wells have beenmonitored since February, 1979 and have showed noground water within a depth of 195 feet. Thedetailed results of the permeability tests and
','
DOCUMENT NO. DR-22-V-Ol
monitoring of the observation wells are presented inReference 16.
4.5 Test Pits
Five test pits, numbered TP-l through TP-5, wereexcavated to depths of 13.5 to 30 ft at the siteduring March 1979 to determine in-situ properties ofthe soil and rock and to obtain bulk samples forlaboratory testing. Field density tests and bulksamples were obtained at selected depths in the sand,caliche, and Gatuna Formation. Plate load tests weremade in the two pits numbered TP-3 and TP-5.Excavation of the test pits was by dozer and backhoe,down to the Gatuna Formation. The locations of thetest pits are shown on Figure 1, and the logs of testpits are included in Reference 16.
A total of 27 in-situ density tests were made in thetest pits in accordance with ASTM D 1556. At leastone in-situ density test was made in each stratumencountered in each of the five test pits. In-situdensity tests were also made adjacent to the plateload tests in test pits TP-3 and TP-5. The resultsof in-situ density and natural water contentdeterminations are shown on Figure 10.
A total of 22 bulk samples were obtained from thetest pits. At least one bulk sample was obtained foreach stratum encountered in each pit. Bulk sampleswere obtained adjacent to in-situ density tests.
DOCUMENT NO. DR-22-V-Ol
Photographs were taken of each of the five pits whichare included in Reference 17.
A total of 14 plate load tests were made in test pitsTP-3 and TP-S. In both TP-3 and TP-S, plate loadtests were made at depths of 3 ft into the upper sandlayer, on top of the caliche and at intermediatedepths in the caliche. Also, plate load tests weremade at the top of the Gatuna Formation in test pitTP-3. In addition to the 14 plate load tests, oneplate load test was made in a hand-dug hole located116 ft northeast of boring B-25 in the upper sandstratum at a depth of 3 ft. This plate load testmade outside the test pits in order to test thesand with a minimum disturbance from the excavatiequipment. The results at hand dug hole weresignificantly lower than those inside the test pi}s.It was concluded that the plate load tests for t~upper sand in the test pits were affected by thedozer operation. Therefore, the elastic modu .obtained in the han9 dug hole were used for thein-situ upper sand layer. The plate load tests weremade in accordance with ASTM D 1196. The results ofall plate load tests are shown on Figure 9 and aresummarized in Table 11.
t:'
6zwi:i~-L-.... ----::-:- --::-::--~
REV 2 SHEET_~.;..1..;..3__ OF __....;;4...;;;6__'-'-;:;;"--

The test pits were backfilled with loose excavatedmaterial upon completion of sampling, testing andphotographing.
4.6 Electrical Resisitivity
Electrical resistivity measurements were conducted atsix locations numbered R-l through R-6 to determinethe corrosion potential in the upper materials ..
In-situ resistivity values in ohms-ern were obtainedby the fall-of-potential method to depths of 5 and 10feet at the six locations. The locations ofelectrical resistivity tests are shown on Figure 1,and the results are included in Reference 16 and aregiven in Table 14.
5 . SITE CONDITIONS
5.1 Surface Conditions
The ground at the site has local undulations of a fewfeet and slopes gently to the west and southwest.Elevations in the plant site range from 3385 feet atboring B-52 in the southwest to 3440 feet at boringB-37 in the east. Based on these elevations, theplant site slopes about 1% to the southwest. Thesurface soils consist of eolian sand plains and sanddunes. The sand dunes are partly stabilized byvegetation, mainly mesquite, scattered grasses andannuals.
)
5.2 Near Surface Conditions
5 .• 2.1 Strata
The materials above bedrock vary in thickness from 10to 20 feet and consist of an upper stratum ofreddish-brown, fine, poorly graded, very loose tomedium dense sand which is underlain by a stratum of"caliche" consisting of white to brown well-cemented,hard, fine silty sand. Bedrock, underlying thecaliche, consists of sandtone of the GatunaFormation. The various strata are shown on thesurfac~ geological profiles on Figures 5 and 6j and
" --"are described below.
OFSHHT 142REV.
The upper sand stratum extends from thesurface to a depth varying from 3 to 16
·sand
Upper. Sand
DOCUMENT NO.DR-22-V-Ol
f:"-6zIU

(
The standard penetration resistance for the uppersand ranged from 2 to 20 blows per foot. The higherblow counts were generally encountered near thecontact with the caliche. Based on the standardpenetration resistance, the upper sand varies indensity from very loose to medium dense. The shearwave velocities as measured by the seismic cross-holesurvey method varied between 450 and 900 feet persecond and the compression wave velocity variedbetween 1100 and 1800 feet per second.
Caliche
Beneath the upper sand is a continuous stratum ofhard caliche which is locally called ~Mescalero
Caliche" and forms a resistant ~caprock~ over theGatuna Formation. The caliche appears to beirregular and undulating as shown on Figure 3 andvaries in thickness from 3 to 15 feet. The calicheis made up of fine silty sand particles and ismoderately to strongly cemented with calciumcarbonate. The lower portion of the caliche (about 1to 3 feet) blends gradually with the underlyingGatuna Formation. The color of caliche is white tobrown.
The standard penetration resistance of the calicheranged from 50 to 100+blows per foot, except in onecase where 36 blows per foot was encountered. Ingeneral, the caliche is hard to very hard. The top 2feet closely resembles limestone. The structure ofthe upper caliche is plated and changes gradually tonodular with depth. The shear wave velocities incaliche varied between 1000 and 1900 feet per secondand the compression wave velocities varied between2000 and 4000 feet per second.
Gatuna Formation
Bedrock underlying the caliche is sandstone of theGatuna Formation varying in thickness from 16 to 28feet. This rock is poorly indurated, relatively weakand friable. The top of the Gatuna Formation isencountered at about 10 to 20 feet below the naturalground surface and is irregular as shown 'on--Eigure 4.
-;The Ga tuna Formation cons ists of fin "gl:air:\I'.'dcemented sandstone. In most of the it7'fl~a~ a, theupper 6 feet of the Gatuna is weakly c~ . a nd thedegree of cementation increases with ~. e¢ementing agents based on the chemical nal es. are
-aluminum and ferric oxides which give the G9-.t·~~sandstone its reddish brown color.
OF _....;4;;..;;6"--__SHEET_-=1;,.;:;5__REV._-.2__DOCUMENT NO. DR-22-V-Ol
~
~zw~i~-"- ~-.....J

-
The standard penetration test resistance of the upper25 feet of the Gatuna Formation ranged from 50 to100+blows per foot, except in one case where 34 blowsper--foot was encountered.- The shear wave veloci tiesvaried between 1300 and 2200 feet per second. Thecompression wave velocities varied between 2900 and4700 feet per second.
5.2.2 Ground water
Ground water was not encountered during drilling ofthe shallow borings to a maximum depth of 100 feetand the observation wells to a maximum depth of 200feet. Eleven observations wells were installed atthe site at depths between Band 195 feet. Theseobservation wells have been monitored since February,1979 and have showed no ground water within a depthof 195 feet. Rainfall in this area amounts tobetween 11 and 13 inches anually, which is notsufficient to significantly affect the design offoundations. Therefore, the foundation evaluationwas generally bas~d on data from samples tested atnatural moisture content with the exception of theevaluation of the upper sand layer as foundation forlightly loaded structures. Some of the tests weremade under saturated conditions in order to evaluatethe change in properties due to saturation. Thedifferences in the test results are discussed inSection 6.
-~-ozw
l:i~-L---------------:;2~-------S...H":'E=ET::-__:..-...;;;-::-1~6:===--:O:-F--:.?.4~6~-_-_-_-'
DOCUMENT NO. DB-22-V-Ol REV. _

6.
6.1
LABORATORY SOIL TESTING
Introduction
The laboratory soil testing program was developed byBechtel and carried out by Sergent, Hauskins &Beckwith in their laboratories in Albuquerque andPhoenix and by Dames & Moore in their laboratory inSan Francisco. The tests were performed on jar,thin-walled Shelby tube and bulk samples obtainedfrom the shallow borings and test pits to a depth of25 feet below the ground surface which is 6 feetinto the Gatuna Formation.
The consolidation tests as well as classification,permeability, and electrical resistivity tests weremade by Sergent, Hauskins & Beckwith. The triaxialtests and resonant column tests as well asclassification and permeability tests were made byDames & Moore. In addition, chemical analysis ofthe foundation materials was carried out byMetallurgical Laboratories in San Francisco. The.testing program included the soil tests listed belowand described in the following paragraphs.
Visual and laboratory classification
Sieve and hydrometer analyses
Atterberg limits
In-situ moisture content and unit weight
Specific gravity
Moisture-density relationship
Relative density
Unconsolidated undrained triaxial compression
Consolidated undrained tiraxial compression withpore pressure measurements
Consolidated drained triaxial compression
Strain-controlled triaxial compression~--.
Resonant column
Permeability
Consolidation tests
Chemical analysis
Electrical resistivity
DOCUMENT NO.DR-22-V-Ol REV. _ SHEET _ 46
All test results are given in the reports bySergent, Hauskins & Beckwith and by Dames & Moorein Reference 16 to this report. In addition,all test results are summarized in Table 1 on thesoil test results summary sheets.
Based on field observation as well as seismiccross-hole survey data the Gatuna Formation improvedwith depth. Therefore, for the type of foundationand loads of the near surface structures it wasconsidered adequate to test the materials down to adepth of 25 feet which is 6 feet into the GatunaFormation.
6.2 Classification Tests
All samples for soil testing were examined andclassified in the laboratory to check the fieldclassification. The tube samples, in particular,were examined for disturbance, and only those thatdid not indicate apparent disturbance were used fortesting. Visual classification was made inaccordance with ASTM D 2488, and laboratoryclassification was in accordance with ASTM D 2487.
6.2.1 Sieve and Hydrometer Analyses
Sieve and hydrometer analysis determinations weremade on selected samples from the sand, caliche andGatuna in accordance with ASTM D 422. The resultsare summarized in Table 1, and the envelope of thegrain size distribution curves for each material isplotted on Figures 11 through 13. Individual.grainsize plots are provided in Reference 16 of th~s
report. The DIO size and coefficient of uniformityof tested sand backfill are given in Table 9.Figure 11 gives the envelope of the results of allsamples of the upper sand stratum that were tested.It is not intended to represent a typical size range
..tor the predominant sand encountered in thisstratum.
Limits
esith
was
to:'
6zw
tiOi":'-L------------"""':2::---------==-~1;C8)--::----.4~6~~
DOCUMENT NO.DR-22-V-Ol REV.____ SHEET OF_--__

6.2.3 In-Situ Moisture Content and Unit Weight
Moisture content and dry unit weight were determinedfor the tube samples from the shallow borings.Determinations of moisture content were made inaccordance with ASTM D 2116 and the unit weight wasdetermined by direct measurement of weight andvolume. In-situ moisture content and unit weight vsdepth are shown on Figure 10, and the results aresummarized in Table 1.
6.2.4 Specific Gravity
Specific gravity tests were made in accordance withASTM D 854 on selected samples of each of thefoundation soils. The results are summarized inTable 1.
6.2.5 Moisture-Density Relations
Moisture-density relations (compaction tests) weremade in accordance with ASTM D 1557, on selectedbulk samples of the upper sand stratum, the calicheand Gatuna Formation. Bulk samples of the uppersand were taken from shallow borings as well as fromtest pits to determine the properties of the sand asa backfill material. The caliche and Gatuna samplesw~re taken from test pit excavations. Thecompaction curves are given in Reference 16, and theresults of optimum moisture content and maximum dryunit weight are summarized in Table 1.
Where the moisture-density curve is very flat, as inthe case of cleaner sands, no well defined optimummoisture content exists. Nevertheless moisture willbe required for dust control and to enhancecompaction. The amount of moisture required will beinvestigated during the test fill program.
6.2.6 Relative Density
SHEET_--=1-,,-9__REV._-l2 _
Attempts were made to determine the in-sidensi ty of the upper sand by performing /..._.......
-minimum density tests on selected sampl sdensity tests in the test pits. Maxim .relative density tests were made in acc r~a'ASTM D 2049. A total of six in-situ reI tivedensity tests were made for the upper sand .and the results are given in Table 8. Two of th~
six samples tested had more than 12 percent finesare not included in Table 8. Based on the results,the relative density of the upper sand variedbetween 39 and 81 percent. The high relativedensities are not consistent with other data and thehigh values obtained are considered to overestimatethe relative density of the upper sand. Therelatively high in-situ dry densities determined in
DOCUMENT NO.DR-22-V-OJ
~-L- ~
OF _---'4""'6"-_
<:'-6zwti

the test pit were probably affected by the dozerduring the test pit excavation. Based on thestandard penetration and the pLate_load test data,the density of the upper sand has been shown to varyfrom very loose to medium dense.
6.3 Engineering Properties Tests
Tests were made to determine the static and dynamicengineering properties of in-situ soil and shallowrock for use in analyses made to develop soilfoundation design criteria. These tests aredescribed below. Summaries of the engineeringproperties of the in-situ soils and the sandbackfill are given in Tables 4 and 5 respectively.Design dynamic and static shear and elastic moduliare given in Table 7. The detail~d te~t results aregiven in Reference 16, and sumrnar1zed 1n Table 1.
6.3.1 Unconsolidated Undrained Triaxial Compression Tests
Unconsolidated undrained triaxial compression testswere made on 2 7/8 inch diameter specimens preparedfrom thin-walled tube samples from the caliche andthe Gatuna Formation. The tests were made inaccordance with ASTM 0 2850.
Specimens from both the caliche and the GatunaFormation were tested at natural moisture contentand under saturated conditions. Each specimen wasapproximately 6 inches in height, and was encased ina rubber membrane and placed in the tiraxialchamber. A constant confining pressure of 1, 6 or12 ksf was imposed on the specimen withoutpermitting drainage. ~he test specimen was thensheared under the confining pressure and withoutdrainage. The deviator stress and axial strain wererecorded and also the moisture content and dry unitweight were measured.
It is believed that the lower strength valuesmeasured in the caliche and Gatuna specimens are dueto sample disturbance and the upper values are more
The test results for the caliche and Gatunaspecimens are given in Table 2 and are shown onFigure 15. The undrained shear strength test. OJresults of the caliche varied between 2.4 and6t tmksf at natural moisture content, and between • ~17.0 ksf under saturated conditions. Saturat'o d~d~
not appear to have a significant effect on the /'-.undrained strength of the. cal iche.
The Gatuna Formation sandstone underlying the'caliche had an undrained shear strength of 1.6 to9.5 ksf at natural moisture content, and 1.4 ksfwhen saturated.r:o-c,;
zw
ti~-L- ------------::~----""7":--J
DOCUMENT NO.DR-22-V-Ol REV.__2__ SHEET__2_0__ OF_--...-;4...;6__

representative of the actual strength of thesematerials.
6.3.2 Consolidated Undrained Triaxial Compression Testswith Pore Pressure Measurements
Consolidated undrained (CU) triaxial compressiontests with pore pressure measurements were made onspecimens 2 7/8 inches in diameter and 6 inch highprepared from thin-walled tube samples from thecaliche and the Gatuna Formation. Initially, thetest program consisted of three test specimens to beprepared from tube samples. However, because largequantities of the caliche and Gatuna materials werenot usable, only two test specimens were preparedfrom these samples.
In addition, CU tests were made on compactedspecimens 3 inches in diameter and 6 inch highprepared from bulk samples of the caliche and theGatuna Formation. These specimens were compacted atoptimum moisture content to 95% of the maximum drydensity as determined in accordance with ASTMD 1557, Method D.
Each specimen was encased in a rubber membrane,placed in the triaxial chamber and saturated by theback pressure method. After saturation, the testseries with the three specimens was consolidatedisotropically at confining pressures of 1, 6 and 12ksf, respectively. The test series with the twospecimens was tested at confining pressures of 1 and6 ksf respectively. After consolidation thespecimen was sheared without permitting drainage andpore pressure measurements were made. The deviatorstress, axial strain and pore pressure wererecorded, and the moisture content and dry unitweight were also measured.
s." ;;~ ...
:! The test resul ts for the compacted
f:'-CJZw&:iOi":'-'-- ~~~""""""'""~----___=----------__:=~----~....-.......l
DOCUMENT NO.DR-22-V-Ol REV.__2__ SHEET__2_1__ OF__4_6__
I\

6.3.3 Consolidated Drained Triaxial Compression Tests
Consolidated drained (CD) triaxial compression testswere made on thin-walled tube samples from the uppersand, caliche and Gatuna Formation. The specimenswere 2 7/8 inches in diameter and 6 inches inheight. One series of tests was made for the uppersand, three series for the caliche, and three seriesfor the Gatuna Formation.
In addition, CD tests were made on compactedspecimens 3 inches in diameter and 6 inch highprepared from bulk samples of the upper sand,caliche and Gatuna materials. These specimens werecompacted at optimum moisture content to 95% of themaximum dry density. The maximum dry density wasdetermined in accordance with ASTM D 1557, Method Cfor the upper sand specimens, and in accordance withASTM D 1557, Method D for the caliche and Gatunaspecimens. Three series of tests were made for thecompacted sand, one series for the compacted calicheand one series for the compacted Gatuna.
Each specimen was encased in a rubber membrane,placed in the triaxial chamber and saturated by theback pressure method. After saturation, the testseries with three specimens was consolidatedisotropically at confining pressures of 1, 6 and 12ksf, respectively. The test series with twospecimens was tested at confining pressures of 1 and6 ksf, respectively. The test specimen was thensheared under strain-controlled load withoutpermitting any buildup of pore pressure. Thedeviator stress, axial strain and volumetric strainwere recorded, and the moisture content and dry unitweight were also measured.
46OF _SHEET__2_2__2REV. _
The test results for the compacted sand are given inTable 3 and are shown on Figure 16(a). The results
The effective strength at peak deviator stress forthe in-situ sand, caliche and Gatuna samples aregiven in Table 2 and are shown on Figures 17, 18 and19, respectively. The results showed that thein-situ sand has a cohesion c = 0 and an angle of ..internal friction ~ = 33 degrees. This angle of 'friction is considered high for the in-situ ,and could be due to densification of the t e
':'s~IJ1p~.es ~uri~g fiel~ sampling and ~ran:.po a~.nl\'For the In-Sl tu callche, the coheSlon c r ng' , - m0.14 'to' 2.6 ksf and the angle of internal r .l ranged from 31 to 33 degrees. For the in situGatuna Formation, the cohesion c was between0.15 and 4.0 ksf and the angle of internal friction¢ was between 28 and 40 degrees. The lower valuesof the strength parameters of the in-situ calicheand Gatuna could be due to sample disturbance.
DOCUMENT NO. DR-22-V-Ol
t:"-~zw
ti~
L..- ---:~-:::-:::--:-:-""=""=""_---~-----------::~---___::i~----J

showed that the compacted sand is cohesionless andhas an angle of internal friction ¢ between 33 and33.5 degrees. The results for the compacted calicheand Gatuna are shown on Figures 16(b) and l6(c),respectively. These results ~how~d that thecompacted caliche has a coheSlon c = 2.0 ksf and anangle of internal friction ¢ = 35 degrees. Thecompacted Gatuna has a cohe~ion c = 1.6 ksf and anangle of internal friction ~ = 36 degrees.
6.3.4 Strain-Controlled Cyclic Triaxial Compression Tests
Cyclic triaxial tests for measurements of thedynamic moduli and damping ratios were made onthin-walled tube samples from the caliche and theGatuna Formation. The specimens prepared from thesesamples were 2 7/8 inches in diameter and 6 inchesin height. Specimens were tested at naturalmoisture content and under saturated conditions.
In addition, cyclic triaxial tests were made oncompacted specimens 3 inches in diameter and 6inches high prepared from bulk samples of the uppersand material. These specimens were compacted atoptimum moisture content to 95% of the maximum dryunit weight as determined in accordance with ASTM D1557, Method C.
The method of compaction has a major influence onthe dynamic properties of compacted specimens. Inthe field the backfill material will be compacted inrelatively thin layers with a vibratory rollerproviding vertically oscillating vibrations atrelatively low frequency (1200-1600 rpm). In orderto simulate field conditions and to obtainuniformity the specimens were prepared in sixlayers, each about 0.9 inch high, compacted to therequired density and at the specified moisturecontent. The specimens were compacted in uniformlayers using low frequency vibrations appliedvertically to the specimens. Preparation of thespecimen in layers was according to the procedure ofunder compaction recommended by Ladd and Silver (5~.
The compacted sand specimens were tested op' urn
: :;~isture content and at 100% saturation. M.',''Each series consisted of 3 specimens, 0 e ., ~es eda~/a confining pressure of 1 ksf, one at' 6 f~none at 12 ksf, respectively. Each test s~was loaded by 10 cyclic axial loads of suchmagnitude that it produced axial strains in therange 10-3 to 1.0 percent.
The variation of the dynamic moduli and dampingratios with strain are shown on Figures 20 through25. The variation of shear moduli with strain forthe compacted sand samples are shown on Figures
DOCUMENT NO. DR-22-V-OI REV.__2__ SHEET__2_3__ 46OF _

20(a) and 20(b). Although sample B-32, BL-l hasdistinctly different grain size distribution with asmuch as 36% of fines, the variation of shear moduliwith strain of this sample wa-s similar to that ofsample B-29, BL-l which has only 8% fines.Therefore, the results of the two samples areincluded on Figure 20(a). The reduction of shearmoduli with strain for the compacted sand is lessthan indicated by the standard curves proposed bySeed and Idriss 6 . But it is within the range ofdata shown in this reference. The curves for thecompacted sand are flatter than those for thecaliche and Gatuna probably due to sampledisturbance of the caliche and Gatuna. The curvesalso show that saturation of the compacted sand andthe caliche has no effect on the shear modulus.However, saturation of the Gatuna Formation resultedin a significant reduction of its shear modulus.
6.3.5 Resonant Column Tests
Resonant Column tests for measurements of thedynamic moduli and damping ratios were made onthin-walled tube samples from the caliche and theGatuna Formation, and on compacted specimens fromthe upper sand material. The preparation of thetest specimens was the same as for cyclic triaxialtests in subsection 6.3.4. However, the resonantcolumn tests were made at smaller strains in therange of 10-5 to 10-2 percent.
Each specimen was tested at three differentconfining pressures of 1, 6 and 12 ksf. The dynamicmoduli and damping ratios of each specimen weredetermined for several strain levels. In theresonant column apparatus the specimen base wasfixed and the top was excited by torsionaloscillations using a Hardin oscillator driven by avariable sine wave frequency. The response of thespecimen was measured by an accelerometer mounted inthe oscillator and the output was displayed on anoscilloscope. The equivalent linear shear modulus.of the specimen was obtained from the resonantfrequency of the system according to the proceduregiven by Drnevich and Hardin (7). The damping ratiowas determined from the decay curve of t . ationafter shutting-off the torsional oscill ttl0r.oc. \,.
The dynamic moduli are given in Table a ~. Jvariation of dynamic moduli and dampin , r withstrain are shown on Figures 20 through ~: Asv1ncyclic tests , saturation did not have a Srqnificanteffect on the dynamic properties of the compactedsand backfill or the caliche. However, saturationof the Gatuna samples resulted in a significantreduction of the dynamic shear modulus.
8:i~-L- ~ ~----_=__--------__:~---___;_:::_---
DOCUMENT NO. DR-22-V-OI REV.__2__ SHEET__2_4__ OF __4;..;6~_
r;o-~zw
The results of the resonant column tests are fairlyconsistent with those of the cyclic triaxial testsfor both the compacted sand and the GatunaFormation. However, for the caliche the results ofresonant column tests show a wide scatter in theshear modulus values as well as large discontnuitybetween the resonant column and cyclic triaxial testdata. This scatter is probably due to variation insample properties such as degree of cementation,grain size distribution and relative density of thecaliche material. Sample disturbance coudld also bea major factor in causing the scatter in the shearmodulus for the caliche samples.
The discontinuities between the resonant column andcyclic triaxial test data could be due to thedifferent loading conditions of the test procedures.In the cyclic triaxial test, a vertical loading isused but in the resonant column test horizontalvibration is used. In addition, shear moduli forthe resonant column test were calculated based onthe sample dimensions, density, torsionalacceleration and resonant frequency where in thecyclic triaxial test the shear moduli are determineddirectly from measurement of the elastic moduli andan estimated value of Poisson's ration.
6.3.6 Permeability Tests
Permeability tests were performed in accordance withASTM D 2434 on thin-walled tube samples from theupper sand, the caliche and the Gatuna Formation.The results of these laboratory permeability testsare given below.
These laboratory permeabilities were consistent withpermeabilities measured in the field (Subsection4.4) as summarized in the following:
'- _.-';;;;";;0 r-:.-._ .•...:.;:,
L:iOOratory FieldMaterial Permeability (cm!sec) Permeabili
In-situ sand 9.0 x 10⁻⁵ - 3.6 x 10⁻³ 1.1 x 10⁻³
Caliche 6.8 x 10⁻⁶ - 6.3 x 10⁻⁴ 1.4 x 10⁻⁶
Gatuna 5.7 x 10⁻⁴ - 8.4 x 10⁻⁴ 6.8 x
6.3.71 ,Consolidation Tests.
One consolidation test was made in accordance withASTM D 2435 on a thin-walled tube sample from theupper sand. The test was made to determine thepotential of collapsing in the uper sand materialcaused by saturation due to a broken pipeline orirrigation.
C':'-c.;zw
tiat
:::l--------------:=--:----------;;:;;;;;:--:;-;~--~OFF-~a~6==~REV ? SH EET _--<.2....51--__ - -DOCUMENT NO. DR-22-V-OJ .---'----

The test specimen was preloaded to 2 ksf and thensaturated, and the load maintained for 24 hours. Theloading was increased in increments to 32 ksf and
- then reduced to O. The consol-ida tion _~est showedthat under saturation the specimen has a verticaldeformation of about 3 percent, indicating the uppersand is susceptible for additional settlement undersaturation. The results of the consolidation testare given in Reference 16.
6.3.8 Chemical Analysis
Chemical analysis was carried out on 5 selectedsamples of the foundation materials. The samplesanalyzed included 3 samples from the upper sand, onefrom the caliche, and one from the Gatuna Formation.
The samples were analyzed for major elements, and theresults of the chemical analysis for the differentmaterials are presented in Table 10. The resultsshow that the main constituent of the upper sand issilica which is typical of sand material. However,the silica content decreased with depth from 93% atthe ground surface to 85% at a depth of 10 feet.The upper sand contained some aluminum oxide, ferricoxide and calcium carbonate. The percentage of thesematerials increased with depth from 4.6% at thesurface to 8.4% to a depth of 10 ft.
The caliche sample contined 55% silica and 16%calcium carbonate. This high percentage of calciumcarbonate provides the cementation and hardness ofthe caliche and gives the caliche its whitish color.Additional cementing agents of 6% aluminum and ferricoxides were also found in the caliche sample.
The Gatuna sample contained a higher percentage ofsilica which was 80%. The cementing agents in theGatuna sample were mainly aluminum and ferric oxidesof approximately 10%. Additional cementing materialof 3% calcium carbonate was also found in the Gatuna
,sample. The variation in the amounts of cementingagents as given above shows the gradational change
." that could occur between the cal iche and the Ga tuna"Forma tion.
6.3.9 Electrical Resistivity
Laboratory resistivity measurements wereselected samples from test pits and shallin the vicinity of six locations numbered
~
6zw
8:ien":'-l-. -~---~--------_:::_::----~::=;:::::~
DOCUMENT NO.DR-22-V-Ol REV.__2__ SHEET__2_6__ Of _

6.4 Design Engineering Properties
The results of engineering properties tests aresummarized in Table 3 for the sand backfill and inTable 2 for the in-situ soils and shallow rock. Thedesign engineering properties were selected on thebasis of these results. However, it is believed thatsome of the tested samples in the caliche or Gatunamaterials were disturbed and therefore engineeringjudgement was applied in selecting design parametersfor these materials. The design properties of thein-situ materials and sand backfill are provided inTables 4 and 5 respectively.
The seismic velocities, Poisson's ratios, and elasticmoduli determined from the cross-hole and downholesurvey for the in-situ materials are given in Table6. Dynamic and static design shear and elasticmoduli for the in-situ materials as determined fronthe seismic cross-hole survey and plate load tests,respectively, are provided in Table 7. The designdynamic moduli for the sand backfill were determined~rom resonant column tests and are included inTable 7. The variation of the shear moduli anddamping ratios with strain as determined fromresonant column tests and cyclic triaxial tests isshown on Figures 20 and 23 for the sand backfill,Figures 21 and 24 for the caliche, and Figures 22 and25 for the Gatuna.
t:'
6zw
t~;;":"-L- --'
DOCUMENT NO.DR- 22-V-Ol REV._-=2=---_ SHEET_--=2.......7__ OF _--.::I:4..l.l6__

7. FOUNDATION EVALUATION
7.1 General
The investigations showed that either the caliche orthe Gatuna Formation would provide an excellentfoundation. The upper loose sand is not suitable forsupporting moderately to heavily loaded structures.However, the upper sand when removed and placed inproperly compacted layers would also provide suitablefoundation for Design Class I and II structures.This is discussed in greater detail in Section 10.Lightly loaded non-settlement sensitive structures,other than Class I and II structures, with bearingpressures less than 1.5 ksf may be founded at ashallow depth in the upper sand.
7.2 Design Criteria
The performance of foundation materials under loadingis evaluated based on two criteria:
(1) The ability of the ground to support loadstransferred through the structural foundationwith an ample factor of safety against soilfailure.
(2) The ability of the foundation to supportstructural loads with tolerable settlements.
The first criterion is related to the strength of thesupporting foundation materials. The secondcriterion is related to the "stress-deformation"characteristics of the foundation material and itsinfluence on the structure.
In the case of a structure foundation on sand,caliche or the Gatuna Formation, the allowablebearing pressure is limited by tolerable settlementsrather than the bearing capacity criterion becaus~ ofthe:.'high -strength of these material. ~.,~"...~ ",
Any\~~~~~tion design must satisfy the f l~Asafety requlrements: \ \~~\. 't.
(1) The factor of safety for bearing capa·ity mu .~at least 3 for dead plus normal live 10 g . .j~
(2) The factor of safety must be at least 2 for deadplus maximum live loading including wind orseismic loatjing.
(3) Settlements under static plus dynamic conditionsshould be tolerable in order not to createdistress in the superstructure or im9air itsfunction.
(4) Although ground water is very deep and the. sand backfill is not likely to get saturated, foundation grad
DOCUMENT NO. pR-22-V-Ol REV. 2 SHEET 28 OF_..:...;46~__
~-ozwti~-L- .-.;;,__~ ~~------~

7.3
7.4
for spread of strip footings should be atleast 2 feet below the ground surface to provideadequate edge support.
Foundation Treatment
The upper sand stratum is not suitable for supportingstructures with net static pressures in excess of 1.5ksf as discussed in Section 7.6. The sand must beremoved and these structures must be supported oncaliche, Gatuna Formation sandstone or compacted sandfill. All select backfill beneath and adjacent tothe structures to the limits discussed in Section 10must be compacted to at least 95% of the maximumdensity determined by ASTM 0-1557. Backfill innon-load bearing areas of the site must be compactedto at least 90% of the maximum density determined byASTM 0-1557.
Preferably, all structures should be founded oncompacted sand or caliche foundations. However,non-Class I and II structures, where there is a significant economic saving in not excavating the sand downto the caliche layer can be founded at a depth of 2 feetbelow the surface on the in-situ sand layer. Thesestructures should be flexible enough to withstand differential settlements of at least 1 inch and the netallowable pressures must not exceed 1.5 ksf.
In arid areas, sandy soils may develop a loose,lightly cemented structure which could collapse underloading when water is introduced into them. This canresult in excessive settlements. In order to reduce thepotential for excessive settlements of structures foundeddirectly on in-situ sand, it is recommended that thefoundation soil should be inundated and compacted withvibratory equipment so that the density of the sand inthe top 12 inches under the footings is at least 95% ofthe maximum determined by ASTM 0-l55. Ca ful controlShOU.ld be exercised during compacti n~~e ent localinstantaneous liquefaction under v' r IVI 0 the roller
Net Ultimate Bearing Capacity
The net ultimate bearing pressure is the pressure overand above that due to the weight of soil and water atfoundation level that will result in overstressing tbefoundation soil.
The net ultimate bearing pressure of the foundationmaterials was determined to evaluate the factor ofsafety of the foundation elements. The effective shearstrength was used in determining the ultimate bearingpressure for caliche, Gatuna Formation sandstone, andcompacted sand. The design strength parameters of thedifferent foundation materials are given in Tables 4and 5. In the bearing capacity analysis for foundationsresting directly on compacted sand, an angle of internalfriction of 33 degrees and a cohesion of"O was used,
DOCUMENT NO. OR-22-V-Ol REV._...;;2__ SHEET_2;;;.;9;.....-__ OF __4..;;..6"--__

7.5.1 Static Settlements
The allowable pressures for structures are control Ieby tolerable settlements. The set~lement of .foundations on compacted sand, callche, or Gatuna
and for foundations placed on caliche or GatunaFormation, an angle of internal friction of 33 degreesand a cohesion of 0.9 ks£ was llsed. -These strengthparameters are the lowest values for the strata underthe foundations and therefore the bearing capacityvalUes are ~onservative.
The ratio of the net ultimate bearing pressure to thenet applied pressure is defined as the factor ofsafety. The net ultimate bearing capacity supportinga circular, square or rectangular footing is definedby the following expressions (Vesic 8 ):
Circular and Square Footing
qult = 1.2cNc + YeDfNq + 1/2 x 0.6 Ye B Ny
Rectangular Footing
quIt = CNc x (1 + 0.2 B) + Y DfN + 1/2 (1-0.4 B)y BNL e q Ley
where
qult = net ultimate bearing capacity
c = cohesion
Ye = effective unit weight
Df = depth of footing below lowest adjacent grade
NC' Nq,Ny = dimensionless bearing capacity factorswhich depend on the friction ang~e of the soil
B = width or diameter of footing
L -- length of rectangular footing --......These equations were simplified assuming an p ~~.
The ultimate bearing capacity of mat fo n~-~9n~ 'asalso calculated based on the above form la "~e netultimate bearing pressures, the net appl sta'cpressures, and the factors of safety for t riousDesign Class I I structures are surnrnarize~... i.n··Table12. The factors of safety calculated are~:'iarge (9 to29), and significantly exceed the allowable factor ofsafety of 3.
7.5 Foundation Settlements
~-6zw
ti~-L.. ~-~------------~:__--_:_::_~-===!.oo'
DOCUMENT NO.DR-22-V-Ol REV.__2__ SHEET__3_O__ OF 46

(~-6zw
Formation sandstone can be estimated based on elastictheory using elastic moduli determined from plateload and laboratory testing. When a load is appliedto sand, caliche or Gatuna Formation sandstone,deformation will occur rapidly and most of thesettlement will occur during construction.
The elastic moduli for the caliche and GatunaFormation sandstone were determined from the plateload test results which are summarized in Table 11.The elastic moduli for compacted sand were determinedfrom consolidated, drained, triaxial tests, and theresults are given in Table 5. For foundationsresting on the caliche, a modulus of elasticity of20,000 lb!in 2 was used. The elastic settlement ofuniformly loaded circular, square, and rectangularfootings on a semi-infinite elastic medium can thenbe calculated from the following equation (Lambe andWhitman 9 ) :
S = q • B. (1 - ].12) IE
where
q = bearing pressure
BO= width or diameter of footing
].I = Poisson's ratio
E = modulus of elasticity
I = displacement influence factor.
The Poisson's ratio was determined from the seismiccross-hole survey data presented in Table 6.
For foundations on sand backfill extending down tothe caliche, the static settlement was calculated byintegrating the vertical strains in the sand,caliche, and Gatuna layers using the followingelastic moduli for each of these layers:
The rock formations below the Gatuna avemoduli equal to or greater than 8 x 10
The strains were determined from the followingequation (Lambe and Whitman 9 ):
)!E
DOCUMENTNO.DR-22-V-Ol REV. 2 _

where
e v = vertical strain at a given depth
6cr v = increase in vertical stress which wascalculated using Boussinesq equations
6crh = increase in horizontal stress
For the purpose of analyses 6crh was considered equalto 0 and the above equation was simplified to:
The net applied static pressure and the settlementfor the various Design Class II structures aresummarized in Table 13. The calculated settlementsfor footings of these structures were small and inthe range of 0.1 to 0.5 inch for pressures in therange of 2 to 5 ksf. Under the hot cell mat of thewaste handling building, the settlement was 1.0 inchfor a net applied pressure of 4 ksf. In addition,Figure 26 provides plots of bearings pressures versussettlements for various footing widths resting oncompacted sand and on caliche foundations.
7.5.2 Earthquake-Induced Settle~ents
SH~ET_--,-32 _REV. 2
The earthquake-induced settlements for footingssupported by the compacted sand, caliche and GatunaFormation materials were evaluated using the methodproposed by Seed and Silver (10). Following thismethod of analysis, the distribution of averageinduced shear strain with depth was obtained usingthe SHAKE computer program (11). The shear modulifor the caliche and Gatuna Formation were determinedfrom the seismic cross-hole survey data and for thecompacted sand from cyclic triaxial and resonantcolumn test data. The variation of the shear moduliand damping ratios with strain used for the analysiswere determined from dynamic laboratory tests and areshown on Figures 20 and 23 for the compact~~nd,
Figures 21 and 24 for the caliche, and in- Figur~ 22and 25 for the Gatuna Formation sandstone "ij:.,~. ~I\;~l \
~~.,
Bechtel's synthetic earthquake time his or . '~ ,maximum ground acceleration of 0.1 g was u ed in h~
settlement analysis. The Bechtel synthetl . ;~H.
history is given in the Bechtel Topical Report 12 . Itis a ~ompilation of data from several real earthquakerecords. The response spectra of the time historyenvelop the design spectra given in the NRCRegulatory guide 1.60. The Bechtel synthetic timehistory has a total duration of 24 seconds. Themaximum integrated velocity of the time history isabout 5 feet per second for a peak groundacceleration of 1.Og.
DOCUMENT NOnR- 2 2-'7- 0'

The geologic and the induced shear strain profilesused are shown on Figure 27. The induced verticalstrains were then calculated from the shear strainsusing a correlation that was developed from thedynamic test data for the foundation materials. Theseismically induced settlements below the foundationwere calcualted by integrating the vertical strainvalues of each layer. By this approach, thecalculated induced settlements under all the DesignClass II structures were negligible (less than0.015 inch).
'7.6 Foundations on In-Situ Sand
Non-Class I and II, lightly loaded non-settlementsensitive structures which are founded 2 feet belowthe ground surface on the in-situ sand, should have amaximum net pressure of not more than 1.5 ksf. Thefoundation treatment for these structures isdiscussed in Section 7.3 of this report. The mostsuitable types of foundation for these structures arestrip footings.
The foundation settlement under these structures wereestimated from the standard penetration test data inthe upper sand using procedures proposed by Peck etal (13). The standard penetration test blowcounts inthe upper sand are shown on Figure 8. The estimatedsettlement for 1.5 ksf load based on the Peck et al(13) settlement charts is about 1 inch. Because oflarge variation in the densities of the upper sand,these structures should be designed for adifferential settlement equal to at least 1 inch.Additional settlement of the upper sand can be causedby saturation due to a broken pipeline or irrigation.Consolidation test data (Section 6.3.7) showed thatthe upper sand can settle about 3 percent due tosaturation. Therefore, the in-situ sand foundationshould be inundated and compacted so that the densityin the top 12 inches under the footings is at least95% of the ASTM D-lS57.
8.
.;',',:
The minimum width of strip footings should be 2 feet, ...../
and for spread footings it should be eet ~"'': Thesettlement estimate is based soleI on th foundationloading. Therefore, any grading d~rl ill whichwo~ld result in ad~itional settle.en~~.', t be placedprlor to constructlon of the footlng~ 'J;n: r er toprevent additional settlements.
.-'LATERAL EARTH PRESSURES
IntroductionC';'-~ The earth pressure that a foundation wall orW retaining wall must support depends on the type of~ soil, the soil strength, the wall friction, them ground water conditions, the degree of compaction in
~L_--~~"=,",,,,=,:--:-~-----::------....-o:'"'"':::=-~33;---=---;-;--....JDOCUMENT NOPR-22-V-Ol REV.__'..;;;,2__ SHEET OF 46

the backfill, the method used in the backfillingprocess and the amount of deflection that the wallundergoes. The principal conditions involved are
-"active",- "atrest"- and "passive"earth pressure.
These conditions are discussed in detail in thefollowing paragraphs. The recommended lateral earthpressures for design do not include hydrostatic waterpressures sin~e there is no ground water table withinthe foundation depth at the WIPP site.
In addition to the lateral earth pressures discussedbelow, there will be pressures due to surchageloading of construction equipment placed adjacent tothe walls. These pressures should be calculated whenthe equipment types and loading become available andshould be added to the earth pressures.
8.2 Active Earth Pressure
If a wall with a horizontal backfill surface behindit is free to move away from the backfill, then thesoil can expand laterally. The vertical stress inthe soil remains constant but the horizontal stress,or earth pressure, reduces until the shear strengthof the backfill is fully developed. The horizontalcomponent of stress in the backfill under thiscondition is known as th= active earth pressure.Most unrestrained retaining walls can movesufficiently to permit development of the activeearth pressure. For sand backfill with an angle ofinternal friction of 33 degrees, and neglecting wallfriction, the active earth pressure coefficient, Ka ,is 0.29. The active earth pressure coefficient isthe ratio of horizontal to vertical stressimmediately behind the wall.
The active earth pressure recommended for design is:
Pa = 0.29 YmH
where
H,
Ym
= height of the backfill above base of
= moist unit weight of the backfill.
The active force is:
OF_~ _SHEET__3_4__REV._...2",--_
Pa = 0.29 Ym H2/2
This force is acting at a depth of 2/3 H below the backfill surface. Lateral earth pressure diagrams are shownon Figure 28. ~~~
8.3 At Rest Earth PressureWhen a rigid wall is restrained from moving, as inthe case of a foundation wall of a building, the
DOCUMENT NO.oR-22-V-Ol
r:e-6zw
ti~L.._--=~~:;__----:---__:::;;.::_~-~~c::

horizontal component of earth pressure is called the"at rest" earth pressure and its magnitude willdepend on the degree of compaction of the backfill.For normally consolidated clean sands, thetheoretical "at rest" earth pressure coefficient, Ko ,varies from about 0.35 for dense sands to about 0.5for loose sands.
However, around structures the backfilling processwill increase the earth pressure considerably. Basedon emprical evaluations, the current practice is touse an earth pressure coefficient of 0.5 for moderatecompaction and 0.7 for heavy compaction where thebackfill is sand or silty sand.
Since the plant backfill will be compacted to 95% ofthe maximum density determined by ASTM D-1557, an "atrest" earth pressure coefficient of 0.7 should beused.
The "at rest" earth pressure is:
Po = 0.7 Ym H
The "at rest" force is:
P = 0.7 Ym H2/2o
8.4
This force isfill surface.on Fiqure 28.Passive Earth
acting at a depth of 2/3 H below the backLateral earth pressure diaqrams are shown
Pressure
When a wall with an adjacent horizontal soil surfaceis pushed into the backfill, the horizontal stressesin the soil will build up while the vertical stressesremain constant until the shear strength of the soilis fully developed. The horizontal stress developedunder this condition is known as the passive earthpressure. For an angle of internal friction of 33degrees for the sand backfill, and conservativelyneglecting wall friction, the passive ear res~ure
coefficient (ratio of horizontal to ve lcal :stresses) is 3.39. llMft.
However, the movement necessary to de el:~ .> 11passive pressure is quite large being n teo er offive percent of the height of the wall. ~uch
movements could not normally be tolerated, a pa$sivepressure in design equal to 50% will be used.
The recommended passive earth pressureC':'ci Pp = 1. 7 Y m Hzwt and the passive force is:i
~ Pp = 1. 7 Y In H2 2
DOCUMENT NOPR-22-V-Ol REV. 2 SHEET__3_5__ OF 46
This force is acting at a depth of 2/3 H below thebackfill surface. Lateral earth pressure diagrams areshown on Figure 28.
8.5 Dynamic Earth Pressure
8.5.1 General
The previous paragraphs discussed earth pressuresunder normal static conditions. However, duringearthquakes these pressures will change. DesignClass I and II structures should be designed for theat-rest static pressure plus a dynamic pressureincrement due to seismic loading! This sectiondevelops a basis for evaluating the dynamic pressureincrement so that a conservative appraisal of thedynamic pressure can be made for earthquakeconditions. This analysis applies to verticalretaining walls as well as to embedded foundationwalls. For a more detailed evaluation of dynamicearth pressure, a dynamic analysis may be performedusing finite element computer programs. The dynamicengineering properties for this type of analysis arefurnished in this report. The dynamic passivepressure has been conservatively disregarded sincethe movement necessary to develop full passivepressure is quite large and could not normally betolerated .
.The design procedures for dynamic soil loads arebased on the Mononobe - Okabe analysis of dynamicpressure in dry cohesionless materials. Theseprocedures were further simplified by Seed andWhitman (14).
The Mononobe - Okabe solution was based on thefollowing assumptions:
a.
b.
_c.
The wall yields sufficiently to produce activeearth pressure.
The maximum shear strength is mobilizedpotential sliding surface. .. ~ \
_The soil wedge behind the wall acts as f ~~~\~:.body so the accelerations are uniform t~o~ghoutthe mass, and the effect of the earthquake- ~an erepresented by inertia forces KW where W is theweight of the sliding wedge and K represents theratio between the horizontal and verticalcomponents of the earthquake accelerations.
Seed and Whitman (14) present- the following procedurefor obtaining the Mononobe - Okabe earth pressures:
a. The maximum earth pressure during an earthquakeis equal to the sum of the static earth pressureand a dynamic pressure increment.
~-6zw
DOCUMENT NOPR-22-V-Ol REV._-=.2__ SHEET__3_6__ OF 46

b. For a backfill with an angle of internal frictionequal to 33 degrees, the dynamic pressureincrement is approximately equal to the inertiaforce on a soil wedge which extends behind thewall a distance equal to 3/4 the height of thewall.
c. The dynamic pressure increment will act on thewall at a height of 2/3 H above its base.
In the earthquake design of structures where nosophisticated analysis is used to determinesoil-structure interaction forces, the followingprocedures should be followed to develop earth loadsfor the design of foundation walls.
a. For the particular type of wall restraint anddegree of backfill compaction, choose theappropriate static earth pressure from therecommendations given for static earth pressure.This static loading may be considered to act at aheight 1/3 H feet above the wall from base to topof soil surface.
b. Apply the dynamic load increment, as developed inthe following paragraph, at a point 2/3 H feetabove the base of the wall for each linear footof wall.
The above rules apply to walls where the backfillsurface is horizontal.
8.5.2 Dynamic Lateral Pressure Increment due to SeismicLoading
The incremental increase of the lateral pressure dueto seismic forces for the case of vertical walls andhorizontal backfills with no ground water table canbe determined using the equation:
-where:
Ym = Moist unit weight 0
= Ratio of theaccelerationgravity
due to
H = Height of backfill above base of wall
The dynamic pressure increment 6AE acts on wall at aheight 2/3 H above the base.
For the plant site conditions with design earthquakehaving a maximum ground acceleration equal to O.lgthe dynamic increments are: -
~-6t z
w
tiCii~-
DOCUMENT NO.DR-22-V-Ol REV.__2__ SHEET__3_7__ OF 4'6

9.
a. For Walls Supported on Backfill:~AE = 0.04 Ym H2
b. For Walls Supported o-n Caliche or Gatuna:~AE = 0.11 Ym H2
~he increase in the dynamic increment for the calicheand the Gatuna by a factor of 3 is based on resultsof finite element analysis discussed with Dr. Seed ofthe University of California in Berkeley.
These dynamic increments should be added to the "atrest" pressure in the case of foundation walls aswell as for vertical retaining walls as shown onFigure 28.
SLOPE STABILITY
The site is relatively flat with an average slope ofless than 1%. No significant permanent cut slopes orembankments are planned in the vicinity of DesignClass I and II structures. The excavation slopesplanned within these areas are temporary slopes.These slopes are shown on Figure 7. Outside areas ofDesign Class I and II structures, permanent slopeswill be required in the upper sand such as for sitegrading and for drainage ditches. These slopesshoul~ be 2-1/2 horizontal to 1 vertical. Adequatemeasures must be taken to protect these slopesagainst erosion.
9.1 Design Criteria and Analysis
The infinite slope method was used in the slopestability analysis for the upper sand, and seismicforces were neglected.
'Based on the infinite slope method a minimum factorof safety of 1.1 was considered acceptable for thetemporary slopes and 1.3 for the permanent slopes •
. The factor of safety for slopes in the upper sand wascalculated using the following equation forcohesionless materials:
where ~ = effective angle of internali = the angle of the slope.
'--..
F.S. = tan Jjtan i
For cuts in caliche and Gatuna which are drymaterials with cohesion, the factor of safety wascalculated using the following equation (Duncan and
Buchignani lS ) :
f:'-ozwti~-~---~-=--:::-:::--:-:-~-----:::------------r~----:-:--~DOCUMENT NOPR-22-V-Ol REV.__2__ SHEET__38__ OF 46
10.
10.1
F. S. = A tan i + Betan i yH
where c = cohesiony = total unit weightH = Assumed depth of sliding mass in vertical
direction.
A = 1 for dry slopes
B = 2.5 for 1/2 horizontal to 1vertical slope.
The angle of internal friction of the in-situ sandwas found to be 330 • However due to the loose natureof the sand, an angle of 30 0 was used in thisanalysis. The analysis showed that for sand withslopes of 2 horizontal to 1 vertical the factor ofsafety is 1.15 and for sand with slopes of 2-1/2horizontal to 1 vertical the factor of safety is 1.4.
For proposed excavated slopes in the caliche andGatuna Formation on Figure 7, a weighted average ofthe strength parameters was used with an angle ofinternal friction of 39 0 and a cohesion of 0.7 ksf.The total height for proposed slope is 19 feet (4feet in caliche + 15 feet in Gatuna). The total unitweight used in the analysis is 102 pcf. For a slopeof 1/2 horizontal to 1 vertical in the caliche andGatuna the factor of safety is 2.1 assuming that thedepth of the sliding mass is 10 feet.
FOUNDATION CONSTRUCTION
Site Grading
Because the construction area is relatively flat, themajor site preparation items will be clearing andstripping. The construction area is covered by lightwoods and grasses which can be cleared easily.During the field investigation, the surfa 'Iswere found to be dry and capable of sup rting ruckmounted equipment. However, repeated ovmft· 0rubber-tired equipment over the dry su fa > 1 tendto loosen the upper sandy soils and re uctrafficability. It will be desirable t use a ayerof 12 inches of caliche as surface for te ryaccess roads and 6 inches of caliche for work areas.Actual thickness should be determined by experiencein the field.
All grading for Design Class I and II and otherstructures with more than 1.5 ksf loading willrequire complete removal of the upper sand down tothe caliche surface within the limits and to thedepths discussed in subsection 10.2.
DOCUMENT NO. DR-22-V-OJ REV._---:;2;;......._

10.2
For non-Class I and II lightly loaded structures withless than 1.5 ksf loading the foundation preparationand treatment are discussed in Section 7 of thisreport. If pockets of clayey_or silty m~~er~al areencountered at foundation level, this material mustbe removed and replaced with select compacted sandmeeting the gradation and compaction criteria givenin subsection 10.4.
Extent of Excavation and Backfill
Most of the structures will have their foundationsresting on caliche, Gatuna, or compacted backfillcarried down to the caliche surface. The estimateddepth of excavation is between 6 and 27 feet as shownon Figure 7. All temporary slopes in the sand shouldbe 2 horizontal to 1 vertical or flatter and in thecaliche and Gatuna Formation they should be 1/2horizontal to 1 vertical. For foundations oncomapacted backfill, the bottom of excavation shouldbe determined by extending a line from the peripheryof structures at foundation grade with a downwardslope of 1 horizontal to 1 vertical or flatter. Theintersection of this line with the caliche surfaceprovides the limits of the excavation at the bottomas shown on Figure 7. In addition a minimum distanceof 5 feet will be kept between the edge of thestructures and the base of excavation slope. Thisdistance was selected for construction considerationas well as for providing adequate compaction near thestructure edges.
Excavation of the upper sand can be accomplished bythe use of scrapers. Rippers will be required forexcavation into caliche and the Gatuna Formation.
Figure 7 shows the location and limits of excavationand structural backfill associated with Design ClassII structures at the site. The structural backfillshould be compacted to at least 95% of the maximumdensity determined in accordance with ASTM D 1557.The engineering properties of the sand backfill areprovided in Tables 3 and 5. The results of the ~~.foundation analysis discussed in Section 7 Show,kha, t"wh~n ,the sand backfill is compacted to the requa.r" .den~i:ty , it will provide an ~dequate support f r i~~\De~lgn'Class II structures wlth large factors 0, ~
safety for bearing capacity and with tolerablesettlements for static and dynamic conditions.
Backfill in non-load bearing areas of the site shouldbe compacted to at least 90% of the maximum drydensity determined in accordance with ASTM D-155
r:o-~zwti~'------------------------------------'
DOCUMENT NO. DR-22-V-Ol REV._..........2"--_ SHEET_4~0,---__

10.3 Dewatering, Slope Protection and ExcavationInspection
During construction, the loose sand should beexcavated to the top of caliche, approximately atElevations 3390 to 3410. Because the ground waterlevel is at a great depth, the only water that mightbe encountered will be surface water due to rainfall.Therefore, the only dewatering provision will be tointercept and dispose of any surface run-off. Nopermanent dewatering system is required. Sump pumpand drainage ditches will be adequate to maintain adry excavation and prevent damage to soils duringconstruction from rainfall and run-off. The pumpshould be capable of handling rainfall accumulatingin the excavation.
Exposed excavations in sand will be susceptible toerosion. Therefore, precautions must be taken toprotect these slopes. All surface run-off should berouted around the excavation. Treatment should beapplied where necessary to minimize slope erosionfrom wind and run-off. Temporary and permanentslopes and the slopes of drainage ditches in theupper sand can be protected with gunite, asphalt,concrete lining, chemical emulsion or seeding withnative desert grasses depending on the economics ofthe alternative methods.
The following provisions will be made for theidentification and removal of unsuitable materialsfor Design Class I and II structures:
( 1 )
( 2 )
.. -~~-"" --
A person experienced in foundation constructionshould inspect all foundation excavations justprior to placement of concrete to confirm anddocument that the recommended foundationelevation has been reached in the bearingstratum. All visual classifications of soil~7
should be in accordance with ASTM ~~1~ .
The foundation soil will be excavate Il~caliche surface beneath all Class.I an~?istructures. Any loose sand and slIt ~and at.lhefoundation grade will be identified by a personexperienced in foundation construction andremoved down to sound caliche. As each sectionof the foundation is approved, approval will bedocumented.
Since the caliche is hard, there is no specialrequirement for foundation protection. Thesurface of the caliche should be throughly cleanfrom all loose material. Surface cracks in thecaliche should be filled with cement slush groutbefore placement of footings or mat foundationsdirectly on the caliche surface.
DOCUMENT NO.DR-22-V-Ol REV._-:2=--_ SHEET 4=l__ OF_~4~6~_

10.4
Because the caliche is relatively incompressible,foundation rebound should be negligible. Thepotentiai for heave should also be negligible becausethe caliche and Gatuna materials are non-plastic.Where required, structure settlements can bemonitored by optical survey procedures provided thatlevels are carried back to a deep bench mark that isoutside any areas that might be subject to subsidencedue to underground construction.
Structural Backfill
Backfill may be obtained from the excavated uppersand. Only sands with less than 20% passing the U.S.standard sieve No. 200 should be used as structuralbackfill. Most of the sand excavated from the siteis suitable for backfill. The sand should bestockpiled for later use as backfill. During theexcavation, undesirable clay or silty material shouldbe removed from the select backfill.
The lift thickness required to place and compact thebackfill to the required degree of compaction withthe available compaction equipment should bedetermined in a test fill. The material should bemoisture conditioned to the range of +2% of theoptimum moisture content, and compacted to at least95% of the maximum density determined by ASTM D 1557.
Backfill material within 2 feet of structures and inareas where large construction equipment cannot beused or where there is a danger of damage tostructures must be compacted to the specified densitywith hand~operated equipment. Thinner lifts of 4inche~:o~ less in thickness will be required to dothis .'
Only suitable material should be placed in thestructural backfill. Suitable material forstructural backfill should be select sand and siltysand having less than 20% by weight passing the No.200 u.S. Standard Sieve size. The backfill shouldnot contain any brush, root, peat, sod, or otherorganic, perishable, or deletrious material, ow,ice, or frozen soil. The bottom of the exc vati~~ ,for Design Class I and II structures shoul ~~~ )thoroughly cleaned of all loose ~ateria~, ns ~ ~~~~ Iand documented by a person experlenced ln U -a~lon/construction before placement of sand backfi -
Structural backfill must be placed in horizontal 1lifts and compacted with a heavy vibratory roller.In confined areas, thinner lifts and hand-operatedcompactors should be used. The backfill should beraised on both sides of the footings at about thesame elevation. The actual lift thickness and thenumber of passes of the proposed rollers will -have tobe established by means of a test fill carried out at
DOCUMENT NO. DR-22-V-Ol REV._---...;;;2~_ SHEET__4.;;.;2~_ OF __..:.4.:::,.6__

the start of backfill operations. All structuralbackfill must be moisture conditioned just beforecompaction. All lift surfaces should b~ inspectedand any soft or yielding material should be replacedor corrected.
Field density tests in the compacted backfill andrelated laboratory compaction testing are required todetermine the degree of compaction. Field densitytests must be taken in accordance with ASTM D 1556 ata depth of at least 12 in. below the adjacent grade.A compaction test should be carried out in accordancewith ASTM D 1557 out for each field density test.These tests will have to be performed at a frequencyappropriate for the work in progress but not lessthan one field density and one compaction test per1,000 cubic yards of backfill for Class I and IIstructures and one field density and one compactiontest per 2,500 cubic yards of backfill for otherstructures. In no case should tests for structuralbackfill be made less frequently than once per shiftwhile backfill is being placed.
To evaluate the applicability of the nuclear tests(ASTM D 2922 and D 3017) for measuring the fielddensi ty, they should be used in the test fill programin parallel with the sand cone test (ASTM D 1556).If proven satisfactory, these nuclear tests can beused in the backfill provided regular checks are madeagainst densities measured by the sand cone procedureon a basis of at least one out of every ten tests.
All work performed in connection with the placementand compaction of structural backfill must ~implemented under a quality assurance program.
REV. 2__
The gradation requirements for the fill are discussedin the beginning of this Section. The test fill mustbe constructed on acceptable caliche foundation.Prior to placement of fill, all low spots anddepressions will have to be filled with sand andcompacted to the required density to provide areasonably uniform and horizontal surface. Thecompaction equipment should be a 10-ton vibratoryroller or equivalent and should operate at 1 1/2 mph.The roller should compact when moving forward and notin reverse. The fill should be about 50 ft by 120 ftin plan with side slopes not steeper than. 1.5 on 1.The test fill can be divided into three equal
DOCUMENT NO. DR-22-V-Ol
r':'-tbzw
ti~-L... ..J
SHEET__4.:.;3~_ OF __4__6~__

sections. Each section would then be compacted withthe number of passes specified below. The moisturecontent of the fill mater-ial-should -be in the rangeof 2% above to 2% below the optimum moisture content.Materials having the required moisture content shouldbe placed in 9 inch loose lifts. The lifts will becompacted with the following number of pas~es:
Section
1
2
3
No. of Passes
4
6
8
c:o-6zw
ti~
The test fill should be raised in a reasonablyhorizontal plane but sloped sufficiently to drain.At least two lifts should be placed before testing.Additional lifts will then have to be added until 8lifts have been placed. Additional fills may have tobe constructed to evaluate lift thickness or type ofvibratory rollers to achieve the required density ifthis cannot be determined satisfactorily with theinitial fill.
The field density tests must be conducted a minimumof 12 inches below the fill surface. At least sixfield density tests should be made on each lift ofeach section. Enough material must be obtained fromeach field density test for compaction tests. Theresults of all field control tests will then bedocumented to show compaction equipment, fillsection, lift thickness, number of passes, compactionand field density test results, percent compaction,gradation, test location, and elevation.
One compaction test must be performed in accordancewith ASTM D 1557 at the location of each field
~·4enslty test. The field density tests should be"carried out in accordance with ASTM D 1556.Gradation tests should be made on material from eachfield density location in accordance with ASTM D 422.
- The results of all field control tests sho bedocumented and analyzed and the recommend d b."i 1proc~dure should be used to meet the con t'reqUirements. ..
\
"
DOCUMENT NO. DR-22-V-Ol REV. _ SHEET_---"4:..::4~_ OF _.....;4:.l6"--__

REFERENCES
1. Geologic Characterization Report, Waste Isolation Pilot plantSite, Southeastern New ~exico, 1978~ Powers et al editors,Sandia Laboratories Albuquerque, Hew Mexico.
2. Seismic Evaluation Report, WIPP Project DocumentNo. 97-D-510-01, Rev. 1, Bechtel National Inc., SanFrancisco, California (December 1978).
3. Sergent, Hauskins & Beckwith, Seismic Refraction SurveyReport, WIPP Site, report to Bechtel Inc., DocumentNo. VP-2l-B-02-5-0 (April 1979).
4. Harding-Lawson Associates, Geophysical Investigation P and SWave Velocities, WIPP Site, report to Bechtel, Inc., DocumentNo. VP-21-B-04-3-0 (1979).
5. R.S. Ladd and M.L. Silver, "Recommended Procedure forPreparing Reconstituted Coarse-Grained Soil Specimens",Preliminary Draft for ASTM Specifications, (1974).
6. H.B. Seed and I.M. Idriss, "Soil Moduli and Damping Factorsfor Dynamic Response Analyses." Earthquake EngineeringCenter Re~ort No. EERC-70-10, University of California"Berkeley (December 1970).
7. V.P. Drnevich and B.O. Hardin, "Proposed Standard for Modulusand Damping of Soils by the Resonant Column Method", ASTMCommittee D18.09, (May 1974).
8. A.S. Vesic, "Analysis of Ultimate Loads of ShallowFoundations," Journal of Soil Mechanics and FoundationsDivision, ASCE Proceedings 99, No. SM 1, pp. 45-73 (Jan~__~1973).
9. ~.w. Lambe and R.V. Whitman, Soil Mechanics,Sons, Inc., New York (1969).
10. H.B. Seed and M.L. Silver, "Settlements of Dry SandsEarthquakes, II Journal of Soil Mechanics and Foundations --:.;.;;',Division, ASCE Proceedings 98, No. SM4, pp. 381-397 (April1972).
11. P.B. Schnable, J. Lysmer, ann H.R. Seed, "SHAKE, a ComputerProgram for Earthquake Response Analysis of HorizontallyLayered Sites," Earthquake Engineering Research Center ReportNo. EERC 72-12, University of California, Berkeley,California (December 1972).
SHEET 45REV._-:2=--_
12. Bechtel Power Corporation, Topical Rep·ort: Seis;.:.m:..::i:..:c=--.::A:..:;n:...:....:...:.a.;::l..-...;:;~....._ ....of Structures and Equipment for Nuclear Power-PIants,BC-TOP-4-A, Rev. 3, San Francisco, California (november1974).
~
6zw
ti~'--------=~~-:':"'~r__------------------~~~_T.-.J

13. R.B. Peck, W.E. Hanson, and T.R. Thornburn, Foundation-----Engineer ing 2nd Edi tion, John Wiley & Sons ,_Inc. , New_ York
(1974).
14. H.B. Seed and R.V. Whitman, "Design of Earth RetainingStructures for Dynamic Loads," ASCE Specialty Conference onLateral Stress in the Ground and Design of Earth RetainingStructures, pp. 103-147, (1970).
15. J.M. Duncan and A.L. Buchignani, An Engineering Manual forSlope Stability Studies. Department of Civil Engineering,univers~ty of California, Berkeley (March 1975).
16. Sergent, Hauskins & Beckwith, Report of Subsurface Explorationand Laboratory Testing - WIPP, 3 Volumes (May 1979).
Vol. 1
Vol. 2
Vol. 3
Subsurface Exploration & LaboratoryTesting, Document No. VP-2l-B-02-2-1Visual Soil Classification, DocumentNo. VP-2l-B-02-3-lLaboratory Soil Test Results byDames and Moore, Document No. VP-2l-B-02-4-1
17. Photographs of Test Pits, WIPP, 1979, by Sandia.
DOCUMENT NO. Dp-22-V-Ol REV._....;2__ SHEET 46 oF_...:!.4~6__

-,
SHEE r I OF 10_™lL I-
SOl L TEST RESULTS SUMMARYOATE_...;.Ha...;.Y=--_~19:.!.7~9 _f E ATURE_.;.F.;.O_IIH_O_A_'_·I_ON_I_Il_V_ES_II_G_A_I_IO_N_-_PHA_S_E_I _JOB NO. .:.'.:.:'1,:::8:::
',l.- PROJECT \II PP PRO.IFCT
HOLE, DEPTH LAIlORATORY MECHANICAL ATTERBERO SPECIFIC NATURAL COMPACTION SHEAR DATA PERMEABILITY CONSOI:
TEST PIT.. FT. CLASS. ANALYSIS LIMITS GflAVITY ...TER TOTAL UNIT DRY UNIT OPTI"UM .... DRY H5T IHITIA 1: T DE~~~Y K IOATION REMARKSORTR£NC SAIIPlE COHHHI wElGttl _[IGU' *AUR OENSITY
fRO" TO GR'VEl S'HOS ':~55 Lt Pl PI G 1%1 W~~~OIlY Q£HSlT
NO. 1%) 1%1 1%1 pcr Pef Pef pef KSf OEG PCf fT/YR TEST
D-l Bl-I 0' 9' SP-SH 0 88 12 1.59 ---_. ----11. '7~ 9.1 91t. S 86.6
.Cyclic Triaxialp-, .1 01 51' i---- ----- ._- f----
--- ---_ .. -B-2 5- I I 205 SP-SH 0 92 8 2.6}
S-2 I( 5.5 sc 0 78 22 22 NP -- 2.47 12 --- ---
5 It 9 '0.5 SH 2 69 29 }I HP -- 2.65 5 --- -..-- - --~ ----
-- --- ----- ---- --- ---- -e-} 5-1 I 2.5 SP-SH 0 9} 7 2.65 } --- ---
f-- ._---- _._.--- _.- "- -- - ------ ---- I-- ._--- ._-- -- --.So} 7.8} 8.7~ SH 6 61 }} NV NP -- 2.78 '9 --- ---
- -- -2:ff -_.---'7.67 0 BIt 16 CO
ao:t "f."~7P-2 19.} SH 2.6 6.5 90.0 ~.l
5.9 .- '9i~r-1-92".2 - l,;YCIIC If,.,,,ar..- ~ 19JJ .20..5.- _SIL-- -~"~- ~Z_ . 95.5. Resonant Col ........--- --- -- m:-r lU'to~
p-I,20.5. 22-__ _...5H___ _.JL -lL. ....l2.. rn ..l:£ , ••• 4 ~. }5--- --- .- ---- -_ . _ __"no -_.-
. _-- --- -_ . .._.-.__ .--_.- -- -- --. .. -_. --- ._-B-Ii P_I } 5 SH 0 87 1] 2.65 1i.0 10lt.0 '00.0 100.0 )710
--- --- --- --S-2 5 6.5A~ " 86 .It NV NP --- 2.66 6 --- ---
----.- :I.l IIl.1IP-2 '0.5 ~I I~ 72 28 NV NP --- 2.6} co
.§..!t. -t4-:-l- lh!.. nC ---' 8./,
---_. -_.- -- --- ~---- --------- - -_.- ---5-5 19.5 21
~~~~~~69 }I 2.66 7 -- --
----- --- --- - --- ---_.- -_.!:1... 21.5 ~ 77 21 2.68
~-- . =.- --- -_. --- --.• ------ _.- -------- - --- -- -- ._- -- ---
-.!2.~ Bl-I 0 8 511 0 ~ 17 2.62. - - ._.. ----- - -_. --
5-2 1t.5 6 sc 0 76 2" 2.66 15 --- ---- -
SPECIFIC GRAVITY COMPACTION TR IAXIAl COMPRESSION TESl S OTHERS
( III I • WINUS NO 4
IDI aPlUS NO 4
CI' aAS'''' D6~8
III-ASI ... DI~~7
Ill' 10.000 fT. LBS/CU. f I.
(1) I "'AJUMUM - MINIMUM
(!li) • OTH[H 15[( I[)!:"
uC UNCONfINED CO..PRESSIOHUU UNCONSOLIDATED UNDRAINED
Co CONSOLlO'HO UNOR"N[OI POR[ PRESSUNE 1oI[ASIIRE ..[H1SI
Best Copy AvailablbHOSCa
Cu CONSOLlO'TEO UNOR"N[O
CO COHSOllO'1EO OR"NEO
CR CYCLIC CONSOUO',EO UHOR',NEOIPORE PR[SSlJIIE .. [.SUflllolENISI
.. VISU'l CLASSlflCATIOH
... II IN-PLACE OfNSIIY TESTHV- 'kln-Va lid
111'- ~n-P' ..s I IeBL- Bulk-Sample
P_ Pitcher S_pleS- Sp II t Spoon Slimp Ie
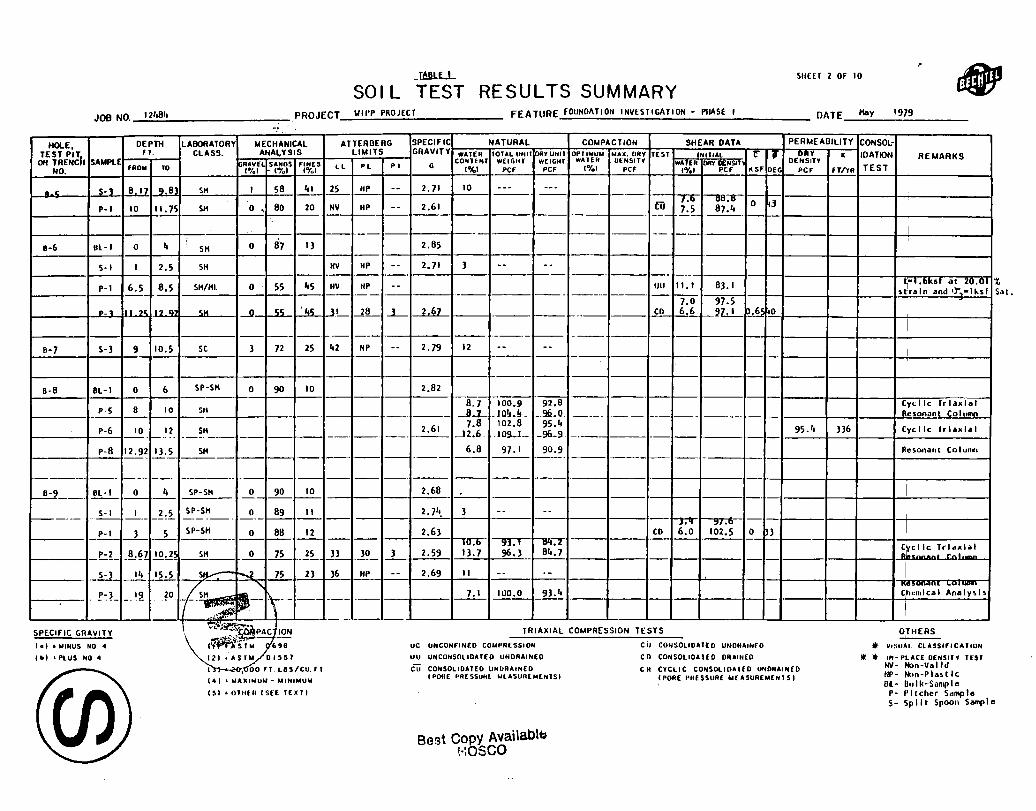
~U-
501 L TEST RESULTS SUMMARYSlIfEI 2 OF 10
JOB NO. _1:.:2c;:":::.8'.:.' ...,.- PROJECT '" !I'P PRO JECT FEATURE fOUNOIITlON INVESTIGATION - PHASE I DATE Hay 197~
X.Sat.
tlP- Nun-PlasticBL- ~lIlk-Sample
p. f'ltcher Samples- Spilt Spoon Sample
CPORE PRESSURE MEASUREMENISII PORE PAE5SUNl "EA5URE ..E"lSI
Best Copy AvailablbHOSea
14' I ""A)CIMUM - MINIMUM
lSI. OTIIER ISH If XII
..HOLE, DEPTH LABOflATORY MECHANICAL ATTERBERG SPECIFIC NATURAL COMPACTION SHEAR DATA PERMEABILITY CONSOL-
M~~:JlHFT. CLASS. ANAI,YSIS LIMITS GRAVITY WATER lOTAL UN" OAVUNII OPT.WUW "".ORV TEST NITIAL r .,
OE~~'Trk IOATION REMARKS
SAMPlE1i'~/~fL SAN05 FINES CO"H"T WEIGHT WEIGHI WAIEA OENSITY
~~:~ lJR'(~N{"fRO.. TO LL PL PI G 1%1 1"Iu1 TESTNO. l'YoI ('Yo I PCF PCf PCf KSf OEG PCf fTlYR
D_C 5-1 8 17 9.81 SH , 58 41 25 HP -- 2.7\ 10 --- ----- --- P> DB:lJ0 80 20 NV NP 2.61 Eil 0 ~3P_I 10 11.75 SH , -- 7.5 87.4
.. --- --~- -- -_. --- ._-- -- I
I, i 0 Ii] 13 2.85,
B-6 Bl-I 0 SH
S-I \ 2.5 SH NV NP -- 2.71 3 .- --- ------
P-I 6.5 8.5 SH/Hl 0 55 45 NV NP -- IIIJ 11.\ 83.1 1'1-\ .bksf al 20.01 •
- . strain and ,]': -lksf
''''1; 2 677.0 97.5
1'_1 ,'1 71; .17 Ql C:M -0 .... 1\ ,...1L~ CD 6.6 _2.l.J.....~~ 0
I
- ------ -- ---- .- -- --_.- -- "-- --- --8-7 S-3 9 10.5 SC 3 12 25 42 NP -- 2.79 12 -- --
I-_. ------
8-B 8l-\ 0 6 SP-SII 0 90 10 2.82
98.7 100.9 92.B Cjl'c1lc Irla.. lal
P-5 10 5H -Bi- _JOlt.!L _.96.0. R'~50nanl Colo"'"---- ---- ._---p-6 10 12 SH 2.61
7.8 102.8 95.4 95./, 336 CIYc Ilc Irl" .. lal._.... ._--_.- ---- - -- -- -_. -12.6. .109-1_ -96.9 -._.---- -- --p-8 12.92 13.5 SH 6.8 97.1 90.9 Rbsonanl Column._- - -- ._-- --- --- ----- -- ---- -
_._-- --- 1------ ------ - -- -- ---8-9 8l-' 0 " SP-SH -~ 90 10 2.68 I--"-"-_. --- -C:-- ._-- ----
S-I I -3.:~SP-SII 0 ~ 11 2.74. 3 -- -----_. ...~ ------- -- - -- ,- -SP-SII
;>. :>t. u
I.f.:..!.- _3- __5_ 0 ~, 12 2.63 CO 6.0 \02.5 0 3------ -- Itr.O "'Jr.T ll'f;TC~cllc Trla.. lalpoL _!!:~1 IO.2~ SH -~ ...lL.. 25 n 30 3 2.59 13.7 96.3 _. 84.7 "i:..~_.. "~I ..__
.1:L lit -,5.5 S~ - ~ 75 2) 36 HP -- 2.69 11 -- .- I
.' "",,'n.'" LU ........
. .!':L __ '2- 20 (~ --- --- --- --_. 7.1 100.0 93.4 Chemical Analysl.
~.--- - -
I:ASPECIFIC GRAVITY \ '::'$~'EMPAC ION TRIAXIAL COMPRESSION TESTS O:r HERS
\ ~,.
I a' _"INUS ~O, • \ l~' -'~'!~~98 IIC UNCONfiNED COMPRESSION CiJ CONSOLIOATEO UHORAINfO • V,SUAI. CLASS" I CA' ION
Cbl • PLUS NO. 121. ASr" 015S7 UU UNCONSOLIDATED UNDRAINED CO CONSOLIOA 1E 0 DRAINED •• 'N - PL ACE OENSIT V TESI- ~ 00 'T. LUS/CU." cu CONSOLIOATEO UNURAINEO CR CTCLIC COIlSOLIDAHD UNDRAINED HU- Non-Va lid

Best Copy A'''allablbHOSCO
.r~u...L
sal L TEST RESULTS SUMMARY511[H ) Of 10
JOB NO. -Lu.c1t1ll8i:1�t PROJECT III PP PROJECT FEATURE fOUNOAfiON INVESTIGATION - PllASE I DATE_.:..::Ha::Jy,---.:I9:..:.7.:...9 _
HOLE, DEPTH LABORATORY MECHANICAL ATTERBERG SPECifiC NATURAL COMPACTION SHEAR DATA PERME ABILITY CONSOt:
~~~:JJHFT CLASS. ANALYSIS LIMITS GRAVITY WATEA 10TAL UNIT OAt UNIT OP'IWUW MAO_ OAt TEST IN' riAL 'l' .,
DE~~~TY K 10AT ION REMARKSSAMPLE iG'!~VU SANDS fl~5SCO"TlI.l ww£IGHT ,*,[Hi'" wA'lA O£HSlft
~!l~ OIlY ~~~TNO. fAD" TO C%I C""'ILL PL PI G C%I pcr PCI (%, PCf ~SF DEG PCf finR TEST
B-IO BL-I 0 6 5P-SH 0 88 12 2.65 ------ -----5-2 1t.5 6 5H 0 75 25 NV NP -- 2.66 14 -- --
-9.1t 94.7 -86.6 -- . __.- ----
pol 11.5 12.9 SH 0 71 29 NV NP -- Cyclic orlaxlalf- ----l6.l_ --lD6...L .9LL ------ ,_.~ -- --- A;.~n'un. rn
5·5 15.96 17.2 SH I 72 27 36 NP -- 2.71 12 -- _.
8-11 5- , I 2.5 SC 0 83 17 2.78f--
5-3 9 10.5 SH I 71 28 2.79 15 -- .---- -
P-3 IS _~L 5H 0 66 34 2.631-- - --.>:) 11lO,1)-1?9:) --.- -- - LycIIC Irlaxl.I
p-Ij 17 18.5 S/i 7.9 'Ol.~ 93.6 Resonant Col,,,,,,,
B-12 P-2 3 _5_ SH 0 81t 16 2.65 7.0 _I_IQ.!L _J.03.2 103.2 947------p.1j ..-1..- . .2... _._~~H.!:- 0 ~ 48 ~- NP -- ~-- -- --- ---- ~._- ----- --_.
91113.6
- -- ----1- --t----I----'I---1I--------I
II]
NP -=.:.... --!.:l2. _.__ -'__I__-t-_..;;,S..c';:;.3t-1 '_0_.0
.-- -- .- .. 'SP::SH-- --0-1-89 If----l-~n_-I'_"I]'__-t..:B""I.'_-L..j]-'O=-.._L_ -SM__ 0 84 16 tlV
1- ..J:L _1- ..U-2!.::~__O_JL _,;:;8_1-_ _f--I--·t_....;2;.:....7..cIt-l--2~_I-_----_f-----I---I_--II--t--I----t--t--f------lf---+---+--------1
I- ~-.LP":.11_j-i..W- _-,S~H I--t--"--I--_t--_I_--1---1--'1~2=1t._127.7
1------ -- ...-- ._- ----I--;--If--- -- --1----1---+----1---11---.---1--;--;--- - -I----f---+---I--------I
I-~~_I_~.5 _~~~ 1_0~1--"'-'-qll-J--"q'_f--I._-f--t---=2.....7L::10,-+---I---+---I·--I---I--I---+---t--i--J----t---t---f--------I
VISUAL CU5SIflCATIOH
''', PLACE Df;NSI~t TUfHV- Non-V" lid'I" Non-Plastic6L- 6ulk S"mplep. pitcher 5a"",lo5 - 51.111 Spoon 5,,,,,p 10
•• II
CU CONSOliDATED UNDAAlNEDCD CONSOLIDATED DAAlNED
C R CYCLIC CO"SOllDA1ED UNDRAINED(PORE PRESSURE MEASUREM["lSI
CU CO"SOLIDATED UNDRAINEDCPOtU PRESSURE MEASUREMENTSI
uC UNCONflNEIl COMPRESSIO"UU UNCONSOLID41[D UNDRAINED
C] I ' 20,000 fT. LUS/CU. f TC4) I WAXINU" - NININUN
(~I • OlllER (Sf[ TOil
C.l • WINUS ftO.4
." 'PlUS NO ..
1- 1- S:.L ..5~5 -L. 5H _,!;;: ~L _!+- -- '__1--- -lJ!LI-'.:....1--1------ --.--- ._- --- -- -- ---If--f--t----f--1f---t--------I
_..i:§_ -I!! .15...5 --5~T --'-.Jh. J'!- _!iV..__~L r---=-:- -l...}L _'_2_ --=..--=---!-'-:.,:--I---I---I--t---t·---II--I--..-.--;--f---lf---------4
'-1---__·~_=_L-_~_~_7.L..._!9_1J9.9! -- ~/ .._-.LI11/J- _3!.~,-__tl_f'_-,--_-_-..L-_'77--.JI__8-'-_--_.-1.==·-=-'-:====:===~.J..-_-~~I-_-_-_-tL-_-_-:_-~I:·_-I::;L-_-_-_-_-I:_-_-_-I:_-_-_-~~I~_-_-_-_-_-:_-_-_-_-_-lJSPECifiC GRAVITY ~ TRIAXIAL COMPRESSION TESTS OTHERS
(I -A5".4 069
121' ,,~n. ~1

JMLLL
SOl L TEST RESULTS SUMMARYSItHT .. OF 10
Joe NO.-..!.1£:2..I!8't!:L.. PROJECT \lIPP PlIO lEtT fEATURE FOUHOATIOU INVESTlGATlOM-PtIAS[ OATE~yL_.L12ZjZL,;l2~----
IIN- PLACE of"5lTY Tur
NV- Non-Va lidNP- Non-PlasticBl- Bulk S""'9lo
P- PI tcher Samp'eS· S"llt S"oon Sample
• '*eo eONSOLIOAHD ORAIN[D
CR CYCLIC eOr4sOI.loATED IIr4DRAINED[PORE PRESSllRE MEAsUREWENlS)
Best Copy AvallablbHOSea
UU UNCONSOLIDATfD UNoRAINfD
Co eONsoLIOAffD UNDRAINEDIPORf PRESSURE ..£ASllRE ..Er4TSI
(21. Asr" 0"5'
Ill' 20,000 Fl. Les/cu. rr.41 • "'''XIMUN - MINIMUM
lSI. OrtlER 15Ef InTl
t btl PLUS NO.4
HQl.E, OEPnt LAIlOftATORY MECHANICAL' ATTERBERG SPECIFIC NATURAL COMPACTION SHEAR DATA PERJ.lEABILITY CONSOL-
~E~1:.:J1tn CLASS. ANALYSIS UJ.lITS GRAVITY WAHIl lOULUNI1 DRY UNIT OPJIWUM MAJ(, DRY reST "'flllA. ~ "J" OE~~~Y M IOATION REJ.lARKS
SAMPlE IGRAVEL SANDS rl~~,seOr4TE"l WflGHT WEIGHI WATER DENSITY WAT~1l I""" O£NSI1
HO. FROW ro ('\'01 (°/01 lL Pl PI G l"/ol per per e%' peF ,0'.J PCF _SF OEG peF FT/YR TEST
B-I& p.1 3 5 SH 2.&5 8.0 11 1•• & 106. I 106.1 300---_. --'--- -_.P-2 8 8.8) Sl1/Hl 0 52 ..8 NV NP -- 2.&0 2".2 119." 96.1 96.1 7
f- --~ ._-_. --- ._- -- ._--c-'2.&& 10.7 96.2 86.9
I
P'3 16 17.1 SH 86.9 8]2--- ----- --- ----- --
P-" 17.17 17.1 SH 6." 109.6 103.0I
Cyclic Tdax'a I--1
B-17 Bl-I 0 I. Sit 0 85 15 2.70
& 8 1".2,
P-I SH 109.3 95.7 Cyclic TriaxIal- -- ---P-2 8 10 SI1 9." 109.5 100.1 Cye Ilc Triaxial.- -_. 1--------- -- --- --_.- ._- ---.--- - --
-- - -- --_. --- ---~--- -
B- 18 Bl-I 0 ) SP-SI1 0 .~ 10 2.71,--'-- -- --I- --- -_. .-_. ----- ----
P-2 I" 1& SH 2.61 11.5 89.2 80.0 80.0 &..8-- --I-- --_.I
p_l, 18 10 SH/Hl 0 108 52 2.6~ 19.2 108.2 90.8 90.8 586- - -- -- --- --- +---" ---- ._-- -- --
I
- ,_ .... _._._--- -,----~ --- _..- -- ----_...-_.... ------ --- -- --- -B-19 5-1 I 2.5 SP-SH 0 91 9 NY tiP
~2.61 ...l.- -. --
S- 3 9 10 SH 0 63 37 NV NP.,
2.67 II -- --.. -- --_.. ----- -_._. --- -- --- +- •• '---- ---
B-20 Bl-I 0 __3_ SP-SH 0 90 10 2.70 ~Q.....J..!Q.,O~._--- -- --_.__ ..'- -
SP-SH 2.68I
BI.-2 0 _3_ D 91 9--- '-- -- ._~._. __._- -- ---- --- ._-- ._- -P-I 3 5 Sit -- ".7 95.9 91.6 )(r ~ 1---_.- ---;;'-;;7 S-
-'- --- --8-21 S-I 1 ~~. ~
2.68 " --- ..--:=::...~:_--
------ ..J:!. 8 ~,.~? .. _~11_.{. -~~- NV ~- -- 2.78 10 .. :.:..=.....-... ---~':\""'~
S·" I'. 15.5. SC \ 12 1:--«';- 1~ --- ----- 27..
SPECifiC GRAVITY '\co...~ACTlON ./ TRIAXIAL COMPRESSION TESTS OTHERS
1.1 I .....us MO, 4 III'AST~ lie UNCONFINfO CONPRfsSION CU eOr4S01l0ATfO UNDIIAINfO 11> VisuAL elAsslF,eATIOr4

Bost Copy Availaol~Hosea
'. ~,t. 501 L TEST RESULTS SUMMARYSIl[ET 5 OF 10
.'JOB NO. _~12:..:1f:.:::8.:..1f "":"!,,"_-_ PROJECT__..:\I.:..I:...:PP:.-.:..P:...:ro;:,.!J.:..,c::;t=-- _,.
FEATURE Foundation Investigation - Phase I DATE Hay 1979
at.
HOLE, DEPTH LABORATORY MECHANICAL ATTERBERG SPECIFIC NATURAL COMPACTION SlfEAR DATA PERMEABILITY CONSOLo
~E~U~JHFT. CLASS. i- ANALYSIS LIMITS GRAVITY wATER TOTAL UN" DRY UNIT OPTluu", WAW DRy fEST 'HillA ~ J' oRY k IDATION REMARKS
SAMPLE COff'f'Hl *(IGHT W['GtlT *'HR Ot"SITY Dt"SITY~~AV£l SA"OS fl~ES Pl PI 0 W~!g OAY~1'TNO. FRDM TO 10/01 t°la) I ~ol
II l"tol pcr pcr ("/u) Pcr KsF !utO pcr fT/YN TEST
B-21 s-6 21f 25. 116 SH I 80 19 2.65 5 - --->-- ---I----I---I--::-- .--- ---1--.-
3 SP-SH0 r 31_ 2'lLB-22 Bl-I 0~ .Z. !_.2__ .!IQ~L_L ~. ---- -_. --_. --
p-I 3 5 SH 0 85 15 2.68 6.1 111.1f ~~ 105.0 Iqlq. --- ---S-2 5.17 6.67 5H I 70 29 '9 20 9 2.78 II - -.-
-- - --- --_. ------ ---_.B-23 P-2 l ~. 5H 1 81f JL 2.66 hl-. !QlJ..- ~L1._ ---- - iCl8 I "01;---
JP- -7 -L~6_
10.2 t-).7 kif .. t ".ll1:¥.p_l, 2.....__ ... ~t!__ Q- ..M-_ )~ ,. ~--_.- -- --- '~,L IQQ.L- Q!t.L w.. .lI.•S 6A- - ll!Ll /.., Strain and <tl-1 ksf HaLHoI-5-6 10 10.92 5C 0 11 29 ~- HP ML _9__
[-5.5 ksf at 6.111
- - - Stealn ...... .;:_i L.---- ---~- _._-- --- ----- ---
B-21f 5-1 1 ~.:L 5P-5H D 91 9 2.67_._--- -- --_. -S-3 5 6 •.5_ 5C 6 62 1~~- HP .-=--~ 16 - ------ _.__.- .--- -- _._-- ---_ .. 1- --5-6 .If !,~~~~ SH JL._. - -"- .~-'."._..- ----- '-- -- -- -- ._--- --_. ------ --_ . -_.
---.B-26 BL-' 0 3 5P-5H 0 91 9 2.75--
p-6 .M_ 2tL ..-2,_H__ i._B_. IQLL.. 9§...L rU1'1I1' Trla.lal
~!..- 9.5 !~~- SH 12.3 ~~ 88.8 - C..cllc TrIaxIal----_.- -- -- ---, --- ------ -,......-....... ...
;;f 'K- '---- ----- ----._-- -_. -_._-_ ... -- -B-2] OL-I l_ 81f 16 2.87 - ._-- ---~._- -- ._---- -- -- --
p_ll _~:~l ,+ 11f.8t~2.1f k,f .. t I.71t~ uu 81f.8 Strain ..nd 1I%~!tH. I-\-- '~~-'~ ------- ,---------- ._-- ._--ta].1 s .. t .' .
P:L 8.67 ~O..i _~.,~IL1IfM.r ------- -- --- --- .!!!L JLJ 87.1& - t[.. ln Irld 1,-6 i..i S-.I.- -_ .. ----
st.
Sit.
St.
TR IAXIAL COMPRESSION TE STSSPECIFIC GRAVITY
(.1 • WINUS ftO, •
Ibl • PLUS "04
COMPACTION
(I) lAST" 0698
121 'ASIM DI~~7
I Sl • 20,000 fT.l8S/CU. fT
••• ' M."'I"'U'" - MIHIMUM
I~I • OlltER 15[[ IEXTI
UC U"CONrl"ED COMPRESSIONUU UNCONSOLIDATED UNORAI"ED
tu CONSOLIDATED UNDRAINtDI PORE PNESSUNt .. tASURI "ENTSI
CU CONSOLIDATED UNDRA,,,[OCD CDNSOLIOATED DRAINED
CR CYCLIC CONSOLIDATED UNDRAINED(PORE PRESSURE "EASUR["E"151
OTHERS
it VISUAL ClASSor,CAl,ON
lIi Jlt IN·PLACt l'ENSITY TUI
H\I- Non-Va lidHP- ibn-PlasticBL- llulk Sample
P- Pilcher SamploS- Spll t SIJOOn $i,mol,.

IAlli....!.
SOl L TEST RESULTS SUMMARYSHEET (, OF 10
JOB NO.-...:1~2.:.1t8:.It:.-- PROJECT WIPP Project FEATURE Foundation InvestIgation - Phas. I DATE~Ka_y,--_1...,9'r.l"","-- _
I
HOLE, DEPTH LABORATORY MECIIANICAL ATTERBERO SPECIFIC NATURAl. COMPACTION SIlEAR DATA PERMEABILITY CONSOL-
~E~~:~JHrr CLASS. ANALYSIS LIMITS GRAVITY ..ATER lOTAL UNII DRY UNII OPTIMUM MAl(, DRY lEST Nll.Al C 'J _DRY " IOATION i REMARKS
SAMPLE ~RAVEL SANDS '1;;ISCDNTENI ..E'GtlT W[IGH, ..ATER O[HSlft ..ATER DRY OENSIT DENSITY
IROM TO LL PL PI G 1'Yol IoH TESTNO. '1%1 1'1'.1 ('\'oj pcr per I'CF 1%1 PCI KSI PCI FTIYR
, ,[helllcal AnalysTs8-20 8L-1 0 It
SP-SH 0 91 9 2.69 10.5 110.6.J-- --I- --- --_.- ._- --~_ . ..... - ._- Resonant Column
P-5 8.17 10.17 SH 12.1 loIt.1t 93.1 .CYcllc Triaxial.._-- --- .... -_.- ------ --_. _.. --- .- -_.p-6 10.17 11.83 SH 0 70 30 NV I-~P - . ---- ._- ._- -- .. _ .•
.. I
,- "'.,"~ 'U,.L LLU Illesonant Co I UIM (2
8-29 BL-I 0 (, SP-SH 0 92 B 2.51t 13.2 108.6 Compact d San, Ie Cyclic Trlal<lal(OT
P-7 12.5 13.5 SH Chemical Analysis
.- --.--- - ---- ---f--
8-30 8L-1 0._ It SP-SH 0 ~~ 10 2.,.8-- ~._.- --17.1t~- 9l.T
..._- ._.- -- _.109.3 ycllc Trlaxla'
p-5 7.5 9.5 SC I~...!!_. .!Q!hL JL~ -_.- Resonant Col,oan---
.!,-6 g.S 10.58 18.0 9It.1t-3.3 ksf at 3.09%
SC .,----- --_.--.---.UU Stra h and (J"~LHf!.
P-7 10.58 12.58 SC !U_ ~.:.L_ 83.3 Cvclle T..
I- --_. --- ._-_. ._-- +--_.- --- --~ -'05:,8-31 ..!!b:L !L.._ '!.~~ .. SP-SH .'L_1-1!L lJ_ .1.:.~ !!.&-- 112.2 ..£!L. 7.8 105.0 0 JJ Resonant Column
'.'-'- --.- -- --- "-_.- --- 8:0- -to,.,-- . --- ------- -- ·1r.t - i02:~ lU).3 lin Cyc IIc Trial< lal-12
8-)2 Bl-I 0 10 SH 0 6'. 36 2.72 12.0 100.7 CO 11A 0 '3. C,,,,,pact d Sam Ie Resonant Column-2-_._-"-~-
_._-- - -- ~--------------- - _. -102.4-
P-O 12_ J~~ SH 0 ~ 1L - --- I--- ---_._- -- - ----- ._-_.--- ..
8-JJ Bl-I 0 (, SP-SH 0 81 9 2.73 I._- -- --_..... _. -
P-5 8 9 5H 11.1 99.3 89.1t I :Cycllc Triaxial---..- ---9 / 'iO:Oii~
._-p-6 0 67 Jl NV NP - 6.6 93.7 07.9 ~ycllc Triaxial
I~~-"I--- ---
P-7 3.8 99.6 96.0 96.0 6Ij,.------ ._- --.-_. -- -_.
_..- I
SPECIFIC GRAVITY COMPACTION TRIAXIAL COMPRESSION TESTS OTHERS- ,
101 'MINUS NO 4 II t AS 1 M 0690 UC UNCONFINED COMPRESSION CU CONSOLIDATED UNDRAINED * VI~UAL CLASS",CATION
Cb I 'PLUS NO.4 '. - 12\ ' ASIM 01557 UU UHCONSOLlOATED UNDRAINED CD COIISOLIDAlED OI""NEO • • IN-PLACE D(HSITV TEST
Testslsts)
Holst.
Testse.ts
lSI' 20,000 FT. L8S/CU FT.
141' "'AMIMUM - MINIMUM
15\ • aTt.ER (S(( IElTI
Cu CONSOLIDATED UNDRAIH[DCPORE I'RESSURE MEASUREMENTS)
Bast Copy Availablt:HOSea
CH CYCLIC CONSOLIDATED UNDRA'NED(PORE PRESSURE MEASUREMENTSl
HV- Non-Va lidtlP,- Non-Plast IeOl- Oulk Sample
P- Pitcher Sample5,- Sn III Snnnn SAmo I"

Best Copy AvailaoJbHOSCO
!M1L!.
SOl L TEST RESULTS SUMMARYSIIEET 7 OF 10
J08 NO._I:.:2:..;48.:.,..:...- PROJECT \/II'P Project FEATURE Foundtltlon Inve.tlgatlon - Ph..e I DATE HaV 1979
at.
ests
est,
HOt.E. DEPTH LABORATORY MECHANICAL ATTERBERG SPECIFIC NATURAL COMPACTION SHEAR DATA PERIAEABILlTY CONSO\:
~g~:JlltFT CLASS. ANALYSIS LIMITS GRAVITY wAl[ft TOTAL UhlT DRY UNIT OPTIMUM MAX:, ORY rEST INITIAl l' if D(~~~Y • IOATION REMARKS
SAMPlE,", CONTENT wEIGtH w[IG.n wATfR O[NSITYRAV(L SAJ!OS fl~~IS
WATER DIll' OI:NSlTNO. fROW TO .,.J.
1"101LL PL PI G t°k! M:f PCf 1%1 PCf 1%1 pcr "5r !lEG pcr fT/YR TEST0'0)
, !L.~
-igt5B-1" BL-I 0 .(.P-C;M 0 89 II 2.7" 12.8 110." CO J!:~ 0 n Resonant Col.-.-2_. -- --- --_.P-6 II ~~.. SH 0 66 fl!!- 8.9 10l.' 94.7 ----1--- yclle Triaxial-- -- --- ---
,------- _. -- ---
B-lli !!d- O 5 5P-51L-- 0 88 12 2."7
TIL liJ= ~F8-------I-
yelle Trlaxla If::L- 8 10 SH 101. -i1•0 Runn~n. rftl. __...
II. -101. 1:6-
Ip-6 10 Il-~11- ~.2._ .JiLL --!Q!,l - 'r...·I1~ T~I_wl .1
6.8 106." 99.6I P-8 ,.&Z Il,~7 .~ - ---- -_. -- -- --- ~,L. JIQ.L _IQ~,Q
_.~-- ._--. -- - "--- -- 'ru~ II .. Tr law I_I
5.2 111.6 106.0
.- -_.- --- ._- -- .- _.- ----- !t..Q__ .199. t. _IQ't.1 ----- ._-- -- ------ - ---Ip-'1 Il.67 15."2 SH -- ---- ~L._ .98 ·L. ~2.,.. Cuellc Trb".... 1
8.6 6." 8'1.1lIe.onant (olulln
P-IO 15.42 16.7~~H !Q~.- _~2.1 !l!L . - lJU-t-I.6kd .. t I III
Strain and or}-Ik.f. ._-_. ._-- -- Nat Hold
---_. - --- --- ._- --- ---- -,--- --- ._-~._- -_. -- -----I- -..I:lL- !!.:.L L_. 1.£ _-2P~~!L ~-- ~ 1_1- -- '-- --- !M.._ -_. .._- --- --- --- I-
~.~ -ror.-;-o;p-8 !M_ 12,L. $" 0 7l 11- .9L u- 106.1 .04 28--- -164.-
--_ .. - -._- _ ... ._. ----_...!~1L-_ BL-I L-. !_- SP-SH 0 'II 9 .--- - l.:!L--- ------ --- ------- - --.=,,-- .--
/' ""'- t-9.5ks' at 7.19'1
---_. ~:~- l~,)~ !l~J -_. -- .. . --- --- Illl 2~~ Strain and 1~------
~Nat. MOI.t.
---_.-- --. --SP-~~' -J - ._-- --- _.
D-HA DL-l ~ 1 C-- II;2.78 --- ---- ._-
-_._-~'~1'._
- --------- ._-B-l8 BL-I ~- l.5 ~,:::~~.~- _.. --- 2.72
tal.Bksf at 10.01tP-5 11."2 1}."2 SH 0 69 }I ._L.-' __. Illl 8.1 85.1 Strain and '!"••6k.f S-
TRIAXIAL COMPRESSION TESTSSPECIFIC GRAVITYl ....., ..us NO, 4
1b I • PLUS NO 4
COMPACTION
til lAST .. 0698
121'Asr .. DISSTell' 20,000 fT. LllS/cu. f T
(41 I MAxlMUN - ""H.I.4U'"
151' OTHER IS£[ r£x1I
UC UNCONFINED CO"PRESSIONIlU UNCONSOLIOAHD UNDRAINEDeu CONSOLIOATED UNORAIN[D
IPOnE PR£SSUf/[ M[ASUR£I,I[NTSI
CU CONSOLIDATED UNDRAINE 0
CO CON50LIOAHD DflAINEOCR CTClIC CONSOLIDATED UNORAINEO
(POR( PRESSURE MEASUR[ ... £N151
OTttERS
... VISUAL CLASSIfICATION• II IN' PL ACE O(NSIT Y fEST
tlV- l«:ln-Valld
NP- l«:ln'PlastleBL- Bulk Sample
P- Pitcher Sample5- 5,,, It 5110<>11 5".",Ie

t.
SIIEET 8 OF 10
II
f E ATURE F_o_u_n_d_a_t1_00__1n_Y_o_s_t~1;:.!Ja;..t;..l;..oo.;.;..._-;..P~h;.;;.,;;.s~o_l;,.- DATE_....H.....uy'--'--1..=9-'i7;:.9 _
I
illll..l.TEST RESULTS SUMMARYSOIL
Joe NO._1_2_,.8_,..:....- PROJECT IIIPP Project
.HOlE, DEPTH LAllOflATORY MECHANICAL ATTERBERG SPECifiC NATURAL COMPACTION SHEAR DATA PERMEABILITY CONSOL-
I
~g~:,JlHrT. CLASS. AN~LYSIS LIMITS GRAVITY WATEII fOTAL UN" OilY UNIT OPTlMUM 'UK. DRY rE 5f INIIIAL C J _D~Y N IDATION REMARKS
SAMPLE GIIAVEL SANDS ~~~sCOOITENf WElGHf WEIGl" WATER OENSITY
~%IR DRY DENS" DENSITY'"0" TO LL PL PI G 1'1'01 IlEG TESTNO, CO'aJ. 1%1' I%! pcr PC, PC' pC, NSF pcr fTlYR
,> :I0-39 8L-1 0 ] SP-SH d 88 12 2.5" -- ---- ---
'-
- ~.-- ----- --- ._- i--- ._-- i
O-~O 8L-1 0 4 SP-SH 0 8'1 n 2.67 --- ---- -- ,
I
.1- .
~l P-5 '1.75 10.42 SH 0 69 11 ~~SJ! SoU.t-'l.u Nsr at 2.3 ~
'-- St aln and 0:·1 ksf S
P-] 11.08 12.01: SH~ 89.1 ]6.0 Cyclic TrlaMI .. 1
-------- --- --_.B-~ 1'-3 !1.67 13.6 SH 0 66 34 i
..._-- --- -- _._-_.
-- -- -- ----- ----- I
0-~9 1'-" 8.5 10.5 SKlHL 0 5" It6 .ll.... -itt 6~L .5f 31 I-_. -8l.I
P-5 10.5 11.17 SH 29.3 117.3 90.7 Resonant Col ......--- -I
P-] 13.17 15.~ SH ~~ .~~2....~ --- -+_. CVclic Td.MI.1'--'----
1'-8 15.17 !1:!1 SH .~ 511 42I--- .---- --------- --- --- -------
1'-9 17.17 19.1 SH~- ~:..!... 92.7
~·I ... ksf .t 0.811
1- St aln and ~.·2 ksf S t------ --- ---I
---- ---- -- --~---- - ------ 19-:-9 I~:t0-50 ,~ !l~!1 13.1 SH 0 60 ~- J?_ ..J.L 13 ~ c-.H.7 -ffil M! .Jj I--
f---"- ~-1_ !~J2 ~!~ SH ---- 7.1 _~6_ ~,~ ------I- Cvcllc Trl"MI,,1---_._- -._--_._------ - --- --- --- 1~~13.0 ksf lit 2.6J
.!!.:~_I__ ...f±- U~-'!& __~tt~ __~ __ -- -- ._- ,.-JIlL '1.7 '17.'1 St lin "nd 1f.-2 k<f ~ t
.____1__+. '" ~.!l - --- I. -1'.' t-b.S ksf .t 1.It4'X
~__~~__ ~:~7_ ?~~? i--~L._~~.-- }-_+__ ---- --- ---- f--- --- UU 10.1 81.7 -ll 110 Ind CTJ-' hI
\ ....~Ha .1 Holslure
-'---'SPECIFIC GRAVITY ""'-. COMPACT~ -~ TR IAXIAL COMPRESSION TESTS OTHERS.....t.t • WINUS fIIO. 4 1" 'A~0&98 uC UNCON~'N[O CO"pRE 5S.0N CU CONSOLIDATED UNOIIA'N£O • VISUAL CLASS.flc.nON
\21'ASf" 01557c') I • 2U,OOO FT. LBS/cu , I.
e4) I "''')IIINUM - MIHINU...
151'OlIlEIIISH IEOI
UU UNCONSOLIDATED UNOIIAINEO
Cu CONSOLIDATED U"o"A'N[O(PONf PRESSURE "EASlJREIlENTSI
-- t COpy Avallab1bBes HOSea
CO CONSOLIOAIEO ORA'N(OCR CYCLIC CONSOL 'OAf EO UNDRA'NED
(PORE P"ESSURE .. EASURE .. 'NI.1
• It 'i1V!."L~~(_em~Y IESfI
HP- IiJn-Plast Icott Bulk Samplo
1'- Pitcher SampleS" Spilt Spoon Sample

IM!L.L
SOl L TEST RESULTS SUMMARYJOB NO.--.,;1;.;;2~11.:..81t.:.- PROJECT IIIPP Project
6eafCopy Avq.iiac)i.,Hoseo
FE ATURE foundat Ion Invest Igat Ion - Phase II
SItHT 9 OF 10
OATE--'.",.,."-y_......:19...;.7.:..9 _
.. 5 L CL 5 f T ON
• Jl IN-PLACE DENSITY I£5TIN- Non-Va lidNP- Non-PlutlcOl- Oulk S"mpleP- Pitcher S"mpleS- Sp II t Spoon SMlple
oCO CDNSOI.IDA TED DRAINED
CN CYCLI C CONSOLIDATED UNDRA'NEDCPORE PRESSURE MEASUREMENTS I
UC UNCONflNE CO E55 0UlJ UNCONSOLIDATED UNORAINEDCU CONSOLIDAHD UNDRAINED
I POIIE PIIESSlJlIE MEASUREMENTS'
til AS'M 0690
III &A5'" OI!t~7
D I • 20,000 fT. L05/CU fI
(4 t I UA IiI'MUM - MINIMUM
I~I I OTH[H C5E[ '£)(1)
:.... ~_ ..101 5NO.4Ibl ,PLUS NO.4
,.,'.', ..... "-
tfOl.E, OEPTt1 LABORATORY MECHANICAL AHERBERG SPECIFIC NATURAL COMPACTION SHEAR DATA PERMEABILITY CONSOL-
TE5T PITh FT. CLASS. ANALYSIS LIMITS GRAVITY "'AHR 10TAL UNit llfIYUNIT OPTIMUM Mol)(, DRY IE ST INITIAL C .,DE~~~Y • IOATION REMARKS
OR TRENC SAMPlE !GRAVEl SANDS fl;'1S CONHNI wEIGUr w[IGltr wATER Ol'NSIT't I-!LR DRY ~"{'TNO. fRO" TO 1°/,.1 1"101 II PL PI G I".' PCf PCf 1".1 pCf 1"101 .5' DIG pcr fTlYN TEST
TP-l : ;L-I L SP2.6lt
3.b 105.2 101.;
1.7 SP-SIt 0 90 10 7.0 IQhL _96 .9 Relative o~n.ltv1-----. ._--BL-2 8.6 9,.1 Caliche -- 18.7 108.11 91.3 f--.--. ---IlL-1 1.1...2- 1't.L. --..£!tI I cho 8.1 tQb.L __~.7 --- I-- -BL-It 21 0 21." Sandstone --- .~L- 110.5 10~: ._-
TP-2 - 0 - t;M 3.0 105.2 102.---1-------Bl-I 3 3.5 ~M-c-L ..!L -!L 2.6'1 7.2 117.9 110.( Relative Density-_. -- 1-'_- ---- --- - ItW • 103.:r·r- --
103.1 3 Compacted to 95'X.Bl-2 5.5 6 ._l;!!!!g!!!.. - 17.3 109.9 93.7 16.1 109.9 ...cu. 15.11- _105...1L 2..0 a!I. ComDac cd Sa 'ole &lI1murL.d...nc I tvr-'--- --- _._- - -- ---- ---- ---. ._---" -_.- - --_.
16.5 103.7
--- ---- U...L WlO..!L - _. .:=-
ffi I~.O 1I0./j 111.2 31f Compacted to 95'.tBl-3 II 11.5 Sandstone 13.7 11~!.... .~3.3 12.9_I~ !~~1" "
,. Compac cd Sa IDle max 1m,.. dens' tv-- I-----TP-3 --=-- 0 - SP 3.5 112./j ~~ -- -- f-._-_._-- -- --- ---_. - --
Bl-I ~ .hL __SH.__. ...JL 81 Iq .!&- 1~_ _.I~~:L 115.~ Relative Oen,lty--- -- .,-~ --- ----- -- -- -_.- - _.
1------ ....!!!::L ~,..L ~~ __Cal.lcbe_ _. ---- .!!!~_.. J99.L .....58.8 --- -_. _ .. _. -OL-l ~d.. ~,L ~Ilch· ------ 12.8 108~L 96.2
_._-~-- tl~:!L ~L ?L ~1£'lL_ - 5.7 115.7 109.!
JIL=5. !!.L ~--Ca IIche 11.1 .!l1..!L.. _lQLj----- - .... - ~' .. - ,.- -_ . -----
____• __ 4 .QL=6... Ill.1. Ill...l 2'!..n~~,,~ -- - ._-- -'~.L_ .. !J!!,!!- -l!>t.~-- ---I- -- --- - --
---- ._- -- -- -- - _.- ----I---I- i---------
f~:~------'-' --------~-~ -~- ---&----_. __.._- -- --- --_ . --- I--. ~
._._._.~ . _. - - _ ...--..
----- -'-'.' --_.- -
SPECIFIC GRAVITY '- ./ COMPACTION TH IAXIAL COMPRESSION TESTS OTUERS
• NINU - , 0 MPR I N CU CONSOLIDAtE UNDRAINED VI UA A Sl itA I

SHEET 10 OF 10
501 L TEST RESULTS SUMMARYJOB NO. __'_2_48_1+_...- PROJECT__II_I_PP_P_ro...:J:..-e_c_t _ FE A TURE_....:..;Fo:::u~nd=a.::.t.:..:10~n.:....:.l~nv.:..:e::.:5:..:t~I~9a::;t~l~on::.:-_-..,:Ph..:;:.::,s::.._I:...:I:......- _ DATE_..IJIIA""¥J--..;.1~9Z<.::91_---_
IHOt.E. OEPTlt LABORATORY UECHANICAL AHERBERG SPECIFIC NATURAL COMPACTION SHEAR DATA PERMEABILITY CONSOL'
TEST PITH fT CLASS. ANALYSIS LIMITS GRAVITY IlIATER TOULI",,' OIlY UllIT OPfUoIUM MAl(. DRY TEST HITIA C 'j' _DRY K lOATION REMARKSOR TRENC SAMPlE GRAV£L SAO/OS Il~~IS
CDO/nO/T W£IGHT wE 'GuT "ATE 01 D£NSIT.[W~J/=IR
DRY DENSlT DEO/,I1Y
INO. fROM TO (°/01 ,O/u) LL l'L PI G("/u) PCI PCI 1%1 PCf pcr "Sf O{G PCI H/TA TEST
0 SP2.63 :t~
, 11.2 101.3TP-I+ I., _. ~ ~ " SP-SH 0 91 9 lIll..L JOU Relative Oensltv--- -_.
- - " f--- ----- ------ --- hemlc"l Analvsls
PL-2 1.5 8 SH 0 7Q 21~-~~1.:.L. 106.1+ ~- Re 'at 'UA 0..." ltv--- --- -- -_.
- - '0 ~",dcal Analysis---I-- --- -13.5 CAliche 103.8 13.3 112.0
13.1 105.1:1 lOb." 10 ""'Pac ted to 95'%PL-3 11+ 1.0 111.1 I~ .!~,2 106.6 l·O 135 Conlpa ted S .mole Hax I mum den. It u
13.0 106.1+Ie--- --_. --_. ---- - l\:b -\~}.l- - -
DL-I+ 29.5 30 Sandstone 1.0 122.6 "1+.6 13.1+ 111.0 CD 1.3 '06.3 1.6 36 ~gg~)c e§6S.. pie Comfaclc~ to 95'i'------- 3.3'- JODI
_. --- --- - ux mlln ens i ty
- 0 - SP 98.2TP-Ii oL:.L l.S-- ...!I... SP-SH 9- ....!!~L _H_ ~~- lJL__. .Ilt.L [email protected] J n __. I •._.- -_.. -. I
BL-' 10 6 ...!!:J.. Caliche -- !.!:L. 11~_ ....!Qh! _.
!IkL. .2,.9 10./1 -'aUl;hc._ . ._-- lJ~ JQ!!..~._ -,§.&.. ..._-- ._-_.. I
8L-4 l\.q 11.- 1+ C! Ilche ~L_ lll.L JJ.L.~ _
OL-t; 20.s .21.. '1 .. SandHQIlL --- 7.!I_. 1!l~L. _12S,] ..._-_. --_. -- -- --- - I
-- -- --_._- _. -- _.-- --- --.. --- --- --- ----~.-- -----I- -lIand Dug
:11-,
.J.L6-£L.IIor I------ --- --- ---- -- ---- --- - ----- I-_. ,
550 East "0:25-_. -- 1.0_ 3.5 __Sf.___ -- ----_.- ~l- .I2!t...6...._ _.11lQ.5 ----.---I-
---_ .. -- -- -- ._--- .. - ._--- - -_. --- ---- .__. --_.. --- --_. --- - I
---_._. -- _. --- -_.- -- -- - --_. -----.------
-- ._-- -------.. - -_. --- .- ------ ------I- II
-- - -- -- - ,
-- --- - ------ II
-- .--- -- ---_.. -- - -- -'-- ---..
TRIAXIAL COMPRESSION TESTSSPECIFIC GRAVITY«.1 • NIHU$ ~O. 4
'0' • PLUS 0/0. 4
.-,,. 0698
TW DI~~T
,DOD .T. LOS/CU. FT
•".XINuwI- MINIMUM
~. 'l\"'~i;7E01 «Sff TE' II\
~~'::,y.. If·~··, ..· i
~-_//
uc UNCONfiNED CO..PRESSIDN
IIU UNCONSOLIDATED UNDRAINEo
CU CONSOLIDATED UNDRAINEDI PORE PRESSURE ..EASURE"EN1SI
Best Copy AvallabhtHOSea
cu CONSOLIDATED UNDRAIO/ED
CD CONSOLIDATED DRAINED
C R CVClIC CONSOLIDATED UNOHAINED«PORE PRESSURE WEASUREWENTSI
OTHERS
lit VISUAL CLASSifiCATION
* * IN1PLACE DEO/SITY TUT
PN-' Non-ValidHr- Non-PlasticOl-' Ilulk Sample
P-I Pitcher SampleS- Spilt Spoon SllIIIplc
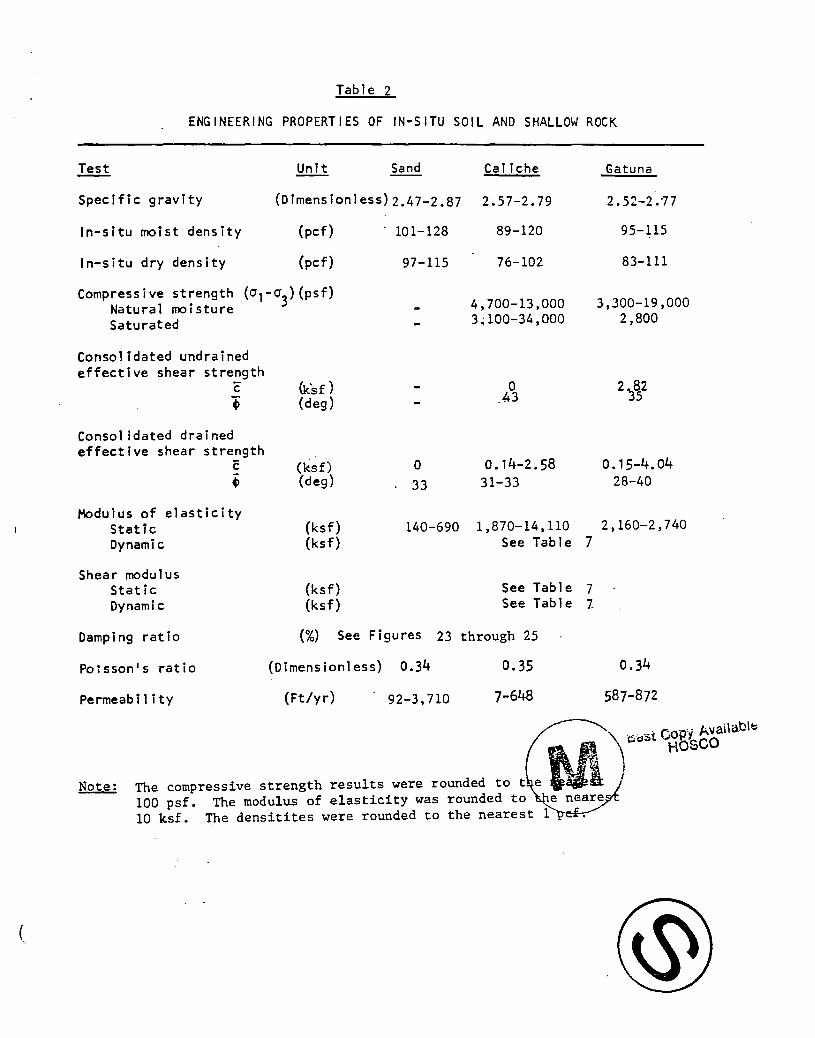
Table 2
ENGINEERING PROPERTIES OF IN-SITU SOIL AND SHALLOW ROCK
Test Unit Sand Caliche Gatuna
Specific gravity (Dimensionless)2.47-2.87 2.57-2.79 2.52-2."77
In-situ moist density (pcf) 101-128 89-120 95-115
In-situ dry density (pcf) 97-115 76-102 83-111
Compressive strength (01-03
) (psf)Natural moisture 4,700-13,000 3,300-19,000
Saturated 3~100-34,000 2,800
Consolidated undrainedeffective shear strength
c Ck'sf) 0 2~~2i (deg) ~3
Consolidated drainedeffective shear strength
C (ksf) 0 0.14-2.58 0.15-4.04~ (deg) 33 31-33 28-40
Modulus of elasticityStatic (ksf) 140-690 1,870-14,110 2,160-2,740Dynamic (ksf) See Table 7
Shear modulusStatic (ksf) See Table 7Dynamic (ksf) See Table 7.
Damping ratio (%) See Figures 23 through 25
POissonls ratio (Dimens ionl ess) 0.34 0.35 0.34
Permeab it i ty (Ft/yr) 92-3,710 7-648 587-872
(

Table 3
ENGINEERING PROPERTIES OF SAND BACKFILL
Test Unit
ASTM D 1557 maximum dry density (pcf) 109 -112
ASTM D 2049 maximum dry density (pet) 113-118
ASTM D 2049 minimum dry density (pet) 84 - 90
Optimum moisture content (%) 5.3-13.2
Consolidated drained effective shear
strength
c (psf) 0
cj> (deg) 33-33.5
Modulus of elasticity
Static (ksf) 520
Dynamic See table 7
Shear modulus (ksf) See table 7
Damping ratio (%) See Figure 23
Poisson's ratio (Dimensionless) 0.34
Note: The dry density was rounded to the nearest 1 pcf, and the modulusof elasticity to the nearest 10 ksf •
.':.:.. "-
-'.
, .
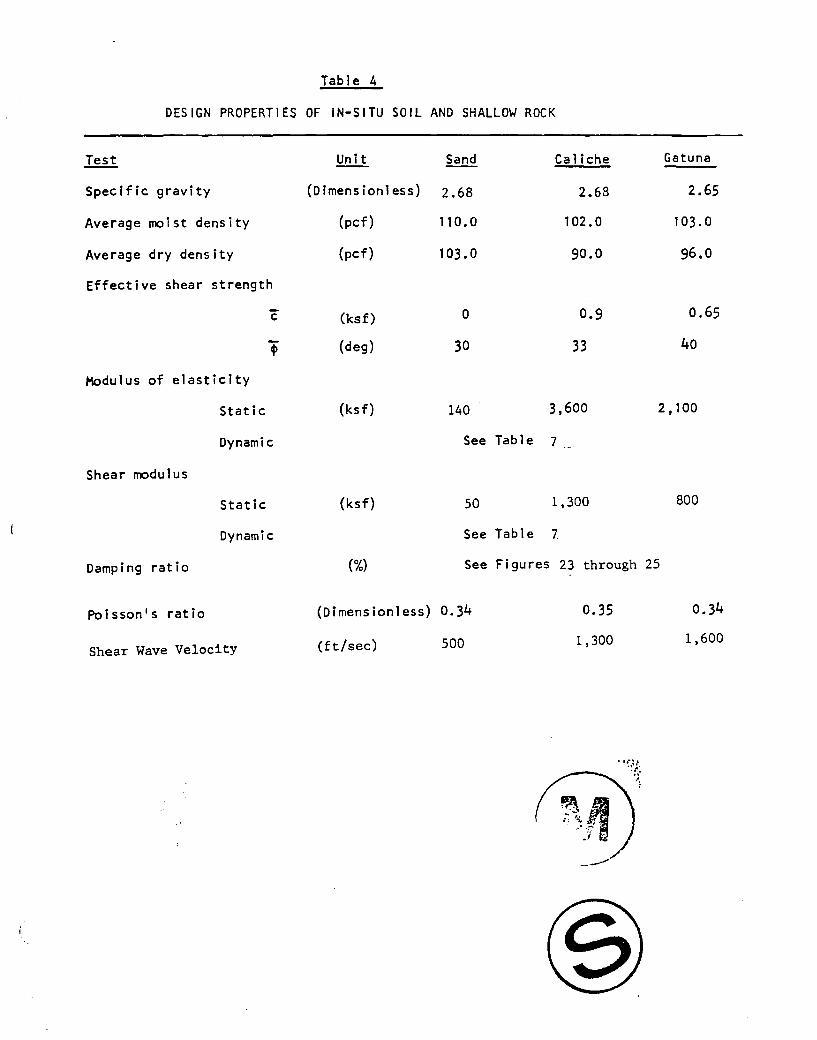
Tab 1e 4
DESIGN PROPERTIES OF IN-SITU SOIL AND SHALLOW ROCK
Test !!!!it Sand Ca Ii che Gatuna
SpecIfic gravity (Dimensionless) 2.68 2.68 2.65
Average moist density (pef) 110.0 102.0 103.0
Average dry density (pef) 103.0 90.0 96.0
Effective shear strength
c (ksf) 0 0.9 0.65
~ (deg) 30 33 40
Modulus of elasticity
Static (ksf) 140 3.600 2.100
Dynamic See Table 7
Shear modulus
Static (ksf) 50 1,300 800
Dynamic See Table 1
Damping ratio (%) See Figures 23 through 25
Poisson's ratio (Dimensionless) 0.34 0.35 0.34
Shear Wave Velocity (ft/sec) 500 1,300 1,600

Tab1e 5
DESIGN PROPERTIES OF SAND BACKFILL
Specific gravity
____·_A~Ti'1 0 1557 rnax"iJTIu~~9:'.~_~~~~l' _
Optimum moisture content
Average moist density
Effective shear strength
Unit
(Dimensionless) 2.63
(pcf) 110.0
(%) 9.8
(pcf) 121.0
Modulus of elasticity
Static
Dynamic
Shear modulus
Static
Dynamic
Damping ratio
(ksf)
(deg)
(ksf)
(ksf)
(%)
o
33
500
See Table 7
200
See Table 7
See Figure 23
Poisson's ratio (Dimensionless) 0.34

Table 6
NEAR SURFACE SEISMIC VEr..ocITIES AND ErASTIC MOIlJLI
"p" Wave "S" Wave Moist Young's Shear BulkDepth velocity velocity ~nsit~ Poisson's Modulus Modulus Modulus
Material (Ft) (ft/sec) (ft/sec) Ibs/ft Ratio (ksf) (ksf) (ksf)
In-situ Sand 0-13 1,100- 450- no 0.34 1,900 700- 1,9001,800 900 7,400 2,800 7,700
caliche
Gatuna
Santa Rosa
Dewey LakeRedbeds
7-20
12-43
32-53
40-100
2,0004,000
2,9004,700
3,3005,200
3,5009,400
1,0001,900
1,3002,200
1,3003,000
1,8003,900
102
103
132
142
0.35
0.34
0.34
0.38
8,60030,900
14,50041,500
18,50098,600
39,500185,500
3,20011,400
5,40015,500
6,90036,800
14,30067,200
9,50034,300
15,10043,200
19,300102,700
54,900257,700
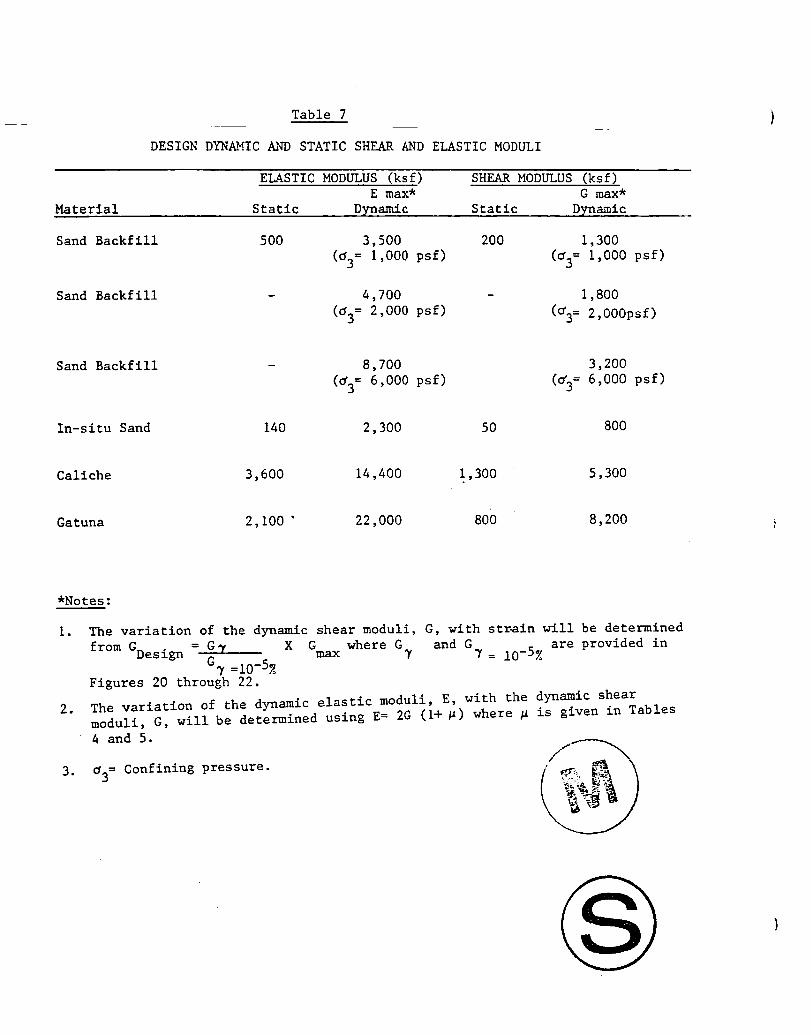
Table 7
DESIGN DYNAMIC AND STATIC SHEAR AND ELASTIC MODULI
ELASTIC MODULUS (ksf) SHEAR MODULUS (ksf)E max* G max*
Material Static Dynamic Static Dynamic
Sand Backfill 500 3,500 200 1,300(d
3= 1,000 psf) (d
3= 1,000 psf)
Sand Backfill 4,700 1,800(d
3= 2,000 psf) (d3= 2,000psf)
Sand Backfill 8,700 3,200(d
3= 6,000 psf) (d
3= 6,000 psf)
In-situ Sand 140 2,300 50 800
Caliche 3,600 14,400 ~,300 5,300
Gatuna 2,100 • 22,000 800 8,200
*Notes:
G, with str~in will be determinedand G 5 are provided in
'Y = 10- %
1.
2.
3.
The variation of the dynamic shear moduli,from Gn i = Gy X G where G
es gn G max 'Y'Y =10-570
Figures 20 through 22.The variation of the dynamic elastic moduli, E, with themoduli, G, will be determined using E= 2G (1+~) where ~
4 and 5.
d = Confining pressure.3
dynamic shearis given in Tables

Test Pit
TP-1
TP-2
TP-4
Table 8
RELATIVE DENSITY OF IN-SITU SAND
In-Situ Minimum Maximum RelativeDry Density Density Density Density
Depth yd y min y max DrSample Ft. pef pef pef %
BL-1 3.2 -3.7 97 89 113 39
BL-1 3.0 -3.5 110 84 118 81
BL-1 3.0 -3.5 107 86 U5 78
BL-1 3.5-4.0 109 90 114 81
ElasticModulus
Epsi
Note: The densities were rounded to the nearest 1 pcf.

Table 9·
010 SIZE AND COEFFICIENT OF UNIFORMITY OF TESTED SAND BACKFILL

Tobie 10
CHEHICAl ANALYSES Of FOUNDATION HATERIALS.
IIorlng Test Depth Ferric Aluminum Calcl .... Hognes'"," Los' on SodIum Potus lum SulfurPIt lb. ~ _F_t_ Haterl el 51 lice OxIde ~ ~ OxIde Ignition ~ OxIde TrIoxide Carbonate Chloride
8-28 8L-l 0-" 8rown 50nd 93.2" 1.02 2.83 0.16 0.20 .."" 0.22 O.n 0.042 0.80 0.05
TP-It 5 Tan Sand 89.62 1."6 3.81 1.36 0.27 1.88 0.3" 0.88 0.045 0.59 0.04
TP-It 10 ""lte Send 81t.64 0.87 2.86 5.2" 0.26 5.02 0.19 0.55 0.115 It. 72 0.03
8-29 P-7 12.5-13.5 Caliche 55.12 2.78 3.57 17. ]I, 2."0 16.71 0.28 1.17 0.101 16.19 <0.01
8-9 P-3 19-20 Getune 79.76 1t.17 5.92 2.1" 1.71 ).96 0.31 1.70 0.065 3.25 0.05
~Shown as a percentage by weight.

Table H~'
PLATE LOAD TEST RESULTS
Modulusof
Water Plate Subgrade ElasticDry DensIty Content Diameter ReactIon Modulus
Test Pit Test No. MaterIal Depth (Ft. ) (pcf) (%) ( In) (pc I) (psI)
TP-3· 1 Sand 3.2 30 200 4,800TP-3 2 Sand 3.2 115 3.6 18 225 2,800TP-3 3 CalIche top 5.5 100 11. a 18 2,500 31,000TP-3 4 Caliche top 5.2 96 12.8 12 3,200 26,000l'P-3'" 5 Caliche mlddle9.2 109 5.7 12 11,890 98,000TP-3 6 CalIche mlddle8.5 101 11.3 12 ,,850 15,000TP-3 7 Gatuna top 16.2 12 2,290 19,000TP-3 8 Gatuna top 16.2 101 12.6 12 1,850 15,000
TP-5 1 Sand 3.8 30 165 3,400TP-5 2 Sand 3.6 109 3.4 30 155 3,200TP-5 3 Caliche top 10.6 102 11.5 12 1,620 13,000TP-S 4 CalIche top 9.9 97 11.9 12 2,990 25,000TP-S S Ca I Iche
middle 13.9 12 5.560 46.000TP-5 6 CalIche
mIddle 13.9 112 5. 1 12 4,420 37,000
Hand-dug Hole,116 ft NE of B-25 Sand 3.0 100 4.1 30 47 1.000
Note: to the nearest 1 pef.

Table 12
NET APPLIED PRESSURES ANDNET ULTIl1ATE BEARING PRESSURES
structures
FoundationDimensions1ft x ft)
NetUltimateBearingPressure
(Ksf) .
NetAppliedStaticPressure
(Ksf)
Factorof
Safety
Waste Handling Building
Hot Cell Mat 40x113 116 4 29Braced Bay Footing 12x76 73 5 15Colunm Footings 18x18 78 5 16Column Footings 8x8 68 5 14
Storage Exhaust F~ter Building
Colunm Footings 12x12 72 3 24Column Footings 6x12 64 3 2-1
Emergency Generator Building
Column Footings 12x12 34 3 11Column Footings 6x12 29 3 10Continuous Footings 5x22 28 3 9
Administration Building (Control Room)
Column Footings 8xa 21 2 10Column Footin.gs 6x6 19 2 9
. . . . . - . . . .

. structures
---~~_. - ----
Table 13
SETTLEMENTS OF ~OUNDATIONS
FoundationDimensionslit x ft)
Net AppliedStatic
Pressure. (Ksf)
Settlement(in)
iiaste Handling Building
IDt Cell Mat . 4Ox113 4 1.0Braced Bay Footing . 12x76 5 0.5Column Footings 18x18 5 0.4Column Footings 8x8 5 0.2
Storage Exhaust Filter Building
Column Footings 12x12 3 0.2Column Footings 6x12 3 0.1
Emergency Generator Building
Column Footings 12x12 3 0.5Column Footings 6x12 3 0.4Continuous Footings 5x22 3 0.4
Administration Building (Control Room)
Column Footings 8x8 2 0.2ColuDUl Footings 6x6 2 0.2. . . . . . . ... - .. .. . . . ........
,.
.. ,

TABLE 14
FIELD RESISTIVITY SURVEY
Resistivity Depth ResistivityLocation (Ft) Reading (Ohms) (Ohms-em)
R - 1 5 0.12 x 10 2 11,49010 0.065 x 10 2 12,448
R - 2 5 0.405 x 10 2 38,78110 0.11 x 10 2 21,066
R - 3 5 0.145 x 10 2 13,88410 0.065 x 10 2 12,448
R - 4 5 0.30 x 10 2 28,72610 0.08 x 10 2 15,321
R - 5 5 0.47 x 10 2 45,00510 0.09 x 10 2 17,236
R - 6 5 0.20 x 10 2 19,15110 0.065 x 10 2 12,448
Notes:
1. 'Ihe average electrical resistivity wasdetermined to depths of 5 am 10 feet using a"Vibroground" Merlel 293 instrtJITents and anequally spaced electrode configuration "WennerMethoo" .
2. Fesistivity locations R-l through R-6 are shownon Figure 1 of this report.

Table 15
LABORATORY RESISTIVITY
Resistivity Laboratory ResistivityLocation Sample Origin & Depth (ohms - em)
R-1 Test Trench TP-3 0 -2~' 10,2532~-4' 4,6384 -8 1 4,9648 -12' 3,137
R-2 Test pit TP-4 0 -4' 13,9204 -II' 9,275
11 -18 1 6,72918 -24' 4,24624 -30' 3,395
R-3 Boring B-13, BL-3 0 -7' 6,401S-2 5 -6~' insufficient sampleS-4 9 -10~' insufficient sample
R-4 Boring B-14, S-1 1 -2~' insufficient sample8-2 4~-5~' insufficient sample
R-5 Test Trench TP-5 0 -3' 14,3683 -7 1 3,0057 -13' 3,984
13 -16' 1,76316 -18' 1,763
R-6 Boring B-53, S-l 1 -2~' insufficient sample8-3 5~-71 insufficient sample8-4 8 -9 15" insufficient sample
Notes:
(1) Laboratory resistivity tests were performed according toCalifornia Highway Department Test Procedure 643, Part 4,Laboratory Method of Determining Minimum Resistivity.
(2) Resistivity locations R-l through R-6 are shown onFigure 1 of this report.
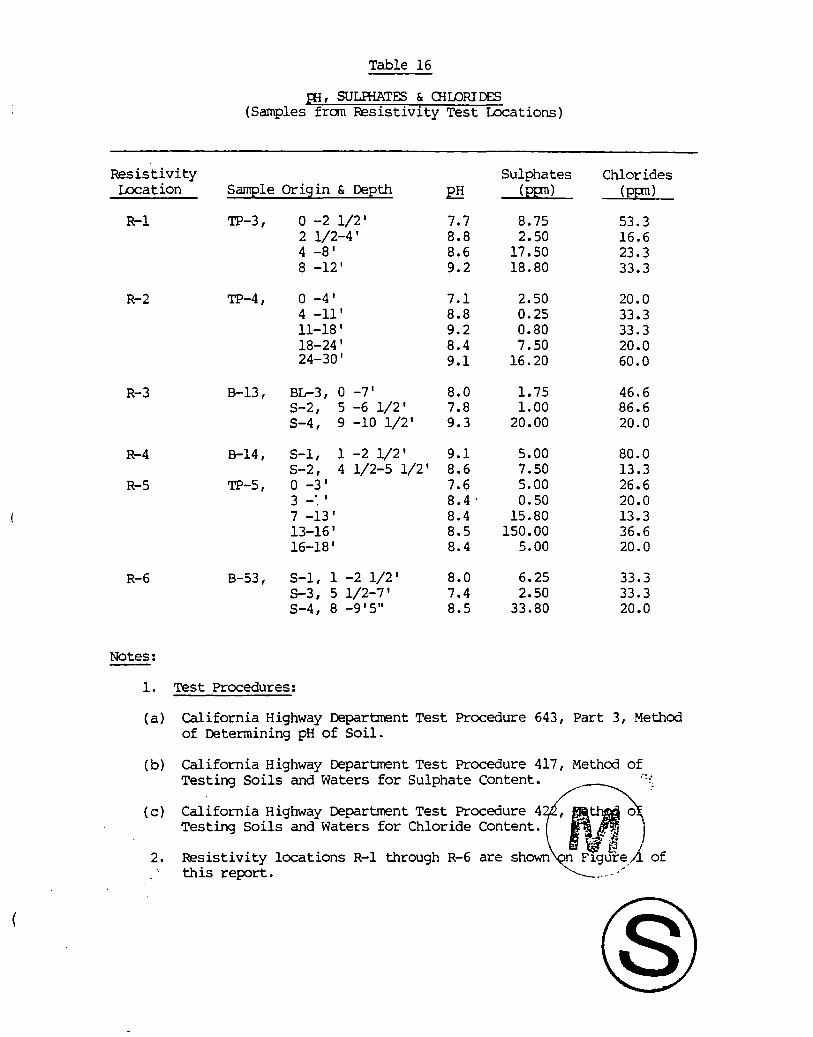
(
Table 16
Bi, SUUHATES & QiLORIDES(Samples from Resistivity Test Locations)
Resistivity Sulphates ChloridesLocation Sample Origin & Depth E!! (ppn) (ppn)
R-l TP-3, o -2 1/2 1 7.7 8.75 53.32 1/2-4 1 8.8 2.50 16.64 -8 1 8.6 17.50 23.38 -12 1 9.2 18.80 33.3
R-2 TP-4, o -4' 7.1 2.50 20.04 _11 1 8.8 0.25 33.311-18 1 9.2 0.80 33.318-24 1 8.4 7.50 20.024-30' 9.1 16.20 60.0
R-3 8-13, BL-3, 0 -7 1 8.0 1. 75 46.6S-2, 5 -6 1/2' 7.8 1.00 86.6S-4, 9 -10 1/2 1 9.3 20.00 20.0
R-4 8-14, S-l, 1 -2 1/2 1 9.1 5.00 80.0S-2, 4 1/2-5 1/2 1 8.6 7.50 13.3
R-5 TP-5, o -3' 7.6 5.00 26.63 _~ 1 8.4 . 0.50 20.07 -13 1 8.4 15.80 13.313-16 1 8.5 150.00 36.616-18 1 8.4 5.00 20.0
R-6 B-53, S-l, 1 -2 1/2 1 8.0 6.25 33.3S-3, 5 1/2-7 1 7.4 2.50 33.3S-4, 8 -9 1 5" 8.5 33.80 20.0
Notes:
1. Test Procedures:
(a) california Highway Department Test Procedure 643, Part 3, Methodof Determining pH of Soil.
(b) california Highway Department Test Procedure 417, Method ofTesting Soils and Waters for Sulphate Content. ..~,
(c) california Highway Department Test Procedure 4Testing Soils and Waters for Chloride Content.
2. Resistivity locations R-1this report.