dprk energy and energy-related trade with china recent trends and implications june 26-27, 2006 dprk...
TRANSCRIPT

DPRK Energy and Energy-DPRK Energy and Energy-Related Trade with ChinaRelated Trade with China
Recent Trends and ImplicationsRecent Trends and Implications
June 26-27, 2006
DPRK Energy Experts Study Group Meeting
Nathaniel Aden

•Notable Findings •Questions Concerning Energy Trade•Data Sources•Energy and Fuel Trade•Energy-Intensive and Related Goods•Trends and Implications
Today’s Presentation
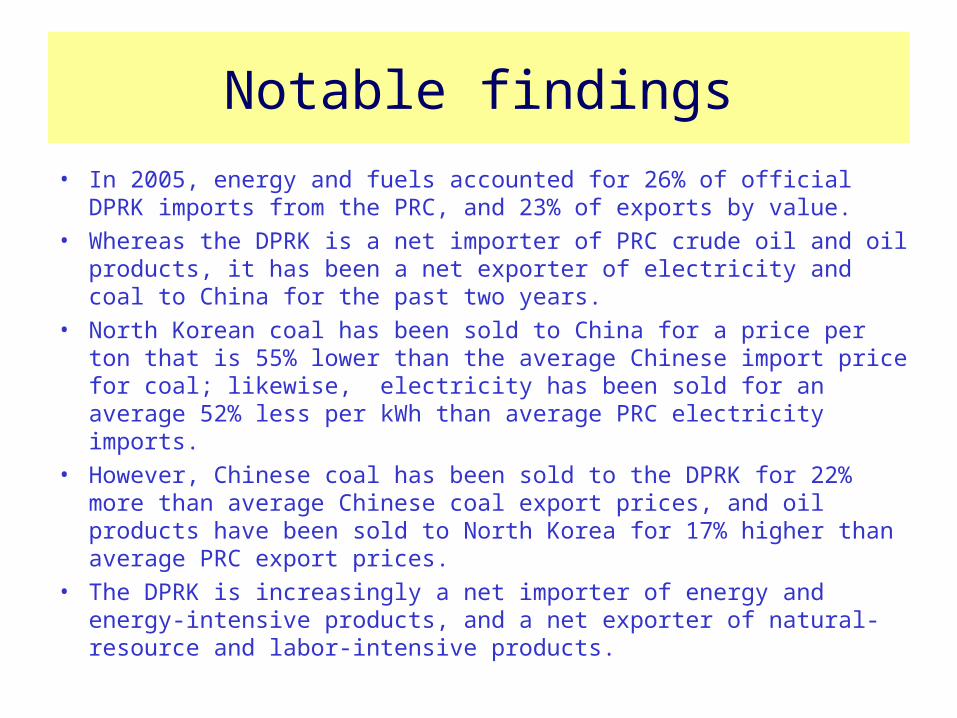
Notable findings
• In 2005, energy and fuels accounted for 26% of official DPRK imports from the PRC, and 23% of exports by value.
• Whereas the DPRK is a net importer of PRC crude oil and oil products, it has been a net exporter of electricity and coal to China for the past two years.
• North Korean coal has been sold to China for a price per ton that is 55% lower than the average Chinese import price for coal; likewise, electricity has been sold for an average 52% less per kWh than average PRC electricity imports.
• However, Chinese coal has been sold to the DPRK for 22% more than average Chinese coal export prices, and oil products have been sold to North Korea for 17% higher than average PRC export prices.
• The DPRK is increasingly a net importer of energy and energy-intensive products, and a net exporter of natural-resource and labor-intensive products.

• What is the value and quantity of energy and fuels trade between North Korea and China?
• How does each country price energy and fuels exports relative to other trading partners?
• What is the energy- and labor-embodiment of DPRK-PRC trade?
• What do trade data indicate about the domestic energy situation?
This presentation will address four questions on DPRK energy trade with China

Direct DPRK data are elusive
North Korean trade data are covered in the UN International Commodity Trade Database and on a fairly detailed level in Chinese Customs Statistics Yearbooks. In order to examine the relationship between the DPRK and the PRC, this presentation reviews data compiled by the China Customs Bureau. Trade value data are in current dollars according to current official exchange rates.

$(1,200)
$(900)
$(600)
$(300)
$-
$300
$600
$900
$1,200
1995 1997 1999 2001 2003 2005
mil
lio
n $
/yea
r
food
other
energy & fuelsenergy intensive/related
(DPRK imports)
(DPRK exports)
Energy and fuels has been a consistent portion of DPRK-PRC trade

In 2005, energy and fuels was the single largest official DPRK-PRC trade category
DPRK Imports DPRK Exports
Commodity Value (million $) Commodity Value (million $)
1
Energy and Fuels $ 286
Energy & Fuels $ 112
2 Meat $ 104 Fish and Seafood $ 92
3 Machinery $ 77 Ores, Slag, Ash $ 92
4Electrical Machinery $ 57 Iron and Steel $ 72
5 Plastic $ 52 Woven Apparel $ 58
6 Cereals $ 50 Wood $ 15
7 Iron and Steel $ 35 Zinc & Articles Thereof $ 11
8Manmade Filament, Fabric $ 29
Misc. Grain, Seed, Fruit $ 7
9Vehicles, Not Railway $ 28 Knit Apparel $ 5
10Iron/Steel Products $ 25
Edible Fruit and Nuts $ 5

-
500,000
1,000,000
1,500,000
2,000,000
2,500,000
3,000,000
1995 1996 1997 1998 1999 2000 2001 2002 2003 2004 2005
ton
s/y
ea
r
imports
oil products
crude oil
coal
coke
Crude imports were overshadowed by more than 2.8 million tons of coal exports
(3,000,000)
(2,500,000)
(2,000,000)
(1,500,000)
(1,000,000)
(500,000)
-
1995 1996 1997 1998 1999 2000 2001 2002 2003 2004 2005
ton
s/y
ea
r
oil products coal
exports

-
50
100
150
200
250
300
1995 1997 1999 2001 2003 2005
mill
ion
US
$
crude oil
oil product
But crude oil is more valuable…
(300)
(250)
(200)
(150)
(100)
(50)
-
1995 1997 1999 2001 2003 2005
mill
ion
$/y
ea
r oil product
coal
(imports)
(exports)

(100,000)
(50,000)
-
50,000
100,000
150,000
200,000
250,000
1995 1996 1997 1998 1999 2000 2001 2002 2003 2004 2005 2006
ton
s/m
on
th
($200)
($100)
$0
$100
$200
$300
$400
$500
$/t
on
im
po
rted
cru
de
imports
exports
crude
product
imported crude price
…and North Korea’s sporadic oil imports have continued unabated
(400,000)
(300,000)
(200,000)
(100,000)
-
100,000
200,000
300,000
400,000
1995 1996 1997 1998 1999 2000 2001 2002 2003 2004 2005 2006
ton
s co
al/m
on
th
$(100)
$(75)
$(50)
$(25)
$-
$25
$50
$75
$100
$/to
n
import price
exports
export price
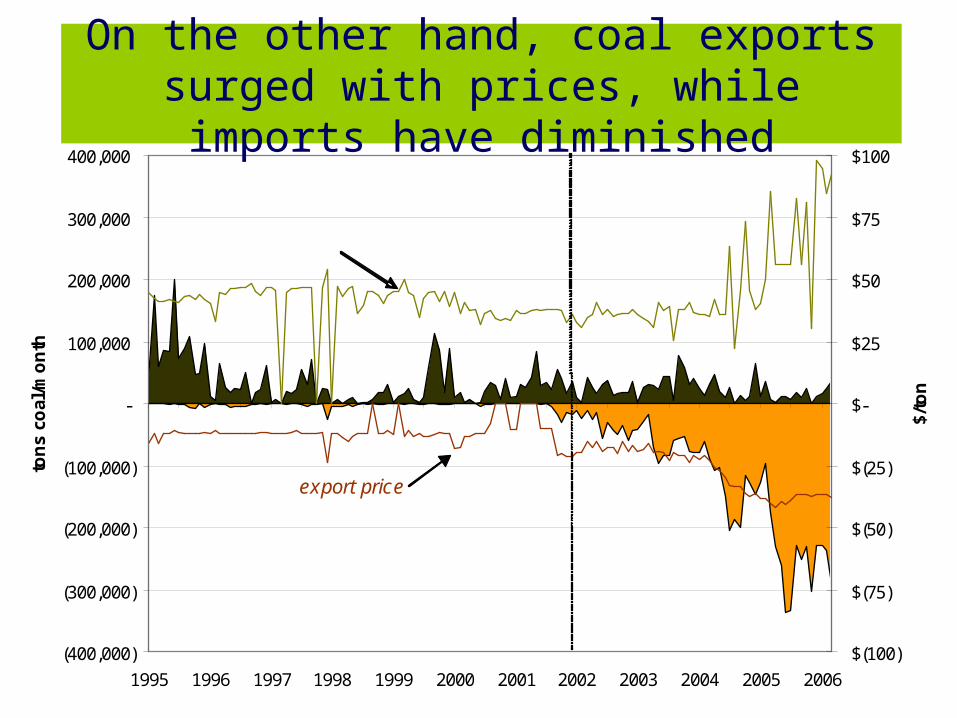
On the other hand, coal exports surged with prices, while imports have diminished
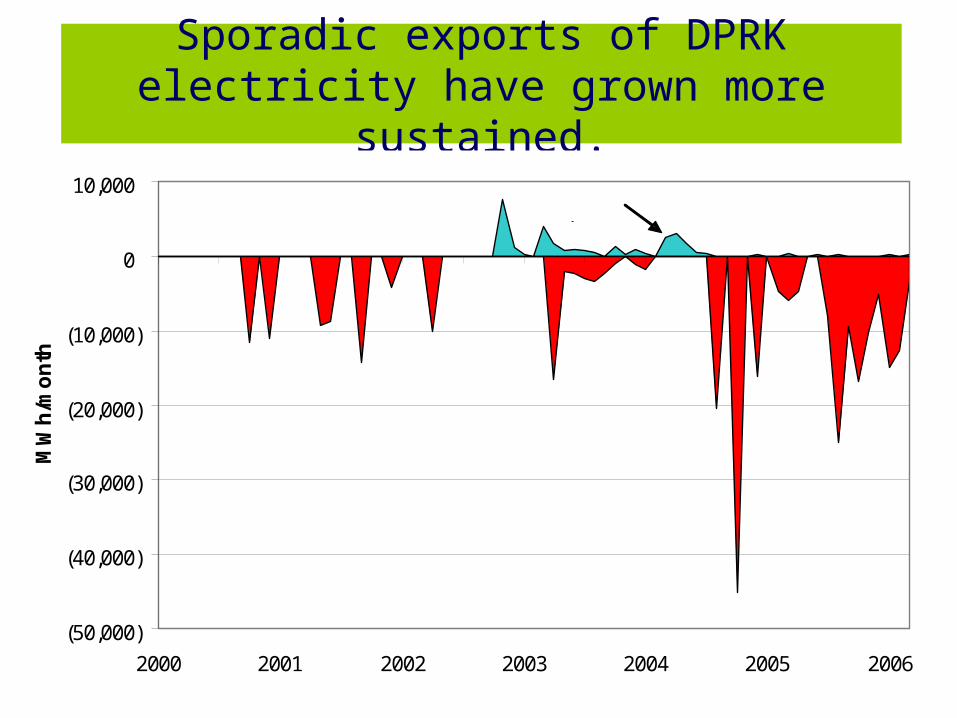
Sporadic exports of DPRK electricity have grown more sustained.
(50,000)
(40,000)
(30,000)
(20,000)
(10,000)
0
10,000
2000 2001 2002 2003 2004 2005 2006
MW
h/m
on
th
imports
exports

-
0.02
0.04
0.06
0.08
0.10
$/k
Wh
ele
ctr
icit
yPRC imports
DPRK exports
North Korean exports of electricity and coal have grown at “friendship prices”
$0
$10
$20
$30
$40
$50
$60
$70
$80
$90
1995
1996
1997
1998
1999
2000
2001
2002
2003
2004
2005
2006
$/t
on
co
al
PRC imports
DPRK exports

$0
$100
$200
$300
$400
$500
$600
$700
199
5
199
5
199
6
199
7
199
8
199
9
200
0
200
1
200
2
200
3
200
4
200
5
200
6
$/t
on
oil
pro
du
ct
DPRK imports
PRC exports
$0
$20
$40
$60
$80
$100
1995 1996 1997 1998 1999 2000 2001 2002 2003 2004 2005 2006
$/t
on
co
al
PRC exports
DPRK imports
But Chinese coal and oil product have been sold at top dollar

…and the DPRK lost its controlled price of $127/ton PRC crude oil in February 1998
$0
$100
$200
$300
$400
$500
$/to
n c
rud
e o
il
PRC exports
DPRK imports

0
5
10
15
20
25
30
1995 1997 1999 2001 2003 2005
mil
lio
n $
/ye
ar
trucks
cars buses
0
10,000
20,000
30,000
40,000
50,000
60,000
1995 1997 1999 2001 2003 2005
nu
mb
er o
f ve
hic
les/
year
bicycles
Transportation equipment moves on a one-way street between the PRC and the DPRK

In trade with the PRC, DPRK exports became more labor-intensive and imports more energy-intensive
(200)
(100)
0
100
200
300
400
1995 1997 1999 2001 2003 2005
mil
lio
n $
/yea
r
energy-intensive imports
labor-intensive exports
(imports)
(exports)

• DPRK-PRC trade deficit surged to its highest point in 2005 ($588 million), while the value of the energy-trade deficit rose to its highest point after 1995 ($173 million), offset perhaps by coal exports.
• Inelasticity of DPRK crude oil import demand to prices may indicate low discretionary usage.
• Expanding coal and electricity exports may reflect surplus capacity, or desperation for hard currency
• Asymmetrical energy export pricing suggests an unbalanced alliance
• Increasing energy-embodied imports may reflect undeveloped industry-integrated energy capacity (e.g., steel or aluminum production capacity)
These ‘mirror statistics’ have implications for DPRK energy and bilateral relations
