dpr on effulent methane capture 1000 cubm
TRANSCRIPT

DETAILED PROJECT REPORT
ON
METHANE CAPTURE (BY ANAEROBIC TREATMENT OF
1000 M³ /HR EFFLUENT) TECHNOLOGY
(GUJARAT DAIRY CLUSTER)
Bureau of Energy Efficiency
Prepared By
Reviewed By

METHANE CAPTURE (BY ANAEROBIC TREATMENT OF 1000 M³ /HR EFFLUENT) TECHNOLOGY
GUJARAT DAIRY CLUSTER
BEE, 2010
Detailed Project Report on Methane Capture (By Anaerobic
Treatment Of 1000 M³ /Hr Effluent) Technology
Gujarat Dairy Cluster, Gujarat (India)
New Delhi: Bureau of Energy Efficiency;
Detail Project Report No.: GUJ/DRY/MCP/07
For more information
Bureau of Energy Efficiency
Ministry of Power, Government of India
4th Floor, Sewa Bhawan, Sector - 1
R. K. Puram, New Delhi -110066
Ph: +91 11 26179699 Fax: 11 26178352
Email: [email protected]
WEB: www.bee-india.nic.in

Acknowledgement
We are sincerely thankful to the Bureau of Energy Efficiency, Ministry of Power, for giving us
the opportunity to implement the ‘BEE SME project in “Ahmedabad Dairy Cluster,
Ahmedabad”. We express our sincere gratitude to all concerned officials for their support and
guidance during the conduct of this exercise.
Dr. Ajay Mathur, Director General, BEE
Smt. Abha Shukla, Secretary, BEE
Shri Jitendra Sood, Energy Economist, BEE
Shri Pawan Kumar Tiwari, Advisor (SME), BEE
Shri Rajeev Yadav, Project Economist, BEE
Petroleum Conservation Research Association (PCRA) is also thankful to “Shri P.K.Sarkar,
OSD & other officials of Gujarat Co-operative Milk Marketing Federation (GCMMF) & its union
members” for their valuable inputs, co-operation, support and identification of the units for
energy use and technology audit studies and facilitating the implementation of BEE SME
program in Ahmedabad Dairy Cluster.
We take this opportunity to express our appreciation for the excellent support provided by
Dairy Unit Owners, Local Service Providers, and Equipment Suppliers for their active
involvement and their valuable inputs in making the program successful and in completion of
the Detailed Project Report (DPR).
PCRA is also thankful to all the SME owners, plant in charges and all workers of the SME
units for their support during the energy use and technology audit studies and in
implementation of the project objectives.
Petroleum Conservation Research Association
Ahmedabad

Contents
List of Annexure iv
List of Tables v
List of Figures vi
List of Abbreviation vIi
Executive summary viii
About BEE’S SME program ix
1 INTRODUCTION ........................................................................................................... 1
1.1 Brief introduction about cluster ...................................................................................... 1
1.2 Energy performance in existing system ......................................................................... 7
1.2.1 Fuel consumption .......................................................................................................... 7
1.2.2 Average annual production ............................................................................................ 7
1.2.3 Specific energy consumption ......................................................................................... 7
1.3 Existing technology/equipment .................................................................................... 10
1.3.1 Description of existing technology ............................................................................... 10
1.3.2 Role in process ........................................................................................................... 12
1.4 Baseline establishment for existing technology ........................................................... 12
1.4.1 Design and operating parameters ............................................................................... 13
1.4.2 Operating efficiency analysis (Existing Loss Study) ..................................................... 17
1.5 Barriers in adoption of proposed equipment ................................................................ 17
1.5.1 Technological barrier ................................................................................................... 17
1.5.2 Financial barrier .......................................................................................................... 18
1.5.3 Skilled manpower ........................................................................................................ 18
1.5.4 Other barrier (If any) .................................................................................................... 18
2. PROPOSED EQUIPMENT FOR ENERGY EFFICENCY IMPROVEMENT ................. 19

2.1 Description of proposed equipment ............................................................................. 19
2.1.1 Detailed of proposed equipment .................................................................................. 19
2.1.2 Equipment/technology specification ............................................................................ 22
2.1.3 Integration with existing equipment ............................................................................. 22
2.1.4 Superiority over existing system .................................................................................. 22
2.1.5 Source of equipment ................................................................................................... 23
2.1.6 Availability of technology/equipment ............................................................................ 23
2.1.7 Service providers ........................................................................................................ 23
2.1.8 Terms and conditions in sales of equipment ................................................................ 23
2.1.9 Process down time ...................................................................................................... 23
2.2 Life cycle assessment and risks analysis .................................................................... 23
2.3 Suitable unit for implementation of proposed technology ............................................. 24
3. ECONOMIC BENEFITS FROM PROPOSED TECHNOLOGY .................................... 25
3.1 Technical benefit ......................................................................................................... 25
3.1.1 Fuel saving .................................................................................................................. 25
3.1.2 Electricity saving ......................................................................................................... 25
3.1.3 Improvement in product quality.................................................................................... 25
3.1.4 Increase in production ................................................................................................. 25
3.1.5 Reduction in raw material ............................................................................................ 25
3.1.6 Reduction in other losses ............................................................................................ 25
3.2 Monetary benefits ........................................................................................................ 25
3.3 Social benefits ............................................................................................................. 26
3.3.1 Improvement in working environment .......................................................................... 26
3.3.2 Improvement in workers skill ....................................................................................... 26
3.4 Environmental benefits ................................................................................................ 26
3.4.1 Reduction in effluent generation .................................................................................. 26
3.4.2 Reduction in GHG emission ........................................................................................ 26
4 INSTALLATION OF PROPOSED EQUIPMENT ......................................................... 27
4.1 Cost of project ............................................................................................................. 27
4.1.1 Equipment cost ........................................................................................................... 27
4.1.2 Erection, commissioning and other misc. cost ............................................................. 27
4.2 Arrangements of funds ................................................................................................ 27
4.2.1 Entrepreneur’s contribution ......................................................................................... 27
4.2.2 Loan amount. .............................................................................................................. 27
4.2.4 Terms & conditions of loan .......................................................................................... 27
4.3 Financial indicators...................................................................................................... 28
4.3.1 Cash flow analysis....................................................................................................... 28
4.3.3 Net Present Value (NPV)............................................................................................. 28
4.3.4 Internal rate of return (IRR) ......................................................................................... 28
4.3.5 Return on investment (ROI) ......................................................................................... 28
4.4 Sensitivity analysis ...................................................................................................... 28
4.5 Procurement and implementation schedule ................................................................. 29

vii
List of Annexure
Annexure -1: Energy audit data used for baseline establishment ........................................ 30
Annexure -2: Process flow diagram after project implementation ........................................ 31
Annexure -3: Detailed technology assessment report ......................................................... 32
Annexure -4 Drawings for proposed electrical & civil works ............................................... 34
Annexure -5: Detailed financial analysis .............................................................................. 35
Annexure:-6 Procurement and implementation schedule ................................................... 39
Annexure -7: Details of technology service providers .......................................................... 41
Annexure–8: Quotations or Techno-commercial bids for new technology/equipment .......... 42
List of Table
Table 1.1 Details of annual energy consumption ...................................................................... 1
Table 1.2 Details of types of product manufactured .................................................................. 2
Table 1.3 Average fuel and electricity consumption .................................................................. 7
Table 1.4 Average annual production ....................................................................................... 8
Table 1.5 Process wise (Main Equipment) wise cost of energy consumption ........................... 9
Table 1.6 Energy charges ...................................................................................................... 11
Table 1.7 Demand charge ...................................................................................................... 11
Table 3.1 Energy and monetary benefit (For One Typical Unit of Gujarat Dairy Cluster) ........ 25
Table 4.1 Details of proposed technology project cost ............................................................ 27
Table 4.2 Financial indicators of proposed technology/equipment .......................................... 28
Table 4.3 Sensitivity analysis at different scenarios ................................................................ 29
Table 4.4 Procurement and implementation schedule ............................................................ 29

viii
List of Abbreviation
BEE Bureau of Energy Efficiency
CDM Clean Development Mechanism
DPR Detailed Project Report
DSCR Debt Service Coverage Ratio
DSH De-super Heater
GHG Green House Gases
IRR Internal Rate of Return
MT Million Tonne
MW Mega Watt
NPV Net Present Value
ROI Return on Investment
SCM Standard Cubic Meter
SIDB Small Industrial Development Bank of India
MoMSME Ministry of Micro Small and Medium Enterprises
WHR Waste Heat Recovery

ix
EXECUTIVE SUMMARY
Petroleum Conservation & Research Association (PCRA) is executing BEE-SME program in
Gujarat Dairy Cluster, supported by Bureau of Energy Efficiency (BEE) with an overall
objective of improving the energy efficiency in cluster units.
Gujarat Dairy cluster is one of the very important clusters in India. Gujarat is 5th largest milk
producer state in India. This explains the importance of dairy cluster in Gujarat State.
Accordingly this cluster was chosen for energy efficiency improvements by implementing
energy efficient measures/technological upgradation, so as to facilitate maximum replication in
other dairy clusters in India. The main energy forms used in the cluster units are grid
electricity, Natural gas and small quantity of diesel oil.
The cluster comprises of mainly two type of dairy activity viz Milk chilling center & main dairy.
In milk chilling center energy is mainly consumed for milk chilling process while in dairy the
major consumer of energy is various milk processes. The cluster comprises of about 80% milk
chilling center & 20% dairies. In a typical milk chilling center, cost wise 61% electrical energy &
39% thermal energy being consumed.
This DPR highlights the details of the study conducted for the use of Methane Capture
technology to generate bio mass for various usages, possible Energy saving and its monetary
benefit, availability of the technologies/design, local service providers, technical features &
proposed equipment specifications, various barriers in implementation, environmental aspects,
estimated GHG reductions, capital cost, financial analysis, sensitivity analysis in different
scenarios and schedule of Project Implementation.
This bankable DPR also found eligible for subsidy scheme of MoMSME for “Technology and
Quality Upgradation Support to Micro, Small and Medium Enterprises” under “National
Manufacturing and Competitiveness Programme”. The key indicators of the DPR including the
Project cost, debt equity ratio, monetary benefit and other necessary parameters are given in
table below:
S.No Particular Unit Value
1 Project cost ( Rs. in Lakh) 247.56
2 Expected Electricity Savings kWh/annum 54000
3 FO Saving details Kg/Annum 352800

x
S.No Particular Unit Value
4 Monetary benefit (Rs. in Lakh)/annum 105.82
5 Debit equity ratio Ratio 3:1
6 Simple payback period Yrs 2.34
7 NPV (Rs. in Lakh) 214.90
8 IRR %age 29.98
9 ROI %age 22.43
10 DSCR Ratio 2.20
11 Process down time Days 14
The projected profitability and cash flow statements indicate that the project
implementation will be financially viable and technically feasible solution for Gujarat
Dairy cluster.

xi
ABOUT BEE’S SME PROGRAM
Bureau of Energy Efficiency (BEE) is implementing a BEE-SME Programme to improve the
energy performance in 25 selected SMEs clusters. Gujarat Dairy Cluster is one of them. The
BEE’s SME Programme intends to enhance the energy efficiency awareness by
funding/subsidizing need based studies in SME clusters and giving energy conservation
recommendations. For addressing the specific problems of these SMEs and enhancing energy
efficiency in the clusters, BEE will be focusing on energy efficiency, energy conservation and
technology up-gradation through studies and pilot projects in these SMEs clusters.
Major activities in the BEE -SME program are furnished below:
Activity 1: Energy use and technology audit
The energy use technology studies would provide information on technology status, best
operating practices, gaps in skills and knowledge on energy conservation opportunities,
energy saving potential and new energy efficient technologies, etc for each of the sub sector in
SMEs.
Activity 2: Capacity building of stake holders in cluster on energy efficiency
In most of the cases SME entrepreneurs are dependent on the locally available technologies,
service providers for various reasons. To address this issue BEE has also undertaken capacity
building of local service providers and entrepreneurs/ Managers of SMEs on energy efficiency
improvement in their units as well as clusters. The local service providers will be trained in
order to be able to provide the local services in setting up of energy efficiency projects in the
clusters
Activity 3: Implementation of energy efficiency measures
To implement the technology up-gradation project in the clusters, BEE has proposed to
prepare the technology based detailed project reports (DPRs) for a minimum of five
technologies in three capacities for each technology.
Activity 4: Facilitation of innovative financing mechanisms for implementation of
energy efficiency projects
The objective of this activity is to facilitate the uptake of energy efficiency measures through
innovative financing mechanisms without creating market distortion.

METHANE CAPTURE (BY ANAEROBIC TREATMENT OF EFFLUENT) TECHNOLOGY
1
1 INTRODUCTION
1.1 Brief introduction about cluster
The global objective of the BEE SME programme is to improve the energy intensity of the Indian
economy by undertaking actions in the SME sector which directly or indirectly produced 60% of
the GDP. The immediate objective of this programme is to create the awareness to accelerate
the adoption of EE technologies and practices in 29 chosen clusters in the SME sector through
knowledge sharing, capacity building and development of innovative financing mechanisms. To
build the energy efficiency awareness by funding/subsidizing need based studies in large
number units in the SMEs and giving energy conservation recommendations including
technology up-gradation opportunities.
Under “BEE-SME Programme - Gujarat Dairy”, the primary task was to carry preliminary energy
audit in 15 units & detail audit in 7 units. The aim of conducting preliminary energy audit in 15
Units is to identify the areas of high energy consumption and to carry out detailed audit and
comprehensive technology gap assessment in remaining 7 Units. Preliminary energy audit has
been carried out for, assessing the overall energy use in the unit, based on measurements such
as various monthly energy consumption rate, production rate, temperature measurement of
thermal & chilling system, illumination etc. Energy audit and Technology gap assessment study
at the plant results in identification of the following energy saving opportunities and however the
detail calculations of the identified saving measures is given in detail energy audit study.
The main form of energy used by the cluster units are grid electricity, Natural Gas, charcoal,
lignite, and diesel oil. Major consumptions of energy are in the form of Natural Gas and lignite.
Details of total energy consumption at Gujarat Dairy cluster are furnished in Table 1.1 below:
Table 1.1 Details of annual energy consumption
a) A Typical Dairy (With majority of products mix)
Energy Type Unit Monthly Average Consumption
% Contribution (MCal Basis)
% Contribution (Cost Basis)
Electricity kWh 1539108 16% 53%
NG SCM 597934 66% 25%
FO Ltrs 141855 18% 22%
b) A Typical Milk Chilling Center
Energy Type Unit Monthly Average Consumption
% Contribution (MCal Basis)
% Contribution (Cost Basis)
Electricity kWh 149056 14% 65%
FO kgs 17671 59% 35%

METHANE CAPTURE (BY ANAEROBIC TREATMENT OF EFFLUENT) TECHNOLOGY
2
Classification of Units
The Gujarat Dairy Cluster units can be broadly categorized into two types based on types of
process.
� Milk Chilling Center
� Dairy Units
Preliminary Energy Carried in 15 Nos. of units out of which 12 Nos. milk chilling centers & 03
Nos. are dairies. Detailed Energy audit carried in 7 units out which 5 Nos. of Dairies & 02 Nos. of
milk chilling center.
Products Manufactured
The various product manufactured in dairies covered under ‘Gujarat Dairy Cluster’ are as follow-
Dairies process following products from Milk while milk chilling center collects milk, weighs, chills
& dispatch to dairy.
1) Tone Milk / Tea Milk
2) Tetra Pack Milk
3) Flavored Milk / Butter Milk
4) Curd
5) Milk Cream
6) Butter
7) Ghee
8) Paneer / Cheese
9) Skimmed Milk Powder / Whole Milk Powder
10) Baby Food (Milk Powder Based)
11) Ice Cream / Indian Sweets.
In dairy industry production capacity is mainly decided by milk processed in Kgs (Ltrs) per day.
Table 1.2 Details of types of product manufactured
Details of units of cluster subjected to Preliminary Energy Audit.
S.No. Particulars of SME Dairy / Chilling Center Production Capacity in ltrs/day
1. Unit 1 Dairy 25000
2. Unit 2 Dairy 14500

METHANE CAPTURE (BY ANAEROBIC TREATMENT OF EFFLUENT) TECHNOLOGY
3
S.No. Particulars of SME Dairy / Chilling Center Production Capacity in ltrs/day
3. Unit 3 Dairy 9000
4. Unit 4 Chilling Center 30000
5. Unit 5 Chilling Center 140000
6. Unit 6 Chilling Center 165000
7. Unit 7 Chilling Center 160000
8. Unit 8 Chilling Center 160000
9. Unit 9 Chilling Center 150000
10. Unit 10 Chilling Center 140000
11. Unit 11 Chilling Center 160000
12. Unit 12 Chilling Center 36000
13. Unit 13 Chilling Center 20000
14. Unit 14 Chilling Center 20000
15. Unit 15 Chilling Center 30000
16. Unit 16 Dairy 160000
17. Unit 17 Dairy 1280000
18. Unit 18 Dairy 5000
19. Unit 19 Dairy 500000
20. Unit 20 Dairy 400000
21. Unit 21 Chilling Center 450000
22. Unit 22 Chilling Center 200000
Energy usages pattern
Electricity is mainly used for dairy cluster units apart from other fuels such as FO, PNG, Bio-
mass (wood), HSD, LDO etc. The dairy wise the pattern varies.
The details of energy uses pattern are as given below-
Name of Unit Electricity FO PNG Wood HSD LDO Other
Unit 1 ☼ ☼
Unit 2 ☼
Unit 3 ☼ ☼
Unit 4 ☼ ☼
Unit 5 ☼ ☼ ☼
Unit 6 ☼ ☼
Unit 7 ☼ ☼
Unit 8 ☼
Unit 9 ☼
Unit 10 ☼ ☼
Unit 11 ☼ ☼
Unit 12 ☼ ☼

METHANE CAPTURE (BY ANAEROBIC TREATMENT OF EFFLUENT) TECHNOLOGY
4
Name of Unit Electricity FO PNG Wood HSD LDO Other
Unit 13 ☼ ☼
Unit 14 ☼ ☼
Unit 15 ☼ ☼
Unit 16 ☼ ☼ ☼
Unit 17 ☼ ☼
Unit 18 ☼ ☼ ☼ ☼ (Castor DOC)
Unit 19 ☼ ☼ (Saw Mill Dust) ☼ (Steam from Outside)
Unit 20 ☼ ☼
Unit 21 ☼ ☼
Unit 22 ☼ ☼
General production process for Dairy cluster
The units of Gujarat Dairy cluster are basically two types i.e. Milk Chilling Centers & Dairies. The
process at milk chilling center is basically to collect the milk, segregation based on type of animal
(cow or buffalo), weighing, Quality study, milk chilling & dispatch to mother dairy.
While the process at mother dairy comprises of various products mix such as packaged milk,
curd, butter, butter milk, Ghee, Various types of milk powder etc.
Milk collection process involves Grading, Weighing (Milk is recorded in Kgs), Chilling, Dumping,
Sampling, Loading in Tanker & dispatch to main processing plant. Most of the chilling centers
are located in remote villages to collect the milk from various local ‘Mandalis’. Now a days, a new
trend of providing BMC (Bulk Milk Storage) is emerging. These give added advantages of
directly preserving milk even in small space. At few places even BMC are further divided in small
numbers & placed in various remote places.
Process Diagram for Typical Milk Chilling Center
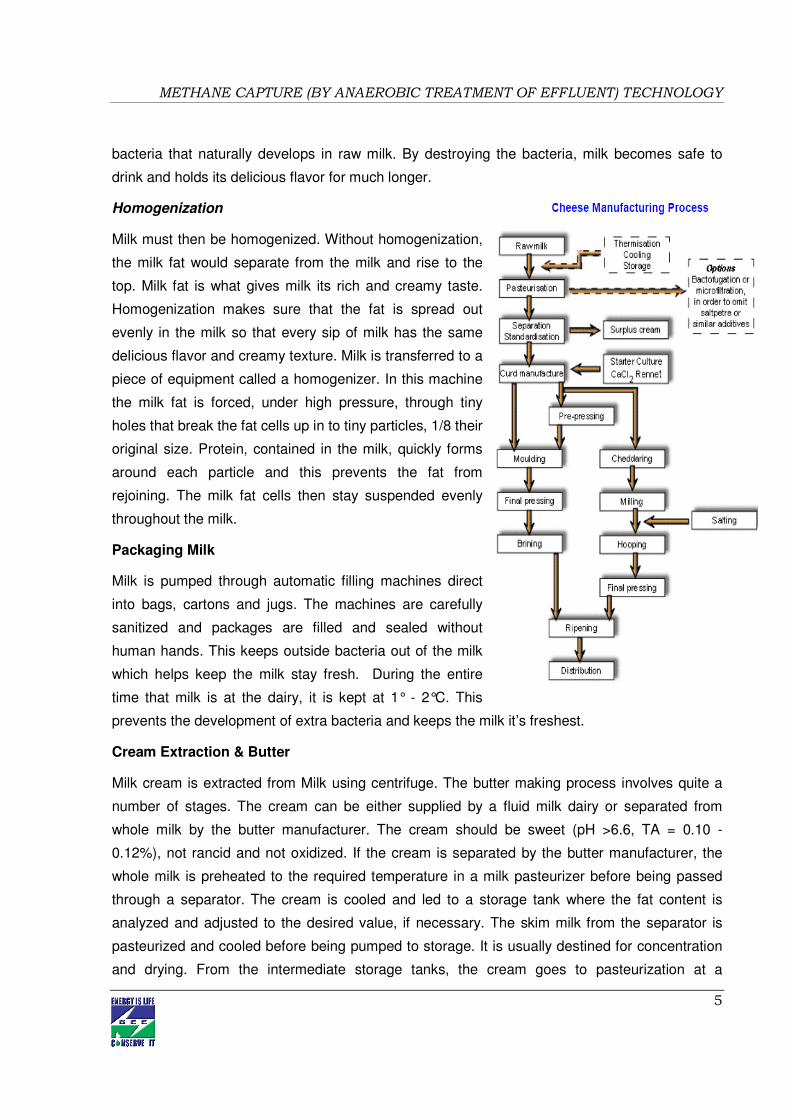
Pasteurization
Pasteurization is the process that purifies milk and helps it stay fresher, longer. Milk is
pasteurized by heating it to 72°C for 16 seconds then quickly cooling it to 4°C. Pasteurization is
named after Louis Pasteur, the famous scientist who discovered that the process destroyed
METHANE CAPTURE (BY ANAEROBIC TREATMENT OF EFFLUENT) TECHNOLOGY
5
bacteria that naturally develops in raw milk. By destroying the bacteria, milk becomes safe to
drink and holds its delicious flavor for much longer.
Homogenization
Milk must then be homogenized. Without homogenization,
the milk fat would separate from the milk and rise to the
top. Milk fat is what gives milk its rich and creamy taste.
Homogenization makes sure that the fat is spread out
evenly in the milk so that every sip of milk has the same
delicious flavor and creamy texture. Milk is transferred to a
piece of equipment called a homogenizer. In this machine
the milk fat is forced, under high pressure, through tiny
holes that break the fat cells up in to tiny particles, 1/8 their
original size. Protein, contained in the milk, quickly forms
around each particle and this prevents the fat from
rejoining. The milk fat cells then stay suspended evenly
throughout the milk.
Packaging Milk
Milk is pumped through automatic filling machines direct
into bags, cartons and jugs. The machines are carefully
sanitized and packages are filled and sealed without
human hands. This keeps outside bacteria out of the milk
which helps keep the milk stay fresh. During the entire
time that milk is at the dairy, it is kept at 1° - 2°C. This
prevents the development of extra bacteria and keeps the milk it’s freshest.
Cream Extraction & Butter
Milk cream is extracted from Milk using centrifuge. The butter making process involves quite a
number of stages. The cream can be either supplied by a fluid milk dairy or separated from
whole milk by the butter manufacturer. The cream should be sweet (pH >6.6, TA = 0.10 -
0.12%), not rancid and not oxidized. If the cream is separated by the butter manufacturer, the
whole milk is preheated to the required temperature in a milk pasteurizer before being passed
through a separator. The cream is cooled and led to a storage tank where the fat content is
analyzed and adjusted to the desired value, if necessary. The skim milk from the separator is
pasteurized and cooled before being pumped to storage. It is usually destined for concentration
and drying. From the intermediate storage tanks, the cream goes to pasteurization at a
METHANE CAPTURE (BY ANAEROBIC TREATMENT OF EFFLUENT) TECHNOLOGY
6
temperature of 95OC or more. The high temperature is needed to destroy enzymes and micro-
organisms that would impair the keeping quality of the butter.
Cheese
Cheese is an important product of fermentative lactic acid bacteria. Due to its reduced water
content, and acidic pH, bacterial growth is severely inhibited.
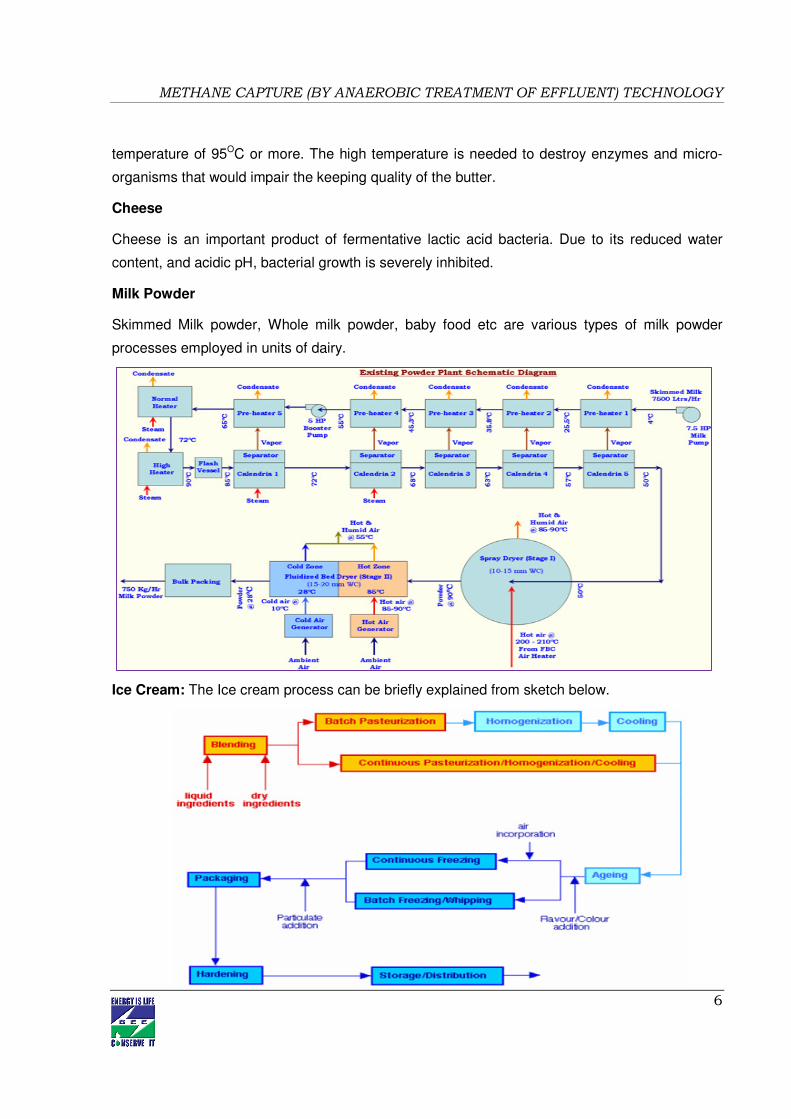
Milk Powder
Skimmed Milk powder, Whole milk powder, baby food etc are various types of milk powder
processes employed in units of dairy.
Ice Cream: The Ice cream process can be briefly explained from sketch below.

METHANE CAPTURE (BY ANAEROBIC TREATMENT OF EFFLUENT) TECHNOLOGY
7
1.2 Energy performance in existing system
1.2.1 Fuel consumption
Average fuel and electricity consumption in a typical Gujarat Dairy Cluster unit is given in Table
1.4 below:
Table 1.3 Average fuel and electricity consumption
a) On Mcal Basis
Energy Type Unit Monthly Average Consumption Monthly Consumption in MCal
Electricity kWh 1539108 1323632.9
NG SCM 597934 5381406.0
FO Ltrs 141855 1489477.5
Total MCal ----- 8194516.4
b) On Cost Basis
Energy Type Average Monthly Consumption
Electricity 9988810.92
NG 4783472
FO 4113795
Total in Rs. 18886078
1.2.2 Average annual production
Annual production in terms of liters /year is taken in case of Milk and Milk products where semi
solids and solids are in their liquid equivalent are given in the following Table 1.5 below:
1.2.3 Specific energy consumption
In dairy industry the specific energy consumption individual product wise cannot be maintained
due to wide range of production mix variation depending on market condition, season and
availability of Milk etc

METHANE CAPTURE (BY ANAEROBIC TREATMENT OF EFFLUENT) TECHNOLOGY
8
Table 1.4 Average annual production
Month Butter Ghee Paneer Khoa Masti Dahi Shrikhand Amul Kool S.M.P. W.M.P. Amulya A.S.P. White Butter
Apr-08 575978 189680 256118 1584 513452 143034 54316 173702 0 119587 1448676 0
May-08 507932 207837 249070 2194 534548 139859 112387 136202 197120 168263 1357065 0
Jun-08 364098 218436 221571 6272 428235 102749 79282 181035 156395 130695 1111404 0
Jul-08 286876 261851 140133 10430 465042 59437 20395 79653 156670 131594 872464 0
Aug-08 339197 286478 182647 25238 471037 171928 38304 179587 0 174919 1228071 0
Sep-08 491342 130691 211473 26482 476500 127843 0 188894 0 176953 1279321 0
Oct-08 417499 249239 243018 15382 565186 89376 47505 151032 0 65639 1692232 0
Nov-08 641696 242069 199052 4160 471105 89793 46766 324071 0 108567 1279682 0
Dec-08 886070 276967 265026 2004 462144 83644 10531 673321 0 123342 1180249 20500
Jan-09 850727 332264 224976 3952 461303 80787 21811 755462 0 80019 1236977 148035
Feb-09 792976 216979 230908 1238 436874 189645 4570 444278 70560 76862 1190432 48510
Mar-09 830203 242737 246304 768 619591 260349 64675 280888 0 89862 1711364 0
Apr-09 592886 232994 241562 9268 729099 159234 42346 247185 0 114262 1469411 10740
May-09 343760 202062 222580 6238 756364 193894 49075 206245 0 127661 1385012 0
Jun-09 190937 196763 259340 2430 717423 106483 59928 139687 0 81213 854819 0
Jul-09 267301 302857 57230 7104 663288 120180 10862 21075 0 15541 646280 0
Aug-09 360404 150111 142175 21386 729928 159988 16555 55147 0 92258 1024997 0
Sep-09 326550 256971 138200 15868 593518 98544 30619 100520 0 31009 999004 6150
Oct-09 503432 228263 180021 20136 620770 93232 32362 170815 0 72966 1404444 0
Nov-09 582951 243360 162538 3564 486056 44187 17453 288975 0 197931 1650920 0
Dec-09 563161 243172 213106 3126 481483 97244 45336 323287 0 81506 1576643 147630
Jan-10 941065 184012 236080 5884 459258 86421 57922 315275 0 46227 1663932 37605
Feb-10 818991 181823 197486 8352 487500 174375 57158 286889 0 108915 1458871 5220
Average 542436 229462 205244 8829 549118 124879 40007 248836 25250 105034 1292273 18452

METHANE CAPTURE (BY ANAEROBIC TREATMENT OF EFFLUENT) TECHNOLOGY
9
Electricity SEC Study in Dairy Cluster Over Past Few Years
Thermal Energy SEC Study in Dairy Cluster over Past Few Years
Figure 1.1 SEC Study in Dairy Cluster over Past Few Years
Process (Main Equipments) wise cost of energy consumption
The specific energy consumption of the typical Industry is as given in Table 1.6 below-
Table 1.5 Process wise (Main Equipment) wise cost of energy consumption
S.No. Process Name % age of Cost
1 Milk Processing 13
2 Refrigeration & Cold Storage 30
3 Packing & Allied Services 12
4 CIP Washing & Cleaning 13
5 General Utility & Services 32

METHANE CAPTURE (BY ANAEROBIC TREATMENT OF EFFLUENT) TECHNOLOGY
10
1.3 Existing technology/equipment
1.3.1 Description of existing technology
The waste generated from dairy unit is categorized as a
high organic waste with extremely high values of BOD and
COD. The wastewater generated from the unit will have
various pollutants which exert high BOD and COD load.
Presently this waste is treated using aerobic treatment to
reduce this load and bring down the BOD /COD levels
within acceptable limits for discharge outside plant.
However present system consumes lot of energy to treat
the waste water
Aerobic biological treatment methods depend on
microorganisms grown in an oxygen-rich environment to
oxidize organics to carbon dioxide, water, and cellular
material. Systems of aerobic treatment can include the
conventional activated sludge process, the rotating
biological contactors, the conventional trickling filters, etc
The highly variable nature of dairy wastewaters in terms of
volumes and flow rates (which is dependent on the factory
size and operation shifts) and in terms of pH and
suspended solid (SS) content (mainly the result of the choice of cleaning strategy employed) makes
the choice of an effective wastewater treatment regime difficult. Because dairy wastewaters are
highly biodegradable, they can be effectively treated with biological wastewater treatment systems,
but can pose a potential environmental hazard if not treated properly. Currently aerobic type of
effluent treatment plant provided with 30 kW of electricity consumption for various processes.
The volume, concentration, and composition of the effluents arising in a dairy plant are dependent on
the type of product being processed, the production program, operating methods, design of the

METHANE CAPTURE (BY ANAEROBIC TREATMENT OF EFFLUENT) TECHNOLOGY
11
processing plant, the degree of water management being applied, and subsequently the amount of
water being conserved. Dairy wastewater may be divided into three major categories:
1. Processing water (water used in the cooling and heating processes). These effluents are
normally free of pollutants and can with minimum treatment be reused or just discharged into
the storm water system.
2. Cleaning wastewaters emanate mainly from the cleaning of equipment that has been in
contact with milk or milk products, spillage of milk and milk products, whey, pressings and
brines, CIP cleaning options, and waters resulting from equipment malfunctions and even
operational errors.
3. Sanitary wastewater, which is normally piped directly to sewage works
The existing observed parameters of typical dairy can be as given below-
SN Parameter Units Raw Waste Water
1. pH - 7.0 to 8.0
2. Temperature °C Ambient
3. Suspended Solid mg/L 500
4. Oil and Fats mg/L < 10
5. COD mg/L 1500 to 5000
6. BOD mg/L 1000 to 2500
Energy charges
Table 1.6 Energy charges
Demand Charges
Table 1.7 Demand charge
S. No. Contract Demand, KVA Energy Charges, Rs/kWh
1 Upto 1000 3.85
2 From 1001 to 2500 4.05
3 Above 2500 4.15
Sr. No. Billing Demand, KVA Demand Charges, Rs/KVA
1 For first 500 98
2 For next 500 139
3 For next 1500 208
4 Billing demand in Excess of 2500 237
5 Billing Demand Excess of contract demand 369

METHANE CAPTURE (BY ANAEROBIC TREATMENT OF EFFLUENT) TECHNOLOGY
12
Therefore, total electricity Charges (including the maximum demand charges & other taxes) is Rs.
6.49 per kWh in considered case.
1.3.2 Role in process
Effluent treatment is very essential in process. The environmental law at both state and central
government level prescribes norms for effluent. The performance of effluent treatment has major
impact on the environment. The methane gas liberated in conventional aerobic treatment has
negative impact. By capturing methane the environment will be benefited enormously.
1.4 Baseline establishment for existing technology
The existing aerobic treatment of the effluent results in substantial release of methane in atmosphere
along with more electrical energy consumption. Existing aerobic effluent treatment comprises of
following main steps
a) Primary Clarifier
b) Surface aeration tank
c) Secondary Clarifier
METHANE CAPTURE (BY ANAEROBIC TREATMENT OF EFFLUENT) TECHNOLOGY
13
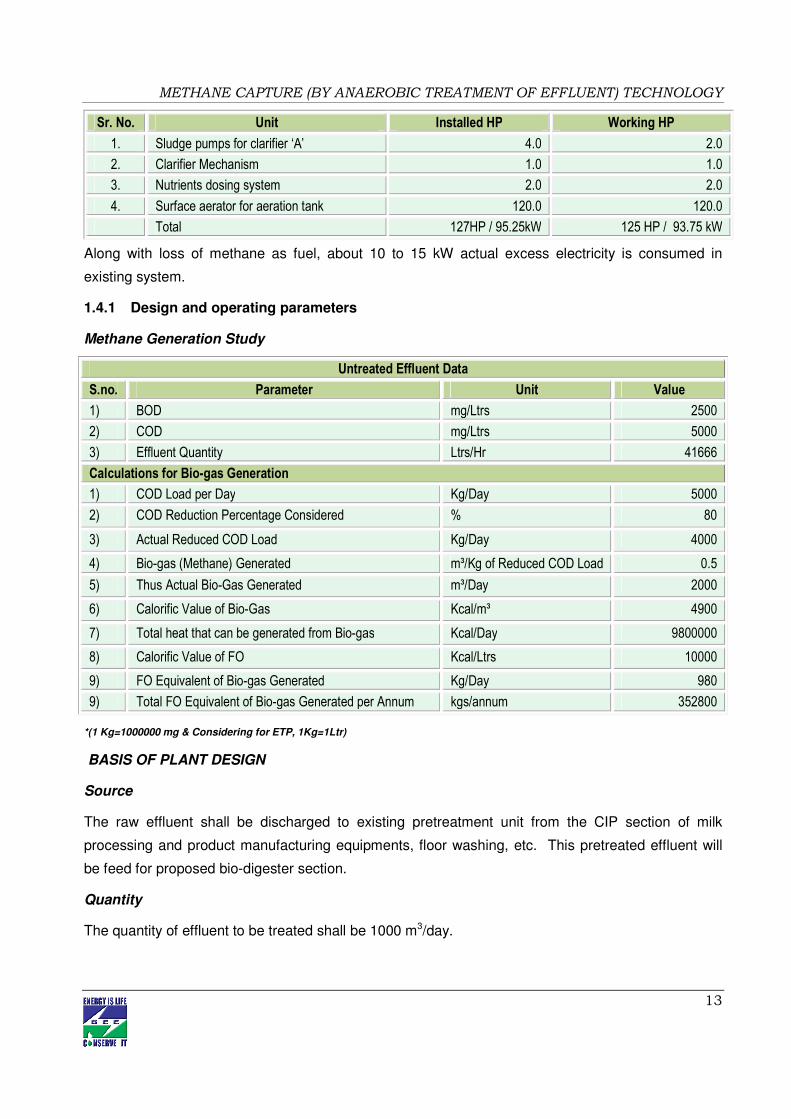
Along with loss of methane as fuel, about 10 to 15 kW actual excess electricity is consumed in
existing system.
1.4.1 Design and operating parameters
Methane Generation Study
Untreated Effluent Data
S.no. Parameter Unit Value
1) BOD mg/Ltrs 2500
2) COD mg/Ltrs 5000
3) Effluent Quantity Ltrs/Hr 41666
Calculations for Bio-gas Generation
1) COD Load per Day Kg/Day 5000
2) COD Reduction Percentage Considered % 80
3) Actual Reduced COD Load Kg/Day 4000
4) Bio-gas (Methane) Generated m³/Kg of Reduced COD Load 0.5
5) Thus Actual Bio-Gas Generated m³/Day 2000
6) Calorific Value of Bio-Gas Kcal/m³ 4900
7) Total heat that can be generated from Bio-gas Kcal/Day 9800000
8) Calorific Value of FO Kcal/Ltrs 10000
9) FO Equivalent of Bio-gas Generated Kg/Day 980
9) Total FO Equivalent of Bio-gas Generated per Annum kgs/annum 352800
*(1 Kg=1000000 mg & Considering for ETP, 1Kg=1Ltr)
BASIS OF PLANT DESIGN
Source
The raw effluent shall be discharged to existing pretreatment unit from the CIP section of milk
processing and product manufacturing equipments, floor washing, etc. This pretreated effluent will
be feed for proposed bio-digester section.
Quantity
The quantity of effluent to be treated shall be 1000 m3/day.
Sr. No. Unit Installed HP Working HP
1. Sludge pumps for clarifier ‘A’ 4.0 2.0
2. Clarifier Mechanism 1.0 1.0
3. Nutrients dosing system 2.0 2.0
4. Surface aerator for aeration tank 120.0 120.0
Total 127HP / 95.25kW 125 HP / 93.75 kW

METHANE CAPTURE (BY ANAEROBIC TREATMENT OF EFFLUENT) TECHNOLOGY
14
Capacity of the Effluent Treatment Plant (ETP)
The Bio Digester section will be designed on the basis of the following Influent characteristics
Total wastewater generation: 1000 m3/day
The effluent coming out of the proposed Bio Digester plant should confirm the following
characteristics:
Bio-gas production: 0.45 to 0.5 m3/kg of C. O. D. removed
Bio-Gas Generation : 2000 m3/day
Gas Composition:
i. Methane content : 52% to 65 %
ii. Hydrogen Sulfide : 1.5 % to 2.5 %
iii. Carbon Dioxide : 38 % to 46 %
iv. Calorific value : 4900 Kcal/Cu.mtr.
FUNDAMENTAL MICROBIOLOGY
The anaerobic treatment of organic wastes resulting in
the production of carbon dioxide and methane, involves
two distinct stages. In the first stage, complex waste components, including fats, proteins, and
polysaccharides are first hydrolyzed by a heterogeneous group of facultative and anaerobic bacteria.
These bacteria then subject the products of hydrolysis to fermentations, oxidations, and other
metabolic processes leading to the formation of simple organic compounds, mainly short-chain
(volatile) acids and alcohols. The first stage is commonly referred to as "acid fermentation". However
Sr. No. Parameter Units Raw Waste Water
1. pH - 7.0 to 8.0
2. Temperature °C Ambient
3. Suspended Solid mg/L 500
4. Oil and Fats mg/L < 10
5. COD mg/L max. 5000
6. BOD mg/L max. 2500
Sr. No. Parameter Units Treated Water
1 ph - 7.0 to 8.0
2 Temperature °C 40°C
3 Suspended Solid mg/L <100 mg/L
4 Oil and Fats mg/L <10
5 COD mg/L <1000
6 BOD mg/L <500

METHANE CAPTURE (BY ANAEROBIC TREATMENT OF EFFLUENT) TECHNOLOGY
15
in the second stage the end products of the first
stage are converted to gases (mainly methane and
carbon dioxide) by several different species of
strictly anaerobic bacteria. This stage is generally
referred to as "methane fermentation".
The primary acids produced during acid
fermentation are propionic and acetic acid. It is
reported that only one group of methane bacteria
is necessary for methane fermentation of acetic
acid, whereas propionic acid, which is fermented through acetic acid requires two different groups of
methane bacteria. The methane fermentation reactions for these two acids are:
The bacteria responsible for acid fermentation are relatively tolerant to changes in pH and
temperature and have a much higher rate of growth than the bacteria responsible for methane
fermentation. As a result, methane fermentation is generally assumed to be the rate limiting step in
anaerobic wastewater treatment.
UP-FLOW ANAEROBIC SLUDGE BLANKET REACTOR (UASB):
Wastewater from the buffer tank shall then be pumped to UASB reactor through a specially designed
distribution pipes. The multiple distributions ensures uniform distribution of flow throughout the sludge
blanket making maximum rises to the top of Anaerobic reactor along with bio-gas generated and also
some sludge particles. A unique three-phase gas – solid – liquid separator shall be provided at the
top to separate out the gas, liquid and the sludge particles. Gas will be collected in the domes
provided at the top. The liquid overflows through the gutters and suspended solids then separated
are allowed to settle down in the sludge blanket thereby retaining valuable bacterial population.
The gas will be carried through a gas line equipped with safety devices to gas holder. Gas will be
supplied to users in plant as per requirement. Excess gas will be burnt at the flare stack. The UASB
shall be constructed in RCC M-20. It shall include standard peripheral approach ladder in M.S. and
an RCC inspection platform at the top level. A standard high handrail in MS pipe shall be provided
along the outer side and sides of the platform, and along the periphery of the UASB top. Necessary
arrangement for access in to the UASB shall be included in the form of side manhole at least 600 mm
dia. CI rungs shall be provided at a suitable location in the tank for access from the manhole to the
tank bottom.
At minimum three locations, sludge outlets connected to a common sludge line for sampling/excess
sludge disposal to the sludge pit shall be provided. Pipe inserts with puddle flange shall be provided
at all effluent/sludge inlet/outlet points. The overflow from the bio-digester will be send to clarifier A
for settling of overflow solids.

METHANE CAPTURE (BY ANAEROBIC TREATMENT OF EFFLUENT) TECHNOLOGY
16
CLARIFIER A
The overflow from UASB Reactor will enter into primary Clarifier. The suspended solids settled at the
bottom of the clarifier will be sent back to buffer tank. The overflow from clarifier will be send to Pre
aeration tank.
PRE AERATION TANK:
The effluent after anaerobic treatment has dissolved gases, to expel out these dissolved gases the
aeration is carried out in pre aeration tank.
GAS HOLDER / GAS COLLECTION SYSTEM:
The biogas generated from UASB reactor is collected in the floating gasholder. A floating gas holder
type bio-gas unit consists of i) Gas Holder, ii) Inlet & outlets assembly and iii) Water removal device.
The gas holder consists of a guide rollers fitted into the brackets on the circumference of the gas
holder tank, slides inside the C channels fixed to the RCC tank wall, a cylindrical tank made of mild
steel sheet painted with epoxy coating. The gas holder tank will be kept upside down so that it
immersed in the water. It collects gas which comes out of the UASB and moves up. When the gas
outlet is opened, the gas so collected is pushed out into the pipeline by the weight of the tank itself, at
a constant pressure of 8 to 10 inches of water column. The drum then moves down this up and down
movement of the drum is guided by a guide rollers fitted into the brackets on the circumference of the
gas holder tank, slides inside the C channels fixed to the RCC tank wall.
FLARE STACK
The excess Bio-Gas can be burnt at flare stack. The flare stack shall be provided in MS pipe in pipe
arrangement with an outer protecting shell and inner gas transmission line leading to the burner. The
stack shall be provided with a suitable concrete foundation, necessary bends, specials, etc.
complete, well grouted. An approach ladder shall be provided up to the top of the stack for gas
flaring. Before installing the stack the outer surfaces of the inner and outer pipes shall be provided
with one coat of red oxide primer followed by two coats of enamel paint of approved make and shade
for weather protection.
ADVANTAGES OF BIO-DIGESTER SYSTEM
� Higher Organic Loading Rate UASB reactor can handle higher organic loading rates thus
reduces the reactor volume.
� Low Capital Cost As media is not required for carrying biomass. Thus UASB reactor is
cheaper.
� Faster Restart The system restarts within a short time even after a longer shut down.

METHANE CAPTURE (BY ANAEROBIC TREATMENT OF EFFLUENT) TECHNOLOGY
17
� More Rugged System Due to its in-built buffering capacity UASB reactor can withstand
variations in flow, pH, COD concentration etc without system going sour.
� Low Operating Cost As there is no moving part inside the system, it has lowest power
consumption i.e. only for feed and re-circulation pumps.
� Higher Digestion UASB reactor reduces initial BOD up to 80% & produces appreciable
amount of biogas.
� Easy Maintenance As there are no moving parts inside the digester, no pulsating flows, no
backwashes, and no sludge recycle, the system is easy to operate and maintain.
� CHEMICALS & NUTRIENTS Chemicals & Nutrients such as Urea, Super Phosphate is
required only during the start up and not after the plant is stabilized.
� Appearance The system is esthetically pleasing and extremely neat and clean.
� Life Cycle Cost Life cycle cost of UASB reactor is the lowest because of :
o Lowest operation & maintenance cost and
o High and consisted biogas generation compared to other anaerobic systems.
� Low Power Requirement As compared to conventional treatment processes like Activated
Sludge Process Anaerobic requires less power.
� Less Sludge Generation Because of higher solid retention time, quantity or sludge
generated in UASB process is very less. Hence, it requires less sludge drying beds area and
the capital cost of system gets reduced.
1.4.2 Operating efficiency analysis (Existing Loss Study)
� The energy consumption for aerobic effluent treatment is higher by 10 kW (Based on actual
measured kW)
� Currently as methane is not captured, the same is liberated in atmosphere.
� As the methane is not captured additional fuel is consumed in boilers and hot air generators
1.5 Barriers in adoption of proposed equipment
1.5.1 Technological barrier
In Gujarat Dairy Cluster, overall technical understanding on Dairy product manufacturing is good and
rapidly increasing. Many of the dairy engineers/managers are well informed and ready to adopt new
technology. It has been observed that at cluster level there is committed interested for leadership and
following up is quick. In general, there is readiness to adopt provided delivery, outcome and results
are demonstrated.

METHANE CAPTURE (BY ANAEROBIC TREATMENT OF EFFLUENT) TECHNOLOGY
18
The technologies need to be demonstrated within the cluster. While carrying out the audits and
presenting the Energy audit reports to the units, in the discussion with the plant owners & other
personnel, they agreed with most of the identified energy saving measures and technologies.
There appears to be no technological barrier. While carrying out the audits and presenting the
Energy audit reports to the units, it was found that significant energy can be saved by provision of
energy efficient electric motor. And hence there is a need for a better technology for efficient energy
management.
1.5.2 Financial barrier
Availing finance is not the major issue. Among the SMEs, the larger units, if convinced are capable of
either financing it themselves or get the finance from their banks. The smaller units will require
competitive loan and other support to raise the loan. However as most of them have been able to
expand their setup and grow, there is readiness to spend for energy efficiency technologies which
have good returns. Energy Efficiency Financing Schemes such as SIDBI’s, if focused on the cluster,
will play a catalytic role in implementation of identified energy conservation projects & technologies.
The cluster has significant potential of technological up gradation. However though there are good
returns, this project is highly capital intensive and requires support of policy as well as innovative
financial mechanisms. CDM needs to be duly applied to generate additional cash flow to further
improve the returns from the project.
1.5.3 Skilled manpower
In Gujarat Dairy cluster, the availability of skilled manpower is one of the problems due to more
number of units. Local technical persons available at individual location take care of maintenance or
repair works of major equipments. Maintenance or repair work of major equipments of Dairy units like
ammonia compressors, hot air generators for spray dryers etc, are generally taken care by the
equipment suppliers itself as they station one of their experienced technical representatives at
Ahmadabad for the maintenance work.
Specialized and focused training of the local service providers on better operation and maintenance
of the equipments, importance of the energy and its use and energy conservation measures will
improve awareness among the unit owners and workforce. Original equipment suppliers should also
participate in these programs.
1.5.4 Other barrier (If any)
No other barrier is seen. It appears that apart from high initial cost of energy efficient electric motor,
there is no other barrier.

METHANE CAPTURE (BY ANAEROBIC TREATMENT OF EFFLUENT) TECHNOLOGY
19
2. PROPOSED EQUIPMENT FOR ENERGY EFFICENCY IMPROVEMENT
2.1 Description of proposed equipment
A. Power requirement
B. Manpower required
C. Chemical and Nutrients
Following chemicals shall be required during commissioning and steady state operation of the plant.
Exact qty will be determined during the commissioning of ETP.
� Urea
� DAP
� Lime – as per process requirement
� Sodium Bi Carbonate
� For anaerobic treatment, Anaerobic sludge/cow dung will be required around 50,000 liters at
the start of commissioning.
2.1.1 Detailed of proposed equipment
Basic Treatment Units
The wastewater treatment system on the basis of the above parameters to be provided in four stages
Pre-Treatment (Existing)
� Screening
� Oil and Fat removal
Sr. No. Unit Installed HP Working HP
1 Feed Pumps for UASB 10 7
2 Sludge pumps for clarifier ‘A’ 4.0 2.0
3 Clarifier Mechanism 1.0 1.0
4 Blowers for pre aeration tank 10.0 5.0
5 Bio-Gas Blowers 6.0 3.0
6 Feed pump for aeration 10.0 5
7 Nutrients dosing system 2.0 2.0
8 Total 43HP / 32.06 kW 25 HP / 18.64kW
Skills No. of Persons
Plant In- charge / Chemist 1 person
Operators 1 Person / shift
Helper 2 person / shift

METHANE CAPTURE (BY ANAEROBIC TREATMENT OF EFFLUENT) TECHNOLOGY
20
� Equalization
� Primary clarifier
� Buffer tank (new)
Secondary Treatment: Biological treatment to remove BOD and COD & to decompose organic
matter.
� First stage Anaerobic Treatment consisting of following treatment unit (New)
o UASB (Up flow Anaerobic Sludge Blanket Reactor)
o Clarifier A
o Pre-aeration
� Second Stage Aerobic Treatment consisting of following treatment units(Existing )
o Extended aeration system.
o Secondary Clarification
� Polishing Treatment (Existing)
o Treated water / Chlorine contact tank
o Pressure Sand Filter
� Sludge Management & Disposal (Existing)
Sludge disposal – to separate the sludge from the thick slurry
� Drying bed
OPERATIONAL PROCESSES
BUFFER TANK: The treated water from pretreatment system after existing primary clarifier enters
into buffer tank. In buffer tank Urea and DAP will be added as nutrients. The tank is also acts as
sump for the feed to UASB.
ANAEROBIC TREATMENT The anaerobic waste treatment process is an effective method for the
treatment of many organic wastes. The treatment has a number of advantages over aerobic
treatment process, namely,
� The energy input of the system is low as no energy is required for oxygenation,
� Lower production of excess sludge( biological synthesis) per unit mass of substrate utilized,
� Lower nutrient requirement due to lower biological synthesis, and
� Degradation leads to production of biogas which is a valuable source of energy.

METHANE CAPTURE (BY ANAEROBIC TREATMENT OF EFFLUENT) TECHNOLOGY
21

METHANE CAPTURE (BY ANAEROBIC TREATMENT OF EFFLUENT) TECHNOLOGY
22
2.1.2 Equipment/technology specification
FLOW CHART FOR BIODIGESTOR SYSTEM
P & Id for Biodigestor System
2.1.3 Integration with existing equipment
It is proposed that initially the anaerobic digestion system will be installed in parallel to existing
system & once the system is ready it will connected to existing aerobic system. No problems are
foreseen for integration with existing system.
2.1.4 Superiority over existing system
The proposed anaerobic effluent treatment system for methane capture is more energy efficient than
existing one and are technologically superior. Use of this technology reduces the overall plant
energy cost. It also reduces the dependency for electricity on the state electricity grid. The proposed
measure bears better technology than the existing one, which results both energy saving &
technological up gradation.
The following are the reasons for selection of this technology
� The proposed system is compact and saves space.
� It will reduce the total operating energy cost of the plant.
METHANE CAPTURE (BY ANAEROBIC TREATMENT OF EFFLUENT) TECHNOLOGY
23
� It reduces the GHG emissions
� This project is also applicable for getting the carbon credit benefits.
� It is a clean technology.
2.1.5 Source of equipment
Methane capture systems are running successfully and the unit owners had observed the savings in
terms of energy. The proposed equipments are available within India. All LSP identified are Indian
firms.
2.1.6 Availability of technology/equipment
Suppliers of this technology are available at local level as well as at international level very easily.
Even most of the suppliers took initiative and interacting with the dairy unit owners for creating the
awareness of use of this technology.
2.1.7 Service providers
Details of technology service providers are shown in Annexure 7.
2.1.8 Terms and conditions in sales of equipment
The suppliers have already extended standard warrantee conditions for exchange, replace or repair
against manufacturing defects for a period of 12 months after the date of commissioning. Promoters
will have to promptly notify the supplier in writing of obvious defects or deficiencies after detection
thereof. Replaced parts shall become the property of the supplier upon request of the supplier.
Supplier is not liable or defects or deficiencies which are resulting from the following reasons, as long
as they are not resulting from a default of Supplier: Improper, unsuitable or negligent use, handling
and/or operation of the system by promoters or by third parties; use of spare parts other than
Genuine Parts; normal wear and tear; use of unsuitable consumables (such as, fuel, oil cooling liquid
or any other consumables), particularly the use of consumables not conciliated in the operation
manuals; improper building ground; chemical, electro- chemical or electric influences.
All conditions associated with this system are standard in nature. No special clause is incorporated.
The conditions are very common in most of the plant & machinery sales.
2.1.9 Process down time
Process down time of Units of about 14 days will be required for the integration with the existing
system.
2.2 Life cycle assessment and risks analysis
Life of the equipment is about 15 years. Risk involves in the installation of proposed project are as
follows:

METHANE CAPTURE (BY ANAEROBIC TREATMENT OF EFFLUENT) TECHNOLOGY
24
� Risk involved in delay in implementation of the proposed project is due to the high initial
investment cost.
2.3 Suitable unit for implementation of proposed technology
The measure & technology is suitable for 2 dairy units under the Gujarat Dairy Cluster & similar units
outside cluster. This measure in fact will result in technological up gradation in vital energy
consuming area of these units. Majority of the dairies & Milk chilling centers (22 numbers in cluster)
are suitable for implementation of at least anaerobic treatment of effluent instead of aerobic treatment
of effluent.

METHANE CAPTURE (BY ANAEROBIC TREATMENT OF EFFLUENT) TECHNOLOGY
25
3. ECONOMIC BENEFITS FROM PROPOSED TECHNOLOGY
3.1 TECHNICAL BENEFIT
3.1.1 Fuel saving
FO or equivalent fuel as mentioned in cost benefit analysis will be saved due to usage of captured
methane. Also due to downgrading of aerobic treatment, some electricity as mentioned in cost
benefit analysis will be saved. Total FO saving would be 352800 liter per annum.
3.1.2 Electricity saving
It is estimated that this system will save 54000 kWh per annum (4.64 KLOE per Annum) for the unit.
3.1.3 Improvement in product quality
The measure does not have any impact on quality of product directly or indirectly.
3.1.4 Increase in production
Production will be the same as in present.
3.1.5 Reduction in raw material
Raw material consumption is same even after the implementation of proposed technology.
3.1.6 Reduction in other losses
No impact on other losses directly or indirectly.
3.2 Monetary benefits
Implementation of project will result in good, consistent monetary benefit (105.82 Lacs). It is
estimated that this system will save on an average 54000 kWh/Annum will be saved for the unit
Please refer following table.
Table 3.1 Energy and monetary benefit (For One Typical Unit of Gujarat Dairy Cluster)
Energy and monetary benefit
S. No. Parameters Unit Value
1) Bio-gas (Methane) Generated m³/Kg of Reduced COD Load 0.5
2) Thus Actual Bio-Gas Generated m³/Day 2000
3) Calorific Value of Bio-Gas Kcal/m³ 4900
4) Total heat that can be generated from Bio-gas Kcal/Day 9800000
5) Calorific Value of FO Kcal/Ltrs 10000
6) FO Equivalent of Bio-gas Generated Ltrs/Day 980
7) Total FO Equivalent of Bio-gas Generated per Annum Ltrs/annum 352800
8) Cost of FO Rs./Ltrs 29

METHANE CAPTURE (BY ANAEROBIC TREATMENT OF EFFLUENT) TECHNOLOGY
26
9) Saving from Bio-gas Generation Rs./Day 28420
10) Additional Saving of Electricity By anaerobic treatment instead of Aerobics Treatment
kWh/annum 54000
11) Cost of electricity Rs./ kWh 6.49
12) Total Saving in Rupees per annum due to anaerobic treatment per annum
Rs./Annum 350460
13) No. of Working Days/Annum Days 360
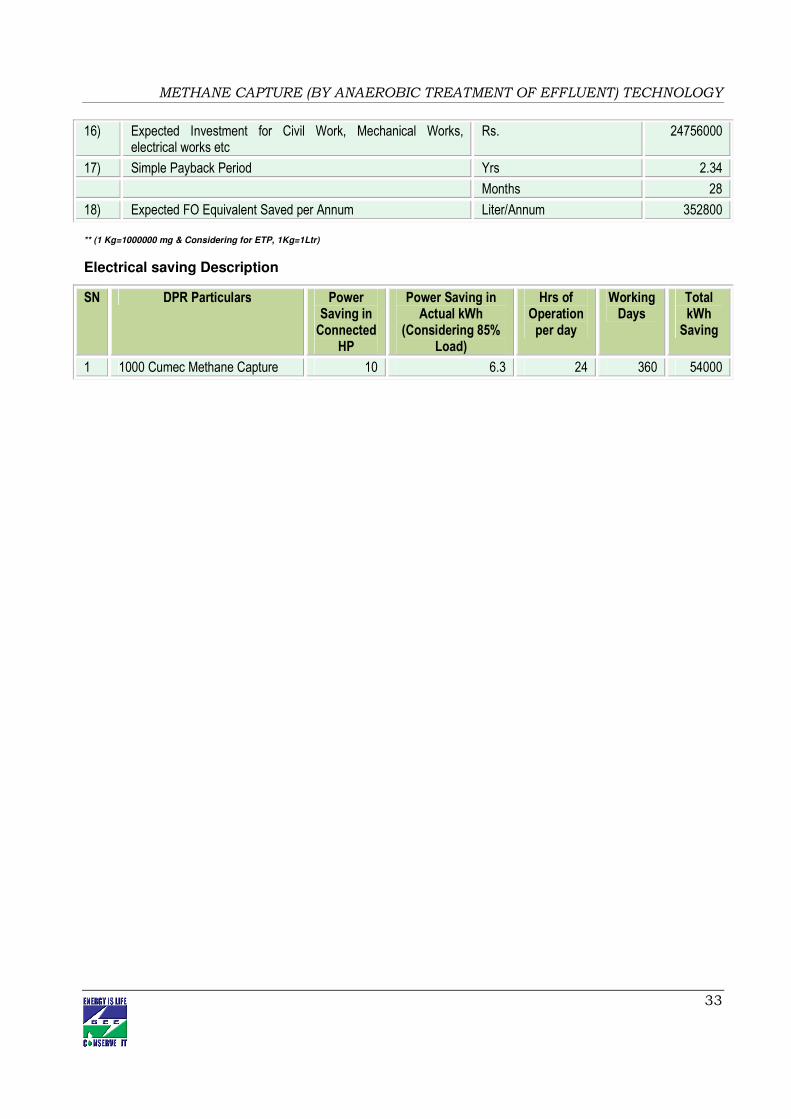
14) Total Expected Saving per Annum Rs./Annum 10581660
15) Expected KLOE Saving Per Annum KLEO/Annum 2025
16) Expected Investment for Civil Work, Mechanical Works, electrical works etc
Rs. 24756000
17) Simple Payback Period Yrs 2.34
Months 28
18) Expected FO Equivalent Saved per Annum Liter/Annum 352800
**Further details of total monetary benefit are given in Annexure 3.
3.3 SOCIAL BENEFITS
3.3.1 Improvement in working environment
Use of energy efficient electric motor technology in Dairy Industry reduces the energy consumption.
3.3.2 Improvement in workers skill
Technical skills of persons will definitely be improved. As the training will be provided by equipment
suppliers which improve the technical skills of manpower required for operating of the equipment and
also the technology implementation will create awareness among the workforce about energy
efficiency and energy saving.
3.4 ENVIRONMENTAL BENEFITS
3.4.1 Reduction in effluent generation
There is no impact in effluent generation due to implementation of the project.
3.4.2 Reduction in GHG emission
Implementation of this technology will reduce the CO2 emissions. Reduction in CO2 emissions will be
possible due to Energy saving. This project will be able to reduce 3535 tonnes of carbon produced
annually (46 tonnes on electricity saving in the process and 3490 tonnes reduction of consumption of
fuel and amount of bio gas produced).
3.4.3 Reduction in other emissions like SOX
Amount of SOX will be reducing due to improved efficiency of the power plants due to better plant
load factor.
METHANE CAPTURE (BY ANAEROBIC TREATMENT OF EFFLUENT) TECHNOLOGY
27
4 INSTALLATION OF PROPOSED EQUIPMENT
4.1 COST OF PROJECT
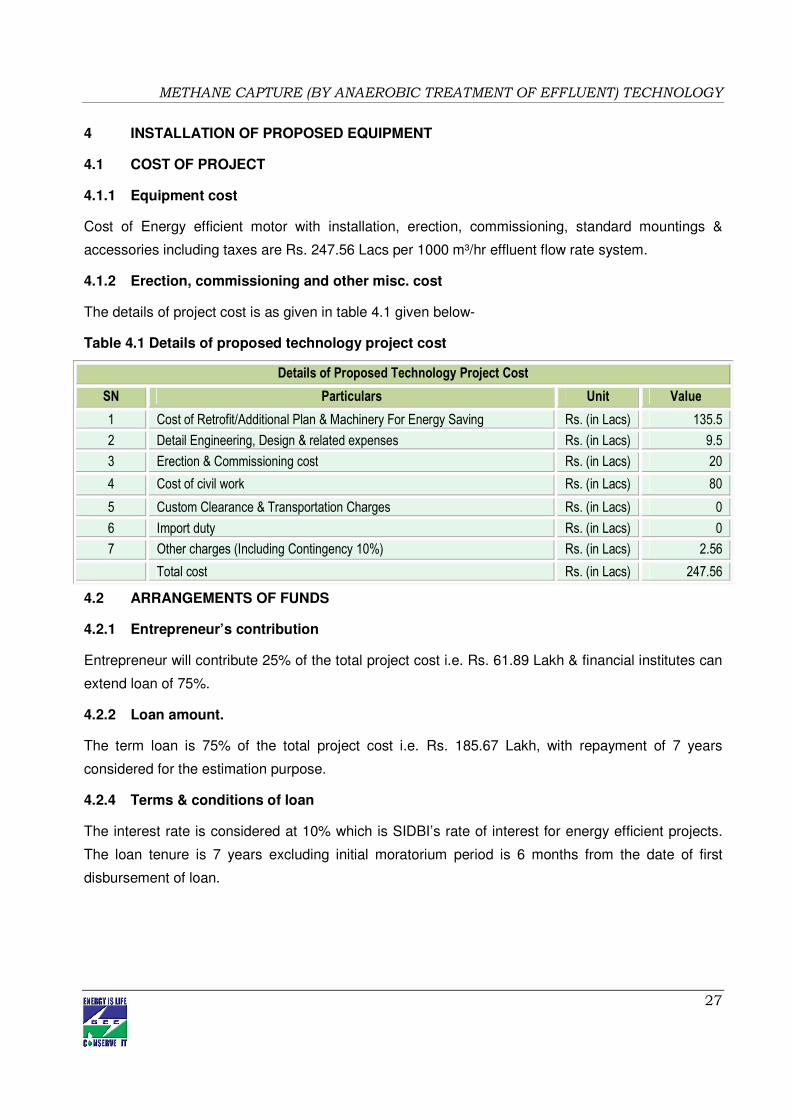
4.1.1 Equipment cost
Cost of Energy efficient motor with installation, erection, commissioning, standard mountings &
accessories including taxes are Rs. 247.56 Lacs per 1000 m³/hr effluent flow rate system.
4.1.2 Erection, commissioning and other misc. cost
The details of project cost is as given in table 4.1 given below-
Table 4.1 Details of proposed technology project cost
Details of Proposed Technology Project Cost
SN Particulars Unit Value
1 Cost of Retrofit/Additional Plan & Machinery For Energy Saving Rs. (in Lacs) 135.5
2 Detail Engineering, Design & related expenses Rs. (in Lacs) 9.5
3 Erection & Commissioning cost Rs. (in Lacs) 20
4 Cost of civil work Rs. (in Lacs) 80
5 Custom Clearance & Transportation Charges Rs. (in Lacs) 0
6 Import duty Rs. (in Lacs) 0
7 Other charges (Including Contingency 10%) Rs. (in Lacs) 2.56
Total cost Rs. (in Lacs) 247.56
4.2 ARRANGEMENTS OF FUNDS
4.2.1 Entrepreneur’s contribution
Entrepreneur will contribute 25% of the total project cost i.e. Rs. 61.89 Lakh & financial institutes can
extend loan of 75%.
4.2.2 Loan amount.
The term loan is 75% of the total project cost i.e. Rs. 185.67 Lakh, with repayment of 7 years
considered for the estimation purpose.
4.2.4 Terms & conditions of loan
The interest rate is considered at 10% which is SIDBI’s rate of interest for energy efficient projects.
The loan tenure is 7 years excluding initial moratorium period is 6 months from the date of first
disbursement of loan.

METHANE CAPTURE (BY ANAEROBIC TREATMENT OF EFFLUENT) TECHNOLOGY
28
4.3 FINANCIAL INDICATORS
4.3.1 Cash flow analysis
Profitability and cash flow statements have been worked out for a period of 10 years. The financials
have been worked out on the basis of certain reasonable assumptions, which are outlined below.
The project is expected to achieve monetary savings of Rs. 105.82 lacs.
� The Operation and Maintenance cost is estimated at 2% of cost of total project with 5%
increase in every year as escalations.
� Interest on term loan is estimated at 10%.
� Depreciation is provided as per the rates provided in the companies act.
Considering the above mentioned assumptions, the net cash accruals starting with Rs. 70.33 lakh in
the first year operation and to Rs. 455.78 lakh at the end of tenth year.
.4.3.2 Simple payback period
The estimated payback period is about 2.34 years or about 28 months.
4.3.3 Net Present Value (NPV)
The Net present value of the investment at 10% works out to be Rs. 214.90 lakh.
4.3.4 Internal rate of return (IRR)
The after tax IRR of the project works out to be 29.98%. Thus the project is financially viable for both
types of fuels.
4.3.5 Return on investment (ROI)
The average return on investment of the project activity works out at 22.43%. Financial indicator of
proposed technology is furnished in Table 4.2 below:
Table 4.2 Financial indicators of proposed technology/equipment
SN Scenario IRR NPV ROI DSCR
1 Normal 29.98% 214.90 22.43 2.20
4.4 SENSITIVITY ANALYSIS
A sensitivity analysis has been carried out to ascertain how the project financials would behave in
different situations like when there is an increase in fuel savings or decrease in fuel savings. For the
purpose of sensitive analysis, two following scenarios has been considered
� Optimistic scenario (Increase in energy savings by 5%)
� Pessimistic scenario (Decrease in energy savings by 5%)

METHANE CAPTURE (BY ANAEROBIC TREATMENT OF EFFLUENT) TECHNOLOGY
29
In each scenario, other inputs are assumed as a constant. The financial indicators in each of the
above situation are indicated along with standard indicators.
Details of sensitivity analysis at different scenarios are shown in Table 4.3 below:
Table 4.3 Sensitivity analysis at different scenarios
Sr. No. Scenario IRR NPV ROI DSCR
1 Normal 29.98% 214.90 22.43 2.20
2 5% Increase in Fuel Saving 31.97% 237.99 22.59 2.31
3 5% Decrease in Fuel Saving 27.97% 191.80 22.25 2.09
4.5 PROCUREMENT AND IMPLEMENTATION SCHEDULE
Procurement and implementation schedule for proposed project is of 18 weeks out of which 16
weeks are for placement of orders and delivery shown in Table 4.4 below and further details of
process break down are shown in Annexure 6.
Table 4.4 Procurement and implementation schedule
SN
Activities
Weeks
1 - 16 17 18
1 Order Placement
2 Delivery
3 Foundation & civil work
4 Pipeline Modification
5 Cabling & electrical panel fitting
6 Testing and trial
7 On site operator training

METHANE CAPTURE (BY ANAEROBIC TREATMENT OF EFFLUENT) TECHNOLOGY
30
Annexure
Annexure -1: Energy audit data used for baseline establishment
Sr. No. Unit Installed HP Working HP
1. Sludge pumps for clarifier ‘A’ 4.0 2.0
2. Clarifier Mechanism 1.0 1.0
3. Nutrients dosing system 2.0 2.0
4. Surface aerator for aeration tank 120.0 120.0
Total 127HP / 95.25 kW 125 HP / 93.75 kW
Along with loss of methane as fuel, about 10 to 15 kW actual excess electricity is consumed in
existing system.

METHANE CAPTURE (BY ANAEROBIC TREATMENT OF EFFLUENT) TECHNOLOGY
31
Annexure -2: Process flow diagram after project implementation
There is no change in process flow diagram after implementation of methane capture project.The
process flow will not change. The only change will be the ammonia compressor will be provided with
Energy Efficient Electric Motor.
METHANE CAPTURE (BY ANAEROBIC TREATMENT OF EFFLUENT) TECHNOLOGY
32
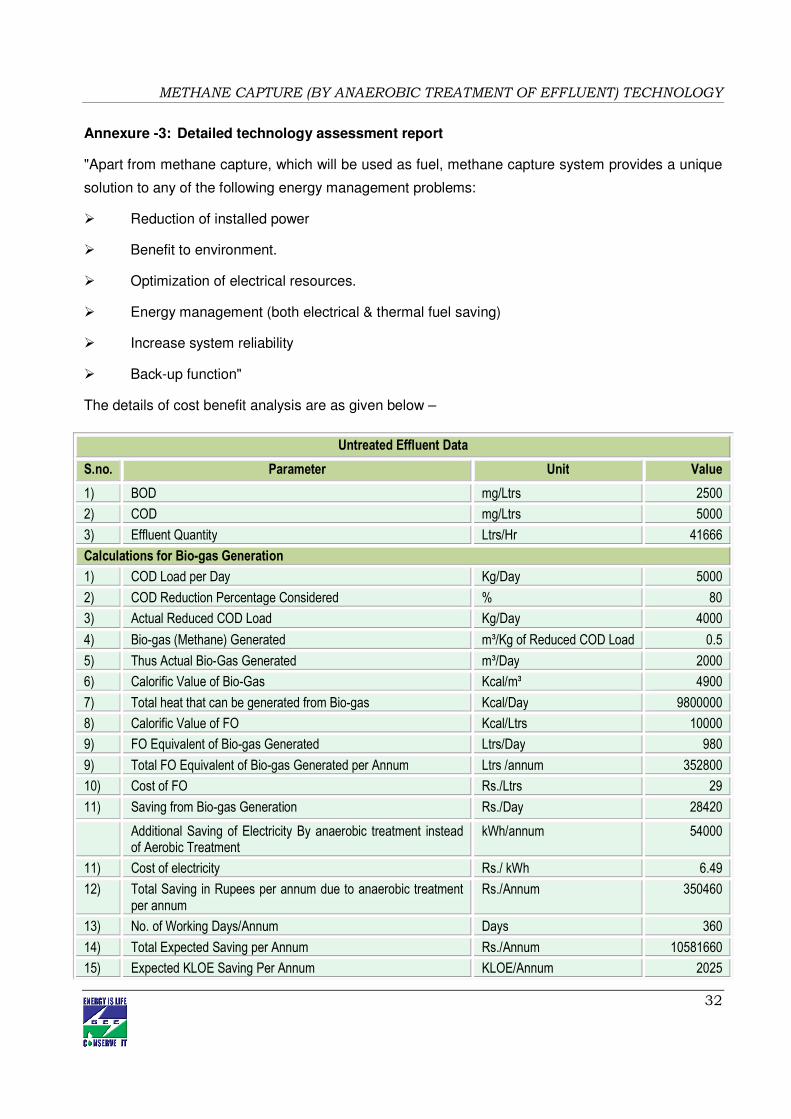
Annexure -3: Detailed technology assessment report
"Apart from methane capture, which will be used as fuel, methane capture system provides a unique
solution to any of the following energy management problems:
� Reduction of installed power
� Benefit to environment.
� Optimization of electrical resources.
� Energy management (both electrical & thermal fuel saving)
� Increase system reliability
� Back-up function"
The details of cost benefit analysis are as given below –
Untreated Effluent Data
S.no. Parameter Unit Value
1) BOD mg/Ltrs 2500
2) COD mg/Ltrs 5000
3) Effluent Quantity Ltrs/Hr 41666
Calculations for Bio-gas Generation
1) COD Load per Day Kg/Day 5000
2) COD Reduction Percentage Considered % 80
3) Actual Reduced COD Load Kg/Day 4000
4) Bio-gas (Methane) Generated m³/Kg of Reduced COD Load 0.5
5) Thus Actual Bio-Gas Generated m³/Day 2000
6) Calorific Value of Bio-Gas Kcal/m³ 4900
7) Total heat that can be generated from Bio-gas Kcal/Day 9800000
8) Calorific Value of FO Kcal/Ltrs 10000
9) FO Equivalent of Bio-gas Generated Ltrs/Day 980
9) Total FO Equivalent of Bio-gas Generated per Annum Ltrs /annum 352800
10) Cost of FO Rs./Ltrs 29
11) Saving from Bio-gas Generation Rs./Day 28420
Additional Saving of Electricity By anaerobic treatment instead of Aerobic Treatment
kWh/annum 54000
11) Cost of electricity Rs./ kWh 6.49
12) Total Saving in Rupees per annum due to anaerobic treatment per annum
Rs./Annum 350460
13) No. of Working Days/Annum Days 360
14) Total Expected Saving per Annum Rs./Annum 10581660
15) Expected KLOE Saving Per Annum KLOE/Annum 2025
METHANE CAPTURE (BY ANAEROBIC TREATMENT OF EFFLUENT) TECHNOLOGY
33
** (1 Kg=1000000 mg & Considering for ETP, 1Kg=1Ltr)
Electrical saving Description
SN DPR Particulars Power Saving in Connected
HP
Power Saving in Actual kWh
(Considering 85% Load)
Hrs of Operation per day
Working Days
Total kWh Saving
1 1000 Cumec Methane Capture 10 6.3 24 360 54000
16) Expected Investment for Civil Work, Mechanical Works, electrical works etc
Rs. 24756000
17) Simple Payback Period Yrs 2.34
Months 28
18) Expected FO Equivalent Saved per Annum Liter/Annum 352800

METHANE CAPTURE (BY ANAEROBIC TREATMENT OF EFFLUENT) TECHNOLOGY
34
Annexure -4 Drawings for proposed electrical & civil works
No additional electrical system will be required. Even electrical load as mentioned above will be
reduced so there will be no change in electrical diagram. The drawing of civil work has been provided
as per the scheme.
METHANE CAPTURE (BY ANAEROBIC TREATMENT OF EFFLUENT) TECHNOLOGY
35
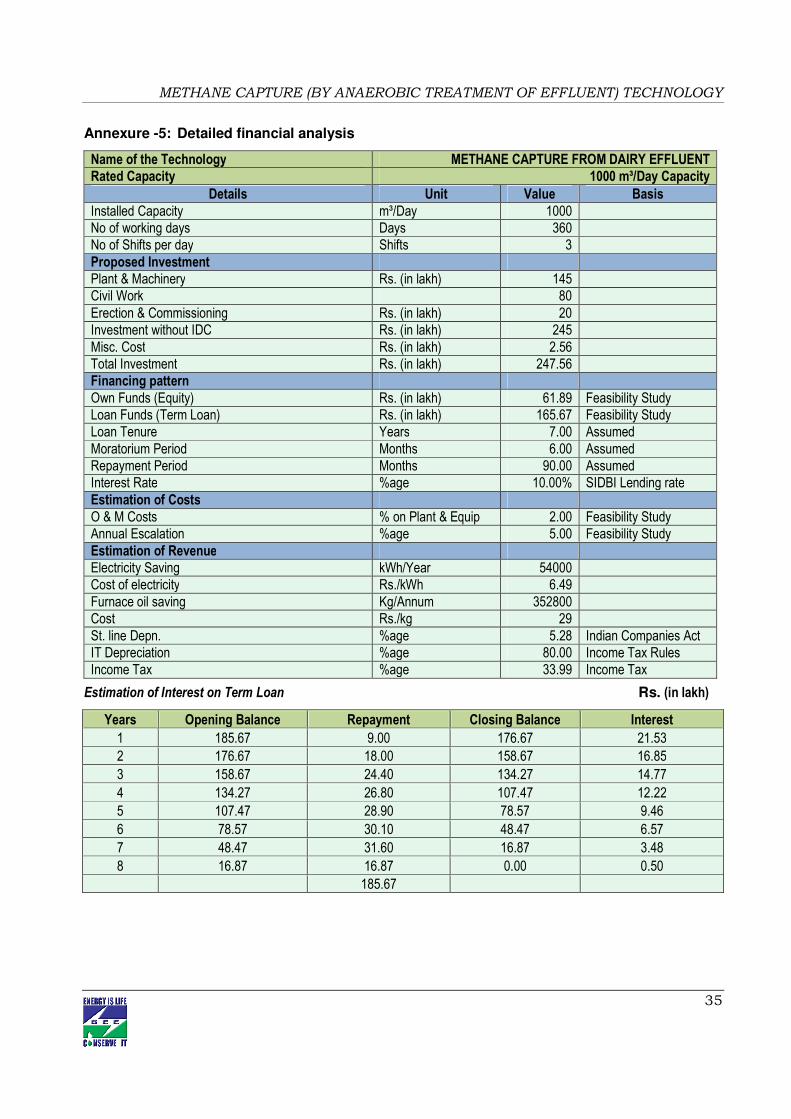
Annexure -5: Detailed financial analysis
Name of the Technology METHANE CAPTURE FROM DAIRY EFFLUENT
Rated Capacity 1000 m³/Day Capacity
Details Unit Value Basis
Installed Capacity m³/Day 1000 No of working days Days 360 No of Shifts per day Shifts 3 Proposed Investment Plant & Machinery Rs. (in lakh) 145 Civil Work 80 Erection & Commissioning Rs. (in lakh) 20 Investment without IDC Rs. (in lakh) 245 Misc. Cost Rs. (in lakh) 2.56 Total Investment Rs. (in lakh) 247.56 Financing pattern Own Funds (Equity) Rs. (in lakh) 61.89 Feasibility Study Loan Funds (Term Loan) Rs. (in lakh) 165.67 Feasibility Study Loan Tenure Years 7.00 Assumed Moratorium Period Months 6.00 Assumed Repayment Period Months 90.00 Assumed Interest Rate %age 10.00% SIDBI Lending rate Estimation of Costs O & M Costs % on Plant & Equip 2.00 Feasibility Study Annual Escalation %age 5.00 Feasibility Study Estimation of Revenue Electricity Saving kWh/Year 54000 Cost of electricity Rs./kWh 6.49 Furnace oil saving Kg/Annum 352800 Cost Rs./kg 29 St. line Depn. %age 5.28 Indian Companies Act IT Depreciation %age 80.00 Income Tax Rules Income Tax %age 33.99 Income Tax
Estimation of Interest on Term Loan Rs. (in lakh)
Years Opening Balance Repayment Closing Balance Interest
1 185.67 9.00 176.67 21.53
2 176.67 18.00 158.67 16.85
3 158.67 24.40 134.27 14.77
4 134.27 26.80 107.47 12.22
5 107.47 28.90 78.57 9.46
6 78.57 30.10 48.47 6.57
7 48.47 31.60 16.87 3.48
8 16.87 16.87 0.00 0.50
185.67
METHANE CAPTURE (BY ANAEROBIC TREATMENT OF EFFLUENT) TECHNOLOGY
36
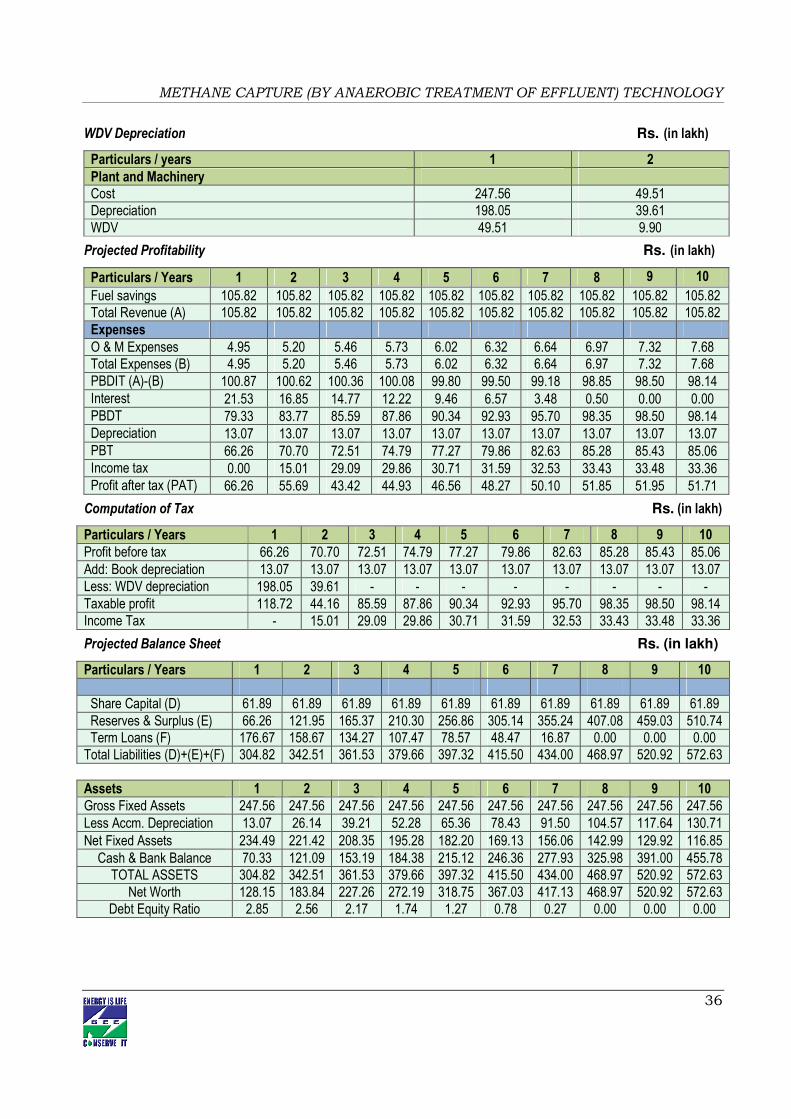
WDV Depreciation Rs. (in lakh)
Particulars / years 1 2
Plant and Machinery Cost 247.56 49.51 Depreciation 198.05 39.61 WDV 49.51 9.90
Projected Profitability Rs. (in lakh)
Particulars / Years 1 2 3 4 5 6 7 8 9 10
Fuel savings 105.82 105.82 105.82 105.82 105.82 105.82 105.82 105.82 105.82 105.82 Total Revenue (A) 105.82 105.82 105.82 105.82 105.82 105.82 105.82 105.82 105.82 105.82 Expenses O & M Expenses 4.95 5.20 5.46 5.73 6.02 6.32 6.64 6.97 7.32 7.68 Total Expenses (B) 4.95 5.20 5.46 5.73 6.02 6.32 6.64 6.97 7.32 7.68 PBDIT (A)-(B) 100.87 100.62 100.36 100.08 99.80 99.50 99.18 98.85 98.50 98.14 Interest 21.53 16.85 14.77 12.22 9.46 6.57 3.48 0.50 0.00 0.00 PBDT 79.33 83.77 85.59 87.86 90.34 92.93 95.70 98.35 98.50 98.14 Depreciation 13.07 13.07 13.07 13.07 13.07 13.07 13.07 13.07 13.07 13.07 PBT 66.26 70.70 72.51 74.79 77.27 79.86 82.63 85.28 85.43 85.06 Income tax 0.00 15.01 29.09 29.86 30.71 31.59 32.53 33.43 33.48 33.36 Profit after tax (PAT) 66.26 55.69 43.42 44.93 46.56 48.27 50.10 51.85 51.95 51.71
Computation of Tax Rs. (in lakh)
Particulars / Years 1 2 3 4 5 6 7 8 9 10
Profit before tax 66.26 70.70 72.51 74.79 77.27 79.86 82.63 85.28 85.43 85.06 Add: Book depreciation 13.07 13.07 13.07 13.07 13.07 13.07 13.07 13.07 13.07 13.07 Less: WDV depreciation 198.05 39.61 - - - - - - - - Taxable profit 118.72 44.16 85.59 87.86 90.34 92.93 95.70 98.35 98.50 98.14 Income Tax - 15.01 29.09 29.86 30.71 31.59 32.53 33.43 33.48 33.36
Projected Balance Sheet Rs. (in lakh)
Particulars / Years 1 2 3 4 5 6 7 8 9 10
Share Capital (D) 61.89 61.89 61.89 61.89 61.89 61.89 61.89 61.89 61.89 61.89 Reserves & Surplus (E) 66.26 121.95 165.37 210.30 256.86 305.14 355.24 407.08 459.03 510.74 Term Loans (F) 176.67 158.67 134.27 107.47 78.57 48.47 16.87 0.00 0.00 0.00 Total Liabilities (D)+(E)+(F) 304.82 342.51 361.53 379.66 397.32 415.50 434.00 468.97 520.92 572.63
Assets 1 2 3 4 5 6 7 8 9 10
Gross Fixed Assets 247.56 247.56 247.56 247.56 247.56 247.56 247.56 247.56 247.56 247.56 Less Accm. Depreciation 13.07 26.14 39.21 52.28 65.36 78.43 91.50 104.57 117.64 130.71 Net Fixed Assets 234.49 221.42 208.35 195.28 182.20 169.13 156.06 142.99 129.92 116.85 Cash & Bank Balance 70.33 121.09 153.19 184.38 215.12 246.36 277.93 325.98 391.00 455.78 TOTAL ASSETS 304.82 342.51 361.53 379.66 397.32 415.50 434.00 468.97 520.92 572.63
Net Worth 128.15 183.84 227.26 272.19 318.75 367.03 417.13 468.97 520.92 572.63 Debt Equity Ratio 2.85 2.56 2.17 1.74 1.27 0.78 0.27 0.00 0.00 0.00
METHANE CAPTURE (BY ANAEROBIC TREATMENT OF EFFLUENT) TECHNOLOGY
37
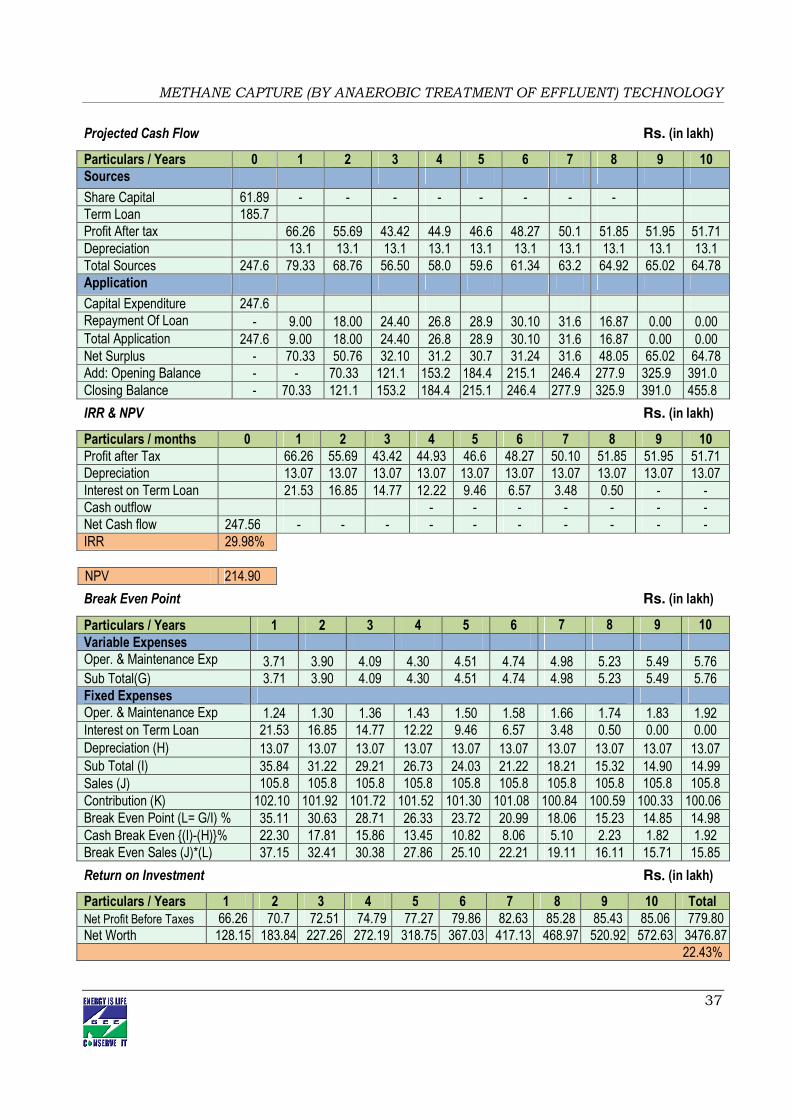
Projected Cash Flow Rs. (in lakh)
Particulars / Years 0 1 2 3 4 5 6 7 8 9 10
Sources
Share Capital 61.89 - - - - - - - - Term Loan 185.7 Profit After tax 66.26 55.69 43.42 44.9 46.6 48.27 50.1 51.85 51.95 51.71 Depreciation 13.1 13.1 13.1 13.1 13.1 13.1 13.1 13.1 13.1 13.1 Total Sources 247.6 79.33 68.76 56.50 58.0 59.6 61.34 63.2 64.92 65.02 64.78 Application
Capital Expenditure 247.6 Repayment Of Loan - 9.00 18.00 24.40 26.8 28.9 30.10 31.6 16.87 0.00 0.00 Total Application 247.6 9.00 18.00 24.40 26.8 28.9 30.10 31.6 16.87 0.00 0.00 Net Surplus - 70.33 50.76 32.10 31.2 30.7 31.24 31.6 48.05 65.02 64.78 Add: Opening Balance - - 70.33 121.1 153.2 184.4 215.1 246.4 277.9 325.9 391.0 Closing Balance - 70.33 121.1 153.2 184.4 215.1 246.4 277.9 325.9 391.0 455.8
IRR & NPV Rs. (in lakh)
Particulars / months 0 1 2 3 4 5 6 7 8 9 10
Profit after Tax 66.26 55.69 43.42 44.93 46.6 48.27 50.10 51.85 51.95 51.71 Depreciation 13.07 13.07 13.07 13.07 13.07 13.07 13.07 13.07 13.07 13.07 Interest on Term Loan 21.53 16.85 14.77 12.22 9.46 6.57 3.48 0.50 - - Cash outflow - - - - - - - Net Cash flow 247.56 - - - - - - - - - - IRR 29.98% NPV 214.90
Break Even Point Rs. (in lakh)
Particulars / Years 1 2 3 4 5 6 7 8 9 10
Variable Expenses
Oper. & Maintenance Exp (75%)
3.71 3.90 4.09 4.30 4.51 4.74 4.98 5.23 5.49 5.76 Sub Total(G) 3.71 3.90 4.09 4.30 4.51 4.74 4.98 5.23 5.49 5.76 Fixed Expenses Oper. & Maintenance Exp (25%)
1.24 1.30 1.36 1.43 1.50 1.58 1.66 1.74 1.83 1.92 Interest on Term Loan 21.53 16.85 14.77 12.22 9.46 6.57 3.48 0.50 0.00 0.00 Depreciation (H) 13.07 13.07 13.07 13.07 13.07 13.07 13.07 13.07 13.07 13.07 Sub Total (I) 35.84 31.22 29.21 26.73 24.03 21.22 18.21 15.32 14.90 14.99 Sales (J) 105.8
2 105.82
105.82
105.82
105.82
105.82
105.82
105.82
105.82
105.82 Contribution (K) 102.10 101.92 101.72 101.52 101.30 101.08 100.84 100.59 100.33 100.06
Break Even Point (L= G/I) % 35.11 30.63 28.71 26.33 23.72 20.99 18.06 15.23 14.85 14.98 Cash Break Even {(I)-(H)}% 22.30 17.81 15.86 13.45 10.82 8.06 5.10 2.23 1.82 1.92 Break Even Sales (J)*(L) 37.15 32.41 30.38 27.86 25.10 22.21 19.11 16.11 15.71 15.85
Return on Investment Rs.... (in lakh)
Particulars / Years 1 2 3 4 5 6 7 8 9 10 Total
Net Profit Before Taxes 66.26 70.7 72.51 74.79 77.27 79.86 82.63 85.28 85.43 85.06 779.80 Net Worth 128.15 183.84 227.26 272.19 318.75 367.03 417.13 468.97 520.92 572.63 3476.87
22.43%

METHANE CAPTURE (BY ANAEROBIC TREATMENT OF EFFLUENT) TECHNOLOGY
38
Debt Service Coverage Ratio Rs.... (in lakh)
Particulars / Years 1 2 3 4 5 6 7 8 9 10 Total
Cash Inflow
Profit after Tax 66.26 55.69 43.42 44.93 46.56 48.27 50.10 51.85 51.95 51.71 407.08 Depreciation 13.07 13.07 13.07 13.07 13.07 13.07 13.07 13.07 13.07 13.07 104.57 Interest on Term Loan 21.53 16.85 14.77 12.22 9.46 6.57 3.48 0.50 0.00 0.00 85.38 Total (M) 100.87 85.61 71.27 70.22 69.09 67.91 66.65 65.42 65.02 64.78 597.04
DEBT
Interest on Term Loan 21.53 16.85 14.77 12.22 9.46 6.57 3.48 0.50 0.00 0.00 85.38 Repayment of Term Loan 9.00 18.00 24.40 26.80 28.90 30.10 31.60 16.87 0.00 0.00 185.67 Total (N) 30.53 34.85 39.17 39.02 38.36 36.67 35.08 17.37 0.00 0.00 271.05 3.30 2.46 1.82 1.80 1.80 1.85 1.90 3.77 0.00 0.00 2.20 Average DSCR (M/N) 2.20

METHANE CAPTURE (BY ANAEROBIC TREATMENT OF EFFLUENT) TECHNOLOGY
39
Annexure:-6 Procurement and implementation schedule
Week wise break up of implementation Schedule
SN
Activities
Weeks
1 - 16 17 18
1 Order Placement
2 Delivery
3 Foundation & civil work
4 Pipeline Modification
5 Cabling & electrical panel fitting
6 Testing and trial
7 On site operator training
The proposed system is anaerobic treatment (methane capture) against existing aerobic treatment.
The existing system is almost fully utilized in proposed system with downgrading electric motor as
per DPR (Pl refer Flow chart of both existing & proposed system). The construction of UASB, gas
holder etc additional item will be first done along with provision of pipe fittings, pumps etc. Till these
are ready, the existing system will not be stopped to reduce the down time. Once the additional
system required is constructed & installed, the integration of proposed system with existing system
will require 14 days.
The break up is as follow –
a. Pipe line modification for integration of additional system such as UASB, gas holder etc will
require 7 days.
b. Additional Civil constructed channels for effluent flow along with curing will require 7 days
(simultaneous with above activity)
c. Minor modifications in primary clarifier for fat trap etc 5 Days (simultaneous with above
activity)
d. Making by pass arrangement for aerator to deal with future maintenance 5 Days
(simultaneous with above activity)
e. Installing electric motors, electric panels, electric starters, distribution box etc for additional
electric motors. Downgrading the existing aerator system (as proposed system saves energy
in portion of existing system) will require 2 days (After completion of first 7 day phase of
above installation work)
f. Trial of newly constructed tanks, gas holder etc by filling water (full load test) (Simultaneously
with above 3 days)

METHANE CAPTURE (BY ANAEROBIC TREATMENT OF EFFLUENT) TECHNOLOGY
40
g. Cleaning and detailed inspection of entire system for mechanical joints, electrical system,
pumps etc will require 3 days (After completion of above phase)
h. Final complete trial of 1000 cumec effluent methane captures 2 days.
i. Contingency considered for above complete operation 1 day.
Overall out of total two weeks required first week will be required for installation & erection while
second week will be required for electrification, testing, trial etc.

METHANE CAPTURE (BY ANAEROBIC TREATMENT OF EFFLUENT) TECHNOLOGY
41
Annexure -7: Details of technology service providers
S.No. Name of Service Provider Address Contact Person and No.
1 Sun Enviro Technologies Pvt. Ltd.,
178, Chhatrapati Nagar, Wardha Road, Nagpur - 440 015
Maharashtra, India
Mr. Utkarsh Khopkar
Mobile Number :- 09423686051
2 Energy Options Incorporation
216, Krishna Con-Arch 2, Tagore Road, Godown Road Corner,
Rajkot – 360002, Gujarat
Mr. Jagdish Langewar
Mobile :-09422102926
3 Bio Energy Engineering
MLS Business Centre, Panchasheel Tech Park, Hinjewadi, Pune – 57; Maharashtra
Mr. Shirish Dhamnekar
Mobile Number :- 09819077387
METHANE CAPTURE (BY ANAEROBIC TREATMENT OF EFFLUENT) TECHNOLOGY
42
Annexure–8: Quotations or Techno-commercial bids for new technology/equipment

METHANE CAPTURE (BY ANAEROBIC TREATMENT OF EFFLUENT) TECHNOLOGY
43
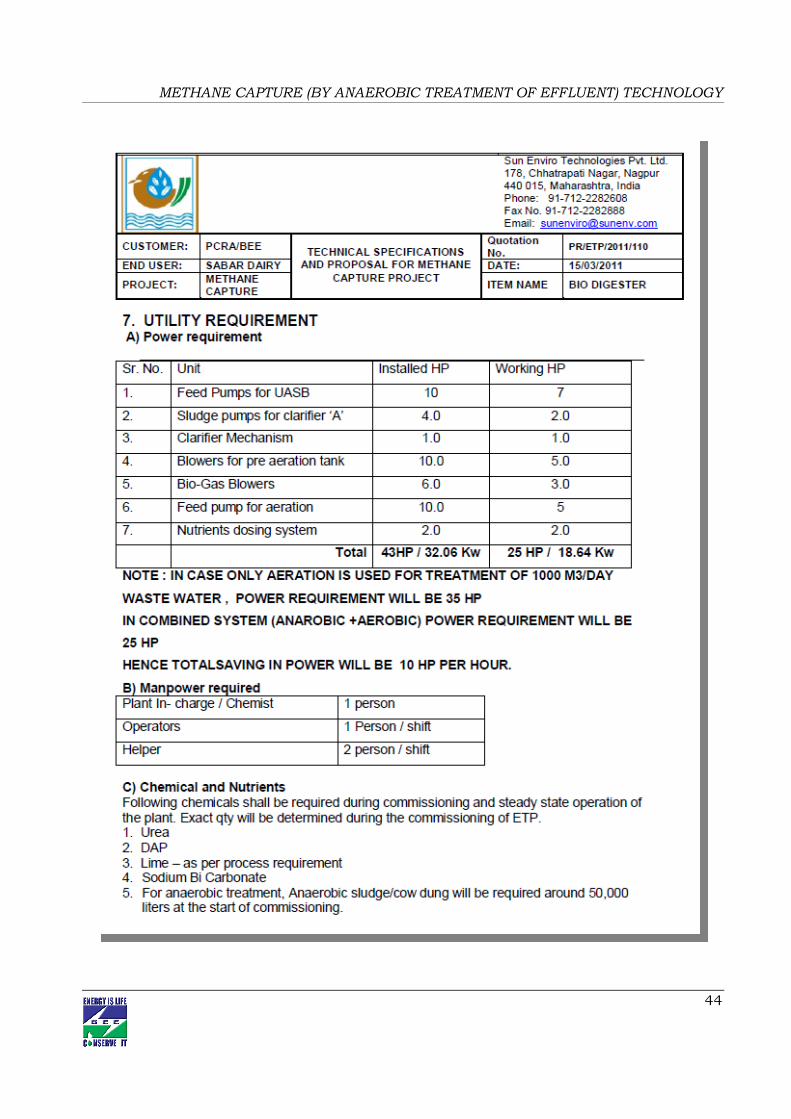
METHANE CAPTURE (BY ANAEROBIC TREATMENT OF EFFLUENT) TECHNOLOGY
44

METHANE CAPTURE (BY ANAEROBIC TREATMENT OF EFFLUENT) TECHNOLOGY
45

METHANE CAPTURE (BY ANAEROBIC TREATMENT OF EFFLUENT) TECHNOLOGY
46

METHANE CAPTURE (BY ANAEROBIC TREATMENT OF EFFLUENT) TECHNOLOGY
47

India SME Technology Services Ltd DFC Building, Plot No.37-38, D-Block, Pankha Road, Institutional Area, Janakpuri, New Delhi-110058 Tel: +91-11-28525534, Fax: +91-11-28525535 Website: www.techsmall.com
Bureau of Energy Efficiency (BEE) (Ministry of Power, Government of India) 4th Floor, Sewa Bhawan, R. K. Puram, New Delhi – 110066 Ph.: +91 – 11 – 26179699 (5 Lines), Fax: +91 – 11 – 26178352
Websites: www.bee-india.nic.in, www.energymanagertraining.com
Petroleum Conservation & Research Association Office Address :- Western Region
C-5, Keshava Building, Bandra-
Kurla Complex; Mumbai – 400051
Website: www.pcra.org