dp 11 book - world trade organization - home page · discussion paper no 11 international...
TRANSCRIPT
I NTERNATIONAL PRODUCTION SHARING: A CASE FOR A COHERENT POLICY FRAMEWORK by HILDEGUNN KYVIK NORDÅS
11
Printed by the WTO Secretariat - 8390.06
ISSN: 1726-9466ISBN: 978-92-870-3379-6

2006A N N U A L P U B L I C AT I O N S
ANNUAL REPORT 2006
The Annual Report of the World Trade Organization focuseson the main activities of the organization and details of itscurrent structure, staff and budget. It is published in thefirst half of the year. This is a companion report to theWorld Trade Report and the International Trade Statistics.
ISBN 978-92-870-3372-7Available Autumn 2006Price: CHF 50
WORLD TRADE REPORT 2006
The annual World Trade Report focuses on trade policyissues - the core topic addressed in 2006 is subsidies. TheReport also takes a look at recent trade developments andexamines a range of trade topics, including trade in texti-les and clothing, flows of international receipts and pay-ments of royalties and license fees, trends in the trade ofleast-developed countries, and the impact of naturaldisasters and terrorist acts on international trade flows.The World Trade Report is useful for policymakers and forany individuals or groups interested in global trade policy.
ISBN 92-870-3352-8Available July 2006Price: CHF 60(1st published in 2003)
Publications available in French, English or Spanish
INTERNATIONAL TRADE STATISTICS 2006
The International Trade Statistics is the WTO's annual com-pilation of global trade statistics. This Report providescomprehensive statistics on trade in merchandise andcommercial services, with an assessment of world tradeflows by country, region and main product groups or servicecategories.
ISBN 978-92-870-3355-0Available December 2006Price: CHF 50(Previously Vol. II of the Annual Report)

DISCUSSION PAPER NO 11
International production sharing: a case for a coherent policy framework
by
Hildegunn Kyvik Nordås
World Trade OrganizationGeneva, Switzerland
Disclaimer and citation guideline
Discussion Papers are presented by the authors in their personal capacity and opinions expressed in these papers should be attributed to the authors. They are not meant to represent the positions or opinions of the WTO Secretariat or of its Members and are without prejudice to Members’ rights and obligations under the WTO. Any errors or omissions are the responsibility of the authors. The author is currently employed of the TAD/Trade and Agriculture Directorate, OECD.
Any citation of this paper should ascribe authorship to staff of the WTO Secretariat and not to the WTO.

This paper is only available in English – Price CHF 20.-
To order, please contact:
WTO PublicationsCentre William Rappard154 rue de LausanneCH-1211 GenevaSwitzerlandTel: (41 22) 739 52 08Fax: (41 22) 739 57 92Website: www.wto.orgE-mail: [email protected]
ISSN 1726-9466ISBN: 978-92-870-3379-6Printed by the WTO SecretariatIII-2007
Keywords: Production sharing, automotive sector, electronics, services trade liberalization.
© World Trade Organization, 2005. Reproduction of material contained in this document may be made only with written permission of the WTO Publications Manager.
With written permission of the WTO Publications Manager, reproduction and use of the material contained in this document for non-commercial educational and training purposes is encouraged.

ACKNOWLEDGEMENTS
The author would like to thank Michael Finger and Patrick Low for useful comments. She also acknowledges helpful comments from Bijit Bora.


ABSTRACT
This study seeks to clarify what vertical specialization/fragmented production/production sharing is, how widespread it is, how it is organized, its driving forces, and what the policy implications are. It presents six country case studies ( USA, Japan, Germany, Brazil, China and South Africa ) where the importance and nature of production sharing or vertical specialization in the automotive and electronics sectors are studied for each country. The automotive industry has always been a leading industry in terms of organizational innovations and recent developments in the sector raise interesting questions about the limits of vertical fragmentation. Electronics is the sector with the highest extent of vertical specialization among all industries. It is characterized by a high value to weight ratio and production of parts and components can easily be separated in time and space.
The driving forces discussed are: technology that allows separation of activities in the supply chain in time and space; organizational innovations that take advantage of such new technologies; the role of services – notably the increasing service content of goods following expanding product diversity and customization to consumer demand – but also the rising demand for sophisticated logistics. It is indeed argued that services links make or break a supply chain. The paper argues that the proliferation of international production sharing requires a coherent policy response, particularly in developing countries, since a chain is as strong as its weakest link. It discusses the complementarities between trade liberalization in goods and services, investment policy, protection of intellectual property and competition policy, where it suggests that there may be a case for looking at the impact of lead firms’ buying power.


TABLE OF CONTENTS
I. INTRODUCTION .................................................................................................................................................................................................................................1
II. THE NATURE OF VERTICAL FRAGEMENTATION .........................................................................................................................4
A. THE SUPPLY CHAIN .................................................................................................................................................................................................................4
B. THE SHARE OF VERTICAL SPECIALIZATION IN WORLD TRADE ..............................................................................6
III. CASE STUDIES ............................................................................................................................................................................................................................. 11
A. THE AUTOMOTIVE INDUSTRY ...............................................................................................................................................................................11
1. USA .....................................................................................................................................................................................................................................................15
2. JAPAN ..............................................................................................................................................................................................................................................16
3. GERMANY ................................................................................................................................................................................................................................18
4. CHINA .............................................................................................................................................................................................................................................19
5. BRAZIL ..........................................................................................................................................................................................................................................19
6. SOUTH AFRICA ..................................................................................................................................................................................................................20
B. ELECTRONICS ..............................................................................................................................................................................................................................22
1. USA .....................................................................................................................................................................................................................................................25
2. JAPAN ..............................................................................................................................................................................................................................................26
3. GERMANY ................................................................................................................................................................................................................................28
4. CHINA .............................................................................................................................................................................................................................................28
5. BRAZIL ..........................................................................................................................................................................................................................................29
6. SOUTH AFRICA ..................................................................................................................................................................................................................29
C. SUMMARY, CASE STUDIES ..........................................................................................................................................................................................30
IV. DRIVING FORCES ......................................................................................................................................................................................................................... 31
A. TECHNOLOGY .............................................................................................................................................................................................................................31
B. INDUSTRIAL ORGANIZATION – THE ROLE OF MULTINATIONAL ENTERPRISES IN VERTICAL SPECIALIZATION .......................................................................................................................................................................................32
C. DEMAND FORCES ...................................................................................................................................................................................................................34
D. ROLE OF DISTANCE AND TIME ............................................................................................................................................................................35
E. ROLE OF SERVICES ................................................................................................................................................................................................................37

V. CONSEQUENCES FOR DEVELOPMENT AND TRADE POLICY ............................................................................. 40
A. THE GATS ...........................................................................................................................................................................................................................................40
B. TRADE FACILITATION ......................................................................................................................................................................................................41
C. TRADE AND COMPETITION ....................................................................................................................................................................................42
D. TRADE, INVESTMENT AND INTELLECTUAL PROPERTY ...................................................................................................43
E. REGIONAL TRADE AGREEMENTS ...................................................................................................................................................................44
VI. SUMMARY AND CONCLUSIONS .......................................................................................................................................................................... 46
VII. REFERENCES ...................................................................................................................................................................................................................................... 48
VIII. STATISTICAL ANNEX ............................................................................................................................................................................................................. 52
IX. TECHNICAL ANNEX ................................................................................................................................................................................................................. 60
LIST OF BOXES, TABLES AND CHARTS
BOX 1 GENERAL MOTORS AND DELPHI ................................................................................................................................ 12
BOX 2 TIME AS A TRADE BARRIER ............................................................................................................................................. 37
CHART 1 THE SUPPLY CHAIN VALUE CHAIN MATRIX ................................................................................................... 5
CHART 2 VERTICAL SPECIALIZATION INDEX BY SECTOR AND COUNTRY, 2001 ......................... 9
CHART 3 EXPORTS OF PARTS AND COMPONENTS OF TRANSPORT EQUIPMENT (BEC CATEGORY 53), US$ BILL .................................................................................................................................... 13
CHART 4 EXPORTS OF PARTS AND COMPONENTS, ELECTRONICS, US$ ............................................... 24
FIGURE II.2 IMPORT CONTENT OF EXPORTS, 2001 .................................................................................................................... 8
FIGURE A.1 U.S. SOURCES OF IMPORTS OF PARTS AND ACCESSORIES OF TRANSPORT EQUIPMENT, 10 LARGEST COUNTRIES (SHARE OF TOTAL) ................ 52
FIGURE A.2 U.S. DESTINATION OF EXPORTS OF PARTS AND ACCESSORIES OF TRANSPORT EQUIPMENT, 10 LARGEST COUNTRIES (SHARE OF TOTAL) ................ 52
FIGURE A.3 RELIANCE ON US MARKET, SHARE OF TOTAL EXPORTS ........................................................... 53
FIGURE A.4 SOURCES OF JAPAN’S IMPORTS OF CAR PARTS AND COMPONENTS IN THE AUTOMOTIVE SECTOR (SHARE OF TOTAL) ............................................................................. 53
FIGURE A.5 GERMANY’S SOURCING OF PARTS AND COMPONENTS TO THE AUTOMOTIVE SECTOR, (SHARE OF TOTAL) ................................................................................................. 54
FIGURE A.6 SOUTH AFRICA’S SOURCING OF PARTS AND COMPONENTS FOR THE TRANSPORT EQUIPMENT SECTOR BY COUNTRY (SHARE OF TOTAL) ......................... 54
FIGURE A.7 SOURCES OF U.S IMPORTS OF PARTS AND COMPONENTS IN THE ELECTRONICS SECTOR (SHARES OF TOTAL) .............................................................................................. 55
FIGURE A.8 US EXPORTS OF PARTS AND COMPONENTS IN THE ELECTRONICS SECTOR (PERCENTAGES) ..................................................................................................................................................... 55
FIGURE A.9 RELIANCE ON THE US MARKET FOR EXPORTS OF PARTS AND COMPONENTS TO THE ELECTRONICS SECTOR (PERCENTAGES OF TOTAL EXPORTS) ............................................................................................................................................................................ 56
FIGURE A.10 SOURCES OF JAPAN’S IMPORTS OF ELECTRONICS PARTS AND COMPONENTS (SHARE OF TOTAL) ........................................................................................................................... 56
FIGURE A.11 DESTINATION OF EXPORTS OF PARTS AND ACCESSORIES OF ELECTRONICS (SHARE OF TOTAL) ........................................................................................................................... 57
FIGURE A.12 RELIANCE ON JAPANESE MARKET – SHARE OF TOTAL EXPORTS ................................... 57
FIGURE A.13 GERMAN SOURCING OF PARTS AND COMPONENTS IN THE ELECTRONICS INDUSTRY (SHARE OF TOTAL) ......................................................................................... 58
FIGURE A.14 CHINA’S SOURCING OF PARTS AND COMPONENTS FOR THE ELECTRONICS SECTOR BY COUNTRY (SHARES OF TOTAL) ..................................................... 58
FIGURE A.15 BRAZIL’S SOURCING OF PARTS AND COMPONENTS FOR THE ELECTRONICS SECTOR BY COUNTRY (SHARE OF TOTAL) ........................................................ 59
FIGURE A.16 SOUTH AFRICA’S SOURCING OF PARTS AND COMPONENTS TO THE ELECTRONICS SECTOR BY COUNTRY (SHARE OF TOTAL) ........................................................ 59
TABLE 1 SHARE OF INTERMEDIATES IN NON-FUEL MERCHANDISE TRADE, 2004, PER CENT ..................................................................................................................................................................................... 6
TABLE 3 DIRECTION OF TRADE IN PARTS AND COMPONENTS OF TRANSPORT EQUIPMENT ........................................................................................................................................................................................... 14
TABLE 4 FINISHED PRODUCTS AND PARTS AND COMPONENTS IN THE ELECTRONICS SECTOR, SITC VERSION 2 CLASSIFICATION..................................................... 23
TABLE 5 DIRECTION OF TRADE IN PARTS AND COMPONENTS OF ELECTRONICS ................ 24
TABLE 6 INDUSTRIAL ORGANIZATION ......................................................................................................................................... 33
TABLE 7 TIME FOR EXPORTS AND IMPORTS (DAYS) ................................................................................................... 41
TABLE A.1 REGRESSION RESULTS FOR VERTICAL SPECIALIZATION AND EXPORTS IN THE AUTOMOTIVE INDUSTRY .................................................................................................. 60
TABLE A.3 CORRELATION BETWEEN U.S TRADE IN PARTS AND COMPONENTS, TRANSPORT EQUIPMENT AND FDI STOCKS ................................................................................................. 61
TABLE A.4 REGRESSION RESULTS, U.S TRADE IN PARTS AND COMPONENTS, TRANSPORT EQUIPMENT AND FDI STOCKS ................................................................................................. 61
TABLE A.5 CORRELATION BETWEEN U.S TRADE IN PARTS AND COMPONENTS, ELECTRONICS AND FDI STOCKS................................................................................................................................. 61
TABLE A.6 REGRESSION RESULTS, U.S TRADE IN PARTS AND COMPONENTS, ELECTRONICS AND FDI STOCKS................................................................................................................................. 61
TABLE A2 REGRESSION RESULTS FOR VERTICAL SPECIALIZATION AND EXPORTS IN THE ELECTRONICS INDUSTRY................................................................................................. 60
I. Countries or areas, codes and abbreviations
Numerical
code
Country or area name ISO ALPHA-3 code
004 Afghanistan AFG
248 Åland Islands ALA
008 Albania ALB
012 Algeria DZA
016 American Samoa ASM
020 Andorra AND
024 Angola AGO
660 Anguilla AIA
028 Antigua and Barbuda ATG
032 Argentina ARG
051 Armenia ARM
533 Aruba ABW
036 Australia AUS
040 Austria AUT
031 Azerbaijan AZE
044 Bahamas BHS
048 Bahrain BHR
050 Bangladesh BGD
052 Barbados BRB
112 Belarus BLR
056 Belgium BEL
084 Belize BLZ
204 Benin BEN
060 Bermuda BMU
064 Bhutan BTN
068 Bolivia BOL
070 Bosnia and Herzegovina BIH
072 Botswana BWA
076 Brazil BRA
092 British Virgin Islands VGB
096 Brunei Darussalam BRN
100 Bulgaria BGR
854 Burkina Faso BFA
108 Burundi BDI
116 Cambodia KHM
120 Cameroon CMR
124 Canada CAN
132 Cape Verde CPV
136 Cayman Islands CYM
140 Central African Republic CAF
148 Chad TCD
830 Channel Islands
152 Chile CHL
156 China CHN
344Hong Kong Special Administrative Region of China
HKG
Numerical
code
Country or area name ISO ALPHA-3 code
446 Macao Special Administrative Region of China
MAC
170 Colombia COL
174 Comoros COM
178 Congo COG
184 Cook Islands COK
188 Costa Rica CRI
384 Côte d'Ivoire CIV
191 Croatia HRV
192 Cuba CUB
196 Cyprus CYP
203 Czech Republic CZE
408 Democratic People's Republic of Korea
PRK
180 Democratic Republic of the Congo
COD
208 Denmark DNK
262 Djibouti DJI
212 Dominica DMA
214 Dominican Republic DOM
218 Ecuador ECU
818 Egypt EGY
222 El Salvador SLV
226 Equatorial Guinea GNQ
232 Eritrea ERI
233 Estonia EST
231 Ethiopia ETH
234 Faeroe Islands FRO
238 Falkland Islands (Malvinas)
FLK
242 Fiji FJI
246 Finland FIN
250 France FRA
254 French Guiana GUF
258 French Polynesia PYF
266 Gabon GAB
270 Gambia GMB
268 Georgia GEO
276 Germany DEU
288 Ghana GHA
292 Gibraltar GIB
300 Greece GRC
304 Greenland GRL
308 Grenada GRD
312 Guadeloupe GLP
316 Guam GUM
320 Guatemala GTM

Numerical
code
Country or area name ISO ALPHA-3 code
831 Guernsey
324 Guinea GIN
624 Guinea-Bissau GNB
328 Guyana GUY
332 Haiti HTI
336 Holy See VAT
340 Honduras HND
348 Hungary HUN
352 Iceland ISL
356 India IND
360 Indonesia IDN
364 Iran, Islamic Republic of IRN
368 Iraq IRQ
372 Ireland IRL
833 Isle of Man
376 Israel ISR
380 Italy ITA
388 Jamaica JAM
392 Japan JPN
832 Jersey
400 Jordan JOR
398 Kazakhstan KAZ
404 Kenya KEN
296 Kiribati KIR
414 Kuwait KWT
417 Kyrgyzstan KGZ
418 Lao People's Democratic Republic
LAO
428 Latvia LVA
422 Lebanon LBN
426 Lesotho LSO
430 Liberia LBR
434 Libyan Arab Jamahiriya LBY
438 Liechtenstein LIE
440 Lithuania LTU
442 Luxembourg LUX
450 Madagascar MDG
454 Malawi MWI
458 Malaysia MYS
462 Maldives MDV
466 Mali MLI
470 Malta MLT
584 Marshall Islands MHL
474 Martinique MTQ
478 Mauritania MRT
480 Mauritius MUS
175 Mayotte MYT
484 Mexico MEX
Numerical
code
Country or area name ISO ALPHA-3 code
583 Micronesia, Federated States of
FSM
492 Monaco MCO
496 Mongolia MNG
499 Montenegro MNE
500 Montserrat MSR
504 Morocco MAR
508 Mozambique MOZ
104 Myanmar MMR
516 Namibia NAM
520 Nauru NRU
524 Nepal NPL
528 Netherlands NLD
530 Netherlands Antilles ANT
540 New Caledonia NCL
554 New Zealand NZL
558 Nicaragua NIC
562 Niger NER
566 Nigeria NGA
570 Niue NIU
574 Norfolk Island NFK
580 Northern Mariana Islands MNP
578 Norway NOR
275 Occupied Palestinian Territory
PSE
512 Oman OMN
586 Pakistan PAK
585 Palau PLW
591 Panama PAN
598 Papua New Guinea PNG
600 Paraguay PRY
604 Peru PER
608 Philippines PHL
612 Pitcairn PCN
616 Poland POL
620 Portugal PRT
630 Puerto Rico PRI
634 Qatar QAT
410 Republic of Korea KOR
498 Republic of Moldova MDA
638 Réunion REU
642 Romania ROU
643 Russian Federation RUS
646 Rwanda RWA
654 Saint Helena SHN
659 Saint Kitts and Nevis KNA
662 Saint Lucia LCA
666 Saint Pierre and Miquelon
SPM

Numerical
code
Country or area name ISO ALPHA-3 code
670 Saint Vincent and the Grenadines
VCT
882 Samoa WSM
674 San Marino SMR
678 Sao Tome and Principe STP
682 Saudi Arabia SAU
686 Senegal SEN
688 Serbia SRB
690 Seychelles SYC
694 Sierra Leone SLE
702 Singapore SGP
703 Slovakia SVK
705 Slovenia SVN
090 Solomon Islands SLB
706 Somalia SOM
710 South Africa ZAF
724 Spain ESP
144 Sri Lanka LKA
736 Sudan SDN
740 Suriname SUR
744 Svalbard and Jan Mayen Islands
SJM
748 Swaziland SWZ
752 Sweden SWE
756 Switzerland CHE
760 Syrian Arab Republic SYR
762 Tajikistan TJK
764 Thailand THA
807 The former Yugoslav Republic of Macedonia
MKD
626 Timor-Leste TLS
768 Togo TGO
772 Tokelau TKL
776 Tonga TON
780 Trinidad and Tobago TTO
788 Tunisia TUN
792 Turkey TUR
795 Turkmenistan TKM
796 Turks and Caicos Islands TCA
798 Tuvalu TUV
800 Uganda UGA
804 Ukraine UKR
784 United Arab Emirates ARE
826 United Kingdom of Great Britain and Northern Ireland
GBR
834 United Republic of Tanzania
TZA
840 United States of America USA
Numerical
code
Country or area name ISO ALPHA-3 code
850 United States Virgin Islands
VIR
858 Uruguay URY
860 Uzbekistan UZB
548 Vanuatu VUT
862 Venezuela (Bolivarian Republic of)
VEN
704 Viet Nam VNM
876 Wallis and Futuna Islands WLF
732 Western Sahara ESH
887 Yemen YEM
894 Zambia ZMB
716 Zimbabwe ZWE
Note: The designations employed and the presentation of country or area names in this list do not imply the expression of any opinion whatsoever on the part of the Secretariat of the United Nations concerning the legal status of any country, territory, city or area or of its authorities, or concerning the delimitation of its frontiers or boundaries. The user of any particular dataset should consult the dataset documentation to determine the exact coverage of statistics for the country or area entities in the dataset. Various datasets may or may not include coverage of outlying and overseas areas, depending on the type of data and source.


1
Once upon a time Henry Ford invented a way of producing cars that made them affordable for ordinary American families. Furthermore, the workers were paid sufficiently high wages to create a mass market for the mass produced cars. Ford’s idea was to break up the production process in as small and standardized units as possible and organize the activities sequentially along an assembly line. He had built factories into which steel entered at the one end and finished, standardized cars rolled off at the other end. Henry Ford is also famously associated with the statement that the colour of the car does not matter as long as it is black.
Many of us still associate manufacturing with the assembly line - and the assembly line with Charlie Chaplin’s movie “Modern Times”. Modern manufacturing has, however, changed a lot since Henry Ford’s and Chaplin’s days. The assembly line has been replaced by different forms of flexible production such as quality circles, flexible automation and just-in-time delivery. On the demand side, Mr. Ford would not get away with providing only one model and only black cars to the public. The modern consumer wants to have a choice.
Today breaking up production on standardized units allows deepening specialization not only within the company as in the early car factory, but also between companies and between countries. Thus, production has become fragmented or decentralized to a number of specialized producers operating at different stages in the production process. The buzz-words of modern manufacturing are mass customization, outsourcing of non-core activities and supply chain management. Mass customization can be seen as a process of differentiating and branding the final product while standardizing and commoditizing intermediate inputs. In this way the benefits of sufficient scale in production are maintained while providing customers with a wide range of products at low prices.
Declining transport and communication costs together with declining tariffs have provided an opportunity for producers to exploit the gains from specialization through a deeper international division of labour (Yi, 2003). However, it appears that as the cost of each
individual trade transaction has gone down, the number of trade transactions has gone up to the extent that total trade costs have actually increased.1 Trade costs include time costs and costs related to uncertainty regarding delivery. As will be stressed in the study, late arrival of a component can bring the entire assembly process to a halt in a supply chain where just-in-time is applied. The cost of such a delay can therefore run into millions even when the fiscal outlay of the delayed components is almost insignificant. Under such circumstances, no price would be low enough to compensate the customer for the loss related to late delivery.
The possibility that distance and time are becoming the binding trade barriers as tariffs and other politically determined barriers to trade have come down raises intriguing and challenging questions for developing countries. As will be shown in this study, most exports from developing countries and small developing countries in particular, have significant import content, reflecting vertical specialization. Even China’s exports represent a link in international supply chains where local value added can be quite low in many sectors. Trade costs, whether due to tariffs, poor infrastructure, inefficient transport and logistics services or slow and inefficient customs services, therefore matters a lot not only for import penetration but also for export performance. Furthermore, it follows directly from the fact that downstream firms minimize trade costs that the export performance of domestic firms depend as much on trade costs relative to other countries as to the absolute level of trade costs. Therefore, if developing countries are to gain market share in industries where vertical specialization is important, they may need to reduce trade costs more than developed countries. Seen from this perspective, the strategy of making special and different treatment a priority area in the Doha round negotiations on the GATS can be self-defeating if the purpose of
1 Total trade costs relative to the value of gross output have been found to have increased by some recent observers. This means that the elasticity of trade f lows to trade costs is significantly above unity. See Duranton and Storper (2005) for a recent discussion.
I. INTRODUCTION
2
the strategy is to postpone reforms.2 By the same token, trade facilitation can be a relatively low-cost means of reducing trade costs for developing countries as several recent studies from the OECD have shown.3
If vertical specialization is increasing its relative importance in world trade, this requires a fresh look at the relationship between trade, trade facilitation, investment and intellectual property policy and the relationship between trade and competition policy. Trade facilitation helps reduce both average time in transit and the variation and uncertainty regarding time in transit. These are both key to competitiveness in vertical supply chains.
Vertical specialization and outsourcing has made the boundaries of the firm more blurred and partnerships, alliances and other forms of contractual relations have in many cases substituted for ownership as a means of control of production and technology. Therefore, the concept of commercial presence as applied in the GATS is relevant to goods-producing sectors as well.
The increased use of contractual relations rather than ownership also raises new issues related to trade and protection of intellectual property rights and trade and competition. Protection of intellectual property rights in a country is important for domestic suppliers’ ability to qualify as suppliers to international production networks producing IP-protected products. Turning to trade and competition, long-term contractual relationships between companies in vertical production networks may constitute a barrier to entry for outside firms. This is a trade barrier outside the realm of government trade policy, but which can be addressed through competition policy measures. Competition measures do, however, increasingly need to address cross-border issues and international cooperation is necessary in order to prevent international supply chains from erecting unnecessary entry barriers.
2 Preferential market access and technical assistance could nevertheless be beneficial for a number of developing countries.
3 See for instance Engman (2005).
There are at least three strands of literature on fragmented production that will be reviewed in this study. First, there is the descriptive literature on international supply chains and outsourcing, largely found in the business literature. Second, there is the empirical literature on vertical fragmentation analyzing trade in intermediates, and third there is the theoretical literature that seeks to incorporate the insights from the industrial organization literature into trade theory and trade policy analysis. While the descriptive literature dates back 10-15 years, the empirical and theoretical literature is of recent origin.
The study seeks to clarify what fragmented production or production sharing is, how widespread it is, how it is organized, its driving forces and what are the policy implications - the latter focussing on developing countries and the Doha Development Round. It presents six country case studies where the importance and nature of production sharing or vertical specialization in the automotive and electronics sectors is studied for each country. The automotive industry has always been a leading industry in terms of organizational innovations and technologies such as just-in-time, and total quality management were developed in this sector. The industry has run into structural problems and there appears to be a reversal towards more centralization and integration in recent years (McKinsey, 2005). Developments in the automotive sector therefore raise interesting questions as to the limits of vertical fragmentation and what role policy interventions have had in the development of this sector. Electronics is chosen because it is the sector with the highest extent of vertical specialization among all industries. It is characterized by a high value to weight ratio and production of parts and components can easily be separated in time and space. Finally, the two sectors are to an increasing extent linked as electronics components and accessories constitute and increasing share of a car’s value.
3
The six countries chosen for the case studies are USA, Japan, Germany, Mexico, China and South Africa. The first three are the largest economies in the world, but located in three different regions and representing different business practices. Likewise, China, Mexico and South Africa are developing countries in three different regions with quite different patterns of integration into vertical supply chains. The six countries thus represent a broad range of countries with a relatively broad and diversified industrial base and good data exists for all six. Smaller countries will enter the picture as we analyse the direction of trade of these six countries.
The study is organized as follows: Section II describes vertical specialization and provides different estimates of its relative importance in world trade. Section III presents the case studies. In section IV the driving forces behind international fragmentation of production are discussed in more depth, analyzing the role of technology, trade costs, industrial organization issues, demand factors and the interactions between these driving forces. It focuses on the potential gains for developing countries from integrating with international production networks. Finally, section five discusses how the Doha Round can contribute to easing developing countries’ access to international production networks.

4
A. THE SUPPLY CHAIN
Some examples illustrate the nature of fragmented production. The so-called manufacturers without factories are the most extreme cases where Dell Computers is a much cited example. All production is done by a multi-tier network of suppliers in which the first-tier suppliers organize a network of subcontractors to produce the semiconductors, the screens and other parts that constitute a computer. Dell does not own its suppliers, but keeps close ties with them in order to ensure that they produce the required quality and deliver in time. In order to do so, final assembly is typically located close to the consumer. Dell’s core business is design and marketing of built-to-order computers and their core assets are the brand name and the distributed production process that they have pioneered and even patented. Another much cited manufacturer without factories is Nike who designs and sells sneakers and sports wear.
For Dell, Nike and other manufacturers without factories the main assets are their ideas and their trade mark. As is well known, building a reputation for quality and value for money takes time and effort, but destroying a reputation takes only one scandal or serious mishap. Manufacturers without factories can only rely on their suppliers to ensure that the products meet quality standards. Therefore, suppliers are carefully chosen and monitored. Furthermore, it is in the interest of the owner of the trade mark that suppliers are at the technology front and highly efficient. Agreements on joint product development and technology transfer are consequently common within production networks where products have a strong trademark. Such cooperation is partly built on trust and takes place within the context of long-term framework agreements.4 The proliferation of production networks in the world economy therefore increases the share of transactions that takes place outside open market arms-length trade, implying that trade and competition policy are closely related in the case of vertical specialization.
4 The reason why cooperation is partly built on trust even when within a framework of a long-term contract is that contracts are incomplete in this area.
In every international production network or supply chain there is a lead firm which organizes and coordinates it. At what link in the vertical supply chain the lead firm is found varies between sectors. A general observation is that the lead firm represents the link where the market is the most concentrated, another reason why competition issues may arise from the proliferation of international production sharing. In light consumer goods sectors the retail stage is often the most concentrated, and retailers are increasingly found as the lead firm in production networks. Examples are Hennes and Mauritz and the GAP in the clothing sector and IKEA in furniture and household appliances. The strategic asset in these networks is the brand name, and suppliers produce according to the designs and under the brand name of the retailers.
In more scale and technology intensive sectors such as car manufacturing and machinery and equipment, the manufacturer is the lead firm in the supply chain and technology is a strategic asset. It appears that the closer to the consumer the lead firm, the more geographically dispersed the production network (Gereffi, 1999).
A production network is often presented as a matrix where activities feature on one axis and institutions on the other. The activities are equivalent to the sequence of production stages, while institutions represent the firms which undertake the activities. In the business literature terminology the chain of activities is labelled the value chain while the institutions are labelled the supply chain. The idea is that changing market conditions, technology and transaction costs affect which activity is carried out by which institution and in which location. Furthermore, the literature documents that the last two decades have seen substantial changes in the matching between institutions and activities. The tendency is that the lead firms, or supply chain drivers in the business literature terminology, concentrate on fewer activities while establishing a network of non-captive suppliers of components, modules and services.
II. THE NATURE OF VERTICAL FRAGEMENTATION

5
There are usually many loops of inbound logistics – operation – outbound logistics in a value chain. In some chains they follow each other in a given sequence, in others they run in parallel. Between each production stage there are inbound and outbound inventories and a number of services including transport, communication, financial services, storage, packaging, testing and many more. These supporting services are increasingly considered non-core and provided by specialized outside suppliers. Furthermore, the supporting services also constitute the mortar that holds the supply chain together and ideally ensure a seamless production chain from raw materials to after-sales services. The effectiveness of supporting services is decisive for the location of production activities within the chain. The more effective the services, the lower the transaction costs and the more can be saved from sourcing from a low-cost country. However, the market for supporting services is typically shallow in developing countries, which implies that transaction costs may be high or at worst that links to international supply chains are missing.
Information and communication technology plays a particularly important role in international production networks. In supply chains driven by retailers, which are particularly relevant for labour-rich developing countries, automated procurement is common. Sales data are gathered in real time at the sales point, transmitted to distribution centres, which in turn are electronically connected to the suppliers. The
Chart 1 The supply chain value chain matrix
Inbound
Logistics OperationOutbound
Logistics Marketing Service
Manufacturers
Transport and logistics firms
Other services firms
technology supporting these networks are computers linked to the internet or dedicated networks, bar codes and lasers for reading the bar codes, and it requires that all links in the chain have access to adequate telecommunications.
Within a vertical specialization framework, there are several possible trade patterns. One possibility is sequential stages of production where raw materials constitute the first stage and subsequent stages add value through further processing until the final stage assembles the components and market the final product. It is often assumed that the lower stages are less capital and skills-intensive than the late stages. In that case the lower stages would be produced in low-cost countries that are relative abundant in labour, while intermediate stages would be located in middle-income countries with relatively low costs, but reasonably well endowed with skills. The final stages would be produced in a country relative abundant in skills, which also tends to be a relative rich country with a significant market for the final goods.5
Another pattern of specialization is one where the lead firm owns a trademark and provides product design, engineering and other key inputs. Production of intermediate products is then distributed on a number of second tier producers which may be located in several countries and may or may not have lower-tier subcontractors
5 Most theoretical models analyzing vertical specialization assumes such sequential production stages.

6
locally or in yet other countries. The production of inputs is coordinated and ideally synchronized by the lead firm, which eventually market the final goods for the local market and exports. In this structure, the early stages of production can be the most capital and skills intensive while the late stages of assembly is often labour-intensive and located in a low-cost country. So-called outward processing agreements are common trade policy measures that support this kind of vertical specialization. The textiles sector is for example more capital and skills-intensive than the apparel sector and the same goes for some pre-production activities such as cutting the fabric. Also electronics is of this nature where the production of micro parts is more capital and skills-intensive than the final stages of assembly.
B. THE SHARE OF VERTICAL SPECIALIZATION IN WORLD TRADE
Cross-border vertical specialization is not possible to measure directly using available trade statistics. One frequently used proxy is trade in intermediate products. Since many products are used for both final consumption and intermediate inputs, one needs to know the actual use of the product in question. Firm level data as well as input-output tables that distinguish between imported and locally sourced inputs can be used for estimating trade in intermediate products. A study by Campa and Goldberg (1997) applied this approach and found that the import share of intermediate inputs in manufacturing increased from about 16 per cent to about 20 per cent in Canada during the period 1974-1993, from 13 to 22 per cent in UK, from 4 to 8 per cent in the US, while the import share of intermediate inputs declined from 8 to 4 per cent in Japan over this period. The import share of intermediate inputs in the manufacturing sector in Norway has been stable at 26 per cent from 1992 to 2002, and in the Netherlands it was stable at about 43 per cent between 1995 and 1998.6
The UN’s Comtrade database provides data by Broad Economic Categories (BEC) which distinguishes between capital goods, industrial supply of parts and accessories and consumption
6 Calculated by author on the basis of input-output tables from Statistics Norway. http://www.ssb.no/emner/09/01/nr/ and from OECD input output tables.
goods. According to these data, imports of industrial supply (category 22) plus parts and accessories of capital goods (category 42) plus parts and accessories of transport equipment (category 53) accounted for about 48 per cent of total world merchandise non-fuel exports in 2004 as well as in 1996. This measure can be seen as the upper boundary of the extent of vertical specialization. Its stability over time could indicate that the rising share of vertical specialization in world trade reported in a number of studies has come to a halt. If so, one explanation could be that the introduction of modern supply chain management techniques has substantially increased the relevance of timely delivery and resulted in agglomeration of suppliers, particularly those producing customized, high-value inputs. Intermediates (categories 22+42+53) as a share of total trade non-fuel (total less BEC category 3) for the six countries that constitute the case studies are presented in Table 1.
Table 1 Share of intermediates in non-fuel merchandise trade, 2004, per cent
Imports Exports
USA 39.7 53.9
Japan 42.0 52.6
Germany 47.8 47.0
Brazil 67.2 42.1
China 61.8 37.7
South Africa 40.8 59.7
Source: Comtrade
The large industrial countries have a higher share of intermediates in their exports than in their imports, while the opposite is true for developing countries, except for South Africa. Brazil, Germany, Japan and South Africa have a trade surplus in intermediate inputs, while China and the US had deficits. This suggests that the second pattern of vertical specialization where assembly is the most labour-intensive activity and located in countries with comparative advantages in labour-intensive activities dominates the picture. The South African pattern probably illustrates the fact that South Africa has a relatively well developed industrial sector that engages in similar patterns of vertical specialization as developed

7
countries’ manufacturing firms – outsourcing or investing in assembly activities in neighbouring less developed countries.
Vertical specialization takes place both within multinational firms and through outsourcing to external producers. The extent of intra-firm international vertical specialization is reflected in multinational firms’ intra-industry trade in intermediate inputs. Borga and Zeile (2004) find that during the period 1966-1999, exports of intermediate inputs by US parents to their foreign affiliates for assembly or processing increased forty-fold, and the share of these exports in U.S. total merchandise exports increased from 8.5 to 14.7 per cent during the same period.
A third measure of international vertical specialization is developed by Hummels et. al. (2001). They define the use of imported intermediate goods in products that are subsequently exported as international vertical specialization, and make a first attempt to estimate its significance.7 They find that the share of vertical specialization in exports was about 20 per cent in 1990, and that it had increased from about 15 per cent in 1970, using data for 13 OECD countries plus Taiwan, a sample that covered 60 percent of world trade. Chen et al. (2005) used the same methodology and the same source for more recent data covering the period 1968-1998. The countries for which data are available beyond 1990 the import share of exports increased during the 1990s in Australia, France, Germany, the Netherlands, the UK and the U.S., but declined in Denmark and remained flat in Japan. This is a relatively narrow measure of international fragmentation of production, and requires that the intermediate product in question must cross an international border at least twice. Chart 2 below shows the share of vertical specialization in total manufactured exports in selected countries estimated from the GTAP database for 2001, using the formula represented in footnote 7.
7 For mal ly the i ndex i s g iven as i
i
iki X
GO
MIVS
where VS is vertical specialization in country k and sector i, MI is imported intermediates, GO is gross output while X is exports

8
Figure II.2 Import content of exports, 20018
ALBARG
AUSAUT
BELBGD
BGRBRA
BWACAN
CHECHL
CHNCOL
CYPCZE
DEUDNK
ESPEST
FINFRA
GBRGRC
HKGHRV
HUNIDN
INDIRL
ITAJPN
KORLKA
LTULUX
LVAMAR
MDGMEX
MLTMOZMWI
MYSNLD
NZLPER
PHLPOL
PRTROM
RUSSGP
SVKSVN
SWETHA
TURTWN
TZAUGA
URYUSA
VENVNM
ZAFZMB
ZWE
0% 10% 20% 30% 40% 50% 60%
Import content of exports
8 Calculated by author using the GTAP database version 6.1.

9
One striking feature of this figure is the large share of total exports attributed to vertical specialization in small countries. The largest shares are found in Singapore and Malta where almost half of total exports can be characterized as vertical specialization. By the same token, the share is small in large countries such as the United States, India and China. The reason for this is that even though vertical specialization among firms are equally widespread in large and
small countries, more links in the supply chain are located within the country in large countries.
There are also large differences among sectors regarding the Hummels’ index of vertical specialization. Table 2 presents estimates of the vertical specialization index for the same countries as presented in Chart 2 for electronics and motor vehicles.
Chart 2 Vertical specialization index by sector and country, 20019
Country Electronics Motor vehicles Country Electronics Motor vehicles
Albania 46.8 7.5 Malawi 70.0 78.7
Argentina 25.9 18.2 Malaysia 53.2 46.2
Australia 37.4 27.3 Malta 55.8 51.5
Austria 37.5 47.7 Mexico 43.1 37.6
Bangladesh 9.9 13.4 Morocco 22.3 27.7
Belgium 44.4 69.9 Mozambique 53.8 62.5
Botswana 41.3 65.6 Netherlands 50.6 44.8
Brazil 34.7 19.1 New Zealand 25.6 39.6
Bulgaria 6.1 6.9 Peru 22.3 10.9
Canada 36.8 40.2 Philippines 71.6 46.9
Chile 27.4 36.4 Poland 28.8 38.3
China 31.6 9.8 Portugal 35.5 30.9
Colombia 23.3 40.6 Romania 23.9 29.0
Croatia 36.6 58.7 Russia 27.6 15.2
Cyprus 50.2 42.2 Singapore 79.4 47.1
Czech Rep. 43.3 42.5 Slovakia 33.5 54.4
Denmark 37.1 37.6 Slovenia 38.0 40.1
Estonia 46.3 49.0 South Africa 16.6 22.7
Finland 43.9 40.5 Spain 28.4 38.5
France 17.4 21.3 Sri Lanka 61.7 24.9
Germany 20.2 19.6 Sweden 28.3 33.7
Greece 23.8 5.6 Switzerland 25.6 19.2
Hong Kong 41.6 9.1 Chinese Taipei 34.5 21.7
Hungary 66.5 64.6 Tanzania 55.1 23.0
India 20.6 4.6 Thailand 65.1 46.5
Indonesia 25.2 28.3 Turkey 28.1 21.1
Ireland 54.9 17.0 Uganda 44.2 34.1
Italy 23.8 25.1 UK 32.4 28.7
Japan 8.2 1.6 Uruguay 18.2 34.8
Korea, Rep. of 36.3 10.5 USA 14.2 12.3
Latvia 48.5 38.7 Venezuela 45.9 34.4
Lithuania 41.5 39.7 Vietnam 40.5 39.6
Luxembourg 48.4 70.0 Zambia 27.2 43.9
Madagascar 84.6 80.0 Zimbabwe 21.1 26.8
Average all countries 37.4 34.1
9 Calculated by author using the GTAP version 6.1 database.

10
There is again considerable variation among countries, and the general picture is the same as for total trade – small and/or poor countries tend to have a higher import content of exports than larger and/or richer countries. A statistical analysis of the data also reveals that the distribution of the vertical specialization index is positively skewed and there is a relatively long tale of high values consisting of poor and small countries that mainly assemble imported inputs.10
10 The skewdness of the vertical specialization index is 0.64 and 0.44 for the electronics and motor vehicle industries respectively, while the kurstosis for the two sectors are 0.37 and -0.07 respectively.
To sum up this chapter, vertical specialization is an important factor behind an increase in the ratio of exports + imports over world GDP. A lower bound on the share of world trade that is driven by vertical specialization is intra-firm trade in intermediate goods. In USA intra-firm exports of intermediate goods accounted for about 15 per cent of total exports in 1999, the latest year available. The upper bound is trade in intermediate inputs as a share of total merchandise trade, which for comparison was 56.5 per cent of total exports in the U.S. in 1999. These measures represent a very broad range indeed and it is necessary to look at individual countries and sectors in more detail in order to get a more precise estimate of the importance of vertical specialization. Finally, it is noted that exports of intermediate inputs as a share of total world non-fuel exports was about 48 per cent in 2004. This share had not changed much over the 8-year period for which trade statistics in the BEC classification is available. This could indicate that outsourced intermediate input production has tended to cluster around the lead firm in the supply chain, and that the trade-off between gains from international specialization and increased trade costs discussed above has induced such clustering. Recent research suggests that international outsourcing of services is on the rise, however.11
11 See for instance WTO (2005) for a recent discussion and evidence.
11
III. CASE STUDIES
This section analyzes the extent of vertical specialization in six countries; the world’s three largest economies (USA, Japan and Germany) and three major developing countries – one on each continent (China, Brazil and South Africa). The case studies focus on two sectors, electronics and motor vehicles, and discuss trends in sourcing patterns in addition to developments in volumes and shares for each of the six countries. Additional detail is found in the statistical annex.
A. THE AUTOMOTIVE INDUSTRY
The automotive sector has gone through substantial structural changes since the early 1990s, notably a number of mergers and acquisitions. In 1964 there were 52 original equipment manufacturers (OEMs) while in 2003 the top 15 producers accounted for a world market share of 92 per cent in light vehicles (McKinsey, 2005). The core competences of the OEMs are design, engineering, assembly, marketing and financing. According to McKinsey the industry has outsourced all manufacturing activities there are to be outsourced and the assembly done in-house is largely automated and done by robots. Services, in contrast, are not outsourced but constitute the core of modern car manufacturers’ business. The McKinsey study argues that about a third of the services jobs in the sector could in theory be outsourced to a low-cost country, but so far less than half of a per cent of the service jobs have moved.
In spite of consolidation many of the largest producers, notably GM and Ford have been in more or less continual crisis for a decade and their credit rating was downgraded to “junk” in August 2005. There are various reasons for this. One is policy restrictions that prevent the industry from utilizing existing capacity fully. Above average tariffs combined with a number of industrial policy incentives have induced companies to invest in capacity as well as local content in many countries. These investments constitute sunk costs that make the industry less flexible in its response to changing demand patterns. Another problem which has plagued the American OEMs is that laying off staff as a response to declining market share and improved productivity has not reduced labour costs correspondingly. Some of the major car producers have in fact more
retired workers for which they have pension payment commitments than active workers. The Japanese OEMs in contrast are doing well both financially and in terms of technology and productivity growth. They have been able to improve productivity twice as much as the big three American producers over the past 25 years (Knupfer and Mercer, 2005).
Apart from the OEMs the industry consists of the systems integrators, first, second and third tier suppliers and the aftermarket. The systems integrators have close linkages to the OEMs or assemblers. They typically play a key role in organizing the supply chain and they undertake much of the R&D in the industry in close cooperation with the OEMs. Research results in new technical solutions to problems specified by the OEMs, while the systems integrators usually retain intellectual ownership to their innovations. Another important task performed by the systems integrators is to organize the production of modules such as brake-axle-suspension, dashboards etc. and ensure that interface requirements are met. The systems integrators follow the OEMs to new markets; i.e. when a car producer makes an investment abroad, the systems integrator would establish a commercial presence there too. Since the early 1990s there have been numerous mergers and acquisitions among the systems integrators which are now dominated by a few firms with global reach. This is therefore a market segment with high entry barriers and it is an unlikely entry point for newcomers from emerging and developing countries.
The first tier suppliers supply directly to the OEMs. They increasingly produce modules rather than individual parts, and they have both design and innovation capabilities. Some have a regional scope, but increasingly their contracts involve the supply of modules to all the OEMs’ plants at least for one model. As car assemblers aim at customizing as much as possible of parts and modules, consolidation can also be expected among the first tier suppliers, and entry barriers are likely to become higher also on this market segment.12 Nevertheless, first tier suppliers invest in production capacity if not in every developing
12 OEMs, assemblers and car producers are used interchangeably in this study.
12
country in which car assembly takes place, at least they are present in all regions. First tier suppliers have for instance followed the assemblers to Central and Eastern Europe and to Mercosur (Humphrey and Memedovic, 2003).
Second tier suppliers provide parts and components for the first tier suppliers. They often produce on the basis of designs provided by the customers and their production is not as capital and skills intensive as the first tier suppliers. Entry barriers are lower and firms from developing countries have entered this market segment. Nevertheless second tier suppliers face strict quality requirements and must deliver just in time. Third tier suppliers provide basic products and they compete mainly on price. The easiest entry point for developing country firms is, however, the aftermarket. Parts and components in this segment are obviously made according to existing designs and technology and delivery is less time sensitive than for parts that enter the assembly of new cars. China, for instance, has entered the world market through this route.
The relation between car manufacturers and suppliers is usually long-term contracts. A contract would at least last for the life span of a typical model which is 5-7 years (Knupfer and Mercer, 2005). Assemblers and systems integrators invest a lot in their suppliers and
the suppliers in return customize designs and technology. With long-tem contracts and relations that go beyond agreeing on a quantity delivered at a specific time at an agreed price, competitive bidding is not necessarily the rule and in any case competitive bidding would take place only at long intervals. Therefore the nature of supplier-customer relations can constitute an entry barrier.
The major markets for cars are segmented and different models and makes are sold for instance on the European and U.S markets. Sports utility vehicles constitute a much larger share of the U.S. market, probably due to differences in environmental policies in general and taxes on fuels in particular. Markets are also segmented due to differences in consumer tastes, income levels and driving conditions. Since markets differ, it makes sense to assemble cars close to each major market, while just-in-time technology induces suppliers to locate close to the assemblers. Trade and industrial policy measures have implied strong incentives for local sourcing and thus market entry through FDI for suppliers. Local content requirements have for instance been common in the industry, including in Brazil and South Africa, until it was ruled illegal under the WTO TRIM agreement.
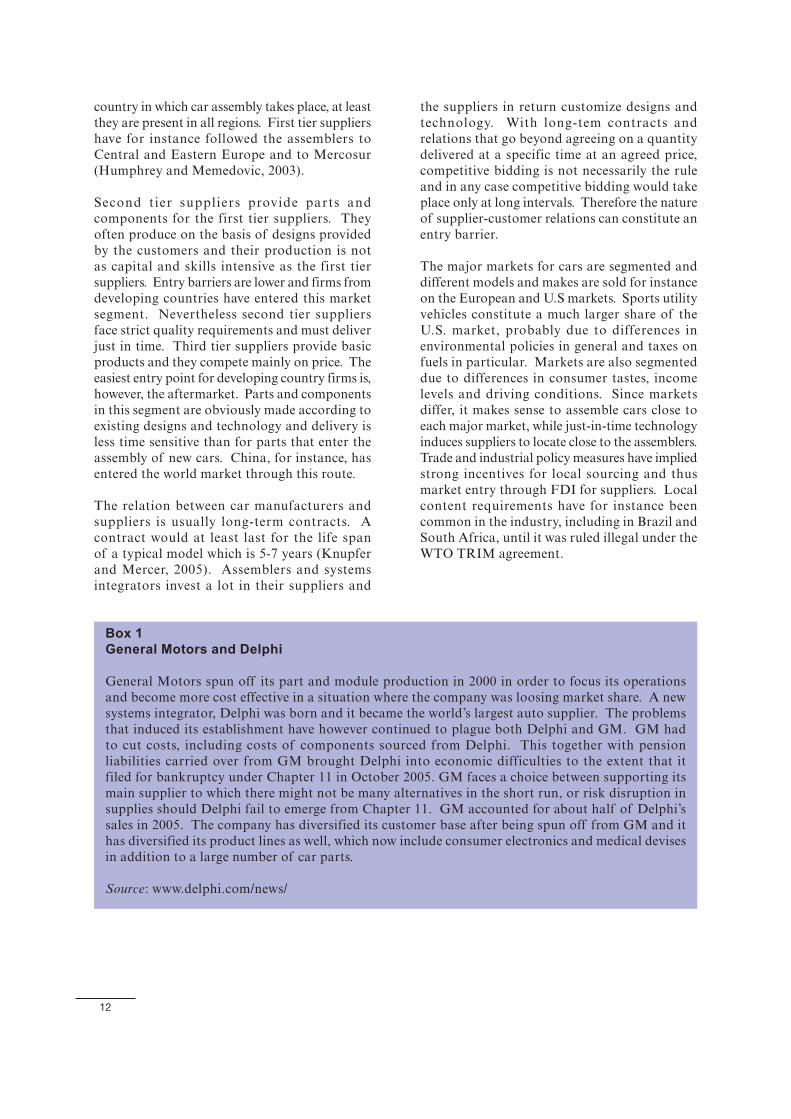
Box 1 General Motors and Delphi
General Motors spun off its part and module production in 2000 in order to focus its operations and become more cost effective in a situation where the company was loosing market share. A new systems integrator, Delphi was born and it became the world’s largest auto supplier. The problems that induced its establishment have however continued to plague both Delphi and GM. GM had to cut costs, including costs of components sourced from Delphi. This together with pension liabilities carried over from GM brought Delphi into economic difficulties to the extent that it filed for bankruptcy under Chapter 11 in October 2005. GM faces a choice between supporting its main supplier to which there might not be many alternatives in the short run, or risk disruption in supplies should Delphi fail to emerge from Chapter 11. GM accounted for about half of Delphi’s sales in 2005. The company has diversified its customer base after being spun off from GM and it has diversified its product lines as well, which now include consumer electronics and medical devises in addition to a large number of car parts.
Source: www.delphi.com/news/

13
Japan was the world’s largest exporter of cars in 1994, with a world market share of more than 20 per cent. Other large exporters were Germany (16 per cent), USA (12 per cent) and Canada (10 per cent). Germany had taken over as the world’s largest exporter of cars in 2004, with a market share of 19 per cent followed by Japan (14 per cent), USA (9 per cent) and Canada and France each about 7.5 per cent. The picture is somewhat different when looking at car parts.
Here USA was the largest exporter, followed by Germany and Japan as indicated in Chart 3. The reason why USA is a relatively larger trader in parts and components than in final products is probably its huge domestic market combined with the location of assembly plants in Mexico involving back and forth trade in components at different stages of processing.
Chart 3 Exports of parts and components of transport equipment (BEC category 53), US$ Bill
0
10
20
30
40
50
60
70
80
90
$ b
illio
n
1996 1997 1998 1999 2000 2001 2002 2003 2004
Brazil
China
Germany
Japan
USA
South Africa
Source: Comtrade
There is an order of magnitude difference between the three developed and the three developing countries in terms of export value. Brazil and South Africa accounted for less than one per cent of world trade in cars and parts and China for about 2.5 per cent in 2004. The automotive industry is nevertheless important to their domestic economies. In China, the car industry accounted for about 7 per cent of industry value added in 2003. In South Africa it accounted for about 17 per cent of total manufacturing sales value during the first three quarter in 2005. During the period between 2000 and end of September 2005, car manufacturing output increased by 37 per cent compared to manufacturing average of 18 per cent in South Africa.13 Germany’s rapid increase is noticeable
13 Source: Statistics South Africa, http://www.statssa.gov.za/timeseriesdata/excel_format.asp downloaded 2 December 2005. For China statistics are from the National Bureau of Statistics.
and stems from the extension of the industry’s supply chain into Central and Eastern Europe as will be discussed further below.
Table 3 presents the direction of trade in parts and components of transport equipment (BEC category 53). NIC 8 are Chinese Taipei, Hong Kong, China, Indonesia, Korea Rep., Malaysia, the Philippines, Singapore and Thailand; Latin America includes the Caribbean; MENA stands for Middle East and North Africa; other Europe includes all non-EU countries west of the Ural, including Russia while SS Africa is sub-Saharan Africa. The rest of the world (ROW) consists of Australia, New Zealand and the Pacific, where Australia accounts for most of the trade flows.

14
The regional dimension of trade in parts and components is clear. NAFTA dominates U.S. exports and imports of parts and components while EU dominates German trade and the share has increased as far as sourcing of imports are concerned. Japan has a strong trade relation with NAFTA in parts and components, but during the period in question sourcing of imports has been shifting towards Asia, particularly to the NICs and China. Brazil and South Africa are integrated in major OEMs production networks where European car makers have a strong presence in both countries. However, NAFTA has increased its share of Brazil’s trade during the period under analysis at the expense of other Latin American countries. The small and in many cases declining share of the developing countries other than China and the NICs is worth noticing.
An attempt has been made in this study to establish the determinants of vertical specialisation in the automotive sector. For this purpose the indices presented in Table 2 were regressed on a number of variables such as the market size, distance to major markets, various indicators of infrastructure and geography that could affect lead time and reliability of delivery. Regressions show that the import content of exports increases with the size of the exporting economy, but less than proportionally such that the import share of export value declines with market size. The explanation for this is probably simply that a larger market allows for a more diversified domestic supplier base. Distance from major markets as measured by the weighted average distance to all other countries (weighted by GDP) has a negative impact on the import content of exports, indicating that car producers located far away from the major markets need to be
Table 3 Direction of trade in parts and components of transport equipment
USA Japan Germany
Exports Imports Exports Imports Exports Imports
1996 2004 1996 2004 1996 2004 1996 2004 1996 2004 1996 2004
China 1.0 1.7 1.1 4.9 2.5 9.1 3.5 9.0 0.7 3.6 0.4 1.3
Japan 6.7 5.2 29.4 21.1 1.3 1.2 5.5 3.0
NIC 8 7.6 6.7 4.4 6.1 25.8 20.8 12.8 17.9 3.7 2.8 2.6 1.6
Other Asia 1.6 1.1 0.4 0.8 2.1 2.9 0.2 0.6 1.6 3.2 1.5 1.8
EU 25 21.8 23.4 23.0 23.5 15.2 16.6 23.7 24.8 70.6 65.3 70.8 76.1
Other Europe 1.5 1.3 0.6 0.6 0.5 0.5 0.2 0.4 3.0 3.1 2.7 3.1
NAFTA 48.7 49.2 37.6 39.1 43.7 39.6 57.1 46.4 12.8 13.2 14.5 10.7
Latin America 4.1 5.0 2.1 2.6 1.7 2.6 0.5 0.2 1.6 1.8 0.9 1.0
MENA 3.2 3.3 0.8 0.5 3.5 3.4 0.0 0.0 2.3 2.8 0.3 0.5
SS Africa 0.7 0.5 0.1 0.2 2.5 2.2 0.0 0.2 1.7 2.4 0.6 0.8
ROW 3.0 2.7 0.5 0.6 2.6 2.2 2.0 0.5 0.7 0.6 0.1 0.0
China Brazil South Africa
China 0.6 3.2 0.6 2.8 0.0 2.0 0.9 4.0
Japan 10.3 9.3 26.5 32.9 0.7 0.3 7.4 11.9 0.2 0.9 16.1 8.8
NIC 8 27.9 24.0 11.5 18.4 1.8 1.3 5.6 3.0 5.4 2.0 9.6 6.2
Other Asia 7.9 5.2 0.8 0.2 0.5 1.0 0.6 0.9 1.0 1.4 1.0 2.6
EU 25 9.4 15.0 29.1 29.6 13.8 20.8 44.8 37.8 49.6 61.6 41.9 56.5
Other Europe 0.7 0.7 5.5 0.9 0.1 0.3 0.2 1.4 0.7 1.2 0.3 0.7
NAFTA 24.3 31.2 21.7 11.5 32.6 38.2 22.7 31.3 13.6 12.9 24.0 17.5
Latin America 3.0 3.3 4.4 1.2 46.1 27.0 17.9 10.6 1.2 1.2 1.6 2.1
MENA 10.3 6.7 0.3 0.0 0.8 2.6 0.1 0.2 1.0 2.2 2.3 0.6
SS Africa 3.8 2.9 0.0 0.2 1.6 3.7 0.1 0.2 22.1 12.3 1.1 0.4
ROW 2.5 1.8 0.3 5.0 1.4 1.6 0.1 0.1 5.2 2.2 1.1 0.7

15
more self-sufficient in parts and components in order to operate a modern car plant with just-in-time delivery. Countries with good telecommunications infrastructure and efficient ports tend to have a higher import share in their export. This result underscores the importance of time and suggests that good infrastructure can to some extent compensate for remoteness. The relevance of telephone density (the number of fixed plus mobile lines per 100 inhabitants) indicates the importance of communication and B2B e-commerce in the sector. Finally, countries that control corruption well have a higher import content of exports. Again the time dimension could be important. Corruption causes delays and uncertainty about costs and lead time and force companies to source inputs closer to home. The results are presented in Table A.1 in the technical appendix.
1. USA
The importance of intermediate inputs in the automotive industry can be assessed from the input output table for the U.S. economy. The latest available is from 2003 and shows that for motor vehicles, the share of intermediate inputs purchased from other firms in total costs is more than 70 per cent. Out of this total about 42 per cent came from within the industry, e.g. from producers of parts and components classified under the industrial category 3361MV “Motor vehicles, bodies and trailers, and parts” and category 3364OT “Other transport equipment”. Compared to the Fordist assembly described in the introduction where only raw materials were purchased from outside the sector has gone through substantial structural changes. The input-output tables do not distinguish between locally produced and imported intermediates, so an indirect approach is needed to assess the internationalization of the U.S. automotive supply chain. The transport equipment sector paid $159.5 billion for inputs from within the industry in 2003, while imports of parts and accessories of the transport equipment sector for the same year was $83 billion.14 Thus, according
14 The total purchase of intermediates from within the industry is from the input-output table while data on imports is from Comtrade, BEC category 53. The two classifications do not perfectly correspond to each other and the data thus only gives a rough indicator of import share.
to this rough indicator, more than half of parts and accessories are imported. Given the relatively low share of trade in the U.S. economy, this is a high figure, suggesting that the automotive industry is significantly more internationally oriented than average for U.S. industries.15
As indicated in Table 3, regional trade plays an important role, and more so for parts and components in the automotive sector than for trade in general. Trade in this sector is also highly concentrated with the 10 largest countries accounting for about 90 per cent of the total (see the annex). Outside the region Japan is the most significant trading partner, reflecting Japanese investments in USA and sourcing of inputs from their parents’ supply networks. The other most significant development is the emergence of China among the top 10 suppliers. China is, however, mainly supplying replacement parts.
Recent research has found that capital-intensive intermediate goods tend to be imported within boundaries of multinational firms (Antràs, 2003). The automotive industry is relatively capital-intensive and multinational firms therefore are likely to play an important role for trade in parts and components. An analysis of bilateral trade between USA and Mexico supports this. In 2001, the U.S. imported about $36 billion worth of transport equipment from Mexico of which about $14 billion were parts and accessories. At the same time USA exported $16 billion of which about $11 billion were parts and accessories. Most of these exports appear to be to foreign affiliates.16 U.S. exports are however dwarfed by sales from U.S. affiliates in Mexico, which was $35.7 billion, more than double the export figure. Out of these sales about $26 billion (from total Central America) were exported back to the U.S. parent. This amount constitutes more than 70 per cent of total U.S. imports from Mexico in the transport equipment sector. From this it appears that vertical specialization in the USA – Mexico context is largely driven by multinational
15 According to the World Bank’s World Development Indicators, the value of U.S. merchandise trade was 19 per cent of GDP in 2003.
16 Intra-firm trade is reported for Central America as a whole due to confidentiality considerations. Mexico is by far the largest U.S. trading partner in this region. Exports to foreign affiliates in Central America were about $17 billion in 2001 (BEA, 2005).
16
companies’ production networks. The break-down of trade in parts and components and finished goods also suggests that parts and components are shipped from USA to Mexico for further processing and sent back to the U.S. as modules or finished cars. It is also noted that among the 15 largest affiliates of foreign multinational companies in Mexico (ranked by sales), 8 produce motor vehicles. Five of these are from USA, two from Germany and one from Japan (UNCTAD, 2005a).
FDI in Canada has accounted for between a third and more than two fifths of total U.S. outward FDI stock in the transport equipment sector since the year 2000, so intra-firm trade probably plays a major role in intra-industry trade between the U.S. and Canada as well. However, Canada tends to import parts and accessories and export finished transport equipment, while Mexico appears to import parts which are processed into modules and then exported back to USA. The data also indicates that Mexico specializes in more labour-intensive parts and components and assembly than does Canada. Gross output per worker and value added per worker are for instance quite similar in the U.S., Canada and Japan, while in Mexico it is about a third of the average for the other three.17 Thus, while intra-industry trade appears to be largely vertical in trade with Mexico, horizontal intra-industry trade appears to be more important in trade with Canada.
In general the correlation between the stock of outward FDI in the transport equipment sector and imports of parts from the host country is high and significant (the correlation coefficient is 0.73 and it significant at a one per cent level). Furthermore, the stock of outward FDI alone explains more than half of the variation in sourcing. There is an even stronger correlation between U.S. exports of parts and accessories and U.S. outward investment in the transport equipment sector. The correlation coefficient is 0.88 and it is significant at a one per cent level, and a simple OLS regression including FDI stocks as the only independent variable explains 77 per cent of the variation in exports
17 Gross output and value added per worker are calculated from the OECD national accounts database, converting local currencies to US dollars using the exchange rates from the same database.
of parts and accessories. These results suggest that much of the observed international vertical specialization in the car industry takes place within multinational companies where American producers locate parts of their supply chains abroad.18
We would also expect to find a close relation between imports of car parts and inward FDI to USA. Japanese car production plants, for instance, source inputs from their parents or from affiliates in third countries (for instance Mexico). There is a positive correlation of 0.53, again significant at a one per cent level, but this relation explains only 27 per cent of the variation in the sourcing of imports. The link between inward investment and trade is probably weaker than for outward investment because the stock of outward investment is significantly larger and because a local supplier network is readily available in USA.
A strong correlation between trade flows and FDI does not necessarily mean that trade in car parts is determined by FDI. It is probably the case that FDI and trade are both determined by the same factors such as the host/exporting/importing countries’ GDP, openness to trade, infrastructure, general business climate and distance from USA. It is also likely that local suppliers to the U.S. affiliates in the host countries participate in the production network, such that trade with independent local producers is also positively related to FDI.
2. Japan
The Japanese automotive sector has by and large avoided the problems faced by the “big three” U.S. producers. Productivity growth has continued, market shares have increased steadily in most major markets and the companies have remained profitable. Otherwise the structure of the Japanese sector is similar to that described for the U.S. Intermediate share of gross output is about 70 per cent, the sector exports about 30 per cent of its output, which is somewhat higher than the U.S. while import penetration is
18 The statistical analysis is presented in the technical annex.

17
much lower at only about 6-7 per cent.19 From Table 3 above it is worth noticing that Asia has increased its market share in Japan by 11 percentage points in this relatively short period, mainly at the expense of NAFTA. It is also interesting to note that imports of car parts almost doubled in nominal dollar terms from 1996 to 2004 while exports increased by less than a third. Japan still maintains a large trade surplus in the automotive sector, however. The sharp increase in Asia’s market share represents new trade and is compatible with outsourcing of labour-intensive production stages as observed by Ito and Fukao (2004). Among individual trading partners, USA dominates and the largest 10 suppliers accounted for almost 90 per cent of total in 2004. Exports of parts and components from Japan largely serve Japanese overseas car manufacturing plants (KPMG, 2005).
The role of multinational companies is significant also in the Japanese supply chain. Lack of data prevents a similar statistical analysis of the relation between trade and FDI flows as conducted for the United States, but the Ministry of Trade and Industry provides data on the operations of foreign affiliates in the transport sector on a regional basis and including some major countries such as the United States and China. Comparing the data on operations of foreign affiliates in the transport equipment sector as a whole, sales by foreign affiliates were about 1.5 times higher than exports from Japan in 2004, while foreign affiliates’ exports back to Japan accounted for about 15 per cent of total imports. These numbers are significantly lower for trade and investment relations with Europe. Imports from foreign affiliates in Europe were less than 1.5 per cent of total imports from Europe while sales by foreign affiliates were about the same as exports from Japan. In contrast Japanese foreign affiliates accounted for two thirds of imports to Japan from Asia. Finally, in North America sales by Japanese affiliates are about twice as high as exports from Japan. These figures suggest that the Japanese transport equipment manufacturers in Europe and North America are embedded in regional supply chains, where both local suppliers and affiliates of the major
19 The figures are estimated from the OECD input-output tables. Import penetration is calculated as the value of imports divided by (gross output – exports + imports); i.e. total domestic end use.
Japanese suppliers take part, while in Asia trade takes place largely within Japanese multinational enterprises.
Kimura and Ando (2005) find that among the Japanese machinery sector investors, the car manufacturers are different. The share of affiliate sales going to the host market is much larger and the share of intra-regional trade in parts and components much smaller than for machinery in general. For car manufacturers FDI seems to be mainly market-seeking and the supply network is replicated in the host countries.
None of Japan’s major suppliers depend on Japan as a market. Only about 6 per cent of U.S. exports of parts and components go to Japan and the share has been stable throughout the decade. For the European suppliers, only about 1 per cent of total exports of parts and components go to Japan. The Asian suppliers have a somewhat higher share, with Indonesia and the Philippines’ exports being most oriented towards Japan with a share of about 20 per cent and rising. The small shares of exports going to Japan in spite of having a large market share there can be explained by the low import penetration in the Japanese automotive sector. According to the Japanese input-output table for 2000, imported intermediates accounted for 4.4 per cent of total intermediates of which about 40 per cent came from the U.S.20
Many concepts and aspects of modern supply chain management and just-in-time technology comes from the Japanese car industry, notably Toyota. One would therefore expect that the Japanese industry would still differ from its foreign competitors in terms of business practices and supplier relations. A recent study focusing on first-tier suppliers finds that this is indeed the case. Japanese first tier suppliers are less dependent on a single customer and they manage a larger number of second tier supplier relations. Their labour productivity is higher than their U.S. and U.K. competitors and their defect rates are lower. Finally their inventories are lower and they receive much more frequent deliveries from suppliers. Thus, first-tiers suppliers received deliveries from second tier suppliers every six hours in Japan compared to every 25 hours
20 The input-output table was downloaded from http://www.meti.go.jp/english/statistics/index.html

18
in the U.S. in 2001 (Oliver et al., 2002). Such performance in terms of timeliness is probably only possible when the manufacturer and first and second tier suppliers are located close to each other, which could explain the low import penetration in Japan. Furthermore, it suggests that in industries where just-in-time technologies are introduced, distance is likely to become more important for the choice of suppliers.
3. Germany
Germany is the world leading exporter of cars and car parts and had a trade surplus of about $100 billion in 2004. Recent years have seen a restructuring of the sector with vertical specialization as one of the main features. This can be seen from a declining value added share in gross output; from about 36 per cent in 1994 to 25 per cent in 2002, the latest year available in the OECD STAN database. The share of intermediates and the extent of outsourcing are somewhat higher in Germany than in the United States and Japan. A declining value added share corresponds to an increasing share of output value being purchased from outside firms. This is partly due to outsourcing of activities that were previously undertaken by the car producers themselves and partly due to the fact that motor vehicles are increasingly being fitted with numerous components largely from the electronics sector. According to a recent study by Schintke and Weiss (2004), the car manufacturers largely source from domestic firms while imports of intermediate inputs as a share of total gross output have actually declined. Data from the OECD STAN database shows that German car makers exported 58 per cent of total output in 2002, up from 53 per cent in 1994, while import penetration of finished cars also increased slightly from 35 to 37 per cent.
Also in Germany sourcing of inputs appears to have become more geographically concentrated during the past decade. Asia has become a more important destination of German exports of parts and components, however, reflecting German car companies’ investments in China and intra-firm trade in parts and components. Looking at individual countries, it is clear that there has been a switch in sourcing from EU 15 to the new members of the European Union, where particularly Hungary, Poland and the Slovak republic have gained market share. While sourcing
has become more concentrated to Europe, it has become less concentrated within Europe with more countries entering the German automakers’ supply chains. This tendency has become even stronger when looking at the destination of German car manufacturers’ exports of parts and components. The top ten destinations received only 60 per cent of the total in 2004, down from 73 per cent in 1996.
The German market is important for most of its largest suppliers of parts and components. The supplier most dependent on the German market is the Slovak Republic. Germany’s share of its total exports increased from 40 to 75 per cent during the period 1997- 2004. The other Central and Eastern European countries have seen an inverted u-shaped development in the share of their exports going to Germany. The share peaked around 2000 at 52, 45 and 70 per cent respectively for the Czech Republic, Poland and Hungary. Thus, it appears that German investments have opened the door to the EU automotive markets for many Central and Eastern European countries. Audi and Opel have for instance built engine assembly plants in Hungary, which assemble parts imported from Germany for exports back to Germany and other EU countries (Humphrey and Memedovic, 2003).
Data on German foreign investment by industry is not available, but it is well known that Volkswagen has produced cars in China in joint ventures with local firms since 1983 and is the largest car maker in China (Ernst & Young, 2005). The relatively low exports of parts and components to China suggest that the assembly plants in China largely source their inputs locally and thus that the suppliers have invested there too.
Germany receives less than 5 per cent of both Japan and USA’s exports of car parts and accessories, while the Western European suppliers send between 15 and 30 per cent of their car parts exports to Germany. For the U.K. and France the share has been increasing, while there has been a declining trend in Spain. The three suppliers appear to be converging towards a share of about 15 per cent, Spain from above, the other two from below. Spain used to be the preferred location of production of low-end cars, a role Central and Eastern Europe has taken over in recent year.
19
4. China
China produced 2.3 million passenger cars in 2004 (excluding mini-vans and sports utility vehicles), most of it for the local market. The car industry accounted for about 7 per cent of industrial value added in 2003 (National Bureau of Statistics of China, 2005). Only 2 per cent of total production was exported, while import penetration was also around 2 per cent (KPMG, 2005). The state plays an important role in the Chinese automotive industry and the industry is listed among the core industries in which the government will concentrate state holdings. Nevertheless, a significant degree of non-state holding will be allowed in the sector (OECD, 2005) and most of the major foreign automakers have a presence in the country, albeit through joint ventures with local firms. Of these Volkswagen of Germany is the largest producer and captured more than half the local market for passenger vehicles in 2002. Its market share has, however, more than halved since then, not because Volkswagen has not been successful, but because of rapid market growth and entry of a number of other major producers in the country (KPMG, 2005).
Both foreign and local producers focus on the domestic Chinese market, which has been growing at break-neck speed over the past decade with annual sales growth at more than 20 per cent on average. However, local producers are widely seen to lack the capacity for producing the required design, quality and fuel economy for word markets and integration into world markets is not foreseen for the near future. Furthermore, the local market is set to continue its rapid growth since car ownership is still very low in China, only about 6 cars per 1000 inhabitants in 1999, compared to 27 for low-and middle-income countries (World Development Indicators, 2005). Finally, since most of the foreign investors in China have excess capacity in their own markets, they have little incentives to use China as an export base.
The supplier industry is highly fragmented and 1700 components manufacturers, of which 450 foreign invested companies are registered. As opposed to the other developing countries, China has a locally owned supplier base. The total value of this market was estimated at about $9 billion in 2004 (KPMG, 2005). Imports of
parts and components the same year was about $3 billion.21
China’s car industry’s sourcing of intermediate inputs is increasingly focussed on Asia, while exports have become less concentrated over time. This is probably explained by the introduction of modern production methods with the arrival of the major car producers which import parts and components from their major suppliers established in the region. In addition China’s exports are mainly for the after-market. China runs an overall deficit in car parts of about $1.2 billion on total exports of about $14.5 billion. Imports have increased five-fold in nominal dollar value from 1996 to 2004, while exports have increased 8-fold.
5. Brazil
The automotive industry was established in Brazil in the 1950s. Initially it enjoyed high protective tariffs and local content requirements ensured a local supplier base. The industry produced mainly small cars for the local market. Over time the industry has become internationalized as a consequence of policy reform in the country and falling domestic and regional demand during the economic crisis and stagnation years of the 1980s. Thus, value added in the automotive sector actually declined during the period 1997 to 2003 at an average annual rate of about 2.5 per cent, in spite of growing exports.
Foreign direct investment plays an important role in the automotive industry and the sector has received the highest rates of FDI inflows since the mid 1990s with an accumulated inflow between 1995 and 2002 of $7.7 billion, accounting for almost a quarter of total FDI in manufacturing. Much of the investments have been greenfield investments by the major global assemblers, notably European assemblers where Volkswagen and Fiat featured prominently (UNCTAD, 2005b). These have specialized in the production of small cars for the local and regional market, but also so-called completely knocked down cars for assembly in other developing countries (Humphrey and
21 The KPMG data on total sales and the Comtrade data on imports are not necessarily comparable in terms of sector classif ication and coverage. The suggested 33 per cent import penetration should therefore be seen as indicative rather than hard facts.

20
Memedovic, 2003). The industry has been subject to federal and regional investment incentives and the sector is still protected by relatively high tariffs. Most major assemblers are present in the country and their major suppliers likewise. The local supplier base has consolidated in the processes and many of the leading local firms have been taken over by multinational first tier suppliers and become integrated into their regional supply network. Following the entry into force of Mercosur in 1995, Brazil and Argentina’s automotive industries have become increasingly integrated in spite of the fact that the car industry is excluded from the agreement. Most of Argentina’s exports of both cars and parts go to Brazil, while Brazil is somewhat less dependent on Argentina.
During the period from 1997 to 2004 trade patterns have changed substantially.22 Brazil was a net importer of cars and parts in 1997 with a trade deficit of about $1.5 billion on 1997. This had turned into a surplus of $7.8 billion in 2004. Total exports were $14 billion out of which parts and accessories accounted for about $6 billion. The same development from deficit to surplus has taken place for finished cars. Total exports of cars and parts doubled in nominal dollar terms between 1997 and 2004, while the corresponding figure for parts and accessories was an increase of more than 50 per cent. Imports of parts and accessories increased by only a quarter during the same period, suggesting that Brazil increasingly assembles vehicles from locally produced parts and accessories and thus a clustering of the industry within Brazil’s borders. Foreign-owned first tier suppliers feature prominently in this development.
The regional dimension of imports of cars and parts largely reflects the relative size of production of the major assemblers in the country, suggesting that trade in parts and components is largely intra-firm or that the assemblers’ home country systems integrators and first tier suppliers export some of the components from the home country in addition to establishing a local base. After all the Brazilian market is relatively small and cannot support local production of the full range of inputs. On the export side, the Americas
22 1997 was the year of the Asian financial crisis, which also affected the Brazilian economy.
have taken a very large, but declining share of Brazil’s exports.
Underlying the regional shifts are some interesting developments at the country level. First, the relative stability of the share of the Americas in Brazil’s sourcing of parts and components conceals a decline of about 30 per cent in current dollar value terms of imports from Argentina, following the economic crisis there. The gap has largely been filled by imports from USA which increased its market share from 19 per cent in 1997 to 28 per cent in 2004. There has also been a shift within the large car manufacturing nations where Japan and France have gained market shares largely at the expense of Italy, whose exports to Brazil in current dollar terms have dropped by as much as 60 per cent between 1997 and 2004. This reflects problems at Fiat whose world market share has fallen sharply, and FDI inflows by the major Japanese and French OEMs have filled the gap.
There have also been big shifts in Brazil’s exports of parts and accessories. Although small in absolute value it is interesting to observe a large increase in exports going to Africa. This reflects emerging South-South trade in parts where Brazil and South Africa are developing intra-industry trade linkages in the automotive sectors, particularly in heavy commercial vehicles. Brazil is also negotiating a free trade agreement with the Southern African Customs Union (WTO, 2004). The crisis in Argentina is also reflected in Brazil’s exports to this country, which declined by about 30 per cent in current dollar terms between 1997 and 2004. There are finally interesting shifts within the Americas, where Mexico and Venezuela have increased their importance. Exports to Mexico have in fact more than tripled from 1997 to 2004.
6. South Africa
Ford Motors established the first assembly plant in South Africa in 1924, and General Motors followed in 1926. Later the major German car producers established assembly plants in South Africa (Volkswagen, BMW and Mercedes), all producing for the local and regional market. The South African government was concerned about the very low local content of these vehicles and introduced a local content program in the 1960s. Six such programs followed one after the other
21
during the period 1961-95 and combined measures such as tariff protection of both cars and parts and import permits subject to relatively complex rules (Barnes 2000). Local producers were given substantial tariff protection, the effective tariff rates went as high as 100 percent and more, and induced a number of foreign firms to set up production in South Africa rather than exporting parts to the country. In addition, the South African state through its Industrial Development Corporation (IDC) set up an engine factory in joint venture with a German firm, which provided the technology.23 The program indeed did increase the local content of the car industry, and a local value chain was established, but at a very high cost to consumers. The program also resulted in small plants producing a wide variety of models in small volumes.
During the sanctions period the American car producers sold their South African plants to local firms, which continued production, while the German producers stayed in the country.24 The car parts producers also divested and production continued by local firms producing on licenses. Two Japanese latecomers to South Africa, Toyota and Nissan, entered the market through franchising production to local firms. The foreign investors returned during the second half of the 1990s, when General Motors bought a 49 percent stake in Delta motors, and Ford bought a 45 percent stake in Samcor and took over management control. Likewise the Japanese carmakers bought minority stakes in the local franchise firms (Barnes 2000).
The return of the multinationals started the process of reintegration of the South African car industry into the world economy and the global production networks of the multinational car and parts makers. A new program, the Motor Industry Development Program was introduced in 1995 and was more export oriented. It is scheduled to last until 2012 and has no local content requirements. It prescribes a gradual reduction of tariff protection from 34 per cent in 2005 to 25 per cent in 2012, while providing
23 IDC invested in new ventures on a commercial basis, often in joint ventures with foreign companies. It also made low-interest investment loans to local companies.
24 Ford was sold to Samcor, a fully owned Anglo American company, and GM was sold to Delta Motors, a local company.
a range of incentives aiming at encouraging integration into the global automotive industry, rationalization and technology upgrading. Imports from the European Union qualify for a 5 per cent tariff rebate following the free trade agreement with EU (Department of Trade and Industry, 2005). A comprehensive restructuring has followed. The number of makes being assembled in South Africa has declined. The car parts industry, which has remained under local ownership, has become more specialized and international sourcing of parts and exports of car parts have grown rapidly. In other words, lifting of sanctions, a sharp reduction in tariffs on both cars and parts, and the return of the multinationals in the car industry have resulted in extensive intra-industry trade both vertically and horizontally in this sector.
Production of light vehicles increased from 314 198 in 1999 to 436 500 in 2004. Out of these 58 928 were exported in 1999 and 120 500 in 2004. The export share has in other words increased. Import penetration was 21.4 per cent in 2003. The OEMs import capital-intensive components such as engines, gearboxes and electronic components, while other parts and components are mainly produced domestically. The most significant exports in car parts are catalytic converters where South African producers enjoy a world market share of about 15 per cent. The sector benefits from access to locally produced platinum and palladium which constitute an important part of catalytic converters. There were 278 first-tier suppliers and more than 300 lower tier suppliers of parts and components in South Africa in 2004 (Department of Trade and Industry, 2005).
Africa was a significant destination for South African parts and components to the transport equipment sector in 1997. Presumably a large share of exports to other African countries is for the after-market, since these countries do not have any significant production of motor vehicles. However, as the industry has become more integrated in international production networks, notably German car manufacturers’ production of right-hand drive passenger cars, the importance of Europe as a trading partner in parts and components has increased both on the exports and imports side. Multinational companies, notably the OEMs established in South Africa are the main channels through which the sector integrates with international
22
production networks. Exports of parts by local firms are mainly through these OEMs and their first-tier suppliers, while imports of parts are mainly by the OEMs. South Africa’s exports in the transport equipment sector almost trebled from 1997 to 2004. The country is nevertheless a net importer in the sector, both for total trade and trade in parts and components. Germany is one of the most important sources of imports of parts and components along with the US, UK and Japan. However, developing countries such as China and Brazil are also among the ten largest sources of car parts to South Africa.
B. ELECTRONICS
According to a study by Farrell (2004), industries using components that are characterized by a high value to weight ratio and having a production process that can easily be separated in time and space are the most likely industries to engage in international outsourcing. She ranks consumer electronics on top of the list of vertically specializing industries. Electronics is also the sector with the highest average import content of exports among the manufacturing sectors included in the GTAP database. Electronics is categorized as a high-technology sector, although it does contain simple assembly processes where low wages are a competitive factor. Transport costs are probably unimportant due to the low weight to value share. Moreover, air transport is used more frequently in this sector, precisely because of the low weight to value ratio, which reduces the relevance of distance.
East and South East Asia has become the most dynamic region in the world as far as electronics are concerned. Ginzburg and Simonazzi (2005) argue that the Asia-Pacific region (the US, Japan, Korea Rep., China Taipei, Singapore, Hong Kong, China and the Asean countries) formed a system of complementary producers where USA was the technology leader, Japan had a role as a structural mediator, while the others were catching up during the 1980s. The 1990s saw a relative decline in USA and Japan as producers and traders, while some of the latecomers reached and even moved the technology frontier in some products, e.g. the Republic of Korea in telecommunications and China, Taipei in DRAM. The separation of design and fabrication in some electronic products, for instance micro-components, has opened new opportunities for the former leaders, i.e. USA and Japan to become leading manufacturers without factories in the electronics sector, specializing in R&D and design.25
Lal l et al . (2004) have studied vert ical specialization in electronics focusing on East Asia and Latin America and find that the sector is more fragmented than the automotive sector both in terms of geographical dispersion and in terms of outsourced products. They also find that the sector is better integrated in East Asia than in Latin America. The latter region is very much dominated by Mexico. The study provides a useful distinction between intermediate goods and final goods in the electronics sector, which is applied in the case studies in this paper. It is based on the SITC rev 2 classification system and includes 4-digit sectors as follows:
25 The authors of the study argue that the electronics sector in the Asian-Pacific region can be described by the “f lying geese” model of trade and development.

23
Strictly speaking semiconductors are not final products, but they are generic components used by most other industries. Intermediate inputs for 3-digit category 776 are “Piezo-electric crystals mounted, parts of 776” (category 7768).
Trade patterns in electronics have changed substantially over the past decade. Japan was the most important exporter of electronics in 1994, with a world market share of 18 per cent, followed by USA (15 per cent), Singapore and Germany, both about 7.5 per cent world market share. By 2004 China had become the world’s largest exporter of electronics with a world market share of 13.5 per cent, followed by USA (10 per cent), Japan (9 per cent), Germany (8 per cent) and Hong Kong (7 per cent). Brazil and South Africa are marginal players in the world markets for electronics products. In 2004 their exports accounted for 0.1 and 0.04 per cent of
Table 4 Finished products and parts and components in the electronics sector, SITC version 2 classification
Main product Finished product Parts and components
Code Code
Offi ce machines and automatic data processing machines
7511 Typewriters, check writing machines 7591 Parts of and accessories suitable for 7511, 7518
7512 Calculating machines, cash registers
7518 Offi ce machines nec
7521 Analogue and hybrid data processing machines 7599 Parts of and accessories suitable for 7512, 752
7522 Complete digital data-processing machines
7523 Complete digital central-processing units
7524 Digital central storage units, separately consigned
7525 Peripheral units, including control and adapting units
7528 Off-line date processing equipment nec
Television, radio receives, gramophones and telecom equipment
7611 Television receivers, colour 7649 Parts of apparatus of 76 (including TV, radio, gramophones telecom equipment)
7612 Television receivers, monochrome
7621 Radio-broadcast receivers for motor vehicles
7622 Radio-broadcast receivers portable, including sound recorders
7628 Other radio broadcast receivers
7631 Gramophones and record players, electric
7638 Other sound recorders and reproducers
7648 Telecommunications equipment
Thermionic, cold and and photo-catode valves (semiconductors)
7761 Television picture tubes, cathode ray 7768 Piezo-electric crystals mounted, parts of 776
7762 Other electronic valves and tubes
7763 Diodes, transistors, similar semiconductor devises
7764 Electronic microcircuits
world exports respectively.26 In South Africa radio, television and communication equipment production has in fact stagnated over the past five years. Exports of intermediate electronics products for the six countries studies are depicted in Chart 4.
26 Calculated from Comtrade data using the definition of electronics presented in Table III.1.

24
Chart 4 Exports of parts and components, electronics, US$
0
5
10
15
20
25
30
35
40
45
50
1994 1995 1996 1997 1998 1999 2000 2001 2002 2003 2004
$ b
illio
n Brazil
China
Germany
Japan
USA
South Africa
Source: Comtrade
The stellar performance of China is striking. Japan and USA suffered a decline in exports following the burst of the dot.com bubble in 2001, and had not fully recovered in 2004. Brazil and
South Africa are tiny exporters compared to the other four. The regional composition of exports and sourcing of inputs is presented in Table 5.
Table 5 Direction of trade in parts and components of electronics
USA Japan Germany
Exports Imports Exports Imports Exports Imports
1994 2004 1994 2004 1994 2004 1994 2004 1994 2004 1994 2004
China 1.5 4.0 3.5 26.3 2.9 16.5 9.3 37.7 1.4 3.2 3.7 14.2
EU 25 32.7 25.2 8.4 8.7 20.2 21.9 7.0 3.4 58.3 64.2 35.3 35.6
Japan 11.0 5.6 32.7 16.2 2.0 1.2 16.9 14.9
Latin America 8.5 8.6 0.4 0.6 0.8 1.0 0.1 0.1 2.2 0.9 0.1 0.6
MENA 2.8 1.6 0.7 0.8 0.4 0.3 0.2 0.4 5.1 3.8 1.1 0.5
NAFTA 22.0 34.0 19.3 14.3 40.4 23.2 36.2 12.4 10.9 5.7 25.2 11.7
NIC 8 15.3 16.3 34.4 32.5 33.5 35.4 46.8 45.6 6.3 5.1 15.8 20.7
Other Asia 1.2 1.2 0.1 0.2 0.3 0.7 0.1 0.3 2.0 2.3 0.1 0.2
Other Europe 1.5 1.2 0.2 0.1 0.3 0.2 0.1 0.1 10.0 11.3 1.7 1.4
SS Africa 0.6 0.5 0.0 0.0 0.2 0.1 0.0 0.0 1.5 2.0 0.1 0.1
ROW 2.9 1.7 0.3 0.2 1.1 0.8 0.2 0.0 0.4 0.3 0.1 0.1
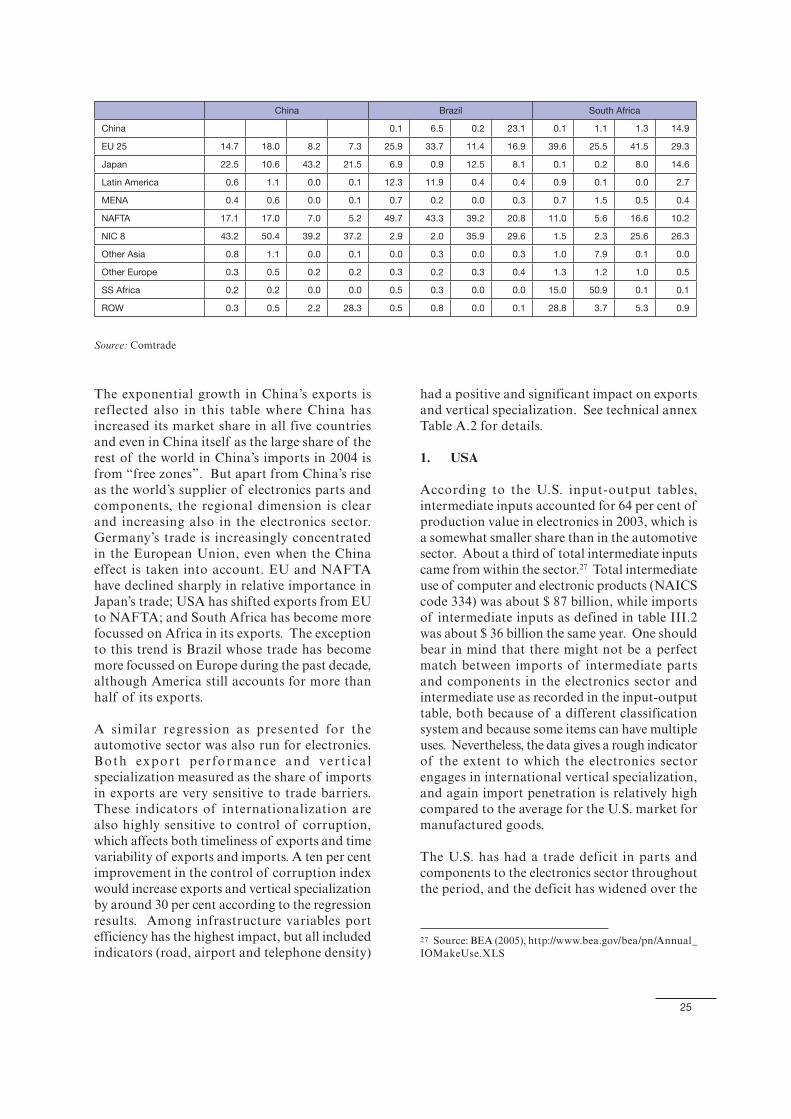
25
The exponential growth in China’s exports is reflected also in this table where China has increased its market share in all five countries and even in China itself as the large share of the rest of the world in China’s imports in 2004 is from “free zones”. But apart from China’s rise as the world’s supplier of electronics parts and components, the regional dimension is clear and increasing also in the electronics sector. Germany’s trade is increasingly concentrated in the European Union, even when the China effect is taken into account. EU and NAFTA have declined sharply in relative importance in Japan’s trade; USA has shifted exports from EU to NAFTA; and South Africa has become more focussed on Africa in its exports. The exception to this trend is Brazil whose trade has become more focussed on Europe during the past decade, although America still accounts for more than half of its exports.
A similar regression as presented for the automotive sector was also run for electronics. Both export per for mance and ver t ica l specialization measured as the share of imports in exports are very sensitive to trade barriers. These indicators of internationalization are also highly sensitive to control of corruption, which affects both timeliness of exports and time variability of exports and imports. A ten per cent improvement in the control of corruption index would increase exports and vertical specialization by around 30 per cent according to the regression results. Among infrastructure variables port efficiency has the highest impact, but all included indicators (road, airport and telephone density)
had a positive and significant impact on exports and vertical specialization. See technical annex Table A.2 for details.
1. USA
According to the U.S. input-output tables, intermediate inputs accounted for 64 per cent of production value in electronics in 2003, which is a somewhat smaller share than in the automotive sector. About a third of total intermediate inputs came from within the sector.27 Total intermediate use of computer and electronic products (NAICS code 334) was about $ 87 billion, while imports of intermediate inputs as defined in table III.2 was about $ 36 billion the same year. One should bear in mind that there might not be a perfect match between imports of intermediate parts and components in the electronics sector and intermediate use as recorded in the input-output table, both because of a different classification system and because some items can have multiple uses. Nevertheless, the data gives a rough indicator of the extent to which the electronics sector engages in international vertical specialization, and again import penetration is relatively high compared to the average for the U.S. market for manufactured goods.
The U.S. has had a trade deficit in parts and components to the electronics sector throughout the period, and the deficit has widened over the
27 Source: BEA (2005), http://www.bea.gov/bea/pn/Annual_IOMakeUse.XLS
China Brazil South Africa
China 0.1 6.5 0.2 23.1 0.1 1.1 1.3 14.9
EU 25 14.7 18.0 8.2 7.3 25.9 33.7 11.4 16.9 39.6 25.5 41.5 29.3
Japan 22.5 10.6 43.2 21.5 6.9 0.9 12.5 8.1 0.1 0.2 8.0 14.6
Latin America 0.6 1.1 0.0 0.1 12.3 11.9 0.4 0.4 0.9 0.1 0.0 2.7
MENA 0.4 0.6 0.0 0.1 0.7 0.2 0.0 0.3 0.7 1.5 0.5 0.4
NAFTA 17.1 17.0 7.0 5.2 49.7 43.3 39.2 20.8 11.0 5.6 16.6 10.2
NIC 8 43.2 50.4 39.2 37.2 2.9 2.0 35.9 29.6 1.5 2.3 25.6 26.3
Other Asia 0.8 1.1 0.0 0.1 0.0 0.3 0.0 0.3 1.0 7.9 0.1 0.0
Other Europe 0.3 0.5 0.2 0.2 0.3 0.2 0.3 0.4 1.3 1.2 1.0 0.5
SS Africa 0.2 0.2 0.0 0.0 0.5 0.3 0.0 0.0 15.0 50.9 0.1 0.1
ROW 0.3 0.5 2.2 28.3 0.5 0.8 0.0 0.1 28.8 3.7 5.3 0.9
Source: Comtrade

26
period.28 And it had an even larger deficit in final goods in the sector. The Americas’ share in U.S. imports of finished electronics goods have increased somewhat during the same period (from 29.5 to 33.2 per cent), suggesting that outward processing within the region could be an important driving force. Although the sourcing of parts and components in the electronics sector is highly concentrated – the largest three countries account for more than half of the market, the sourcing is more geographically dispersed than in the automotive sector. Turning to individual countries, Japan was by far the most important source of intermediate imports in 1994, while Canada and Mexico are the only non-Asian countries to reach a market share above 5 per cent. The major shifts during the decade are within Asia. China has emerged as a formidable supplier, and also Malaysia has made substantial gains, while Thailand is a new entrant among the top ten suppliers (see the statistical annex).
Multinational companies play an important role also in the electronics sector. The sales of U.S. foreign affiliates amounted to $207 billion in 2003, compared to total exports of about $ 103 billion. Sales by U.S. affiliates abroad were in other words more than double the value exported from USA. Of these sales $42 billion was exported to USA, of which about $30 billion went back to the parent. Intra-firm trade is thus important, but less so than in the automotive sector. This impression is supported by statistical analysis which finds that although there is a positive and significant correlation between exports of parts and components and outward foreign direct investment, it only explains about ten per cent of the variation (see technical annex).
The three largest individual country sources of intermediate inputs are China, Japan and Malaysia. Both Japan and Malaysia have become less focussed on the U.S. market in recent years. Japan has increasingly engaged in regional production networks throughout the decade, while this is also the case for Malaysia since the turn of the century. The fourth largest supplier, Mexico, is highly dependent on the U.S market, although the share has declined from 95 per cent in 1994 to 86 per cent in 2004.
28 Exports were 85 per cent of imports in value terms in 1994, but only 70 per cent in 2004.
2. Japan
Japan is a leading exporter of electronics, ranking third in the world. It is also a net exporter; in 2004 its exports was almost twice its imports. However, the trade surplus has narrowed over the past decade – exports were four times higher than imports in 1994. Finished goods account for less than half of exports and slightly more than half of imports, suggesting that parts are exported for assembly abroad. According to the Japan-U.S. input-output table from 2000, 62 per cent of gross output in the electronics sector was paid to intermediate inputs. Of these almost two fifths came from within the same industry and the import share was 14 per cent, much higher than in the automotive sector. Furthermore, the import share was as much as 29 per cent when looking at the within industry intermediate use only. Thus, the input-output table suggests extensive vertical specialization in the electronics sector.
As indicated in Table 5, there has been a dramatic shift in the sourcing of inputs where the share of Asia has increased from 56 to 84 per cent, while the Americas, almost entirely the Unites States, has seen its market share reduced to a third of what it was in 1994. Most of the shift has, moreover, taken place during the past 5 years. The input-output table from 2000 thus probably underestimates the degree of vertical specialization. Although total import value in nominal dollars have increased by more than 250 per cent during the decade, North America’s exports to Japan have declined also in nominal value terms. On the export side the shift has been less pronounced, but regionalization can be observed also here. The nominal value of exports has increased by only 130 per cent during the period, suggesting vertical disintegration in the electronics supply chain and outsourcing the production of parts and components to neighbouring Asian countries.
Further evidence of this can be found looking at the exports of components to individual countries. The United States remains the largest export market, but its share has almost halved over the decade. Malaysia was a very important market for both USA and Japan for parts and components in the electronics sector, particularly parts for semiconductors (SITC category 7768) during the 1990s. This was largely intra-firm trade where both Japanese and U.S. companies

27
established foreign affiliates in export processing zones on a large scale (Ismail, 1995). Malaysia has maintained is importance as a destination for outward processing in this sub-sector, but become less important in the other categories and thus slipping from second to 8th in the ranking of Japan’s most important export destinations.29 Low-cost Asian countries, notably China and the Philippines have climbed in the ranking, reflecting offshoring of labour-intensive parts and components (Lall et al 2004). Interestingly, tiny Costa Rica was among the ten largest markets for Japan’s exports of category 7768 in 2004, absorbing almost five per cent of total exports. Costa Rica has established export processing zones where the electronics sector dominates and where parts and components are assembled mainly for the U.S. market.
Japanese multinational companies play an important role also in the electronics sector. In 2004 the sales of foreign affiliates was about 1.5 times the export value.30 Of these sales in the host country accounted for about half and exports back to Japan accounted for about a sixth. There are, however big regional differences. Affiliates in North America sell almost all their output in the host country, while affiliates in ASEAN only sold about 15 per cent of their output in the host country. Thus, it appears that FDI in North America is horizontal, while in Asia FDI is mainly of a vertical nature.
A recent study has found that Japanese investments in China tend to cluster and that the existing supplier relations in Japan are replicated in China. In particular, when a core firm in a business group (or kereitsu) establishes an affiliate in China, its most important suppliers tend to do the same (Belderbos and Carree, 2002). An analysis of FDI flows as recorded in the UNCTAD investment database shows that the U.S. by far and away has been the largest recipient of Japanese FDI in the electronics sector during the period 1990-2004. Total outward FDI in the sector fluctuated between $2 and $6
29 Malaysia’s market share in Japan in category 7768 has, however increased from 24 to 29 per cent during the period, suggesting that Malaysia has moved up the quality ladder in the electronics sector. See also Ismail (2001).
30 Sales of foreign affiliates as given by METI in electrical machinery are compared to exports data from Comtrade, SITC category 72.
billion (current value) during this period, but with a peak in 1999, largely explained by an unusually large outflow to the United States that year. It is not clear whether the database covers all investment flows and whether the coverage is the same throughout the period, so the trends should be taken only as a rough indicator of developments in Japanese outward FDI flows. The figures do, however, correspond well with the FDI data provided by the Japanese Ministry of Finance. The second largest recipient of Japanese FDI in the electronics sector is China, followed by the Netherlands, United Kingdom and Thailand.
Kimura and Ando (2005) find that outward FDI in the electronics sector has increasingly agglomerated in South East Asia, including China. The region is particularly important for small and medium-sized enterprises that have almost exclusively invested in this region when going abroad. The study identifies some interesting developments over time. First, intra-regional production sharing has increased over time; i.e. the share of intermediate inputs sourced from East Asian countries other than Japan or the host country has increased. Second, the share of arms-length trade has increased at the expense of intra-firm trade. Thus, intra-firm purchases from Japan tend to be replaced by local arms length trade and purchases from other East Asian countries over time. It is further found that while this trend is observed for all machinery sectors, it is much stronger for the electronics sector. However, the same tendency is not observed for Japanese investments in Latin America where Mexico and Brazil are the most important host countries. To the contrary, affiliates in Latin America largely source their inputs from East Asia. It is finally argued that Japanese FDI has contributed to forming the critical mass of industrial clusters in East Asia.
Japanese firms have been at the forefront of organizational innovations for a long time. Its production networks have, however, largely been confined to Japan and in addition the supply chains have been replicated in major host countries for Japanese FDI. This pattern is slowly changing. Labour-intensive activities have been offshored to other Asian countries where regional networks have emerged. These networks increasingly provide inputs to Japanese affiliates in Europe and the Americas, particularly
28
in electronics where they are also becoming important as exporters to Japan. The production networks studied here cannot be described as global, however, and distance and services links matter a lot. The absence of Africa and the low share of the Australia, New Zealand and the Pacific also allude to the relevance of distance and services links.
3. Germany
Germany is a leading exporter also in the electronics sector but nevertheless recorded a trade deficit in the sector as defined in Table 4.31 The deficit in parts and components has been growing over the ten-year period analysed, while the deficit in final products has narrowed. Trade (exports plus imports) in final products has been about six times larger than trade in intermediate inputs during the entire period. More than two thirds of the industry’s output was exported in 2002 up from about 40 per cent in 1994 (OECD, STAN database). Vertical fragmentation has been a feature of this sector and the share of intermediate inputs has increased from 58 to 65 per cent from 1994 to 2002 (OECD STAN database). Particularly in the office machinery and computers sector, about 60 per cent of output growth is accounted for by imports of intermediate inputs during the period 1995-2000 in this sub-sector. For other electronics sectors (electrical machinery and apparatus and radio television and communication equipment) vertical fragmentation is also clearly seen in the data, but here domestic and foreign intermediate providers contributed equally (Schintke and Weiss, 2004). Imports of intermediates doubled in nominal dollar terms from 1994 to 2004. The data thus points to a rapid rate of internationalization in the sector. The most notable development over the past decade is the concentration of exports on Europe, but dispersion within Europe. The German production network is concentrated in Europe where an increasing number of Central and Eastern European countries have been linked to the networks, whereas Africa and the Pacific are marginal suppliers, and increasingly so (see statistical annex).
31 The country has a trade surplus in the combined SITC rev 2 codes 75, 76 and 77.
4. China
The export-oriented electronics industry in China was initiated through cross-border operations from electronics firms in Hong Kong in the 1970s forming joint ventures with Chinese firms. In the 1980s the industry was largely confined to the coastal area, notably Guangdong, which is the mainland province closest to Hong Kong. Tuan and Ng (2001) document that firms from Hong Kong started the process by moving their most labour-intensive operations to China. Subsequently firms from Chinese Taipei and other advanced Asian countries followed suit and eventually firms from all over the world have located production in China. Over time fabrication has spread across coastal China while the interior is emerging as a new frontier for labour-intensive production stages. During the 1990s and beyond, the electronics sector had the highest export growth among all sectors in China at an annual average of 36 per cent (Lall and Albaladejo, 2004).
The assembly plant nature of China’s entry into the electronics sector is also reflected in the trade data. From 1994 to (and including) 2001, China had a trade deficit in parts and components, which turned into a surplus in 2002. During this period agglomeration of assembly plants and suppliers of intermediate inputs has taken place involving mainly foreign invested companies, but also an increasing number of local firms. The trade deficit did, however, entirely stem from sourcing of inputs from Asia, while China had a surplus on trade in components with the Americas and Europe, albeit total export volume was relatively small in the early 1990s.32 China has had a trade surplus in final goods in the electronics sector throughout the period, except for the year 2000. China’s trade surplus in final and intermediate products combined amounted to $22 billion in 2004. We note that this is much less than Germany’s surplus in the automotive industry.
Japan has played a major role in the development of China as a location for electronics assembly as well as the emergence of other Asian countries
32 Exports of parts and components as defined in Table 3 to the Americas amounted to $450 mil l ion and to Europe the export value was $380 million in 1994 (Source: Comtrade)

29
geography, but multinational firms from Europe accounted for the highest share of FDI stocks in the country which could explain the high and growing share of Europe in Brazil’s exports of parts and components. On the import side, Asia is the most important source of parts and components, and its share has grown since 1999 following China’s rise as a global supplier.
Brazil has gone through a period of economic reforms, including trade and investment policy reforms. Both the automotive and the electronics sector have been largely focused on the domestic market in the past and foreign direct investment has been largely market-seeking. Following a sharp fall in domestic and regional demand around the turn of the century, both sectors have contracted, but the decline has been tempered by increased export orientation, led by multinational companies that have increasingly integrated Brazil in their production networks. Brazil’s improved trade performance can also be largely explained by a deprecation of the real. It depreciated from 0.84 to the U.S. dollar 1 January 1995 to 3.54 in January 2003. Since then the real has appreciated, however, and stood at 2.33 to the dollar 16 December 2005. A commodity price boom can largely explain the recent appreciation, which suggests that Brazil is still vulnerable to Dutch disease type problems.
6. South Africa
South Africa is a small player in the international market for electronics. Its exports of finished goods as defined in Table 4 were only $300 mill in 2004, while exports of parts and components amounted to about $133 million. South Africa is a net importer of electronics products, both for parts and components and for finished goods. The trade deficit as a share of exports narrowed between 1994 and 1999, but widened again after that. From the trade data it appears that South Africa assembles final goods in the electronics sector, largely for the African market, from imported components. The rise of Asia as the powerhouse for electronics manufacturing is also apparent in South Africa’s trade as can be seen from Table 5.
Turning to production in the electronics sector, Statistics South Africa publishes data on production by SIC code. The relevant codes corresponding to the electronics trade data are
as hosts of lead firms in electronics production networks, notably the Republic of Korea. Sweden has been among the ten largest suppliers of parts and components to China throughout the period mainly due to its strong position in telecommunication equipment. The largest sources of parts and components to China are also the largest recipients of exports of parts and components from China, indicating the back-and-forth production sharing that takes place mainly in the Asian region as described in Kimura and Ando (2005).
5. Brazil
Value added in electronics equipment has contracted by more than six per cent per year on average during the period 1998-2003 in Brazil. This is the sharpest decline among all industrial sectors and reflects a decline in domestic and Mercorsur demand as well as lack of competitiveness in export markets (Maia et al., 2005).33 The sector has nevertheless become more integrated into international production networks since the mid 1990s, receiving about 10 per cent of accumulated FDI inflows during the period 1995-2002 at $3.4 billion. Many of these investments have been mergers and acquisitions following privatization (UNCTAD, 2005b). Leading multinationals such as Siemens and Lucent have production facilities in Brazil and these have introduced modern management and production technology in the country.
Brazil has had a trade deficit in the electronics sector for the entire period depicted in Table 5, while both exports and imports have grown in current dollar terms. The data suggests growing international specialization. Imports of parts and components grew faster than imports of final goods (148 per cent versus 97 per cent respectively from 1994 to 2004), and the same was the case for exports (161 per cent versus 20 per cent for the same period). Exports of final goods were four times higher than exports of intermediate goods in 1994, but less than twice as much in 2004.
Europe plays a more important role in Brazil’s trade than what would be expected from
33 The study does not specify the classification of goods and it is not clear to what extent the “electronics equipment” overlaps with the definition of electronics in Table 3.

30
Manufacture of office, accounting and computing machinery (SIC 359), Manufacture of electronic valves and tubers and other electric components (SIC 371), Manufacture of television and radio transmitters and apparatus for line telephony and line telegraphy (SIC 372) and Manufacture of television and radio receivers, sound or video recording or reproducing apparatus and associated goods (SIC 373). Among these production data is available only for SIC category 372. Production during the period 1998 and November 2005 have fluctuated around a declining trend while according to a study by Maia et al. (2005) value added in TV, radio and communication equipment declined by 1.2 per cent per year on average during the period 1994-2004. Yet, the sector is relatively export oriented and export orientation has increased over the past decade. About a third of its output was exported in 2004, as compared to less than 10 per cent in 1994. Import penetration in the sector was as much as 80 per cent in 2004, up from 60 per cent in 1994.
South Africa differs from the other case studies in that its sourcing of inputs is less geographically concentrated. This probably reflects the fact that neighbouring countries do not have much production capacity in the electronics sector and South Africa is far from all the major producers. In South Africa as in all the other case studies, China has emerged as the largest source of inputs to the electronics sector, surpassing USA. It is noticeable that also Ireland has surpassed USA as an exporter to South Africa in this sector. Another newcomer is Malaysia who has been one of the major sources of foreign direct investment as well.
C. SUMMARY, CASE STUDIES
Both the automotive and the electronics sector have become more regionalized during the period analyzed and this trend is strongest for the automotive sector, while Asia, and China in particular, is the global supplier of parts and components to the electronics sector. Intra-industry trade in parts and components have increased in all the developing country case studies and in the electronics sector for all countries, but in the automotive sector clustering of producers of parts and components appears to have taken place. Vertical specialization does indeed take place also in the automotive sector, but to a large extent within the country or between neighbouring countries. The rise of Asia as the world supplier of electronics components as well as finished goods may have rendered South Africa and Brazil less competitive and resulted in a contraction of the electronics sector in both countries in spite of significant restructuring and internationalization. During this process, local producers have specialized on a narrower product range and targeted both the national and international market. In South Africa the main channel through which local producers of parts and components have entered the world market is through foreign affiliates of multinational companies located in the country. One worrying observation is the small share of developing Asia outside the NICs, sub-Saharan Africa and MENA in both imports and exports of parts and components in the electronics and automotive sectors. It is much smaller than their share in total world trade. If as many observers suggest, vertical specialization is a major source of technology transfer, this does not bode well for least developed countries’ ability to catch up.

31
IV. DRIVING FORCES
A. TECHNOLOGY
Technology has contributed to vert ical specialization through three channels. First, it has made the different tasks and activities that constitute the production process separable in time and space. Modern manufacturing equipment, for instance, consists of flexible machine tools and production equipment that can be electronically programmed. Design and engineering are also computerized and can be fed directly into the programmable production equipment. This implies relatively small batch sizes, just-in-time delivery, quality control at source and consequently smaller inventories at all stages of production. Computer-assisted design (CAD) that feeds into computer-assisted manufacturing (CAM) is standard in many industries. Furthermore, the two (i.e. CAD and CAM) can be separated in space and between institutions through electronic transmission of design.34 For example, even if manufacturing activities have relocated from Western Europe to emerging economies in Asia or more recently Central and Eastern Europe, product development, product design and engineering activities have remained in Western Europe either in specialized independent firms or as a main office function in multinationals.
The second contribution of technology is to reduce the cost of managing outside suppliers relative to in-house production of parts and components. Inventory management and procurement are often computerized and in some cases automated and streamlined to shorten the time to market as much as possible. The entire sequence of activities from production of parts and components to after sales services can be coordinated by means of electronic networks,. Introducing modern, largely computerized technology at one stage in the production process, however, often requires compatible technologies and computerization in the closest vertical stages as well in order for the system to operate smoothly. Furthermore, when the supply chain is organized as a lean network with just-in-time deliveries, delays at one stage can become very costly and delivery reliability
34 See Milgrom and Roberts (1990) for a seminal article on modern manufacturing practices and Nordås (2004) for a case study.
may well be a more important competitive factor than the price of the input. This is a development that should worry policy makers in poor countries that have hitherto relied on low costs as their competitive advantage. Suppliers in such countries risk becoming marginalized or confined to supplying standard inputs on the spot market unless lead time and delivery reliability is significantly reduced and the local industry gets access to adequate telecommunication services.
The third contribution of technology is to reduce trade cost. Services such as transport, telecommunications, logistics and business services play an important role in both the second and third channel and they can be seen as the mortar that holds the supply chain together. A study that illustrates the relationship between technology, services and the supply chain is Mun and Nadiri (2002) who estimate the spillover effect of investment in ICT in the U.S. economy during the period 1985-2000. Their focus is on how investment in ICT in one sector affects cost effectiveness in other sectors through backward and forward linkages. The results are interesting in a production networks perspective. First, they find that it is ICT investments in the services sectors that have the largest spillover effects on other sectors. Second, they find support for the prediction by Milgrom and Roberts (1990) that ICT investments in one industry facilitate ICT investments in their supplier and customer industries as well. They find that on average IT demand in an industry responds more strongly to IT investments in customer industries than in supplier industries. This finding suggests strong backward linkages as far as technology adoption is concerned. The finding is also consistent with a study of the Internet and U.S. trade in services where U.S. imports of business services is significantly correlated with suppliers’ access to the Internet, while exports are not (Freund and Weinhold, 2002).
Productivity has improved and costs have been reduced substantially through utilizing ICT in the transport sector. This is a service in which matching supply and demand can be particularly difficult, since demand in one direction of a journey usually does not match demand in

32
purchase inputs on behalf of all affiliates. This can be a barrier to entry for instance for local firms in host countries with limited capacity for providing supplies to the multinationals’ international production network, or limited ability to meet product standards – or to document that product standards are met. But it was also shown in the case studies that over time local suppliers have managed to win contracts from the foreign affiliates located in their country including for inputs that are exported to other affiliates. The automotive industry in South Africa is a case in point.
Empirical and anecdotal evidence suggests that the role of multinationals in international production networks differs between sectors and between countries. A growing body of research provides an emerging understanding of what determines the role of multinationals. This research looks at what determines the boundaries of firms, focusing on property rights, transaction costs or incentives. Firms are likely to produce in-house inputs that embody the firm’s intellectual property or products that are specific to the product or the process of the firm (often these go together) or products that are very sensitive to timely entry into the production process. In addition to defining the boundary of the firm, recent research on vertical specialization combines the theory of the firm with insights from economic geography asking the question what determines the location of a certain production activity. Finally these firm-level analyses constitute the micro foundation of new trade theory that can explain the international flows of intermediate inputs.
A lead firm in a production network needs to take a decision on which inputs to produce itself and which to purchase from the market (the make-or-buy decision). If it chooses to make the input, it needs to decide where to locate production, where foreign direct investment is one of the options. If the lead firm chooses to buy inputs, it needs to decide whether to purchase standard generic inputs at arms length (the spot market) or to enter into a contract with an outside supplier who would customize the inputs. The search for a suitable supplier could be limited to the domestic market, or the lead firm could decide to look abroad as well. These decisions do usually not constitute a sequential decision tree, as the theoretical literature might suggest, but the
the other direction and filling a truck in both directions may involve a lot of search efforts. Recent technology development, particularly electronic vehicle management systems (EVMS) have enabled carriers to know in real time where trucks and cargo are and can therefore better match supply and demand. A recent estimate from USA finds that the installation of EVMS has increased capacity utilization by 13 per cent (Hubbard, 2003).
B. INDUSTRIAL ORGANIZATION – THE ROLE OF MULTINATIONAL ENTERPRISES IN VERTICAL SPECIALIZATION
As indicated in section II multinational enterprises play an important role in vertical specialization, particularly in capital-intensive sectors. However, outsourcing to independent firms also seems to be on the rise and dominates the picture in labour-intensive industries (Antrás, 2003). These suppliers are independent in terms of ownership, but typically enter long-term contracts with the down-stream firms. The contract often entails obligations on the part of the supplying firm to adopt its product to the downstream customer’s needs and a commitment to just-in-time delivery. The buyer will in turn typically commit to assisting the supplier in fulfilling its obligations through the transfer of information and often also technology. In technology-intensive sectors it is common to include a clause that commits the supplier to cut costs over time in exchange for a long-term contract and technology transfer from the downstream firm. The commitments both on the part of the supplier and the downstream customer cannot be fully captured in a contract, and the relationship is therefore partly built on trust. For suppliers in developing countries such contracts can be an important source of technology transfer and access to international marketing channels. However, the incompleteness of contracts and the logistics-intensity of trade driven by vertical specialization require a minimum level of institutional capacity and infrastructure in the exporting countries that is lacking in many least developed countries. The regression results reported in chapter III and Annex tables A.1 and A.2 support the idea that institutional development is important for the entry into international production networks.
Multinational firms often have centralized procurement systems and the headquarters

33
decision is nevertheless based on the perceived available options where the costs and benefits of potential suppliers at home and abroad are weighed against each other and against in-house production. The possible outcomes are illustrated by Table 6.
Table 6 Industrial organization35
loc
ati
on
of
su
pp
lie
r
Degree of integration
Integrated local fi rm
Outsourcing to local suppliers
Market transactions With local suppliers
Integrated multinational fi rm
Outsourcing to foreign suppliers
Market transactions With foreign suppliers
The integrated local firm and the firms that choose market transactions with local suppliers are not considered as lead firms in international production networks, but are included in the table because the outcomes are possible alternatives to vertical fragmentation. Furthermore, if circumstances changed, they could become the preferred alternatives for firms that currently engage in vertical fragmentation. If for instance trade costs should increase e.g. due to high fuel prices or additional, costly security measures at ports and airports, more firms could choose to consolidate or re-integrate their supply chains.
Antràs (2003) and Antràs and Helpman (2003) have provided some new insights on what determines in which cell in Table 6 firms would be found. They distinguish between sectors according to the intensity of headquarter-inputs in the production of final goods, and in addition firms vary in terms of productivity. Allowing for firm heterogeneity adds realism and important new insights. It is first found that firms in sectors which do not use headquarter inputs intensively are unlikely to be vertically integrated, but outsource production of intermediate inputs to outside suppliers. They characterize these as low-technology firms. Furthermore, among these non-integrated firms, the high-productivity firms will outsource production to low-cost producers in developing countries, while the
35 Outsourcing is defined as a task that is performed by an outside supplier on a contractual basis and according to the outsourcing firm’s specifications.
low-productivity firms will outsource to domestic outside producers. The reason is that the cost of searching for a supplier and managing the relationship to a foreign supplier is higher than a domestic supplier and only the most productive firms can carry this extra cost. However, the larger the wage gap between the low-cost location and the home country of the firm in question, the further down the productivity ranking one can find firms that can afford to search for a foreign supplier. And the lower the trade costs between the two locations, the more firms will outsource to suppliers in low-cost countries.
Antràs (2003) finds empirical evidence that capital-intensive industries are more likely to be vertically integrated and engage in intra-firm trade in intermediate inputs. He also finds that U.S. trade with other capital-rich countries is more likely to involve multinationals than trade with capital-scarce countries which is more likely to be of the kind in the third column in the figure above.36 The automotive case studies in section II of this report also support this finding.
Embedding the make-or-buy decision into trade analysis, Grossman and Helpman (2002) argue that outsourcing on a contractual basis to a developing country is more likely to take place if the developing country has a relatively large industrial base with a number of potential suppliers. This will lower the search costs for a suitable partner. Producers in developing countries are also more likely to be parties to outsourcing contracts when their country has a reasonably sound legal environment such that contracts can be enforced. A recent study by Kimura and Ando (2005) supports this prediction. They find that a better legal framework for contract enforcement and the development of new forms of contracts (by the private sector) have contributed to the reduction of governance costs in special economic zones in South and South East Asia.
A recent empirical study of the determinants of U.S. parent companies’ exports of intermediate products to their majority-owned foreign affiliates indicates that the affiliate is more likely to source inputs from the parent the more intensively the parent invests in R&D, and if the host country
36 See World Trade Report 2005 chapter III.C for further discussion.

34
has a cost advantage. However, countries with GDP per capita less than $1000 are less likely to participate in vertical specialization within the framework of multinational firms. Foreign affiliates are also more likely to source from the parent if the affiliate is a former wholesale affiliate indicating that sales outlets of U.S. multinationals can be a first step towards establishing a link in a supply chain in the host country (Borga and Zeile, 2003).
The case studies in chapter III indeed suggest that multinational enterprises are most important in the capital-intensive automotive sector and that trade is largely intra-firm in the developing countries included in the study (Brazil, China and South Africa), with local firms gradually entering the supply chains.
C. DEMAND FORCES
Consumers love variety, and the more affluent they are the more they are concerned with design, and with distinguishing themselves from the crowd through the choice of products and design. In many cases consumers are also concerned with the process through which the product they consume has been produced. The latter point includes to what extent the production process has harmed the environment, used child labour or otherwise not adhered to core labour standards. Also, the more affluent consumers, the larger the share of their income is spent on services. Finally, the aging societies in Europe, Japan and elsewhere spend an increasing share of national as well as household income on health services.
Producers in turn use differences in consumer preferences to differentiate their products and customize them to different market segments or even individual consumers. Some companies identify niche markets which they target with a relatively narrow spectre of products and varieties of the same product. Others target a mass market while offering a broad range of varieties from which consumers can chose. Over the past fifteen years techniques for so-called mass customization have emerged in a number of industries, including electronics and to some extent the automotive industry.
Mass customization refers to the ability of a manufacturer or service provider through a flexible process in high volumes to customize
products to groups of consumers or individuals.37 The concept covers a range of ways to interact with consumers. These include direct dialogue with designers at the one end of the spectre. At the opposite end of the spectre is the use of electronic point of sales data on consumer choices in order to quickly adapt the product to revealed consumer preferences. Specialized firms that offer such services have emerged and enabled medium-sized companies to utilize such methods as well. The major characteristic of mass customization is continuous product innovation while at the same time maintaining a stable production process. Key success factors for firms adopting mass customization techniques are the standardization of modules and parts, short lead time and integrated product cycles where for instance design, sales and services are integrated (Jiao et al., 2003).
Sectors and companies differ on where in the supply chain customization takes place. The further down in the supply chain, the less flexibility there is. Cost effectiveness increases and lead time typically shortens as customization is moved closer to the consumer. Taking this to the extreme, customization can be done by the consumer, which is the business idea behind IKEA, a Swedish furniture retailer. Customization can also take place through packaging, which is mainly a cosmetic customization, or at the assembly stage. What these techniques have in common is that they are based on a set of common modules that can be mixed and matched with differentiated components and add-ons according to customers orders.
In the automotive sector mass customization has been expected and forecasted by analysts for some time. Mass customization was seen as the likely response to the entrance of new car producers from emerging markets offering low-cost but often less sophisticated vehicles than the incumbent market leaders. One way of tackling this new competition is to offer customized vehicles at reasonable costs. However, mass customization has not quite caught on in this industry. The reasons are that the automotive
37 In the literature there are different definitions of mass customization where some reserve the term for products that are customized to individual consumers while others include products that are customized to groups of consumers that can choose from a catalogue of differentiated products.

35
sector has relatively long product cycles and lead times compared to other sectors. Moreover, most features of a motor vehicle must be incorporated in the assembly process and this yields less flexibility than if customization could take place at a later link in the supply chain. The industry largely ended up with pushing a broader variety of models into the market often at substantial increases in costs (Alford et al., 2000). The electronics sector in contrast has been highly successful with mass customization of a number of consumer goods.
It is argued in the l i terature that mass customization usually involves a supply network that is located close to the lead firm.38 Furthermore, it is argued that mass customization involves the synchronizing of the supply chain such that individual firm efficiency is not enough, but that it is necessary to be part of a network of firms that is collectively efficient. Therefore, mass customization has been a counterforce to the centrifugal forces of declining transport and communication costs. It is an example of taking advantage of lower transaction costs by introducing more transaction-intensive technologies and in the process increasing the relative importance of transaction costs. This is discussed further in the next section. It is finally noted that producers at the customization stage in the value chain are the most likely to earn the rent from customization. Hence for low-technology mass products, there may be a relatively large margin between the finished unpacked product and the packed product.
D. ROLE OF DISTANCE AND TIME
During the Internet hype period, it was widely believed that the so-called ICT-revolution would eliminate the relevance of distance and there would be a development towards a global village where production could take place anywhere. People’s decision on where to live and where to work would become two independent decisions according to the enthusiasts. The sceptics, however, argued that not all information can be codified and digitized. Moreover, periods with rapid technology diffusions are periods with a large amount of uncertainty. Products and processes are not standardized and effective
38 See Da Silveira et al. (2001) for a literature review.
communication in such a framework can only take place face to face (Gaspar and Glaeser, 1998; Leamer and Storper, 2001). Therefore, they argued, electronic communication is complementary to face-to-face communication and the net effect of the ICT revolution on location of productive activities may well be further centralization.
A l t h o u g h t h e c o s t o f t r a n s p o r t a n d communication has declined substantially over the past few decades, total trade costs appear not to have declined. In fact several studies have found that total trade costs have increased. An explanation for this is that as communication and transport costs come down, more is transported and more communication takes place per unit of output. Duranton and Storper (2005) argue that as transport costs decline, exporters in the machinery industry find it profitable to produce higher quality machines that require more interactions between producer and customer. Further evidence is found in Brun et al. (2002) who investigated whether the ICT revolution has reduced the relevance of distance in international trade. They found that it has not. If anything, for developing countries the relevance of distance has increased during the period 1962-96.39 That is, bilateral trade declined more with the distance between trading partners in the 1990s than in the 1960s in trade involving developing countries. A descriptive study of international supply chains in the clothing sector also found that these have become more regionalized during the 1990s, while they used to be global in scope (Gereffi, 1999).
Time has in recent years emerged as a trade barrier in its own right. When just-in-time technology is introduced, delayed delivery of a component can cause costs that are much higher than the market prices of the delayed component. Therefore, no discount can compensate the customer for unreliable delivery time, at least not in the short
39 The study estimated a gravity model of trade on a panel of 130 countries during the period 1962-96, letting the coefficient on distance vary over time. For the entire sample using a standard gravity model, the relevance of distance increased over time. Distance is a proxy for transport and other transaction costs. When separating such costs in those that vary with distance (transport) and those that no not (handling costs), and dividing the sample into 3 income groups, the distance parameter did not change significantly over time for the rich group, while it still increased over time for poor countries.

36
run. It is of course possible to build a buffer stock but this has turned out to be more expensive than to source from suppliers that are close to the assembly, even if their production costs are higher than more remote suppliers with lower production costs, for instance in a developing country. The increased security measures introduced in the war on terror add to the time cost of imports, the more so the less capacity the exporting country has to comply with new regulation.
Time can act both as an entry barrier and as a variable trade cost. It constitutes an entry barrier when there is a threshold lead time which suppliers must meet in order to pre-qualify for bidding on a contract. David Hummels’ (2001) estimate of the probability of exporting to the United States as a function of shipping time is a measure that captures time as an entry barrier. The probability was found to decline by 1.5 per cent per day in transit. Nordås (2006) applies the same methodology for bilateral trade between a larger sample of countries and finds that time for exports and imports reduces the probability to export more in the electronics sector and for intermediate goods as defined in Table II.1 than for merchandise trade on average. Another empirical study from USA looked at the location of suppliers to Japanese affiliates. It found that being located in the same county as the customer mattered when just-in-time systems were introduced, but distance was not significant beyond the county level (Reid, 1994). This suggest that the supplies that continuously feed the production line must be within a few hours delivery distance, while distance does not matter very much for suppliers delivering components that are held in storage, for instance by wholesalers. There is, however, a selection bias in this and most other similar studies since it only includes firms that actually do sell inputs to the Japanese affiliates.
One measure to reduce the entry barrier induced by long and variable lead time (see box IV.1) in developing countries is to develop specialized economic zones. The purpose of such zones should probably not be to introduce export processing enclaves. Rather the point is that time is an entry barrier that can only be reduced through improved infrastructure, frequent calls of ships and diversified services links. And not least elimination of red-tape as will be discussed further in section V.B on trade facilitation. Poor
countries can typically not afford to introduce the necessary infrastructure and services links throughout the country and the establishment of fully serviced special zones could be a good start to attract outsourcing businesses. Kimura and Ando (2005) argue that industrial zones can reduce governance costs in addition to reducing services links costs. They find that industrial zones have been a major success factor in South East Asia and China’s emergence as manufacturing power houses. The zones have contributed to agglomeration of a variety of firms forming a competitive supplier base.40 The study finally finds that Japanese FDI, particularly by small and medium-sized firms have agglomerated in South East Asia and that the affiliates have gradually replaced intra-firm trade with arms-length trade with both local firms and affiliates of other multinationals in the host country and in other South East Asian countries. Similar results are found by Belderbos et al. (2001). Feenstra et al. (2002) have documented how logistics services firms in Hong Kong have facilitated mainland Chinese firms’ entry into international production networks. A study of Hong Kong garment firms’ foreign direct investment in mainland China finds that the number of local suppliers are larger and the local suppliers are more likely to upgrade their products if there is a cluster of foreign direct investment in the industry than if there is dispersed FDI in the sector (Thomson, 2002). Such effects are, however, not found in export processing zones, which indeed is a cluster of foreign direct investments. A possible explanation is that many export processing zones are designed to facilitate the processing of imported intermediaries and effectively discourage linkages to local suppliers. Box 2 presents the different aspects of time as a trade barrier.
The World Bank has recently conducted a survey of freight forwarders in 140 countries on freight time and costs including administrative procedures such as acquiring an export or import license, customs clearance, inspection of goods and several other indicators. These were introduced in an empirical study using an augmented gravity model for 80 countries and three sectors; textiles, apparel and coffee and tea (Hausman et al. 2005). The study finds that a 10 percent reduction in the total trade-related
40 Several studies have found that “thicker” markets reduces governance costs. See for instance McLaren (2000).
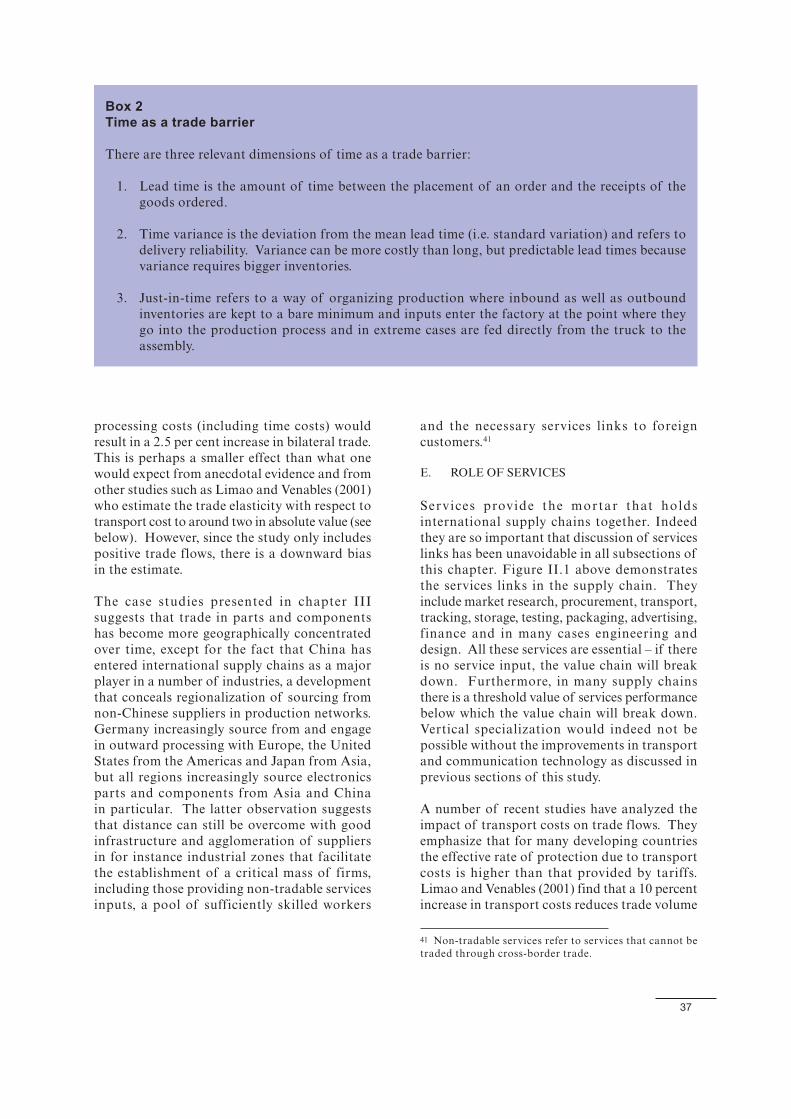
37
processing costs (including time costs) would result in a 2.5 per cent increase in bilateral trade. This is perhaps a smaller effect than what one would expect from anecdotal evidence and from other studies such as Limao and Venables (2001) who estimate the trade elasticity with respect to transport cost to around two in absolute value (see below). However, since the study only includes positive trade flows, there is a downward bias in the estimate.
The case studies presented in chapter III suggests that trade in parts and components has become more geographically concentrated over time, except for the fact that China has entered international supply chains as a major player in a number of industries, a development that conceals regionalization of sourcing from non-Chinese suppliers in production networks. Germany increasingly source from and engage in outward processing with Europe, the United States from the Americas and Japan from Asia, but all regions increasingly source electronics parts and components from Asia and China in particular. The latter observation suggests that distance can still be overcome with good infrastructure and agglomeration of suppliers in for instance industrial zones that facilitate the establishment of a critical mass of firms, including those providing non-tradable services inputs, a pool of sufficiently skilled workers
and the necessary services links to foreign customers.41
E. ROLE OF SERVICES
Services provide the mortar that holds international supply chains together. Indeed they are so important that discussion of services links has been unavoidable in all subsections of this chapter. Figure II.1 above demonstrates the services links in the supply chain. They include market research, procurement, transport, tracking, storage, testing, packaging, advertising, finance and in many cases engineering and design. All these services are essential – if there is no service input, the value chain will break down. Furthermore, in many supply chains there is a threshold value of services performance below which the value chain will break down. Vertical specialization would indeed not be possible without the improvements in transport and communication technology as discussed in previous sections of this study.
A number of recent studies have analyzed the impact of transport costs on trade flows. They emphasize that for many developing countries the effective rate of protection due to transport costs is higher than that provided by tariffs. Limao and Venables (2001) find that a 10 percent increase in transport costs reduces trade volume
41 Non-tradable services refer to services that cannot be traded through cross-border trade.
Box 2 Time as a trade barrier
There are three relevant dimensions of time as a trade barrier:
1. Lead time is the amount of time between the placement of an order and the receipts of the goods ordered.
2. Time variance is the deviation from the mean lead time (i.e. standard variation) and refers to delivery reliability. Variance can be more costly than long, but predictable lead times because variance requires bigger inventories.
3. Just-in-time refers to a way of organizing production where inbound as well as outbound inventories are kept to a bare minimum and inputs enter the factory at the point where they go into the production process and in extreme cases are fed directly from the truck to the assembly.

38
by 20 percent. The study distinguishes between sea transport and overland transport, and finds that the cost of the latter is considerably higher. Overland costs are related to a country’s infrastructure, but also availability and quality of key services such as transport services and handling of goods at ports and other transport nodes. The availability and quality of such services in turn depend a lot on the market structure and regulatory framework, including openness to trade. Competitive markets are found to improve quality and reduce prices, as is further discussed in section V.C below.
With the proliferation of modern manufacturing, the transport and logistics services are in a process of substantial changes. Transport companies increasingly become global in scope. Moreover, specialized firms that manage the flow of physical goods, information and some also provide financial services have emerged. An example from The Economist illustrates the crucial role of logistics in matching suppliers and customers in a just-in-time production network.42 Ford has contracted a logistics firm to organize the supply of components and parts for its factory in Toronto. The logistics firm organizes 800 deliveries a day to 12 different points along Ford’s assembly line from 300 different parts makers without being more than 10 minutes late on any delivery. The logistics company’s computer software is integrated with Ford’s procurement system. It goes without saying that supplies must be localized close to Ford’s assembly in this case. However, this does not necessarily mean that all suppliers must be close to the assembly. There are many examples where logistics firms operate as market integrators and fill the gap between required delivery time and suppliers’ delivery variability, and in some cases also the gap between required fault rates and the fault rates of the suppliers, through testing and packaging. For producers in developing countries with low labour costs, but limited technological capacity, there might be a sufficient margin for intermediaries to operate. This is particularly the case when just-in-time is important while lead time is less so (see Box IV.1).
42 The Economist December 7th 2002, Special Report Logistics.
Exports of cut flowers for instance, requires a cold chain from the moment the flower is cut until it arrives in the flower shop. If the flowers are left in the heat on the airport tarmac even for a short period of time, it will perish and the customer will refuse to accept it. In spite of these requirements, least developed countries such as Zambia has entered this market through the services of international logistics firms and airlines. Strictly speaking, this is not a case of vertical specialization, but it shows that short lead time and efficient services linkages are possible even for a land-locked country in sub-Saharan Africa. Another example of a service link that could open exports markets is testing services. A local manufacturer of switches for passenger cars in India could not sell to a foreign affiliate in India because thermal shock tests that satisfied the multinational company’s requirements were not available locally and the equipment to perform the tests was too expensive for in-house testing (Humphrey and Memedovic, 2003). Finally, producers of fashion clothing need design and market research inputs, otherwise the product will not sell, even if the price is low and the quality per see is good.
In many small countries and developing countries with relative small markets, the market for essential services inputs is shallow and manufacturers have to produce such services in-house. This limits the extent of specialization since most firms are not large enough to afford specialists in each of the services mentioned. Special industrial zones could in many cases help establishing a sufficiently large market for specialized service suppliers, whether foreign-owned or local. This reflects the well-documented fact that the degree of specialization depends on the extent of the market. The dynamics between market size, the cost of services links and depth of the services market constitute a virtuous cycle. As export volume increases, there is space for more service suppliers operating at lower costs, allowing for more timely delivery and further export expansion. In transport, for instance, costs per ton-kilometre declines with volume. Furthermore, a higher volume would justify more

39
frequent calls of ships or aircraft. Courier service suppliers use dedicated overnight flights on the routes with the largest business volume, and can be useful for instance for the supply of urgently needed spare parts. The special economic zones in South East Asia and China have for instance contributed to creating a critical mass of skills and services inputs for the electronics sector as argued in the case studies above.
It should finally be noted that the services sector itself has been subject to vertical specialization driven by differences in costs between countries and technology that has made services tradable. The most publicised examples are call centre and business processing services exported from India to developed countries over the internet or fixed line telecommunications.

40
A. THE GATS
The transport sector plays a key role in international production networks. Unfortunately, this is a sector where trade barriers are relatively high and commitments in the GATS relatively few. Air transport is outside the scope of GATS, while only 41 per cent of WTO members had made commitments in maritime transport and 54 per cent in other transport by March 2005.43 New initial commitments in the Doha Round do not bode well for further liberalization either. Some 20 per cent of members had made offers improving on existing commitments while another 5 per cent had made new commitments in the transport sector by March 2005 (Adlung and Roy, 2005). Maritime transport is subject to so-called cabotage regulation in many countries. Such regulation reserves domestic transport for locally built, owned and manned ships and easily adds to both financial and time costs if cargo needs to be reloaded in order to comply with the regulation. Opening up maritime transport services, particularly in developing countries with a weak maritime transport sector could provide a missing link in the supply chain enabling local firms to become integrated in such chains.
Within just-in-time production networks courier services can be crucial. If an exporter for some reason should have occasional problems with meeting agreed delivery times for samples or other light components, courier services can sometimes solve the problem and help maintain the exporter’s reputation as a reliable supplier. Allowing commercial presence of courier services can therefore be crucial for the participation in international production sharing. Courier services are, however not among the most committed services in the GATS. Developed countries have been particularly reluctant to commit in this sector, while new members and
43 Aircraft repair and maintenance, selling and marketing of air transport services and computer reservation services are included in the Annex on Air Transport Services while ground handling services can be classified under services auxiliary to all modes of transport and committed.
countries in transition (which overlaps to a great extent) have committed more.44
The other services sectors that provide crucial services links in the supply chain are telecommunications, financial services, including insurance, and a number of business services such as advertising, technical testing and packaging. These are generally more open and more commitments are made in these sectors. Telecommunications and financial services are in fact among the most committed sectors in the GATS.
With little progress towards liberalization beyond committing existing practices in the GATS, one must ask if there are alternative negotiation procedures that could yield better results. Is it for instance possible to identify in which services the welfare gains would be the largest and prioritize opening those? On this issue Kox and Lejour (2004) have a proposal. They argue that services could be classified according to the nature of trade barriers and assigned to coloured boxes in a similar way as domestic support in agriculture. Quantitative trade restrictions or price differentiation could be put in a red box and given priority as far as liberalization is concerned. Domestic regulation that unintentionally restricts trade could be put in a brown box where disciplines on regulation aiming at reducing the trade restricting effects could be negotiated. More complex regulation which addresses real domestic market failures, but have an international dimensions (e.g. product standards) could be put in a blue box and regulatory principles could be negotiated (e.g. a principle to adopt international standards where such exist). Finally a green box is suggested for legitimate regulatory measures that do affect market access, but should still be a “no-go” area for the GATS. More clearly defined services supplied under the exercise of government authority would for instance be a clear candidate for the green box.
44 According to the WTO services database, 5 developed, 14 countries in transition, 6 least developed and 24 developing countries have made commitments in courier services.
V. CONSEQUENCES FOR DEVELOPMENT AND TRADE POLICY

41
The request-offer procedure in the GATS negot iat ions have not produced much improvement in market access in general and in key services link sectors in particular, so alternative procedures need to be considered. Plurilateral negotiations were agreed as a complementary procedure at the Hong Kong Ministerial in 2005. Various forms of benchmarks have also been suggested during the Doha Round. Additional procedures are clearly needed in order to obtain progressive liberalization in services within a reasonable period of time. It must nevertheless be born in mind that procedural reforms cannot substitute for willingness to engage in multilateral liberalization of trade in services. Only pressure from stakeholders backed by clear evidence of the overall gains from multilateral liberalization of services is likely to induce more vitality into the negotiations.
B. TRADE FACILITATION
David Hummels’ study on time as a trade barrier found that one extra day in transit corresponds to a 0.8 per cent tariff rate and reduces the probability of exporting manufactured goods to USA by 1.5 per cent. Assuming that these estimates hold for time through customs and other procedures that extends lead time, there are substantial potential gains from improving customs procedures. The World Bank’s doing business studies provide data on time for exports and imports. These are based on business surveys where traders are asked about how many days it takes to export or import. The procedures included in the questionnaire are time through ports, customs clearance, technical control, other required administrative procedures (e.g. export or import licenses, pre-shipment inspection for exports etc.) and transport from port of entry to final destination for imports. Procedures that can run parallel are assumed to run parallel in the study.
The data for 2005 shows that the country with the longest time for exports was the Central African Republic with 115 days. According to Hummels’ estimates this alone reduces the country’s probability of exporting manufacturing goods to USA to zero. This is not very far from the actual recorded figures. According to the Comtrade database the value of manufactured exports from the Central African Republic to USA in 2003 was around $170 000, while the
country’s total exports of manufactures were $2.5 million. In the Central African Republic it also took 122 days to import. Time for imports and exports for the six case studies in section III is presented in Table 7. It is noted that the three developed countries have the same length of time for exports and imports while the three developing countries all have longer time for imports than for exports. Denmark has the lowest time of all countries in the database with 5 days for both imports and exports.
Table 7 Time for exports and imports (days)
Country Time for exports Time for imports
Brazil 39 43
China 20 24
Germany 6 6
Japan 11 11
South Africa 31 34
USA 9 9
Source: World Bank
It is not clear whether export procedures can start while the products for exporting are under production. Depending on whether or not this is the case and depending on whether or not procedures have to be repeated for each shipment, lead time could be between four months and a year for exporters from the worst performing countries.
Negotiations on trade facilitation aim at providing a framework for simplification and harmonization of international trade procedures. The Doha Round negotiations are, however, limited to GATT 1994 Article V (freedom of transit) Article VIII (fees and formalities connected with importation and exportation) and Article X (publication and administration of trade regulations). Several recent studies have analysed the impact of trade facilitation on trade flows, although most quantitative studies have a broader definition of trade facilitation than what is on the table in the Doha Round negotiations. Many for instance include port services and to various extent cargo handling, pre-shipment inspection, testing and some also include logistics services.45
45 See for instance Engman (2005) for an overview.

42
All empirical studies find significant gains from reducing trade costs due to international trade procedures and that gains are larger for developing countries. Likewise, at a firm level small and medium sized enterprises are to gain the most. This is because many of the costs related to complying with administrative trade procedures are independent of traded volume and counts for a larger share of total costs for a small than for a large company. Furthermore, large companies typically receive better services due to their large trade flows. Studies also find that unilateral improvements in trade procedures reduces the costs of both exports and imports and thus facilitates international production sharing which depends on uninterrupted flows of goods and services.
Wilson, Mann and Otsuki (2005) include port efficiency, customs environment, regulatory environment and services sector infrastructure in their measure of trade facilitation, but analyze them separately, using a gravity model of total merchandise trade. They find that the impact on trade facilitation is larger on exports than on imports and that services sector infrastructure has the largest impact among the measures included in the analysis. It is important to notice that the measures included in the study are complementary, although that is not recognized in the study. Improvements in services infrastructure would for instance not improve time for exports and imports much if goods still had to wait for several weeks for customs clearance and vice versa. The analysis also conceals differences among sectors in terms of trade responsiveness to trade facilitation. There is for instance probably a threshold time limit for exports and imports below which firms start to engage in international production sharing. The impact on trade flows could thus be non-linear, particularly in time-sensitive products. Finally, the study does not take zero trade flows into account and the results are therefore biased.
A coherent approach to trade facilitation and infrastructure services trade liberalization is necessary in order to enable local firms to shorten lead time and reduce variability of lead time. In addition domestic reforms in the often highly inefficient and regulated transport sector would increase the probability that local firms could participate in international production networks.
C. TRADE AND COMPETITION
Trade and competition has been studied extensively in the past. One early result was that foreign competition might make domestic competition policy redundant (Dixit, 1984). In South Africa for instance post apartheid trade liberalization indeed did introduce much needed competition. Dixit’s view has, however, not taken hold and most developed and a number of developing countries, including South Africa have introduced competition policy.
In a globalizing world economy a need for an international competition policy or at least multilaterally agreed principles for domestic competition policy was envisaged. Thus, at the Singapore Ministerial of the WTO in 1996 it was agreed to establish a working group to investigate the relation between trade and competition. In the Doha Ministerial in 2001 it was agreed that formal negotiations on competition policy should be launched in the 2003 Ministerial. As is well known, opposition to this idea mounted and competition policy together with investment and government procurement were effectively shelved at the Cancun Ministerial in 2003.
Numerous studies have found a positive relation between competition and performance in infrastructure sectors. For telecommunications for instance, a number of empirical studies have found that the most important factor for performance regarding telephone density, prices and productivity is competition.46 In other infrastructure services similar results have emerged.47 Competition is more important than ownership, but competition in services sectors with scale and network effects - as are common in the infrastructure services sectors - often requires government regulation. Otherwise incumbent dominant firms can exploit their market power even if the sector is liberalized and privatized. Liberalization and regulation thus need to go hand in hand.
One of the arguments in favour of a multilateral agreement on competition policy is that
46 See Li and Xu (2004) for a recent cross-country study, Paredes (2005) for a case study on Chile and Mattos and Coutinho (2005) for a case study of Brazil.
47 See Estache et al. (2005) for a recent survey.

43
multinational companies may have market power not only in their home markets, but also for instance in developing countries where local authorities may have limited capacity to impose anti-trust regulation on them. Hoekman and Mavroids (2003) argue that there should therefore be international provisions making competition authorities in multinational firms’ home country responsible for taking action against their uncompetitive behaviour abroad.
Competition policy is usually concerned with the behaviour of dominant firms in the output market. This is also the aspect of competition policy that has been most analysed in the literature. In international production sharing agreements competition issues also arise regarding the lead firm in the supply chain’s behaviour as a buyer and the possible impact of its market power in the market for inputs (monopsony). As the discussion in section II alluded to, the lead firm typically enter long-term contracts with suppliers, they often have considerable bargaining power in this market and the long-term contracts may lock in selected suppliers while effectively excluding others. This raises more complex competition policy issues which have international dimensions. However, it has generally been argued in the literature that the welfare consequences of exclusive dealing can only be welfare improving for final consumers since the only way the monopsonists can increase his profits is through reduced costs. From the point of view of the input supplier and his home country, however, the welfare implications are less clear. Whether this is a competition policy issue is also not clear and further research is needed in this area.
D. TRADE, INVESTMENT AND INTELLECTUAL PROPERTY
The case studies in section III has documented that multinational enterprises dominate international production sharing in the automotive sector. Multinational enterprises are also important in the electronics sector, but they use independent suppliers to a larger extent than the automotive sector. It was further documented that establishing a commercial presence has been a first step when sourcing inputs from new locations, but that a shift towards independent and subsequently local firms occur over time. These observations reflect first, that foreign investment and trade
are increasingly complementary rather than substitutes. A policy that promotes exports and integration in international production networks must therefore consider trade and investment policy in a coherent way.
The determinants of foreign direct investment motivated by international production sharing, which mainly comes under the category of efficiency-seeking FDI, are relative input costs, an open trade regime, protection of intellectual property rights and agglomeration effects. Efficiency-seeking investments aim at optimizing the production process by exploiting the comparative advantages of different locations. The relative input costs have both a price and quality dimension. An open trade regime is necessary since firms seek the best cost/quality combination and not all inputs can be sourced from the host economy. Intellectual property rights are important because a multinational firm’s most important asset is its knowledge, trademark, patents and other intellectual property. Agglomeration effects refer to a situation where the production costs for firms located in the same area declines with the number of other firms in the same area. The reason for cost reductions is that a diversified supplier base for services and a skills pool develop with the growing demand for such services and inputs. Agglomeration needs to be supported by adequate infrastructure. In addition market size, a stable regulatory environment, and an unrestrictive investment regime are important for all kinds of foreign investment.
Multinational firms must often share technology with suppliers in order to ensure that the inputs have the required quality and interface with other inputs in the production system. A multinational is, however, reluctant to do so if its intellectual property rights are not protected. Therefore it will produce products that involve proprietary processes or embody proprietary technology in-house or outsource to outside suppliers in countries where intellectual property protection is strong. From the multinational company’s point of view it can be too risky to license production to a local firm if the licensee can set up its own competing production of the same or similar product unpunished. Joint ventures are equally risky if the joint venture partner can walk away with the technology and set up a competing firm. There are for instance reports of claimed incidences where joint venture

44
partners of multinational car manufacturers have set up competing production based on their partners’ technology and design in China (Ernst & Young, 2005). While in China the benefits of a large and fast growing domestic market may outweigh problems with intellectual property rights, other developing countries are not in a similar position. Adhering to a minimum standard of intellectual property rights protection will therefore be necessary in order to attract foreign direct investment, particularly in the form of joint ventures. Also in the case of China there has been growing concern over intellectual property rights protection and USA, Switzerland and Japan have filed a formal request in the WTO for information on China’s intellectual property rights efforts.
For low-technology products trademarks are often more important than patents. This is particularly the case for products that can be easily copied and which has a strong trademark. Fashion clothing and accessories is a case in point.
In short, in vertical production networks a protective domestic market is no attraction for foreign companies. Access to low-cost inputs, good infrastructure and related services and protection of intellectual property rights are more attractive in this market. Furthermore, thin markets for infrastructural services can often bee alleviated by allowing foreign investments in these areas. Finally, linkages to local industries are most likely when foreign companies are not met with strict export requirements.48
E. REGIONAL TRADE AGREEMENTS
Production sharing means breaking up the production into parts and components which are produced by a large number of suppliers located in different countries. As Figure II.2 and Table II.2 above show, the import content of exports is high in the sectors where vertical specialization is most prominent and the more so the smaller and less developed the country. Domestic content is typically much smaller than what is required as local content for preferential access in regional trade agreements, which is usually between 30 and 60 per cent. Thus, if a manufacturer’s foreign suppliers are located in other countries than the
48 See Maskus (1997) for a discussion.
regional trading partners, he either has to change suppliers or he will not enjoy preferential access to the trading partners’ markets.
The fact that preferences are not fully utilized in a number of regional trade agreements suggests that changing suppliers can represent higher costs than the gains from the preference margin. Such costs may include a higher price of the intermediate input, the input may be less suitable to the production process, and would possibly require modification of the entire supply chain. Finally, transaction costs might be higher, at least for a period. A recent study of NAFTA finds that the preference utilization rate in 2001 was 58 per cent for total merchandise trade, 74 per cent for intermediate goods and 54 per cent for final goods. Compliance costs were found to vary with the nature of the rules or origin. The rules may require a transformation that amounts to a change of tariff classification, there may be regional value content schemes and there may be technical requirements. Among these technical requirements are found to have the highest compliance costs. The combined compliance costs of change in tariff classification and technical requirements amounted to more than 11 per cent of export value.49 Technical requirements are important in the textiles and clothing sector and probably explain why preference utilization rates are not higher in this sector than the average in spite of significantly higher preference margins (Carrère and de Melo, 2004).
Several studies of free trade areas have found that imports of intermediate inputs into the free trade area declines with the introduction of rules of origin, while imports of finished goods may actually increase. The effect on final goods is explained by the fact that producers of final goods within the free trade area incur higher costs of intermediate inputs and produce less (Duttagupta and Panagariya, 2003; Ju and Krishna, 2005). This trend is, however, reversed if rules of origin are sufficiently tight. Then an increasing number of firms decide not to comply with the rules of origin and face the most favoured nation tariff rates instead.
Studies of rules of origin and trade usually focus on the case with one regional agreement
49 Change in subheading and technical requirements could not be distinguished in the estimates.

45
and one intermediate product. The results can not always be generalized to cases with many partly overlapping regional trade agreements or to vertical production sharing where many complementary inputs are traded between a number of countries. Exporters of final goods in a country that is a member of several regional trade agreements must comply with different rules of origin, and different documentation requirements depending on the location of its customer. Carrère and de Melo (2004) find that the administrative compliance costs for Mexican exporters in NAFTA is somewhat less than 2 per cent of export value and that total compliance costs range between 4 and 16 per cent depending on the nature of the rules of origin. Some of these costs are fixed e.g. the cost of compliance with standards and to some extent administrative costs, while others are proportional to trade volumes. The fixed costs must be incurred in each and every regional trade area an exporter choose to enter, which implies that the trade costs incurred by an exporter increase with the number of rules of origin he must comply with in order to enjoy preferential access. One consequence of the growing patchwork of partly overlapping free trade areas is that exporting firms become larger and fewer. In addition the existence of different rules of origin will reduce the flexibility of exporting firms since the content and technical standards of the product will have to be different depending on who the customer is.50 There is of course the option not to comply with rules of origin and face MFN tariffs, which moderate to low utilization rates suggest that many do.
We have seen in this study that in vertical production networks, developing countries typical ly assemble imported parts and components and export final goods. Regional trade agreements with rules of origin requirements could raise new trade barriers to developing countries outside the gravity field of the major markets, even if they are parties to North-South free trade agreements or receive preferences under GSP or other schemes. Thus, distance and poor services linkages often make outward
50 The regional trade agreements notified to the WTO where Mexico is a member are Group of Three (Colombia, Mexico and Venezuela), Northern Triangle (El Salvador, Guatemala, Honduras, Mexico) and NAFTA. In addition Mexico has signed trade agreements notified to the WTO with Bolivia, Chile, Costa Rica, EFTA, EU, Israel, Japan, Nicaragua and Uruguay.
processing economically infeasible while rules of origin may prevent them from sourcing from the least cost supplier. Furthermore, the burden of fixed costs of complying with a multitude of rules of origin in different RTAs is larger the smaller the firms, and developing countries tend to have smaller firms.
The proliferation of regional trade agreements seen in recent years may have contributed to the tendency towards regionalization of trade in intermediate inputs as indicated in the case studies, although more research is needed to establish this more firmly. It should finally be noted that customs unions are different from free trade areas as rules of origin is not an issue here since the customs union has a common external tariff. As the German case study shows, the custom union can stimulate production sharing within the union and the extension of the European Union has helped integrate Central and Eastern European countries into international production networks and helped firms access cutting edge technology and European markets.
Products subject to international production sharing typically have a low domestic content. This is a result of firms’ cost minimizing behaviour where entire supply chains compete with each other. Low local content is thus not primarily an effort to free-ride on other countries’ preferential access. Therefore, rules of origin in regional trade agreements should take this into account and allow both a relatively high import content and accumulation. Procedures related to compliance with rules of origin as well as technical standards where applicable should not only be transparent and non-discriminatory, but they should also be harmonized to the extent possible. Exporters incur a fixed cost of complying with these costs and some are repeated in each RTA or preference scheme the exporter’s home country is a member of. The more different the rules and procedures the bigger the part of the compliance costs have to be repeated in each market. To conclude, a “spaghetti bowl” of regional trade agreements is not conducive to a world of production sharing in vertical production networks.
46
VI. SUMMARY AND CONCLUSIONS
Vertical specialization has been one of the major driving forces behind the rise in the trade/GDP ratio in the past two decades. It appears, however that the engine has lost some steam during the past few years as the share of intermediate inputs in world trade has remained fairly stable since 1996. Import penetration in parts and accessories in the automotive sector has also remained fairly stable in the major developed economies, while it has increased in the developing countries included in the study. The driving forces behind vertical specialization have been technical development, particularly in transport, communication and supply chain management, and trade and investment liberalization. It appears, however to be a law in economics as well as in physics that for every force there is a counterforce. In the case of vertical specialization the force and counterforce are centrifugal and centripetal respectively. The centrifugal force pushes towards decentralization of production both geographically and between institutions and is driven by technical developments and declining transaction costs. The centripetal force in contrast draws towards centralization and clustering of economic activities. It arises because lower transaction costs encourage more transaction-intensive ways of organizing production and in the process becomes more vulnerable to delays and disruptions in transport and communication. Furthermore, as production technology becomes more precise and flawless, there is less need for quality control at the assembly point. Quality control is left to the suppliers, and the assembly becomes more vulnerable if suppliers are not up to quality standards. It appears that the centripetal force has gained in relative importance in some sectors, notably the automotive sector, in recent years.
Vertical specialization can be a source of technology transfer and a channel for companies in developing countries to enter export markets as the experience from China, South Africa and Brazil shows. These are all countries with relatively good infrastructure, at least in designated industrial areas, they have had a relatively open investment regime and the need for more open trade is recognized as a necessity for continued progress towards integration in international production networks. Not all developing countries and regions have been
able to engage in vertical integration, however. Manufacturers in sub-Saharan Africa for instance, often face insurmountable obstacles in their effort to enter the gravity field of the centripetal forces. This study has indicated some policy measures that could strengthen the centrifugal forces as far as suppliers in developing countries are concerned.
First, it has been shown that lead time and time variability are substantial entry barriers. In addition they impose a cost on suppliers that eventually has to be borne by the least mobile factor of production – labour. One efficient and cost-effective way to reduce lead time is to substantially reduce the time for importing and exporting. For some countries bureaucratic procedures related to trade alone exclude local manufacturers from participating in international production sharing. For these countries lead time will remain an entry barrier and the trade response to improved market access and own trade liberalization can be expected to be minimal in time-sensitive goods. Therefore, unilateral reforms would make a lot of difference and cost very little, while a multilateral agreement on trade facilitation would provide further gains facilitating back-and-forth trade in intermediate inputs.
Second, it has been argued that services links make or break a supply chain. Liberalization combined with adequate regulation of key infrastructure sectors, notably maritime and air transport, but also courier services, port services, packaging, warehousing, technical testing and many more could help improve quality, availability and costs of crucial services links. Domestic reforms and unilateral liberalization could help, but a multilateral agreement that entails meaningful liberalization would yield additional gains because of economies of scale in the transport sector. Multilateral liberalization would allow better capacity utilization and more frequent calls of ships and planes, reducing lead time further. Technical assistance related to adequate regulation should be readily available to liberalizing least developed countries in order to help ensure that liberalization results in more competition which is key to better performance.

47
Third, even fully liberalized infrastructural services markets are constrained by weak infrastructure. Investments in infrastructure are therefore necessary for the integration into international production networks. Such investments are costly and compete with scarce resources for other important purposes such as health and education. Building adequate infrastructure is therefore a long-term objective. The study has suggested that a starting point could be to establish designated fully serviced industrial zones. This could create a critical mass of supporting services and other inputs for suppliers to international vertical production networks, whether locally owned or foreign affiliates. The benefits of creating enclave export processing zones through a mix of tax incentives are, however, less clear and should probably be avoided.
These are the steps that developing and least developed countries in particular could take unilaterally supported by donors and the multilateral trading system through the GATS and trade facilitation. Research on the impact of trade costs on trade overwhelmingly finds that it is relative rather than absolute trade costs that matter for trade performance. Developing countries that have fallen behind because others have moved faster therefore need to catch up and narrow the gap as far as trade costs (in time and money) are concerned. Special and differential treatment in the GATS should therefore be seen as an opportunity for international support for liberalization rather than an opportunity to postpone necessary reforms.
Other policy implications that can be drawn from the study are that the recourse to regional trade agreements will reinforce the centripetal forces. A plethora of product and process standards, rules of origin and administrative procedures related to the enforcement of these create new trade barriers that fall disproportionally on small countries and small firms. Furthermore these arrangements are not conducive to international production sharing.
It should f inally be noted that vertical spec ia l i zat ion i s taking p lace in most manufacturing and increasingly also services sectors. There is thus no escape from reducing lead time through the improvement of the services links in the supply chain. The steps that need to be taken are complementary. Improving one service link would not have much effect if other links remain unreformed and become a bottleneck in the supply chain. A supply chain is as strong as its weakest link. Therefore the weakest link needs to be strengthened first and subsequently all links need to be strengthened in step with each other.
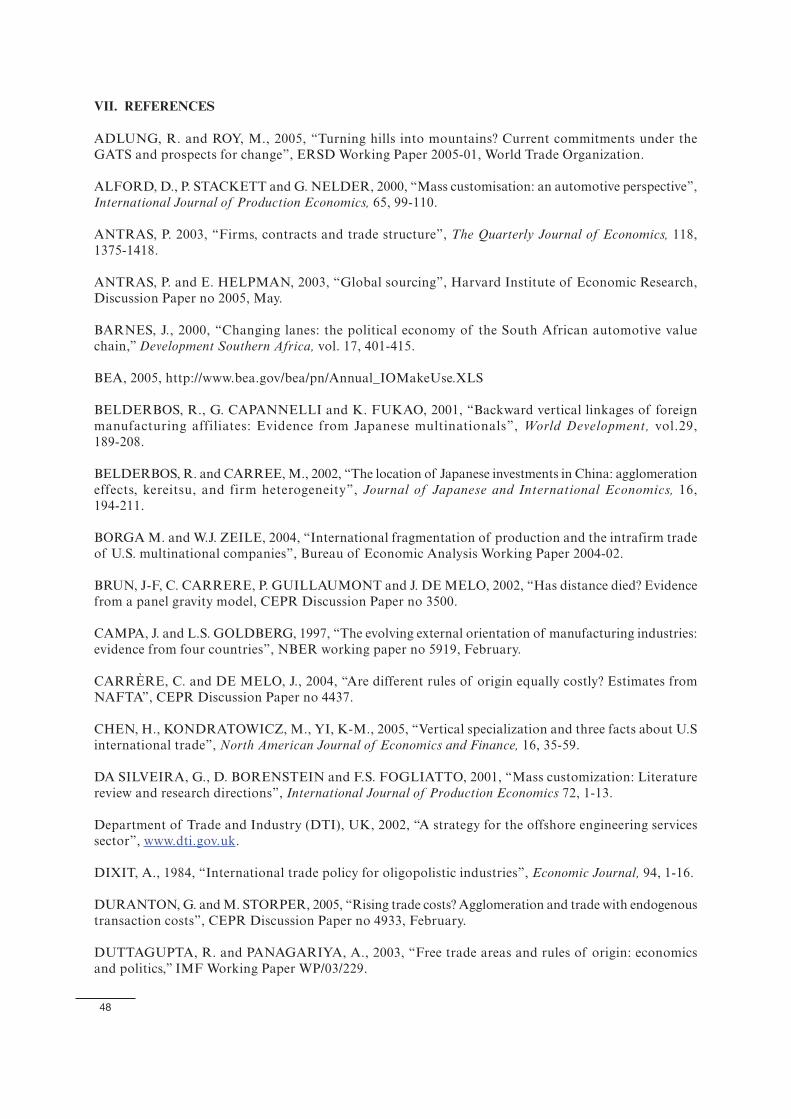
48
VII. REFERENCES
ADLUNG, R. and ROY, M., 2005, “Turning hills into mountains? Current commitments under the GATS and prospects for change”, ERSD Working Paper 2005-01, World Trade Organization.
ALFORD, D., P. STACKETT and G. NELDER, 2000, “Mass customisation: an automotive perspective”, International Journal of Production Economics, 65, 99-110.
ANTRAS, P. 2003, “Firms, contracts and trade structure”, The Quarterly Journal of Economics, 118, 1375-1418.
ANTRAS, P. and E. HELPMAN, 2003, “Global sourcing”, Harvard Institute of Economic Research, Discussion Paper no 2005, May.
BARNES, J., 2000, “Changing lanes: the political economy of the South African automotive value chain,” Development Southern Africa, vol. 17, 401-415.
BEA, 2005, http://www.bea.gov/bea/pn/Annual_IOMakeUse.XLS
BELDERBOS, R., G. CAPANNELLI and K. FUKAO, 2001, “Backward vertical linkages of foreign manufacturing affiliates: Evidence from Japanese multinationals”, World Development, vol.29, 189-208.
BELDERBOS, R. and CARREE, M., 2002, “The location of Japanese investments in China: agglomeration effects, kereitsu, and firm heterogeneity”, Journal of Japanese and International Economics, 16, 194-211.
BORGA M. and W.J. ZEILE, 2004, “International fragmentation of production and the intrafirm trade of U.S. multinational companies”, Bureau of Economic Analysis Working Paper 2004-02.
BRUN, J-F, C. CARRERE, P. GUILLAUMONT and J. DE MELO, 2002, “Has distance died? Evidence from a panel gravity model, CEPR Discussion Paper no 3500.
CAMPA, J. and L.S. GOLDBERG, 1997, “The evolving external orientation of manufacturing industries: evidence from four countries”, NBER working paper no 5919, February.
CARRÈRE, C. and DE MELO, J., 2004, “Are different rules of origin equally costly? Estimates from NAFTA”, CEPR Discussion Paper no 4437.
CHEN, H., KONDRATOWICZ, M., YI, K-M., 2005, “Vertical specialization and three facts about U.S international trade”, North American Journal of Economics and Finance, 16, 35-59.
DA SILVEIRA, G., D. BORENSTEIN and F.S. FOGLIATTO, 2001, “Mass customization: Literature review and research directions”, International Journal of Production Economics 72, 1-13.
Department of Trade and Industry (DTI), UK, 2002, “A strategy for the offshore engineering services sector”, www.dti.gov.uk.
DIXIT, A., 1984, “International trade policy for oligopolistic industries”, Economic Journal, 94, 1-16.
DURANTON, G. and M. STORPER, 2005, “Rising trade costs? Agglomeration and trade with endogenous transaction costs”, CEPR Discussion Paper no 4933, February.
DUTTAGUPTA, R. and PANAGARIYA, A., 2003, “Free trade areas and rules of origin: economics and politics,” IMF Working Paper WP/03/229.

49
ENGMAN, M., 2005, “The economic impact of trade facilitation”, OECD Trade Policy Working Paper No. 21.
ERNST & YOUNG, 2005, “China’s automotive sector – at the crossroads”, www.ey.com.
ESTACHE, A., PERELMAN, S. and TRUJILLO, L., 2005, “Infrastructure performance and reform in developing and transition economies: evidence from a survey of productivity measures”, Policy Research Working Paper Series 3514, World Bank.
FARRELL, D., 2004, ‘Beyond Offshoring: Assess Your Company’s Global Potential’, Harvard Business Review, December, 82-90.
FEENSTRA, R.C. and HANSON, G.H. (1997) “Foreign direct investment and relative wages: Evidence from Mexico’s maquiladoras”, Journal of International Economics, 42, 3-4: 371-393.
FEENSTRA, R.C., G.H. HANSON and S. LIN, 2002, “The value of information in international trade: gains to outsourcing through Hong Kong”, NBER working paper no 9328, November.
FREUND, C. and WEINHOLD, D., 2002, “The internet and international trade in services”, The American Economic Review, 92, 236-240.
GASPAR, J. and E.L. GLAESER, 1998, “Information technology and the future of cities,” Journal of Urban Economics, vol. 43, pp. 136-156.
GEREFFI, G., 1999, “International trade and industrial upgrading in the apparel commodity chain” Journal of International Economics, vol. 48, 37-70.
GROSSMAN, G.M. and E. HELPMAN, 2002, “Outsourcing in a global economy”, NBER working paper no 8728, January.
GINSBURG, A. and SIMONAZZI, A., 2005, “Patterns of industrialization and the flying geese model: the case of electronics in East Asia”, Journal of Asian Economics, 15, 1051-1078.
HAUSMAN, W., LEE, H.L. and SUBRAMANIAN, 2005, “Global logistics indicators, supply chain metrics and bilateral trade patterns”, mimeo, World Bank, October.
HOEKMAN, B. and MAVROIDIS, P.C., 2003, “Economic development, competition policy and the World Trade Organization”, Journal of World Trade, 37, 1-27.
HUBBARD, T.N., 2003, “Information, decisions, and productivity: On-board computers and capacity utilization in trucking”, American Economic Review, vol. 93, 4: 1328-1353.
HUMMELS, D. (2001), ‘Time as a trade barrier’, Mimeo, Purdue University, July.
HUMMELS, D., J. ISHII and KEY-MU YI, 2001, The nature of growth of vertical specialization in world –trade,” Journal of International Economics, vol. 54, 75-96.
HUMPHREY, J. and MEMDOVIC, O., 2003, “The Global automotive industry value chain: What prospects for upgrading by developing countries”, UNIDO Sectoral Studies Series, Vienna: UNIDO.
ISMAIL, M.N., 1995, Transnational Corporations and Economic Development: a Study of the Malaysian Electronics Sector, Kuala Lumpur: Penerbit Universiti Malaya.
ISMAIL, M.N., 2001, “Foreign direct investment and development: The Malaysian electronics sector”. CMI Working Paper 2001:4, Chr. Michelsen Institute, Bergen, Norway.
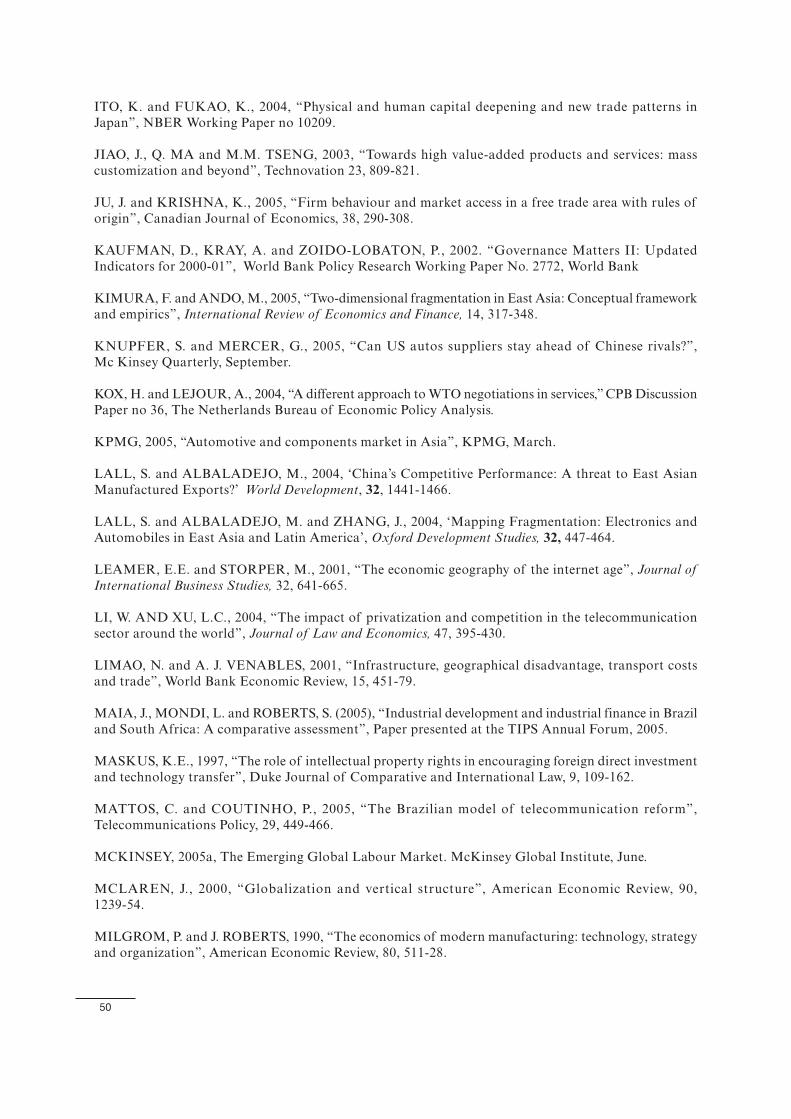
50
ITO, K. and FUKAO, K., 2004, “Physical and human capital deepening and new trade patterns in Japan”, NBER Working Paper no 10209.
JIAO, J., Q. MA and M.M. TSENG, 2003, “Towards high value-added products and services: mass customization and beyond”, Technovation 23, 809-821.
JU, J. and KRISHNA, K., 2005, “Firm behaviour and market access in a free trade area with rules of origin”, Canadian Journal of Economics, 38, 290-308.
KAUFMAN, D., KRAY, A. and ZOIDO-LOBATON, P., 2002. “Governance Matters II: Updated Indicators for 2000-01”, World Bank Policy Research Working Paper No. 2772, World Bank
KIMURA, F. and ANDO, M., 2005, “Two-dimensional fragmentation in East Asia: Conceptual framework and empirics”, International Review of Economics and Finance, 14, 317-348.
KNUPFER, S. and MERCER, G., 2005, “Can US autos suppliers stay ahead of Chinese rivals?”, Mc Kinsey Quarterly, September.
KOX, H. and LEJOUR, A., 2004, “A different approach to WTO negotiations in services,” CPB Discussion Paper no 36, The Netherlands Bureau of Economic Policy Analysis.
KPMG, 2005, “Automotive and components market in Asia”, KPMG, March.
LALL, S. and ALBALADEJO, M., 2004, ‘China’s Competitive Performance: A threat to East Asian Manufactured Exports?’ World Development, 32, 1441-1466.
LALL, S. and ALBALADEJO, M. and ZHANG, J., 2004, ‘Mapping Fragmentation: Electronics and Automobiles in East Asia and Latin America’, Oxford Development Studies, 32, 447-464.
LEAMER, E.E. and STORPER, M., 2001, “The economic geography of the internet age”, Journal of International Business Studies, 32, 641-665.
LI, W. AND XU, L.C., 2004, “The impact of privatization and competition in the telecommunication sector around the world”, Journal of Law and Economics, 47, 395-430.
LIMAO, N. and A. J. VENABLES, 2001, “Infrastructure, geographical disadvantage, transport costs and trade”, World Bank Economic Review, 15, 451-79.
MAIA, J., MONDI, L. and ROBERTS, S. (2005), “Industrial development and industrial finance in Brazil and South Africa: A comparative assessment”, Paper presented at the TIPS Annual Forum, 2005.
MASKUS, K.E., 1997, “The role of intellectual property rights in encouraging foreign direct investment and technology transfer”, Duke Journal of Comparative and International Law, 9, 109-162.
MATTOS, C. and COUTINHO, P., 2005, “The Brazilian model of telecommunication reform”, Telecommunications Policy, 29, 449-466.
MCKINSEY, 2005a, The Emerging Global Labour Market. McKinsey Global Institute, June.
MCLAREN, J., 2000, “Globalization and vertical structure”, American Economic Review, 90, 1239-54.
MILGROM, P. and J. ROBERTS, 1990, “The economics of modern manufacturing: technology, strategy and organization”, American Economic Review, 80, 511-28.

51
MUN, S-B., and NADIRI, M.I., 2002, “Information technology externalities; empirical evidence from 42 U.S. industries”, NBER Working Paper 9272, October.
NORDÅS, H.K., 2004, ‘Location of Engineering and Designer Services in the Space Economy. In De Groot, H.L.F., Nijkamp, P. and Stough, R., (eds). Rising Entrepreneurship in a Shrinking World A Spatial Perspective. Cheltenham, UK: Edward Elgar.
NORDÅS, H.K. and PIERMARTINI, R., 2004, ”Infrastructure and Trade”, ERSD Working Paper 2004-04, World Trade Organization.
NORDÅS, H.K., 2006, “Logistics services and time as a trade barrier”, OECD Economic Studies, 42.
OECD, 2005, OECD Economic Surveys: China, Paris: OECD.
OLIVER, N., DELBRIDGE, R. and BARTON, H., 2002, “Lean production and manufacturing performance improvement in Japan, the UK and US 1994-201”, ESRC Centre for Business Research, University of Cambridge, Working Paper no. 232.
PAREDES, R.D., 2005, “Lessons from the deregulation transition in Chile’s local telephony market”, Telecommunications Policy, 29, 333-350.
REID, N., 1994, “Just-in-time inventory control and the economic integration of Japanese-owned manufacturing plants”, Regional Studies, 29, 345-355.
SCHINTKE, J. and WEISS, J-P., 2004, “Growing division of labour dampening value added growth in manufacturing industry”, Economic Bulletin, 12/2004, DIW, Berlin.
THOMPSON, E.R., 2002, “Clustering of foreign direct investment and enhanced technology transfer: Evidence from Hong Kong garment firms in China”, World Development, 30, 873-889.
TUAN, C. and NG, L.F.Y., 2001, “Regional division of labour from agglomeration economies’ perspective: some evidence”, Journal of Asian Economics, 12, 65-85.
UNCTAD, 2005a, World Investment Report 2005 Transnational Corporations and the Internationalisation of R&D. Geneva: UNCTAD.
UNCTAD, 2005b, Investment Policy Review Brazil (unedited advance copy 31 January 2005). Geneva: UNCTAD.
WILSON, J.S., MANN, C.L. and OTSUKI, T., 2005, “Assessing the benefits of trade facilitation: A global perspective”, World Economy, 28, 841-871.
World Bank, 2005, World Development Indicators, http://devdata.worldbank.org/dataonline/
WTO, 2004, Trade policy Review Report by Brazil, WT/TPR/G/140.
WTO, 2005, “Offshoring services: recent developments and prospects”, World Trade Report 2005, Geneva: World Trade Organization.
YI, K-M, 2003, “Can vertical specialization explain the growth of world trade?”, The Journal of Political Economy, vol. 111, no 1, pp. 52-102.

52
VIII. STATISTICAL ANNEX
Figure A.1 U.S. sources of imports of parts and accessories of transport equipment, 10 largest countries (share of total)
1996
JPN30%
CAN26%
MEX11%
DEU6%
GBR6%
FRA5%
ITA2%
TWN2%
BRA2%
KOR1%
Other9%
2004
CAN25%
JPN21%
MEX14%
DEU8%
FRA5%
CHN5%
GBR5%
TWN3%
KOR2%
ITA2% Other
10%
Source: Comtrade
Figure A.2 U.S. destination of exports of parts and accessories of transport equipment, 10 largest countries (share of total)
1996
CAN38%
MEX10%JPN
7%
GBR5%
DEU4%
FRA4%
KOR3%
AUS2%
SGP2%
BEL2%
Other23%
2004
CAN37%
MEX13%GBR
6%
FRA5%
JPN5%
DEU4%
BRA3%
SGP2%
AUS2%
KOR2%
Other21%
Source: Comtrade

53
0
0.1
0.2
0.3
0.4
0.5
0.6
0.7
0.8
0.9
1
1996 1997 1998 1999 2000 2001 2002 2003 2004
shar
e o
f to
tal
Canada
Japan
Mexico
Source: Comtrade.
Figure A.4Sources of Japan’s imports of car parts and components in the automotive sector (share of total)
1996
USA56%
DEU9%
TWN5%
GBR5%
FRA3%
CHN3%
KOR3%
ITA3%
AUS2%
CAN1%
Other10%
2004
USA45%
CHN9%
DEU8%
FRA5%
GBR5%
KOR4%
THA4%
TWN3%
IDN3%
PHL2%
Other12%
Source: Comtrade
Figure A.3Reliance on US market, share of total exports

54
Figure A.5Germany’s sourcing of parts and components to the automotive sector, (share of total)
1996 2004
FRA14%
USA13%
AUT12%
GBR12%
ITA8%
ESP8%
JPN6%
HUN4%
NLD3%
BEL3%
Other17%
FRA14%
GBR11%
USA10%
HUN9%
AUT8%
ITA7%
CZE6%
POL5%
ESP5%
SVK3%
Other22%
Source: Comtrade
Figure A.6South Africa’s sourcing of parts and components for the transport equipment sector by country (share of total)
USA22%
DEU19%
JPN16%
GBR10%
TWN5%
FRA4%
KOR3%
ITA3%
ISR2%
BLX2%
ROW14% GBR
18%
DEU18%
USA17%
JPN9%
FRA7%
CHN4%
ITA4%
TWN3%
ESP3%
BRA2%
ROW15%
1997 2004
Source: Comtrade

55
Figure A.7Sources of U.S imports of parts and components in the electronics sector (shares of total)
1994
JPN32%
CAN12%
TWN12%
SGP11%
MEX7%
KOR6%
CHN4%
MYS2%
GBR2%
HKG2% other
10%
2004
CHN25%
JPN16%
MYS10%
MEX9%
TWN7%
KOR7%
SGP6%
CAN6%
GBR2%
THA2%
other10%
Source: Comtrade
Figure A.8US exports of parts and components in the electronics sector (percentages)
1994 2004
CAN13%
JPN11%
MEX9%
GBR9%
DEU7%
NLD5%
FRA4%
BRA3%
SGP3%
KOR3%
Other33%
MEX21%
CAN13%
GBR7%
JPN6%NLD
5%DEU4%
SGP4%
CHN4%
HKG4%
BRA3%
Other29%
Source: Comtrade

56
Figure A.9Reliance on the US market for exports of parts and components to the electronics sector (percentages of total exports)
0
0.05
0.1
0.15
0.2
0.25
0.3
0.35
0.4
1994 1995 1996 1997 1998 1999 2000 2001 2002 2003 2004
China
Japan
Malaysia
Source: Comtrade
Figure A.10Sources of Japan’s imports of electronics parts and components (share of total)
1994 2004
USA36%
THA10%
CHN9%
MYS8%
KOR8%
TWN7%
SGP6%
PHL4%
HKG3%
ITA2% Other
7%
CHN37%
KOR13%
USA11%
TWN8%
PHL7%
MYS6%
THA6%
SGP4%
IDN1%
DEU1%
Other6%
Source: Comtrade
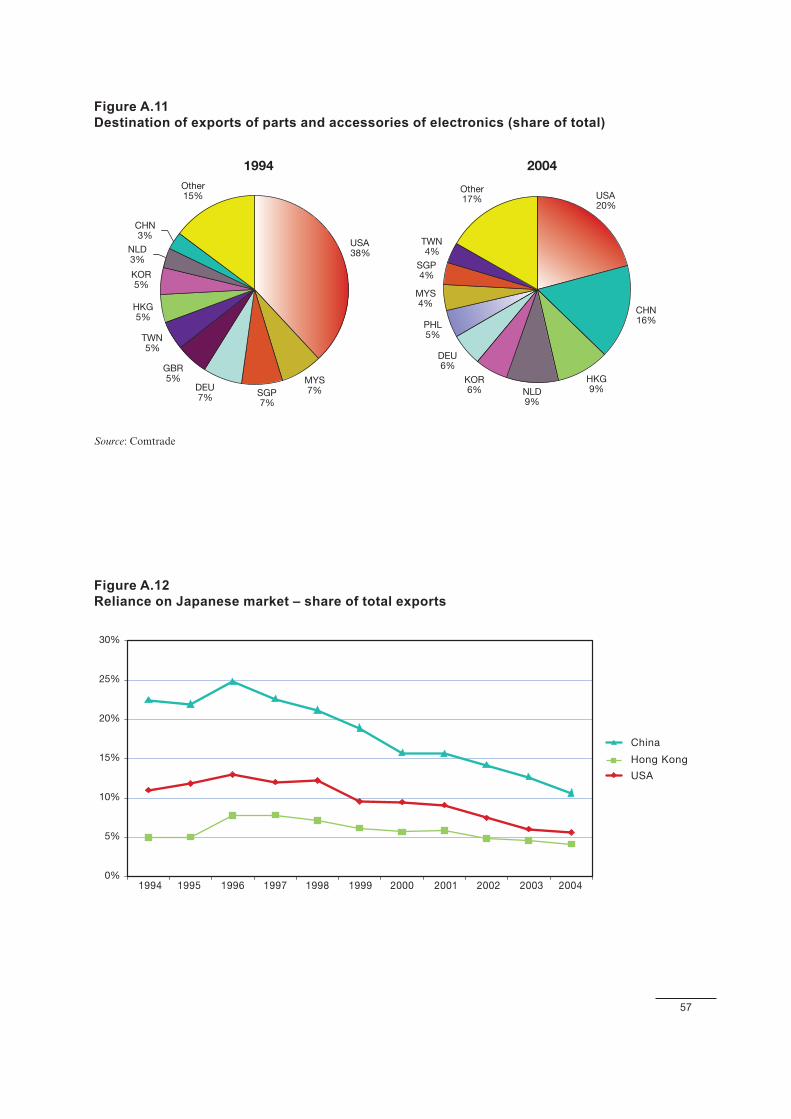
57
Figure A.11Destination of exports of parts and accessories of electronics (share of total)
1994 2004
USA38%
MYS7%SGP
7%
DEU7%
GBR5%
TWN5%
HKG5%
KOR5%
NLD3%
CHN3%
Other15% USA
20%
CHN16%
HKG9%NLD
9%
KOR6%
DEU6%
PHL5%
MYS4%
SGP4%
TWN4%
Other17%
Source: Comtrade
Figure A.12Reliance on Japanese market – share of total exports
China
Hong Kong
USA
0%
5%
10%
15%
20%
25%
30%
1994 1995 1996 1997 1998 1999 2000 2001 2002 2003 2004
58
Figure A.13German sourcing of parts and components in the electronics industry (share of total)
1996 2004
USA23%
JPN17%
GBR8%NLD
7%
TWN7%
FRA5%
SGP5%
ITA4%
CHN4%
SWE2%
other18%
JPN15%
CHN15%
USA11%
KOR8%
NLD6%
IRL5%
GBR5%
TWN4%
SGP4%
FRA3%
other24%
Source: Comtrade.
Figure A.14China’s sourcing of parts and components for the electronics sector by country (shares of total)
JPN44%
HKG21%
TWN8%
USA7%
KOR6%
SGP4%
DEU2%
SWE2%
BLX1%
ROW5%
JPN31%
KOR20%TWN
12%
USA5%
THA5%
HKG4%
MYS4%
SGP3%
SWE2%
ROW14%
1994 2004
Source: Comtrade

59
Figure A.15Brazil’s sourcing of parts and components for the electronics sector by country (share of total)
1994 2004
USA38%
JPN13%
HKG9%
SGP9%
KOR8%
TWN3%
MYS3%
THA3%
DEU3%
ITA2% ROW
9%CHN24%
USA17%
KOR13%
JPN8%
SGP5%
TWN5%
SWE3%
DEU3%
MYS3%
FRA2%
ROW17%
Source: Comtrade
Figure A.16South Africa’s sourcing of parts and components to the electronics sector by country (share of total)
USA16%
DEU14%
GBR11%
TWNJPN
HKG6%
SPE5%
SGP4%
FRA4%
NLD4%
ROW17%
CHN15%
JPN15%
IRL10%
USA%GBR
TWN7%
MYS5%
HKG4%
DEU3%
SGP3%
ROW21%
1994 2004
Source: Comtrade
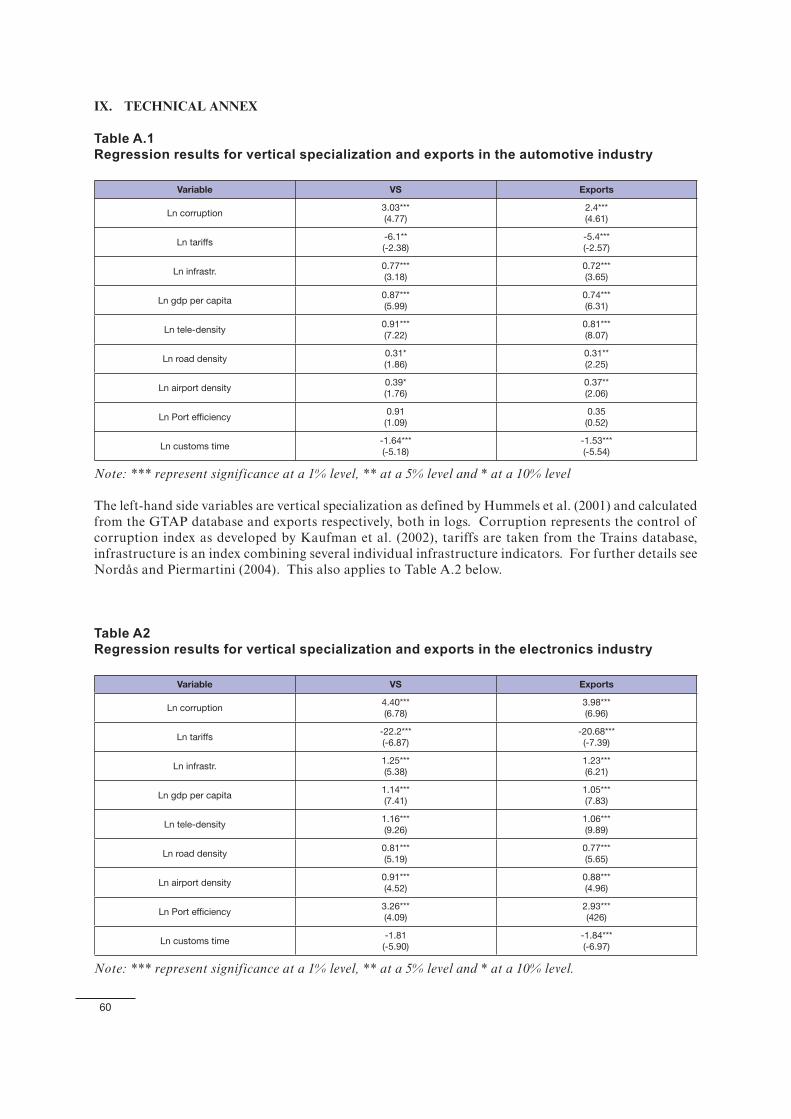
60
IX. TECHNICAL ANNEX
Table A.1Regression results for vertical specialization and exports in the automotive industry
Variable VS Exports
Ln corruption3.03***(4.77)
2.4***(4.61)
Ln tariffs-6.1**(-2.38)
-5.4***(-2.57)
Ln infrastr.0.77***(3.18)
0.72***(3.65)
Ln gdp per capita0.87***(5.99)
0.74***(6.31)
Ln tele-density0.91*** (7.22)
0.81***(8.07)
Ln road density0.31*(1.86)
0.31**(2.25)
Ln airport density0.39*(1.76)
0.37**(2.06)
Ln Port effi ciency0.91(1.09)
0.35(0.52)
Ln customs time-1.64***(-5.18)
-1.53***(-5.54)
Note: *** represent significance at a 1% level, ** at a 5% level and * at a 10% level
The left-hand side variables are vertical specialization as defined by Hummels et al. (2001) and calculated from the GTAP database and exports respectively, both in logs. Corruption represents the control of corruption index as developed by Kaufman et al. (2002), tariffs are taken from the Trains database, infrastructure is an index combining several individual infrastructure indicators. For further details see Nordås and Piermartini (2004). This also applies to Table A.2 below.
Table A2Regression results for vertical specialization and exports in the electronics industry
Variable VS Exports
Ln corruption4.40***(6.78)
3.98***(6.96)
Ln tariffs-22.2***(-6.87)
-20.68***(-7.39)
Ln infrastr.1.25***(5.38)
1.23***(6.21)
Ln gdp per capita1.14***(7.41)
1.05***(7.83)
Ln tele-density1.16*** (9.26)
1.06***(9.89)
Ln road density0.81***(5.19)
0.77***(5.65)
Ln airport density0.91***(4.52)
0.88***(4.96)
Ln Port effi ciency3.26***(4.09)
2.93***(426)
Ln customs time-1.81(-5.90)
-1.84***(-6.97)
Note: *** represent significance at a 1% level, ** at a 5% level and * at a 10% level.

61
Table A.3Correlation between U.S trade in parts and components, transport equipment and FDI stocks
Imports Exports
Outward FDI 0.73 0.88
Inward FDI 0.53 0.19
Table A.4Regression results, U.S trade in parts and components, transport equipment and FDI stocks
Imports Imports Exports
Outward FDI1.20***(18.3)
1.68***(31.4)
Inward FDI0.54***(2.70)
N 296 189 296
Adjusted R2 0.53 0.27 0.77
These are simple OLS regressions indicating a relation between the variables and should not be interpreted as a causal link.
Table A.5Correlation between U.S trade in parts and components, electronics and FDI stocks
Imports Exports
Outward FDI 0.38 0.33
Table A.6Regression results, U.S trade in parts and components, electronics and FDI stocks
Imports Exports
Outward FDI0.33***(6.68)
0.17***(5.68)
N 260 260
Adjusted R2 0.10 0.11
2006A N N U A L P U B L I C AT I O N S
ANNUAL REPORT 2006
The Annual Report of the World Trade Organization focuseson the main activities of the organization and details of itscurrent structure, staff and budget. It is published in thefirst half of the year. This is a companion report to theWorld Trade Report and the International Trade Statistics.
ISBN 978-92-870-3372-7Available Autumn 2006Price: CHF 50
WORLD TRADE REPORT 2006
The annual World Trade Report focuses on trade policyissues - the core topic addressed in 2006 is subsidies. TheReport also takes a look at recent trade developments andexamines a range of trade topics, including trade in texti-les and clothing, flows of international receipts and pay-ments of royalties and license fees, trends in the trade ofleast-developed countries, and the impact of naturaldisasters and terrorist acts on international trade flows.The World Trade Report is useful for policymakers and forany individuals or groups interested in global trade policy.
ISBN 92-870-3352-8Available July 2006Price: CHF 60(1st published in 2003)
Publications available in French, English or Spanish
INTERNATIONAL TRADE STATISTICS 2006
The International Trade Statistics is the WTO's annual com-pilation of global trade statistics. This Report providescomprehensive statistics on trade in merchandise andcommercial services, with an assessment of world tradeflows by country, region and main product groups or servicecategories.
ISBN 978-92-870-3355-0Available December 2006Price: CHF 50(Previously Vol. II of the Annual Report)