downstream petroleum industry · the nigerian oil and gas industry is highly controlled and tightly...
TRANSCRIPT
Banking Industry
FSDH Merchant Bank Limited
December 2015
Downstream Petroleum Industry
Subsidy Removal: Time to Act
FSDH Research
Downstream Petroleum Industry
FSDH Research 2 December 2015
Contents
1.0 The Global Oil Price .......................................................................................................................................................... 6
2.0 Domestic Macroeconomic Environment: ........................................................................................................................... 6
2.1 The Downstream Oil Sector and the Macroeconomic Environment: ............................................................................. 6
2.2 Foreign Exchange Market Development: ...................................................................................................................... 6
2.3 Oil Price Movement: ...................................................................................................................................................... 6
2.4 Interest Rate Movement: ............................................................................................................................................... 7
3.0 Downstream Oil and Gas Regulators and Associations: ................................................................................................... 8
3.1 Regulators and Associations: ........................................................................................................................................ 8
3.1.1 The Ministry of Petroleum Resources: .................................................................................................................... 8
3.1.2 The Department of Petroleum Resources (DPR): .................................................................................................. 8
3.1.3 Nigerian National Petroleum Company (NNPC): .................................................................................................... 9
3.1.4 Other Regulators and Associations in the Downstream Oil and Gas Sector: ....................................................... 11
3.2 The Petroleum Industry Governance and Institutional Framework Bill 2015: .............................................................. 12
3.2.1 The Bill: ................................................................................................................................................................ 12
3.2.2 Objectives of the Act ............................................................................................................................................. 12
3.2.3 The New Structure: ............................................................................................................................................... 12
4.0 Petroleum Products Supply ............................................................................................................................................. 13
4.1 Domestic Refining Capacity:........................................................................................................................................ 13
4.2 Petroleum Product Supply from Off-shore Processing Agreements (OPA): ................................................................ 14
4.3 Downstream Petroleum Product Distributions: ............................................................................................................ 14
4.4 Value of Imported Petrol Products: .............................................................................................................................. 16
5.0 Analysis of the Downstream Petroleum Marketing Companies: ...................................................................................... 17
5.1 Industry Coverage: ...................................................................................................................................................... 17
5.2 Balance Sheet Analysis: .............................................................................................................................................. 17
5.3 Profitability: .................................................................................................................................................................. 19
5.4 Ratio Analysis in the Industry: ..................................................................................................................................... 20
6.0 Company Analysis: .......................................................................................................................................................... 21
6.1Conoil Plc: .................................................................................................................................................................... 21
6.1.1 Q3 2015 Performance Analysis: ........................................................................................................................... 21
6.1.2 FY 2014 Performance Analysis: ........................................................................................................................... 23
6.1.3 Drivers of Performance ......................................................................................................................................... 26
Downstream Petroleum Industry
FSDH Research 3 December 2015
6.1.4 Strategic Focus: .................................................................................................................................................... 26
6.1.5 SWOT Analysis: ................................................................................................................................................... 26
6.2 Forte Oil Plc: ................................................................................................................................................................ 27
6.2.1 Q3 2015 Performance Analysis: ........................................................................................................................... 27
6.2.2 FY 2014 Performance Analysis: ........................................................................................................................... 29
6.2.3 Drivers of Performance: ........................................................................................................................................ 32
6.2.4 Strategic Focus: .................................................................................................................................................... 33
6.2.5 SWOT Analysis .................................................................................................................................................... 33
6.3 Mobil Oil Nigeria Plc: ................................................................................................................................................... 34
6.3.1 Q3 2015 Performance Analysis: ........................................................................................................................... 34
6.3.2 FY 2014 Performance Analysis: ........................................................................................................................... 37
6.3.3 Drivers of Performance and Strategic Focus: ....................................................................................................... 40
6.3.4 Strategic Focus: .................................................................................................................................................... 41
6.3.5 SWOT Analysis: ................................................................................................................................................... 41
6.4 MRS Oil Nigeria Plc: .................................................................................................................................................... 42
6.4.1 Q3 2015 Performance Analysis: ........................................................................................................................... 42
6.4.2 FY 2014 Performance Analysis: ........................................................................................................................... 44
6.4.3 Drivers of Performance: ........................................................................................................................................ 47
6.4.4 Strategic Focus: .................................................................................................................................................... 47
6.4.5: SWOT Analysis: .................................................................................................................................................. 48
6.5 Oando Plc: ................................................................................................................................................................... 49
6.5.1 Q3 2015 Performance Analysis: ........................................................................................................................... 49
6.5.2 FY 2014 Performance Analysis: ........................................................................................................................... 51
6.5.3 Drivers of Performance and Strategic Focus: ....................................................................................................... 54
6.5.4 Strategic Focus ..................................................................................................................................................... 54
6.5.5 SWOT Analysis: ................................................................................................................................................... 55
6.6 TOTAL Plc: .................................................................................................................................................................. 56
6.6.1 Q3 2015 Performance Analysis: ........................................................................................................................... 56
6.6.2 FY 2014 Performance Analysis: ........................................................................................................................... 58
6.6.3 Drivers of Performance and Strategic Focus: ....................................................................................................... 61
6.6.4 Strategic Focus: .................................................................................................................................................... 61
6.6.5 SWOT Analysis: ................................................................................................................................................... 62
7.0 Valuation: .................................................................................................................................................................... 63

Downstream Petroleum Industry
FSDH Research 4 December 2015
Executive Summary
The weak global demand, increased production and the appreciation in the value
of the U.S Dollar have contributed to the decline in the crude oil price. The short-
term analysis of the global oil demand and supply shows that the oil market will remain
oversupplied while demand may remain weak. Thus, we expect crude oil price to drop
further.
The drop in the crude oil price may not necessarily translate to a drop in the pump
price of fuel in Nigeria because of the weak Naira. A depreciation in the value of the
Naira from the current level, as we expect, will eliminate the effect of the drop in the
crude oil price.
The Federal Government of Nigeria (FGN) has sent a bill to the National Assembly
that will change the petroleum industry structure. One of the objectives of the bill is to
create a conducive business environment for petroleum industry operations.
Nigerian government and the operators in the petroleum industry have not
managed the fuel subsidy to the benefit of the masses. The scheme is loaded with
fraud and delays in the payment of subsidy to the petroleum marketers leading to
increase in finance charges and lower profit. With the drop in the crude oil price and
dwindling FGN revenue, we believe it is time to end the fuel subsidy. Under the
current market conditions, the removal of the fuel subsidy will increase competition and
improve efficiency in the sector. We are aware that the pump price for Premium Motor
Spirit (PMS) may increase after subsidy removal, principally on account of Naira
depreciation. However, the FGN may have some savings to channel into other critical
sectors of the Nigerian economy to cushion the impacts of the price increase.
The short-term earnings outlook of the petroleum marketing companies in Nigeria
does not look good. The sector is plagued with drop in turnover, high interest charges
and drop in profit. However, the situation may change in the next few months if the
current reforms in the sector are properly implemented.
The valuations for the companies analysed in this report could change drastically
if the expected changes in the petroleum marketing industry are carried out.

Downstream Petroleum Industry
FSDH Research 5 December 2015
Table 1: Recommendations:
S/N Company Rating
1. Conoil Plc BUY
2. Forte Oil Plc SELL
3. Mobil Oil Plc BUY
4. MRS Oil Plc HOLD
5. Oando Plc HOLD
6. TOTAL Nigeria Plc BUY

Downstream Petroleum Industry
FSDH Research 6 December 2015
1.0 The Global Oil Price
Oil prices in the international market have faced significant fall since June 2014. The
Organization for the Petroleum Exporting Countries (OPEC) Reference Basket (ORB) fell
sharply by 70.53% to US$32.56/b as at December 15, 2015 from US$110.48/b as at
June 20, 2014. Year-to-Date, the ORB fell by 37.38% to close at US$32.56/b as at
December 15, 2015. The oil price was impacted by supply glut in the international
market. The advancement in shale oil production techniques in the U.S. and weak
global economic growth fueled the supply glut. The strengthening of the U.S. Dollar
and the inability of OPEC to agree on a production cut are also putting a downward
pressure on oil price.
2.0 Domestic Macroeconomic Environment:
2.1 The Downstream Oil Sector and the Macroeconomic Environment:
2.2 Foreign Exchange Market Development:
The demand pressure in the foreign exchange market adversely impacted the
earnings of the petroleum industry operators. The operators find it difficult to source
foreign exchange for the importation of petroleum products. This reduced the volume of
petroleum products available for sale and ultimately affected the bottom line. Under a
fully price deregulated market, both the foreign exchange rate and petroleum products
prices may increase. The customers may likely pay more depending on the foreign
exchange rate and the crude oil price. Nevertheless, oil marketers will operate on full
capacity and may be able to earn more revenue.
2.3 Oil Price Movement:
The petroleum marketing companies could not fully benefit from the sharp drop in
the oil price because of the devaluation of the Naira. This led to high financing
costs and petrol product importation cost. The delay in the payment of oil subsidy
claims negatively impacted the operations of the oil marketing companies. The price of
Bonny Light dropped by 66.42% to U$37.82/b as at December 15, 2015, from
US$112.64/b as at end-June 2014.
Oil prices in the international
market have faced significant fall
since June 2014.
The demand pressure in the
foreign exchange market
adversely impacted the earnings
of the petroleum industry
operators.
The delay in the payment of oil
subsidy claims negatively
impacted the operations of the oil
marketing companies.

Downstream Petroleum Industry
FSDH Research 7 December 2015
2.4 Interest Rate Movement:
The devaluation of the Naira increased the funding cost for the importation of
refined petrol products. This reduced the profit margin of the petroleum marketers. The
high interest rate movement increased the borrowing cost of the petroleum marketing
companies, with a negative impact on their earnings. The removal of fuel subsidy or a
prompt payment of the arrears owed to the operators will reduce the interest charges
paid by the oil marketers.
The devaluation of the Naira
increased the funding cost for the
importation of refined petrol
products.

Downstream Petroleum Industry
FSDH Research 8 December 2015
3.0 Downstream Oil and Gas Regulators and Associations:
3.1 Regulators and Associations:
The Nigerian oil and gas industry is highly controlled and tightly regulated by a
number of key agencies. These organizations fulfill a number of functions on behalf of
Nigeria.
At the moment, the main regulators in the industry are: The Ministry of Petroleum
Resources (MoPR), The Department of Petroleum Resources (DPR), The Nigerian
National Petroleum Company (NNPC), and the Federal Environment Protection Agency
(FEPA).
3.1.1 The Ministry of Petroleum Resources:
The Ministry of Petroleum Resources (MoPR) is the body of the Nigerian government
responsible for the initiation of policies guiding the petroleum industry and the supervision
of the implementation of these policies.
3.1.2 The Department of Petroleum Resources (DPR):
The DPR focuses on the supervision, monitoring and enforcing of oil and gas operations
within the country.
The functions of the DPR include:
It ensures compliance with industry regulations
Processes applications for licenses, leases and permits
Establishes and enforces environmental regulations.
The DPR, and the National Petroleum Investment Management Services (NAPIMS), play
a crucial role in the day to day activities in the industry. The regulatory body is managed
by a Director of Petroleum Resources, who oversees the general workings of NAPIMS.
These includes: Upstream Monitoring and Regulation; Downstream Monitoring and
Regulation; Gas Monitoring and Regulation; Engineering and Standards and General
Corporate Services.
The Nigerian oil and gas industry
is highly controlled and tightly
regulated by a number of key
agencies within the Nigerian
government.

Downstream Petroleum Industry
FSDH Research 9 December 2015
3.1.3 Nigerian National Petroleum Company (NNPC):
The NNPC is involved in exploration and operational activities of oil minerals,
including the refining, petrochemicals and products transportation as well as the
marketing of petroleum products. The NNPC pioneered the construction of four oil
refineries located in Warri, Kaduna and Port Harcourt. The NNPC is directly regulated by
the Ministry of Petroleum Resources (MoPR) and the Department of Petroleum
Resources (DPR). It operates on three fronts namely Upstream Activities, Midstream
Activities and Downstream Activities.
The NNPC Downstream activities are further broken down into a number of focused
departments which deal with Retail Services, Product Distribution, and Research and
Development.
3.1.3.1 Retail Services Unit:
NNPC Retail Ltd operations commenced in August 2002, when the first Retail outlet was
commissioned in Lagos to market petroleum products to the public. NNPC entry into
products retailing was initially a strategic move intended to provide the Corporation with:
The vehicle for intervention in the market during periods of emergency and
avoidable supply disruptions
A benchmark for key players in the distribution chain and ensure safe, orderly
and profitable retailing of products in the country
A vehicle to achieve NNPC’s world class vision by integrating its upstream and
downstream businesses in a similar manner to other national and international oil
companies
3.1.3.2 Product Distribution Unit: The Pipelines and Product Marketing Company (PPMC) is the product distribution
arm of NNPC. PPMC is directly responsible for the comparative ease with which
petroleum products are sourced and distributed to all parts of the country, at a uniform
price. PPMC, a subsidiary of NNPC, ensures, among other things, the availability of
petroleum products to sustain industries, run automobiles and for domestic cooking.
PPMC is directly responsible for
the comparative ease with which
petroleum products are sourced
and distributed to all parts of the
country, at a uniform price
The NNPC Downstream activities
are further broken down into a
number of focused departments
which deal with Retail Services,
Product distribution, and Research
and Development.

Downstream Petroleum Industry
FSDH Research 10 December 2015
Mode of Operation
PPMC receives crude oil from the NNPC unit called the National Petroleum
Investments Management Services (NAPIMS).
PPMC then supplies the crude oil to the NNPC local refineries. However;
petroleum products are sometimes imported to supplement local production
when the local refineries are unable to process enough for the country’s needs.
PPMC receives petroleum products that are either imported or refined locally through
import jetties and pipelines. It distributes the products through pipelines to depots
strategically located and transported to the retail outlets. There is also provision for using
the rail system to move petroleum products from some of the PPMC depots.
3.1.3.3 Research and Development Unit: NNPC Downstream sector capabilities here include:
Crude Assay Analyzer
Collaborative Research Services with other National Oil Companies (Petrobras,
Saudi Aramco, etc.), OPEC, National Government Agencies and Independent
Oil Companies (IOC)
New Businesses such as:
1. Glassblowing production
2. Renewable Energy studies on Biofuels and Solar energy
It also provides technical services to oil & gas companies such as: Process Simulation;
Energy optimization studies; Troubleshooting of plants operational problem; Improvement
of existing processes and development of new ones; New products development in fuels;
lubes, bitumen and petrochemicals, Natural gas utilization for the production of solvent;
and Catalysts characterization.
·

Downstream Petroleum Industry
FSDH Research 11 December 2015
3.1.4 Other Regulators and Associations in the Downstream Oil and Gas Sector:
Other regulators that exist in the oil and gas industry include: The Petroleum Equalization
Fund (PEF), The Petroleum Products Pricing and Regulatory Agency (PPRA) and The
Nigerian Content Development and Monitoring Board.
The Petroleum Equalization Fund (PEF) oversees petrol prices bridging activities,
ensures that the Uniform Pricing Mechanism works effectively throughout the country. It
applies the laws of the Federal Republic of Nigeria (FGN) as they affect the Uniform
Pricing System.
The Petroleum Products Pricing and Regulatory Agency (PPRA) of Government is
responsible for setting the benchmark prices of petroleum products and in turn regulating
and monitoring the transportation and distribution of petroleum products in Nigeria.
The National Petroleum Investment Management Services (NAPIMS) manages the
federal government’s interests in the oil and gas industry. It is neither a regulator nor an
operator. NAPIMS aids the management of Nigerian Government assets, spearheading
new technology application in the oil and gas industry and is involved in project
management activities.
PPRA is responsible for setting
the benchmark prices of
petroleum products.
Downstream Petroleum Industry
FSDH Research 12 December 2015
3.2 The Petroleum Industry Governance and Institutional Framework Bill 2015:
3.2.1 The Bill:
The FGN has sent a bill to the National Assembly that will change the industry structure.
The Bill is for an Act to provide the governance and institutional framework for the
petroleum industry and for other related matters.
3.2.2 Objectives of the Act:
The objectives of the Act shall be to:
Create efficient and effective governing instructions with clear and separate roles
for the petroleum industry
Establish a framework for the creation of commercially oriented and profit driven
petroleum entities that incur value additions and internalization of the petroleum
industry
Promote transparency and accountability in the administration of the petroleum
resources of Nigeria
Create a conducive business environment for petroleum industry operations
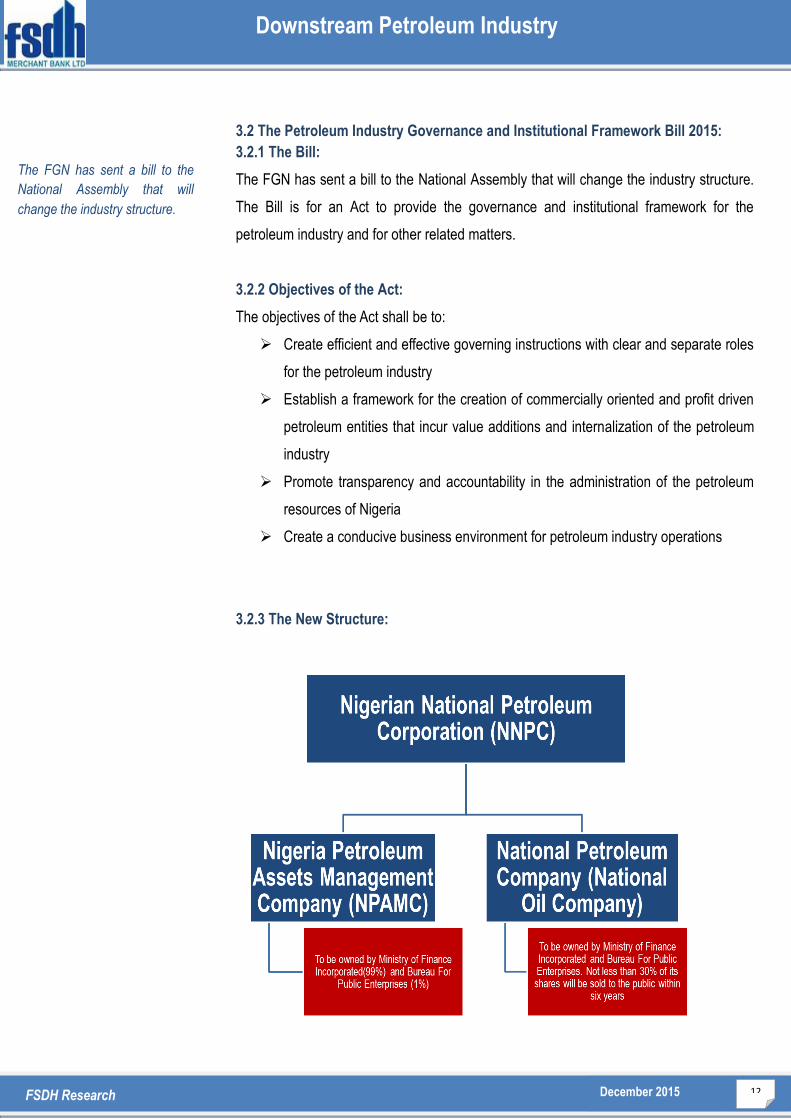
3.2.3 The New Structure:
The FGN has sent a bill to the
National Assembly that will
change the industry structure.

Downstream Petroleum Industry
FSDH Research 13 December 2015
4.0 Petroleum Products Supply:
4.1 Domestic Refining Capacity:
Nigeria will continue to rely on imported fuel as local capacity is unable to meet demand.
The total daily Premium Motor Spirit (PMS) capacity of the Nigerian refineries is put at 19
million barrels per day (mbd). The total local demand is estimated at 40mbd at the
moment. This means that Nigeria will still rely on importation of PMS to meet local
demand even if all the refineries operate at full capacities. At the moment the refineries
are producing about 6.76mb/d. The refineries are considered old and maintenance cost is
currently high and may not operate at full capacities under government management.
They may be sold to private company for efficient management under the proposed new
structure. The petroleum marketing industry needs to be fully deregulated for it to be
attractive to private investors. In addition, the planned Dangote Refinery should start
production around 2017-2018, which could make Nigeria to be self-sufficient in refined
products.
Table 2: Production Capacity of Nigeria Refineries vs Demand for Premium Motor Spirit (PMS)
Litres of PMS
Port Harcourt Refinery 7,326,316
Warri Refinery 6,598,684
Kaduna Refinery 5,075,000
Total 19,000,000
Total Demand 40,000,000
Deficit (21,000,000)
Source: FSDH Research Estimate

Downstream Petroleum Industry
FSDH Research 14 December 2015
4.2 Petroleum Product Supply from Off-shore Processing Agreements (OPA):
In November 2015, 1,009.04 million litres of white products was supplied into the country
through the OPA arrangements, compared with 852.10 million litres supplied in October
2015. A total of 787.21 million litres of PMS was supplied in November 2015, compared
with a total of 645.64 million litres in October 2015. A total of 221.82 million litres of DPK
was supplied in November, compared with 206.46 million litres in November 2015. The
table 3 below provide more details of the total petroleum product supply from OPAs
4.3 Downstream Petroleum Product Distributions:
A total of 908.02 million litres of white product was distributed by PPMC in November
2015, compared with 676.70 million litres in October 2015. This is comprised of 779.92
million litres of PMS, 104.74 million litres of Kerosene and 23.36 million litres of Diesel.
Total sale of white products for the period January to November 2015 stands at 7.99
billion litres, PMS (6.51 billion litres) accounts for 81.44%.
Table 3: Imported Petroleum Products from OPA (Litres)
Period PMS DPK Total
Jan-15 518,772,435.65 328,471,903.76 847,244,339.41
Feb-15 472,805,826.73 84,308,867.10 557,114,693.84
Mar-15 928,342,421.75 84,985,825.23 1,013,328,246.98
Apr-15 575,901,484.32 171,709,078.46 747,610,562.78
May-15 700,039,657.96 349,630,514.46 1,049,670,172.43
Jun-15 295,642,465.38 67,562,199.94 363,204,665.32
Jul-15 773,679,148.25 36,968,789.09 810,647,937.33
Aug-15 701,294,113.85 N/A 701,294,113.85
Sep-15 567,601,005.43 196,295,727.94 763,896,733.37
Oct-15 645,641,292.96 206,461,653.55 852,102,946.51
Nov-15 787,212,195.72 221,824,955.97 1,009,037,151.69
Total 6,179,719,852.27 1,526,394,559.54 7,706,114,411.81
Source: NNPC Monthly Report

Downstream Petroleum Industry
FSDH Research 15 December 2015
Table 4: Downstream Petroleum Distribution
Period PMS AGO DPK Total White Products
Jan-15 512,396,097 20,966,547 303,183,934 836,546,578
Feb-15 499,945,695 19,004,650 93,309,212 612,259,557
Mar-15 795,149,204 31,644,056 124,187,347 950,980,607
Apr-15 582,586,368 17,227,372 191,077,678 790,891,418
May-15 566,290,963 13,988,465 271,031,091 851,310,519
Jun-15 582,416,290 11,601,322 42,022,793 636,040,405
Jul-15 570,023,134 3,292,716 40,506,046 613,821,896
Aug-15 516,699,923 6,562,586 83,581,196 606,843,705
Sep-15 456,814,949 19,676,371 31,412,691 507,904,011
Oct-15 645,791,079 26,159,353 4,752,112 676,702,544
Nov-15 779,924,371 23,357,124 104,737,196 908,018,691
Total 6,508,038,074 193,480,562 1,289,801,296 7,991,319,932
Source: NNPC Monthly Report
Table 5: Total Petroleum White Product Supply from NNPC (litres)
Total Product Supply (OPA and Refineries) Average Daily Supply PMS DPK Total PMS DPK Jan-15 699,283,104.65 392,409,007.76 1,091,692,112.41 22,557,519.50 12,658,355.09 Feb-15 533,570,559.73 84,308,867.10 617,879,426.84 19,056,091.42 3,011,030.97 Mar-15 983,445,452.75 84,985,825.23 1,068,431,277.98 31,724,046.86 2,741,478.23 Apr-15 633,985,558.32 171,709,078.46 805,694,636.78 21,132,851.94 5,723,635.95 May-15 729,020,008.96 349,630,514.46 1,078,650,523.43 23,516,774.48 11,278,403.69 Jun-15 353,465,044.38 67,562,199.94 421,027,244.32 11,782,168.15 2,252,073.33 Jul-15 827,073,745.25 66,828,773.09 893,902,518.33 26,679,798.23 2,155,766.87 Aug-15 817,758,622.85 83,780,928.00 901,539,550.85 26,379,310.41 2,702,610.58 Sep-15 639,612,705.43 200,070,575.94 839,683,281.37 21,320,423.51 6,669,019.20
Oct-15 748,111,125.96 206,461,653.55 954,572,779.51 24,132,616.97 6,660,053.34
Nov-15 837,737,052.72 221,824,955.97 1,059,562,008.69 27,924,568.42 7,394,165.20
Total 6,965,325,928.27 1,707,747,423.54 8,673,073,351.81 20,854,269.25 5,113,016.24
Source: NNPC Monthly Report

Downstream Petroleum Industry
FSDH Research 16 December 2015
4.4 Value of Imported Petrol Products:
A total value of N66.96bn was collected as sales revenue for white products sold by
PPMC in November 2015, compared with N52.85bn collected in October 2015. Total
revenues generated from the sales of white products for the period January to November
2015 stands at N581bn. PMS contributed 87.14% of the revenues collected with a value
of N506.28bn.
Table 6: Sales Revenue for Petroleum Products White Product Distributions (Naira)
Period PMS AGO DPK Total White Products
Jan-15 41,039,382,833 2,892,544,824 12,400,222,901 56,332,150,558
Feb-15 38,731,828,782 2,211,571,121 3,816,346,771 44,759,746,673
Mar-15 61,718,451,733 3,686,952,718 5,079,262,492 70,484,666,943
Apr-15 45,243,657,319 1,974,058,858 7,815,077,030 55,032,793,208
May-15 43,937,131,621 1,612,590,245 11,085,171,622 56,634,893,488
Jun-15 45,230,449,083 1,441,464,259 2,084,424,706 48,756,338,048
Jul-15 44,235,234,795 395,718,609 1,656,697,281 46,287,650,685
Aug-15 40,075,798,540 741,703,470 3,418,470,916 44,235,972,926
Sep-15 35,476,248,942 1,904,976,828 1,284,779,062 38,666,004,832
Oct-15 50,152,135,231 2,506,066,017 194,361,381 52,852,562,629
Nov-15 60,437,022,382 2,237,612,479 4,283,751,316 66,958,386,177
Total 506,277,341,261 21,605,259,429 53,118,565,478 581,001,166,168
Source: NNPC Monthly Report

Downstream Petroleum Industry
FSDH Research 17 December 2015
5.0 Analysis of the Downstream Petroleum Marketing Companies:
We analysed here the performance of the petroleum marketing companies that are listed
on the floors of the Nigerian Stock Exchange (NSE). The choice of these companies is
based on the availability of data. The companies we considered are listed on the table
below; also showing the nature of their business.
5.1 Industry Coverage:
As at December 31, 2014 there were eight (8) petroleum marketing companies
whose shares are listed on the floors of the Nigerian Stock Exchange. Seven (7) of
these companies are quoted on the Petroleum and Petroleum Products Distributors sub-
sectors on the floors of the NSE. The companies are Beco Petroleum Products Plc,
Conoil, Eterna Oil, Forte Oil, Mobil Oil, MRS Oil and TOTAL Oil, while one (1) is quoted
on the Integrated Oil and Gas Services sub-sector, which is Oando Plc. Oando’s
operations are substantially different from other companies, although their turnover is still
dominated by oil sales. For the purpose of this Industry size analysis, we covered
six (6) of the quoted petroleum marketing companies because of availability of
audited accounts. We believe the companies included in this report are
representative of the industry size.
5.2 Balance Sheet Analysis:
As at December 2014, the total Assets of the listed petroleum marketing companies in
Nigeria stood at N1.32trn, an increase of 43.13% from N921bn as at December 2013.
The company with the largest assets was Oando, with total assets of N889.37bn,
Table 7: International Oil Companies (Operators)
Company Products
1 Conoil Plc White Products, Lubricants and Liquefied Natural Gas (LPG)
2 Forte Oil Plc Fuel Business, Production Chemicals, Lubricants and Power Generation
3 Mobil Oil Nigeria Plc. Petroleum Products Marketing and Property Business
4 MRS Oil Nigeria Plc. White Products and Lubricants
5 Oando Plc Exploration & Production, Marketing, Refining & Terminals, Supply & Trading, Gas & Power, Energy Services, and Corporate Services
6 TOTAL Oil Plc White Products and General Trade (lubricants and greases)
The total liabilities in the industry
stood at N1.16trn, up by 71.47%
from 2013.
For the purpose of this Industry
size analysis we covered six (6)
petroleum marketing companies.

Downstream Petroleum Industry
FSDH Research 18 December 2015
accounting for 52.62% of the industry total assets. This was followed by Forte Oil with
total assets of N139.24bn and accounted for about 10.57% of the industry size. The
largest contributor
to the industry total assets was current assets which stood at N838.20bn and accounted
for 63.61% of the total assets.
The total liabilities in the industry stood at N1.16trn, up by 71.47% from 2013. The current
liabilities accounted for about 68.46% of the total liabilities. Oando also controlled the
largest liabilities in the industry standing at N843.87bn which represented 72.49% of the
total. The liabilities of the petroleum marketing companies are Oando N843.87trn; Forte
Oil N94.90bn; TOTAL N81.58bn; Conoil N70.50bn, MRS Oil N37.63bn and Mobil Oil
N35.68bn.
The total Net Assets (Total Equity) of the petroleum marketing industry stood at
N153.63bn as at December 2014, representing a decrease of 36.46% from N241.78bn
as at December 2013. Oando had the largest total equity at N45.51bn, accounting for
29.62% of the total. The contributions of other companies are Forte Oil (N44.33bn); MRS
Oil (N20.22bn); Conoil (N16.10bn); TOTAL (N13.93bn) and Mobil (N13.55bbn).
Table 8: Statement of Financial Position Conoil Forte Oil Mobil MRS Oando TOTAL
N'bn 2014 2013 2014 2013 2014 2013 2014 2013 2014 2013 2014 2013
Fixed Asset 5.23 5.67 56.80 55.39 36.97 29.82 20.57 22.40 693.47 359.53 25.18 23.28
Current Asset 81.37 76.70 82.44 49.29 12.26 10.78 37.28 43.30 195.91 188.41 70.33 56.12
Total Assets 86.59 82.37 139.24 104.68 49.23 40.60 57.85 65.69 889.37 547.95 95.51 79.40
Long Term Liabilities 0.53 0.88 12.76 15.68 19.34 16.81 5.54 6.00 326.00 93.54 2.98 3.00
Current Liabilities 69.97 63.46 82.15 46.65 16.34 14.38 32.09 40.07 517.86 315.29 78.60 63.16
Total Liabilities 70.50 64.33 94.90 62.33 35.68 31.19 37.63 46.07 843.87 408.83 81.58 66.16
Working Capital 11.40 13.24 0.29 2.63 (4.08) (3.60) 5.19 3.23 (321.96) (126.87) (8.27) (7.04)
Net Assets 16.10 18.04 44.33 42.35 13.55 9.41 20.22 19.63 45.51 139.11 13.93 13.24
Short Term Debt 22.66 11.83 28.79 9.89 1.71 0.00 11.61 15.81 311.01 183.41 15.68 16.61
Long Term Debt 0.00 0.00 12.25 14.90 0.00 1.09 0.00 0.00 162.33 71.87 0.00 0.00
Total Debt 22.66 11.83 41.04 24.79 1.71 1.09 11.61 15.81 473.34 255.29 15.68 16.61
ROE 5.18% 17.02% 10.05% 11.82% 47.19% 37.01% 3.68% 3.23% (393.97%) (3.36%) 31.76% 40.29%
Solvency and Liquidity: Solvency Ratio 3.27% 7.29% 6.97% 10.07% 20.81% 14.47% 6.42% 4.77% (21.25%) (1.14%) 8.98% 12.02%
Current Ratio (x) 1.16 1.21 1.00 1.06 0.75 0.75 1.16 1.08 0.38 0.60 0.89 0.89
Debt To Equity 140.75% 65.58% 92.57% 58.54% 12.61% 11.54% 57.45% 80.55% 1,040.16% 183.51% 112.59% 125.43%
Debt to Total Assets 26.16% 14.36% 29.47% 23.68% 3.47% 2.67% 20.08% 24.07% 53.22% 46.59% 16.42% 20.92%
Liabilities to Assets 81.41% 78.10% 68.16% 59.54% 72.48% 76.82% 65.05% 70.12% 94.88% 74.61% 85.42% 83.32%

Downstream Petroleum Industry
FSDH Research 19 December 2015
5.3 Profitability:
The industry’s Turnover (T/O) decreased marginally by 0.56% to N1.135trn in 2014
from N1.142trn in 2013. The company with the largest T/O was Oando which stood at
N424.68bn and represented 37.39% of the industry T/O. The difficult operating
environment has been leading to an erosion of profit for the operators in the industry. On
an aggregate basis, the industry recorded a Loss Before Tax (LBT) of N148.50bn as at
December 2014, from a Profit Before Tax (PBT) of N26.47bn recorded in 2013. The
distribution of the profits or losses of the companies are: Mobil N8.45bn; Forte Oil
N6.01bn; TOTAL N5.58bn; Conoil N1.53bn, and MRS Oil N1.28bn. The industry recorded a
Loss After Tax of N162.43bn as at December 2014, from the Profit After Tax (PAT) of N12.85bn
in 2013. Oando was responsible for the LAT of the industry as at 2014. Oando recorded
LAT of N179.28bn in 2014, compared with the LAT of N4.68bn in 2013.
Table 9: Comprehensive Income Statement Conoil Forte Oil Mobil MRS Oando TOTAL
N'bn 2014 2013 2014 2013 2014 2013 2014 2013 2014 2013 2014 2013
Turnover 128.35 159.54 170.13 128.03 79.58 78.74 92.33 87.79 424.68 449.87 240.62 238.16
Gross Profit 13.79 17.04 18.46 12.26 10.74 9.94 6.96 4.78 69.18 59.29 27.9 28.7
OPEX 10.88 12.92 11.73 12.38 7.49 7.47 5.78 6.48 277.63 47.87 21.24 21.05
Other Income 0.17 2.76 1.4 6.39 2.37 2.75 1.26 0.61 68.79 5.14 1.17 1.22
EBIT 3.08 6.88 8.14 6.27 5.62 5.23 2.43 -1.09 -139.67 16.55 7.84 8.87
Depreciation 1.47 1.62 2.16 1.27 1.03 1.03 1.67 1.56
2.91 2.62
EBITDA 4.55 8.5 10.29 7.54 6.65 6.26 4.1 0.47 -139.67 16.55 10.74 11.49
Finance Cost 2.31 2.25 4.21 1.88 0.19 0.15 1.43 0.78 31.44 15.83 2.62 1.98
Finance Income - - 2.08 2.13
0.28 3.28
0.34 1.23
Sundry Income 0.76 -0.05 - - 3.01 0.05 - - -0.22 0 - -
PBT 1.53 4.58 6.01 6.52 8.45 5.12 1.28 1.41 -171.32 0.71 5.56 8.12
Tax 0.7 1.51 1.55 1.52 2.05 1.64 0.54 0.77 7.96 5.39 1.13 2.79
PAT 0.83 3.07 4.46 5 6.39 3.48 0.74 0.63 -179.28 -4.68 4.42 5.33
GP Margin 10.74% 10.68% 10.85% 9.58% 13.49% 12.62% 7.54% 5.44% 16.29% 13.18% 11.60% 12.05%
EBIT Margin 2.40% 4.31% 4.78% 4.90% 7.07% 6.64% 2.63% -1.24% -32.89% 3.68% 3.26% 3.72%
EBITDA Margin 3.54% 5.33% 6.05% 5.89% 8.36% 7.94% 4.45% 0.54% -32.89% 3.68% 4.46% 4.82%
PBT Margin 1.19% 2.87% 3.53% 5.10% 10.61% 6.51% 1.39% 1.60% -40.34% 0.16% 2.31% 3.41%
PAT Margin 0.65% 1.92% 2.62% 3.91% 8.03% 4.42% 0.81% 0.72% -42.22% -1.04% 1.84% 2.24%
Interest Cover (x) 1.33 3.05 1.93 3.34 30.23 34.6 1.7 -1.39 -4.44 1.05 2.99 4.48
EPS (N) 1.2 4.42 4.08 4.64 16.42 8.94 2.93 2.5 -14.9 -0.69 0.01 0.02
The industry’s Turnover (T/O)
decreased marginally by 0.56% to
N1.135bn in 2014 from N1.142trn in
2013.

Downstream Petroleum Industry
FSDH Research 20 December 2015
5.4 Ratio Analysis in the Industry:
The industry’s average Gross Profit margin stood at 11.75% in 2014, up from
10.59% in 2013. The increase in operating costs and expenses; delay in the
payment of petrol subsidy by the government; and high finance charges led to a
fall in both the PBT and PAT Margins in 2014 for the operators. However, Mobil
recorded an increase in its PBT and PAT Margins during the period. Mobil’s PBT Margin
increased to 10.61% in 2014, from 6.51% in 2013. Its PAT Margin also increased to
8.03% in 2014, from 4.42% in 2013. MRS Oil also recorded an increase in its PAT
Margin to 0.81% in 2014, from 0.73% in 2013, but with a decrease in its PBT Margin to
1.39% in 2014, from 1.60% in 2013.
The debt-to-total assets for most of the companies analysed showed that the level of
financial leverage can be increased to achieve optimal use of debt. The debt-to-total
asset ratio showed that Mobil had the lowest at 3.47%; followed by TOTAL at 16.42%;
MRS Oil at 20.08%, Conoil at 26.16% and Forte Oil 29.47%. However, Oando had a
debt-to-total asset of 53.22% as at FY 2014. The solvency ratio which measures the
ability of the company to meet its debt and other obligations also showed that Mobil has
the highest solvency ratio of 20.81% in 2014. The other companies’ aside Oando had
positive but lower solvency ratios of less than 10%. Oando may need to raise additional
equity capital to reposition the company. Oando has a negative solvency ratio of 21.25%
in 2014.
Under a fuel subsidy removal this ratios will become more attractive for bank lending
activities. The operators may require both long and short term debt financing.
The debt-to-total assets for
most of the companies
analysed showed that the
level of financial leverage can
be increased to achieve
optimal use of debt.

Downstream Petroleum Industry
FSDH Research 21 December 2015
Conoil Rating: BUY
Current Price: N26.04
Fair Value: N39.04
6.0 Company Analysis:
6.1Conoil Plc:
6.1.1 Q3 2015 Performance Analysis:
The unaudited Q3 2015 result for the period ended September 2015 shows that
Turnover (T/O) decreased by 42.28% to N60.16bn, compared with N104.22bn in
2014.The cost of sales decreased by 45.14% to N51.25bn from N93.43bn in Q3 2014.
The cost of sales as a percentage of T/O improved to 85.19% from 89.64% as at Q3
2014. The administrative, selling and distribution expenses decreased by 4.81% to
N6.99bn. However, these expenses as a percentage of T/O increased to 11.61% in Q3
2015 from 7.04% in Q3 2014.
Other operating income stood at N2.67bn as at Q3 2015, from N165.38mn in Q3
2014. Conoil recorded an increase of 85.92% in its finance charges to N2.83bn in Q3
2015, from N1.52bn in 2014. PBT fell to N1.76bn in Q3 2015, a decrease of 16.13% from
N2.10bn in 2014.The tax provision also decreased by 16.13% to N563.26mn, from
N671.54mn. PAT stood at N1.20bn in Q3 2015, from N1.43bn in 2014, representing a
decrease of 16.13%. Despite the decrease in the company’s profits, there was an
increase in its profit margins in Q3 2015, compared with Q3 2014. This was because of
an increase in the operating income. The PBT Margin in Q3 2015 increased over the Q3
2014.The PBT margin increased to 2.93% in Q3 2015, from 2.01% as at Q3 2014. The
PAT margin stood at 1.99% in Q3 2015, up from 1.37% in the corresponding period of
2014.
The result also indicates that the percentage of T/O, PBT, and PAT in the Q3 2015 to the
Audited T/O, PBT and PAT for the period ended December 2014 are: 46.87%, 114.88%
and 143.44%, respectively. Given the run rate, the company may not meet its previous
year’s top line performance but should surpass its PBT and PAT performance.
Table 10: Financial Performance (N’bn)
Q3 2015 Q3 2014 Change (%) T/O 60.16 104.22 (42.28) EBIT 4.59 3.62 (26.75) PBT 1.76 2.10 (16.13) PAT 1.20 1.43 (16.13)
The turnover in Q3 2015 decreased
by 42.28% to N60.16bn.
The decline in the PBT is mainly due
to the sharp increase in the finance
cost in 2014.
The company’s profit margins
increased in Q3 2015, compared with
Q3 2014.

Downstream Petroleum Industry
FSDH Research 22 December 2015
A cursory look at the balance sheet position as at Q3 2015 compared with FY Dec 2014
shows a decrease in the company’s fixed assets. The total fixed assets decreased by
5.24% to N4.95bn in Q3 2015 from N5.23bn in FY 2014. The inventory increased by
30.42% to N7.19bn in Q3 2015, from N5.52bn in FY 2014. The cash and bank balances
recorded a decrease of 22.70% from N31.16bn in FY 2014 to N24.08bn in Q3 2015. The
trade debtors and other receivables decreased in Q3 2015 by 24.80% to N2.42bn, from
N3.22bn in FY 2014. The trade creditors also decreased by 22.48% to N14.52bn from
N18.73bn as at FY 2014. The working capital stood at N10.84bn in Q3 2015 from
N11.40bn in Q3 2014, while net assets for the period decreased by 5.14% to stand at
N15.27bn, from N16.10bn as at FY 2014.
Table 11: Quarterly Result Highlights (N'bn)
Q3 2015 Q2 2015 Q1 2015 Q4 2014 Q3 2014
Turnover 17.13 20.66 22.36 24.13 25.72
PBT 1.23 1.28 (0.75) (0.57) 0.61
PAT 0.84 1.19 (0.83) (0.59) 0.42
Table 12: Profitability Margins (N’bn)
Q3 2015 Q3 2014
GP* Margin 14.81 10.36
EBIT Margin 7.63 3.47
PBT Margin 2.93 2.01
PAT Margin 1.99 1.37
*GP – Gross Profit
The trade debtors and other receivables decreased in Q3 2015 by 24.80% to N2.42bn, from N3.22bn in FY 2014.
Q3 2012 Q3 2013 Q3 2014 Q3 2015
Q3 Revenue 38.56 42.17 25.72 17.13
0.00
10.00
20.00
30.00
40.00
50.00
60.00
Q3 Revenue Trend (N'bn)
Downstream Petroleum Industry
FSDH Research 23 December 2015
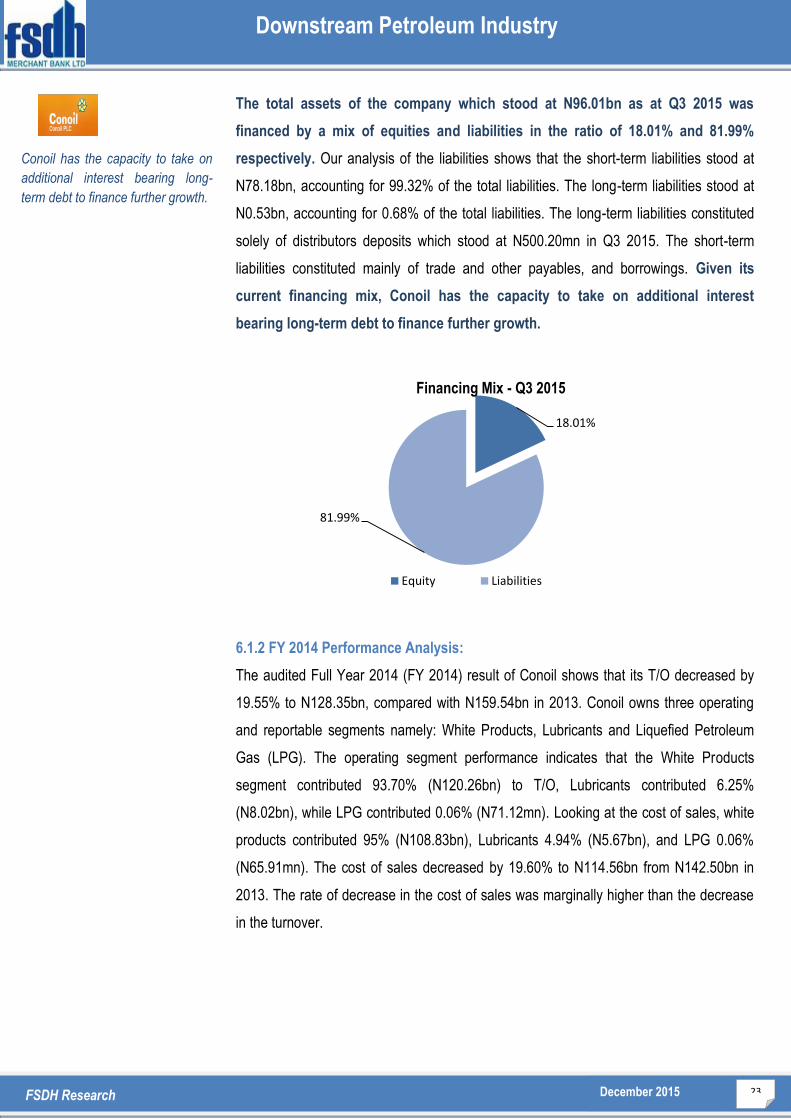
The total assets of the company which stood at N96.01bn as at Q3 2015 was
financed by a mix of equities and liabilities in the ratio of 18.01% and 81.99%
respectively. Our analysis of the liabilities shows that the short-term liabilities stood at
N78.18bn, accounting for 99.32% of the total liabilities. The long-term liabilities stood at
N0.53bn, accounting for 0.68% of the total liabilities. The long-term liabilities constituted
solely of distributors deposits which stood at N500.20mn in Q3 2015. The short-term
liabilities constituted mainly of trade and other payables, and borrowings. Given its
current financing mix, Conoil has the capacity to take on additional interest
bearing long-term debt to finance further growth.
6.1.2 FY 2014 Performance Analysis:
The audited Full Year 2014 (FY 2014) result of Conoil shows that its T/O decreased by
19.55% to N128.35bn, compared with N159.54bn in 2013. Conoil owns three operating
and reportable segments namely: White Products, Lubricants and Liquefied Petroleum
Gas (LPG). The operating segment performance indicates that the White Products
segment contributed 93.70% (N120.26bn) to T/O, Lubricants contributed 6.25%
(N8.02bn), while LPG contributed 0.06% (N71.12mn). Looking at the cost of sales, white
products contributed 95% (N108.83bn), Lubricants 4.94% (N5.67bn), and LPG 0.06%
(N65.91mn). The cost of sales decreased by 19.60% to N114.56bn from N142.50bn in
2013. The rate of decrease in the cost of sales was marginally higher than the decrease
in the turnover.
18.01%
81.99%
Financing Mix - Q3 2015
Equity Liabilities
Conoil has the capacity to take on
additional interest bearing long-
term debt to finance further growth.

Downstream Petroleum Industry
FSDH Research 24 December 2015
Other operating income decreased significantly to stand at N934.62mn as at 2014,
representing a decrease of 65.51% compared with N2.71bn recorded in 2013.
Consequently, the Earnings Before Interest and Tax (EBIT) decreased to N3.84bn in
2014, a decrease of 43.76% from N6.83bn in 2013.
The company recorded an increase of 2.48% in its finance cost to N2.31bn in 2014 from
N2.25bn in 2013. The Profit Before Tax (PBT) stood at N1.53bn in 2014, a decrease of
66.52% from N4.58bn recorded in the corresponding period of 2013. The decline in the
PBT was impacted by the trickle-down effect of the sharp drop in other income and the
increase in operating expenses in 2014. The tax provision recorded a decrease of
53.66% to N697.75mn from N1.51bn, leading to a Profit After Tax (PAT) of N834.42mn in
2014 from N3.07bn recorded in the corresponding period of 2013, this represents a
decrease of 72.82%.
The company’s profit margins decreased in 2014 compared with 2013. This is a reflection
of the fall in revenue and the increase in operating expenses recorded by the company.
The PBT margin decreased to 1.19% in 2014 from 2.87% in 2013. The PAT margin also
decreased to 0.65% in 2014, down from 1.92% in 2013.
Table 14: Financial Performance (N’bn)
FY 2014 FY 2013 Change T/O 128.35 159.54 (19.55%) EBIT 3.84 6.83 (43.76%) PBT 1.53 4.58 (66.52%) PAT 0.83 3.07 (72.82%)
Table 13: Profitability Margins
FY 2014 FY 2013 FY 2012 GP* Margin 10.74% 10.68% 10.78%
EBIT Margin 2.99% 4.28% 0.77% PBT Margin 1.19% 2.87% 0.77%
PAT Margin 0.65% 1.92% 0.48% *GP – Gross Profit
The company recorded an increase of 2.48% in its finance cost to N2.31bn in 2014 from N2.25bn in 2013.
Downstream Petroleum Industry
FSDH Research 25 December 2015
Conoil’s balance sheet position as at FY 2014, compared with the position as at FY 2013
shows a decrease in the company’s fixed assets. The total fixed assets decreased by
7.86% to N5.23bn from N5.67bn in FY 2013. The stock decreased to N5.52bn in FY 2014
from N10.64bn in FY 2013. The cash and bank balances recorded an increase of 12.13%
from N27.79bn in FY 2013 to N31.16bn in 2014. The trade debtors decreased in 2014 by
57.28% to N3.22bn, from N7.53bn in the FY 2013 period. The trade creditors decreased
by 19.70% to N23.93bn from N29.80bn as at FY 2013. The working capital stood at
N11.40bn, down from N13.24bn recorded in FY 2013, while net assets for the period
decreased by 10.76% to stand at N16.10bn, from N18.04bn as at FY 2013.
The total assets of the company which stood at N86.59bn as at FY 2014 were financed
by a mix of equities and liabilities in the ratio of 18.59% and 81.41% respectively. Our
analysis of the liabilities shows that the short-term liabilities stood at N69.97bn,
accounting for 99.25% of the total liabilities, while the long-term liabilities stood at
N530.86mn, accounting for 0.75% of the total liabilities. The long-term liabilities
constituted mainly of Distributors Deposits, which stood at N498.35mn, which increased
by 0.39% compared with the FY 2013.
The trade debtors decreased in 2014 by 57.28% to N3.22bn, from N7.53bn in the FY 2013 period.
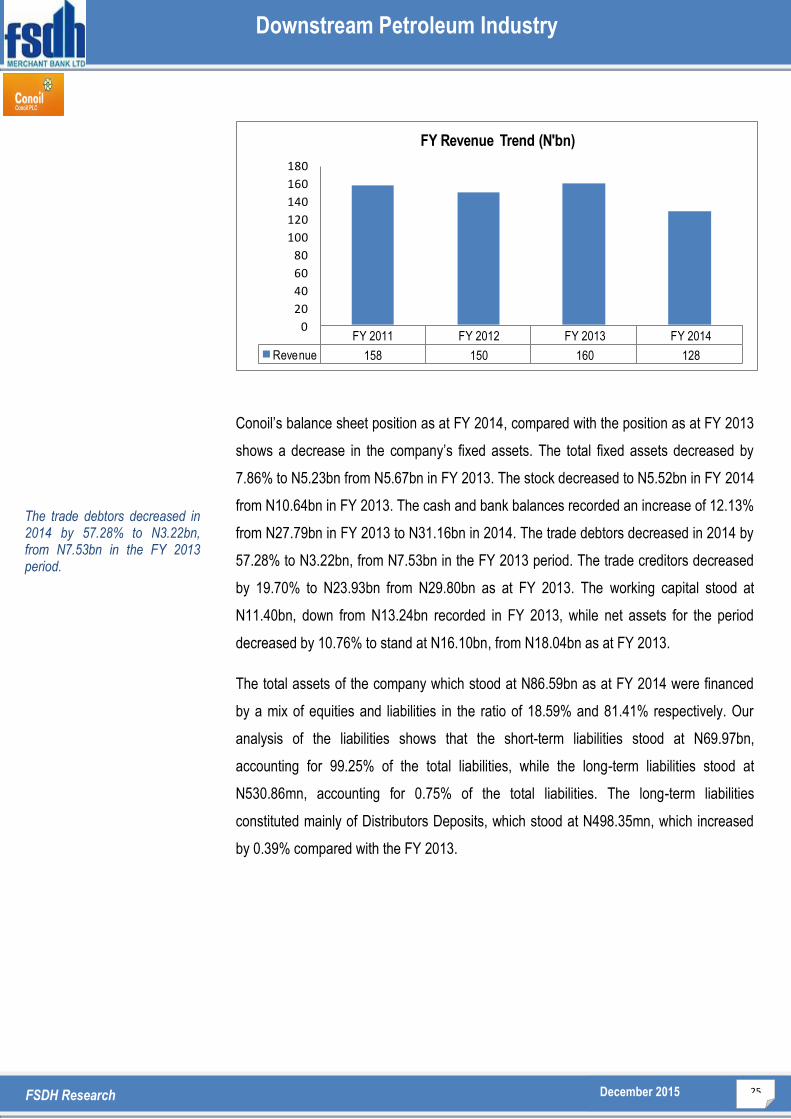
FY 2011 FY 2012 FY 2013 FY 2014
Revenue 158 150 160 128
0
20
40
60
80
100
120
140
160
180
FY Revenue Trend (N'bn)

Downstream Petroleum Industry
FSDH Research 26 December 2015
6.1.3 Drivers of Performance:
Conoil performance in Q3 2015 and FY 2014 along with the industry trend was mainly
impacted by a number of factors. These factors include
The devaluation of the Naira
The delay in the payment of oil subsidy by the government, and
The high interest charges from its borrowings.
6.1.4 Strategic Focus:
The company has built a new production line at its Port Harcourt factory to
consolidate on its lubricant market position. The new line was built to boost capacity
and meet increasing demand. In its aviation arm, it is acquiring new production facility to
bridge the demand gap between both national and international customers. It also plans
to grow in all other business segments as it strives to maintain good presence in the LPG
market.
6.1.5 SWOT Analysis:
Strengths:
o Diversified products in the
market
o Growing products with high
profit margins
Weaknesses:
o Declining revenue and profits o Declining margins o Limited visibility and market share
o Rising administrative and distribution
costs
Opportunities:
o Large market size in Nigeria o Availability of raw materials o Removal of fuel subsidy
Threats:
o Poor road network for distribution of
products
o Insecurity in some northern part of the
country
o Foreign exchange rate risk o High interest rate in the country
o Weak macroeconomic environment
The company has built new production line at its Port Harcourt factory to consolidate on its lubricant market position.

Downstream Petroleum Industry
FSDH Research 27 December 2015
Forte Oil Rating: SELL
Current Price: N242.00
Fair Value: N114.23
6.2 Forte Oil Plc:
6.2.1 Q3 2015 Performance Analysis:
The unaudited Q3 2015 result for the period ended September 2015 shows that Turnover
T/O decreased by 25.26% to N91.62bn, compared with N122.58bn in 2014.The cost of
sales decreased by 28.05% to N78.64bn from N109.29bn in Q3 2014. The cost of sales
as a percentage of T/O declined to 85.83% from 89.15% as at Q3 2014. The
administrative, selling and distribution expenses increased by 29.21% to N10.06bn in Q3
2015. The expenses as a percentage of T/O increased to 10.98% in Q3 2015 from 6.35%
in Q3 2014.
The other operating income stood at N2.66bn as at Q3 2015, representing an increase of
216.25%, compared with N842.66mn in Q3 2014. Forte Oil recorded a net finance charge
of N292.72mn in Q3 2015, from N1.15bn in 2014. PBT increased to N5.29bn in Q3 2015,
an increase of 1.63% from N5.20bn in 2014.The tax provision decreased by 15.49% to
N1bn, from N1.19bn. PAT stood at N4.28bn in Q3 2015, from N4.02bn in 2014,
representing an increase of 6.69%. There was an improvement in the company’s profit
margins in Q3 2015, compared with Q3 2014. The PBT margin increased to 5.77% in Q3
2015, from 4.24% as at Q3 2014. The PAT margin currently stands at 4.68% in Q3 2015,
up from 3.28% in the corresponding period of 2014.
The result also indicates that the percentage of T/O, PBT, and PAT in the Q3 2015 to the
Audited T/O, PBT and PAT for the period ended December 2014 are: 53.85%, 88.04%
and 96.14%, respectively. Given the run rate, the company is unlikely to meet its previous
year topline, but should surpass its previous year’s profit.
Table 16: Quarterly Result Highlights (N'bn)
Q3 2015 Q2 2015 Q1 2015 Q4 2014 Q3 2014
Turnover 30.45 28.11 33.06 47.55 42.97
PBT 2.03 2.41 0.84 (0.80) 1.01
PAT 1.75 1.75 0.78 0.53 0.79
Table 15: Quarterly Financial Performance (N’bn)
Q3 2015 Q3 2014 Change (%) T/O 91.62 122.58 (25.26%) EBIT 5.58 6.35 (12.10%) PBT 5.29 5.20 1.63% PAT 4.28 4.02 6.69%
The turnover in Q3 2015 decreased
by 25.26% to N91.62bn.
The PAT stood at N4.28bn in Q3
2015, from N4.02bn in 2014,
representing an increase of 6.69%.

Downstream Petroleum Industry
FSDH Research 28 December 2015
A cursory look at the balance sheet position as at Q3 2015 compared with FY Dec 2014
shows an increase in the company’s fixed assets. The total fixed assets increased by
13.81% to N64.64bn in Q3 2015 from N56.80bn in FY 2014. The inventory decreased by
43.85% to N6.85bn in Q3 2015, from N12.20bn in FY 2014. The cash and bank balances
recorded a decrease of 25.89% from N16.06bn in FY 2014 to N11.90bn in Q3 2015. The
trade debtors and other receivables decreased in Q3 2015 by 11.50% to N47.44bn, from
N53.60bn in FY 2014. The trade creditors decreased by 18.04% to N43.39bn from
N52.94bn as at FY 2014. The working capital stood at negative N1.74bn in Q3 2015 from
N291.25mn in Q3 2014, while net assets for the period increased by 3.69% to stand at
N45.97bn, from N44.34bn as at FY 2014.
The total assets of the company which stood at N131.26bn as at Q3 2015 was
financed by a mix of equities and liabilities in the ratio of 35.02% and 64.98%
respectively. Our analysis of the liabilities shows that the short-term liabilities stood at
N68.36bn, accounting for 80.15% of the total liabilities. The long-term liabilities stood at
N16.93bn, accounting for 19.85% of the total liabilities. The long-term liabilities
constituted mainly of loans and borrowings which stood at N14.91bn in Q3 2015. The
short-term liabilities constituted mainly of trade and other payables and bank overdrafts.
Table 17: Profitability Margins
Q3 2015 Q3 2014 GP* Margin 14.17% 10.85% EBIT Margin 6.09% 5.18% PBT Margin 5.77% 4.24% PAT Margin 4.68% 3.28% *GP – Gross Profit
The trade debtors and other receivables decreased in Q3 2015 by 11.50% to N47.44bn, from N53.60bn in FY 2014.

Downstream Petroleum Industry
FSDH Research 29 December 2015
6.2.2 FY 2014 Performance Analysis:
The audited Full Year 2014 (FY 2014) result of Forte Oil for the period ended December
31, 2014 shows that its Turnover (T/O) increased by 32.88% to N170.13bn, compared
with N128.03bn recorded in the corresponding period of 2013. The operating segment
performance indicates that the Fuels Business Segment contributed 89.42%
(N152.12bn) to T/O, while Production Chemicals, Lubricants and Grease, and
Power Generation contributed 1.58% (N2.68bn), 3.68% (N6.26bn), and 5.33%
(N9.06bn) respectively.
The cost of sales increased by 31.01% to N151.66bn in 2014, from N115.77bn recorded
in 2013. The rate of increase in the cost of sales was marginally lower than the increase
in the turnover. The Power Generation Business Segment contribution to the cost of
sales increased to 2.85% in 2014, from 0.73% in 2013. The distribution and
administrative expenses as a percentage of T/O decreased from 9.67% in 2013 to 6.89%
in 2014. This demonstrates the company’s drive to improve on the efficiency and
effectiveness of its operations in order to lower costs and boost profitability.
35.02%
64.98%
Financing Mix - Q3 2015
Equity Liabilities
Table 18: Financial Performance (N’bn)
FY 2014 FY 2013 Change
T/O 170.13 128.03 32.88%
EBIT 10.21 8.40 21.55%
PBT 6.01 6.52 (7.94%)
PAT 4.46 5.00 (10.95%)
The cost of sales increased by
31.01% to N151.66bn in 2014, from
N115.77bn recorded in 2013.
The Fuels Business Segment
contributed 89.42% (N152.12bn) to
T/O

Downstream Petroleum Industry
FSDH Research 30 December 2015
Other operating income decreased significantly to stand at N1.40bn as at 2014,
representing a decrease of 78.12% compared with N6.39bn recorded in 2013. However,
the Earnings Before Interest and Tax (EBIT) increased to N10.21bn in 2014, an increase
of 21.55% from N8.40bn in 2013. The company recorded an increase of 124.02% in its
finance cost of N4.21bn in 2014 from N1.88bn in 2013. The delay in the payment of
subsidy was partly responsible for this. PBT stood at N6.01bn in 2014, a decrease of
7.94% from N6.52bn recorded in 2013. The decline in PBT was majorly due to the sharp
increase in the company’s finance cost in 2014. The tax provision recorded a modest
increase of 1.94% to N1.55bn from N1.52bn, leading to a PAT of N4.46bn in 2014 from
N5bn recorded in 2013, representing a decrease of 10.95%.
The company’s profit margins decreased in 2014 compared with 2013, except the gross
profit margin. This is a reflection of the impact of the increase in finance charges and
drop in the income on the company’s bottom line. The PBT margin decreased to 3.53% in
2014 from 5.10% in 2013. The PAT margin also decreased to 2.62% in 2014, down from
3.91% in 2013.
Table 19: Profitability Margins
FY 2014 FY 2013 FY 2012
GP* Margin 10.85% 9.58% 11.15%
EBIT Margin 4.78% 4.90% 2.96%
PBT Margin 3.53% 5.10% 1.26%
PAT Margin 2.62% 3.91% 1.11%
*GP – Gross Profit
FY 2011 FY 2012 FY 2013 FY 2014
FY Revenue 117.00 90.98 128.03 170.13
-20.00
30.00
80.00
130.00
180.00
FY Revenue Trend (N'bn)
The company recorded an increase
of 124.02% in its finance cost of
N4.21bn in 2014 from N1.88bn in
2013.

Downstream Petroleum Industry
FSDH Research 31 December 2015
A cursory look at Forte Oil’s balance sheet position as at FY 2014 compared with the
position as at FY 2013 shows an increase in the company’s fixed assets. The total fixed
assets increased by 2.64% to N56.80bn from N55.39bn in FY 2013, while stock
increased to N12.20bn from N10.58bn in FY 2013. The cash and bank balances
recorded a substantial increase of 136.57% from N6.79bn in FY 2013 to N16.06bn in
2014. The trade debtors also increased significantly in 2014 by 157.17% to N16.16bn
from N6.28bn in the FY 2013 period. The receivables expressed in the financial
statements are that of fuel subsidy receivables and receivables accruing from the
company’s power business. The trade creditors increased by 64.39% to N26.05bn from
N15.85bn as at FY 2013. The working capital stood at N291.25mn, significantly down
from N2.63bn recorded in FY 2013, while net assets for the period increased by 4.69% to
stand at N44.33bn from N42.35bn as at FY 2013.
The total assets of the company which stood at N139.24bn as at FY 2014 were financed
by a mix of equities and liabilities in the ratio of 31.84% and 68.16% respectively. Our
analysis of the liabilities shows that the short-term liabilities stood at N82.15bn,
accounting for 86.56% of the total liabilities, while the long-term liabilities stood at
N12.76bn, accounting for 13.44% of the total liabilities. The long-term liabilities
constituted mainly of term loan, which stood at N12.25bn, which declined by 17.77%
compared with the FY 2013. The bulk of the long term liabilities relate to the
refinancing of its Geregu Power Plant.
31.84%
68.16%
Financing Mix - FY 2014
Equity Liabilities
The bulk of the long term liabilities
relate to the refinancing of its Geregu
Power Plant.
The receivables expressed in the financial statements are that of fuel subsidy receivables and receivables accruing from the company’s power
business.

Downstream Petroleum Industry
FSDH Research 32 December 2015
6.2.3 Drivers of Performance:
Forte Oil is a major marketer of refined petroleum products in Nigeria. The company has
a widespread of dealer-assisted and dealer-developed retail outlets spread across the
country. It has a fuel storage installation at Apapa, Lagos, a storage depot at Onne,
Rivers State, an aviation joint users hydrant in Ikeja, Lagos. It also has joint aviation
depots in Abuja, Port Harcourt and Kano. The company operates in Ghana as AP Oil and
Gas Ghana Limited.
We gathered from the company that 75% of the 25.26% decline in sales in Q3 2015
was as a result of reduction in pump price of regulated product. Pump price of PMS
was reduced by over 10% in Q1 2015. The balance 25% is attributable to reduced import
of PMS due to huge unpaid fuel subsidies and foreign exchange exposures.
Forte Oil performance in 2014 was impacted by a number of factors. These are:
The exchange rate devaluation
The delay in the payment of oil subsidy by the Government
The increase in the company’s cost of sales due to importation process delays.
The delay in the declaration of the Transition Electricity Market (TEM) in the power sector
also contributed to its poor performance. To counter these challenges, the company’s
Dollar denominated loans have been converted to Naira loans and hedging instruments
are being used to address any issues going forward.
The capacity utilization at the Geregu Power plant is currently 33%. A major factor
that has been limiting the capacity utilization of the plant is the government’s
unwillingness to begin the Transitional Phase (TP) of the Power Sector Privatization
Scheme (PSPS), which should have seen the end of the Interim Phase since Q2 2014.
Forte Oil believes that the TP of the PSPS will raise the capacity of the plant by a large
margin. The positive development in the powers sector should contribute to a sustainable
growth of the company in the short-to-medium term.
The company’s Dollar denominated
loans have been converted to Naira
loans and hedging instruments are
being used to address any issues
going forward.
The delay in the declaration of TEM in the power sector contributed to its poor performance.

Downstream Petroleum Industry
FSDH Research 33 December 2015
6.2.4 Strategic Focus:
The company’s future growth drivers are highlighted below:
Forte oil plans to achieve market dominance through the expansion of its retail
infrastructure, commercial business and non-fuel revenue.
It has initiated diversification into the upstream space through the acquisition of
upstream assets.
It also plans to achieve and generate the installed capacity of 414MW at Geregu
through a major overhaul of the power plant. It aims to boost its power supply
from the plant by an additional 60% and increase distribution efficiency.
Forte Oil continues its diversification into related high margin products and
improvement on logistics through the acquisition of an additional 100 trucks to
supplement its existing 100 trucks.
6.2.5 SWOT Analysis:
Strengths:
o Diversification from the regulated fuel
business
o The growth in power generating
business
o Management with good knowledge
and expertise in the local market
o Improved corporate governance
structure.
Weaknesses:
o Decline in revenue
o High cost of borrowing
o Huge amount outstanding as
receivables under the Petroleum
Support Fund (PSF) scheme.
Opportunities:
o Large market size in Nigeria
o Favourable policy change and security
with new administration
o Growth prospects in the power sector
Threats:
o Poor road network for distribution
o Insecurity in the north
o Foreign exchange rate risk
o High interest rate in the country
o Weak macroeconomic environment.
Forte oil plans to achieve market
dominance through the expansion of
retail infrastructure, commercial
business and non-fuel revenue.

Downstream Petroleum Industry
FSDH Research 34 December 2015
Mobil Oil Rating: BUY
Current Price: N132.41
Fair Value: N163.25
6.3 Mobil Oil Nigeria Plc: 6.3.1 Q3 2015 Performance Analysis:
The unaudited Q3 2015 result for the period ended September 2015 shows that T/O
decreased by 25.35% to N45.33bn, compared with N60.72bn in 2014. Cost of sales
decreased by 28.97% to N37.12bn from N52.26bn in Q3 2014. The company’s cost of
sales as a percentage of T/O declined to 81.89%, from 86.07% as at Q3 2014. The
administrative, selling and distribution expenses increased by 18.50% to N6.23bn as at
Q3 2015. The expenses as a percentage of T/O increased to 13.74% in Q3 2015 from
8.66% in Q3 2014.
The other operating income stood at N3.35bn as at Q3 2015, representing an increase of
82.30%, compared with N1.84bn in Q3 2014. Mobil recorded a net finance charge of
N58.70mn in Q3 2015, from a net finance income of N77bn in 2014. The PBT fell to
N5.25bn in Q3 2015, a decrease of 33.53% from N7.89bn in 2014. The tax provision also
decreased by 15.83% to N1.60bn, from N1.90bn. The PAT stood at N3.65bn in Q3 2015,
from N6bn in 2014, representing a decrease of 39.13%.
There was a decrease in its profit margins in Q3 2015, compared with Q3 2014. This was
a result of the difficult operating environment in which it operated. The PBT margin
decreased to 11.58% in Q3 2015 from 13% as at Q3 2014. The PAT margin currently
stands at 8.05% in Q3 2015, down from 9.88% in the corresponding period of 2014.
The percentage of T/O, PBT, and PAT in the Q3 2015 to the Audited T/O, PBT and PAT
for December 2014 are: 56.95%, 62.13% and 57.09%, respectively. Given the run rate,
the company is unlikely to meet its previous year’s performance.
Table 20: Financial Performance (N’bn)
Q3 2015 Q3 2014 Change
T/O 45.33 60.72 (25.30%)
EBIT 5.33 5.04 (5.71%)
PBT 5.25 7.89 (33.53%)
PAT 3.65 6.00 (39.13%)
Table 21: Quarterly Result Highlights (N'bn)
Q3 2015 Q2 2015 Q1 2015 Q4 2014 Q3 2014
Turnover 13.50 15.33 16.50 18.87 18.55
PBT 1.14 2.04 2.07 0.55 1.74
PAT 0.74 1.42 1.49 0.40 1.18
The turnover in 2015 decreased by
25.35% to N45.33bn.
The PAT stood at N3.65bn in Q3
2015, from N6bn in 2014,
representing a decrease of 39.13%.

Downstream Petroleum Industry
FSDH Research 35 December 2015
A cursory look at the balance sheet position as at Q3 2015 compared with FY Dec 2014
shows an increase in the company’s fixed assets. The total fixed assets increased by
4.42% to N38.60bn in Q3 2015 from N36.97bn in FY 2014. The inventory increased by
15.25% to N5.03bn in Q3 2015, from N4.36bn in FY 2014. The cash and bank balances
recorded a decrease of 91.75% from N372.71mn in FY 2014 to N30.74mn in Q3 2015.
The trade debtors and other receivables decreased in Q3 2015 by 15.86% to N6.21bn,
from N7.38bn in FY 2014. The trade creditors also decreased by 29.23% to N6.99bn
from N9.88bn as at FY 2014. The working capital stood at negative N991.43mn in Q3
2015 from negative N4.08bn in Q3 2014, while net assets for the period decreased by
9.37% to stand at N14.82bn, from N13.55bn as at FY 2014.
Table 22: Profitability Margins
Q3 2015 Q3 2014
GP* Margin 18.11% 13.93%
EBIT Margin 11.75% 8.30%
PBT Margin 11.58% 13.00%
PAT Margin 8.05% 9.88%
*GP – Gross Profit
The total asset of the company was financed by a mix of equities and liabilities in the ratio of 29.61% and 70.39% respectively.

Downstream Petroleum Industry
FSDH Research 36 December 2015
29.61%
70.39%
Financing Mix - Q3 2015
Equity Liablities
The total assets of the company which stood at N50.05bn as at Q3 2015 was
financed by a mix of equities and liabilities in the ratio of 29.61% and 70.39%
respectively. Our analysis of the liabilities shows that the short-term liabilities stood at
N12.44bn, accounting for 35.31% of the total liabilities. The long-term liabilities stood at
N22.79bn, accounting for 64.69% of the total liabilities. The long-term liabilities
constituted solely of non-current portion of deferred revenue which stood at N20.58bn in
Q3 2015.
Mobil should restructure its
capital towards more equity
financing in order to reduce its
interest payment burden.

Downstream Petroleum Industry
FSDH Research 37 December 2015
6.3.2 FY 2014 Performance Analysis:
The audited Full Year 2014 (FY 2014) result of Mobil for the period ended December 31,
2014 shows that its Turnover (T/O) increased marginally by 1.07% to N79.58bn,
compared with N78.74bn in 2013. The operating segment performance indicates that the
Petroleum Product Marketing business segment contributed 100% (N79.58bn) to T/O.
The major contributors to the other incomes were: rental income of N2.11bn; other
operating income of N133.33mn; and backcourt (rental) income of N144.19mn. The cost
of sales increased marginally by 0.06% to N68.85bn in FY 2014 from N68.80bn recorded
in FY 2013. The rate of increase in Mobil’s cost of sales is lower than the increase in its
turnover. This boosted gross profit to N10.74bn in 2014, from N9.94bn in 2013. The
distribution and administrative expenses as a percentage of T/O decreased marginally
from 8.13% in 2013 to 8.01% in 2014. The growth in the company’s revenue in
comparison to the decline in its operating expenses shows the efficiency drive of the
company and the effectiveness of its cost saving strategies.
Table 23: Financial Performance (N’bn)
FY 2014 FY 2013 Change
T/O 79.58 78.74 1.07%
EBIT 5.66 5.22 7.61%
PBT 8.45 5.12 64.87%
PAT 6.39 3.48 83.66%
The cost saving initiative implemented by the company and the increase in other income realized by the company also boosted PAT in 2014.
The short-term liabilities constituted mainly of inventories and debtors/other
receivables.

Downstream Petroleum Industry
FSDH Research 38 December 2015
Other operating income decreased to stand at N2.37bn as at 2014, representing a
decrease of 13.73% compared with N2.75bn recorded in 2013. However, the EBIT
increased to N5.62bn in 2014 by 7.61% from N5.22bn in 2013. The company recorded
an increase of 22.48% in its finance cost to 186.10mn in 2014 from N151.94mn in 2013.
This was mainly due to the increase in interest rates from the devaluation of the Naira.
The PBT stood at N8.45bn in 2014, an increase of 64.87% from N5.12bn recorded in the
corresponding period of 2013. The increase in PBT was due to the gain of N2.85bn from
the sale of fixed asset; we do not expect this to reoccur in the coming years. The cost
saving initiative implemented by the company and the increase in other income realized
by the company also boosted PAT in 2014. The company’s tax provision recorded an
increase of 25.04% to N2.05bn from N1.64bn. Its Profit After Tax (PAT) was N6.39bn in
2014, from N3.48bn in 2013, representing an increase of 83.66%.
The company’s profit margins increased in 2014 compared with 2013. This reflects the
impact from the gains made from the sale of a fixed asset. The PBT Margin in 2014
increased over the 2013 figure. The PBT margin increased to 10.61% in 2014 from
6.51% in 2013. The PAT margin also increased to 8.03% in 2014, up from 6.03% in
2013.
Table 24: Profitability Margins
FY 2014 FY 2013 FY 2012
GP* Margin 13.49% 12.62% 10.16%
EBIT Margin 7.06% 6.63% 5.37%
PBT Margin 10.61% 6.51% 5.05%
PAT Margin 8.03% 6.03% 4.45%
*GP – Gross Profit

Downstream Petroleum Industry
FSDH Research 39 December 2015
A cursory look at the balance sheet position as at FY 2014 compared with the position as
at FY 2013 shows an increase in the company’s fixed assets. The fixed assets increased
by 23.97% to N36.97bn from N29.82bn in FY 2013. Inventory decreased to N4.36bn from
N4.51bn in FY 2013. The cash and bank balances recorded a decrease of 61.24% from
N961.71mn in FY 2013 to N372.71mn in 2014. The trade debtors increased in 2014 by
23.60% to N2.53bn from N2.04bn in the FY 2013 period. The trade creditors increased
by 21.34% to N5.08bn from N4.19bn in the FY 2013 period. The working capital stood at
a negative N4.08bn, from a negative N3.47bn recorded in FY 2013. Mobil’s net assets for
the period increased by 42.06% to stand at N13.55bn from N9.54bn as at FY 2013.
The total assets of the company which stood at N49.23bn as at FY 2014 was financed by
a mix of equities and liabilities in the ratio of 27.52% and 72.48% respectively. Our
analysis of the liabilities shows that the short-term liabilities stood at N16.34bn,
accounting for 45.51% of the total liabilities, while the long-term liabilities stood at
N19.34bn, accounting for 54.19% of the total liabilities. The long-term liabilities
constituted mainly of non-current portion of deferred revenue, which stood at N17.48bn
as at FY 2014.
The total asset of the company in FY 2014 was financed by a mix of equities and liabilities in the ratio of 27.52% and 72.48% respectively.

Downstream Petroleum Industry
FSDH Research 40 December 2015
6.3.3 Drivers of Performance and Strategic Focus:
Mobil’s performance in Q3 2015 was impacted by a decline in the firm’s revenue due to
the tough operating environment. However, quarter-on-quarter, the company’s property
business segment grew substantially following its investment in the back court food
offering in partnership with UAC Plc. Other ancillary income earned from its operations
also contributed to the segment growth.
The delays in the reimbursement of subsidy claims from the government are also putting
strains on its earnings. The gridlock brought about by bad road infrastructure hampered
the sale of the company’s products and increased the costs of moving materials to and
from the terminals.
The company distributes its products through a network of outlets and distributors as well
as through some direct sales to end-users. Mobil has two major operating and reportable
business segments. The Petroleum Product Marketing business is responsible for the
sale and distribution of petroleum products (refined products) to retail customers and
industrial customers. The Property Business involves the leasing out of company
properties to related parties and other third parties. Mobil has continued to improve upon
its property business to create alternative revenue, considering the poor sales
experienced in the Fuel subsector.
The company’s plans to boost efficiency should improve its profitability; however the main
issue which requires attention is the growth in revenue.
Mobil’s performance in Q3 2015 was impacted by a decline in the firm’s revenue due to delays in the payment of oil subsidy by the Government.

Downstream Petroleum Industry
FSDH Research 41 December 2015
6.3.4 Strategic Focus:
The company hopes to achieve the following in the short-term:
Boost its property/real estate business and strengthen its partnership with UAC.
Improve its operational efficiency through upgrading its tank farm and loading
racks.
Boost capacity in lube oil blending plant through building more storage tanks.
6.3.5 SWOT Analysis:
Strengths:
o Well-known brand name in the
industry
o Strong partnership with parent
company
o Diversified business model
Weaknesses:
o Declining revenue and profit growth
o Rising administrative and distribution
costs
Opportunities:
o Large market size in Nigeria o Availability of raw materials o Removal of fuel subsidy
Threats:
o Poor road network for distribution
o Insecurity in the northern part of the
country
o Foreign exchange rate risk o High interest rate in the country
o Weak macroeconomic environment

Downstream Petroleum Industry
FSDH Research 42 December 2015
MRS Oil Rating: HOLD
Current price: N49.66
Fair Value: N51.60
6.4 MRS Oil Nigeria Plc: 6.4.1 Q3 2015 Performance Analysis:
The unaudited Q3 2015 result for the period ended September 2015 shows that Turnover
T/O decreased by 6.72% to N64.59bn, compared with N69.24bn in 2014.The cost of
sales decreased by 7.33% to N59.72bn from N64.45bn in Q3 2014. The cost of sales as
a percentage of T/O declined to 92.46% from 93.07% as at Q3 2014. The administrative,
selling and distribution expenses increased by 5.01% to N4.23bn. The expenses as a
percentage of T/O increased to 6.55% in Q3 2015 from 5.82% in Q3 2014.
The other operating income stood at N1.04bn as at Q3 2015, representing an increase of
17.85%, compared with N882.16mn in Q3 2014. MRS recorded a finance charge of
N417.24mn in Q3 2015, from N403.54mn in 2014. The PBT stood at N1.26bn in Q3
2015, an increase of 0.94% from N1.25bn in 2014. The tax provision decreased by
21.12% to N529.05mn, from N670.69mn.The PAT stood at N730.59mn in Q3 2015, from
N577.24mn in 2014, representing a decrease of 26.57%. The PBT Margin in Q3 2015
increased over the Q3 2014.The PBT margin increased to 1.95% in Q3 2015 from 1.80%
as at Q3 2014. The PAT margin currently stands at 1.13% in Q3 2015, up from 0.83% in
the corresponding period of 2014.
The percentage of T/O, PBT, and PAT in the Q3 2015 to the Audited T/O, PBT and PAT
as at December 2014 are: 68.96%, 98.25% and 97.88%, respectively. Given the run
rate, the company may not meet the previous year’s top line performance, but
expected to surpass the previous year bottom line.
Table 26: Quarterly Result Highlights (N'bn)
Q3 2015 Q2 2015 Q1 2015 Q4 2014 Q3 2014
Turnover 27.61 15.65 21.34 23.08 22.09
PBT 1.20 0.80 (0.73) 0.03 0.78
PAT 0.69 0.96 (0.92) 0.17 0.26
Table 25: Financial Performance (N’bn)
Q3 2015 Q3 2014 Change (%) T/O 64.59 69.24 (6.72%) EBIT 1.68 1.65 1.54% PBT 1.26 1.25 1.54% PAT 0.73 0.58 26.57%
T/O decreased by 6.72% to N64.59bn, compared with N69.24bn in 2014.
The PAT stood at N730.59mn in Q3 2015, from N577.24mn in 2014,
representing a decrease of 26.57%.

Downstream Petroleum Industry
FSDH Research 43 December 2015
A cursory look at the balance sheet position as at Q3 2015 compared with FY Dec 2014
shows a decrease in the company’s fixed assets. The total fixed assets decreased by
3.99% to N19.75bn in Q3 2015 from N20.57bn in FY 2014. The inventory increased by
11.98% to N4.28bn in Q3 2015, from N3.82bn in FY 2014. The cash and bank balances
recorded an increase of 46.27% from N11.48bn in FY 2014 to N16.79bn in Q3 2015. The
trade debtors and other receivables also increased in Q3 2015 by 51.85% to N33.37bn,
from N21.98bn in FY 2014. The trade creditors increased by 55.14% to N29.88bn from
N19.26bn as at FY 2014. The working capital stood at N6.49bn in Q3 2015 from N5.19bn
in Q3 2014, while net assets for the period increased by 2.67% to stand at N20.76bn,
from N20.22bn as at FY 2014.
The total assets of the company which stood at N74.19bn as at Q3 2015 were
financed by a mix of equities and liabilities in the ratio of 27.97% and 72.03%
respectively. Our analysis of the liabilities shows that the short-term liabilities stood at
N47.96bn, accounting for 89.75% of the total liabilities. The long-term liabilities stood at
N5.48bn, accounting for 10.25% of the total liabilities. The long-term liabilities constituted
mainly of deferred tax liabilities which stood at N5.46bn in Q3 2015. The short-term
liabilities constituted mainly of current financial liabilities and debtors/other receivables.
Table 27: Profitability Margins (N’bn)
Q3 2015 Q3 2014
GP* Margin 7.54% 6.93%
EBIT Margin 2.60% 2.38%
PBT Margin 1.95% 1.80%
PAT Margin 1.13% 0.83%
*GP – Gross Profit
Q3 2012 Q3 2013 Q3 2014 Q3 2015
Revenue 14.32 23.15 22.09 27.61
0.00
20.00
40.00
60.00
Q3 Revenue Trend (N'bn)
The total assets of the company were financed by a mix of equities and liabilities in the ratio of 27.97% and 72.03% respectively.

Downstream Petroleum Industry
FSDH Research 44 December 2015
6.4.2 FY 2014 Performance Analysis:
The audited Full Year 2014 (FY 2014) result of MRS Oil Plc (MRS Oil) for the period
ended December 31, 2014 shows that its Turnover (T/O) increased by 5.17% to
N92.33bn, compared with N87.79bn in 2013. MRS Oil has three operating business
segments. These are: Retail/ Commercial & Industrial segment, which involves the sale
and distribution of petroleum products (refined products) to retail customers and industrial
customers. The Aviation segment; involving the sale of Aviation Turbine Kerosene (ATK)
The Lubricants segment, which manufactures and sells lubricants and greases. The
operating segment performance indicates that the Retail/Commercial & Industrial
Business Segment contributed 82.89% (N76.53bn) to T/O, while Aviation and Lubricants
contributed 14.14% (N13.05bn) and 2.97% (N2.74bn) respectively.
The cost of sales increased by 2.84% to N85.37bn from N83.01bn recorded in 2013. The
rate of increase in the cost of sales was lower than the increase in the turnover. The
Retail/Commercial & Industrial Business Segment contribution to the cost of sales
decreased to 83.57% in 2014, from 85.72% in 2013. The value of changes in products,
packaging materials and work-in-progress included in the operating costs amounted to
N84.71bn, representing 99.23% of the cost of sale. The distribution and administrative
expenses as a percentage of T/O decreased from 7.38% in 2013 to 6.26% in 2014. This
shows a greater fall in the company’s operating expenses in comparison to its growth in
revenue.
The cost of sales increased by 2.84% to N85.37bn from N83.01bn recorded in 2013.
27.97%
72.03%
Financing Mix - Q3 2015
Equity Liabilities

Downstream Petroleum Industry
FSDH Research 45 December 2015
Other operating income increased significantly to stand at N1.26bn as at 2014,
representing an increase of 105.02% compared with N612.40mn recorded in 2013. The
increase in other income was majorly as a result of the increase in the sundry income of
N841.30mn, which grew by 205% from N276.19mn in 2013. The company’s Earnings
Before Interest (EBIT) stood at N2.43bn in 2014, from a Loss Before Interest and Tax
(LBIT) of N1.09bn in 2013. The company recorded an increase of 81.97% in its finance
cost of N1.43bn in 2014, from N784.51mn in 2013. This was mainly due to the increase
in interest expenses and bank charges of 149.90% to N613.62mn in 2014, from
N245.50mn in 2013; and the net foreign exchange loss of 712.80mn in 2014 up from
N455.77mn in 2013. The Profit Before Tax (PBT) stood at N1.28bn in 2014, a decrease
of 8.89% from N1.41bn recorded in the corresponding period of 2013. The decrease in
PBT is mainly due to the sharp increase in the finance cost in 2014, with the significant
drop in interest income. The company’s tax provision for the year decreased by 30.68%
to N535.65mn from N772.73mn. The Profit After Tax (PAT) stood at N746.40mn in 2014,
from N634.42mn in 2013, representing an increase of 17.65%.
The company’s profit margins reported a mixed performance in 2014 compared
with 2013. This is a reflection of the impact of the increase in operating expenses
and finance charges. The PBT Margin in 2014 decreased over the 2013 figure. The
PBT margin decreased to 1.39% in 2014 from 1.60% in 2013. The PAT margin increased
to 0.81% in 2014, up from 0.72% in 2013.
Table 28: Financial Performance (N’bn)
FY 2014 FY 2013 Change
T/O 92.33 87.79 5.17%
EBIT 2.43 (1.09) 322.58%
PBT 1.28 1.41 (8.89%)
PAT 0.75 0.63 17.65%
Table 29: Profitability Margins
FY 2014 FY 2013 FY 2012
GP* Margin 7.54% 5.44% 7.16%
EBIT Margin 2.63% (1.24%) 1.99%
PBT Margin 1.39% 1.60% 0.48%
PAT Margin 0.81% 0.72% 0.26%
*GP – Gross Profit
The decrease in PBT is majorly due to the sharp increase in the finance cost in 2014, with the significant drop in interest income.

Downstream Petroleum Industry
FSDH Research 46 December 2015
34.95%
65.05%
Financing Mix - FY 2014
Equity Liablities
A cursory look at the balance sheet position as at FY 2014 compared with the position as
at FY 2013 shows a decrease in the company’s fixed assets. The total fixed assets
decreased by 8.16% to N20.57bn from N22.40bn in FY 2013. The inventory decreased to
N3.82bn in FY 2014 from N7.72bn in FY 2013. The cash and bank balances recorded a
decrease of 12.47% from N13.11bn in FY 2013 to N11.48bn in 2014. The trade debtors
also decreased in 2014 by 14.20% to N4.23bn from N4.94bn in FY 2013. The receivables
expressed in the financial statements consist mostly of fuel subsidy receivable from the
government and other receivables from related party. This includes the Petroleum
Exploration Fund (PEF) and the Petroleum Support Fund (PSF). The trade creditors
decreased by 23.57% to N8.55bn from N11.19bn as at FY 2013. The working capital
stood at N5.19bn, up from N3.23bn in FY 2013 while net assets for the period increased
by 3% to N20.22bn from N19.63bn in FY 2013.
The company’s total assets which stood at N57.85bn in FY 2014 were financed by a mix
of equities and liabilities in the ratio of 34.95% and 65.05% respectively. Our analysis of
the liabilities showed that the short-term liabilities accounted for 85.28% (N32.09bn) of
the total liabilities, while long-term liabilities accounted for 14.72% (N5.54bn) of the total
liabilities. MRS’s long-term liabilities consisted of deferred tax, which stood at N5.52bn,
which declined by 7.69% compared with the FY 2013.
The trade debtors also decreased in 2014 by 14.20% to N4.23bn from N4.94bn in FY 2013.
Downstream Petroleum Industry
FSDH Research 47 December 2015
6.4.3 Drivers of Performance:
MRS owns a lube blending plant, with a 23.9 million litres annual capacity and 1.3 million
kilograms annual capacities grease plant. It also operates 7.3 million litres annual
capacities tank farm storage and Finished-Goods warehouses located in various parts of
Nigeria. The company’s performance in Q3 2015 and FY 2014 were impacted mainly by
the foreign exchange rate devaluation, delay in oil subsidy payment by the Government
and the increase in its cost of sales. This increase in the cost of sales was due to severe
importation process delays. The devaluation of the Naira significantly inflated the
company’s borrowing expenses via the interest rate channel. This had a direct impact on
the company’s ability to conducts its day to day operations.
6.4.4 Strategic Focus:
The company introduced a new product into the market in Q4 2014, called “MRS Gas”.
The company’s new product is said to adhere to all safety regulations and claimed to be
positioned in the market as a more convenient, safer and easier to use canister. The
company also intends to focus on a new branding outfit going forward.
The following factors are expected to drive the company’s revenue in the coming years:
The expansion into a new product, “MRS Gas”.
The rebranding of the company’s current operations.
The additional investments in Property, Plant and Equipment (PPE) made by the
company.
The devaluation of the Naira significantly increased the company’s borrowing expenses via the interest rate channel.
MRS Oil plans to achieve significant growth through rebranding.

Downstream Petroleum Industry
FSDH Research 48 December 2015
6.4.5: SWOT Analysis:
Strengths:
o Growth in other income category
o Innovative management
Weaknesses:
o Declining revenue and profit growth
o Rising finance charges
o Rising inventory
Opportunities:
o Large market size in Nigeria o Removal of fuel subsidy
Threats:
o Poor road network for distribution
o Insecurity in the northern part of the
country
o Foreign exchange rate risk o High interest rate in the country
o Weak macroeconomic environment.

Downstream Petroleum Industry
FSDH Research 49 December 2015
Oando Rating: HOLD
Current Price: N5.21
Fair Value: N6.24
6.5 Oando Plc:
6.5.1 Q3 2015 Performance Analysis:
The unaudited Q3 2015 result for the period ended September 2015 shows that Turnover
T/O decreased by 5.48% to N95.78bn, compared with N101.33bn in 2014.The cost of
sales increased by 47.05% to N54.73bn from N37.22bn in Q3 2014. The cost of sales as
a percentage of T/O increased to 57.13% from 36.73% as at Q3 2014. The
administrative, selling and distribution expenses increased by 23.86% to N45.92bn. The
expenses as a percentage of T/O increased to 47.94% in Q3 2015, from 36.58% in Q3
2014.
The other operating income stood at N15.28bn as at Q3 2015, representing an increase
of 222.70%, compared with N4.74bn in Q3 2014. Oando recorded a finance charge of
N37.49bn in Q3 2015, up from N29.44bn in 2014. The company recorded a Loss Before
Tax (LBT) of N52.03bn in Q3 2015, from a Profit Before Tax (PBT) of N3.22bn in
2014.The utilization of the company’s tax credit increased by 125.11% to N4.39bn in Q3
2015, from N1.95bn in Q3 2014.The Loss After Tax (LAT) stood at N47.65bn in Q3 2015,
from N5.17bn in 2014. Consequently, it recorded negative margins in 2014.
Table 30: Quarterly Financial Performance (N’bn)
Q3 2015 Q3 2014 Change (%) T/O 95.78 101.34 (5.48) EBIT 10.42 31.78 (67.21) PBT (52.03) 3.22 (1,717.59) PAT (47.65) 5.17 (1,022.44)
Table 31: Quarterly Result Highlights (N'bn)
Q3 2015 Q2 2015 Q1 2015 Q4 2014 Q3 2014
Turnover 35.47 27.29 33.03 86.57 45.66
PBT (13.45) (21.57) (17.01) (181.50) (5.36)
PAT (12.97) (16.40) (18.28) (189.98) (0.58)
T/O decreased by 5.48% to N95.78bn,
compared with N101.33bn in 2014.
Oando recorded negative margins in Q3 2015.

Downstream Petroleum Industry
FSDH Research 50 December 2015
A cursory look at the balance sheet position as at Q3 2015 compared with FY Dec 2014
shows a decrease in the company’s fixed assets. The total fixed assets decreased by
14.56% to N592.50bn in Q3 2015 from N693.47bn in FY 2014. The inventory decreased
by 83.74% to N4.39bn in Q3 2015, from N26.97bn in FY 2014. The cash and bank
balances recorded a decrease of 85.87% from N27.44bn in FY 2014 to N3.88bn in Q3
2015. The trade debtors and other receivables also decreased in Q3 2015 by 56.91% to
N58.65bn, from N136.12bn in FY 2014. The trade creditors decreased by 13.77% to
N135.07bn from N156.63bn as at FY 2014. The working capital stood at negative
N220.81bn in Q3 2015 from a negative N321.96bn in Q3 2014, while net assets for the
period increased by 21.70% to stand at N55.38bn, from N45.51bn as at FY 2014.
The total assets of the company which stood at N831.62bn as at Q3 2015 was
financed by a mix of equities and liabilities in the ratio of 6.66% and 93.34%
respectively. Our analysis of the liabilities shows that the short-term liabilities (including
liabilities of disposal group classified as held for sale) stood at N474.85bn, accounting for
61.17% of the total liabilities. The long-term liabilities stood at N301.39bn, accounting for
38.83% of the total liabilities. The long-term liabilities constituted mainly of deferred tax
liabilities and borrowings which stood at N141.02bn and N140.69bn in Q3 2015,
respectively. The short-term liabilities constituted mainly of trade and other payables,
borrowings and current tax liabilities.
Table 32: Quarterly Profitability Margins (%)
Q3 2015 Q3 2014
GP* Margin 42.87% 63.27%
EBIT Margin 10.88% 31.36%
PBT Margin (54.32%) 3.17%
PAT Margin (49.74%) 5.17%
*GP – Gross Profit
Q3 2012 Q3 2013 Q3 2014 Q3 2015
Q3Revenue 137.16 105.92 45.66 35.47
30.00
50.00
70.00
90.00
110.00
130.00
Q3 Revenue Trend (N'bn)
The total asset of the company was financed by a mix of equities and liabilities in the ratio of 6.66% and 93.34% respectively.

Downstream Petroleum Industry
FSDH Research 51 December 2015
6.66%
93.34%
Financing Mix- Q3 2015
Equity Liabilities
There is a need for Oando to inject more equity capital. However, it is unclear if the
company would be able to raise equity capital from investors because of its
current poor performance and reporting.
6.5.2 FY 2014 Performance Analysis:
The audited Full Year 2014 (FY 2014) result of Oando Plc (Oando) for the period ended
December 31, 2014 shows that its Turnover (T/O) decreased by 5.60% to N424.68bn,
compared with N449.87bn in FY 2013. The company’s cost of sales decreased by 8.98%
to N355.50bn in FY 2014 from N390.58bn recorded in FY 2013. The gross profit
increased by 16.69% to N69.18bn in 2014, from N59.29bn in 2013. The distribution and
administrative expenses as a percentage of T/O reported a dramatic increase from
7.76% in 2013 to 65.38% in 2014.
Other operating income increased to N68.79bn as at 2014, representing an increase of
1,239% compared with N5.14bn recorded in 2013 in line with recent trends in the
industry. However, the Earnings Before Interest and Tax (EBIT) declined substantially to
a negative of N139.67bn in 2014 by 943.93% from N16.55bn in 2013. This was due to
the enormous 856.08% rise in the company’s administrative expenses to N271.88bn from
N28.44bn The company recorded an increase of 79.27% in its finance cost to N38.79bn
in 2014 from N21.64bn in 2013. This was mainly due to the increase in borrowing cost as
a result of the devaluation of the Naira. The Loss Before Tax (LBT) stood at N171.32bn in
2014, from a Profit Before Tax (PBT) of N713.21mn recorded in the corresponding period
of 2013. The company’s tax provision recorded an increase of 47.68% to N7.96bn from
N5.39bn. It recorded a Loss After Tax (LAT) of N179.28bn in 2014, from a LAT of
N4.68bn in 2013.

Downstream Petroleum Industry
FSDH Research 52 December 2015
Oando recorded negative margins in 2014, except for its gross profit margin. This was as
a result of the significant rise in the company’s operating expenses and its financing
costs.
Table 33: Financial Performance (N’bn)
FY 2014 FY 2013 Change T/O 424.68 449.87 (5.60) EBIT (139.67) 16.55 (943.93) PBT (171.32) 0.71 (24,121.53)
PAT (179.28) (4.68) (3,733.88)
Table 34: Profitability Margins
FY 2014 FY 2013 FY 2012
GP* Margin 16.29% 13.18% 10.74%
EBIT Margin (32.89%) 3.68% 3.75%
PBT Margin (40.34%) 0.16% 2.18%
PAT Margin (42.51%) (1.04%) 0.85%
*GP – Gross Profit

Downstream Petroleum Industry
FSDH Research 53 December 2015
5.12%
94.88%
Financing Mix - FY 2014
Equities Liabilities
A cursory look at the balance sheet position as at FY 2014 compared with the position as
at FY 2013 shows an increase in the company’s fixed assets. The fixed assets increased
by 92.88% to N693.47bn from N359.53bn in FY 2013. Oando’s stock increased to
N26.97bn from N19.45bn in FY 2013. The company’s cash and bank balances recorded
an increase of 14.87% from N23.89bn in FY 2013 to N27.44bn in 2014. Its trade debtors
decreased in 2014 by 5.30% to N136.12bn from N143.74bn in the FY 2013 period. Trade
creditors increased by 26.25% to N156.638bn from N124.06bn in the FY 2013 period.
The working capital stood at a negative N321.96bn, from a negative N126.87bn recorded
in FY 2013. Oando’s net assets for the period decreased by 67.29% to stand at
N45.51bn from N139.11bn as at FY 2013.
The total assets of the company which stood at N889.37bn as at FY 2014 and were
financed by a mix of equities and liabilities in the ratio of 5.12% and 94.88% respectively.
Our analysis of the liabilities shows that the short-term liabilities stood at N517.86bn,
accounting for 61.37% of the total liabilities, while the long-term liabilities stood at
N326bn, accounting for 38.63% of the total liabilities. The long-term liabilities constituted
mainly of long-term borrowings, which stood at N162.33bn as at FY 2014.
Trade debtors decreased in 2014 by 5.30% to N136.12bn from N143.74bn in the FY 2013 period.

Downstream Petroleum Industry
FSDH Research 54 December 2015
6.5.3 Drivers of Performance and Strategic Focus:
The acquisition of Conoco Philips in 2014 has short-term impact on its profitability
because of the high finance charges from the acquisition of the asset.
According to the company, the increase in administrative expenses was because
of the large impairment charges it incurred on the provisioning it made on its
exploration and appraisal assets. The valuations estimates of these assets were
marked down as a result of the decline in oil prices.
Oando has three major operating and reportable business segments namely: Upstream
Business, where it provides energy services and is involved in the production and
exploration of crude oil and gas products; Midstream Business, where it operates in gas
and power distribution; and Downstream Business which involves the use of terminals,
supply networks and regional marketing to distribute oil products to consumers.
The company is known for late release of its financial results to the NSE. This puts
to question the corporate governance structure of the company. The Nigerian stock
market has downgraded the share price on account of this.
6.5.4 Strategic Focus:
The company hopes to achieve the following strategic initiatives in the coming year:
Increase oil production levels
Expand product offering in drilling
Complete construction of Greater Lagos Pipeline and other pipeline expansion
projects
Sell off significant stake in downstream sector to Vitol and Helios Investment
Partners.
The company’s acquisition of Conoco Philips in 2014 has been impacting on its profitability because of the high finance and impairment charges.

Downstream Petroleum Industry
FSDH Research 55 December 2015
Take advantage of the multiple storage terminals with a combined storage
capacity of 61,000 MT to the Apapa mid-stream jetty to further boost income
from its terminal business.
The company plans to focus more strongly on its upstream business in order to
leverage on the assets acquired from ConocoPhillips in the previous year. The
company believes that the upstream sub-sector of the oil and gas sector will be more
lucrative than the downstream sector in the coming years.
6.5.5 SWOT Analysis:
Strengths:
o Diversified income stream
o Wide distribution network
o Known name in the petroleum
marketing industry
Weaknesses:
o Declining revenue and profit growth
o Rising operating expenses
o Negative retained earnings
o Declining profit margins
o Poor Corporate Reporting
Opportunities:
o Large market size in Nigeria o Availability of raw materials o Removal of fuel subsidy
Threats:
o Poor road network for distribution
o Insecurity in some northern part of the
country
o Foreign exchange rate risk o High interest rate in the country
o Weak macroeconomic environment
The company plans to focus more strongly on its upstream business in order to leverage on its assets
acquired from ConocoPhillips.

Downstream Petroleum Industry
FSDH Research 56 December 2015
TOTAL Rating: BUY
Current Value: N145.00
Fair Value: N179.36
6.6 TOTAL Plc:
6.6.1 Q3 2015 Performance Analysis:
The unaudited Q3 2015 result for the period ended September 2015 shows that Turnover
T/O decreased by 10.41% to N159.30bn, compared with N177.81bn in 2014.The cost of
sales decreased by 10.79% to N140.11bn from N157.06bn in Q3 2014. The cost of sales
as a percentage of T/O declined to 87.95% from 88.33% as at Q3 2014. The
administrative, selling and distribution expenses increased by 8.62% to N16.88bn. The
expenses as a percentage of T/O increased to 10.60% in Q3 2015 from 8.74% in Q3
2014.
The other operating income stood at N807.27mn as at Q3 2015, representing an
increase of 27.23%, compared with N633.99mn in Q3 2014. TOTAL recorded a finance
charge of N1.25bn in Q3 2015, from N1.85bn in 2014. The PBT fell to N4.01bn in Q3
2015, a decrease of 4.63% from N4.20bn in 2014.The tax provision increased by 20.63%
to N1.88bn, from N1.56bn.The PAT stood at N2.13bn in Q3 2015, from N2.65bn in 2014,
representing a decrease of 19.47%. There was a mixed performance in its profit margins
in Q3 2015, compared with Q3 2014. The PBT Margin in Q3 2015 increased over the Q3
2014.The PBT margin increased to 2.52% in Q3 2015 from 2.36% as at Q3 2014. The
PAT margin was 1.34% in Q3 2015, down from 1.49% in the corresponding period of
2014.
The result also indicates that the percentage of T/O, PBT, and PAT in the Q3 2015 to the
Audited T/O, PBT and PAT for December 2014 are: 66.20%, 72.14% and 48.22%,
respectively. Given the run rate, the company is unlikely to meet its previous year’s
performance. We expect performance to remain flat during the second half of the year as
we expect the tough operating and regulatory environment in which the company
operates to continue.
Table 35: Financial Performance (N’bn)
Q3 2015 Q3 2014 Change (%)
T/O 159.30 177.81 (10.41%)
EBIT 3.12 5.84 (46.59%)
PBT 4.01 4.20 (4.63%)
PAT 2.13 2.65 (19.47%)
T/O decreased by 10.41% to N159.30bn, compared with N177.81bn in 2014.
There was a mixed performance in its profit margins in Q3 2015, compared with Q3 2014.

Downstream Petroleum Industry
FSDH Research 57 December 2015
A cursory look at the balance sheet position as at Q3 2015 compared with FY Dec 2014
shows an increase in the company’s fixed assets. The total fixed assets increased by
3.06% to N25.95bn in Q3 2015 from N25.18bn in FY 2014. The inventory increased
marginally by 1.29% to N20.08bn in Q3 2015, from N19.83bn in FY 2014. The cash and
bank balances recorded a decrease of 49.06% from N14.47bn in FY 2014 to N7.37bn in
Q3 2015. The trade debtors and other receivables also decreased in Q3 2015 by 32.79%
to N9.98bn, from N14.84bn in FY 2014. The trade creditors decreased by 38.91% to
Table 36: Quarterly Result Highlights (N'bn)
Q3 2015 Q2 2015 Q1 2015 Q4 2014 Q3 2014
Turnover 47.32 51.93 60.04 62.81 57.65
PBT 0.33 3.06 0.63 1.35 0.78
PAT 0.17 1.74 0.22 1.78 0.47
Table 37: Profitability Margins
Q3 2015 Q3 2014
GP* Margin 12.05% 11.67%
EBIT Margin 1.96% 3.28%
PBT Margin 2.52% 2.36%
PAT Margin 1.34% 1.49%
*GP – Gross Profit
Q3 2012 Q3 2013 Q3 2014 Q3 2015
Revenue 56.55 57.04 57.65 47.32
0.00
10.00
20.00
30.00
40.00
50.00
60.00
Q3 Revenue Trend (N'bn)

Downstream Petroleum Industry
FSDH Research 58 December 2015
N22.56bn from N36.92bn as at FY 2014. The working capital stood at negative N10.36bn
in Q3 2015 from N8.27bn in Q3 2014, while net assets for the period decreased by
11.50% to stand at N12.33bn, from N13.93bn as at FY 2014.
The total assets of the company which stood at N76.31bn as at Q3 2015 were
financed by a mix of equities and liabilities in the ratio of 16.16% and 83.84%
respectively. Our analysis of the liabilities shows that the short-term liabilities stood at
N60.72bn, accounting for 94.90% of the total liabilities. The long-term liabilities stood at
N3.26bn, accounting for 5.10% of the total liabilities. The long-term liabilities constituted
mainly of deferred tax liabilities which stood at N3.04bn in Q3 2015. The short-term
liabilities constituted mainly of trade and other payables and borrowings.
6.6.2 FY 2014 Performance Analysis:
The audited Full Year 2014 (FY 2014) result of Total for the period ended December 31,
2014 shows that its Turnover (T/O) increased by 1.03% to N240.62bn, compared with
N238.16bn in 2013. Total has three operating business segments namely: Network,
which is responsible for the sale and distribution of petroleum products (refined products)
to retail customers and industrial customers. Aviation, which involves the sale of Aviation
Turbine Kerosene (ATK). General Trade, which manufactures and sells fuels, lubricants
and greases. The operating segment performance indicates that the Network Business
Segment contributed 66.82% (N160.72bn) to T/O. General Trade consisting of the sale of
fuel products and lubricants, and Aviation contributed 22.48% (N54.08bn), and 10.70%
(N25.83bn) to T/O respectively. The cost of sales increased by 1.55% to N212.71bn from
N209.46bn recorded in 2013. The rate of increase in the cost of sales was higher than
the increase in the turnover. The Network Business
The total asset of the company was financed by a mix of equities and liabilities in the ratio of 16.16% and 83.84% respectively.
The rate of increase in the cost of sales was higher than the increase in the turnover.

Downstream Petroleum Industry
FSDH Research 59 December 2015
Segment contribution to the cost of sales decreased to 65.41% in 2014, from 64.16% in
2013. The distribution and administrative expenses as a percentage of T/O decreased
from 8.844% in 2013 to 8.83% in 2014.
Other operating income decreased to N1.17bn as at 2014, representing a decrease of
3.70% compared with N1.22bn recorded in 2013. Likewise, the EBIT decreased by
11.64% to N7.84bn in 2014 from N8.87bn in 2013. The company recorded an increase of
32.29% in its finance cost to N2.62bn in 2014 from N1.98mn in 2013. This was mainly
due to the increase in interest charges arising from the impact of the devaluation of the
naira. The PBT stood at N5.56bn in 2014, a decrease of 31.55% from N8.12bn recorded
in the corresponding period of 2013. The decrease in PBT is mainly due to the sharp
increase in the finance cost in 2014 coupled with the significant drop in interest income.
The tax provision recorded a decrease of 59.27% to N1.13bn from N2.79bn. The PAT
was N4.42bn in 2014 from N5.33bn in 2014, representing a decrease of 17.07%.
Table 38: Financial Performance (N’bn)
FY 2014 FY 2013 Change T/O 240.62 238.16 1.03% EBIT 7.84 8.87 (11.64%) PBT 5.56 8.12 (31.55%) PAT 4.42 5.33 (17.07%)
FY 2011 FY 2012 FY 2013 FY 2014
Revenue 173.95 217.84 238.16 240.62
0.00
10.00
20.00
30.00
40.00
50.00
60.00
FY 2014 Revenue Trend (N'bn)
The company recorded an increase of 32.29% in its finance cost to N2.62bn
in 2014 from N1.98mn in 2013.
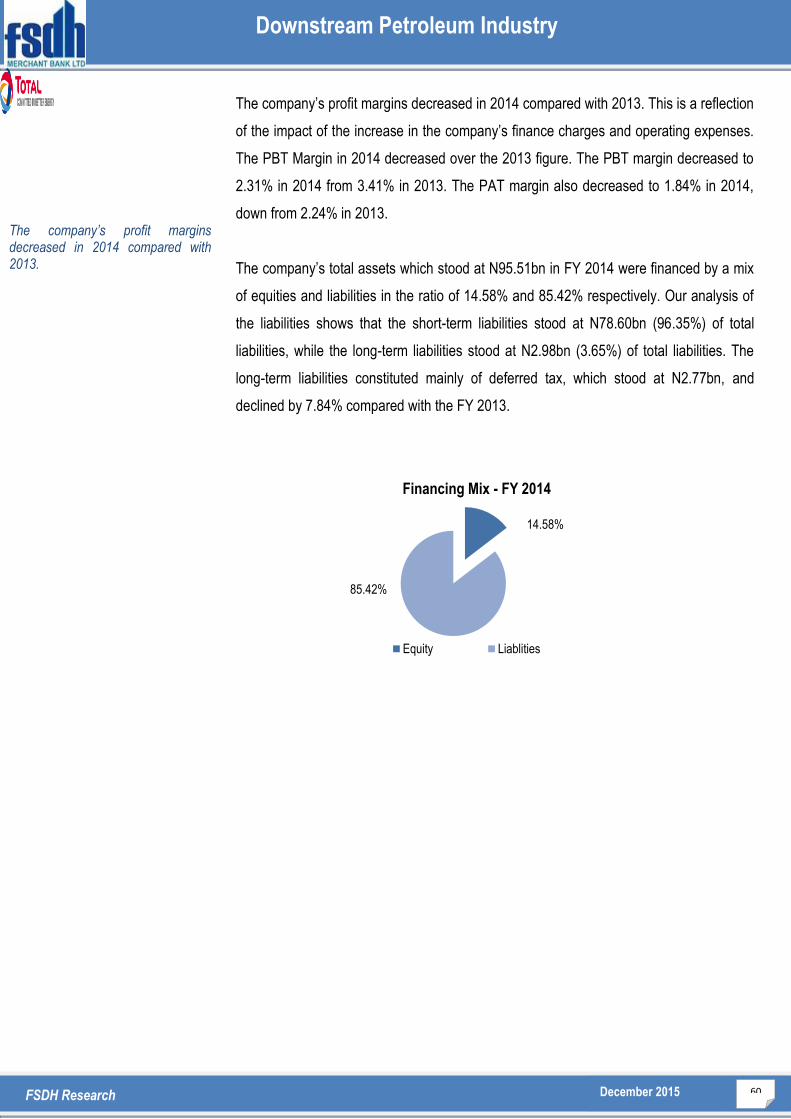
Downstream Petroleum Industry
FSDH Research 60 December 2015
14.58%
85.42%
Financing Mix - FY 2014
Equity Liablities
The company’s profit margins decreased in 2014 compared with 2013. This is a reflection
of the impact of the increase in the company’s finance charges and operating expenses.
The PBT Margin in 2014 decreased over the 2013 figure. The PBT margin decreased to
2.31% in 2014 from 3.41% in 2013. The PAT margin also decreased to 1.84% in 2014,
down from 2.24% in 2013.
The company’s total assets which stood at N95.51bn in FY 2014 were financed by a mix
of equities and liabilities in the ratio of 14.58% and 85.42% respectively. Our analysis of
the liabilities shows that the short-term liabilities stood at N78.60bn (96.35%) of total
liabilities, while the long-term liabilities stood at N2.98bn (3.65%) of total liabilities. The
long-term liabilities constituted mainly of deferred tax, which stood at N2.77bn, and
declined by 7.84% compared with the FY 2013.
The company’s profit margins decreased in 2014 compared with 2013.

Downstream Petroleum Industry
FSDH Research 61 December 2015
6.6.3 Drivers of Performance and Strategic Focus:
TOTAL’s performance in Q3 2015 was impacted by the weak macroeconomic
environment. They were also affected by the delays in the payment of fuel subsidies by
the Government, which subsequently led to inadequate supply of its petrol products in
2015. The weak macroeconomic environment also contributed to the fall in revenue and
the increase in the company’s cost of sales because of the delays in the importation of its
products.
The company however, benefitted from the increased sales of its new product, Awango
solar lamps, which was launched in 2014. It has converted a number of its service
stations into full multi service stations, consisting of modern lube bays and carwash
centres. These stations run side by side with the company’s Bonjour shops, which offer
more products. TOTAL is affiliated to a number of popular eateries including KFC and
Chicken Republic which provide better marketing opportunities and rental value.
6.6.4 Strategic Focus:
Total began e-marketing its products via Konga to increase visibility and boost sales. It
also intends to construct 8 new solar powered stations by the end of 2015. The company
also intends to provide these solar power solutions for homes before the end of this year.
The company aims to achieve the following objectives ahead of the coming year:
The impending provision of solar power solutions to consumers
Increases sales of the firms Awango lamps
Growing its multiservice fuel stations around Nigeria
Lucrative partnership with UAC Plc
Using online services and other means to market products more effectively.
TOTAL also plans to diversify into the provision of solar power solutions in 2016. The
company’s other income which consists of rental income with vendor management
(network income) and collection of royalties, is also expected to expand in coming years.
TOTAL was affected by the delays in the payment of oil subsidies by the Government.
TOTAL is affiliated with a number of popular eateries including KFC and Chicken Republic which provide better marketing opportunities and rental value.
TOTAL intends to construct 8 new solar powered stations by the end of 2015.
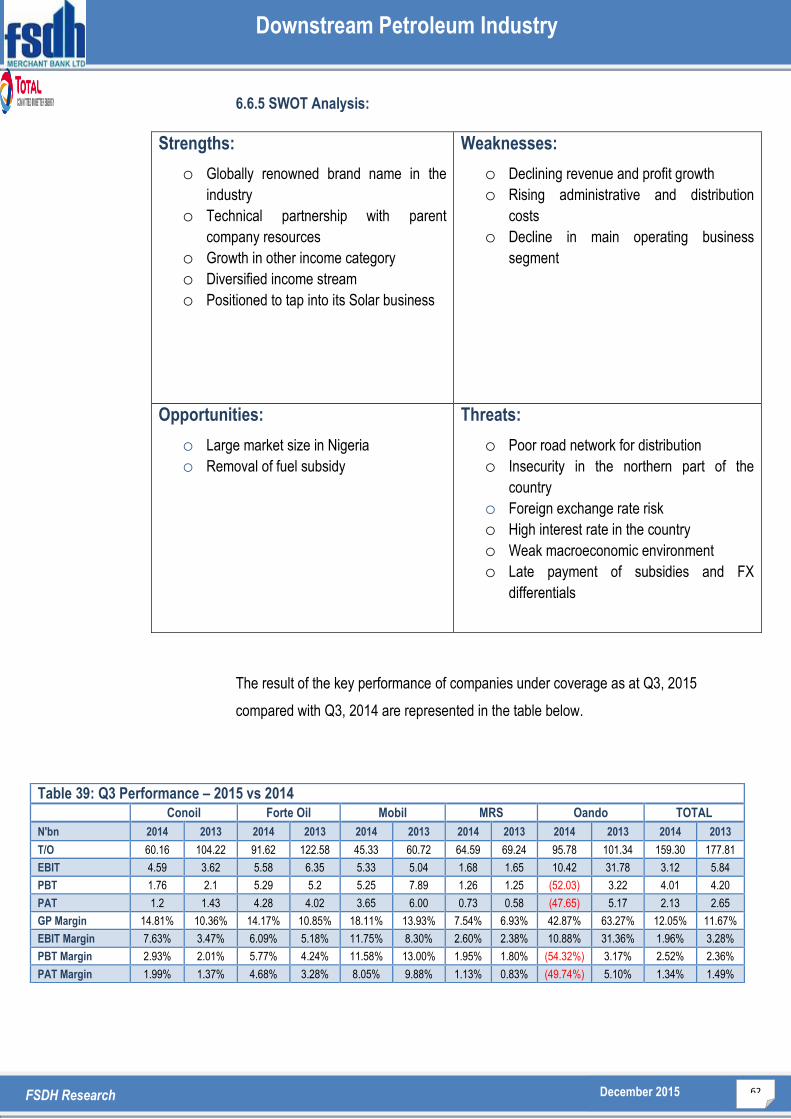
Downstream Petroleum Industry
FSDH Research 62 December 2015
6.6.5 SWOT Analysis:
The result of the key performance of companies under coverage as at Q3, 2015
compared with Q3, 2014 are represented in the table below.
Strengths:
o Globally renowned brand name in the
industry
o Technical partnership with parent
company resources
o Growth in other income category
o Diversified income stream
o Positioned to tap into its Solar business
Weaknesses:
o Declining revenue and profit growth
o Rising administrative and distribution
costs
o Decline in main operating business
segment
Opportunities:
o Large market size in Nigeria o Removal of fuel subsidy
Threats:
o Poor road network for distribution
o Insecurity in the northern part of the
country
o Foreign exchange rate risk o High interest rate in the country
o Weak macroeconomic environment
o Late payment of subsidies and FX
differentials
Table 39: Q3 Performance – 2015 vs 2014 Conoil Forte Oil Mobil MRS Oando TOTAL
N'bn 2014 2013 2014 2013 2014 2013 2014 2013 2014 2013 2014 2013
T/O 60.16 104.22 91.62 122.58 45.33 60.72 64.59 69.24 95.78 101.34 159.30 177.81
EBIT 4.59 3.62 5.58 6.35 5.33 5.04 1.68 1.65 10.42 31.78 3.12 5.84
PBT 1.76 2.1 5.29 5.2 5.25 7.89 1.26 1.25 (52.03) 3.22 4.01 4.20
PAT 1.2 1.43 4.28 4.02 3.65 6.00 0.73 0.58 (47.65) 5.17 2.13 2.65
GP Margin 14.81% 10.36% 14.17% 10.85% 18.11% 13.93% 7.54% 6.93% 42.87% 63.27% 12.05% 11.67%
EBIT Margin 7.63% 3.47% 6.09% 5.18% 11.75% 8.30% 2.60% 2.38% 10.88% 31.36% 1.96% 3.28%
PBT Margin 2.93% 2.01% 5.77% 4.24% 11.58% 13.00% 1.95% 1.80% (54.32%) 3.17% 2.52% 2.36%
PAT Margin 1.99% 1.37% 4.68% 3.28% 8.05% 9.88% 1.13% 0.83% (49.74%) 5.10% 1.34% 1.49%

Downstream Petroleum Industry
FSDH Research 63 December 2015
7.0 Valuation:
The proposed change of regulation in the petroleum industry and the removal of
the fuel subsidy would change the industry structure and operations. If these
reforms are implemented as conceived, the operators and performance of the petroleum
marketing companies may change drastically in the next few months. This may also
affect the valuation substantially. Therefore, our valuations of the petroleum
marketing companies have a six (6) months view. We will review the valuations
when we get details on the reforms and the impacts on the petroleum marketing
industry.
In order to arrive at fair values for the petroleum marketing companies, we used an
EBITDA Multiple of 10.24x for Conoil, Mobil Oil, MRS Oil and TOTAL. However, we used
a Price-to-Sale multiple of 0.57x to arrive at the fair value for Oando.
Our forecast and the result of the short-term valuation are presented on the table 39 below:
Table 40: Forecast and Valuation
Conoil Forte Oil Mobil Oil MRS Oil Oando TOTAL
N’bn 2015E 2015E 2015E 2015E 2015E 2015E
T/O (N) 77,653 136,102 58,892 83,093 131,650 211,744
EBITDA (N) 1,816 10,840 5,879 1,293 (43,229) 6,066
EBIT (N) 1,391 9,231 4,867 1,192 (43,297) 5,096
PBT (N) 927 7,255 6,250 1,154 (53,110) 4,891
TAX (N) 422 1,240 1,519 482 2,467 998
PAT (N) 505 6,015 4,731 672 (55,577) 3,893
Fair Value (N) 39.04 114.23 163.25 51.60 6.24 * 179.36
Dividend Payout Ratio (%) 85.00% 85.00% 85.00% 85.00% - 85.00%
Dividend Payment (N) 429 5,113 4,021 571 - 3,309
EPS (N) 0.73 4.62 13.12 2.64 (4.62) 11.47
DPS (N) 0.62 3.93 11.15 2.25 - 9.75
P/E Ratio (x) 53.67x 24.73x 12.44x 19.51x - 15.64x
Earnings Yield (%) 1.86% 4.04% 8.04% 5.13% 6.25% 6.39%
Dividend Yield (%) 1.58% 3.44% 6.83% 4.36% - 5.13%
* Price-to-Sale Valuation

Downstream Petroleum Industry
FSDH Research 64 December 2015
For enquiries please contact us at our offices: Lagos Office: 5th-8th floors UAC House, 1/5 Odunlami Street, P.M.B 12913 Lagos. Tel: 234-1-2702881-2 (Fax): 234-1-2702890. Port Harcourt Office: Mainstreet Bank Building, (2nd floor, 5 Trans Amadi Road, Port Harcourt. Tel: 234-802 408 1331 (Fax) 234-084-463174. Abuja Office: Leadway House (First Floor), Plot 1061 Herbert Macaulay way, Central
Business District, Abuja-Nigeria. Tel.: 09-6700535, 09-2731170.
Website: www.fsdhgroup.com Email: [email protected] Our Reports and Prices are also Available on Bloomberg {FSDH<GO>}
Disclaimer Policy
This publication is produced by FSDH Merchant Bank Limited solely for the information of users
who are expected to make their own investment decisions without undue reliance on any
information or opinions contained herein. The opinions contained in the report should not be
interpreted as an offer to sell, or a solicitation of any offer to buy any investment. FSDH Merchant
Bank Limited may invest substantially in securities of companies using information contained
herein and may also perform or seek to perform investment services for companies mentioned
herein. Whilst every care has been taken in preparing this document, no responsibility or liability
is accepted by any member of FSDH Merchant Bank Limited for actions taken as a result of
Information provided in this publication.