downscaling of land use change scenarios to assess the dynamics of european landscapes
TRANSCRIPT
Downscaling of land use change scenarios to assess
the dynamics of European landscapes
Peter H. Verburg *, C.J.E. Schulp, N. Witte, A. Veldkamp
Department of Environmental Sciences, Wageningen University, P.O. Box 37, 6700 AA Wageningen, The Netherlands
Available online 10 January 2006
Abstract
Europe’s rural areas are expected to witness massive and rapid changes in land use due to changes in demography, global trade, technology
and enlargement of the European Union. Changes in demand for agricultural products and agrarian structure are likely to have a large impact
on landscape quality and the value of natural areas. A spatially explicit, dynamic, land use change model has been used to translate European
level scenarios into a high resolution assessment of changes in land use for the 25 countries of the European Union. Scenarios differ in
worldview, ranging from enhanced global cooperation towards strong regionalisation on one hand and strong to weak government
intervention on the other. Global economic and integrated assessment models were used to calculate changes in demand for agricultural
area at country level while a spatially explicit land use change model was used to downscale these demands to land use patterns at 1 km2
resolution. The land use model explicitly accounts for the variation in driving factors among countries and the path dependence in land use
change trajectories. Results indicate the large impact abandonment of agricultural land and urbanization has on European landscapes and the
different scenarios indicate that spatial policies can make an important contribution to preserve landscapes containing high natural and/or
historic values. Furthermore, the dynamic simulations indicate that the trajectory of land use change has an important impact on resulting
landscape patterns as a result of the path-dependence in land use change processes. The results are intended to support discussions on the
future of the rural area and identify hotspots of landscape change that need specific consideration.
# 2005 Elsevier B.V. All rights reserved.
Keywords: Europe; Downscaling; Land use change; Scenarios; Landscape
www.elsevier.com/locate/agee
Agriculture, Ecosystems and Environment 114 (2006) 39–56
1. Introduction
Europe has a varied and dynamic landscape in which
agriculture is one of the dominant land use types. The
environmental and social variability within Europe, in
combination with a variety of agricultural policies, has
created a complex and often dynamic pattern of land use.
Since land use is the result of human decisions, the patterns
of land use reflect the decision-making processes by those
who control land resources. Agricultural policies such as the
availability of subsidies, fixing of quotas on food production,
the setting aside of land in return for monetary compensation
and schemes to encourage farms to diversify, have caused
rapid changes in European landscapes over the past 50 years.
* Corresponding author. Tel.: +31 317485208; fax: +31 317482419.
E-mail address: [email protected] (P.H. Verburg).
0167-8809/$ – see front matter # 2005 Elsevier B.V. All rights reserved.
doi:10.1016/j.agee.2005.11.024
More recently, European integration and globalization
processes are accelerating, e.g. in 2004, 10 new member
states (the accession countries) entered the European Union
bringing about a larger internal market and the challenge to
bridge socio-economic differences between older and newer
member states. These processes will have an impact on the
European landscapes: spatial development and planning
policies have to keep pace with and attempt to provide some
control over these developments.
Many studies have confirmed that massive changes in the
European countryside are to be expected. The well known
study ‘Ground for Choices’ in the early 1990s showed an
enormous decrease in agricultural area for the member states
of the European Union for all scenarios considered upon
reform of the Common Agricultural Policy and supposed
optimization of production practices (Rabbinge et al., 1994;
Latesteijn, 1998). Although this study may have over-
P.H. Verburg et al. / Agriculture, Ecosystems and Environment 114 (2006) 39–5640
estimated the adaptation of agricultural technology, recent
studies by Rounsevell (Rounsevell et al., 2005) and van
Meijl et al. (this issue) still indicate considerable decreases
in agricultural area for most of the studied scenarios. These
projections have raised enormous concerns about rural
livelihoods and the contribution of the current agricultural
areas in terms of nature conservation, biodiversity and the
European landscape (Vos and Meekes, 1999). Furthermore,
European landscapes are threatened by unprecedented rates
of urbanization and sub-urbanization (Antrop, 2004;
Wasilewski and Krukowski, 2004) while at the same time
policies are anticipated to better protect natural areas and
valuable landscapes (Jongman, 1995). Traditional land-
scapes are changing with increasing speed and an important
cultural heritage is becoming lost. New landscapes replace
the traditional ones gradually or sometimes abruptly
(Eetvelde and Antrop, 2004).
A multitude of studies have addressed the concerns of
changes in land use and landscape in Europe. However, only
few have covered the whole extent of Europe (Rabbinge and
Van Latesteijn, 1992; Rounsevell et al., 2005) while many
studies investigate specific processes of land use change in
local case studies (Burgi, 1999; Peppler-Lisbach, 2003;
Hietel et al., 2004; Kristensen et al., 2004). Such local case
studies of landscape change have a tendency to focus
primarily on cases that are exemplary for the studied
processes or where land use change leads to severe
environmental problems (Burgi et al., 2004). Furthermore,
most local studies focus on historical changes in landscape
(Burgi, 1999; Tress et al., 2001), are not necessarily
representative for large areas and cannot provide informa-
tion on the aggregate impact of these changes at the
European level. On the other hand, the existing studies at the
European scale provide an overview of the main land use
changes but fail to integrate the different processes of
change and are conducted at such coarse spatial and
temporal scales that they cannot provide insight into the
consequences of the foreseen changes on the landscapes.
The observed gap between European level explorations
of future changes in agricultural area and local case studies
evaluating landscape impacts of ongoing processes, mostly
based on historic observations, is apparent and calls for
downscaling approaches that link the European level
developments to landscape level impacts. Such downscaling
is essential to adequately capture the enormous variability in
landscapes across Europe. A gross estimate of, for example,
5% decrease in agricultural area within the next 20 years is
not likely to affect all regions in a similar way. Even, given
such European level changes, it is not unlikely that certain
regions experience an increase in agricultural area. Down-
scaling will allow an assessment of these differential
developments and enable the identification of critical
regions and places that are most vulnerable to the effects
of these changes. The impacts on landscapes and other social
and environmental indicators can often not be based on the
coarse scale assessments since most impacts are location
specific and dependent on the spatial patterns of land use.
Impacts on biodiversity of natural areas not only depend on
the overall change in nature area but also on the change in
spatial configuration of the natural areas, determining the
relative connectivity or isolation of the natural areas
(Wimberly and Ohmann, 2004). Changes in livelihood in
areas that face abandonment of agricultural land are
expected to be highly variable, due to the spatial
concentration of land abandonment. Impacts of such
developments on carbon sequestration and land degradation
are highly dependent on the actual soil and landscape
conditions at the locations of abandonment; therefore
requiring high resolution assessments of land use change.
Such assessments cannot merely be based on local case
studies since case study location selection is often biased to
the presence of the phenomenon that is studied and results
cannot easily be extrapolated to the European extent.
Therefore, the downscaling of European level assessments
of land use change is essential to understand variations
between locations and make assessments of European level
impacts. Finally, downscaling provides both physical and
strategic planners with the tools that are required to envisage
the outcome of particular trends and assess the implications
of alternative decisions and planning strategies at different
spatial scales (Stillwell and Scholten, 2001).
To our knowledge there are no studies published in
literature that downscale European level scenarios of future
change in political and socio-economic conditions to a
resolution suitable for detecting landscape change. One
exception is the recently published scenario study for the
original 15 countries of the European Union by Rounsevell
et al. (2005). However, this downscaling effort, based on
simple land allocation rules, does not downscale beyond a
spatial resolution of 10 min (approximately 16 km). This
resolution does not allow the identification of land use
change effects at the landscape level and is insufficient to
establish a link with local case studies.
This paper presents a study that employs a high resolution
land use change model to downscale land use changes from
macro-scale models to the landscape level.
2. Methods and data
2.1. Overview of the approach
In contrast to the ‘Ground for Choices’ study published in
the early 1990s (Rabbinge and Van Latesteijn, 1992;
Rabbinge et al., 1994) the current study does not aim at
presenting optimized options for European land use given a
set of goals and policy objectives. Moreover, this study
intends to provide a procedure to visualize and explore
different, plausible, developments in land use in Europe.
Therefore, a scenario-based approach was chosen. Scenarios
follow the concept storylines of the IPCC Special Report on
Emission Scenarios (SRES) (IPCC, 2000) which are

P.H. Verburg et al. / Agriculture, Ecosystems and Environment 114 (2006) 39–56 41
structured along two axis yielding four scenarios distin-
guishing globalization from regionalisation; and develop-
ment pursuing narrowly defined economic objectives from
more broadly defined economic, social and environmental
objectives. However, the focus of these scenarios is
completely outside land use, agriculture and rural develop-
ment and lacks the regional disaggregating needed for this
study. Therefore the scenarios were elaborated for land use
issues and agricultural policies typical for Europe (Westhoek
et al., this issue). This resulted in a series of four scenarios
distinguished by different degrees of global (market)
integration and different levels of (policy) regulation. The
regulation level is indicative for the ambition of govern-
ments in pursuing its goals with ambitious regulation, e.g. to
obtain equity or environmental sustainability. Scenarios with
a relatively low level of regulation include the A1 (Global
Economy) and A2 (Continental Market) scenarios. The
other two scenarios: B1 (Global Co-operation) and B2
(Regional Communities) assume a relatively high level of
regulation, including specific spatial and agricultural
policies.
The storylines of the scenarios were scaled down to
assess the effects on land use patterns by a series of
simulation models that account for the hierarchical structure
of land use driving factors. Global trade agreements and
political structures may be an important factor explaining
differences in agricultural and industrial development
among continents and countries while local variations in
social and biophysical conditions are important determi-
nants of landscape patterns and variability. Furthermore, the
driving factors of landscape pattern are often region-specific
Fig. 1. Representation of the hierarchical procedure to translate the qualitative des
patterns.
as a consequence of different contextual conditions, specific
variation in the socio-economic and biophysical conditions,
and the influence of land use history and culture (Nassauer,
1995; Naveh, 2001). Since no single method can address the
different processes at these different scales consistently a
sequence of models was used at different scales (Fig. 1). The
demand for agricultural production, development of
production levels in agriculture, demand for urban and
industrial area and changes in acreage of natural areas were
calculated on a national scale taking into account European
level and global level conditions and interactions. For this
purpose use was made of a combination of a macro-
economic model and an integrated assessment model (van
Meijl et al., this issue). The actual downscaling of the
national level changes to the landscape level was done by a
spatially explicit land use change model. For each country
(or country-group) the assessment was done separately to be
able to account for the specific driving factors of land use
change in each country.
2.2. Land use change model
The land use and land cover change research community
has developed a wide range of spatially explicit land use
change models over the past decade. Reviews are provided
by Briassoulis (2000) and Verburg et al. (2004b). These
models differ in the spatial resolution and extent, underlying
concept and the range of applications. For the study
described in this paper the CLUE-s model (Conversion of
Land Use and its Effects model version CLUE-s 2.3) has
been chosen because of its flexibility in configuration, and
cription of scenarios into the quantitative simulation of impacts on land use
P.H. Verburg et al. / Agriculture, Ecosystems and Environment 114 (2006) 39–5642
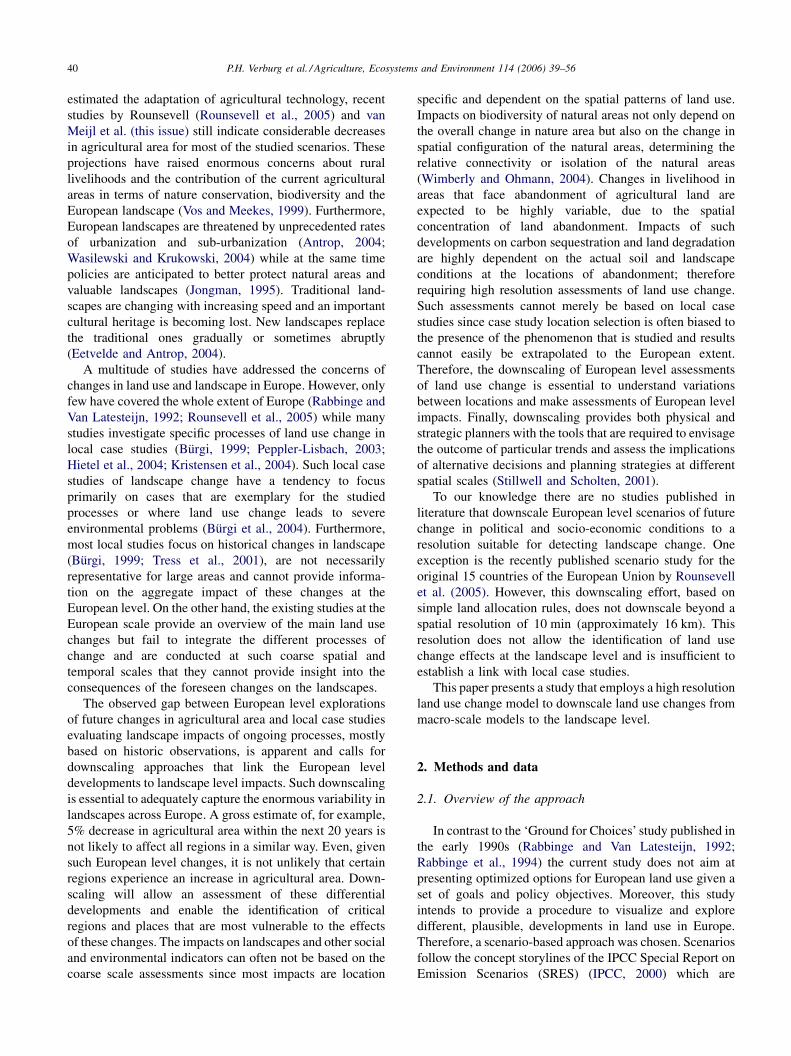
Fig. 2. Schematic representation of model structure.
the ability to specify the scenario conditions in detail
(Verburg et al., 2002; Verburg and Veldkamp, 2004a).
Furthermore, the model has been widely used by different
research groups and has been validated in different cases
(Kok et al., 2001; Verburg et al., 2002). The CLUE-s model
is based on the dynamic simulation of competition between
land uses while the spatial allocation rules can be specified
based on either an empirical analysis, user-specified
decision rules, neighborhood characteristics (similar to
cellular automata models (Verburg et al., 2004c)) or a
combination of these methods. The actual allocation is based
on the constraints and preferences defined by the user based
on the characteristics of the land use type or the assumed
processes and constraints relevant to the scenario. In the
following sections we describe the specification of model
parameterization in more detail. Differences between
scenarios are obtained by differences in data inputs and
variable settings that affect the behavior of the model.
Therefore, the parameterization is central to the downscaling
procedure. Four categories of settings and data inputs can be
distinguished that together define the set of preferences and
constraints for which the allocation routine determines an
optimal solution (Fig. 2).
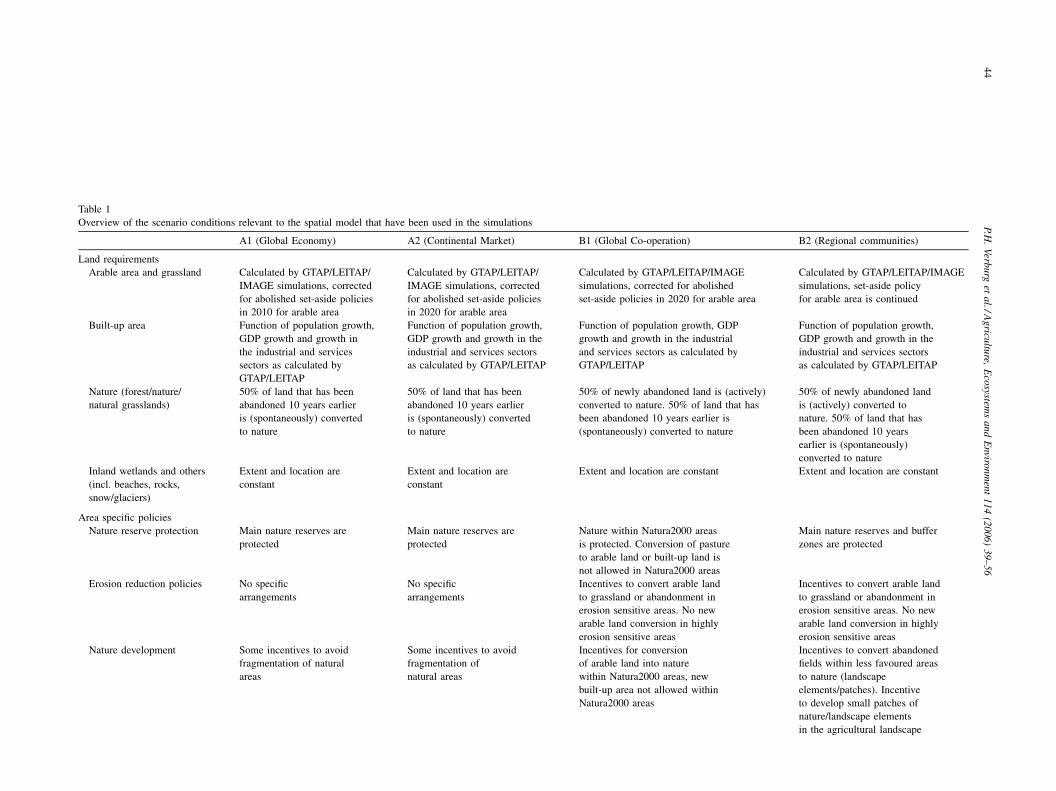
2.2.1. Land requirements
The land requirements of the different land use types
determine the actual area of the different land use types that
is allocated by the model. These demands are specified for
each country or country-group. Fig. 3 shows the countries
included in this study. In order to limit the number of
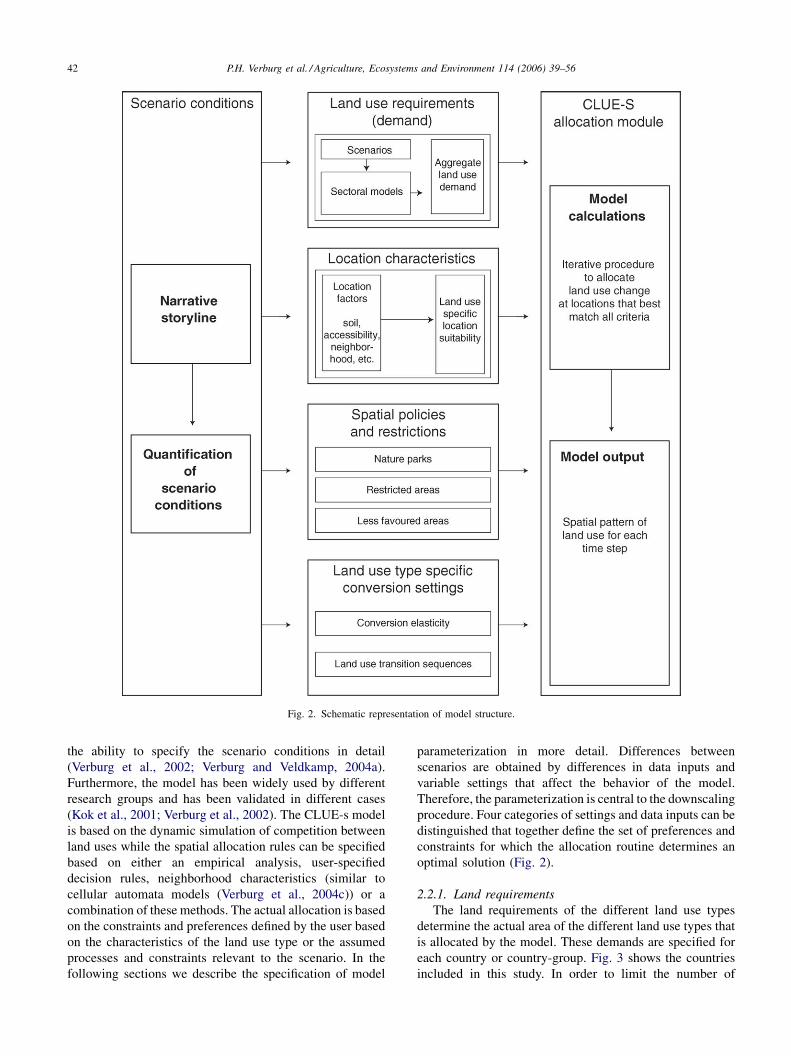
P.H. Verburg et al. / Agriculture, Ecosystems and Environment 114 (2006) 39–56 43
Fig. 3. Overview of the countries included in this study and indication of the ‘accession countries’.
countries distinguished in the macro-economic model (van
Meijl et al., this issue), the Baltic countries were dealt with
as one group as well as Belgium and Luxembourg. Changes
in agricultural land areas are based on the results of the
combined simulations with a macro-economic (GTAP) and
integrated assessment model (IMAGE) as described by van
Meijl et al. (this issue). GTAP calculates the economic
consequences for the agricultural system by capturing static
features of the global food market, with the dynamics from
exogenous scenario assumptions. The output from GTAP is
used by the IMAGE model to calculate yields, the demand
for land, feed efficiency rates and environmental indicators.
The output of GTAP/IMAGE cannot be directly used as
land requirements for the downscaling procedure. In
general, the current agricultural area has a larger extent in
the spatial data used in the downscaling procedure as
compared to the area reported in the statistical sources that
are used in the macro-economic calculations. This is
because the spatial data incorporate landscape elements that
are smaller than the mapping resolution within the mapping
units, e.g. ditches, roads and farm houses. Also temporarily
fallow land and non-cultivated field borders as part of the
set-aside policy are not distinguished in the spatial data.
Therefore, a correction is made to the output of the GTAP/
IMAGE models to account for these differences between
statistical and spatial data based on the current situation.
Growth in built-up area is calculated proportional to
changes in population, GDP and the growth in the industrial/
services sectors calculated by the macro-economic model.
Changes in natural area follow land availability after
accounting for changes in agricultural and built-up area. If
land is available, nature development can occur spontaneous
on abandoned lands or more directly through active
management of former agricultural areas. See Table 1 for
a specification of these conditions.
2.2.2. Location suitability
Whereas the demand for land by the different land use
types determines the overall competitive capacity of the
different land use types, the location suitability is a major
determinant of the competitive capacity of the different land
use types at a specific location. It is well known that a wide
range of local and more regional factors can influence the
suitability of a location for a land use type (Lambin et al.,
2001; Burgi et al., 2004). Besides the commonly considered
biophysical suitability in terms of crop growth potential,
other factors, such as accessibility or neighborhood
characteristics, should be considered as factors influencing
the suitability as perceived by the decision maker. In this
study the suitability is determined by a scenario and land use
type specific combination of empirical analysis, neighbor-
hood conditions and decision rules. The final suitability is a
weighted average of the suitability based on empirical
analysis capturing the historic and current location
preferences in response to location characteristics, the
influence of neighboring land uses on location suitability
(e.g. in case of agglomeration effects) and scenario specific
suitabilities based on scenario specific decision rules. It is
P.H
.V
erbu
rget
al./A
gricu
lture,
Eco
systems
an
dE
nviron
men
t1
14
(20
06
)3
9–
56
44
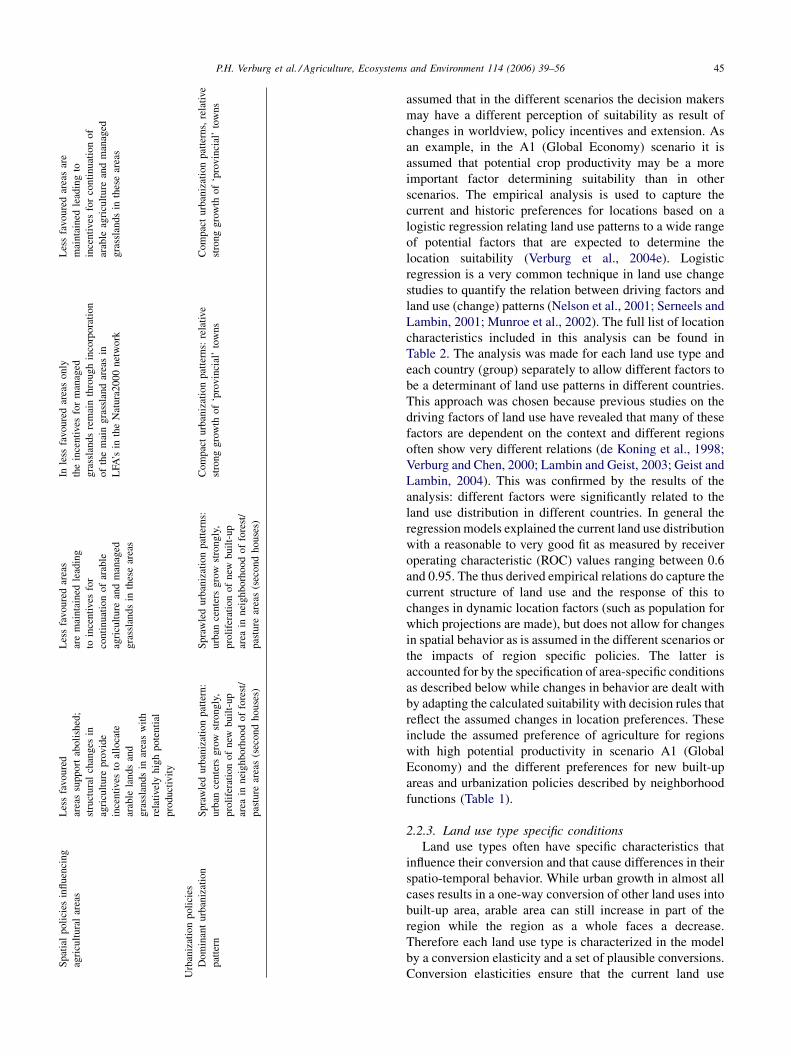
Table 1
Overview of the scenario conditions relevant to the spatial model that have been used in the simulations
A1 (Global Economy) A2 (Continental Market) B1 (Global Co-operation) B2 (Regional communities)
Land requirements
Arable area and grassland Calculated by GTAP/LEITAP/
IMAGE simulations, corrected
for abolished set-aside policies
in 2010 for arable area
Calculated by GTAP/LEITAP/
IMAGE simulations, corrected
for abolished set-aside policies
in 2020 for arable area
Calculated by GTAP/LEITAP/IMAGE
simulations, corrected for abolished
set-aside policies in 2020 for arable area
Calculated by GTAP/LEITAP/IMAGE
simulations, set-aside policy
for arable area is continued
Built-up area Function of population growth,
GDP growth and growth in
the industrial and services
sectors as calculated by
GTAP/LEITAP
Function of population growth,
GDP growth and growth in the
industrial and services sectors
as calculated by GTAP/LEITAP
Function of population growth, GDP
growth and growth in the industrial
and services sectors as calculated by
GTAP/LEITAP
Function of population growth,
GDP growth and growth in the
industrial and services sectors
as calculated by GTAP/LEITAP
Nature (forest/nature/
natural grasslands)
50% of land that has been
abandoned 10 years earlier
is (spontaneously) converted
to nature
50% of land that has been
abandoned 10 years earlier
is (spontaneously) converted
to nature
50% of newly abandoned land is (actively)
converted to nature. 50% of land that has
been abandoned 10 years earlier is
(spontaneously) converted to nature
50% of newly abandoned land
is (actively) converted to
nature. 50% of land that has
been abandoned 10 years
earlier is (spontaneously)
converted to nature
Inland wetlands and others
(incl. beaches, rocks,
snow/glaciers)
Extent and location are
constant
Extent and location are
constant
Extent and location are constant Extent and location are constant
Area specific policies
Nature reserve protection Main nature reserves are
protected
Main nature reserves are
protected
Nature within Natura2000 areas
is protected. Conversion of pasture
to arable land or built-up land is
not allowed in Natura2000 areas
Main nature reserves and buffer
zones are protected
Erosion reduction policies No specific
arrangements
No specific
arrangements
Incentives to convert arable land
to grassland or abandonment in
erosion sensitive areas. No new
arable land conversion in highly
erosion sensitive areas
Incentives to convert arable land
to grassland or abandonment in
erosion sensitive areas. No new
arable land conversion in highly
erosion sensitive areas
Nature development Some incentives to avoid
fragmentation of natural
areas
Some incentives to avoid
fragmentation of
natural areas
Incentives for conversion
of arable land into nature
within Natura2000 areas, new
built-up area not allowed within
Natura2000 areas
Incentives to convert abandoned
fields within less favoured areas
to nature (landscape
elements/patches). Incentive
to develop small patches of
nature/landscape elements
in the agricultural landscape
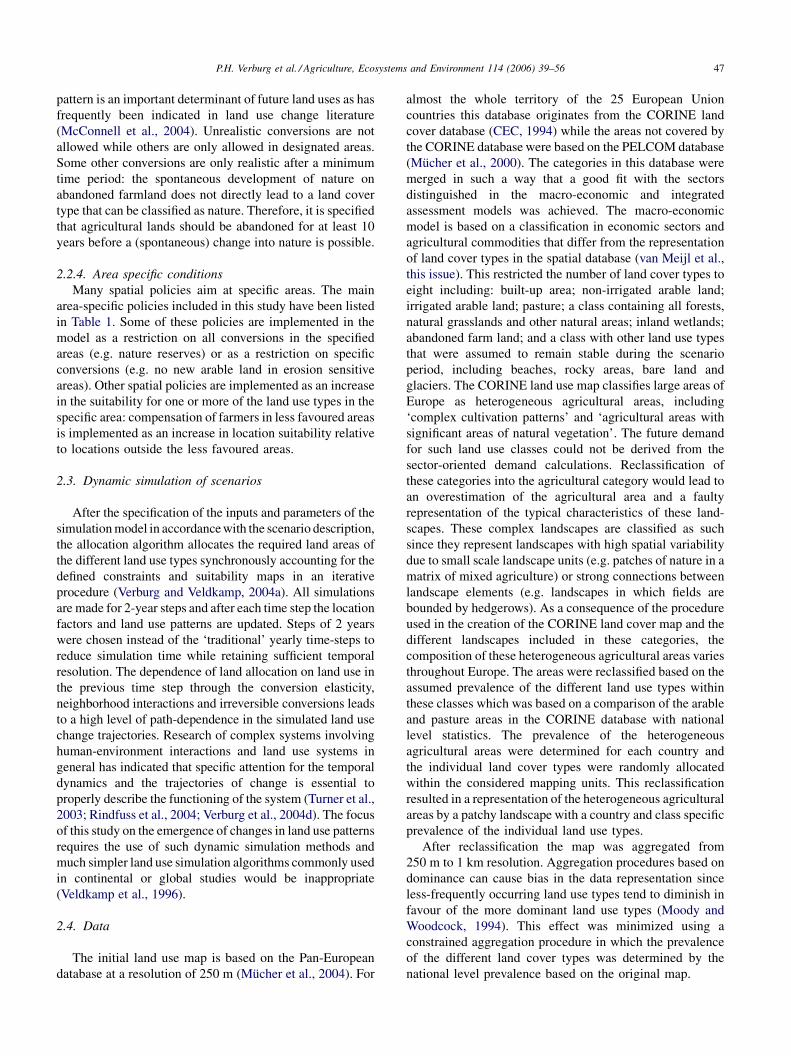
P.H. Verburg et al. / Agriculture, Ecosystems and Environment 114 (2006) 39–56 45S
pat
ial
po
lici
esin
flu
enci
ng
agri
cult
ura
lar
eas
Les
sfa
vo
ure
d
area
ssu
ppo
rtab
oli
shed
;
stru
ctu
ral
chan
ges
in
agri
cult
ure
pro
vid
e
ince
nti
ves
toal
loca
te
arab
lela
nds
and
gra
ssla
nd
sin
area
sw
ith
rela
tivel
yh
igh
po
ten
tial
pro
duct
ivit
y
Les
sfa
vo
ure
dar
eas
are
mai
nta
ined
lead
ing
toin
centi
ves
for
con
tin
uat
ion
of
arab
le
agri
cult
ure
and
man
aged
gra
ssla
nds
inth
ese
area
s
Inle
ssfa
vo
ure
dar
eas
on
ly
the
ince
nti
ves
for
man
aged
gra
ssla
nd
sre
mai
nth
roug
hin
corp
ora
tio
n
of
the
mai
ng
rass
lan
dar
eas
in
LFA
’sin
the
Nat
ura
20
00
net
wo
rk
Les
sfa
vo
ure
dar
eas
are
mai
nta
ined
lead
ing
to
ince
nti
ves
for
con
tin
uat
ion
of
arab
leag
ricu
lture
and
man
aged
gra
ssla
nd
sin
thes
ear
eas
Urb
aniz
atio
np
oli
cies
Do
min
ant
urb
aniz
atio
n
pat
tern
Spra
wle
durb
aniz
atio
npat
tern
:
urb
ance
nte
rsg
row
stro
ng
ly,
pro
life
rati
on
of
new
bu
ilt-
up
area
inn
eig
hb
orh
oo
do
ffo
rest
/
pas
ture
area
s(s
econ
dh
ou
ses)
Sp
raw
led
urb
aniz
atio
np
atte
rns:
urb
ance
nte
rsg
row
stro
ng
ly,
pro
life
rati
on
of
new
bu
ilt-
up
area
inn
eigh
bo
rho
od
of
fore
st/
pas
ture
area
s(s
eco
nd
ho
use
s)
Com
pac
turb
aniz
atio
npat
tern
s:re
lati
ve
stro
ng
gro
wth
of
‘pro
vin
cial
’to
wn
s
Com
pac
tu
rban
izat
ion
pat
tern
s,re
lati
ve
stro
ng
gro
wth
of
‘pro
vin
cial
’to
wn
s
assumed that in the different scenarios the decision makersmay have a different perception of suitability as result of
changes in worldview, policy incentives and extension. As
an example, in the A1 (Global Economy) scenario it is
assumed that potential crop productivity may be a more
important factor determining suitability than in other
scenarios. The empirical analysis is used to capture the
current and historic preferences for locations based on a
logistic regression relating land use patterns to a wide range
of potential factors that are expected to determine the
location suitability (Verburg et al., 2004e). Logistic
regression is a very common technique in land use change
studies to quantify the relation between driving factors and
land use (change) patterns (Nelson et al., 2001; Serneels and
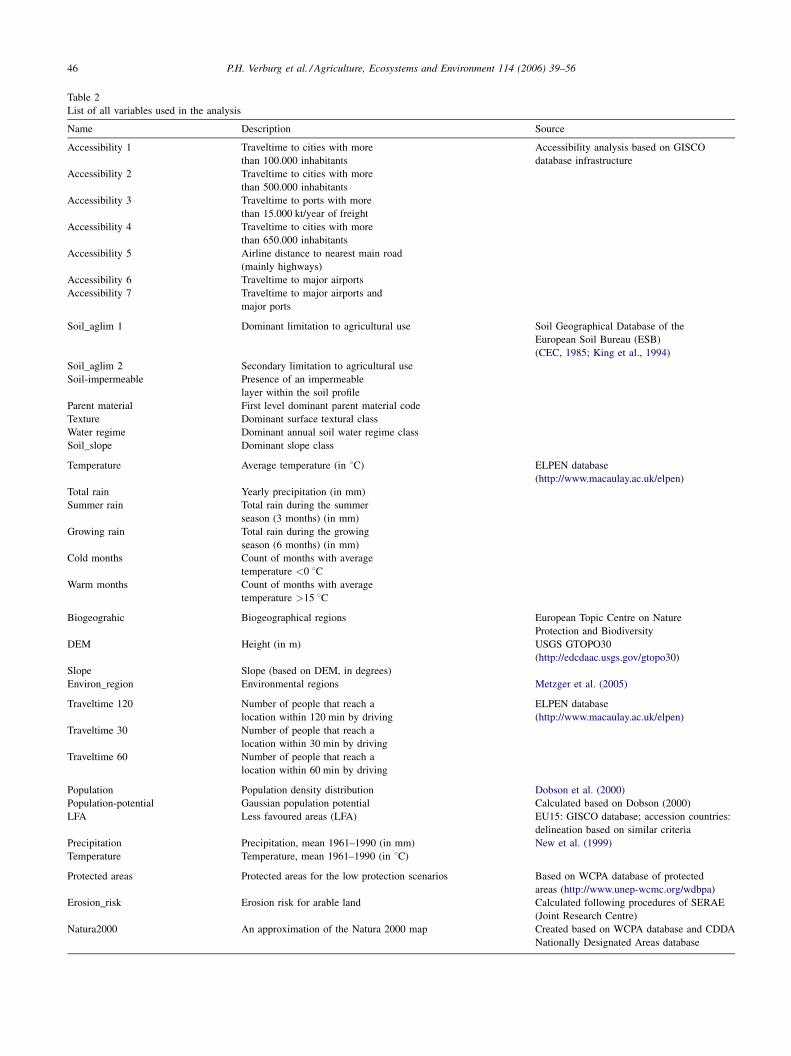
Lambin, 2001; Munroe et al., 2002). The full list of location
characteristics included in this analysis can be found in
Table 2. The analysis was made for each land use type and
each country (group) separately to allow different factors to
be a determinant of land use patterns in different countries.
This approach was chosen because previous studies on the
driving factors of land use have revealed that many of these
factors are dependent on the context and different regions
often show very different relations (de Koning et al., 1998;
Verburg and Chen, 2000; Lambin and Geist, 2003; Geist and
Lambin, 2004). This was confirmed by the results of the
analysis: different factors were significantly related to the
land use distribution in different countries. In general the
regression models explained the current land use distribution
with a reasonable to very good fit as measured by receiver
operating characteristic (ROC) values ranging between 0.6
and 0.95. The thus derived empirical relations do capture the
current structure of land use and the response of this to
changes in dynamic location factors (such as population for
which projections are made), but does not allow for changes
in spatial behavior as is assumed in the different scenarios or
the impacts of region specific policies. The latter is
accounted for by the specification of area-specific conditions
as described below while changes in behavior are dealt with
by adapting the calculated suitability with decision rules that
reflect the assumed changes in location preferences. These
include the assumed preference of agriculture for regions
with high potential productivity in scenario A1 (Global
Economy) and the different preferences for new built-up
areas and urbanization policies described by neighborhood
functions (Table 1).
2.2.3. Land use type specific conditions
Land use types often have specific characteristics that
influence their conversion and that cause differences in their
spatio-temporal behavior. While urban growth in almost all
cases results in a one-way conversion of other land uses into
built-up area, arable area can still increase in part of the
region while the region as a whole faces a decrease.
Therefore each land use type is characterized in the model
by a conversion elasticity and a set of plausible conversions.
Conversion elasticities ensure that the current land use
P.H. Verburg et al. / Agriculture, Ecosystems and Environment 114 (2006) 39–5646
Table 2
List of all variables used in the analysis
Name Description Source
Accessibility 1 Traveltime to cities with more
than 100.000 inhabitants
Accessibility analysis based on GISCO
database infrastructure
Accessibility 2 Traveltime to cities with more
than 500.000 inhabitants
Accessibility 3 Traveltime to ports with more
than 15.000 kt/year of freight
Accessibility 4 Traveltime to cities with more
than 650.000 inhabitants
Accessibility 5 Airline distance to nearest main road
(mainly highways)
Accessibility 6 Traveltime to major airports
Accessibility 7 Traveltime to major airports and
major ports
Soil_aglim 1 Dominant limitation to agricultural use Soil Geographical Database of the
European Soil Bureau (ESB)
(CEC, 1985; King et al., 1994)
Soil_aglim 2 Secondary limitation to agricultural use
Soil-impermeable Presence of an impermeable
layer within the soil profile
Parent material First level dominant parent material code
Texture Dominant surface textural class
Water regime Dominant annual soil water regime class
Soil_slope Dominant slope class
Temperature Average temperature (in 8C) ELPEN database
(http://www.macaulay.ac.uk/elpen)
Total rain Yearly precipitation (in mm)
Summer rain Total rain during the summer
season (3 months) (in mm)
Growing rain Total rain during the growing
season (6 months) (in mm)
Cold months Count of months with average
temperature <0 8CWarm months Count of months with average
temperature >15 8C
Biogeograhic Biogeographical regions European Topic Centre on Nature
Protection and Biodiversity
DEM Height (in m) USGS GTOPO30
(http://edcdaac.usgs.gov/gtopo30)
Slope Slope (based on DEM, in degrees)
Environ_region Environmental regions Metzger et al. (2005)
Traveltime 120 Number of people that reach a
location within 120 min by driving
ELPEN database
(http://www.macaulay.ac.uk/elpen)
Traveltime 30 Number of people that reach a
location within 30 min by driving
Traveltime 60 Number of people that reach a
location within 60 min by driving
Population Population density distribution Dobson et al. (2000)
Population-potential Gaussian population potential Calculated based on Dobson (2000)
LFA Less favoured areas (LFA) EU15: GISCO database; accession countries:
delineation based on similar criteria
Precipitation Precipitation, mean 1961–1990 (in mm) New et al. (1999)
Temperature Temperature, mean 1961–1990 (in 8C)
Protected areas Protected areas for the low protection scenarios Based on WCPA database of protected
areas (http://www.unep-wcmc.org/wdbpa)
Erosion_risk Erosion risk for arable land Calculated following procedures of SERAE
(Joint Research Centre)
Natura2000 An approximation of the Natura 2000 map Created based on WCPA database and CDDA
Nationally Designated Areas database
P.H. Verburg et al. / Agriculture, Ecosystems and Environment 114 (2006) 39–56 47
pattern is an important determinant of future land uses as has
frequently been indicated in land use change literature
(McConnell et al., 2004). Unrealistic conversions are not
allowed while others are only allowed in designated areas.
Some other conversions are only realistic after a minimum
time period: the spontaneous development of nature on
abandoned farmland does not directly lead to a land cover
type that can be classified as nature. Therefore, it is specified
that agricultural lands should be abandoned for at least 10
years before a (spontaneous) change into nature is possible.
2.2.4. Area specific conditions
Many spatial policies aim at specific areas. The main
area-specific policies included in this study have been listed
in Table 1. Some of these policies are implemented in the
model as a restriction on all conversions in the specified
areas (e.g. nature reserves) or as a restriction on specific
conversions (e.g. no new arable land in erosion sensitive
areas). Other spatial policies are implemented as an increase
in the suitability for one or more of the land use types in the
specific area: compensation of farmers in less favoured areas
is implemented as an increase in location suitability relative
to locations outside the less favoured areas.
2.3. Dynamic simulation of scenarios
After the specification of the inputs and parameters of the
simulation model in accordance with the scenario description,
the allocation algorithm allocates the required land areas of
the different land use types synchronously accounting for the
defined constraints and suitability maps in an iterative
procedure (Verburg and Veldkamp, 2004a). All simulations
are made for 2-year steps and after each time step the location
factors and land use patterns are updated. Steps of 2 years
were chosen instead of the ‘traditional’ yearly time-steps to
reduce simulation time while retaining sufficient temporal
resolution. The dependence of land allocation on land use in
the previous time step through the conversion elasticity,
neighborhood interactions and irreversible conversions leads
to a high level of path-dependence in the simulated land use
change trajectories. Research of complex systems involving
human-environment interactions and land use systems in
general has indicated that specific attention for the temporal
dynamics and the trajectories of change is essential to
properly describe the functioning of the system (Turner et al.,
2003; Rindfuss et al., 2004; Verburg et al., 2004d). The focus
of this study on the emergence of changes in land use patterns
requires the use of such dynamic simulation methods and
much simpler land use simulation algorithms commonly used
in continental or global studies would be inappropriate
(Veldkamp et al., 1996).
2.4. Data
The initial land use map is based on the Pan-European
database at a resolution of 250 m (Mucher et al., 2004). For
almost the whole territory of the 25 European Union
countries this database originates from the CORINE land
cover database (CEC, 1994) while the areas not covered by
the CORINE database were based on the PELCOM database
(Mucher et al., 2000). The categories in this database were
merged in such a way that a good fit with the sectors
distinguished in the macro-economic and integrated
assessment models was achieved. The macro-economic
model is based on a classification in economic sectors and
agricultural commodities that differ from the representation
of land cover types in the spatial database (van Meijl et al.,
this issue). This restricted the number of land cover types to
eight including: built-up area; non-irrigated arable land;
irrigated arable land; pasture; a class containing all forests,
natural grasslands and other natural areas; inland wetlands;
abandoned farm land; and a class with other land use types
that were assumed to remain stable during the scenario
period, including beaches, rocky areas, bare land and
glaciers. The CORINE land use map classifies large areas of
Europe as heterogeneous agricultural areas, including
‘complex cultivation patterns’ and ‘agricultural areas with
significant areas of natural vegetation’. The future demand
for such land use classes could not be derived from the
sector-oriented demand calculations. Reclassification of
these categories into the agricultural category would lead to
an overestimation of the agricultural area and a faulty
representation of the typical characteristics of these land-
scapes. These complex landscapes are classified as such
since they represent landscapes with high spatial variability
due to small scale landscape units (e.g. patches of nature in a
matrix of mixed agriculture) or strong connections between
landscape elements (e.g. landscapes in which fields are
bounded by hedgerows). As a consequence of the procedure
used in the creation of the CORINE land cover map and the
different landscapes included in these categories, the
composition of these heterogeneous agricultural areas varies
throughout Europe. The areas were reclassified based on the
assumed prevalence of the different land use types within
these classes which was based on a comparison of the arable
and pasture areas in the CORINE database with national
level statistics. The prevalence of the heterogeneous
agricultural areas were determined for each country and
the individual land cover types were randomly allocated
within the considered mapping units. This reclassification
resulted in a representation of the heterogeneous agricultural
areas by a patchy landscape with a country and class specific
prevalence of the individual land use types.
After reclassification the map was aggregated from
250 m to 1 km resolution. Aggregation procedures based on
dominance can cause bias in the data representation since
less-frequently occurring land use types tend to diminish in
favour of the more dominant land use types (Moody and
Woodcock, 1994). This effect was minimized using a
constrained aggregation procedure in which the prevalence
of the different land cover types was determined by the
national level prevalence based on the original map.
P.H. Verburg et al. / Agriculture, Ecosystems and Environment 114 (2006) 39–5648
The location factors that were assumed to be determi-
nants of the land use patterns are derived from a wide range
of different data sets. Only few consistent datasets are
available for the whole extent of 25 countries. Since the
selection of location factors and the simulations were
conducted for each country (group) separately some datasets
were used that did not cover the whole extent of the study
area. This prevented that important factors that were not
available for the complete extent had to be disregarded
altogether. Some other datasets were, however, required to
fully cover the area to obtain consistent simulations across
the countries. An example is the delineation of the less
favoured areas policy. Within the designated less favoured
areas farmers are eligible for compensation for the less
favourable farming conditions. At the time of study the less
favoured areas in the accession countries were not yet
formally defined. Therefore, an approximation was made by
applying the official criteria used to delineate the less
favoured areas to the topographic and demographic
conditions in the accession countries. A similar approxima-
tion was made for delineating the areas that are part of the
Natura2000 network of protected areas. Table 2 provides a
list of all variables included in the analysis and a short
description of the origin of the data.
3. Results
3.1. Scenario specific results
The land use simulations result in 2-yearly maps of land
use at 1 km2 resolution for the whole European Union
(EU25). These maps provide important information on the
changing spatial patterns of land use and are the basis for the
assessment of the potential impacts of these changes. Multi-
temporal analysis of the maps reveals the trajectories of land
use change and leads to the identification of regions that can
be considered as potential hotspots of land use change.
Hotspots were identified for all major conversions in
European land use: urbanization, agricultural abandonment
and changes in the natural areas. Based on this analysis the
most striking results for each scenario are summarized.
3.1.1. Global Economy (A1)
Most striking in the A1 scenario is the large extent of
urbanization. The urbanization is a result of high population
growth, high economic growth leading to a larger use of
space per person (e.g. due to the demand for shopping and
recreation facilities) and growth in the industry and services
sector. Urbanization is found throughout the whole of
Europe with hotspots located near to the main cities and
agglomerations such as the Dutch Randstad and the Flemish
Diamond. The absence of spatial policies to control urban
sprawl causes urbanization to have large influences on the
landscapes in many parts of Europe. Since abandonment of
agricultural land is found in most countries the future
function of these lands is an important discussion item. The
abandoned lands are partially used for residential, industrial
and recreational purposes, while in less accessible areas with
low population pressure spontaneous development of nature
is expected. This leads to an expansion of some of the larger
natural areas of Europe. Agriculture is expected to disappear
from many of the least productive areas in Europe.
3.1.2. Continental Market (A2)
The A2 scenario is characterized by high pressure on
available land resources. In spite of a slight decrease in
population numbers, requirements for build-up area increase
due to strong economic growth and increases in prosperity
leading to a sprawled spatial pattern of urbanization (e.g.
proliferation of second houses). At the same time the high
protection level for European agriculture as well as the
global macro-economic conditions cause an increase in land
required for agricultural purposes. In many countries the
combined requirements for agricultural and residential/
commercial purposes cause that the conversions come at the
cost of natural areas. Mostly the small patches of nature and
landscape elements (most likely including small patches of
nature and hedgerows) that remain within the prime
agricultural areas will be lost first. Therefore, it is expected
that the conditions of this scenario have an important
negative impact on the natural and cultural-historical values
of the European landscapes.
3.1.3. Global Co-operation (B1)
In the B1 scenario urbanization has fewer impacts on the
rural landscapes. This is due to the lower requirements for
residential/commercial areas compared to the A scenarios.
At the same time the spatial policies that are assumed under
this scenario (see Table 1) aim at concentrating urbanization
in designated areas, leading to compact urbanization
patterns. Other policies in this scenario aim at reinforcing
the natural values and ecological strengths of natural areas
designated in the Natura2000 network. Natura2000 is a
European network of protected sites, which represent areas
of the highest value for natural habitats and species of plants
and animals, which are rare, endangered or vulnerable in the
European Community. Large areas of abandonment of
agricultural lands offer opportunities to actually implement
these policies. Land abandonment is the result of the macro-
economic conditions in combination with increasing
productivity leading to strong decreases in land required
for agricultural purposes. The results suggest a significant
reinforcement of the designated protected natural areas at
the cost of agricultural area that is concentrated in the prime
agricultural regions.
3.1.4. Regional Communities (B2)
This scenario shows relative modest changes in landscape
patterns due to the low rate of urbanization, policies to
maintain agricultural production in the ‘less favoured areas’
and no policies to establish an European level network of
P.H. Verburg et al. / Agriculture, Ecosystems and Environment 114 (2006) 39–56 49
Table 3
Total area changed due to land use change across the European Union for the
different scenarios
Scenario % of land area changed between 2000 and 2030
All EU
countries
‘Old’ EU
countries (EU15)
Accession
countries
A1 7.65 7.15 9.83
A2 4.74 4.53 5.62
B1 8.07 8.51 6.19
B2 6.02 6.30 4.79
natural areas. Land abandonment is, therefore, found
distributed over different landscapes. Modest increases in
agricultural productivity in combination with the decrease of
agricultural area offers opportunity to maintain diversity,
natural and cultural–historical values in most rural areas.
3.2. Comparison of the scenarios
The interplay between demand for agricultural and urban
land, spatial policies and competition among land uses leads
to differences in land use dynamics between the scenarios.
Table 3 indicates which part of the land area of the EU is
expected to face some kind of change in land use between
2000 and 2030. This table indicates a tremendous impact on
land use in this period: even in the scenario with the smallest
dynamics (A2) almost 5% of the total land area will be
converted to another land use type. Note that this only
includes conversions between the legend classes used in this
study; other conversions that do not change our classification
of the land use, e.g. between crop types or residential and
industrial functions, are not counted. Due to the large area of
land abandonment the B1 scenario is most dynamic resulting
in large changes in land use patterns. These changes can
have a huge impact on the aesthetic and functional quality of
the landscapes. Another pattern of interest is the relative
strength of land use dynamics in the 15 countries that were
member of the European Union before 2004 (EU15) versus
the accession countries. Whereas the accession countries
show more dynamics in the A scenarios compared to the
EU15 countries, the pattern is opposite in the B scenarios
where most dynamics occur in the EU15 countries.
Of all changes in land use abandonment of agricultural
land is most important in terms of area (Table 4). While in
Table 4
Percentage of total land area of the EU that is expected to change due to
urbanization, land abandonment or the development of new nature
A1 A2 B1 B2
Urbanization 2.37 1.38 1.33 0.41
Land abandonmenta 6.35 2.49 6.28 5.21
New natureb 2.11 0.55 4.58 3.18
a This only includes abandoned agricultural land, not corrected for new
agricultural areas at other locations.b This only includes the areas of new nature, not corrected for loss of
nature area at other locations.
the A2 scenario 2.5% of the land area (which equals
approximately 5% of the agricultural area in 2000) is
abandoned this is 6.4% (approximately 13% of the
agricultural area) in the A1 scenario where abandonment
of the current agricultural area is largest. Due to the small
expansion of the agricultural in some parts of Europe in the
Global Economy (A1) scenario the net loss of agricultural
area is less than in the Global Co-operation (B1) scenario.
Land abandonment puts an important issue concerning
alternative uses on the agenda of to policy makers. Part of the
abandoned land, especially in the A1 scenario, is used for
residential, industrial and recreation purposes. In all other
scenarios this is less and nature has possibilities to develop
on these lands. In the A scenarios nature development is
assumed to occur only spontaneous; especially in the
Continental Market (A2) scenario the extent of nature
development is therefore very restricted. Under the
conditions in the B scenarios active nature development
leads to a large expansion of the natural areas, mainly on
former agricultural land. The lower urbanization rates
provide opportunities for this development.
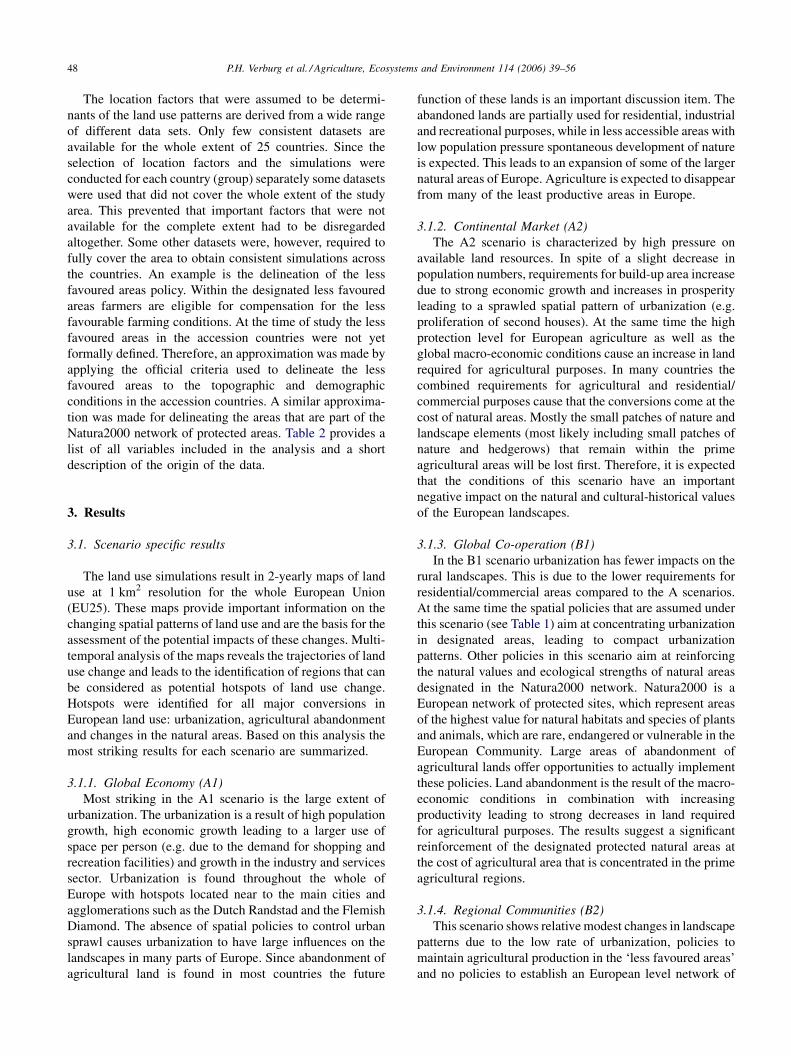
Hotspots for agricultural land abandonment are typically
found in the neighborhood of important cities, where urban
pressure is high, or in areas that are surrounded by or border
natural areas. These areas are mostly marginal areas for
agriculture and easily abandoned in scenarios where
production efficiency increases. In the scenarios in which
nature development is an important issue, these areas are (as
a consequence of location adjacent to nature areas and the
lack of alternative uses) favoured for nature development
(Fig. 4).
Locations of areas where nature is lost differ by scenario.
Hardly any hotspots of nature loss are identified since the
losses mostly are mainly the small patches within or
bordering the agricultural areas. Hotspots for development
of nature are often found in the neighborhood of existing
natural areas. This is most often due to abandonment of
agricultural lands on marginal soils bordering nature areas or
due to spatial policies such as the reinforcement of the
Natura2000 conservation plan.
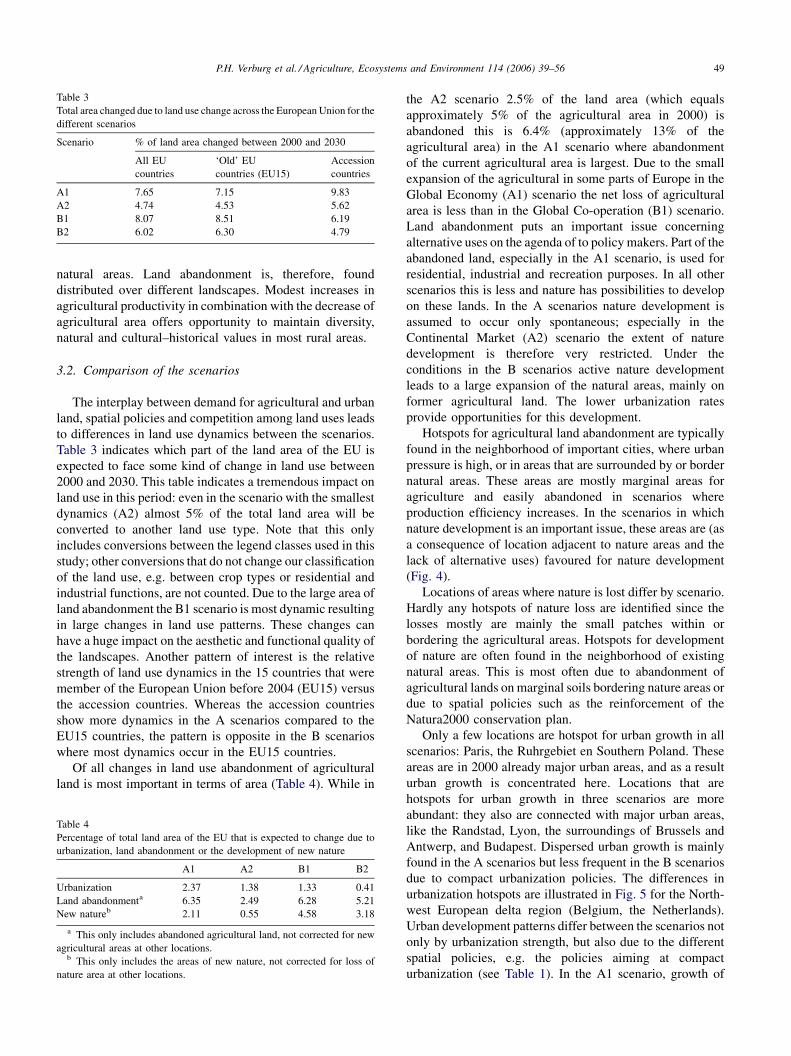
Only a few locations are hotspot for urban growth in all
scenarios: Paris, the Ruhrgebiet en Southern Poland. These
areas are in 2000 already major urban areas, and as a result
urban growth is concentrated here. Locations that are
hotspots for urban growth in three scenarios are more
abundant: they also are connected with major urban areas,
like the Randstad, Lyon, the surroundings of Brussels and
Antwerp, and Budapest. Dispersed urban growth is mainly
found in the A scenarios but less frequent in the B scenarios
due to compact urbanization policies. The differences in
urbanization hotspots are illustrated in Fig. 5 for the North-
west European delta region (Belgium, the Netherlands).
Urban development patterns differ between the scenarios not
only by urbanization strength, but also due to the different
spatial policies, e.g. the policies aiming at compact
urbanization (see Table 1). In the A1 scenario, growth of
P.H. Verburg et al. / Agriculture, Ecosystems and Environment 114 (2006) 39–5650
Fig. 4. Identification of ‘hotspots’ of agricultural abandonment (2000–2030) and remaining agricultural areas. The colors indicate the number of scenarios in
which the location is identified as a ‘hotspot’.
built-up area is highest due to the high growth of the
population, GDP and the industry and services sectors. Fig. 5
shows that adjacent to existing urban areas large new urban/
industrial areas are projected. At the same time a lot of urban
sprawl is found in villages and small towns throughout the
area, especially in the ‘green’ areas (due to e.g. the
proliferation of second houses) and liberal spatial policies.
In the A2 scenario we find a similar pattern. However, due to
the lower increase in built-up area the growth of the larger
cities is less striking. In the B1 and B2 scenarios the growth
rate of built-up area in this part of Europe is much smaller.
Still, large ‘hotspots’ of urbanization directly adjacent to the
existing urban centres can be seen. This urbanization pattern
reflects the spatial policies aiming at compact urbanization
assumed for these scenarios.
The overlap in simulated changes between the different
scenarios can be used to identify differences and similarities
between the scenarios (Fig. 4). Some locations change in
each scenario: these are not dependent on the scenario
conditions and could be indicated as locations that change
independently from differences in the spatial policies among
the scenarios. Many other locations are only subject to
change in one or two scenarios, partly because of the
differences in the demand for changes among the scenarios,
but also because of the differences in spatial policies. In
addition, the competition between the land use types differs
between the scenarios, leading to different path-dependent
developments that cause differences in resulting land use
patterns between the scenarios.
The maximum possible overlap between locations of
change is determined by the scenario with the least change.
In Table 5 the maximum possible overlap is compared with
the real overlap. The maximum overlap for urbanization is
very much restricted due to the low urbanization rate in the
Regional Communities (B2) scenario. However, in spite of
the small area, only 73% of the area in the B2 scenario is also
urbanized in the scenarios where urbanization is more
dominant. The overlap between the areas allocated to built-
up area is partly a result of the tendency of the growth
adjacent to the major urban centres in all scenarios. If the
other scenarios are compared to scenario A1 that has the
highest rate of urbanization it is found that, respectively, 67
and 58% of the new built-up area for the A2 and B1
scenarios is allocated at the same locations as in the A1
scenario. In the B1 scenario urbanization is assumed to be
more regulated by planning policies and therefore large
differences with the A1 scenario appear. Land abandonment
and new nature are more different in spatial allocation
between the scenarios. Only 39% of the new nature area in
the A2 scenario is also converted to nature in the other
scenarios. This is mainly due to the largely different spatial
policies concerning nature protection and enforcement of
P.H. Verburg et al. / Agriculture, Ecosystems and Environment 114 (2006) 39–56 51
Fig. 5. New built-up areas (black) projected for 2030 and existing urban areas (gray) for the North-western European delta region (Belgium/The Netherlands)
for the different scenarios.
the Natura2000 network of protected areas versus the
protection of natural patches within the agricultural land-
scapes.
3.3. Landscape level impacts
In order to provide an assessment of the potential impact
of the land use changes in the different scenarios on
landscape characteristics the results should be analysed in
more detail. Two examples of the impact on landscape
variability are discussed in this paper and illustrated with
Figs. 6 and 7.
The first example illustrates how non-linear changes in
demand for arable land can have large impacts on the
landscape. Such non-linear changes in demand are
Table 5
Overlap in location for the main land use conversions on a European scale
Maximum overlap (% of land area)
Urbanization 0.41
Land abandonment 2.49
New nature 0.55
especially found in most accession countries for the
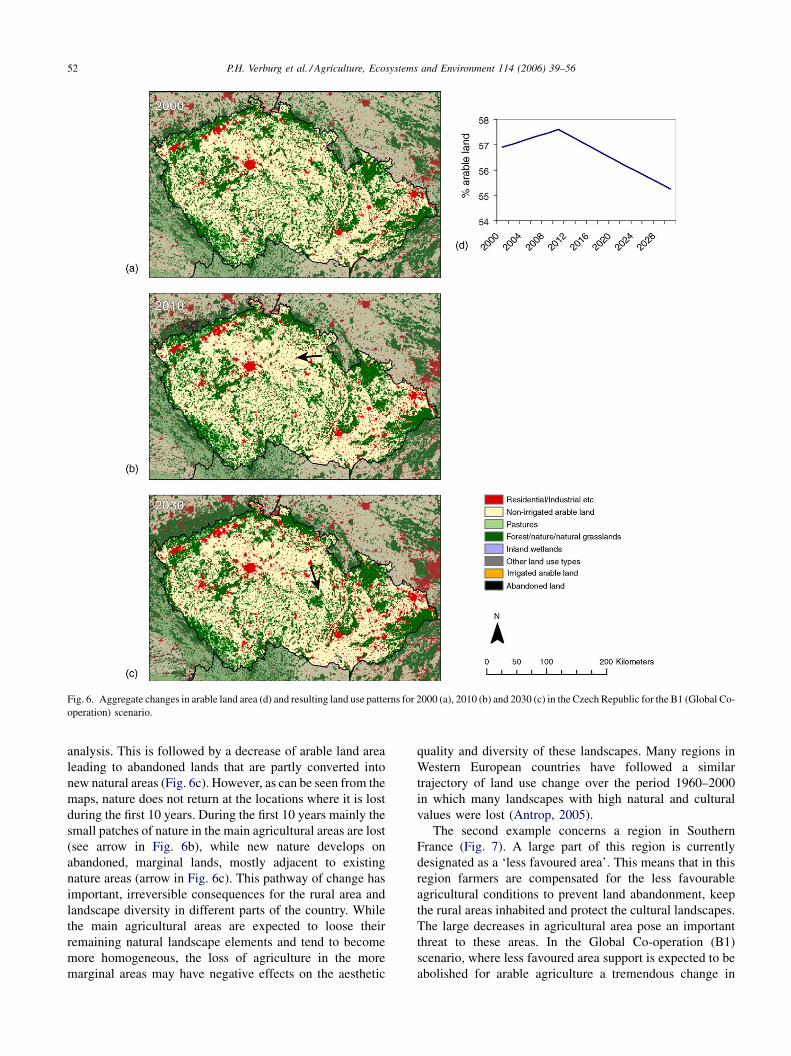
conditions in the Global Co-operation (B1) scenario. The
results of the macro-economic model calculations for this
scenario (see van Meijl et al., this issue) show an increase in
the arable land area until 2013 followed by a decrease in area
until 2030 (Fig. 6d). This is due to changes in agricultural
policies after 2013: until that year the accession countries
are expected to benefit from European agricultural policies
and production quota, leading to an increase in arable area in
the first decade. This scenario, however, implies that
production quota are abolished which will result in a
stronger influence of liberalization after 2013, leading to
abandonment of agricultural lands. As is illustrated in
Fig. 6b the increase in the area of arable land comes at the
cost of a decrease in nature area during the first decade of the
Real overlap (% of land area) Ratio between real and
maximum overlap (%)
0.30 73
1.03 41
0.21 39
P.H. Verburg et al. / Agriculture, Ecosystems and Environment 114 (2006) 39–5652
Fig. 6. Aggregate changes in arable land area (d) and resulting land use patterns for 2000 (a), 2010 (b) and 2030 (c) in the Czech Republic for the B1 (Global Co-
operation) scenario.
analysis. This is followed by a decrease of arable land area
leading to abandoned lands that are partly converted into
new natural areas (Fig. 6c). However, as can be seen from the
maps, nature does not return at the locations where it is lost
during the first 10 years. During the first 10 years mainly the
small patches of nature in the main agricultural areas are lost
(see arrow in Fig. 6b), while new nature develops on
abandoned, marginal lands, mostly adjacent to existing
nature areas (arrow in Fig. 6c). This pathway of change has
important, irreversible consequences for the rural area and
landscape diversity in different parts of the country. While
the main agricultural areas are expected to loose their
remaining natural landscape elements and tend to become
more homogeneous, the loss of agriculture in the more
marginal areas may have negative effects on the aesthetic
quality and diversity of these landscapes. Many regions in
Western European countries have followed a similar
trajectory of land use change over the period 1960–2000
in which many landscapes with high natural and cultural
values were lost (Antrop, 2005).
The second example concerns a region in Southern
France (Fig. 7). A large part of this region is currently
designated as a ‘less favoured area’. This means that in this
region farmers are compensated for the less favourable
agricultural conditions to prevent land abandonment, keep
the rural areas inhabited and protect the cultural landscapes.
The large decreases in agricultural area pose an important
threat to these areas. In the Global Co-operation (B1)
scenario, where less favoured area support is expected to be
abolished for arable agriculture a tremendous change in

P.H. Verburg et al. / Agriculture, Ecosystems and Environment 114 (2006) 39–56 53
Fig. 7. Land use pattern in 2000 and 2030 for the B1 (Global Co-operation) and B2 (Regional Communities) scenario for Southern France (city in the lower
right corner is Marseille).
landscape pattern is observed. Many marginal fields are
abandoned and become part of the natural area, leading to an
expansion of the natural areas in this region. However, the
loss of agricultural activities from these landscapes will have
important consequences for the character and quality of the
landscape. In the Regional Communities (B2) scenario
support of farming activities in less favoured areas is
assumed to be maintained. However, in spite of this support,
not all agricultural land in the less favoured areas will
remain in production due to the large decrease in the total
agricultural area. However, due to the less favoured area
support it is expected that the remaining landscape pattern
will still exhibit some of the variability in land use
characteristic for the current landscape in this area.
Therefore, the changes in landscape in this area are much
less drastic in this scenario. The differential impacts on
landscapes are a demonstration of the impact macro-
economic changes may have on regional land use patterns.
4. Discussion
The procedure described in this paper has been successful
in downscaling a coarse scale assessment of changes in land
use to region-specific changes in land use pattern. The high
spatial resolution visualizes the consequences of these
changes for the different regions within the countries and
reveals the enormous spatial variability in impact on the
landscape. The land use model accounts for spatial and
temporal interactions and allows specific driving factors for
different countries and scenarios. In interaction with the
macro-level changes in land demand varying, dynamic,
spatial patterns of land use change emerge and it becomes
clear how policies affect landscapes in different contexts.
Although the representation of landscape level changes is
still relatively coarse as a consequence of the spatial
resolution as compared to the resolution used in landscape
level case studies, the approach provides an opportunity to
bridge European level assessments and local case studies.
The type of landscape processes (fragmentation, abandon-
ment, urban encroachment, etc.) that are observed and
described in local case studies can be identified from the
simulation results. Furthermore, from the maps it is possible
to estimate in which parts of Europe similar processes of
change in landscape pattern are expected and, therefore, give
an indication of the general validity of the case study. In this
sense, the approach can be used as a framework to link local
case studies that add more depth in understanding the
P.H. Verburg et al. / Agriculture, Ecosystems and Environment 114 (2006) 39–5654
processes of landscape change. It should be noted that,
without additional information, the method only addresses
changes in landscape in terms of changes in land use pattern.
Following the definition of Wascher (2004) landscapes are
spatial units whose character and functions are defined by
the complex and region-specific interaction of natural
processes with human activities that are driven by
economic, social and environmental forces and values.
Therefore, a full analysis of landscape change needs
additional information on the social and economic impacts
of change in order to obtain a comprehensive assessment of
the landscape.
The visualization of changes in land use pattern for
different scenarios can support policy discussions on the
development of the European landscape, support the
identification of priority areas for intervention and test the
potential consequences of certain policy options. Although
technically it is possible to calculate the consequences of
individual spatial policies on land use patterns, such an
approach may not be consistent with the scenario approach.
Scenarios are commonly developed, as much as possible, as
internally consistent storylines (Rotmans et al., 2000; Xiang
and Clarke, 2003; Shearer, 2005). Variations in a certain
policy may not be consistent with the basic ideas underlying
the scenario and conflict with the socio-economic and
political assumptions of the storyline. Therefore, the
sensitivity of the land use patterns to specific policies can
only be explored as far as such a variation is acceptable
within the overall storyline of the scenario.
An analysis of the results for the four scenarios presented
in this study reveals that land abandonment is likely to
become an important issue for land use in Europe. Many
case studies in different parts of Europe indicate that already
in the current situation land abandonment is a common
phenomenon (MacDonald et al., 2000; Eetvelde and Antrop,
2004; Kristensen et al., 2004). In the simulation results these
abandoned arable lands are classified as abandoned land or,
after some years, as natural area if active nature management
or spontaneous regrowth is assumed. However, this does not
clarify the actual use of the abandoned lands. Part of these
lands may still have some extensive agricultural functions,
as some farmers have compensated the loss of income as
result of agricultural policy reforms by additional activities
outside agriculture. Such agricultural lands may remain
under extensive forms of agriculture as result of ‘part-time’
or ‘hobby’ farming. Other abandoned lands may transform
into estates with houses for the rich or obtain recreational
functions. Another option not considered in this study is the
use of such lands for the cultivation of biofuels. Biofuel
cultivation may become an interesting option when
abundant land is available and may compete with the
conversion of abandoned agricultural lands to nature. As
indicated by other authors studying developments in
European land use (Vereijken, 2002; Rounsevell et al.,
2005), the future function of the areas that become available
due to agricultural abandonment poses an enormous
challenge to planners and policy makers to find options
that best preserve the quality and identity of the landscapes.
Scenario simulations can help to support the discussion on
this issue.
The method presented in this study can provide a crucial
link between global to national scale assessments of land use
change and the landscape level impacts. The results allow an
in-depth assessment of the consequences of the simulated
land use changes for different aspects of the landscape. The
spatial patterns of changes in natural areas make an
assessment of the consequences for biodiversity possible.
The changes in the size of continuous natural areas can
easily be determined and used in biodiversity assessments
based on the area–species curve (McIntosh, 1985; Scheiner,
2003). For agricultural biodiversity the assessments are
more complicated. Although the results do not provide
information on the actual changes in landscape structure
relevant to biodiversity, e.g. the removal or creation of
landscape elements such as hedgerows and small natural
patches in the agricultural landscape (Baudry et al., 2003),
the loss or gain of pixels classified as nature within the
agricultural areas provides an indication of the changes in
landscape pattern relevant to biodiversity assessments
(Reidsma et al., this issue). Similar assessments are possible
for a large number of other environmental and social
indicators, including greenhouse gas emissions, landscape
diversity, etc.
A major limitation of all assessments based on these data
is the lack of information on the intensity of the land use.
Currently, agricultural practices differ strongly both
between different regions in Europe and within regions.
Also in the scenarios major changes are expected in crop
productivity and farming intensity, with significantly
different developments for the different scenarios. The
transition into organic farming systems and multi-func-
tional agricultural landscapes will face varying opportu-
nities in the different scenarios. In many areas
intensification and extensification or abandonment happen
side by side (Klijn and Vos, 2000; Eetvelde and Antrop,
2004). Such changes in farming intensity have enormous
impact on the landscape and environmental issues (ground-
water pollution, etc.). In the current application changes in
crop productivity have been accounted for in the calcula-
tions with the integrated assessment model at the national
scale (van Meijl et al., this issue), but has not been included
in the spatial allocation procedure. A major constraint for
including this is the availability of high resolution data on
farming systems and production intensity. For adminis-
trative units production data are available that may give
some indication, but data on crop types and associated
livestock systems (e.g. grazing intensities) are needed for a
detailed assessment.
The scenario approach includes a range of spatial
policies that are relevant for the whole European extent.
However, in the current situation spatial policies tend to
differ by country due to the influence of national level
P.H. Verburg et al. / Agriculture, Ecosystems and Environment 114 (2006) 39–56 55
policies that, in some of the scenarios, certainly will remain
important. To some extent these policies are captured by the
country-specific specification of the driving factors.
However, for a more explicit specification detailed research
into the planning traditions of the different countries would
be needed.
The validity of the model results is an issue not addressed
in this paper. In this respect it should be noted that the
simulation results are not meant as predictions of future land
use but as projections based on the assumed scenario
conditions, or rather, as a quantified, visualization of the
qualitative scenario descriptions. However, validation could
still contribute to an assessment of the validity and
uncertainty in the downscaling procedure. Although
different versions of the CLUE model have been validated
with good results in different applications (Kok et al., 2001;
Verburg et al., 2002), the validity of a model is mainly
determined by the case study specific characteristics and the
quality of the input data. Therefore, a proper validation of
the model simulations in this study can only be based on
European land use data. This requires consistent land cover
databases for 2 years, which are hardly available for the
European extent. The new CORINE database that highlights
changes in land cover between 1990 and 2000 of the
European Environmental Agency will make such a
validation possible.
5. Conclusion
The method presented in this paper allows the down-
scaling of coarse scale land use change assessments to the
landscape level. The method results in the visualization of
the effect of the scenario conditions on land use patterns,
allows semi-quantitative analysis of effects on landscapes
and associated indicators and links continental scale
assessments with local case studies. Such a linkage
between different scales is essential, since in this type
of land use change assessments the relations between the
simulated changes and the actual processes of change are
not obvious, as is the way they cause a profound change of
the landscape character and identity. Remaining challenges
are the further downscaling of the simulated land cover
changes to the fundamental determinants of the land-
scapes, including the field size and structure, management
intensity and landscape elements. Such assessment of
landscape change trajectories could be linked to the current
downscaling procedure and complement the toolbox to
discuss the future of Europe’s landscape and spatial
planning policies.
Acknowledgement
This study has been conducted as part of the EUR-
URALIS project commissioned by the Dutch Ministry of
Agriculture, Nature and Food Quality. We would like to
thank the whole project team for their contribution to this
research.
References
Antrop, M., 2004. Landscape change and the urbanization process in
Europe. Landscape Urban Plann. 67, 9–26.
Antrop, M., 2005. Why landscapes of the past are important for the future.
Landscape Urban Plann. 70, 21–34.
Baudry, J., Burel, F., Aviron, S., Martin, M., Ouin, A., Pain, G., Thenail, C.,
2003. Temporal variability of connectivity in agricultural landscapes: do
farming activities help? Landscape Ecol. 18, 303–314.
Briassoulis, H., 2000. Analysis of land use change: theoretical and modeling
approaches. In: Loveridge, S. (Ed.), The Web Book of Regional Science.
West Virginia University, Morgantown. , http://www.rri.wvu.edu/
regscweb.htm.
Burgi, M., 1999. A case study of forest change in the Swiss lowlands.
Landscape Ecol. 14, 567–576.
Burgi, M., Hersperger, A.M., Schneeberger, N., 2004. Driving forces of
landscape change—current and new directions. Landscape Ecol. 19,
857–868.
CEC, 1985. Soil map of the European Communities. In: Commission of the
European Communities, Luxembourg, p. 124.
CEC, 1994. CORINE land cover. Technical guide. In: Office for Official
Publications of the European Communities, Luxembourg.
de Koning, G.H.J., Veldkamp, A., Fresco, L.O., 1998. Land use in Ecuador:
a statistical analysis at different aggregation levels. Agric. Ecosyst.
Environ. 70, 247–321.
Dobson, J.E., Bright, E.A., Coleman, P.R., Durfee, R.C., Worley, B.A.,
2000. A global poulation database for estimating population at risk.
Photogramm. Eng. Rem. Sens. 66, 849–857.
Eetvelde, V.v., Antrop, M., 2004. Analyzing structural and functional
changes of traditional landscapes—two examples from Southern
France. Landscape Urban Plann. 67, 79–95.
Geist, H.J., Lambin, E.F., 2004. Dynamic causal patterns of desertification.
Bioscience 54, 817–829.
Hietel, E., Waldhardt, R., Otte, A., 2004. Analysing land-cover changes in
relation to environmental variables in Hesse, Germany. Landscape Ecol.
19, 473–489.
IPCC, 2000. Special Report on Emissions Scenarios—A Special Report of
Working Group III of the Intergovernmental Panel on Climate Change.
Cambridge University Press, Cambridge, UK.
Jongman, R.H.G., 1995. Nature conservation planning in Europe: devel-
oping ecological networks. Landscape Urban Plann. 32, 169–183.
King, D., Daroussin, J., Tavernier, R., 1994. Development of a soil geo-
graphic database from the soil map of the European Communities.
CATENA 21, 37–56.
Klijn, J.A., Vos, W., 2000. From landscape ecology to landscape science. In:
Proceedings of the European congress ‘‘Landscape ecology: things to
do-proactive thoughts for the 21st century’’, organised in 1997 by the
Dutch Association for Landscape Ecology (WLO) on the occasion of its
25th anniversary, Kluwer, Dordrecht.
Kok, K., Farrow, A., Veldkamp, A., Verburg, P.H., 2001. A method and
application of multi-scale validation in spatial land use models. Agric.
Ecosyst. Environ. 85, 223–238.
Kristensen, L.S., Thenail, C., Kristensen, S.P., 2004. Landscape changes in
agrarian landscapes in the 1990s: the interaction between farmers and
the farmed landscape. A case study from Jutland, Denmark. J. Environ.
Manage. 71, 231–244.
Lambin, E.F., Geist, H.J., 2003. Regional differences in tropical deforesta-
tion. Environment 45, 22–36.
Lambin, E.F., Turner II, B.L., Geist, H.J., Agbola, S.B., Angelsen, A.,
Bruce, J.W., Coomes, O., Dirzo, R., Fischer, G., Folke, C., George, P.S.,
P.H. Verburg et al. / Agriculture, Ecosystems and Environment 114 (2006) 39–5656
Homewood, K., Imbernon, J., Leemans, R., Li, X.B., Moran, E.F.,
Mortimore, M., Ramakrishnan, P.S., Richards, J.F., Skanes, H., Stone,
G.D., Svedin, U., Veldkamp, A., Vogel, C., Xu, J.C., 2001. The causes of
land-use and land-cover change: moving beyond the myths. Global
Environ. Change 4, 261–269.
Latesteijn, H.C., 1998. A policy perspective on land use changes and risk
assessment. Agric. Ecosyst. Environ. 67, 289–297.
MacDonald, D., Crabtree, J.R., Wiesinger, G., Dax, T., Stamou, N., Fleury,
P., Gutierrez Lazpita, J., Gibon, A., 2000. Agricultural abandonment in
mountain areas of Europe: environmental consequences and policy
response. J. Environ. Manage. 59, 47–69.
McConnell, W.J., Sweeney, S.P., Mulley, B., 2004. Physical and social
access to land: spatio-temporal patterns of agricultural expansion in
Madagascar. Agric. Ecosyst. Environ. 101, 171–184.
McIntosh, R.P., 1985. The Background of Ecology. Cambridge University
Press, Cambridge, UK.
Metzger, M.J., Bunce, R.G.H., Jongman, R.G.H., Mucher, C.A., Watkins,
J.W., 2005. A climatic stratification of the environment of Europe.
Global Ecol. Biogeogr. 14, 549–563.
Moody, A., Woodcock, C.E., 1994. Scale-dependent errors in the estimation
of land-cover proportions: implications for global land-cover data sets.
Photogramm. Eng. Rem. Sens. 60, 585–594.
Mucher, C.A., Steinnocher, K.T., Kressler, F.P., Heunks, C., 2000. Land
cover characterization and change detection for environmental mon-
itoring of pan-Europe. Int. J. Rem. Sens. 21, 1159–1181.
Mucher, C.A., Hennekens, S.M., Bunce, R.G.H., Schaminee, J.H.J., 2004.
Mapping European habitats to support the design and implementation of
a Pan-European Ecological Network. The PEENHAB project. Alterra
report 952. In: Alterra, Wageningen.
Munroe, D.K., Southworth, J., Tucker, C.M., 2002. The dynamics of land-
cover change in western Honduras: exploring spatial and temporal
complexity. Agric. Econ. 27, 355–369.
Nassauer, J.I., 1995. Culture and changing landscape structure. Landscape
Ecol. 10, 229–237.
Naveh, Z., 2001. Ten major premises for a holistic conception of multi-
functional landscapes. Landscape Urban Plann. 57, 269–284.
Nelson, G.C., Harris, V., Stone, S.W., 2001. Deforestation, land use, and
property rights: empirical evidence from Darien, Panama. Land Econ.
77, 187–205.
New, M., Hulme, M., Jones, P., 1999. Representing twentieth-century space-
time climate variability. Part I: Development of a 1961–1990 mean
monthly terrestrial climatology. J. Climate 12, 829–856.
Peppler-Lisbach, C., 2003. Predictive modelling of historical and recent
land-use patterns. Phytocoenologia 33, 565–590.
Rabbinge, R., Van Latesteijn, H.C., 1992. Long-term options for land use in
the European Community. Agric. Syst. 40, 195–210.
Rabbinge, R., van Diepen, C.A., Dijsselbloem, L., Koning, G.H.J., van
Latesteijn, H.C., Woltjer, E., van Zijl, J., 1994. Ground for choices: a
scenario study on perspectives for rural areas in the European Com-
munity. In: Fresco, L.O., Stroosnijder, L., Bouma, J., van Keulen, H.
(Eds.), The Future of the Land: Mobilising and Integrating Knowledge
for Land Use Options. Wiley, New York, pp. 95–121.
Reidsma, P., Tekelenburg, T., van den Berg, M., Alkemade, R., this issue.
Impacts of land use change on biodiversity: an assessment of agricul-
tural biodiversity in the European Union. Agric. Ecosyst. Environ.
Rindfuss, R.R., Walsh, S.J., Turner II, B.L., Fox, J., Mishra, V., 2004.
Developing a science of land change: challenges and methodological
issues. PNAS 101, 13976–13981.
Rotmans, J., van Asselt, M., Anastasi, C., Greeuw, S., Mellors, J., Peters, S.,
Rothman, D., Rijkens, N., 2000. Visions for a sustainable Europe.
Futures 32, 809–831.
Rounsevell, M.D.A., Ewert, F., Reginster, I., Leemans, R., Carter, T.R.,
2005. Future scenarios of European agricultural land use: II. Projecting
changes in cropland and grassland. Agric. Ecosyst. Environ. 107, 101–
116.
Scheiner, S.M., 2003. Six types of species-area curves. Global Ecol.
Biogeogr. 12, 441–447.
Serneels, S., Lambin, E.F., 2001. Proximate causes of land use change in
Narok district Kenya: a spatial statistical model. Agric. Ecosyst.
Environ. 85, 65–81.
Shearer, A.W., 2005. Approaching scenario-based studies: three perceptions
about the future and considerations for landscape planning. Environ.
Plann. B 32, 67–87.
Stillwell, J., Scholten, H., 2001. A framework for European land use
simulation. In: Stillwell, J., Scholten, H. (Eds.), Land Use Simulation
for Europe. Kluwer Academic Publishers, Dordrecht/Boston/London,
pp. 1–11.
Tress, B., Tress, G., Decamps, H., d’Hauteserre, A.-M., 2001. Bridging
human and natural sciences in landscape research. Landscape Urban
Plann. 57, 137–141.
Turner II, B.L., Kasperson, R.E., Matson, P.A., McCarthy, J., Corell, R.W.,
Christensen, L., Eckley, N., Kasperson, J.X., Luers, A., Martello, M.L.,
Polsky, C., Pulsipher, A., Schiller, A., 2003. A framework for vulner-
ability analysis in sustainability science. In: Proceedings of the National
Academy of Sciences, 100. pp. 8074–8079.
van Meijl, H., van Rheenen, T., Tabeau, A., Eickhout, B., this issue. The
impact of different policy environments on agricultural land use in
Europe. Agric. Ecosyst. Environ.
Veldkamp, A., Zuidema, G., Fresco, L.O., 1996. A model analysis of the
terrestrial vegetation model of 2.0 for Costa Rica. Ecol. Model. 93, 263–
273.
Verburg, P.H., Chen, Y.Q., 2000. Multi-scale characterization of land-use
patterns in China. Ecosystems 3, 369–385.
Verburg, P.H., Veldkamp, A., 2004a. Projecting land use transitions at forest
fringes in the Philippines at two spatial scales. Landscape Ecol. 19, 77–
98.
Verburg, P.H., Soepboer, W., Limpiada, R., Espaldon, M.V.O., Sharifa, M.,
Veldkamp, A., 2002. Land use change modelling at the regional scale:
the CLUE-S model. Environ. Manage. 30, 391–405.
Verburg, P.H., Schot, P., Dijst, M., Veldkamp, A., 2004b. Land use change
modelling: current practice and research priorities. Geojournal 61, 309–
324.
Verburg, P.H., de Nijs, T.C.M., Ritsema van Eck, J., Visser, H., de Jong, K.,
2004c. A method to analyse neighbourhood characteristics of land use
patterns. Comput. Environ. Urban Syst. 28, 667–690.
Verburg, P.H., Veldkamp, A., Willemen, L., Overmars, K.P., Castella, J.C.,
2004d. Landscape level analysis of the spatial and temporal complexity
of land-use change. In: DeFries, R.S., Asner, G.P., Houghton, R.A.
(Eds.), Ecosyst. Land Use. Geophysical Monograph Series 153, Amer-
ican Geophysical Union, Washington D.C., pp. 217–230.
Verburg, P.H., Ritsema van Eck, J., de Nijs, T., Dijst, M.J., Schot, P., 2004e.
Determinants of land use change patterns in the Netherlands. Environ.
Plann. B 31, 125–150.
Vereijken, P.H., 2002. Transition to multifunctional land use and agricul-
ture. Neth. J. Agric. Sci. 50, 171–179.
Vos, W., Meekes, H., 1999. Trends in European cultural landscape devel-
opment: perspectives for a sustainable future. Landscape Urban Plann.
46, 3–14.
Wascher, D.M., 2004. Landscape-indicator development: steps towards a
European approach. In: Jongman, R.G.H. (Ed.), The new dimensions of
the European landscape: Frontis workshop on the future of the European
cultural landscape, Wageningen, The Netherlands, 2002-06-10/ 2002-
06-12. Springer, Dordrecht, pp. 237–252.
Wasilewski, A., Krukowski, K., 2004. Land conversion for suburban
housing: a study of urbanization around Warsaw and Olsztyn. Poland
Environ. Manage. 34, 291–303.
Westhoek, H.J., van den Berg, M., Bakkes, J.A., this issue. Scenario
development to explore the future of Europe’s rural areas. Agric.
Ecosyst. Environ.
Wimberly, M.C., Ohmann, J.L., 2004. A multi-scale assessment of human
and environmental constraints on forest land cover change on the
Oregon (USA) coast range. Landscape Ecol. 19, 631–646.
Xiang, W.-N., Clarke, K.C., 2003. The use of scenarios in land-use
planning. Environ. Plann. B 30, 885–909.