Download - ZaZa Energy - Investor Presentation

Investor PresentationDecember 31, 2013
Nasdaq: ZAZA

Investor Notices
Nasdaq: ZAZA 2
Forward‐Looking Statements. This presentation and other written or oral statements made by or on behalf of ZaZa Energy Corporation (the “Company”) contain forward‐looking statements within the meaning of Section 27A of the Securities Act of 1933 and Section 21E of the Securities Exchange Act of 1934. All statements, other than statements of historical fact, including without limitation, statements and projections regarding the Company’s future financial position, operations, performance, business strategy, returns, budgets, reserves, levels of production and costs, statements regarding future commodity prices and statements regarding the plans and objectives of the Company’s management for future operations, are forward‐looking statements. The Company’s forward looking statements are typically preceded by, followed by or include words such as “will,” “may,” “could,” “would,” “should,” “likely,” “believe,” “expect,” “anticipate,” “plan,” “estimate,” “target,” “goal,” “project,” “plan,” “intend” and similar words or expressions. The Company’s forward‐looking statements are not guarantees of future performance and are only predictions and statements of the Company’s beliefs based on assumptions that may prove to be inaccurate. Forward‐looking statements involve known, unknown or currently unforeseen risks and uncertainties that may be outside of the Company’s control and may cause the Company’s actual results and future developments to differ materially from those projected in, and contemplated by, such forward‐looking statements. Risks, uncertainties and other factors that could cause the Company’s actual results to materially differ from the expectations reflected in the Company’s forward‐looking statements include, without limitation, the Company’s registered public accounting firm expressing doubts about its ability to continue as a going concern, the Company’s ability to raise necessary capital in the future, the effect of the Company’s indebtedness on its financial health and business strategy, whether the Company’s joint venture partners elect to move forward with subsequent phases of its joint ventures, the Company’s ability to maintain or renew its existing oil and gas leases or obtain new ones and any other factors or risks listed in the reports and other filings that the Company has filed and may file with the Securities and Exchange Commission (the “SEC”). Any forward‐looking statements made by the Company in this presentation and in other written and oral statements are based only on information currently available to the Company and speak only as of the date on which they are made. The Company undertakes no obligation to update or revise any of its forward‐looking statements, whether as a result of new information, future developments or otherwise.
Market & Industry Data. The market and industry data contained in this presentation and other written or oral statements made by or on behalf of the Company are based on management’s own estimates, internal company research, surveys and studies conducted by third parties and industry and general publications, and in each case, are believed by management to be reasonable estimates. The Company has not independently verified market and industry data from third party sources. This data is subject to change and cannot always be verified with complete certainty due to limits on the availability and reliability of raw data, the voluntary nature of the data gathering process and other limitations and uncertainties inherent in any statistical survey of market or industry data. As a result, you should be aware that market and industry data set forth herein, and estimates and beliefs based on such data, may not be reliable.
Cautionary Note. The SEC permits oil and gas companies, in their filings with the SEC, to disclose only proved, probable and possible reserves that meet the SEC’s definitions for such terms (and price and cost sensitivities for such reserves), and prohibits the disclosure of resources that do not constitute such reserves. This presentation and other written or oral statements made by or on behalf of the Company may contain certain terms, such as resource potential and exploration target size, that are by their nature more speculative than estimates of proved, probable and possible reserves and accordingly are subject to substantially greater risk of being actually realized. SEC guidelines strictly prohibit the Company from including such estimates in filings with the SEC. Investors are encouraged to consider closely the disclosure in our reports and other filings that the Company has filed and may file with the SEC, all of which are available on our website at www.zazaenergy.com or by written request to ZaZa Energy Corporation, Attn. Investor Relations, 1301 McKinney Street, Suite 2800, Houston, Texas 77010.
ZaZa Energy Overview
Nasdaq: ZAZA 3
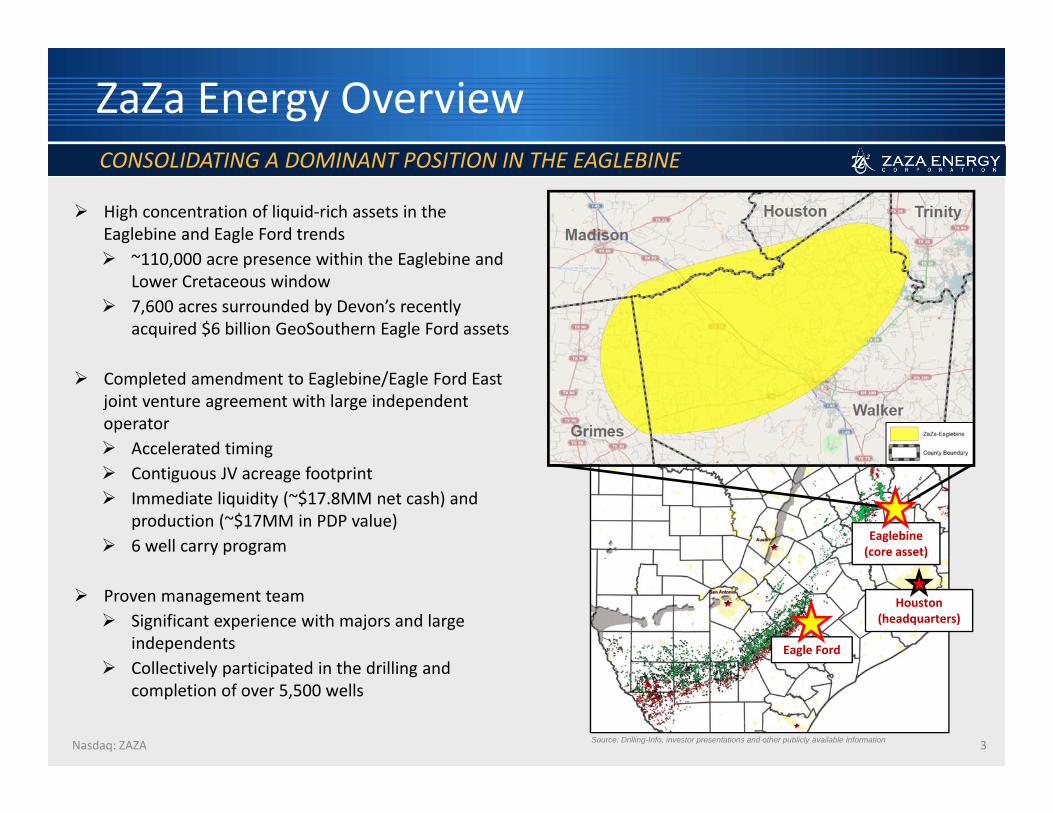
High concentration of liquid‐rich assets in the Eaglebine and Eagle Ford trends ~110,000 acre presence within the Eaglebine and
Lower Cretaceous window 7,600 acres surrounded by Devon’s recently
acquired $6 billion GeoSouthern Eagle Ford assets
Completed amendment to Eaglebine/Eagle Ford East joint venture agreement with large independent operator Accelerated timing Contiguous JV acreage footprint Immediate liquidity (~$17.8MM net cash) and
production (~$17MM in PDP value) 6 well carry program
Proven management team Significant experience with majors and large
independents Collectively participated in the drilling and
completion of over 5,500 wells
CONSOLIDATING A DOMINANT POSITION IN THE EAGLEBINE
Houston(headquarters)
Eaglebine(core asset)
Source: Drilling-Info, investor presentations and other publicly available information
Eagle Ford
Capital & Ownership Structure
Nasdaq: ZAZA 4
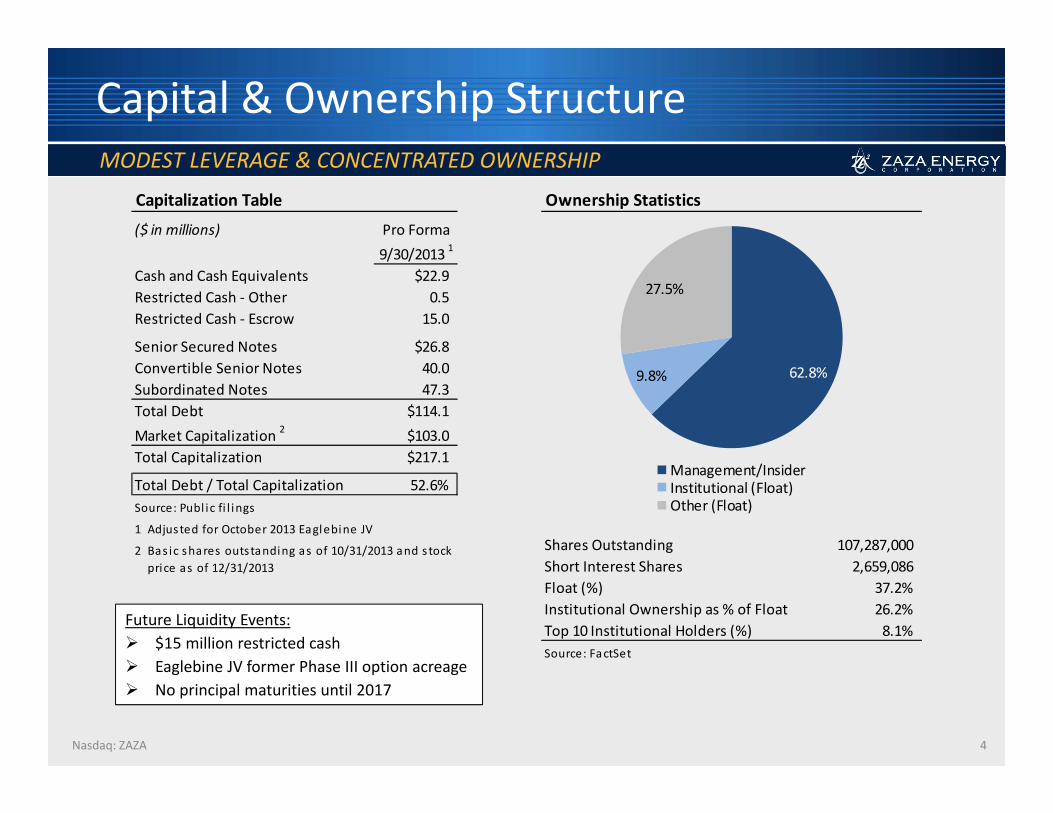
Future Liquidity Events: $15 million restricted cash Eaglebine JV former Phase III option acreage No principal maturities until 2017
MODEST LEVERAGE & CONCENTRATED OWNERSHIP
Capitalization Table
($ in millions) Pro Forma9/30/2013 1
Cash and Cash Equivalents $22.9Restricted Cash ‐ Other 0.5Restricted Cash ‐ Escrow 15.0
Senior Secured Notes $26.8Convertible Senior Notes 40.0Subordinated Notes 47.3Total Debt $114.1Market Capitalization 2 $103.0Total Capitalization $217.1
Total Debt / Total Capitalization 52.6%Source: Publ ic fi l ings
1 Adjusted for October 2013 Eaglebine JV
2 Bas ic shares outstanding as of 10/31/2013 and s tock price as of 12/31/2013
Ownership Statistics
Shares Outstanding 107,287,000Short Interest Shares 2,659,086Float (%) 37.2%Institutional Ownership as % of Float 26.2%Top 10 Institutional Holders (%) 8.1%Source: FactSet
62.8% 9.8%
27.5%
Management/InsiderInstitutional (Float)Other (Float)

Recent Milestones
Nasdaq: ZAZA 5
Secured a first mover advantage in the Eaglebine/Eagle Ford East play
Consummated joint venture agreement with a large independent operator to develop Eaglebine/Eagle Ford East acreage
Accelerated original joint venture agreement through an amendment to acquire additional production and further develop our acreage block
Entered joint venture agreement with Sabine Oil & Gas LLC, a First Reserve portfolio company, to develop Sweet Home Eagle Ford acreage
Strategically completed sale of non‐core Moulton Eagle Ford assets for approximately $38 million
Reduced senior secured notes to $26.8 million from $100 million
Drilled and completed 4 proof‐of‐concept wells during 2013
POSITIONED FOR RAPID VALUE CREATION
Quality of Core Asset – Eaglebine Overview
Nasdaq: ZAZA 6
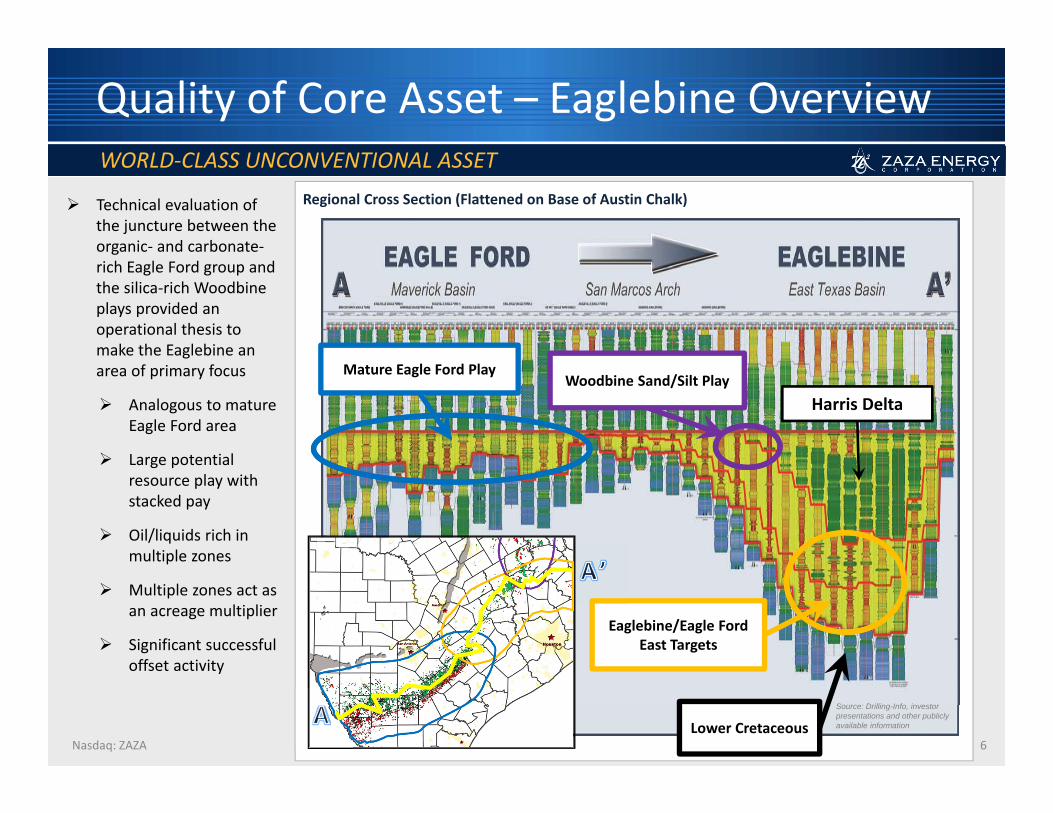
Technical evaluation of the juncture between the organic‐ and carbonate‐rich Eagle Ford group and the silica‐rich Woodbine plays provided an operational thesis to make the Eaglebine an area of primary focus
Analogous to mature Eagle Ford area
Large potential resource play with stacked pay
Oil/liquids rich in multiple zones
Multiple zones act as an acreage multiplier
Significant successful offset activity
WORLD‐CLASS UNCONVENTIONAL ASSETRegional Cross Section (Flattened on Base of Austin Chalk)
Lower Cretaceous
Woodbine Sand/Silt PlayHarris Delta
Mature Eagle Ford Play
Eaglebine/Eagle Ford East Targets
Source: Drilling-Info, investor presentations and other publicly available information

Eaglebine/Eagle Ford East Development Targets
Nasdaq: ZAZA 7
W
8300
8400
8500
8600
8700
8800
8900
9000
9100
9200
9300
9400
9500
9600
9700
9800
9900
1000
010
100
1020
010
300
1040
010
500
1060
010
700
1080
010
900
1100
011
100
1120
011
300
1140
011
500
1160
017
00
0 300GR [GAPI] (CTR)
0.2 2000RT90 [ohmm]
0.45 -0.15DPHI [%]
0.45 -0.15NPHI [CFCF]
20 20000TOTAL_GASES
1,00
0’
Austin Chalk
Eagle FordWoodbine/Harris Delta
U Eaglebine
L Eaglebine
Buda
Georgetown
Kiamichi
Edwards
PaluxyGlen Rose AGlen Rose BGlen Rose CGlen Rose DGlen Rose EGlen Rose G
Vertical Options Horizontal Options
Oil Gas
EVALUATING MULTIPLE PRODUCTIVE FORMATIONS
Data based on Burk Royalty Co. Ltd – Etheredge #1, 42‐225‐31198, Houston Co., TX
Horizontal Lower
Eaglebine17‐25
multi‐stage completion
Vertical Lower
Cretaceous (“Buda‐Rose”)Single stage or comingled 3‐5 multi‐stage (“Stack and
Frac”) completion
Key Targets

Sweet Home Overview
Nasdaq: ZAZA 8
Sabine Oil & Gas LLC (“Sabine”) and ZaZa entered into a 75/25 joint venture for the development of ZaZa’s Sweet Home prospect in the Eagle Ford trend located in the liquids window of De Witt and Lavaca Counties, Texas
Sabine carries ZaZa for two commitment wells and up to $750,000 of construction costs related to gathering and infrastructure in exchange for a 75% interest in 7,600 net acres and the Boening well. Sabine also carries up to $300,000 of ZaZa’s expenses related to the extension and renewal of certain leases
If Sabine completes the first commitment well by February 15, 2014, ZaZa will transfer to Sabine a 75% interest in approximately 3,200 net acres and the Boening well
If Sabine completes the second commitment well by April 15, 2014, ZaZa will transfer to Sabine a 75% interest in the remaining net acres (4,400)
• Assuming the initial two commitment wells are successful in achieving production, participating interests in any additional wells drilled or lease acreage acquired in the Sweet Home prospect will be shared 75% by Sabine and 25% by ZaZa under an Area of Mutual Interest (“AMI”) that will expire on September 15, 2015
Joint Venture Terms
Source: Investor presentations and other publicly available information
+200’ thick Eagle Ford pay section with >8% porosity in thickest portion of organic shale
Adjacent to and surrounded by Devon’s recently acquired $6 billion GeoSouthern Eagle Ford assets
Visible oil growth in low‐risk, repeatable play
ZaZa’s Boening well began with an initial production rate of 669 Boe/d
Sweet Home Prospect Overview
EAGLE FORD SHALE PROPERTIES
Gonzales
De Witt
LavacaJoint Venture
AMI
Legend
ZaZa Acreage
ZaZa Boening Well
ZaZa Joint Venture Carried Wells
Devon / GeoSouthern Acreage

Vision to Deliver Extraordinary Results
Nasdaq: ZAZA9
Business ModelInitial Appraisal• Regional geologic evaluation
• Depositional model, subsurface analysis, 3D seismic• Hydrocarbon system, maturity, geochemistry• Begin building subsurface model
• In‐depth data analysis• Analyze all area logs and rasters• Analyze all nearby core data if available
• Maturity/TOC/XRD, mineral composition, fracability• Detailed log correlations and custom petrophysics
Proof of Concept• Drill pilot well, take full suite of logs and core
• Mud logging, ISO‐analysis, in‐situ fluid composition• Open‐hole logging (rock properties, matrix mineralogy, clay
type, hydrocarbon saturation, stress analysis, rock mechanics)
• Core analysis• Maturity/TOC/XRD, mineral composition, fracability
• Core calibrated to petrophysics • Integration
• Detailed pilot to lateral rock properties calibration• Custom frac design and execution• Microseismic monitoring and tracer analysis
Capital Markets Access• Strengthening balance sheet• Optimizing capital structure for growth• Transact to accelerate cash flow
Approach• Identify trends
early / first mover• Low entry cost• Large contiguous
acreage blocks• Concentrated area
focus• High‐value
partnerships
• Oil‐weighted properties
• Latest technology
Results2014 Catalysts• Viable exploration
wells• Eaglebine
development moving forward
• Secure “regular‐way” financings
PROVEN BUSINESS MODEL & EXPERIENCED TEAM
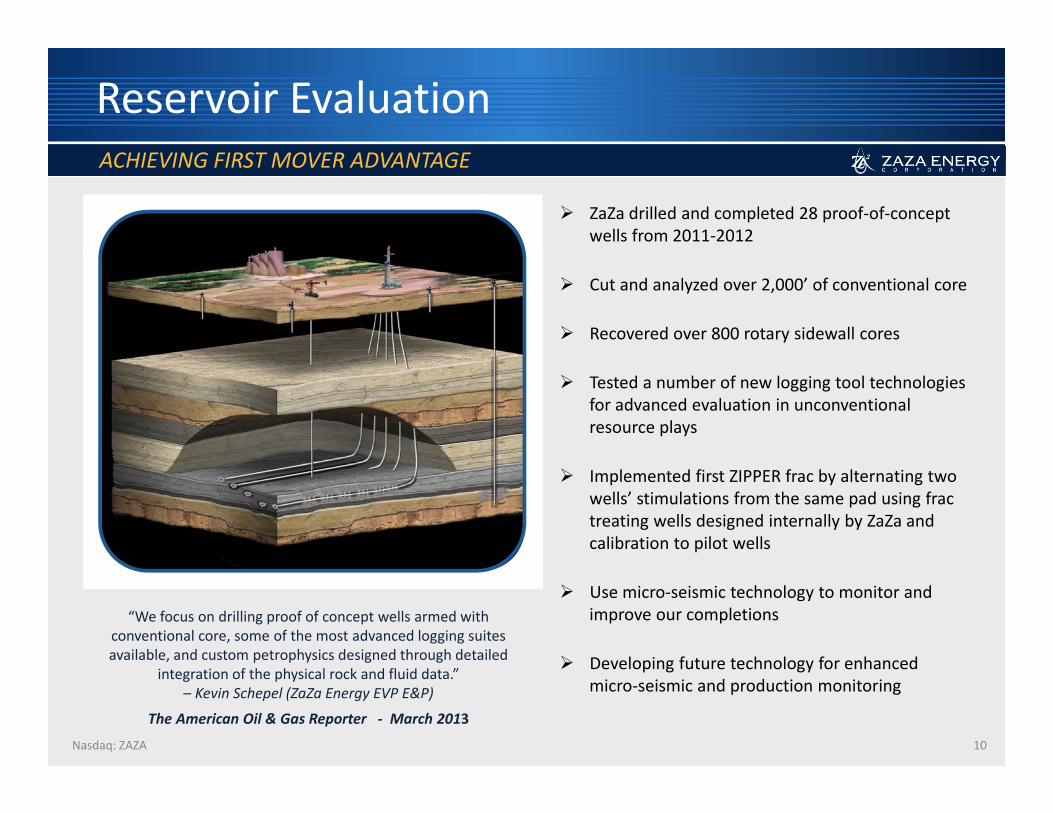
“We focus on drilling proof of concept wells armed with conventional core, some of the most advanced logging suites available, and custom petrophysics designed through detailed
integration of the physical rock and fluid data.” – Kevin Schepel (ZaZa Energy EVP E&P)
The American Oil & Gas Reporter ‐ March 2013
Reservoir EvaluationACHIEVING FIRST MOVER ADVANTAGE
ZaZa drilled and completed 28 proof‐of‐concept wells from 2011‐2012
Cut and analyzed over 2,000’ of conventional core
Recovered over 800 rotary sidewall cores
Tested a number of new logging tool technologies for advanced evaluation in unconventional resource plays
Implemented first ZIPPER frac by alternating two wells’ stimulations from the same pad using fractreating wells designed internally by ZaZa and calibration to pilot wells
Use micro‐seismic technology to monitor and improve our completions
Developing future technology for enhanced micro‐seismic and production monitoring
10Nasdaq: ZAZA

Appraisal to Proof‐of‐Concept Phase
Nasdaq: ZAZA 11
TECHNICAL CAPABILITIES
Eaglebine/Eagle FordEvaluation Process
Depositional Model Thickness, Depth, and Pressure Maturity/TOC/XRD
Core Calibrated Petrophysics Mineral Composition and “Fracability”
Integration ‐ Pilot to Lateral Microseismic MonitoringFRAC Design and Execution
Source: ZaZa

2014 Strategic Plan
Nasdaq: ZAZA 12
Eaglebine / Eagle Ford East Joint Venture
Continue to test and evaluate the play
Increase acreage and production
Obtain independent resource valuation
Other Growth Opportunities
Acquire existing production
Acquire nearby extension acreage in our expertise areas
Evaluate and assess “proof‐of‐concept” opportunities in new emerging plays
Optimized Balance Sheet & Financing Strategy
Implement tailored financing strategy to fund future growth opportunities
Pursue commodity hedging program as production base increases
Demonstrate Value Proposition to the Investment Community
ENTERING GROWTH PHASE NOW

Nasdaq: ZAZA 13
Assets
Core Asset – Eaglebine/Eagle Ford East
Nasdaq: ZAZA 14
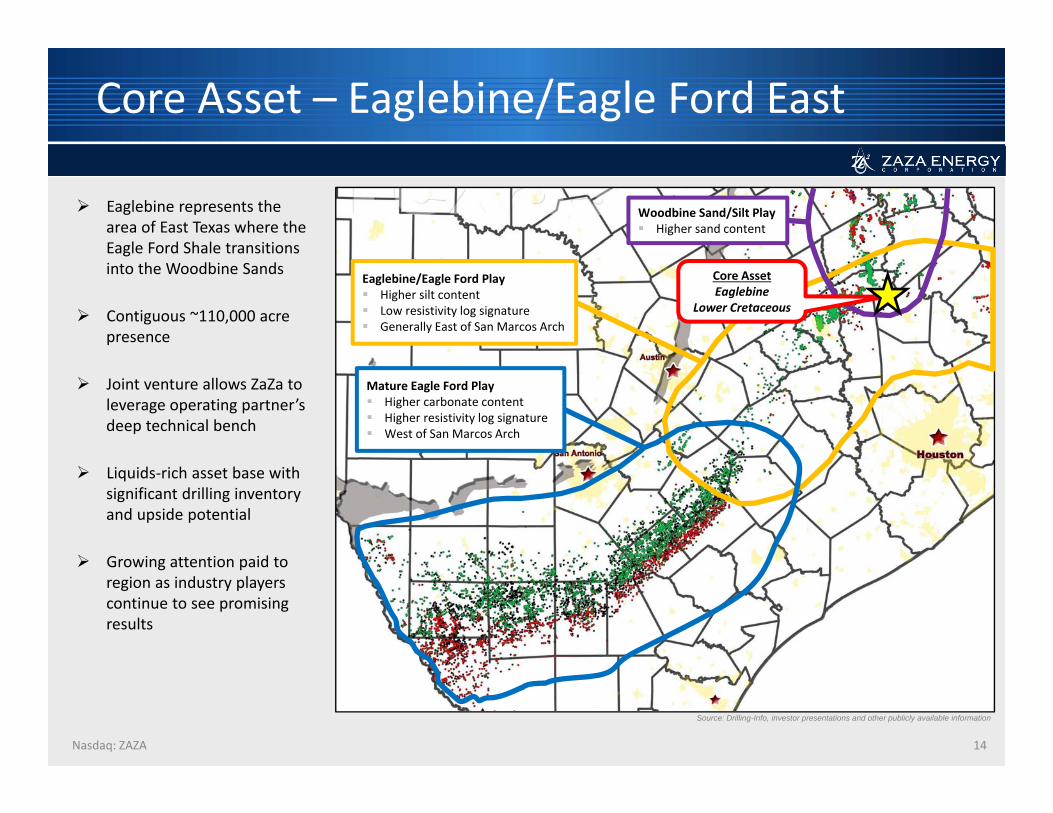
Eaglebine/Eagle Ford Play Higher silt content Low resistivity log signature Generally East of San Marcos Arch
Mature Eagle Ford Play Higher carbonate content Higher resistivity log signature West of San Marcos Arch
Woodbine Sand/Silt Play Higher sand content
Core AssetEaglebine
Lower Cretaceous
Eaglebine represents the area of East Texas where the Eagle Ford Shale transitions into the Woodbine Sands
Contiguous ~110,000 acre presence
Joint venture allows ZaZa to leverage operating partner’s deep technical bench
Liquids‐rich asset base with significant drilling inventory and upside potential
Growing attention paid to region as industry players continue to see promising results
Source: Drilling-Info, investor presentations and other publicly available information

Amended Eaglebine/Eagle Ford East JV Terms
Nasdaq: ZAZA 15
Partner has elected into Phase II ahead of original schedule ZaZa delivers ~20,000 net acres to Partner Partner pays $16.3 million cash and contributes production interests of $3 million of PDP present value in
15 wellbores located outside of the AMI Three‐well carry plus $1.25 million in miscellaneous work credit remain in place from original JV agreement
Carry for one vertical and two horizontal wells
Acceleration of Phase II
Acceleration of Phase III
Acreage and Production Exchange
ZaZa delivers ~7,800 net former Phase III acres to Partner now Partner contributes production interests of $11 million of PDP present value in the above‐referenced 15
wellbores located outside of the AMI Former Phase III Option Acreage
Partner can participate in up to ~12,000 remaining former Phase III net acres on or before January 31, 2014 for cash consideration at a fixed price per acre
Original agreement called for a Phase III election by January 31, 2015
ZaZa delivers ~13,875 net acres of its prior Retained Acreage position, including 75% and 50% interest in its Commodore and Stingray wells, respectively
ZaZa receives ~4,750 net acres and $3 million of PDP present value in AMI acreage and wells acquired by Partner
Preliminary Assumptions
To satisfy obligation of the third well under Phase I from the original agreement, ZaZa receives $1.5 million cash and $1.5 million cash value carry on vertical well(s)
Partner operates and earns in 75%; ZaZa 25% pro forma Total Eaglebine area: ~110,000 acres, ~25,000 net acres to ZaZa ~60,000 net acres delivered to Partner by ZaZa ZaZa retains ~12,000 former Phase III net acres for Partner election by January 31, 2014

Eaglebine/Eagle Ford East JV Overview
Nasdaq: ZAZA 16
ZaZa Receives ~$17.8MM Net Cash plus Production Interests in 23 Wells (~$17MM PDP PV)
PAGE NOTES: $ in millionsJV figures as of 10/21/2013
Eaglebine/Eagle Ford East JV Acreage PositionGross Acres
Delivered to JVNet Acres to
PartnerNet Acres to
ZaZaPhase I 1 36,667 20,025 6,675 Phase II 26,700 20,025 6,675 Former Phase III 10,424 7,818 2,606 Partner AMI 19,000 14,250 4,750 Retained Acreage 18,500 13,875 4,625 Sub Total 111,291 75,993 25,331
Former Phase III Option 2 12,311 9,233 3,078
Total with Former Phase III Option Election 123,602 85,226 28,409 Total without Former Phase III Option Election 111,291 75,993 37,642 NOTES:1 Gross acres include legacy Range JV acreage
2
(All acreage figures are approximate)Area
Partner can participate in up to 12,311 remaining former Phase III net acres on or before January 31, 2014 for cash consideration at a fixed price per acre
Net Cash to ZaZaPhase I 1 $1.5Phase II 16.3Total Net Cash to ZaZa $17.8NOTES:1 Initial deposit received during August 2013
Production Interests to ZaZaPDP Present
Wells ValueOutside of AMI (Phase II) 1 15 $3.0
Outside of AMI (Former Phase III) 1 15 11.0
Inside of AMI 2 8 3.0Total to ZaZa 23 $17.0NOTES:1 PDP present value based on independent reserve report
2 Well count excludes overlap with 4 of 15 wells outside of the AMI referenced from Phase II and former Phase III
Phase II Carry Value to ZaZaWorking Interest100% 25.0%
1 Vertical $6.00 $1.502 Horizontal 24.00 6.00
$30.00 $7.50
Land or Opex $1.25Total Carry Value to ZaZa 1 $8.75NOTES:1 ZaZa's internal estimate of carry value. Costs include cores and other science not expected in development wells

JV Eaglebine/Eagle Ford East Acreage
Nasdaq: ZAZA 17
~37,600 net acres to ZaZa (includes 100% remaining former Phase III acreage)
ZaZa first Eaglebine test in February 2012
Recent well IPs of 600+ Boe/d support ZaZa’s technical view
ZaZa maintains one of the most consolidated acreage holdings in the region
Since ZaZa commenced leasing, surrounding acreage values have significantly increased

Nasdaq: ZAZA 18
Why Invest in ZaZa?
Investment Thesis
Nasdaq: ZAZA 19
Poised for rapid production and reserve growth
Attractive well economics
Material position with first mover advantage in the Eaglebine/Eagle Ford East
Strong management team
COMMITTED TO MAXIMIZING SHAREHOLDER VALUE
Company Has Been Streamlined and is Strategically Positioned to Enter its Growth Phase

Recent Eaglebine/Eagle Ford East Completions
Nasdaq: ZAZA 20
DRILLING PACE INCREASING RAPIDLY
Active DrillersAnadarko EOG ResourcesApache GeosouthernBurk Royalty Halcon Cabot Navidad ResourcesCentex Energy SequiturContango Oil & Gas SM EnergyCrimson Energy Partners Treadstone EnergyDevon Weber EnergyEncana ZaZa Energy
Source: Drilling-Info, investor presentations and other publicly available information

Eaglebine/Eagle Ford East is Now Emerging
Nasdaq: ZAZA 21
Small and large E&P companies are investing significant capital, technology and expertise in the Eaglebine/Eagle Ford East play
Major Eaglebine Producers 1
(US$ in millions)
Company Market Capitalization 2
EOG Resources $45,586.8Devon Energy 24,676.7Encana Corporation 12,768.5SM Energy 5,451.5Halcon Resources 1,376.5Contango Oil & Gas 703.5Gastar Exploration 385.6ZaZa Energy Corporation $103.0NOTES:
1 Source: Publ ic fi l ings & FactSet
2 As of 12/31/2013
SIGNIFICANT INVESTMENT ACTIVITY

Illustrative Lower Eaglebine & Lower Cretaceous (Buda‐Rose) Economics
Nasdaq: ZAZA 22
ATTRACTIVE WELL ECONOMICSAssumed Type Well Economics
Lower LowerEaglebine Cretaceous
Wellhead VolumesGas (MMcf) 3,339 856Oil (MBbls) 432 107Total (Mboe) 989 250
Sales VolumesGas (MMcf) 1,821 514Oil (MBbls) 323 80NGL (MBbls) 434 34Total (Mboe) 1,060 200
Estimated Well Cost ($M) $10,000 $3,500
Operating Expenses Fixed Opex / Well / Month ($) $10,000 $10,000Variable Oil ($ / Gross Bbl) $3.00 $3.00Variable Gas ($ / Gross Mcf) 0.30 0.30G&T ($ / Net Mcf) 0.25 0.25Processing (% of NGL Revenue) 10.0% 10.0%Marketing (% of Gas and NGL Revenue) 1.0% 1.0%
PricingGas ($ / Mcf) $4.00 $4.00Oil ($ / Bbl) $95.00 $95.00Gas Differential ($ / Mcf) ($0.30) ($0.30)Oil Differential ($ / Bbl) $4.50 $4.50NGL Differential (% of WTI) 25.0% 25.0%
InterestWorking Interest (%) 100.0% 100.0%Revenue Interest (%) 74.7% 75.0%
TaxesSeverance, Oil (%) 4.6% 4.6%Severance, Gas and NGL (%) 7.5% 7.5%Ad Valorem (%) 2.5% 2.5%
Single Well IRR 37.8% 46.2%Single Well PV‐10 ($M) $7,357 $1,631Single Well Discounted ROI 1.7x 1.5x
Source: Drilling-Info, investor presentations and other publicly available information. Internal ZaZa economic forecasts.

Illustrative Lower Eaglebine Economics
Nasdaq: ZAZA 23
ATTRACTIVE WELL ECONOMICS
10
100
1,000
10,000
100,000
0 60 120 180 240 300 360 420 480 540 600Production Month
Lower Eaglebine Type Curve
Gas, MCF/Month
Oil, BO/Month
Mon
thly Rate
Lower Eaglebine Highlights Well Head Volumes – 989 Mboe Sales Volumes – 1,060 Mboe Drill & Complete – $10 million per well
Source: Drilling-Info, investor presentations and other publicly available information. Internal ZaZa economic forecasts.

Illustrative Lower Cretaceous (Buda‐Rose) Economics
Nasdaq: ZAZA 24
ATTRACTIVE WELL ECONOMICS
10
100
1,000
10,000
100,000
0 60 120 180 240 300 360Production Month
Lower Cretaceous Type Curve
Gas, MCF/Month
Oil, BO/Month
Mon
thly Rate
Lower Cretaceous Highlights Vertical, comingled play Well Head Volumes – 250 Mboe Sales Volumes – 200 Mboe Drill & Complete – $3.5 million per well
Source: Drilling-Info, investor presentations and other publicly available information. Internal ZaZa economic forecasts.

Eaglebine Acreage by Operator
Eaglebine/Eagle Ford East Competitive Landscape
25Nasdaq: ZAZA
MATERIAL POSITION
Source: Company investor presentations and other publicly available information.
1st mover leasing strategy tied up large tracts early making it difficult for competitors to gain a foothold Acreage block is large, contiguous, and strategic As position is developed, expected to bring a premium valuation

Proven Management Team
Nasdaq: ZAZA 26
Todd Brooks (Founder, Executive Director, President &
CEO)
Founded ZaZa Energy, LLC in 2009. Led company into multiple scaled drilling and development JVs in the Eagle Ford and Eaglebine. Took ZaZa public via reverse merger in early 2012
Principal of Neuhaus Brooks Investments of Texas, LLC, a company making strategic energy investments across multiple geographic regions
Experienced land man, E&P investor and entrepreneur B.A. in Economics from Vanderbilt University; J.D. from South Texas College of Law
Ian Fay(CFO)
Founding Partner at Odin Advisors LLC Served as Head of the Energy & Natural Resources Group | Americas at BNP Paribas Worked as Managing Director for RBC Capital Markets and Director of M&A for UBS Investment Bank B.A. in English from the University of North Carolina at Chapel Hill and Morehead‐Cain scholar
Kevin Schepel(EVP Exploration and
Production)
Executive Vice President of Exploration and Production since June 2010 Served as Vice President of Worldwide Exploitation for Pioneer Natural Resources, Chief
Petrophysicist for BHP Petroleum and 15 years as an advanced Geoscientist at Exxon B.S. from Michigan State University; Licensed by the Texas Board of Professional Geoscientists
Thomas Bowman(EVP Evaluation, Geology and Geophysics)
Served in various roles such as Evaluation Manager and Exploration Advisor at Aspect Abundant Shale, Bass Enterprises, Fina Oil and Chemical and Tenneco Oil Co.
Industry‐recognized specialist in identification of resource plays and the utilization of geophysical advancements; involved in the completion of over 1,000 horizontal resource wells across a majority of US shale plays
B.S. from Montana College of Mineral Science and Technology; Licensed by the Texas Board of Professional Geoscientists
SIGNIFICANT EXPERIENCE
Nasdaq: ZAZA 27
Appendix

Pro Forma Financial Summary
Nasdaq: ZAZA 28
Capitalization Table
($ in millions)Actual Eaglebine Pro Forma
9/30/2013 Joint Venture 9/30/2013Cash and Cash Equivalents $6.6 $16.3 $22.9Restricted Cash ‐ Other 0.5 0.5Restricted Cash ‐ Escrow 15.0 15.0
Senior Secured Notes $26.8 $26.8Convertible Senior Notes 40.0 40.0Subordinated Notes 47.3 47.3Total Debt $114.1 $114.1
Market Capitalization $103.0 $103.0Total Capitalization $217.1 $217.1
Total Debt / Total Capitalization 52.6% 52.6%Source: Publ ic fi l ings
NOTES:
1 Bas ic shares outstanding as of 10/31/2013 and stock price as of 12/31/2013

Marketing Advantage
Nasdaq: ZAZA 29
Light Louisiana Sweet crude pricing offers premium relative to WTI (~$4.50 per Bbl)
Gas prices benefit from favorable BTU/GPM content and proximity to Houston‐area markets
Quality infrastructure in place with available takeaway capacity
Eaglebine Midstream Map
Atmos

Eagle Ford – Eaglebine Trend
Nasdaq: ZAZA 30
Shale play trends across Texas from the Mexican border up into East Texas, roughly 50 miles wide and 400 miles long with an average thickness of 250’
It is Cretaceous in age resting between the Austin Chalk and the Buda Lime at a depth of approximately 4,000’ to 12,000’. The down‐dip limits are currently defined by the Sligo shelf edge
Producing over 617,884 Boe/d (as of June 2013)
Key Points

Upper Cretaceous Shales ‐ Transition of Play Types
Nasdaq: ZAZA 31
Eagle Ford
Eagle Ford Group
Boquillas
Woodbine Group Woodbine Group
Tuscaloosa Group
EaglebineTuscaloosa Marine
200 miles
322 Kilometers
Source: Drilling-Info, investor presentations and other publicly available information
Lateral equivalents of Upper Cretaceous shale across the southern Gulf Coast of the United States; in outcrop and in sub‐surface. Local names include the Lewisville, Dexter,
Maness, Pepper Shales, and Raritan

Eagle Ford and Eaglebine Areas Offer Multiple Stacked Targets
Nasdaq: ZAZA 32
Regional Cross Section (Flattened on Base of Austin Chalk)
Lower Cretaceous
Woodbine Sand/Silt PlayHarris Delta
Mature Eagle Ford Play
Eaglebine /Eagle Ford East Targets
Woodbine sand/silt horizontal play kicked off activity in the Eaglebine in 2009
Lower Eaglebine target is a ~250’ thick “hot” shale across ZaZa’s leasehold and has recently become a main target
Analogous to mature Eagle Ford area
Upper Eaglebine target is ~250’ thick shale/sand/silt across ZaZa’s leasehold and is between the Harris Delta sand and Lower Eaglebine
Has some similarity to the Woodbine sand/silt play
Potential upside from Lower Cretaceous section
Kiamichi and Paluxy are “hot” shale targets across leasehold
Additional targets include Buda/Georgetown, Edwards, and Glen Rose
Eaglebine / Eagle Ford East Area
Source: Drilling-Info, investor presentations and other publicly available information

XRD Comparison of Shales
33
Analysis of Eaglebine vertical sections in several historical wells
Good TOC concentrations throughout section: 2% ‐ 9%
Good silica concentrations (Quartz): 30% ‐ 60%
Low expanding clay concentrations mostly illite
Key Points
Nasdaq: ZAZA
Source: ZaZa
Eagle Ford Core
Tuscaloosa Marine Shale
Eaglebine / Eagle Ford East
Quartz
Geologic Comparison of Shales
Nasdaq: ZAZA 34
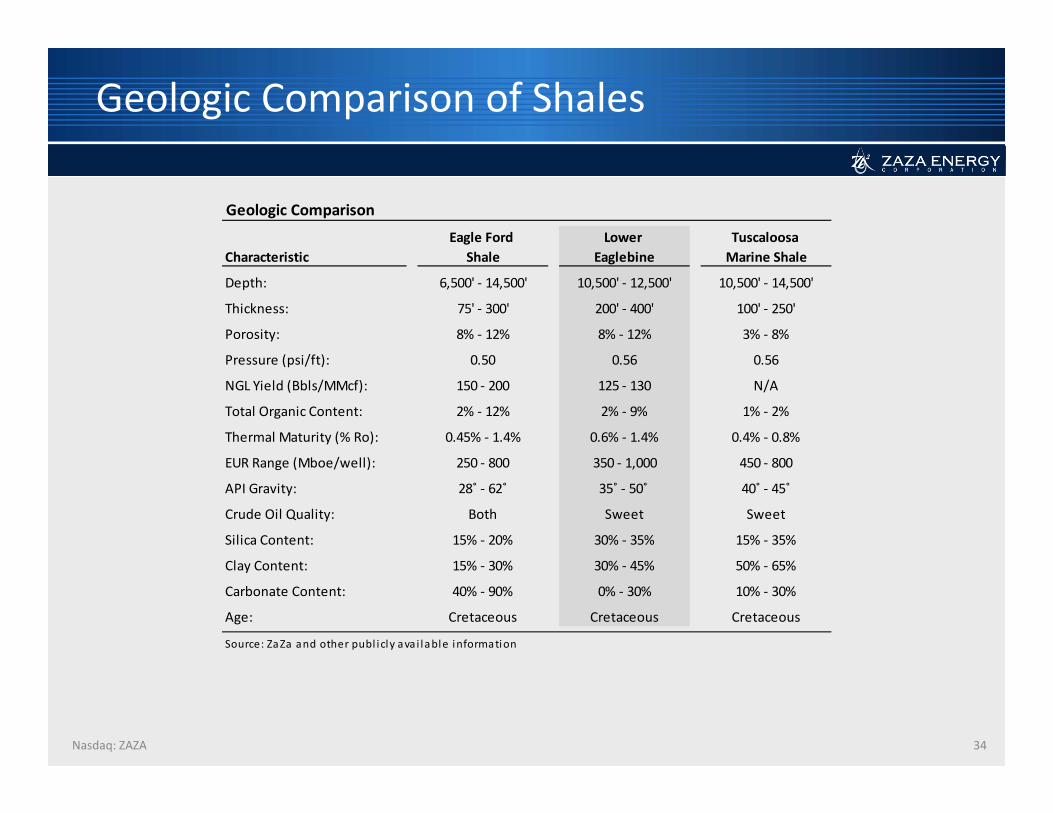
Geologic Comparison
Eagle Ford Lower Tuscaloosa Characteristic Shale Eaglebine Marine Shale
Depth: 6,500' ‐ 14,500' 10,500' ‐ 12,500' 10,500' ‐ 14,500'
Thickness: 75' ‐ 300' 200' ‐ 400' 100' ‐ 250'
Porosity: 8% ‐ 12% 8% ‐ 12% 3% ‐ 8%
Pressure (psi/ft): 0.50 0.56 0.56
NGL Yield (Bbls/MMcf): 150 ‐ 200 125 ‐ 130 N/A
Total Organic Content: 2% ‐ 12% 2% ‐ 9% 1% ‐ 2%
Thermal Maturity (% Ro): 0.45% ‐ 1.4% 0.6% ‐ 1.4% 0.4% ‐ 0.8%
EUR Range (Mboe/well): 250 ‐ 800 350 ‐ 1,000 450 ‐ 800
API Gravity: 28˚ ‐ 62˚ 35˚ ‐ 50˚ 40˚ ‐ 45˚
Crude Oil Quality: Both Sweet Sweet
Silica Content: 15% ‐ 20% 30% ‐ 35% 15% ‐ 35%
Clay Content: 15% ‐ 30% 30% ‐ 45% 50% ‐ 65%
Carbonate Content: 40% ‐ 90% 0% ‐ 30% 10% ‐ 30%
Age: Cretaceous Cretaceous Cretaceous
Source: ZaZa and other publ icly avai lable information
Nasdaq: ZAZA 35
ZaZa Energy Corporation


