
1
Yum Cha 飲 茶 May 11, 2016
Source: Bloomberg
INDICES Closing DoD%
Hang Seng Index 20,242.7 0.4
HSCEI 8,486.2 0.4
Shanghai COMP 2,832.6 0.02
Shenzhen COMP 1,802.3 (0.1)
Gold 1,265.8 0.2
BDIY 594.0 (3.6)
Crude Oil, WTI(US$/BBL) 44.7 2.8
Crude Oil, BRENT(US$/BBL) 45.5 4.3
HIBOR, 3-M 0.5 0.3
SHIBOR, 3-M 2.9 -
RMB/USD 6.5 0.1
TALKING POINT: CSRC to Restrict Local Backdoor Listings
Last Friday, the China Securities Regulatory Commission (CSRC) said it is studying the
impact of the delisting of some overseas-listed Chinese companies and their possible
return to the A-share market. According to news flow, the CSRC is considering possible
restrictions on reverse mergers and backdoor listings, such as: a) a cap on valuation mul-
tiples for deals involving companies that previously traded overseas, and b) a quota on
the number of reverse mergers each year. The restrictions are to avoid: a) instability trig-
gered by overly high valuations for the companies involved, and b) capital flows which put
pressure on the RMB. The CSRC has held talks with investment banks and other market
participants to gauge their views on the potential curbs. Shares of US-traded Chinese
companies such as YY Inc., Momo Inc. and Qihoo 360, which have already announced
privation plans, are under heavy selling pressure. As discussed earlier, some proposed
privatizations in Hong Kong, such as Wanda Commercial [3699.HK], may face much high-
er policy risks. There has been speculation that Evergrande Real Estate Group Ltd.
[3333.HK] may return to A-share market through a back-door listing; this is now less cer-
tain.
DATA RELEASES DUE THIS WEEK
May 07/12 Foreign Direct Investment YoY CNY
Analyst: Mark Po, CFA
Huaneng Renewables Corporation [0958.HK; HK$3.80;BUY] - HNR’s total power
generation in April jumped 32.4% YoY to 2,044GWh, with wind power generation
surging 32.6% YoY to 1,954GWh and solar power generation increasing 29.1% YoY
to 90GWh. We estimate wind utilization increased ~2.6% YoY in April, which was
much better than the 11% decline reported by China Longyuan [0916 HK; BUY]. We
continue to like HNR because of its fast-growing power generation on the back of its
strong execution, better-than-peers regional mix and lower grid-curtailment rate.
HNR is trading at below 9x 2016E PER, which we believe has yet to reflect the fast
earnings growth. Reiterate BUY with a DCF-based TP of HK$3.80 (unchanged).
Daqo New Energy [DQ.US; US$25.06; Not rated] – Q1 2016 results in line with expectations; Positive management guidance for Q2 2016
RESEARCH NOTES

2
Huaneng Renewables Corporation [0958.HK]
HNR’s total power generation in April jumped 32.4% YoY to 2,044GWh, with wind
power generation surging 32.6% YoY to 1,954GWh and solar power generation in-
creasing 29.1% YoY to 90GWh. We estimate wind utilization increased ~2.6% YoY in
April, which was much better than the 11% decline reported by China Longyuan
[0916 HK; BUY]. We continue to like HNR because of its fast-growing power genera-
tion on the back of its strong execution, better-than-peers regional mix and lower grid-
curtailment rate. HNR is trading at below 9x 2016E PER, which we believe has yet to
reflect the fast earnings growth. Reiterate BUY with a DCF-based TP of HK$3.80
(unchanged).
Strong performance in April. HNR’s wind-utilization hours growth (+2.6% YoY)
was consistent with the 2.9% increase in average wind speed in China based on
our check. While we estimate Inner Mongolia reported a 14% YoY decline in utili-
zation hours, this weakness was more than offset by the strong performance in
Liaoning, Yunnan and Shanxi. The wind power generation growth of 32.6% YoY
in April was an acceleration from the 20% reported in March.
Total power generation +30% YoY to 6,646GWh in 4M16. Of this, wind and
solar power generation increased 30% and 23% YoY, respectively. In 4M16, total
power generation accounted for 35.8% of our full-year estimate, compared to
34.9% of full-year output in 4M15.
Risks: (1) capacity ramp-up risk; (2) unexpected decline in wind speed; (3) high
gearing; (4) delay in power transmission line construction; (5) potential fund-
raising exercise.
Wayne Fung, CFA—Analyst
(852) 3698-6319
Wong Chi Man, CFA—Head of Research
(852) 3698-6317
Wind Power Sector Total power generation in April +32%, outpacing peers
BUY
(Unchanged)
Close: HK$2.24 (May 10, 2016)
Target Price: HK$3.80 (+70%)
Share Price Performance
Market Cap US$2,807m
Shares Outstanding 9,728m
Auditor KPMG
Free Float 43%
52W range HK$1.39-3.80
3M average daily T/O US$5.8m
Major Shareholding Huaneng Group
(56.9%)
May 11, 2016
Key Financials (RMB m) 2013 2014 2015 2016E 2017E
Revenue 5,798 6,151 7,357 9,209 10,876
Change (YoY) 44% 6% 20% 25% 18%
Other income 79 168 435 253 305
Adjusted EBIT 2,649 3,178 3,681 4,622 5,437
Change (YoY) 34% 20% 16% 26% 18%
Recurring net profit 971 1,041 1,499 2,082 2,474
Change (YoY) 114% 7% 44% 39% 19%
Recurring EPS 0.113 0.115 0.154 0.214 0.254
Change (YoY) 112% 2% 34% 39% 19%
PER (x) 15.8 15.7 12.3 8.9 7.5
Dividend yield 1.2% 1.2% 1.6% 2.3% 2.7%
PBR (x) 1.2 1.1 1.0 0.9 0.9
EV/EBITDA (x) 13.4 11.1 9.1 7.6 6.4
Net debt/equity 182% 215% 241% 250% 250%
ROE 7.6% 7.0% 8.8% 11.1% 12.0%
Source: Company, CGIS Research estimates

3
Figure 1: HNR monthly power generation
Sources: Company, CGIS Research
Power generation (GWh) Jan-15 Feb-15 Mar-15 Apr-15 Jan-16 Feb-16 Mar-16 Apr-16
Wind power
Inner Mongolia 193 167 288 346 323 297 373 414
Liaoning 126 65 213 265 140 89 234 331
Shandong 153 119 185 220 173 129 180 189
Yunnan 166 199 248 218 278 235 343 319
Shanxi 135 105 150 87 129 94 130 137
Hebei 53 36 80 71 62 34 73 87
Guizhou 69 81 103 104 124 68 121 118
Guangdong 61 48 64 55 86 88 86 74
Xinjiang 33 21 38 37 19 17 47 99
Shanghai 8 8 7 11 22 23 20 16
Jilin 9 7 22 25 14 11 19 50
Shaanxi 6 10 9 9 8 13 12 11
Sichuan 34 37 45 26 106 51 106 102
Zhejiang 0 0 0 0 4 5 5 7
Wind total 1,046 904 1,452 1,474 1,486 1,155 1,749 1,954
Solar power
Solar total 54 55 67 70 65 63 84 90
Total 1,100 959 1,519 1,544 1,551 1,218 1,833 2,044
(Change YoY) Jan-15 Feb-15 Mar-15 Apr-15 Jan-16 Feb-16 Mar-16 Apr-16
Wind power
Inner Mongolia - - - - 67% 77% 30% 20%
Liaoning - - - - 11% 38% 10% 25%
Shandong - - - - 13% 8% -2% -14%
Yunnan - - - - 67% 18% 38% 46%
Shanxi - - - - -4% -11% -13% 57%
Hebei - - - - 16% -7% -9% 22%
Guizhou - - - - 78% -16% 18% 13%
Guangdong - - - - 40% 84% 34% 35%
Xinjiang - - - - -43% -16% 21% 167%
Shanghai - - - - 165% 199% 208% 41%
Jilin - - - - 48% 51% -15% 102%
Shaanxi - - - - 39% 30% 29% 24%
Sichuan - - - - 216% 37% 136% 301%
Zhejiang - - - - n/a n/a n/a n/a
Wind average - - - - 42% 28% 20% 33%
Solar power
Solar average - - - - 20% 16% 26% 29%
Average - - - - 41% 27% 21% 32%
4
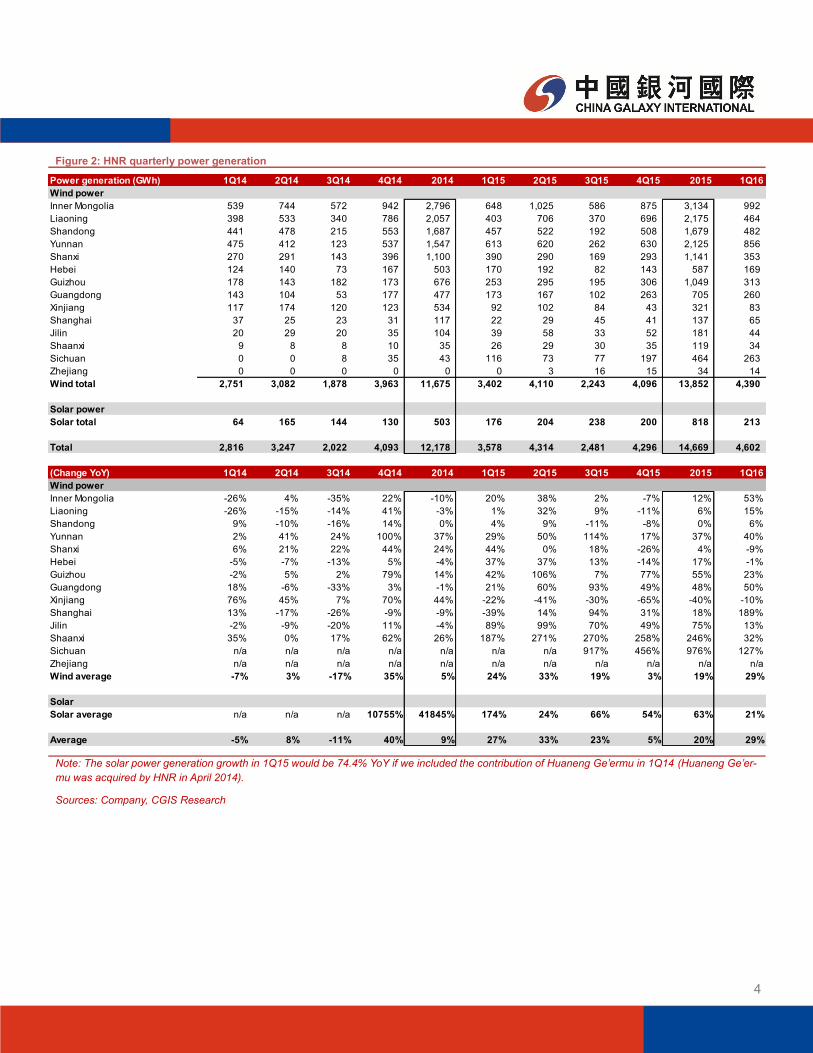
Figure 2: HNR quarterly power generation
Note: The solar power generation growth in 1Q15 would be 74.4% YoY if we included the contribution of Huaneng Ge’ermu in 1Q14 (Huaneng Ge’er-
mu was acquired by HNR in April 2014).
Sources: Company, CGIS Research
Power generation (GWh) 1Q14 2Q14 3Q14 4Q14 2014 1Q15 2Q15 3Q15 4Q15 2015 1Q16
Wind power
Inner Mongolia 539 744 572 942 2,796 648 1,025 586 875 3,134 992
Liaoning 398 533 340 786 2,057 403 706 370 696 2,175 464
Shandong 441 478 215 553 1,687 457 522 192 508 1,679 482
Yunnan 475 412 123 537 1,547 613 620 262 630 2,125 856
Shanxi 270 291 143 396 1,100 390 290 169 293 1,141 353
Hebei 124 140 73 167 503 170 192 82 143 587 169
Guizhou 178 143 182 173 676 253 295 195 306 1,049 313
Guangdong 143 104 53 177 477 173 167 102 263 705 260
Xinjiang 117 174 120 123 534 92 102 84 43 321 83
Shanghai 37 25 23 31 117 22 29 45 41 137 65
Jilin 20 29 20 35 104 39 58 33 52 181 44
Shaanxi 9 8 8 10 35 26 29 30 35 119 34
Sichuan 0 0 8 35 43 116 73 77 197 464 263
Zhejiang 0 0 0 0 0 0 3 16 15 34 14
Wind total 2,751 3,082 1,878 3,963 11,675 3,402 4,110 2,243 4,096 13,852 4,390
Solar power
Solar total 64 165 144 130 503 176 204 238 200 818 213
Total 2,816 3,247 2,022 4,093 12,178 3,578 4,314 2,481 4,296 14,669 4,602
(Change YoY) 1Q14 2Q14 3Q14 4Q14 2014 1Q15 2Q15 3Q15 4Q15 2015 1Q16
Wind power
Inner Mongolia -26% 4% -35% 22% -10% 20% 38% 2% -7% 12% 53%
Liaoning -26% -15% -14% 41% -3% 1% 32% 9% -11% 6% 15%
Shandong 9% -10% -16% 14% 0% 4% 9% -11% -8% 0% 6%
Yunnan 2% 41% 24% 100% 37% 29% 50% 114% 17% 37% 40%
Shanxi 6% 21% 22% 44% 24% 44% 0% 18% -26% 4% -9%
Hebei -5% -7% -13% 5% -4% 37% 37% 13% -14% 17% -1%
Guizhou -2% 5% 2% 79% 14% 42% 106% 7% 77% 55% 23%
Guangdong 18% -6% -33% 3% -1% 21% 60% 93% 49% 48% 50%
Xinjiang 76% 45% 7% 70% 44% -22% -41% -30% -65% -40% -10%
Shanghai 13% -17% -26% -9% -9% -39% 14% 94% 31% 18% 189%
Jilin -2% -9% -20% 11% -4% 89% 99% 70% 49% 75% 13%
Shaanxi 35% 0% 17% 62% 26% 187% 271% 270% 258% 246% 32%
Sichuan n/a n/a n/a n/a n/a n/a n/a 917% 456% 976% 127%
Zhejiang n/a n/a n/a n/a n/a n/a n/a n/a n/a n/a n/a
Wind average -7% 3% -17% 35% 5% 24% 33% 19% 3% 19% 29%
Solar
Solar average n/a n/a n/a 10755% 41845% 174% 24% 66% 54% 63% 21%
Average -5% 8% -11% 40% 9% 27% 33% 23% 5% 20% 29%

5
Figure 3: Key assumptions for HNR
Sources: Company, CGIS Research estimates
Key Assumptions 2007 2008 2009 2010 2011 2012 2013 2014 2015 2016E 2017E
Wind power
Capacity installed (MW)
Consolidated 129 402 1,550 3,523 4,904 5,457 6,221 7,527 9,721 11,021 12,321
Change YoY - 211.1% 285.2% 127.3% 39.2% 11.3% 14.0% 21.0% 29.2% 13.4% 11.8%
Annual addition - 273 1,148 1,973 1,382 553 764 1,306 2,194 1,300 1,300
Average 76 201 784 1,696 3,488 4,736 5,491 6,227 7,375 9,260 10,651
Change YoY - 164.7% 289.8% 116.4% 105.6% 35.8% 15.9% 13.4% 18.4% 25.6% 15.0%
Consolidated power generation (Gwh)
Gross 178 477 1,885 3,789 6,844 8,402 11,142 11,675 13,852 17,561 20,677
Change YoY - 168.4% 294.7% 101.1% 80.6% 22.8% 32.6% 4.8% 18.6% 26.8% 17.7%
Net 154 427 1,607 3,405 6,204 7,790 10,719 11,207 13,159 16,858 19,850
Change YoY - 178.4% 275.9% 111.9% 82.2% 25.6% 37.6% 4.6% 17.4% 28.1% 17.7%
Average utilization hours 2,334 2,380 2,365 2,265 1,962 1,774 2,029 1,875 1,878 1,896 1,941
Change YoY - 2.0% -0.6% -4.2% -13.4% -9.6% 14.4% -7.6% 0.2% 1.0% 2.4%
Weighted average on-grid tariff (RMB/kwh, Incl-VAT) 0.698 0.680 0.617 0.604 0.596 0.605 0.594 0.598 0.596 0.585 0.587
Weighted average on-grid tariff (RMB/kwh, ex-VAT) 0.597 0.581 0.527 0.516 0.509 0.517 0.507 0.511 0.509 0.500 0.502
Change YoY - -2.7% -9.3% -2.0% -1.4% 1.4% -1.8% 0.7% -0.3% -1.9% 0.4%
Solar power
Capacity installed (MW)
Consolidated - - - - - - 330 485 625 725 825
Change YoY - - - - - - - 47.0% 28.9% 16.0% 13.8%
Annual addition - - - - - - 330 155 140 100 100
Average - 354 514 620 725
Change YoY - - - - - - - - 45.2% 20.7% 16.9%
Consolidated power generation (Gwh)
Gross - - - - - - 1 503 818 961 1,124
Change YoY - - - - - - - 41845% 63% 18% 17%
Net - - - - - - 1 452 777 923 1,079
Change YoY - - - - - - - 37602% 71.9% 18.8% 16.9%
Average utilization hours - - - - - - - 1,420 1,591 1,550 1,550
Change YoY - - - - - - - - 12.0% -2.6% 0.0%
Weighted average on-grid tariff (RMB/kwh, Incl-VAT) - - - - - - - 1.00 1.00 1.00 0.99
Weighted average on-grid tariff (RMB/kwh, ex-VAT) - - - - - - - 0.85 0.85 0.85 0.85
Change YoY - - - - - - - - 0.0% -0.4% -0.4%
6
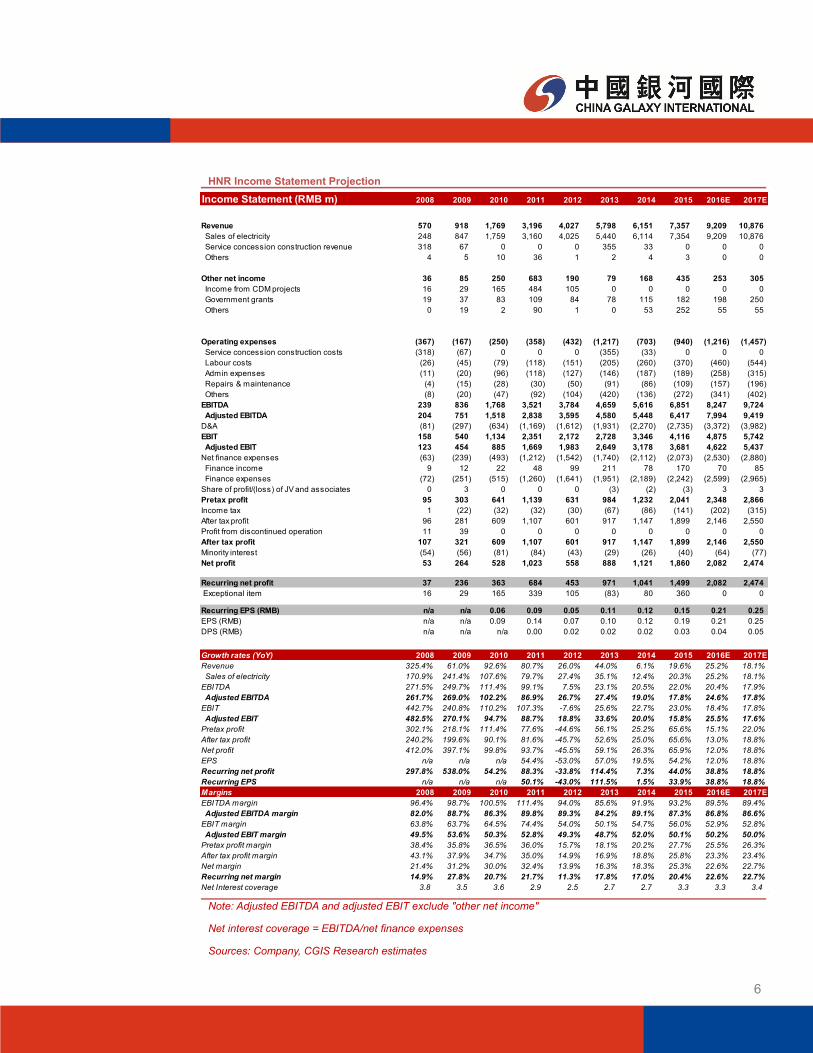
HNR Income Statement Projection
Note: Adjusted EBITDA and adjusted EBIT exclude "other net income"
Net interest coverage = EBITDA/net finance expenses
Sources: Company, CGIS Research estimates
Income Statement (RMB m) 2008 2009 2010 2011 2012 2013 2014 2015 2016E 2017E
Revenue 570 918 1,769 3,196 4,027 5,798 6,151 7,357 9,209 10,876
Sales of electricity 248 847 1,759 3,160 4,025 5,440 6,114 7,354 9,209 10,876
Service concession construction revenue 318 67 0 0 0 355 33 0 0 0
Others 4 5 10 36 1 2 4 3 0 0
Other net income 36 85 250 683 190 79 168 435 253 305
Income from CDM projects 16 29 165 484 105 0 0 0 0 0
Government grants 19 37 83 109 84 78 115 182 198 250
Others 0 19 2 90 1 0 53 252 55 55
Operating expenses (367) (167) (250) (358) (432) (1,217) (703) (940) (1,216) (1,457)
Service concession construction costs (318) (67) 0 0 0 (355) (33) 0 0 0
Labour costs (26) (45) (79) (118) (151) (205) (260) (370) (460) (544)
Admin expenses (11) (20) (96) (118) (127) (146) (187) (189) (258) (315)
Repairs & maintenance (4) (15) (28) (30) (50) (91) (86) (109) (157) (196)
Others (8) (20) (47) (92) (104) (420) (136) (272) (341) (402)
EBITDA 239 836 1,768 3,521 3,784 4,659 5,616 6,851 8,247 9,724
Adjusted EBITDA 204 751 1,518 2,838 3,595 4,580 5,448 6,417 7,994 9,419
D&A (81) (297) (634) (1,169) (1,612) (1,931) (2,270) (2,735) (3,372) (3,982)
EBIT 158 540 1,134 2,351 2,172 2,728 3,346 4,116 4,875 5,742
Adjusted EBIT 123 454 885 1,669 1,983 2,649 3,178 3,681 4,622 5,437
Net finance expenses (63) (239) (493) (1,212) (1,542) (1,740) (2,112) (2,073) (2,530) (2,880)
Finance income 9 12 22 48 99 211 78 170 70 85
Finance expenses (72) (251) (515) (1,260) (1,641) (1,951) (2,189) (2,242) (2,599) (2,965)
Share of profit/(loss) of JV and associates 0 3 0 0 0 (3) (2) (3) 3 3
Pretax profit 95 303 641 1,139 631 984 1,232 2,041 2,348 2,866
Income tax 1 (22) (32) (32) (30) (67) (86) (141) (202) (315)
After tax profit 96 281 609 1,107 601 917 1,147 1,899 2,146 2,550
Profit from discontinued operation 11 39 0 0 0 0 0 0 0 0
After tax profit 107 321 609 1,107 601 917 1,147 1,899 2,146 2,550
Minority interest (54) (56) (81) (84) (43) (29) (26) (40) (64) (77)
Net profit 53 264 528 1,023 558 888 1,121 1,860 2,082 2,474
Recurring net profit 37 236 363 684 453 971 1,041 1,499 2,082 2,474
Exceptional item 16 29 165 339 105 (83) 80 360 0 0
Recurring EPS (RMB) n/a n/a 0.06 0.09 0.05 0.11 0.12 0.15 0.21 0.25
EPS (RMB) n/a n/a 0.09 0.14 0.07 0.10 0.12 0.19 0.21 0.25
DPS (RMB) n/a n/a n/a 0.00 0.02 0.02 0.02 0.03 0.04 0.05
Growth rates (YoY) 2008 2009 2010 2011 2012 2013 2014 2015 2016E 2017E
Revenue 325.4% 61.0% 92.6% 80.7% 26.0% 44.0% 6.1% 19.6% 25.2% 18.1%
Sales of electricity 170.9% 241.4% 107.6% 79.7% 27.4% 35.1% 12.4% 20.3% 25.2% 18.1%
EBITDA 271.5% 249.7% 111.4% 99.1% 7.5% 23.1% 20.5% 22.0% 20.4% 17.9%
Adjusted EBITDA 261.7% 269.0% 102.2% 86.9% 26.7% 27.4% 19.0% 17.8% 24.6% 17.8%
EBIT 442.7% 240.8% 110.2% 107.3% -7.6% 25.6% 22.7% 23.0% 18.4% 17.8%
Adjusted EBIT 482.5% 270.1% 94.7% 88.7% 18.8% 33.6% 20.0% 15.8% 25.5% 17.6%
Pretax profit 302.1% 218.1% 111.4% 77.6% -44.6% 56.1% 25.2% 65.6% 15.1% 22.0%
After tax profit 240.2% 199.6% 90.1% 81.6% -45.7% 52.6% 25.0% 65.6% 13.0% 18.8%
Net profit 412.0% 397.1% 99.8% 93.7% -45.5% 59.1% 26.3% 65.9% 12.0% 18.8%
EPS n/a n/a n/a 54.4% -53.0% 57.0% 19.5% 54.2% 12.0% 18.8%
Recurring net profit 297.8% 538.0% 54.2% 88.3% -33.8% 114.4% 7.3% 44.0% 38.8% 18.8%
Recurring EPS n/a n/a n/a 50.1% -43.0% 111.5% 1.5% 33.9% 38.8% 18.8%
Margins 2008 2009 2010 2011 2012 2013 2014 2015 2016E 2017E
EBITDA margin 96.4% 98.7% 100.5% 111.4% 94.0% 85.6% 91.9% 93.2% 89.5% 89.4%
Adjusted EBITDA margin 82.0% 88.7% 86.3% 89.8% 89.3% 84.2% 89.1% 87.3% 86.8% 86.6%
EBIT margin 63.8% 63.7% 64.5% 74.4% 54.0% 50.1% 54.7% 56.0% 52.9% 52.8%
Adjusted EBIT margin 49.5% 53.6% 50.3% 52.8% 49.3% 48.7% 52.0% 50.1% 50.2% 50.0%
Pretax profit margin 38.4% 35.8% 36.5% 36.0% 15.7% 18.1% 20.2% 27.7% 25.5% 26.3%
After tax profit margin 43.1% 37.9% 34.7% 35.0% 14.9% 16.9% 18.8% 25.8% 23.3% 23.4%
Net margin 21.4% 31.2% 30.0% 32.4% 13.9% 16.3% 18.3% 25.3% 22.6% 22.7%
Recurring net margin 14.9% 27.8% 20.7% 21.7% 11.3% 17.8% 17.0% 20.4% 22.6% 22.7%
Net Interest coverage 3.8 3.5 3.6 2.9 2.5 2.7 2.7 3.3 3.3 3.4

7
HNR Balance Sheet Projection
Sources: Company, CGIS Research estimates
Balance sheet (RMB m) 2008 2009 2010 2011 2012 2013 2014 2015 2016E 2017E
Non current assets
PP&E 8,544 14,336 27,803 36,956 39,859 45,599 57,873 68,658 76,690 84,008
Lease prepayments 15 23 65 102 122 138 157 317 317 317
Intangible assets 358 412 395 381 364 703 696 682 657 632
Investment in associates and JV 52 0 0 85 85 82 112 109 113 116
Other assets 21 1,165 2,690 3,824 3,717 3,516 4,153 5,131 5,240 5,186
Deferred tax assets 21 16 13 7 6 6 5 4 4 4
9,012 15,951 30,966 41,356 44,153 50,044 62,997 74,901 83,020 90,263
Current assets
Inventories 2 0 1 2 4 4 13 43 (16) 48
Trade and bill receivables 117 391 960 2,010 3,303 2,908 3,160 2,900 4,165 5,073
Prepayments and other current assets 121 597 208 584 562 403 176 122 122 122
Restricted deposits 29 16 1 59 209 170 2 27 27 27
Cash 1,644 819 1,309 7,518 5,469 6,265 7,786 4,504 6,221 7,926
Others 0 7 1 0 0 3 4 56 56 56
1,912 1,830 2,479 10,174 9,546 9,754 11,141 7,652 10,575 13,252
Total assets 10,924 17,781 33,445 51,531 53,699 59,798 74,138 82,553 93,595 103,515
Current liabilities
Borrowings 2,396 2,799 4,818 6,759 8,276 10,389 17,306 18,727 23,527 28,527
Obligations under finance leases 0 119 232 283 361 386 434 496 496 496
Tax payable 4 13 6 18 31 32 40 60 60 60
Other payables 1,574 2,082 6,255 8,839 6,214 8,435 7,961 9,250 10,438 11,224
3,974 5,012 11,311 15,899 14,882 19,242 25,741 28,533 34,521 40,307
Non current liabilities
Borrowings 4,437 8,087 13,201 19,257 22,005 22,606 26,842 30,677 33,877 35,877
Obligations under finance leases 0 806 1,768 2,384 2,257 1,883 2,769 2,018 2,018 2,018
Others 49 324 762 1,547 1,572 1,086 1,634 2,450 2,450 2,450
Deferred income 176 234 249 258 273 265 248 231 231 231
Deferred tax liabilities 9 21 34 27 18 19 19 20 20 20
4,670 9,472 16,015 23,472 26,126 25,859 31,512 35,395 38,595 40,595
Equity
Share capital 452 452 5,800 8,447 8,447 9,029 9,728 9,728 9,728 9,728
Reserves 1,223 2,132 (516) 2,885 3,373 4,832 6,373 8,070 9,860 11,917
Attributable to equity owner 1,674 2,583 5,284 11,332 11,820 13,861 16,101 17,798 19,588 21,645
Minority interests 605 713 835 828 871 836 784 827 891 968
2,280 3,297 6,119 12,159 12,691 14,697 16,885 18,624 20,479 22,613
Total equity and liabilities 10,924 17,781 33,445 51,531 53,699 59,798 74,138 82,553 93,595 103,515
BVPS (RMB) - - - 1.34 1.40 1.54 1.66 1.83 2.01 2.23

8
HNR Cash Flow Projection; Valuation and Ratios
Sources: Company, CGIS Research estimates
Cash flow statement (RMB m) 2008 2009 2010 2011 2012 2013 2014 2015E 2016E 2017E
Pretax profit 108 360 641 1,139 631 984 1,232 2,041 2,348 2,866
Income tax (1) (20) (15) (22) (25) (68) (77) (141) (202) (315)
Depreciation 101 283 614 1,150 1,591 1,910 2,237 2,696 3,347 3,957
Amortization 1 14 19 20 21 21 29 34 25 25
Interest expense 95 251 514 1,059 1,620 1,870 2,143 2,241 2,599 2,965
Interest income (5) (8) (13) (43) (92) (51) (55) (170) (70) (85)
Dividend income (2) (4) (4) (3) (4) (9) (8) 0 0 0
Share of profit / (loss) of JV and associates (0) (3) 0 0 0 3 2 3 (3) (3)
Change in working capital (96) (114) (485) (921) (619) 1,116 689 1,520 (18) (132)
Others (4) (84) (12) 183 (10) 140 (68) (516) 0 0
Operating cash flow 197 674 1,260 2,562 3,113 5,918 6,125 7,709 8,027 9,276
Purchase/(disposal) of PP&E and intangible assets (4,988) (7,164) (10,417) (7,699) (6,580) (7,157) (13,394) (13,062) (11,150) (10,890)
Acquisition of subsidiaries/disposal of subsidiaries 0 138 0 0 0 (2) (361) 0 0 0
Investment in/(disposal of) financial assets, JV & associates (3) (357) (33) (328) (192) 0 0 0 0 0
Interest received 5 8 13 43 87 58 58 170 70 85
Dividend received 4 4 4 3 4 9 8 0 0 0
Others 99 215 713 194 (1,674) 439 728 (500) 0 0
Investing cash flow (4,883) (7,156) (9,720) (7,787) (8,355) (6,653) (12,961) (13,393) (11,080) (10,805)
Net proceeds from issuance of shares 0 0 0 5,403 0 1,230 1,358 0 0 0
Capital contribution - equity owner 780 700 2,172 0 0 0 0 0 0 0
Capital contribution - minority interest 223 207 86 5 62 0 0 0 0 0
Proceeds from /(repayment of) borrowings 4,953 4,615 7,134 7,998 4,263 2,709 10,489 5,256 8,000 7,000
Interest paid (213) (484) (705) (1,316) (1,858) (1,850) (2,228) (2,660) (2,937) (3,350)
Dividend paid to equity owner 0 0 0 0 0 (127) (181) (195) (292) (416)
Others (9) 590 280 (510) (964) (598) (550) 0 0 0
Financing cash flow 5,735 5,627 8,968 11,580 1,503 1,364 8,889 2,401 4,771 3,234
Net change in cash 1,048 (855) 509 6,355 (3,739) 630 2,053 (3,283) 1,718 1,705
Valuation
P/E (recurring earnings) n/a n/a 30.9 19.7 33.9 15.8 15.7 12.3 8.9 7.5
Dividend yield n/a n/a n/a 0.0% 0.8% 1.2% 1.2% 1.6% 2.3% 2.7%
P/B n/a n/a n/a 1.4 1.3 1.2 1.1 1.0 0.9 0.9
EV/EBITDA n/a n/a 35.3 17.7 16.5 13.4 11.1 9.1 7.6 6.4
Ratios
Recurring net margin 14.9% 27.8% 20.7% 21.7% 11.3% 17.8% 17.0% 20.4% 22.6% 22.7%
Recurring ROE - 11.1% 9.2% 8.2% 3.9% 7.6% 7.0% 8.8% 11.1% 12.0%
Recurring ROA - 1.6% 1.4% 1.6% 0.9% 1.7% 1.6% 1.9% 2.4% 2.5%
Net debt / Equity 227.6% 305.4% 273.1% 152.1% 195.5% 181.9% 215.3% 241.1% 249.9% 249.8%
Current ratio 0.48 0.37 0.22 0.64 0.64 0.51 0.43 0.27 0.31 0.33
9
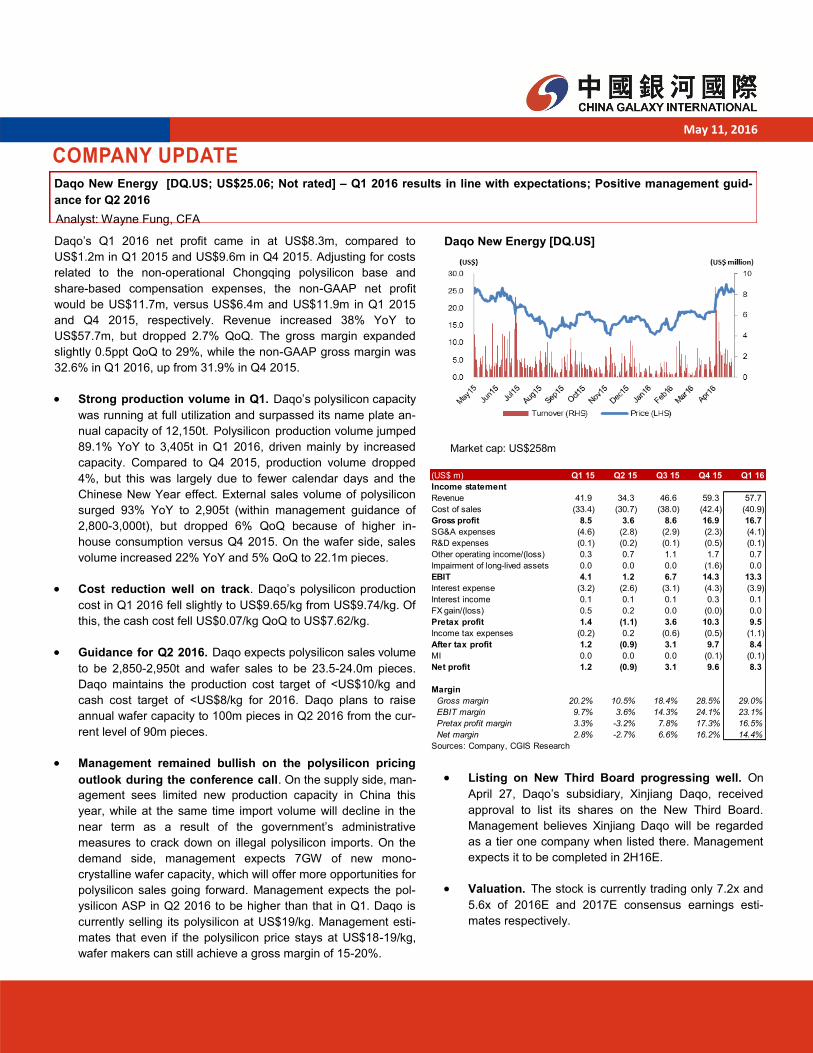
COMPANY UPDATE
Analyst: Wayne Fung, CFA
Daqo New Energy [DQ.US; US$25.06; Not rated] – Q1 2016 results in line with expectations; Positive management guid-
ance for Q2 2016
Daqo’s Q1 2016 net profit came in at US$8.3m, compared to
US$1.2m in Q1 2015 and US$9.6m in Q4 2015. Adjusting for costs
related to the non-operational Chongqing polysilicon base and
share-based compensation expenses, the non-GAAP net profit
would be US$11.7m, versus US$6.4m and US$11.9m in Q1 2015
and Q4 2015, respectively. Revenue increased 38% YoY to
US$57.7m, but dropped 2.7% QoQ. The gross margin expanded
slightly 0.5ppt QoQ to 29%, while the non-GAAP gross margin was
32.6% in Q1 2016, up from 31.9% in Q4 2015.
Strong production volume in Q1. Daqo’s polysilicon capacity
was running at full utilization and surpassed its name plate an-
nual capacity of 12,150t. Polysilicon production volume jumped
89.1% YoY to 3,405t in Q1 2016, driven mainly by increased
capacity. Compared to Q4 2015, production volume dropped
4%, but this was largely due to fewer calendar days and the
Chinese New Year effect. External sales volume of polysilicon
surged 93% YoY to 2,905t (within management guidance of
2,800-3,000t), but dropped 6% QoQ because of higher in-
house consumption versus Q4 2015. On the wafer side, sales
volume increased 22% YoY and 5% QoQ to 22.1m pieces.
Cost reduction well on track. Daqo’s polysilicon production
cost in Q1 2016 fell slightly to US$9.65/kg from US$9.74/kg. Of
this, the cash cost fell US$0.07/kg QoQ to US$7.62/kg.
Guidance for Q2 2016. Daqo expects polysilicon sales volume
to be 2,850-2,950t and wafer sales to be 23.5-24.0m pieces.
Daqo maintains the production cost target of <US$10/kg and
cash cost target of <US$8/kg for 2016. Daqo plans to raise
annual wafer capacity to 100m pieces in Q2 2016 from the cur-
rent level of 90m pieces.
Management remained bullish on the polysilicon pricing
outlook during the conference call. On the supply side, man-
agement sees limited new production capacity in China this
year, while at the same time import volume will decline in the
near term as a result of the government’s administrative
measures to crack down on illegal polysilicon imports. On the
demand side, management expects 7GW of new mono-
crystalline wafer capacity, which will offer more opportunities for
polysilicon sales going forward. Management expects the pol-
ysilicon ASP in Q2 2016 to be higher than that in Q1. Daqo is
currently selling its polysilicon at US$19/kg. Management esti-
mates that even if the polysilicon price stays at US$18-19/kg,
wafer makers can still achieve a gross margin of 15-20%.
Daqo New Energy [DQ.US]
Market cap: US$258m
Listing on New Third Board progressing well. On
April 27, Daqo’s subsidiary, Xinjiang Daqo, received
approval to list its shares on the New Third Board.
Management believes Xinjiang Daqo will be regarded
as a tier one company when listed there. Management
expects it to be completed in 2H16E.
Valuation. The stock is currently trading only 7.2x and
5.6x of 2016E and 2017E consensus earnings esti-
mates respectively.
May 11, 2016
(US$ m) Q1 15 Q2 15 Q3 15 Q4 15 Q1 16
Income statement
Revenue 41.9 34.3 46.6 59.3 57.7
Cost of sales (33.4) (30.7) (38.0) (42.4) (40.9)
Gross profit 8.5 3.6 8.6 16.9 16.7
SG&A expenses (4.6) (2.8) (2.9) (2.3) (4.1)
R&D expenses (0.1) (0.2) (0.1) (0.5) (0.1)
Other operating income/(loss) 0.3 0.7 1.1 1.7 0.7
Impairment of long-lived assets 0.0 0.0 0.0 (1.6) 0.0
EBIT 4.1 1.2 6.7 14.3 13.3
Interest expense (3.2) (2.6) (3.1) (4.3) (3.9)
Interest income 0.1 0.1 0.1 0.3 0.1
FX gain/(loss) 0.5 0.2 0.0 (0.0) 0.0
Pretax profit 1.4 (1.1) 3.6 10.3 9.5
Income tax expenses (0.2) 0.2 (0.6) (0.5) (1.1)
After tax profit 1.2 (0.9) 3.1 9.7 8.4
MI 0.0 0.0 0.0 (0.1) (0.1)
Net profit 1.2 (0.9) 3.1 9.6 8.3
Margin
Gross margin 20.2% 10.5% 18.4% 28.5% 29.0%
EBIT margin 9.7% 3.6% 14.3% 24.1% 23.1%
Pretax profit margin 3.3% -3.2% 7.8% 17.3% 16.5%
Net margin 2.8% -2.7% 6.6% 16.2% 14.4%
Sources: Company, CGIS Research

10
Figure 1: Daqo polysilicon sales volume Figure 2: Daqo wafer sales volume
Sources: Company, CGIS Research Sources: Company, CGIS Research
Figure 3: Daqo Polysilicon ASP Figure 4: Daqo polysilicon unit cost (for Xinjiang production base)
Sources: Company, CGIS Research Sources: Company, CGIS Research
15.8
12.2 11.8 12.0 11.8 11.5 10.7 10.9 10.5 10.6 8.7 7.7 7.6
4.8
5.4 4.2 3.8
2.7 2.7 2.3 2.4 2.3 2.4
2.4 2.1 2.0
0.0
5.0
10.0
15.0
20.0
25.0
Q1 13 Q2 13 Q3 13 Q4 13 Q1 14 Q2 14 Q3 14 Q4 14 Q1 15 Q2 15 Q3 15 Q4 15 Q1 16
Cash cost Depreciation
1,406 1,391 1,528 1,646 1,502 1,363
2,277
3,092 2,905
0
500
1,000
1,500
2,000
2,500
3,000
3,500
Q1 14 Q2 14 Q3 14 Q4 14 Q1 15 Q2 15 Q3 15 Q4 15 Q1 16
Polysilicon sales volume (t)
18.0 17.1 18.3 18.1 18.3 19.1
21.0 22.1
0
5
10
15
20
25
Q2 14 Q3 14 Q4 14 Q1 15 Q2 15 Q3 15 Q4 15 Q1 16
Wafer sales volume (m pieces)
16.7 16.7
18.0 18.7
21.6
22.0 21.5
20.5
18.1
16.0 15.0
13.9 13.7
0.0
5.0
10.0
15.0
20.0
25.0
Q1 13 Q2 13 Q3 13 Q4 13 Q1 14 Q2 14 Q3 14 Q4 14 Q1 15 Q2 15 Q3 15 Q4 15 Q1 16
Polysilicon ASP (US$/kg)
11
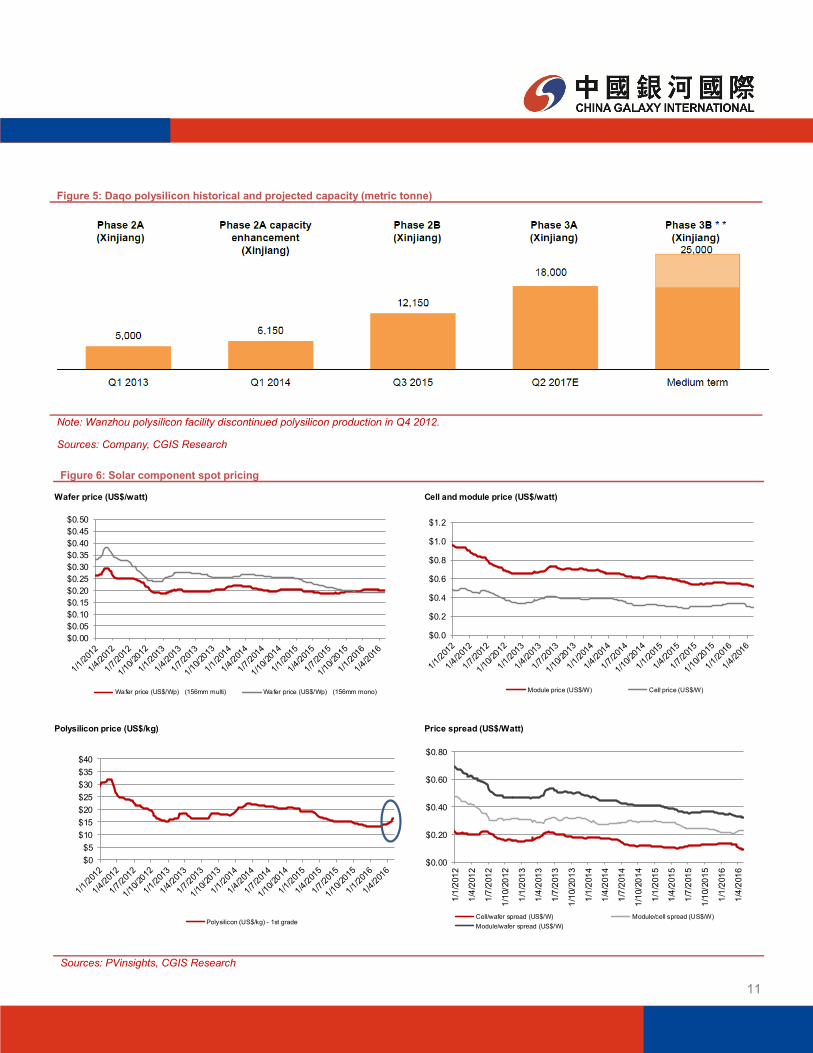
Figure 5: Daqo polysilicon historical and projected capacity (metric tonne)
Note: Wanzhou polysilicon facility discontinued polysilicon production in Q4 2012.
Sources: Company, CGIS Research
Figure 6: Solar component spot pricing
Sources: PVinsights, CGIS Research
Wafer price (US$/watt) Cell and module price (US$/watt)
Polysilicon price (US$/kg) Price spread (US$/Watt)
$0.00
$0.20
$0.40
$0.60
$0.80
1/1
/201
2
1/4
/201
2
1/7
/201
2
1/1
0/2
01
2
1/1
/201
3
1/4
/201
3
1/7
/201
3
1/1
0/2
01
3
1/1
/201
4
1/4
/201
4
1/7
/201
4
1/1
0/2
01
4
1/1
/201
5
1/4
/201
5
1/7
/201
5
1/1
0/2
01
5
1/1
/201
6
1/4
/201
6
Cell/wafer spread (US$/W) Module/cell spread (US$/W)
Module/wafer spread (US$/W)
$0
$5
$10
$15
$20
$25
$30
$35
$40
Polysilicon (US$/kg) - 1st grade
$0.0
$0.2
$0.4
$0.6
$0.8
$1.0
$1.2
Module price (US$/W) Cell price (US$/W)
$0.00
$0.05
$0.10
$0.15
$0.20
$0.25
$0.30
$0.35
$0.40
$0.45
$0.50
Wafer price (US$/Wp) (156mm multi) Wafer price (US$/Wp) (156mm mono)

12
Disclaimer
This research report is not directed at, or intended for distribution to or use by, any person or entity who is a citizen or resident of or located in any jurisdiction where such distribution, publication, availability or use would be contrary to applicable law or regulation or which would subject China Galaxy International Securities (Hong Kong) Co., Limited (“Galaxy International Securities”) and/or its group companies to any registration or licensing requirement within such jurisdiction.
This report (including any information attached) is issued by China Galaxy International Securities (Hong Kong) Co., Limited, one of the subsidiaries of the China Galaxy International Financial Holdings Limited, to the institutional clients from the information sources believed to be reliable, but no repre-sentation or warranty (expressly or implied) is made as to their accuracy, correctness and/or completeness.
This report shall not be construed as an offer, invitation or solicitation to buy or sell any securities of the company(ies) referred to herein. Past perfor-mance should not be taken as an indication or guarantee of future performance, and no representation or warranty, express or implied, is made regard-ing future performance. The recipient of this report should understand and comprehend the investment objectives and its related risks, and where necessary consult their own independent financial advisers prior to any investment decision.
Where any part of the information, opinions or estimates contained herein reflects the personal views and opinions of the analyst who prepared this report, such views and opinions may not correspond to the published views or investment decisions of China Galaxy International Financial Holdings Limited and any of its subsidiaries (“China Galaxy International”), directors, officers, agents and employees (“the Relevant Parties”).
All opinions and estimates reflect the judgment of the analyst on the date of this report and are subject to change without notice. China Galaxy Interna-tional and/or the Relevant Parties hereby disclaim any of their liabilities arising from the inaccuracy, incorrectness and incompleteness of this report and its attachment/s and/or any action or omission made in reliance thereof. Accordingly, this report must be read in conjunction with this disclaimer.
Disclosure of Interests
China Galaxy International may have financial interests in relation to the subjected company(ies) the securities in respect of which are reviewed in this report, and such interests aggregate to an amount may equal to or more than 1 % of the subjected company(ies)’ market capitalization.
One or more directors, officers and/or employees of China Galaxy International may be a director or officer of the securities of the company(ies) men-tioned in this report.
China Galaxy International and the Relevant Parties may, to the extent permitted by law, from time to time participate or invest in financing transac-tions with the securities of the company(ies) mentioned in this report, perform services for or solicit business from such company(ies), and/or have a position or holding, or other material interest, or effect transactions, in such securities or options thereon, or other investments related thereto.
China Galaxy International may have served as manager or co-manager of a public offering of securities for, or currently may make a primary market in issues of, any or all of the entities mentioned in this report or may be providing, or have provided within the last 12 months, significant advice or invest-ment services in relation to the investment concerned or a related investment or investment banking services to the company(ies) mentioned in this report.
Furthermore, China Galaxy International may have received compensation for investment banking services from the company(ies) mentioned in this report within the preceding 12 months and may currently seeking investment banking mandate from the subject company(ies).
Analyst Certification
The analyst who is primarily responsible for the content of this report, in whole or in part, certifies that with respect to the securities or issuer covered in this report: (1) all of the views expressed accurately reflect his or her personal views about the subject, securities or issuer; and (2) no part of his or her compensation was, is, or will be, directly or indirectly, related to the specific views expressed by the analyst in this report.
Besides, the analyst confirms that neither the analyst nor his/her associates (as defined in the code of conduct issued by The Hong Kong Securities and Futures Commission) (1) have dealt in or traded in the securities covered in this research report within 30 calendar days prior to the date of issue of this report; (2) will deal in or trade in the securities covered in this research report three business days after the date of issue of this report; (3) serve as an officer of any of the Hong Kong-listed companies covered in this report; and (4) have any financial interests in the Hong Kong listed companies cov-ered in this report.
Explanation on Equity Ratings
Copyright Reserved
No part of this material may be reproduced or redistributed without the prior written consent of China Galaxy International Securities (Hong Kong) Co., Limited.
China Galaxy International Securities (Hong Kong) Co. Limited, CE No.AXM459
Room 3501-3507, 35/F, Cosco Tower, Grand Millennium Plaza, 183 Queen’s Road Central, Sheung Wan, Hong Kong. General line: 3698-6888.
BUY share price will increase by >20% within 12 months in absolute terms :
SELL share price will decrease by >20% within 12 months in absolute terms :
HOLD no clear catalyst, and downgraded from BUY pending clearer signal to reinstate BUY or further downgrade to outright SELL :

![Yum Cha 飲 茶€¦ · Yum Cha 飲 茶 March 20, 2013 Source: Bloomberg TALKING POINTS TIANNENG POWER [0819.HK, HK$5.50] — Gross margin of about 18% (based on original accounting](https://cdn.vdocuments.mx/doc/165x107/6016b4edf548b25fc7427010/yum-cha-e-eoe-yum-cha-e-eoe-march-20-2013-source-bloomberg-talking-points.jpg)


