Download - You are an ecologist. Devise a method of estimating the number of great blue heron in Rhode Island

You are an ecologist. Devise a method of estimating the number of great blue heron in Rhode Island.
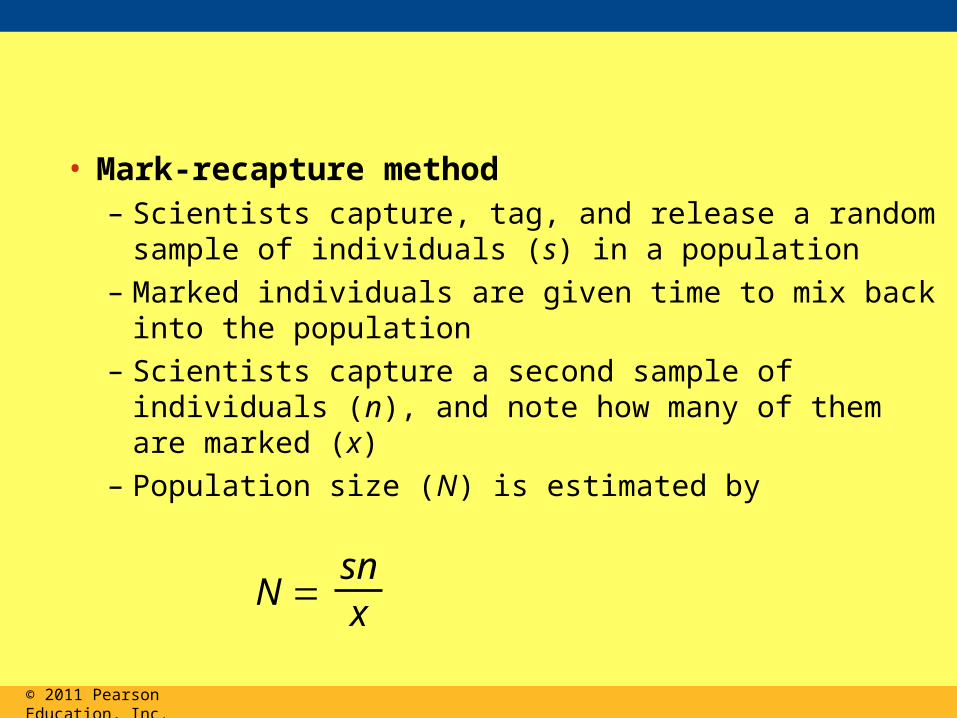
• Mark-recapture method– Scientists capture, tag, and release a random
sample of individuals (s) in a population
– Marked individuals are given time to mix back into the population
– Scientists capture a second sample of individuals (n), and note how many of them are marked (x)
– Population size (N) is estimated by
© 2011 Pearson Education, Inc.
snx
N

LECTURE PRESENTATIONSFor CAMPBELL BIOLOGY, NINTH EDITION
Jane B. Reece, Lisa A. Urry, Michael L. Cain, Steven A. Wasserman, Peter V. Minorsky, Robert B. Jackson
© 2011 Pearson Education, Inc.
Lectures byErin Barley
Kathleen Fitzpatrick
Population Ecology
Chapter 53

Bioflix: population ecology
AP biology test formula sheet
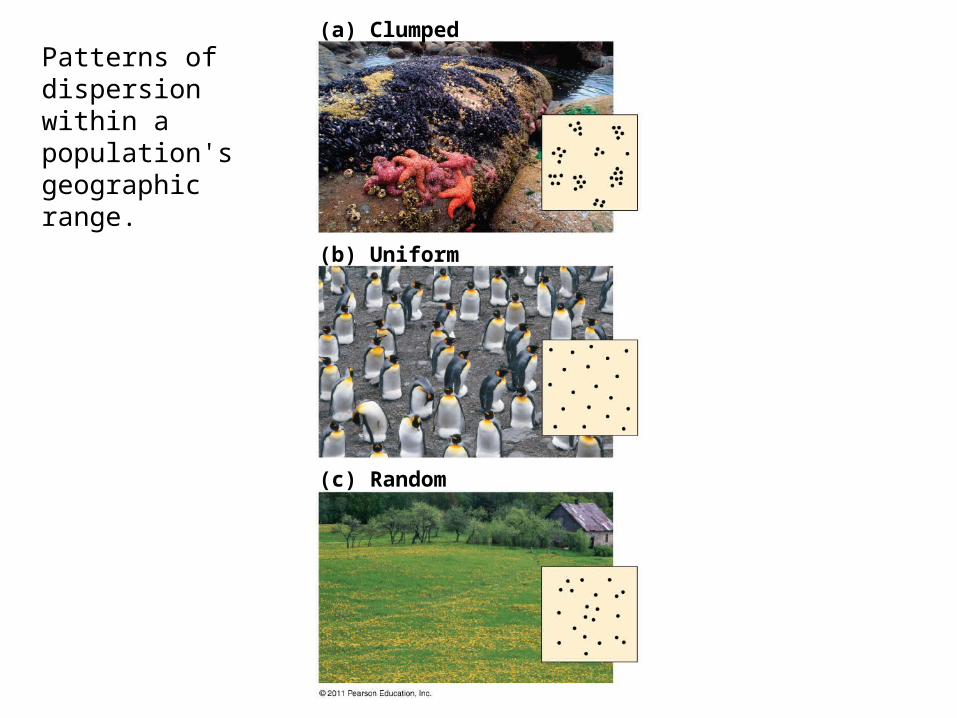
Patterns of dispersion within a population's geographic range.
(a) Clumped
(b) Uniform
(c) Random

What pieces of information can you glean from the life table data?

What pieces of information can you glean from the life table data?
Survivorship Curves
• A survivorship curve is a graphic way of representing the data in a life table
• The survivorship curve for Belding’s ground squirrels shows a relatively constant death rate
© 2011 Pearson Education, Inc.

Figure 53.5
Males
Females
1,000
100
10
1
Age (years)
Nu
mb
er o
f su
rviv
ors
(lo
g s
cale
)
0 2 4 6 8 10
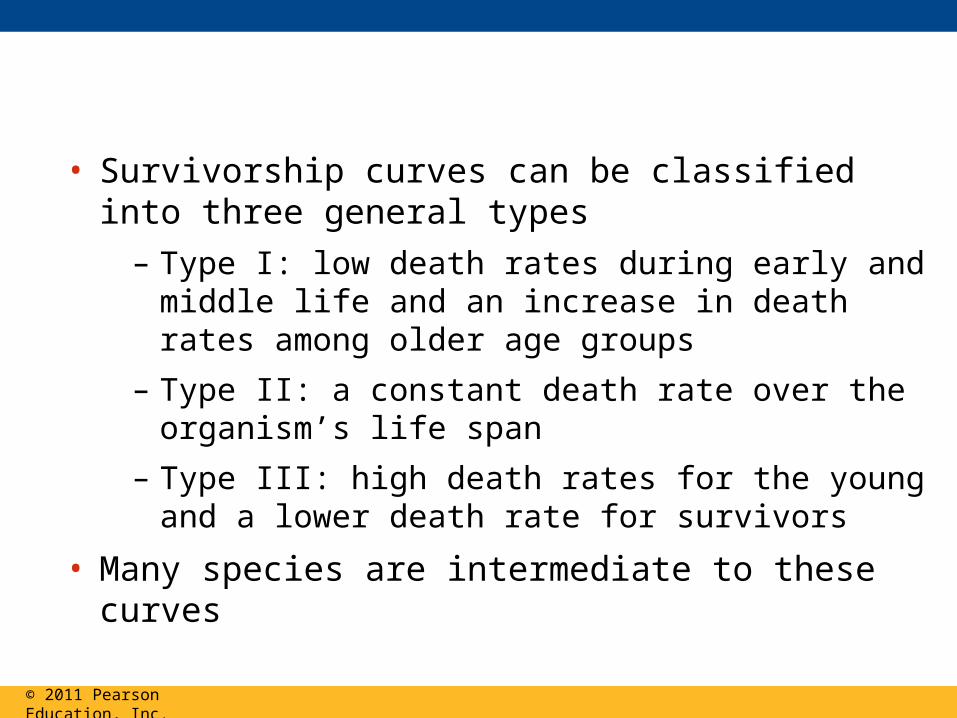
• Survivorship curves can be classified into three general types
– Type I: low death rates during early and middle life and an increase in death rates among older age groups
– Type II: a constant death rate over the organism’s life span
– Type III: high death rates for the young and a lower death rate for survivors
• Many species are intermediate to these curves
© 2011 Pearson Education, Inc.

Figure 53.6
1,000
III
II
I
100
10
1100500
Percentage of maximum life span
Nu
mb
er o
f su
rviv
ors
(lo
g s
cale
)

Reproductive Rates
• For species with sexual reproduction, demographers often concentrate on females in a population
• A reproductive table, or fertility schedule, is an age-specific summary of the reproductive rates in a population
• It describes the reproductive patterns of a population
© 2011 Pearson Education, Inc.
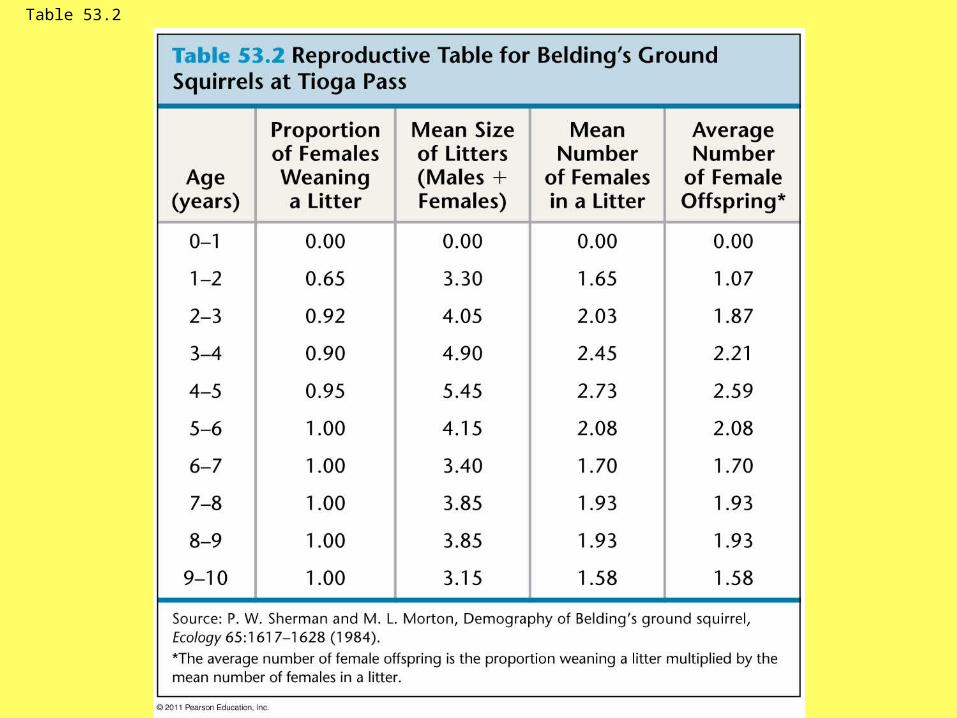
Table 53.2
How would an ecologist determine change in population size over a given period of time?
Devise a formula.

Population dynamics
Births Deaths
Immigration Emigration
Births and immigrationadd individuals toa population.
Deaths and emigrationremove individualsfrom a population.

Per Capita Rate of Increase
• If immigration and emigration are ignored, a population’s growth rate (per capita increase) equals birth rate minus death rate
© 2011 Pearson Education, Inc.
Change inpopulation
sizeBirths
Immigrantsentering
populationDeaths
Emigrantsleaving
population
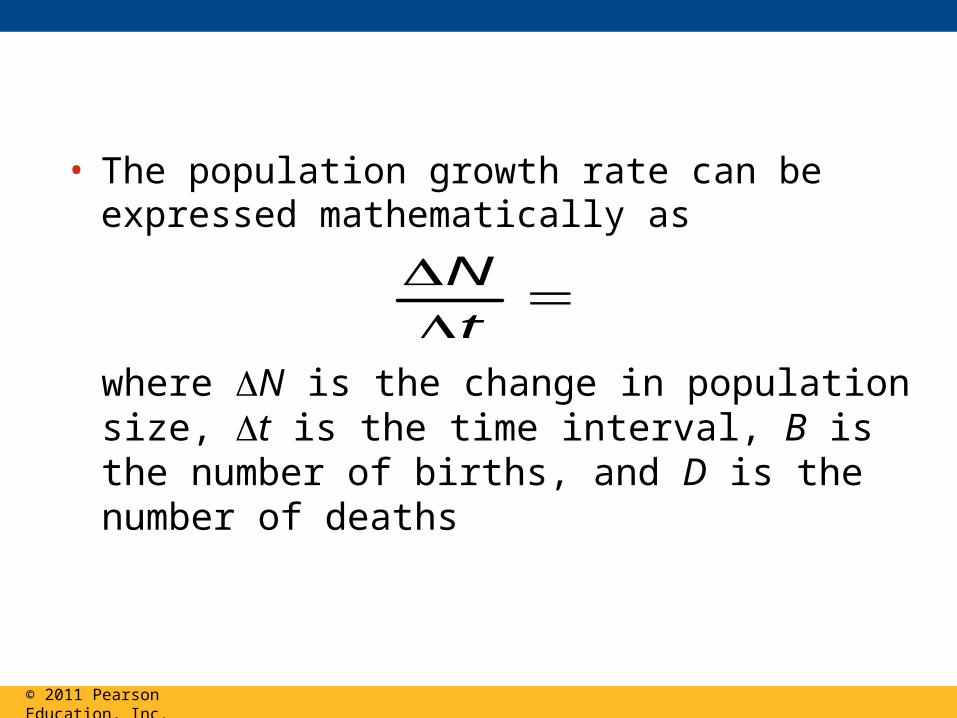
• The population growth rate can be expressed mathematically as
© 2011 Pearson Education, Inc.
where N is the change in population size, t is the time interval, B is the number of births, and D is the number of deaths
NB D
t
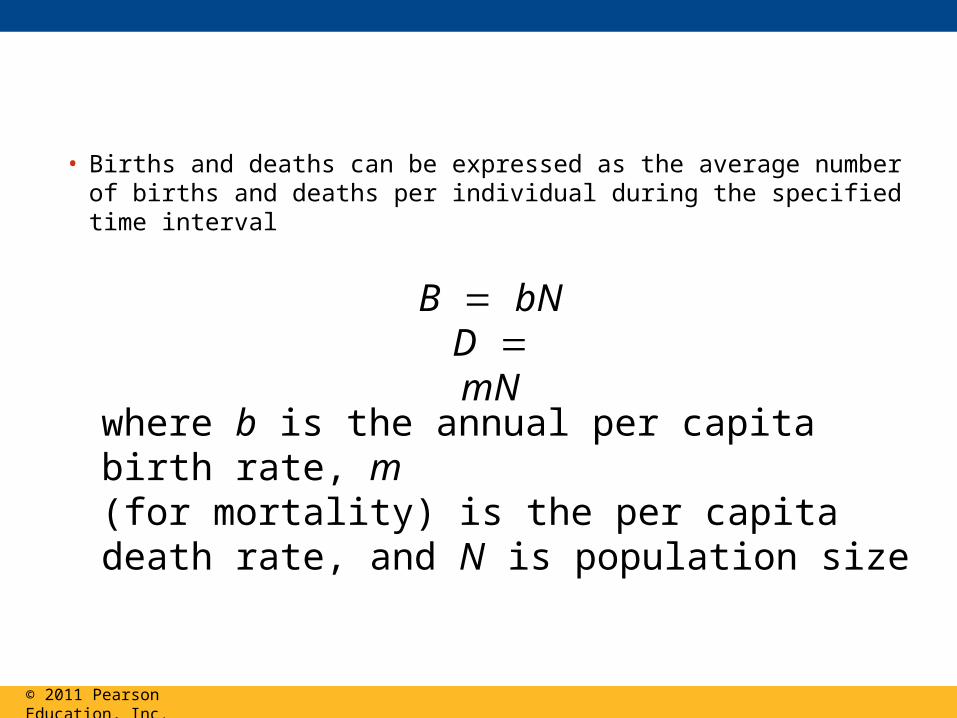
• Births and deaths can be expressed as the average number of births and deaths per individual during the specified time interval
© 2011 Pearson Education, Inc.
where b is the annual per capita birth rate, m (for mortality) is the per capita death rate, and N is population size
B bND mN

• The population growth equation can be revised
© 2011 Pearson Education, Inc.
NbN mN
t

• The per capita rate of increase (r) is given by
© 2011 Pearson Education, Inc.
r b m
• Zero population growth (ZPG) occurs when the birth rate equals the death rate (r 0)

• Change in population size can now be written as
Nt
rN
© 2011 Pearson Education, Inc.
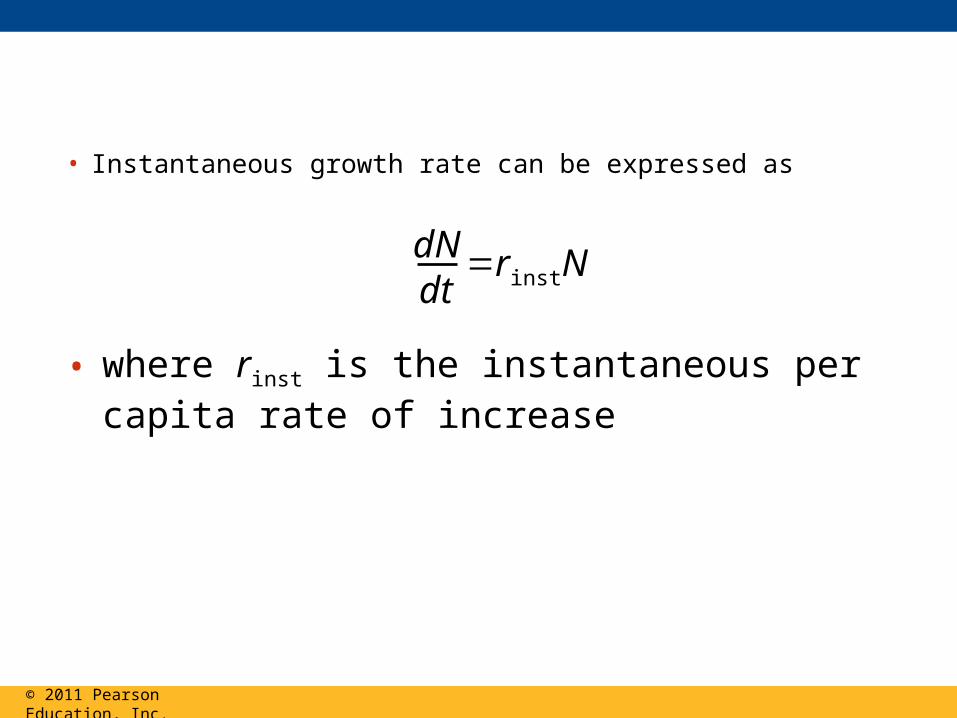
• Instantaneous growth rate can be expressed as
dNdt
rinstN
© 2011 Pearson Education, Inc.
• where rinst is the instantaneous per capita rate of increase
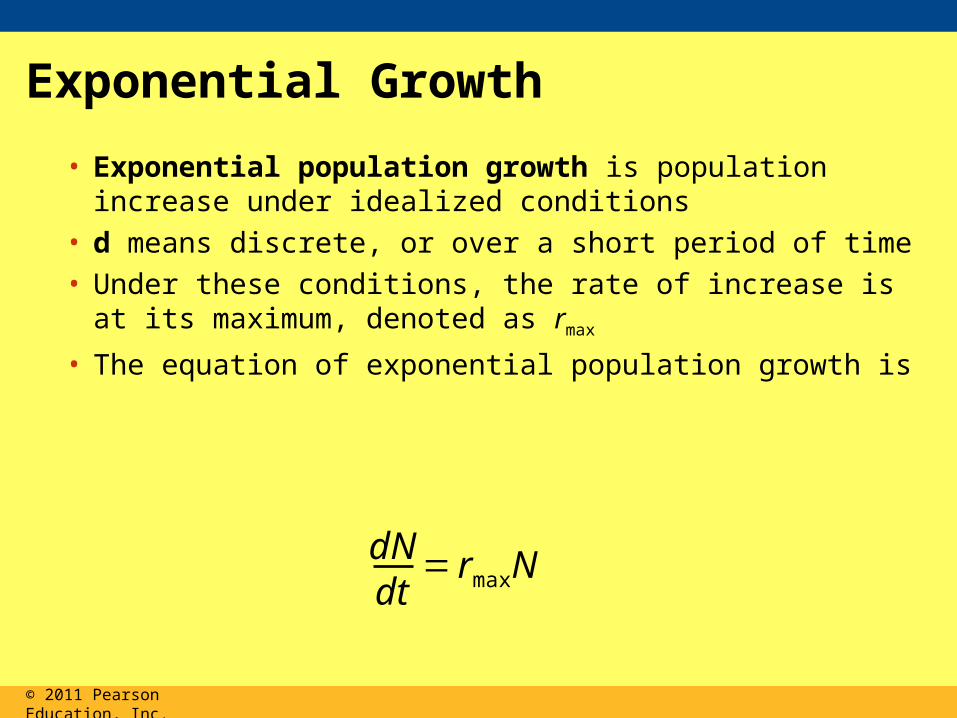
Exponential Growth
• Exponential population growth is population increase under idealized conditions
• d means discrete, or over a short period of time• Under these conditions, the rate of increase is at its
maximum, denoted as rmax
• The equation of exponential population growth is
© 2011 Pearson Education, Inc.
dNdt
rmaxN

• Exponential population growth results in a J-shaped curve
© 2011 Pearson Education, Inc.

Number of generations
Po
pu
lati
on
siz
e (N
)
0 5 10 15
2,000
1,500
1,000
500
dNdt
dNdt
= 1.0N
= 0.5N
Figure 53.7

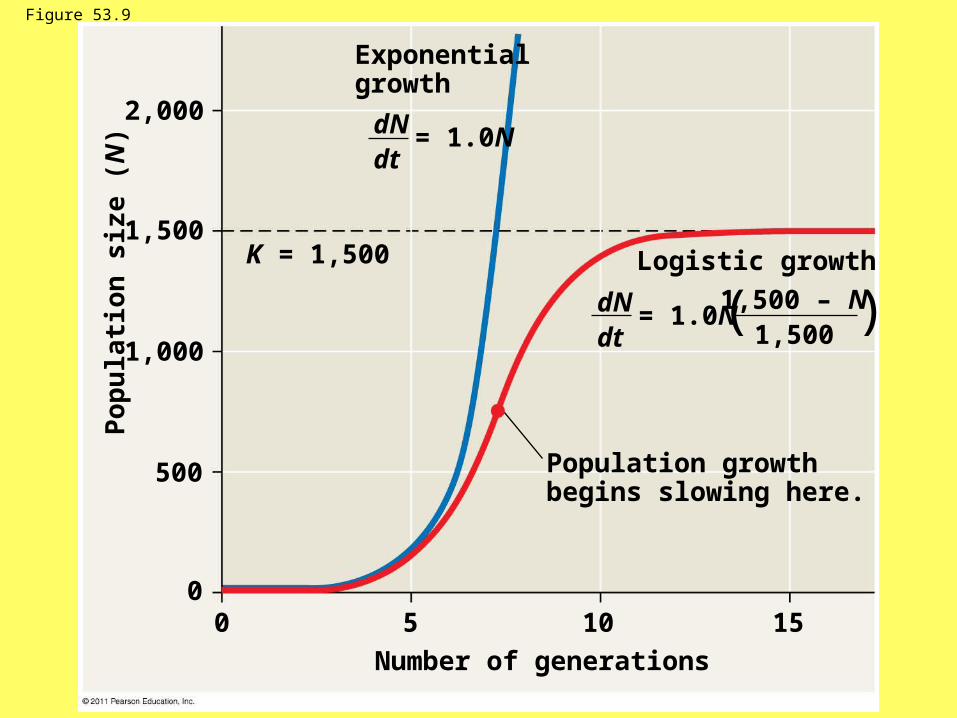
The Logistic Growth Model
• In the logistic population growth model, the per capita rate of increase declines as carrying capacity is reached
• The logistic model starts with the exponential model and adds an expression that reduces per capita rate of increase as N approaches K
dNdt
(K N)
Krmax N
© 2011 Pearson Education, Inc.

Table 53.3
Number of generations
Population growthbegins slowing here.
Exponentialgrowth
Logistic growth
Po
pu
lati
on
siz
e (
N)
0 5 1510
2,000
1,500
1,000
500
0
K = 1,500
dNdt
= 1.0N
dNdt
= 1.0N
1,500 – N1,500
( )
Figure 53.9

Figure 53.UN03
Number of generations
Po
pu
lati
on
siz
e (N
)
= rmax NdNdt
K – NK
K = carrying capacity
( )

How well do these populations fit the logistic growth model?What factor could be determining carrying capacity in each of the populations below?
Time (days) Time (days)
(a) A Paramecium population in the lab
(b) A Daphnia population in the lab
Nu
mb
er o
f P
aram
eciu
m/m
L
Nu
mb
er o
f D
aph
nia
/50
mL
1,000
800
600
400
200
00 5 10 2015 0 16040 60 80 100 120 140
180
150
120
90
60
30
0

When populationdensity is low, b > m. Asa result, the populationgrows until the densityreaches Q.
When populationdensity is high, m > b,and the populationshrinks until thedensity reaches Q.
Equilibrium density (Q)
Density-independentdeath rate (m)
Density-dependentbirth rate (b)
Population density
Bir
th o
r d
eath
rat
ep
er c
apit
a
Determining equilibrium for population density

Figure 53.16
Population size
% o
f yo
un
g s
hee
p p
rod
uci
ng
lam
bs
200 300 400 500 600
100
80
60
40
20
0

Wolves Moose
Year
Nu
mb
er o
f w
olv
es
Nu
mb
er o
f m
oo
se
1955 1965 1975 1985 1995 2005
50
40
30
20
10
0
2,500
2,000
1,500
1,000
500
0
Figure 53.18

You be the ecologist


• Hypothesis: The hare’s population cycle follows a cycle of winter food supply
• How could you test this hypothesis?
© 2011 Pearson Education, Inc.© 2011 Pearson Education, Inc.

• Hypothesis: The hare’s population cycle follows a cycle of winter food supply– If this hypothesis is correct, then the cycles
should stop if the food supply is increased– Additional food was provided experimentally to
a hare population, and the whole population increased in size but continued to cycle
– These data do not support the first hypothesis
© 2011 Pearson Education, Inc.© 2011 Pearson Education, Inc.
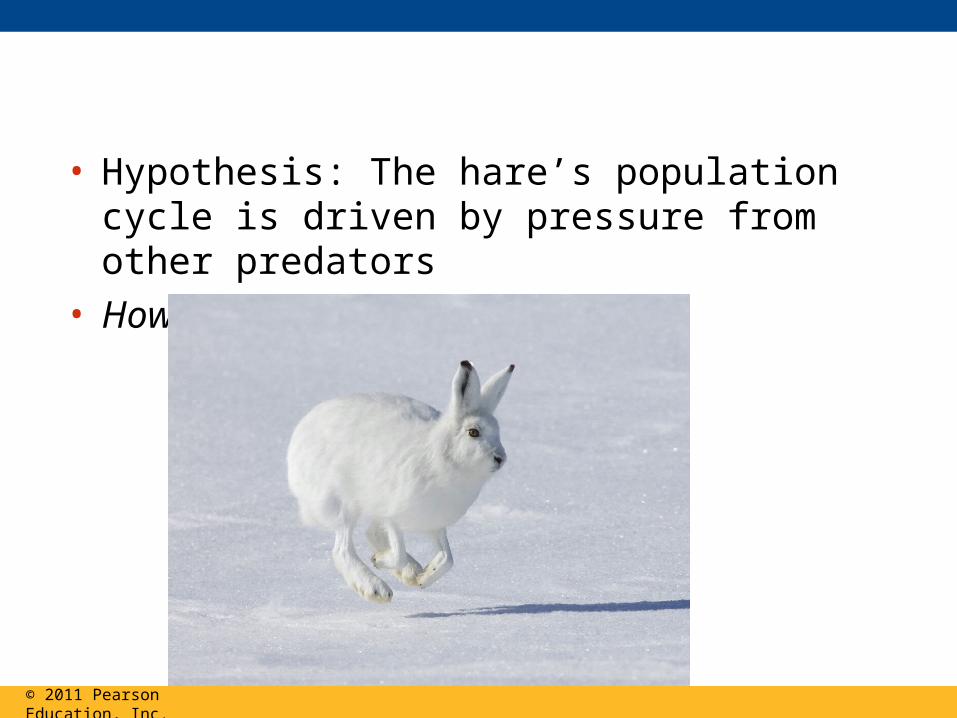
• Hypothesis: The hare’s population cycle is driven by pressure from other predators
• How could you test this hypothesis?
© 2011 Pearson Education, Inc.

• Hypothesis: The hare’s population cycle is driven by pressure from other predators– In a study conducted by field ecologists, 90% of the
hares were killed by predators– These data support the second hypothesis
© 2011 Pearson Education, Inc.

Snowshoe hare
Lynx
Year
1850 1875 1900 1925
Nu
mb
er o
f h
ares
(th
ou
san
ds)
Nu
mb
er o
f ly
nx
(th
ou
san
ds)
160
120
80
40
0
9
6
3
0
Figure 53.19

• Hypothesis: The hare’s population cycle is linked to sunspot cycles– Sunspot activity affects light quality, which in turn affects
the quality of the hares’ food– There is good correlation between sunspot activity and
hare population size
© 2011 Pearson Education, Inc.
• The results of all these experiments suggest that both predation and sunspot activity regulate hare numbers and that food availability plays a less important role
© 2011 Pearson Education, Inc.
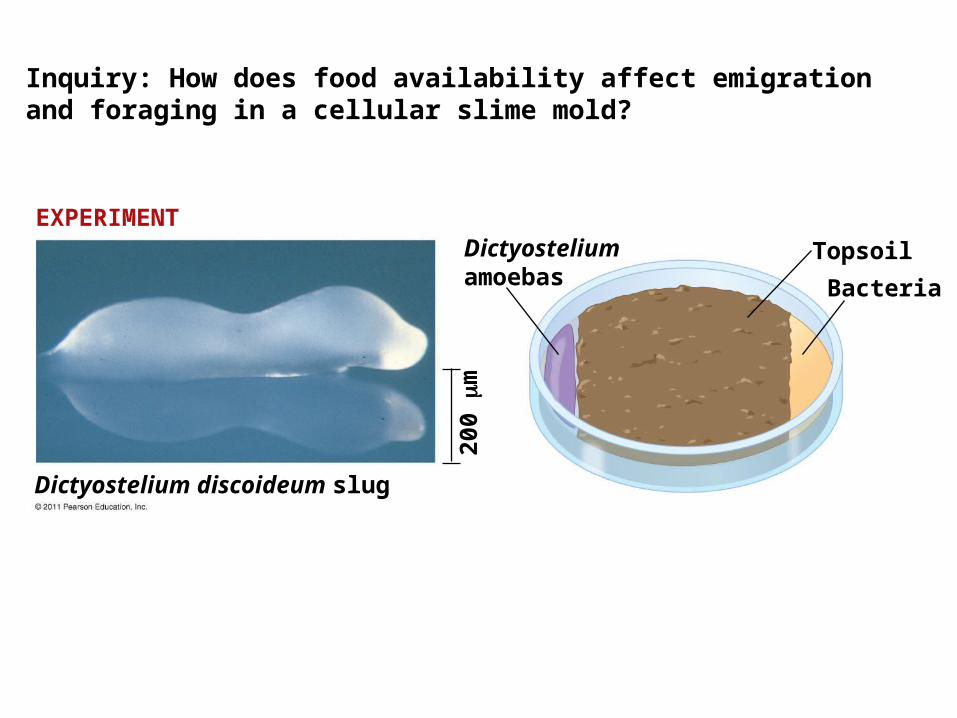
Inquiry: How does food availability affect emigration and foraging in a cellular slime mold?
Topsoil
Bacteria
EXPERIMENTDictyosteliumamoebas
Dictyostelium discoideum slug20
0 m
AlandIslands˚
EUROPE
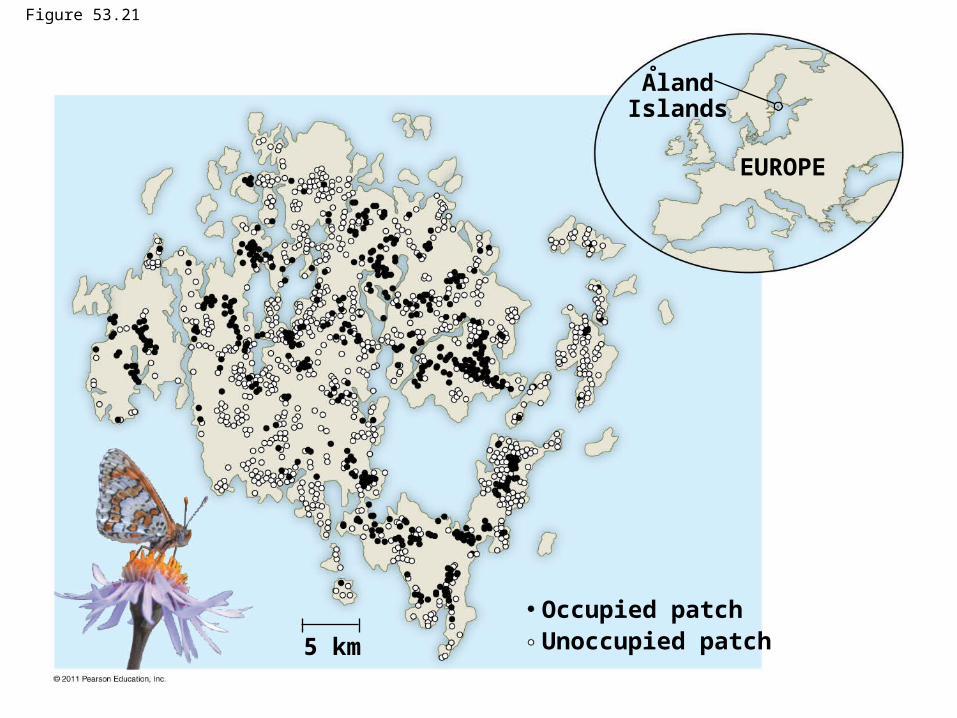
Occupied patchUnoccupied patch5 km
Figure 53.21

Human population growthWhat can be said about the data?
The Plague
Hu
man
po
pu
lati
on
(b
illio
ns)
8000BCE
4000BCE
2000CE
1000BCE
2000BCE
3000BCE
1000CE
0
7
6
5
4
3
2
1
0
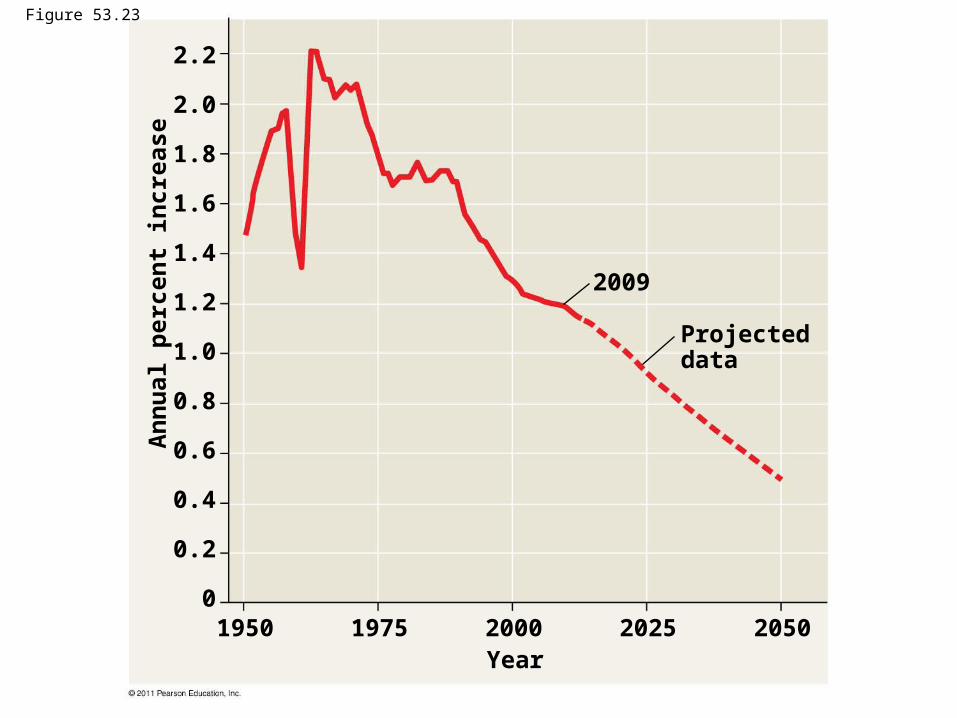
Projecteddata
2009
An
nu
al p
erce
nt
incr
ease
1950 1975 2000 2025 2050Year
2.2
2.0
1.8
1.6
1.4
1.2
1.0
0.8
0.6
0.4
0.2
0
Figure 53.23

Percent of population Percent of population Percent of population
Afghanistan United States Italy
Male Male MaleFemale Female FemaleAge85+
80–8475–7970–7465–6960–6455–5950–5445–4940–4435–3930–3425–2920–2415–1910–14
5–90–4
Age85+
80–8475–7970–7465–6960–6455–5950–5445–4940–4435–3930–3425–2920–2415–1910–14
5–90–4
10 0108 8 8 8 886 6 6 6 6 64 4 4 4 4 4222222 00
Match the country with the age-structure pyramid: US, Italy, Afghanistan

How do their growths compare?
Percent of population Percent of population Percent of population
Afghanistan United States Italy
Male Male MaleFemale Female FemaleAge85+
80–8475–7970–7465–6960–6455–5950–5445–4940–4435–3930–3425–2920–2415–1910–14
5–90–4
Age85+
80–8475–7970–7465–6960–6455–5950–5445–4940–4435–3930–3425–2920–2415–1910–14
5–90–4
10 0108 8 8 8 886 6 6 6 6 64 4 4 4 4 4222222 00
Futures Institute: Age-structure pyramids

Percent of population Percent of population Percent of population
Rapid growthAfghanistan
Slow growthUnited States
No growthItaly
Male Male MaleFemale Female FemaleAge85+
80–8475–7970–7465–6960–6455–5950–5445–4940–4435–3930–3425–2920–2415–1910–14
5–90–4
Age85+
80–8475–7970–7465–6960–6455–5950–5445–4940–4435–3930–3425–2920–2415–1910–14
5–90–4
10 0108 8 8 8 886 6 6 6 6 64 4 4 4 4 4222222 00
Futures Institute: Age-structure pyramids

Indus-trialized
countries
Indus-trialized
countries
Less indus-trialized
countries
Less indus-trialized
countries
Infa
nt
mo
rta
lity
(de
ath
s p
er 1
,00
0 b
irth
s)
Lif
e e
xpe
cta
nc
y (
ye
ars
)
60
50
40
30
20
10
0
80
60
40
20
0
Conclusions?

Per capita energy use
Gigajoules
> 300150–30050–15010–50< 10


