
ANNUAL REPORT2011
Year of changes

Basware in brief
SOLUTIONS AND SERVICES FOR AUTOMATION OF FINANCIAL PROCESSES• Solutions for invoice automation, travel management and purchase management• Offering in Automation Services: scanning, e-Invoicing, activation services, catalog management and purchase message exchange• Solutions for fi nancial management from planning to reporting• License and service based delivery modelsINTERNATIONAL SERVICE COMPANY• Offi ces in 13 countries in Scandinavia, Europe, North America and Asia-Pacifi c• Extensive partner network• Over 2,000 customer companies globally• Over 500,000 customers in Basware e-Invoicing service• Over 1 million software users globally• Solid experience• Established in 1985• Innovation of invoice processing solution as known on the markets today in 1997 • Forerunner in e-Invoicing• The company’s open network has more than 2.2 million monthly transactionsRELIABLE LISTED COMPANY• Listed on NASDAQ OMX Helsinki Ltd Mid cap• Net sales in 2011: EUR 107,750 thousand• Over 1,000 employees• Core strategy valid since 1985

Year 2011 in briefCEO s review
ProductsHuman Resources
ResponsibilityBoard of Directors
Executive TeamCorporate Governance
Financial StatementsContacts
46
101617
2022263690
Contents

annual report 20114
2007 2008 2009 2010 2011
KEY FIGURESEUR Thousand 2011 2010
Net sales 107,750 103,094 Growth of net sales % 4.5% 11.3%Operating profi t 12,280 13,487Growth in operating profi t % -8.9% 14.1%% of net sales 11.4% 13.1%Profi t before taxes 12,332 13,325% of net sales 11.4% 12.9%Profi t for the period 9,671 10,331% of net sales 9.0% 10.0%Recurring revenue, % of net sales 48.9% 44.3%Cash fl ow 15,207 12,523Return on equity 11.6% 16.7%Return on investment 14.9% 20.1%Interest-bearing liabilities 682 3 582Cash and liquid assets *) 42,977 13,822Equity ratio, % -42.3% -15.3%R&D costs 16,489 14,883% of net sales 15.3% 14.4%R&D personnel, 31 Dec 2011 311 239Personnel, 31 Dec 2011 1,182 913Earnings per share, EUR 0,76 0,90Equity per share, EUR 7,72 5,78
NET SALES (EUR THOUSAND)
*) Includes cash, cash equivalents and fi nancial assets at fair value through profi t or loss
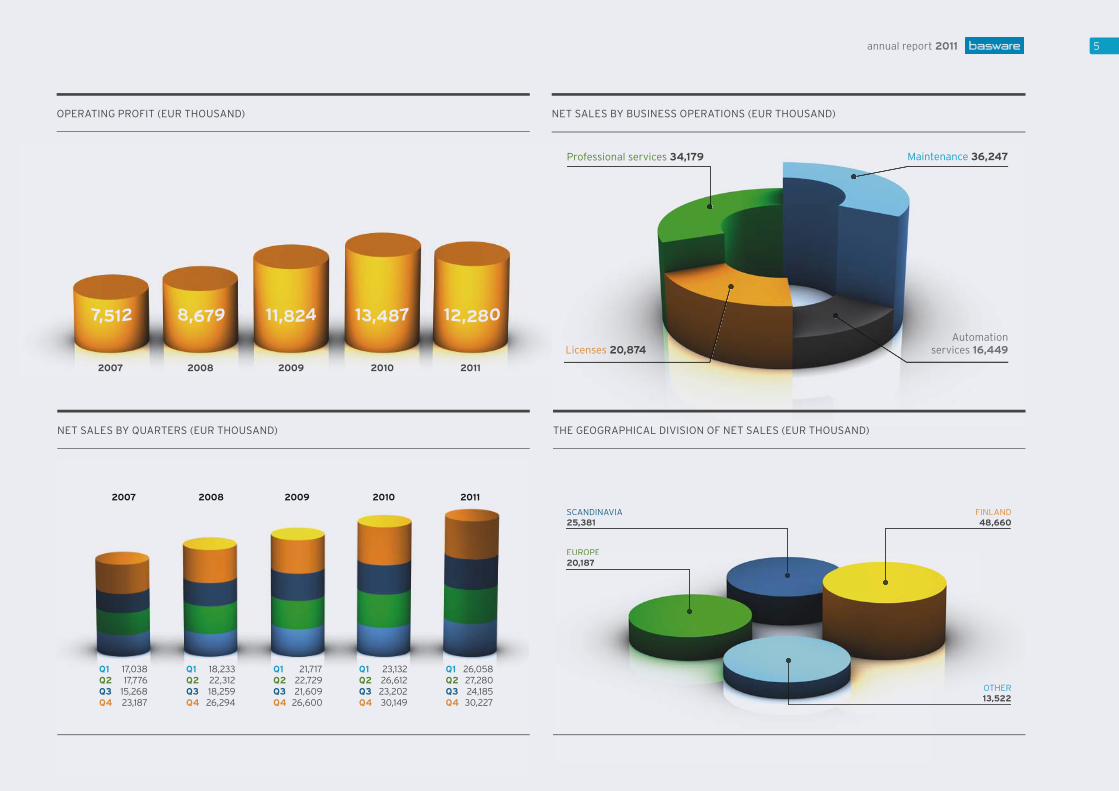
Basware’s business operations can be divided into License Sales, Maintenance, Professional Ser-vices and Automation Services. License solutions consist of Purchase to Pay (P2P) product family and only in Finland marketed fi nancial management products. Solutions can be delivered as a Service or as on-premise licenses. Reported geographical areas are Finland, Scandinavia, Europe and Other.
In 2011 net sales grew by 4.5 percent to 107,750 thousand euro. Operating profi t was 12,280 thou-sand euro and decreased by 8.9 percent. Earnings per share were 0.76 euro and decreased by 15.0 percent. At the end of 2011 the number of personnel was 1,182 and grew most in Indian offi ce in Chandigarh.
The conversion of license sales to Software as a Service (SaaS) solutions continued in 2011 and Basware Automation Services grew strongest by 32.3 percent with the share of net sales of 15.3 percent. Recurring revenue (Maintenance and Automation Services) formed 48.9 percent of net sales. Maintenance revenue grew by 8.9 percent and was 33.6 percent of net sales. Growth of Professional Services was 4.5 percent and share of net sales was 31.7 percent. License Sales dec-reased by 15.4 percent and were 19.4 percent of net sales in 2011.
Year 2011 in Brief
Transforming from a software companyto a service company
5annual report 2011
2007 2008 2009 2010 2011
Q1 17,038Q2 17,776Q3 15,268Q4 23,187
Q1 18,233Q2 22,312Q3 18,259Q4 26,294
Q1 21,717Q2 22,729Q3 21,609Q4 26,600
Q1 23,132Q2 26,612Q3 23,202Q4 30,149
Q1 26,058Q2 27,280Q3 24,185Q4 30,227
2007 2008 2009 2010 2011
FINLAND48,660
SCANDINAVIA25,381
OTHER13,522
EUROPE20,187
NET SALES BY QUARTERS (EUR THOUSAND)
OPERATING PROFIT (EUR THOUSAND) NET SALES BY BUSINESS OPERATIONS (EUR THOUSAND)
THE GEOGRAPHICAL DIVISION OF NET SALES (EUR THOUSAND)
Licenses 20,874Automation
services 16,449
Maintenance 36,247Professional services 34,179

annual report 2011 | CEO´s review6
CEO’S REVIEW
In a time of change
The year of 2011 was a year of changes. We had a stronger focus on our strategy, we rene-wed our organization and developed new services and solutions in rapidly changing market situations.
We published our revised strategy in January 2011, aiming to focus on rapid international growth. In order to facilitate growth, we arranged a directed issue of shares to selected institutional in-vestors. During the fi rst half of the year, we continued steady growth across all of our geographic segments. Our net sales increased by 7.2 percent to EUR 53.3 million. The demand shifted inc-reasingly from license sales towards Software as a Service (SaaS) solutions, and our Automation Services unit grew at a rate of 43.4 percent. Our performance during the fi rst two quarters was a good achievement in the uncertain global economy. During the latter half of 2011, uncertainty in the global economy and markets increased further, which slowed down and postponed agreements. The growth in our net sales slowed down and we were forced to issue two profi t warnings towards the end of the year. Our full-year net sales reach-ed EUR 107.8 million and our operating profi t amounted to EUR 12.3 million. Growth in net sales was 4.5 percent. Automation Services continued their favorable growth at a rate of 32.3 percent. Share of recurring revenue (Automation Services and Maintenance) continued growth and was 48.9 percent of net sales. The performance can be considered satisfactory, given the prevailing economic situation.
FOCUS ON STRATEGYWe got a new CEO in October, and in November we restructured our organization in order to focus our operations on services and boost the implementation of the strategy. The biggest change in the new organization that took effect as of the beginning of 2012 was the move from a region-
based structure to a global function-based operating method. Our product portfolio is now orga-nized according to customer segments and sizes of customer companies. Our solutions cover the entire Purchase to Pay supply chain. In 2011, we focused on seamless compatibility between Auto-mation Services and invoice automation, and 2012 will see us continuing the further development of our procurement solutions. Our operating methods and processes are harmonized across all continents and countries, and we focus on the provision of services to our customers. In 2012, we will continue the development of offshoring functions in line with our strategy. Our Indian branch has grown strongly in 2011, and we are surveying the opportunities of new business service functions and internal support functions operating from India. We are also exploring new geographic areas.
Acquisitions have a signifi cant role in our international growth. During 2011, we have actively sur-veyed the markets, and we will continue surveying opportunities for acquisitions in 2012 in order to complement the offering of our e-Invoice service. The signifi cance of the service business will increase further. We are undergoing a strong transformation phase from a software company into a service company, which will change our operating methods, solutions, and services. We operate profi tably in everything we do.
The offering of the Automation Services unit has been expanded, and in 2011 we launched a so-lution for outsourcing the accounts payable process called InvoiceOut. Automation Services is our fastest-growing unit, and our aim is for the transaction volumes transmitted by Automation

7annual report 2011 | CEO´s review
Services to increase. Transactions include invoices and purchase messages as well as product and service catalogs. EU-level measures to promote e-Invoicing have also contributed to the de-velopment of the unit. The objectives of the European e-Invoicing Service Providers Association include creating a cooperative e-Invoicing ecosystem and promoting the extensive adoption of e-Invoicing. The European Commission aims for e-Invoicing to be the primary payment method in Europe by 2020. Our customer is at the core of everything, and we revised our pricing model to be fl exible ac-cording to the customer’s needs. Software solutions are available to customers with a one-time license fee, monthly pricing, or according to the SaaS model.
We have a solid strategy. Our solution and service offering is unique and competitive. We are agile, and our employees are talented and competent. Our aim is to become the world’s leader in e-Invoices.
Esa TihiläCEO
7annual report 2011 | CEO´s review
messages as well as productave also contributed to the de-Service Providers Association
ting the extensive adoption ofthe primary payment method
ricing model to be fl exible ac-e to customers with a one-time
ue and competitive. aim is to become

Products and services

annual report 2011 | products and services10
Basware’s R&D personnel number a total of 311 in Espoo, Tampere, Pori, and India, accoun-ting for 26.3 percent of the company’s personnel. The fastest-growing unit in terms of per-sonnel was the Indian offi ce in Chandigarh.
Users’ expectations and requirements for the products have recently increased signifi cantly, and in 2011 the company focused on the development of the user experience and new concepts in cooperation with customers and other stakeholders. Particular focus on quality and customer satisfaction also continued during 2011. The focus of the R&D unit was also increasingly on rese-arch to keep the products at the high end of technology and market development. Basware has fi ne-tuned the R&D unit’s processes, models and methods to be seamlessly compatible, and the unit works in all of the phases of the R&D chain with top-notch professionals. The R&D unit closely observes external, rapidly changing trends. The company reacts to new trends in an agile way and adjusts its operations accordingly. The development of cloud services continued in 2011, while mobile and tablet solutions became even more important targets for development. The long-term work of the R&D unit is not left unnoticed, and the Global Finance magazine chose Basware as the best provider of invoice automation solutions for the second year in a row in 2011. Basware ranks number one also in a comparison of the world’s best procurement systems. A leading industry analyst mentions Purchase to Pay solutions and the strategy of open networks as Basware’s strengths and particularly praises Basware for the possibility of integrating the solu-tions, extensive support for various product categories in the procurement system, and supplier activation.
World Class Research and Development
AUTOMATION SERVICESBasware has extensive experience in developing invoice automation services. Automation Servi-ces increase the level of automation of customer companies’ invoice processing and make paper invoices and purchase documents obsolete. The increase in the degree of automation lowers the costs of the organization’s invoice processing.
Scan and Capture servicesWith Basware’s outsourced Scan and Capture services, a company can immediately transfer to receiving all invoices as e-Invoices. Paper invoices are sent to a service center where they are scanned into electronic format, and the information on the invoice is recognized by software. Bas-ware then sends the invoices to the customer company’s invoice processing system electronically.
E-InvoicingE-Invoicing refers to the electronic transmission of invoice data from the seller to the customer. E-Invoices can be sent to companies and consumers. An e-Invoice includes the same information as a paper invoice, presented as an image and data fi elds in the XML format. The seller and the customers can process e-Invoices in their own invoice processing systems.
CatalogsBasware offers product catalog management as a service to its customers. This includes tools for both suppliers and purchasers. Catalog management tools offer a diverse set of features – for the supplier, composing and sending product catalogs to customers and for the customer, compa-ring, editing and approving catalogs. Basware’s all-in-one service also includes supplier activation services that support the purchaser customer in supplier communication and consultation with regard to product catalogs.
Activation servicesWith its supplier activation service, Basware helps suppliers and their customers to join the elec-tronic supply chain. The supplier can send paper invoices to Basware’s Scan and Capture service where they are scanned into electronic format and transmitted to the customer company. The supplier can also send genuine e-Invoices to the customer via Basware’s Business Transactions service, send invoices in the Basware Supplier Portal or integrate into the transaction chain using the solution of Basware’s e-Invoicing partner. Activation services cover both supplier and custo-mer activation.
11annual report 2011 | products and services
Printing servicesWith Basware’s outsourced printing service, the invoices of a supplier company can be sent on paper to those customer companies that are unable to receive e-Invoices. Basware generates an image of the electronic invoice, prints it and mails it to the customer company. The printing servi-ce is scalable according to the number of invoices.
Exchange of purchase messagesSeveral documents are exchanged between the seller and the customer in the purchase process. Basware Automation Services transmit purchase orders and invoices, receives order confi rma-tions and sends product catalogs.
InvoiceReadyInvoiceReady is an invoice automation solution for small and medium-sized enterprises. Invoice-Ready facilitates completely paperless and electronic invoice processing without the customer company having to invest in hardware or software. InvoiceReady includes the automatic proces-sing of purchase invoices, recurring invoice matching, order and purchase invoice matching, solu-tion to make travel management more effi cient, and electronic archiving. InvoiceOutInvoiceOut is an accounts payable process outsourcing solution offered as a service. The service integrates a purchase invoice processing solution, software maintenance, outsourced Scan and Capture service, e-Invoices and invoice data content checking service. InvoiceOut includes the maintenance of invoice automation software in the SaaS environment, guaranteeing a scalable and cost-effi cient business environment.
PURCHASINGBasware Purchase Management solution offers the customer ways to make procurement compre-hensively more effi cient. The solution includes a purchase management, contract lifecycle mana-gement, RFx tendering tool and product catalog management.
Purchase Management solutionThe different phases of the operational purchase process can be managed with the Basware Pur-chase Management solution. The solution provides transparency and control throughout the pur-chase process. Organizations can decentralize the processing of purchase proposals while utili-zing the negotiated contracts in a centralized way. Purchases are forwarded to customer-specifi c catalogs and contracts to ensure contract prices and utilization of any discounts and terms and conditions of delivery and payment. Purchase Management solution is suited for organizations of all sizes.
Contract Lifecycle ManagementBasware Contract Lifecycle Management allows a company to centralize all of its contract mana-gement into a single safe and user-friendly system. The CLM system covers the entire lifecycle of the contract and is suited for managing customer, supplier as well as partnership agreements. The CLM system integrates directly with Basware Purchase Management, thereby enabling the practical implementation of purchase agreements in the organization.
RFx tendering toolBasware RFx Management is an electronic tendering solution. All of the phases associated with tendering and related documents can be automated and managed with Basware RFx. It also makes it possible to obtain information on the timetables of tendering projects.
CatalogsBasware offers product catalog management as a service to its customers. This includes tools for both suppliers and purchasers. Catalog management tools offer a diverse set of features – for the supplier, composing and sending product catalogs to customers and for the customer, compa-ring, editing and approving catalogs. Basware’s all-in-one service also includes supplier activation services that support the purchaser customer in supplier communication and consultation with regard to product catalogs.
annual report 2011 | products and services12
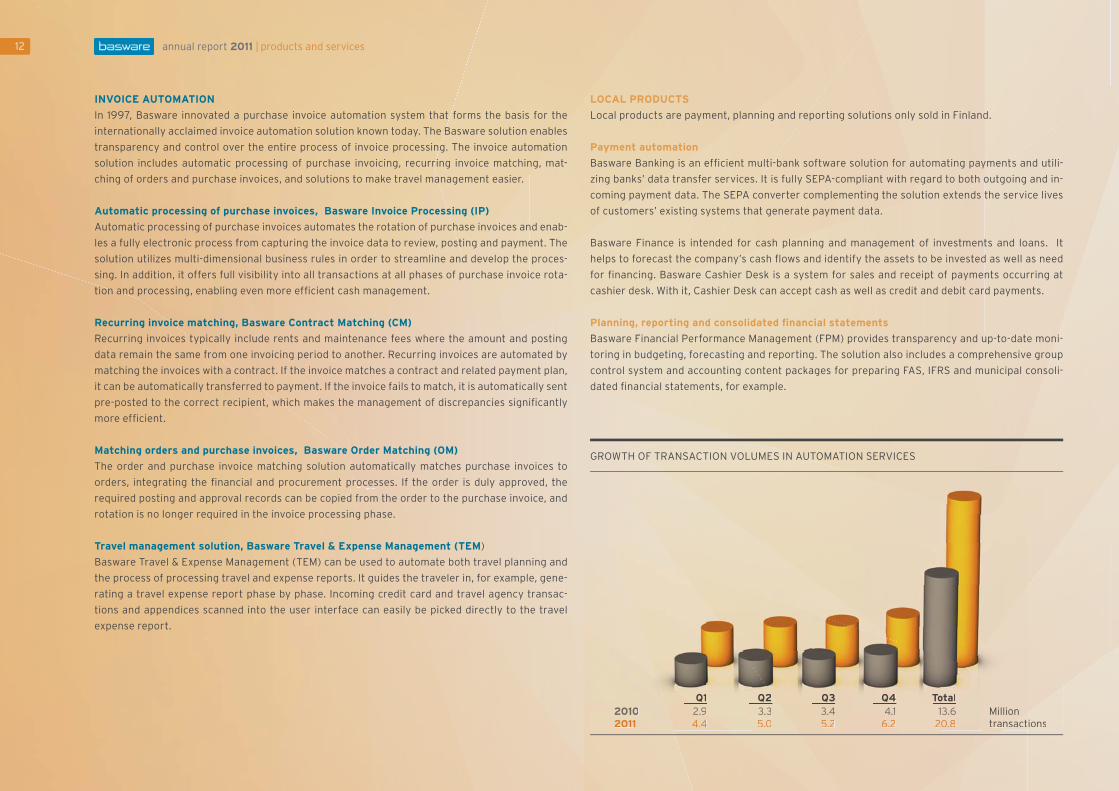
Millionionsnsacttransa
20102011
13.620.8
Total4.1
6.2
Q43.45.2
Q33.35.0
Q22.92.94.4
Q1
INVOICE AUTOMATIONIn 1997, Basware innovated a purchase invoice automation system that forms the basis for the internationally acclaimed invoice automation solution known today. The Basware solution enables transparency and control over the entire process of invoice processing. The invoice automation solution includes automatic processing of purchase invoicing, recurring invoice matching, mat-ching of orders and purchase invoices, and solutions to make travel management easier.
Automatic processing of purchase invoices, Basware Invoice Processing (IP)Automatic processing of purchase invoices automates the rotation of purchase invoices and enab-les a fully electronic process from capturing the invoice data to review, posting and payment. The solution utilizes multi-dimensional business rules in order to streamline and develop the proces-sing. In addition, it offers full visibility into all transactions at all phases of purchase invoice rota-tion and processing, enabling even more effi cient cash management.
Recurring invoice matching, Basware Contract Matching (CM)Recurring invoices typically include rents and maintenance fees where the amount and posting data remain the same from one invoicing period to another. Recurring invoices are automated by matching the invoices with a contract. If the invoice matches a contract and related payment plan, it can be automatically transferred to payment. If the invoice fails to match, it is automatically sent pre-posted to the correct recipient, which makes the management of discrepancies signifi cantly more effi cient.
Matching orders and purchase invoices, Basware Order Matching (OM)The order and purchase invoice matching solution automatically matches purchase invoices to orders, integrating the fi nancial and procurement processes. If the order is duly approved, the required posting and approval records can be copied from the order to the purchase invoice, and rotation is no longer required in the invoice processing phase.
Travel management solution, Basware Travel & Expense Management (TEM)Basware Travel & Expense Management (TEM) can be used to automate both travel planning and the process of processing travel and expense reports. It guides the traveler in, for example, gene-rating a travel expense report phase by phase. Incoming credit card and travel agency transac-tions and appendices scanned into the user interface can easily be picked directly to the travel expense report.
LOCAL PRODUCTSLocal products are payment, planning and reporting solutions only sold in Finland.
Payment automationBasware Banking is an effi cient multi-bank software solution for automating payments and utili-zing banks’ data transfer services. It is fully SEPA-compliant with regard to both outgoing and in-coming payment data. The SEPA converter complementing the solution extends the service lives of customers’ existing systems that generate payment data.
Basware Finance is intended for cash planning and management of investments and loans. It helps to forecast the company’s cash fl ows and identify the assets to be invested as well as need for fi nancing. Basware Cashier Desk is a system for sales and receipt of payments occurring at cashier desk. With it, Cashier Desk can accept cash as well as credit and debit card payments.
Planning, reporting and consolidated fi nancial statementsBasware Financial Performance Management (FPM) provides transparency and up-to-date moni-toring in budgeting, forecasting and reporting. The solution also includes a comprehensive group control system and accounting content packages for preparing FAS, IFRS and municipal consoli-dated fi nancial statements, for example.
GROWTH OF TRANSACTION VOLUMES IN AUTOMATION SERVICES

13annual report 2011 | products and services
Scan andcapture
E-Invoicing CatalogManagement
ActivationServices
PurchaseMessageExchange
PrintingServices
InvoiceReady
InvoiceOut
Software as a Service (SaaS)Basware Connectivity
Offering
SUPPLIER
CUSTOMER
Purchase Management RFxManagement
ContractLifecycle
Management
PurchaseManagement
Software Products
On-premise License orSaaS Service Delivery
Invoice AutomationOrder
MatchingInvoice
ProcessingContract
Management
Local ProductsPayment Planning
and Reporting On-premise License Delivery
BASWARE OFFERING PRODUCTS AND SERVICES DELIVERY MODELP
rofessional Services and M
aintenance Offerings
covering all Basw
are solutions


Human Resources

annual report 2011 | HR and responsibility16
Service company with talented employees
2007 2008 2009 2010 2011
NUMBER OF PERSONNEL
GEOGRAPHICAL DIVISION OF PERSONNEL
Northeast459
dinaviaScand122
uropeEuroE34131
Other72
India395
During 2011, the number of Basware personnel increased by 269, resulting in a staff of 1,182 at year’s end. International operations continued their growth, and 61.2% of the employees worked outside Finland in international units, while 38.8% worked in Finland. Operations in India conti-nued to grow, and several Basware units have expanded their operations there. The number of Automation Services, Professional Services and support personnel in India increased quickly. The Indian offi ce in Chandigarh is the company’s second-largest offi ce after the Espoo headquarters. In 2011, 55.7 percent of personnel worked in Consulting and Services, 26.3 percent worked in Soft-ware Production, 11.3 percent in Sales and Marketing, and 6.8 percent in Administration. The company’s extensive international operations facilitate internal job rotation between offi ces in different countries, and the employees were increasingly encouraged to grasp these opportu-nities in 2011. Also, internal job rotation was utilized in connection with the organization change in November 2011, allowing the employees to learn and develop. This makes it possible to spread knowledge between various units and strengthen the competence of the personnel. In accordance with the new organization model, the HR unit works in a decentralized way, both internationally and locally, close to the employees. This ensures harmonized operating methods and processes across all offi ces.
2011 was a busy year in terms of training. Various sales and consultation academies, a number of separate product trainings and supervisor training courses were arranged during the year. The company adopted the Career Framework planning model in the fi rst units, Professional Services and Support Services, at the beginning of 2012. Career Framework supports the employee’s per-sonal development as well as career planning. The Career Framework model is used for charting one’s career desires and opportunities, the required areas of development and the schedule. The model will be adopted in phases across other units as well during 2012.
In 2012, Basware will increasingly focus on the service business in accordance with its strategy, requiring new ways of working and competence from the employees. During the transition phase, the HR unit will assist the staff in planning the acquisition of new required skills and knowledge. The company emphasizes the way of working complying with its values and open communication.

17annual report 2011 | HR and responsibility
BACHELOR32,7%
MASTER27,8%
COLLEGE AND OTHER39,3%
ACT WITH COURAGE BUILD ON RESPECT
BE PROFESSIONAL AIM FOR ACHIEVEMENT
EDUCATIONAL BACKGROUND
EMPLOYMENT DURATION
Less than 1 year32,3%
Over 11 years7,8%
9-10 years7,2%
7-8 years5,2%
1-2 years22,5%
3-4 years16,2%
5-6 years8,8%
Responsibility
Basware complies with high business ethics, company values and required legislation. The com-pany is committed to fi nancial as well as social and environmental responsibility in all operations. The responsibility of the employees is emphasized further as the company is increasingly trans-forming into a service company. From the environmental perspective, our solutions in part promote the reduction of offi ce waste and the transition towards a paperless offi ces in thousands of companies worldwide. Our fi nan-cial profi tability brings value to our stakeholders while supporting our environmental and social responsibility.
The company also cooperates with the Plan Finland charity foundation, and the company has 15 sponsored children around the world. The company also sponsors the conservation of the Baltic Sea. The Art of Basware contest for young artists has become increasingly popular, and the number of entries in 2011 was record-high. The theme for the 2012 contest is “relationships”.
AUDIT OF THE ENVIRONMENTAL SYSTEMBureau Veritas Certifi cation has audited Basware Corporation’s offi ces in Espoo, Oulu, Pori, and Tampere, and given them ISO 14001:2004 certifi cation on August 8, 2011.
BASWARE VALUES


19annual report 2011 | board of directors
Corporate Governance

annual report 2011 | board of directors20 annual report 2011 | board of directors20
PenttiHeikkinen
HannuVaajoensuu
EevaSipilä
SakariPerttunen
IlkkaToivola
Board of Directors

21annual report 2011 | board of directors
HANNU VAAJOENSUU
Born 1961 Member of the Board since 1990, Chairman of the Board 2005–MSc (Econ)
Key working experience: Basware Corporation: CEO 1999-2004, Partner, Executive Director 1991-1999, consulting positions in the company 1987-1991
Positions of trust:Chairman of the Board: Dovre Oyj, Havacment, Nervogrid OyMember of the Board: Comptel Oyj (deputy chairman), Fenno Kvantum Oy, Inventure Oy, Movenium, Profi t Software Oy, The Federation of Finnish Technology Industries, The Federation of Finnish Technology Industries/Information Technology
PENTTI HEIKKINEN
Born 1960Member of the Board since 2009MSc (Econ), Stanford Graduate School of Business (Stanford Execu-tive Program 2001)
Key working experience: Gateway Technolabs Finland Oy: Founder and CEO 2008-TietoEnator Oyj: President and CEO 2006-2007, Chief Operating Offi cer 2004-2005, President in Telecom & Media Division 2001-2003, President in Services Division 1999-2000, President in Public Administration Division 1996-1998VTKK Government Systems Ltd: Managing Director 1994-1995 CapGemini Finland: Director 1991-1993 VTKK Group: Director 1987-1990, Management Consultant 1985-1986
Positions of trust: Member of the Board: Aditro Oy AB, Hammerkit Oy, Technotree Oyj, Nordea Bank Finland Oyj (Member of Advisory Board)
SAKARI PERTTUNEN
Born 1957Member of the Board 1993-2004, 2008 -MSc (Econ) Key working experience: Basware Corporation: CFO 2004-2007, Vice President IT 2001-2003, Vice President Development 1999-2000, specialist and management positions at Basware 1987-1998
Positions of trust: Chairman of the Board: Movenium
EEVA SIPILÄ
Born 1973Member of the Board 2010-M.Sc. (Econ.), CEFA
Key working experience:Cargotec: Executive Vice Presi-dent and CFO 2008-, Senior Vice President, IR & Communications 2005-2008Metso Corporation: Vice President, Investor Relations 2002-2005Mandatum Stockbrokers Ltd (Sampo Bank plc): Equity Analyst 1999-2002
ILKKA TOIVOLA
Born 1963Member of the Board since 2008MSc (Tech)
Key working experience:Proha Oyj: CEO 2009-2011Nokia Siemens Networks: Head of Global Sales, Business Support Systems 2007-2009 Nokia Networks: Various executive and managerial level positions in 2000-2007 Hewlett-Packard Company: Various executive and managerial level positions in 1989-2000
of Ad

annual report 2011 | executive team22
PEKKA LINDFORS Senior Vice President, Volume Sales
Born 1966, Helsinki School of Economics, studentAt Basware since 2004, Member of Basware Executive Team since 2011
Key working experience:Basware Corporation: Senior Vice President Volume Sales 2012-, Se-nior Vice President Northeast 2011, Sales Director 2008-2009, Director Global Marketing 2007-2008 Basware Oyj: Senior Vice President Northeast, 2011-Sales Director, 2008-2010Director, Global Marketing 2007-2008Marketing Diriector 2006-2007Business Unit Manager 2004-2006Novo Group Oyj: Marketing Director 1998-2004, various positions in sales and fi nancials 1993-1998
ESA TIHILÄ CEO
Born 1964, College Graduate (Econ), eMBAAt Basware since 2004, Member of Basware Executive Team 2005
Key working experience: Basware Corporation: CEO 10/2011-Senior Vice President, Automation Services 2009-2011Senior Vice President, Europe and Asia-Pacifi c 2009-2010General Manager, Europe and Ame-ricas 2006-2008 Senior Vice President, Global Opera-tions, 2005-Meridea Financial Software: CEO 2001-2004iCL PLC: Group Executive Director 2001, Global Director, e-Business 1999-2001iCL Data Oy: Director, e-Business 1997-1998, Business Development Director 1995-1996
Positions of trust:Futurice Oy: Member of the Board 2011-The Finnish Orienteering Federati-on: Member of the Board 2008-
STEVE MUDDIMAN Senior Vice President, Global Marketing
Born 1961, University Graduate (Comms)At Basware since 2008, Member of Basware Executive Team since 2008
Key working experience:Basware Corporation: Senior Vice President Global Marketing 2008- VMware Inc.: Director of Field and Corporate Marketing, Europe, Mid-dle East & Africa 2006-2008 Ariba Inc. Vice President, Marketing and Strategy, Europe, Middle East & Africa 2001-2005Hewlett-Packard Inc: Various Ge-neral Management and Marketing Management positions 1989-2000
MATTI RUSI Senior Vice President, Support
Born 1963, MBA At Basware since 2010 and 1997-2008, Member of Basware Executi-ve Team since 2010
Key working experience: Basware Corporation: Senior Vice President Support 2012-, Senior Vice President Europe 2010-2011 Profi t Software Oy:COO 2008-2009Valimo Wireless Oy: CEO 2008Basware Oyj: Senior Vice President, Finland 2005-2008President & Country Manager of Basware, Inc. 2003-2004Senior Vice President, e- Flow Busi-ness Unit 2000-2002Area Manager, Benelux Countries 1999-2000Project Manager 1997-1999
MARI HEUSALA Senior Vice President, HR&Dev
Born 1966, M.Sc. (Econ)At Basware since 2009, Member of Basware Executive Team since 2011
Key working experience:Basware Corporation: Senior Vice President, HR&Dev 2012-, Vice Presi-dent, HR&Dev 2009-2011Nokia Oyj: Various executive and managerial HR positions 1997-2009Northrop Grumman International Aircraft Inc: Project Coordinator 1993-1996

23annual report 2011 | executive teamannual report 2011 | executive team
SteveMuddiman
PekkaLindfors
EsaTihilä
Executive Team
MariHeusala
MattiRusi
annual report 2011 | executive team24 annual report 2011 | executive team24
MattiCopeland
MikaHarjuaho
JukkaVirkkunen
JormaKemppainen
RikuRoos
Executive Team

25annual report 2011 | executive team 22511 | executive team
JORMA KEMPPAINEN Senior Vice President, Products
Born 1965,M.Sc. (Tech)At Basware since 2009, Member of Basware Executive Team since 2009
Key working experience:Basware Corporation: Senior Vice President Products 2009- Inno-rd Oy: Managing Director and executive level consultant 2009 Suunto Oy: Direictor, R&D 2005-2009SSH Communications Corporation Oyj: Vice President, R&D and Custo-mer Services 2003-2005F-Secure Oyj: Vice President, R&D 2000-2003Tellabs Oy: Customer Training Manager 1996-2000, various R&D positions 1993-1996ICL Oy: Various R&D positions 1987-1993
RIKU ROOSSenior Vice President, Automation Services
Born 1960, M.Sc. (Tech)At Basware since 2007, Member of Basware Executive Team since 2012
Key working experience:Basware Corporation: SVP, Automa-tion Services 2012-VP, EPP Automation Services 2009-2011Basware Inc: VP and Country Mana-ger 2007-2009Meridea Financial Software (Finland, Singapore): EVP 2000-2007Nokia Corporation: Global Head of Services Hosting 1999-2000Cap Gemini Oy: Director 4/1999-12/1999Deutsche Bank, Head Offi ce (Ger-many, Frankfurt): Global Relation-ship Manager for Private Banking 1998-1999, Regional Head of IT Infrastructure 1997-1998Microsoft AB (Sweden): Various managerial positions 1993-1997
MATTI COPELAND Senior Vice President, Strategy
Born 1961, M.Sc. (Econ), Stanford Graduate School of Business (Stan-ford Executive Program 2000)At Basware since 2011, Member of Basware Executive Team since 2011
Key working experience:Basware Corporation: Senior Vice President Strategy 2012-, Senior Vice President M&A/IR 2011 Basware Oyj: Member of the Board 2008-2011August&Bob: Managing Partner 2007-2009Deloitte: Partner, M&A Adviso-ry 2005-2007CapMan Capital Management: In-vestment Director Buyout Business Unit 2002-2005Aura Capital: Managing Director 2001-2002Jippii Group: Managing Director 2001-2001Leonia/Sampo: Executive Vice President, Large Corporate Clients 1998-2001KANSALLIS-OSAKE-PANKKI/Merita/Merita-Nordbanken: Head of Debt Capital Markets1988-1998Citibank New York: Manager 1986-1988. Positions of trust Alekstra Oy: Chairman of the Board 2009-Vergo Oy: Chairman of the Board 2011-
MIKA HARJUAHO CFO
Born 1966, M.Sc. (Econ)At Basware since 2007, Member of Basware Executive Team since 2007
Key working experience: Basware Corporation: CFO 2007-Suunto Oy: CFO 2001–2007Ericsson AB: Regional Controller 2000-2001Oy LM Ericsson AB: Profi t Center Controller 1997-2000Suomen Unilever Oy Van den Bergh Foods: Controller 1996-1997Unilever Nederland B.V.: Internal Auditor 1995-1996 Suomen Unilever Oy Lever: Cost Accountant 1994-1995
JUKKA VIRKKUNEN Senior Vice President, Enterprise Sales
Born 1960, College Graduate (Econ) At Basware since 2006, Member of the Board since 2006
Key working experience: Basware Corporation: Senior Vice President, Enterprise Sales 2012-Senior Vice President, Scandinavia 2010-2011Senior Vice President, Northeast 2006-2010Capgemini Finland Oy Technology Services: Unit Manager 2004-2006Ementor Oy: Sales Manager 2002-2003Fujitsu Services Oyj: Marketing Manager for the Nordic Countries 2000-2002iCL Data Oy e-Business: Sales Direc-tor 2000-1997, Account Manager 1997-1996
Positions of trust: Helsinki Region Chamber of Com-merce: Member of ICT Committee 2006-

annual report 2011 | corporate governance26
GENERAL PRINCIPLES Basware Corporation is a public limited company registered in Finland and its head offi ce is lo-cated in Espoo, Finland. Basware Group (Basware) is comprised of the parent company Basware Corporation, its one Finnish subsidiary and 9 foreign subsidiaries.
Decision-making and governance at Basware comply with the company’s Articles of Association, the Finnish Companies Act, and other applicable legislation. In addition, the company complies with the recommendations of NASDAQ OMX Helsinki Ltd, the Central Chamber of Commerce of Finland and the Confederation of Finnish Industries EK on corporate governance with the excep-tions mentioned in these principles, as well as NASDAQ OMX Helsinki Ltd’s Guidelines for Insiders. The subsidiaries comply with local legislation.
Basware complies with the Finnish Corporate Governance Code published by the Securities Mar-ket Association with the following exception: Basware’s Board of Directors does not have separate committees as the extent of the company’s operations and the size of the Board of Directors do not require matters to be prepared by a body smaller than the entire Board of Directors.
TASKS AND RESPONSIBILITIES OF BODIES The General Meeting of Shareholders, Board of Directors and CEO are in charge of the manage-ment of Basware Group, and their tasks are determined as specifi ed by the Finnish Companies Act. The CEO is in charge of Group-level operational activity, assisted by the group’s Executive Team.
GENERAL MEETING The Annual General Meeting is the highest decision-making body of the company. The Annual Ge-neral Meeting is arranged once a year on the date determined by the Board of Directors within six
months of the end of the fi nancial period. Extraordinary General Meetings can be arranged during the year, if necessary. In accordance with the Articles of Association, the General Meeting is held in the company’s registered offi ce Espoo, Helsinki or Vantaa. A Summons to a General Meeting of Shareholders and the matters to be discussed in the meeting is issued in a newspaper announce-ment placed in at least one Finnish-language national daily newspaper and published as a stock exchange release and on the company’s website.
The Annual General Meeting each year resolves the following matters: • approval of the income statement and balance sheet • measures occasioned by the profi t or loss shown in the approved balance sheet • discharging members of the Board of Directors and the CEO from liability • number of Board members and their appointment • election of the auditor • remuneration of the Board of Directors and auditors • other matters mentioned in the summons to the meeting
BOARD OF DIRECTORS The Board of Directors of Basware Corporation is responsible for the Company’s management and the appropriate arrangement of its operations. The Board supervises the Company’s ope-rations and management and decides on signifi cant matters concerning the Company strategy, organization, fi nancing and investments. The essential duties and responsibilities of the Board are defi ned primarily by the Articles of Association and the Finnish Companies Act. The Board annually ratifi es a working order that specifi es the meeting procedure of the Board of Directors and its tasks.
In 2011, Basware’s Board of Directors had six members: Hannu Vaajoensuu (Chair), Matti Copeland (resigned on January 24, 2011), Pentti Heikkinen, Sakari Perttunen (Vice Chair), Eeva Sipilä, and Ilkka Toivola. The Board of Directors convened 18 times and the attendance rate was 96.7%.
IN ACCORDANCE WITH THE WORKING ORDER, THE TASKS OF THE BOARD OF DIRECTORS ARE TO • assume responsibility for tasks specifi ed as obligatory for the company’s Board of Directors by the Finnish Companies Act, the Articles of Association or elsewhere • approve the company’s strategy and objectives • approve the company values and ethical principles • approve the company’s management system and organizational structure • approve the operating plan and essential changes to it • approve the company’s internal control and risk management policies and enforce them • approve the interim reports, fi nancial statements and annual report • assume responsibility for communications related to fi nancial market outlook • approve the company’s fi nancing policy
BASWARE CORPORATION
Corporate Governance Statement 2011
This Corporate Governance Statement has been composed in accordance with Recommen-dation 51 of the new Corporate Governance Code and Chapter 2, Section 6 of the Finnish Securities Market Act. The Corporate Governance Statement is issued separately from the company’s annual report.

27annual report 2011 | corporate governance
• assume responsibility for the development of the company’s market value and specify the company’s dividend policy • approve company and business acquisitions and divestments and signifi cant individual investments and contingent liabilities • approve the company’s incentive system and policy • appoint and discharge the company’s top management and decide on their terms of employment and remuneration • decide on appointing a deputy for the President • decide on the founding of subsidiaries • assume responsibility for the development of the company’s Corporate Governance • review the operation of the Board of Directors annually • review the CEO’s operation and provide feedback
in accordance with the Articles of Association, the Basware Board of Directors has a minimum of four and a maximum of eight regular members. The Board members are elected by the Annual General Meeting for one term of offi ce at a time. The term of offi ce begins at the end of the Gene-ral Meeting that elected the Board and expires at the end of the fi rst Annual General Meeting of Shareholders following the election. The Articles of Association place no restrictions on the power of the General Meeting to elect members for the Board of Directors. The Board of Directors elects a Chair and a Vice Chair from among its members, and the Board of Directors is deemed to have a quorum present when half of its members are present. In addition to matters to be resolved, the Board of Directors is given real-time information on the operation, fi nancial standing and risks of the group in the meetings. The Board of Directors con-venes once monthly according to an agreed schedule, in addition to which the Board of Directors convenes when necessary. Minutes are kept for all meetings.
CEO The Board of Directors appoints the CEO. The CEO is in charge of the management of the company’s business operations and governance in accordance with the Articles of Association, the Finnish Companies Act and the instructions given by the Board. The CEO is assisted in the management of the group by the Executive Team. Ilkka Sihvo acted as the CEO of the company between January 1, 2011 and October 16, 2011, and Esa Tihilä from October 17, 2011 to December 31, 2011.
BASWARE EXECUTIVE TEAM, BET The Group’s Executive Team is appointed by Basware’s Board of Directors. The Group’s Executive Team assists the CEO in the operative management of the Company, pre-pares matters handled by the Board and the CEO as well as plans and monitors the operations of the business units. The Executive Team convenes once a month. The CEO acts as chairman of the Executive Team.
Members of Basware’s Executive Team were from January 1, 2011 Ilkka Sihvo, CEO January 1, 2011 – October 16, 2011; Esa Tihilä, CEO October 17, 2011 – December 31, 2011 and Senior Vice President, Automation Services January 1, 2011 – October 16, 2011; Mika Harjuaho, CFO; Mari Heusala, Vice President, HR&Dev; Olli Hyppänen, Senior Vice President, Strategy and Global Operations; Jorma Kemppainen, Senior Vice President, Products; Pekka Lindfors, Senior Vice President, NorthEast; Steve Muddiman, Senior Vice President, Global Marketing; Matti Rusi, Senior Vice President, Eu-rope; Ari Salonen; General Manager, North America; and Jukka Virkkunen, Senior Vice President, Scandinavia. From January 25, 2011, Matti Copeland, Senior Vice President, M&A, IR, was also a member of the Executive Team. Matti Copeland resigned from Basware’s Board of Directors on January 24, 2011.
INTERNAL AUDIT The Group’s internal audit assesses and ensures the suffi ciency and effectiveness of the Group’s internal control. It also assesses the effi ciency of different business processes, suffi ciency of risk management and compliance with internal guidelines. Internal audit services are mainly acquired from an external and independent service supplier selected by the Board of Directors of Basware Corporation, supplemented by the company’s in-house resources as applicable.
The Group’s internal audit is independent of Basware’s business units and other units. It reports to the Group’s Board of Directors and, in an administrative sense, to the CEO. The CFO coordinates internal audit activities. The work description, authority and responsibilities of the Group internal audit are specifi ed in the Internal Audit Charter. The Board of Directors approves the Internal Audit Charter and the annual risk-based audit plan.
EXTERNAL AUDIT According to the Articles of Association, Basware Corporation has a minimum of one and a ma-ximum of two auditors appointed by the Annual General Meeting, at least one of which is a fi rm accredited by the Central Chamber of Commerce (Authorized Public Accountants). Additionally, the company has a minimum of one and a maximum of two deputy auditors. The auditors are elected until further notice. The Board’s proposal for the auditor is disclosed in the notice of the General Meeting. The primary function of audit is to verify that the Financial Statements give ac-curate and adequate information about Basware Corporation’s result and fi nancial position for the fi nancial period. In addition, the Auditors report to the Board of Directors on the ongoing auditing of administration and operations. In 2011, Basware’s auditor was Ernst & Young Oy, Authorized Public Accountants, with Heikki Ilkka, A.P.A., as the auditor in charge. Terhi Mäkinen, A.P.A., was the deputy auditor.

annual report 2011 | corporate governance28
Internal control and risk management systems associated with fi nancial reporting
The ultimate responsibility for accounting and fi nancial administration lies with Basware Corporation’s Board of Directors. The Board is responsible for internal control, and the CEO is res-ponsible for the practical arrangements and monitoring of the control system. The steering and monitoring of business operations is based on the reporting and business planning system covering the entire Group. The CEO and CFO give both Board and Executive Team meetings presentations of the Group’s situation and development based on monthly reports.
RISK MANAGEMENT AND INTERNAL AUDIT SYSTEM The Group’s risk management is guided by legal requirements, business requirements set by the shareholders as well as the expectations of the customers, personnel and other important sta-keholders. The goal of risk management is to systematically and extensively identify and ackno-wledge the risks involved in the company’s operations as well as to make sure that the risks are appropriately managed when making business decisions.
The company’s risk management supports the attainment of strategic goals and ensures the conti-nuity of business operations. Basware takes risks that are a natural part of its strategy and objecti-ves. The company is not ready to take risks that might endanger the continuity of operations or that are uncontrollable or that can signifi cantly harm the company’s operations.
In accordance with the company’s risk management policy, risks are divided into six categories: risks related to business operations, products, personnel as well as legal, fi nancial and data se-curity risks. Responsibilities of risk management follow the distribution of liability throughout the organization and operations. Each group has a designated person in charge. In the process of risk management, the goal is to identify and evaluate the risks, after which a risk-specifi c plan is drawn up and concrete action is taken. Such actions may include avoiding the risk, diminishing the risk by different means or transferring the risk by insurance or agreements. The company has created a crisis communication plan as a part of its risk management process.
In accordance with Basware’s risk management process, the Board of Directors receives once a year a summary of the most signifi cant risks discovered during the assessment of risks. The Board analyses the risks from the point of view of shareholder value. According to the reporting con-forming to the risk management process, the most signifi cant risks in 2011 that have come to the Board’s knowledge are associated with ensuring product leadership and maintaining the company’s competitiveness in the changing competitive situation, improving new customer acquisition and increasing the transaction volume of the e-invoicing business, increasingly extensive utilization of the cost benefi ts offered by offshoring sites in business and support processes to improve profi -tability, successful preparation and implementation of merger and acquisition projects, strengthe-
ning the position of intellectual property rights as well as the measurement of signifi cant balance sheet items and impairment testing.
Internal control is a process performed by the organization’s Board of Directors, acting mana-gement and other employees to obtain a reasonable certainty of the attainment of goals. The framework of internal control at Basware is based on the international COSO model published by the Committee of Sponsoring Organizations of the Treadway Commission.
CONTROL ENVIRONMENT The goal of Basware’s internal control is to support the implementation of the Group strategy and ensure compliance with regulations. The system is based on Group-level policies, guidelines and processes and controls of business operations and support processes. Basware’s strong ethics, values and operating culture form the basis of the internal control system. The operating culture is being built by the steering and control of the company’s operations by the Board of Directors, the management methods of the company’s management, the company’s organizational structure and management system, effective utilization of global information system as well as the emplo-yees’ competence and development. The company uses a global HR system.
The Group’s centralized fi nancial administration center and group accounting as well as control-ling function, operating under the CFO, are responsible for the overall control system of fi nancial reporting. Harmonized methods of fi nancial reporting are applied in all Group companies, utilizing a uniform ERP system and harmonized account scheme, and also software for electronic procure-ment management, purchase invoices and travel expense reports and fi nancial management. The entire Group applies the International Financial Reporting Standards (IFRS).
RISK ASSESSMENT The aim of fi nancial reporting is to ensure that assets and liabilities belong to the company; all rights and liabilities of the company are presented in the fi nancial statements; items in the fi nan-cial statements have been classifi ed, disclosed and described correctly; assets, liabilities, income and expenditure are entered in the fi nancial statements at the correct amounts; all the transac-tions during the reporting period are included in the accounts; transactions entered in the ac-counts are factual transactions; and that the assets have been secured.
The risk management process includes an annual identifi cation and analysis of risks related to fi -nancial reporting. In addition, the aim is to analyze and report all new risks immediately after they have been identifi ed. Taking into account the quality and extent of the Group’s business opera-tions, the most signifi cant risks associated with the reliability of fi nancial reporting are associated with revenue recognition, processing of bad debt reservation, capitalization of product develop-ment expenses, impairment testing of assets (including goodwill, capitalized product development expenses and unfi nished projects) and deferred tax assets.
29annual report 2011 | corporate governance
CONTROL FUNCTIONS The correctness and reliability of fi nancial reporting are ensured through compliance with the
Group policies and guidelines. Controls that ensure the correctness of fi nancial reporting include controls related to accounting transactions, controls related to the selection of and compliance with the accounting principles, information system controls and fraud controls.
The Group’s net sales are recognized under the supervision of the centralized controlling functi-on. The Group has written internal revenue recognition guidelines. Revenue recognition is based on the existence of obligatory sale and delivery documents. The amount of the Group’s bad debt reservation is calculated monthly by the centralized fi nancial administration service center. The calculation is based on the maturity distribution of trade receivables by sales company.
The capitalized amount of the Group’s product development expenditure is calculated monthly by the centralized fi nancial administration service center. The calculation is based on project-specifi c monitoring documentation of R&D activities. The Group has written guidelines on R&D expendi-ture. Goodwill is tested for impairment during the last quarter of the year. Key variables used in the calculations are the estimated change rates of net sales and costs. In addition, indications of impairment are continuously monitored. In specifying the company-specifi c deferred assets, the effective tax rate of each country is applied. The subsidiaries have accumulated unutilized tax losses for which deferred tax assets have not been recognized in line with the prudence concept. According to the transfer pricing principle applied since 2008, subsidiaries accumulate taxable income against which confi rmed losses can be utilized in the future. We consider it probable that taxable income will be generated in the subsidiaries in the future against which the unutilized tax losses can be utilized. Deferred tax assets were recognized in the fi nancial statements for 2011 for unutilized tax losses accumulated in previous years.
The Group’s centralized fi nancial administration service center and controlling function conti-nuously develop global reliable, harmonized, scalable and effi cient operating methods. The global-ly harmonized account scheme, high automation rate of the Group’s shared information systems and the systems’ integrated control points facilitate a cost-effi cient internal control process with an audit trail for fi nancial reporting. Information systems support compliance with the Group’s acceptance authorizations for procurement proposals and purchase invoices among others. Basware’s fi nancial administration, including cash management and payment, are centralized at the Group’s level, which strengthens the functionality of the controls further.
Personnel expenses account for a majority of Basware’s expenditure. Actual and forecasted per-sonnel expenses are monitored and the forecasts are updated at a very detailed level regularly. The controlling function is responsible for the calculation of commissions and bonuses globally in accordance with the bonus scheme in effect at any time, approved by the Board annually.
The result of business operations and attainment of annual goals is assessed monthly by Execu-tive Team and Board meetings. Monthly management and Board reporting includes both actual and forecast data compared to the goals and actual results of previous periods. Financial reports generated for use by the business management monitor certain key indicators associated with the development of sales and trade receivables on a weekly and monthly basis.
Basware aims to complement its organic growth with acquisitions in accordance with its strate-gy. In making acquisitions, the company aims to follow due diligence and utilize its internal and external competence in the planning phase (e.g. due diligence), takeover phase (e.g. immediate adoption of Basware’s information systems) as well as when integrating acquired functions with the company’s operations (e.g., adoption of Basware’s HR policies).
COMMUNICATION AND INFORMATION The purpose of the management’s reporting is to produce aptly timed and essential information for making decisions. The controlling function provides the guidelines on monthly reporting for the entire organization and is in charge of special reporting instructions associated with budgeting and forecasting. The Group’s fi nancial administration internally distributes information on fi nan-cial reporting-related processes and procedures on a regular basis and the personnel perform their internal control tasks according to such information. When necessary, fi nancial administra-tion also arranges targeted training for the rest of the organization on the procedures associated with fi nancial reporting and changes in them.
The Group’s Investor Relations function maintains the guidelines on the disclosure of fi nancial information in cooperation with fi nancial administration and the legal department.
MONITORING Monitoring refers to the process to assess Basware’s internal control system and its performance in the long term. Basware also continuously monitors its operations through various assessments, such as internal audits and external audits as well as supplier audits carried out by customers. Basware’s management monitors internal control as part of routine management work. The busi-ness management is responsible for ensuring that all operations comply with applicable laws and regulations. The Group’s fi nancial and controller functions monitor compliance with the fi nancial reporting processes and control. The fi nancial and controller functions also monitor the correct-ness of external and internal fi nancial reporting. The Board of Directors assesses and ensures the appropriateness and effectiveness of Basware’s internal control and risk management.
Internal audit assists the Board of Directors in assessing and ensuring the appropriateness and effectiveness of Basware’s internal control and risk management by performing regular internal audits in the Group’s support functions and legally independent units in accordance with its annual plan. Basware’s internal control is also assessed by the company’s Auditor. The external auditor

annual report 2011 | corporate governance30
verifi es the correctness of external annual fi nancial reporting. Performed as part of continuous auditing, process auditing targets typical controls that ensure the correctness of fi nancial repor-ting. The most signifi cant observations and recommendations of the process audit according to the auditing plan are reported to the Board of Directors.
Compensation
MANAGEMENT OF COMPENSATION In its fi rst organizational meeting, the Board of Directors decided not to establish separate com-mittees for 2011 as the extent of the company’s operations and the size of the Board of Directors do not require matters to be prepared by a body smaller than the entire Board of Directors. The-refore, preparation of the compensation paid to the Board of Directors has not been allocated to a Nomination Committee, and the preparation of the compensation paid to the CEO and other members of the management has not been allocated to a Compensation Committee.
BOARD OF DIRECTORS The General Meeting decides on the remuneration paid to the Board of Directors and auditors. The Board decides on the service terms and conditions of the CEO, specifi ed in writing. The compen-sation principles of the top management are decided by the Board. The Board annually approves the personnel incentive scheme.
The Annual General Meeting resolved on 17.02.11, to compensate the members of the Board accor-ding to the following: • members EUR 27,500 per year; • Vice Chair EUR 32,000 per year and • Chair EUR 55,000 per year.
However, the remuneration is not paid to those members of the Board who hold a fulltime position at Basware. In addition, all members of the Board are paid a meeting fee of EUR 340 for each meeting. The annual remuneration will be paid in the following manner: 40 percent of the gross annual remuneration of those members of the Board whose shareholding in Basware Corp. is less than 5,000 shares, will be paid in Basware shares, acquired in public trading on NASDAQ OMX Helsinki Oy. The shares will be acquired as soon as possible after the closing of the Annual General Meeting. The ownership of the shares received is associated with a two-year lock-up during Board membership. The lock-up ends with the termination of membership.
CEOThe Board decides on the service terms and conditions of the CEO, specifi ed in writing. Currently the CEO has • 6 months’ period of notice and salary for the period of notice should the Company give notice, in addition to which he is entitled to severance pay equivalent of 12 months’ fi xed salary,• 6 months’ period of notice and salary for the period of notice should the person resign himself, no additional compensation is paid,• 12-month prohibition of competition as of the termination of employment on the part of the company• 24-month prohibition of competition as of the termination of employment on the part of the CEO • retirement age and pension benefi ts pursuant to the Employees’ Pensions Act (TEL).
The short-term remuneration of the CEO is comprised of salary, fringe benefi ts and a possible an-nual bonus based on performance. The CEO’s long-term remuneration consists of a share-based incentive scheme. The bonus is determined on the basis of the attainment of goals related to the company’s growth and profi tability according to its strategy, and personal objectives. The Board of Directors monitors the fulfi llment of the performance and result criteria of the incentive sche-me twice a year and approves the bonus to be paid at each time.
A share-based incentive scheme was in use in 2009–2011. The possible reward of the share-based incentive scheme for the vesting period 2009-2011 is based on Basware Corporation’s earnings per share (EPS). The bonus for the vesting period 2009 was paid in December 2011, the bonus for the vesting period 2010 will be paid in December 2012, and the bonus for the vesting period 2011 in December 2013, partially as shares in the company and partially in cash. The bonus of the share-based incentive scheme is paid two years after the end of the vesting period, and therefore no other restrictions are associated with the ownership of the shares received.
The salary of CEO Ilkka Sihvo, including benefi ts, totaled EUR 467,960.81 for the period January 1 – October 16, 2011. Salary in money was EUR 221,354.67 and fringe benefi ts totaled EUR 14,119.14. A performance bonus of EUR 92,662.00 was paid. In December 2011, Ilkka Sihvo was granted 8,750 shares on the basis of the incentive scheme, of which 4,375 shares were conveyed to Ilkka Sihvo and EUR 69,912.50 was paid in cash to cover the withholding tax. In connection with the end of Ilkka Sihvo’s duties as CEO, a lump-sum of EUR 183,207.50 was paid in addition to the regular statutory employment-related compensation.
The salary of CEO Esa Tihilä’s for the period October 17 – December 31, 2011, including bene-fi ts, was EUR 202,920.24. Salary in money was EUR 60,512.01 and fringe benefi ts totaled EUR 2,583.23. In December 2011, Esa Tihilä was granted 8,750 shares on the basis of the incentive

31annual report 2011 | corporate governance
scheme; of which 4,375 shares were conveyed to Esa Tihilä (the value of which is approximately EUR 69.912,50 based on the average share price of the payment day) and EUR 69,912.50 was paid in cash to cover the withholding tax.
EXECUTIVE TEAM Members of Basware’s Executive Team were from January 1, 2011 Ilkka Sihvo, CEO January 1, 2011 – October 16, 2011; Esa Tihilä, CEO October 17, 2011 – December 31, 2011 and Senior Vice President, Automation Services January 1, 2011 – October 16, 2011; Mika Harjuaho, CFO; Mari Heusala, Vice President, HR&Dev; Olli Hyppänen, Senior Vice President, Strategy and Global Operations; Jorma Kemppainen, Senior Vice President, Products; Pekka Lindfors, Senior Vice President, NorthEast; Steve Muddiman, Senior Vice President, Global Marketing; Matti Rusi, Senior Vice President, Eu-rope; Ari Salonen; General Manager, North America; and Jukka Virkkunen, Senior Vice President, Scandinavia. From January 25, 2011, Matti Copeland, Senior Vice President, M&A, IR, was also a member of the Executive Team. Matti Copeland resigned from Basware’s Board of Directors on January 24, 2011.
REMUNERATION OF THE EXECUTIVE TEAMThe compensation principles of the top management are decided by the Board. The short-term remuneration of the top management consists of salary, fringe benefi ts and a possible annual bonus based on performance. The top management’s long-term remuneration consists of a share-based incentive scheme. The bonus based on performance is no more than 50 percent of annual basic salary. The bonus is determined on the basis of the attainment of goals supporting to the company’s growth and profi tability according to its strategy, and personal objectives. The Board of Directors monitors the fulfi llment of the performance and result criteria of the incentive sche-me twice a year and approves the bonus to be paid. A share-based remuneration scheme was in use in 2009–2011.
The possible reward of the share-based incentive scheme for the vesting period 2009-2011 is based on Basware Corporation’s earnings per share (EPS). The bonus for the vesting period 2009 was paid in December 2011, the bonus for the vesting period 2010 will be paid in December 2012, and the bonus for the vesting period 2011 in December 2013, partially as shares in the company and partially in cash. The bonus of the share-based incentive scheme is paid two years after the end of the vesting period, and therefore no other restrictions are associated with the ownership of the shares received.
In December 2011, members of the Executive Team were granted a total of 35,000 shares on the basis of the incentive scheme, of which 17,500 were transferred to the members of the Executive Team and EUR 279,650 was paid in cash to cover the withholding tax.
The members of the Executive Team, excluding the CEO, were paid a total of EUR 1,572,307.52 in salaries, EUR 78,986.03 in fringe benefi ts and EUR 281,311.66 in bonuses based on performance in 2011. Sales of options granted on the basis of the long-term incentive scheme in force in 2006–2008 amounted to EUR 177,020.00 in 2011.
MEMBERS OF THE EXECUTIVE TEAM IN 2012
Esa Tihilä CEOBorn 1964, College Graduate (Econ), eMBAAt Basware since 2004, member of the Executive Team since 2005
Key working experience: Basware Corporation: CEO 10/2011-Senior Vice President Automation Services 2009-2011, Senior Vice President Europe and Asia-Pacifi c 2009-2010, General Manager Europe and Americas 2006-2008, Senior Vice President Global Operations 2005; Meridea Financial Software: CEO 2001–2004, iCL PLC: Group Executive Director 2001, Global Director e-Business 1999–2001; iCL Data Oy: Director e-Business 1997–1998, Business Development Director 1995–1996Commissions of trust:European E-invoicing Service Providers Association (EESPA): Chair 2011–Futurice Oy: Board member 2011–Finnish Orienteering Federation: Board member 2008–
Matti CopelandSenior Vice President, Strategy Born 1961, M.Sc. (Econ), Stanford Graduate School of Business (Stanford Executive Program 2000)At Basware since 2011
Key working experience: Basware Oyj: Senior Vice President Strategy 2012-, Senior Vice President M&A/IR 2011, Member of the Board 2008–2011; August&Bob: Managing Partner 2007-2009; Deloitte: Partner, M&A Advi-sory 2005-2007; CapMan Capital Management: Investment Director Buyout Business Unit 2002–2005; Aura Capital: Managing Director 2001–2002; Jippii Group: Managing Director 2001–2001; Leonia/Sampo: Executive Vice President Large Corporate Clients 1998–2001; KANSALLIS-OSAKE-PANKKI/Merita/Merita-Nordbanken: Head of Debt Capital Markets1988-1998; Citibank New York: Manager 1986–1988.

annual report 2011 | corporate governance32
Commissions of trust: Alekstra Oy: Chairman of the Board 2009–Vergo Oy: Chairman of the Board 2011–
Mika HarjuahoCFOBorn 1966, M.Sc. (Econ)At Basware since 2007, member of the Executive Team since 2007 Key working experience: Basware Corporation: CFO 2007–; Suunto Oy: CFO 2001–2007; Ericsson AB: Regional Controller 2000–2001, Oy LM Ericsson AB: Profi t Center Controller 1997–2000, Unilever Finland Ltd Van den Bergh Foods: Controller 1996–1997, Unilever Nederland B.V.: Internal Auditor 1995–1996; Unilever Finland Ltd: Cost Accountant 1994–1995 Mari HeusalaSenior Vice President, HR&DevBorn 1966, M.Sc. (Econ)At Basware since 2009, member of the Executive Team since 2011
Key working experience:Basware Corporation: Senior Vice President HR&Dev 2012–, Vice President HR&Dev 2009–2011;Nokia Corporation: Various executive and managerial HR positions 1997–2009; Northrop Grumman International Aircraft Inc: Project Coordinator 1993–1996
Jorma KemppainenSenior Vice President, ProductsBorn 1965, M.Sc. (Tech)At Basware since 2009, member of the Executive Team since 2009
Key working experience: Basware Corporation: Senior Vice President Products 2009-; Inno-rd Oy: Managing Director and executive level consultant 2009; Suunto Oy: Director R&D 2005–2009; SSH Communications Cor-poration Oyj: Vice President R&D and Customer Services 2003–2005; F-Secure Oyj: Vice Presi-dent R&D 2000–2003; Tellabs Oy: Customer Training Manager 1996–2000, various R&D positions 1993–1996; ICL Oy: Various R&D positions 1987–1993
Pekka Lindfors Senior Vice President, Volume SalesBorn 1966, Helsinki School of Economics, studentAt Basware since 2004, member of the Executive Team since 2011
Key working experience:Basware Corporation: Senior Vice President Volume Sales 2012-, Senior Vice President Northeast 2011, Sales Director 2008-2009, Director Global Marketing 2007-2008, Basware Corporation: Se-nior Vice President Northeast 2011-, Sales Director 2008-2010, Director Global Marketing 2007-2008, Marketing Director 2006-2007, Business Unit Manager 2004-2006; Novo Group Oyj: Marketing Director 1998-2004, various positions in sales and fi nancials 1993-1998
Steve Muddiman Senior Vice President, Global MarketingBorn 1961, Southampton Solent University, communicationsAt Basware since 2008, member of the Executive Team since 2008
Key working experience:Basware Corporation: Senior Vice President Automation Services 2012-, Vice President Automati-on Services 2009-2011, Basware Inc: Vice President and Country Manager, Senior Vice President Global Marketing 2008-; VMware Inc.: Director of Field and Corporate Marketing Europe, Middle East & Africa 2006-2008; Ariba Inc.. Vice President Marketing and Strategy Europe, Middle East & Africa 2001–2005; Hewlett-Packard Inc: Various General Management and Marketing Manage-ment positions 1989–2000
Riku RoosSenior Vice President, Automation ServicesBorn 1960, M.Sc. (Tech)At Basware since 2007, member of the Executive Team since 2012
Key working experience:Basware Corporation: Senior Vice President, Automation Services 2012-, Vice President Automa-tion Services 2009-2011, Basware Inc: Vice President and Country Manager 2007-2009; Meridea Financial Software (Finland, Singapore): Executive Vice President 2000-2007; Nokia Corporation: Global Head of Services Hosting 1999-2000; Cap Gemini Oy: Director 4/1999–12/1999; Deutsche Bank, Head Offi ce (Germany, Frankfurt): Global Relationship Manager for Private Banking 1998-1999, Regional Head of IT Infrastructure 1997–1998; Microsoft AB (Sweden): Various managerial positions 1993–1997
33annual report 2011 | corporate governance
Matti Rusi Senior Vice President, SupportBorn 1963, MBA,At Basware since 2010 and 1997–2008, member of the Executive Team since 2010
Key working experience: Basware Corporation: Senior Vice President Support 2012-, Senior Vice President Europe 2010-2011; Profi t Software Oy: COO 2008–2009; Valimo Wireless Oy: CEO 2008;Basware Corporation: Senior Vice President Finland 2005-2008, President & Country Manager of Basware, Inc. 2003–2004, Senior Vice President e-Flow Business Unit 2000–2002, Area Manager Benelux Countries 1999–2000, Project Manager 1997–1999
Jukka Virkkunen Senior Vice President, Enterprise SalesBorn 1960, College Graduate (Econ)At Basware since 2006, member of the Executive Team since 2006
Key working experience: Basware Corporation; Senior Vice President, Enterprise Sales 2012-, Senior Vice President Scandi-navia 2010–2011, Senior Vice President Northeast 2006–2010; Capgemini Finland Oy Technology Services: Unit Manager 2004–2006; Ementor Oy: Sales Manager 2002–2003; Fujitsu Services Oyj: Marketing Manager for the Nordic Countries 2000–2002; iCL Data Oy e-Business: Sales Director 2000–1997, Account Manager 1997–1996Commissions of trust: Helsinki Region Chamber of Commerce: Member of Committee, Member of ICT Committee 2006–
INSIDER ADMINISTRATION Basware’s insider guidelines comply with the NASDAQ OMX Helsinki Guidelines for Insiders effec-tive as of January 1, 2006. The insider guidelines forbid insiders, including persons under their guardianship and companies where they exercise control, to trade in shares or option rights issued of the company for a period of four weeks prior to the publication of an interim report or a fi nan-cial statements bulletin (the so-called closed window).
By law, the Company public insiders include members of the Board, CEO, auditors and the auditor in charge of the company of public accountants as well as Executive Team members responsible for the key business areas. In addition, the Company has a company-specifi c insider register that includes those who regularly receive insider information in their work. Persons who are involved in acquisitions or other projects that have an effect on the valuation of the company’s shares, are considered project-specifi c insiders and are subject to a temporary trading suspension.
The Company lawyer is in charge of the guidance and supervision of insider issues and also main-tains the project-specifi c insider registers if necessary. The Communications Manager takes care of the permanent insider register. The insider register of Basware Corporation is maintained by Euroclear Finland Ltd (previously the Finnish Central Securities Depository Ltd.). The up-to-date shareholdings of the insiders can be seen in Euroclear Finland Ltd’s customer service point in Helsinki, Finland, address Urho Kekkosen katu 5 C. The company also maintains a list of insiders on its website.
According to the share register maintained by Euroclear Finland Ltd, on December 31, 2011, CEO Esa Tihilä holds 4,875 Basware Corporation shares, Matti Copeland 2,771, Mika Harjuaho 4,375, Olli Hyppänen 8,490, Steve Muddiman 4,375, and Jukka Virkkunen 4,375 shares. Other members of the Executive Team did not hold shares in Basware Corporation.
According to the share register maintained by Euroclear Finland Ltd, on December 31, 2011, Hannu Vaajoensuu held 757,976, Pentti Heikkinen 2,049, Ilkka Toivola 2,790, Sakari Perttunen 841,300 and Eeva Sipilä 1,033 shares in Basware Corporation.
DISCLOSURE POLICY In its communications, Basware complies with Finnish and EU legislations, the rules of NASDAQ OMX Helsinki Ltd, the guidelines issued by the Financial Supervision Authority, and the company’s Corporate Governance Statement. Basware has a separate disclosure policy, ratifi ed by Basware’s Board of Directors on January 20, 2011.


FinancialStatements

annual report 2011 | financial statements36
summary of the financial year 2011
Financial year 2011
» Net sales EUR 107,750 thousand (EUR 103,094 thousand) –
growth 4.5 percent
» Operating profit EUR 12,280 thousand (EUR 13,487 thousand)
– decrease of 8.9 percent
» Operating profit 1 1.4 percent of net sales (13.1%)
» Operating profit includes a restructuring provision of EUR
1,203 thousand due to streamlining measures
» Growth of Automation services (SaaS and e-Invoicing) 32.3
percent
» Recurring revenue (including Maintenance and Automation
Services) 48.9% (44.3%) of net sales
» Cash flows from operating activities were EUR 15,207 thou-
sand (EUR 12,523 thousand)
» Earnings per share EUR 0.76 (0.90) – decrease of 15.0 percent
» Dividend proposal for 201 1: EUR 0.41 per share (2010: EUR
0.40)
The Financial Statements have been prepared according to Inter-
national Financial Reporting Standards (IFRS)
rePortinG
Basware’s reporting segment is based upon geography as follows:
Finland, Scandinavia, Europe, and Other. The Finland segment in-
cludes the Finnish, Russian, and Asia-Pacific (excluding Australia)
business operations and corporate services. The Other segment
includes North America and Australia.
In addition, the company reports revenue from products and
services as follows: License Sales, Professional Services, Mainte-
nance and Automation Services. License Sales consist of the Pur-
chase to Pay (P2P) product suite and financial management and
payment automation solutions that are only marketed in Finland.
Basware Automation Services include paper invoice scanning ser-
vices, exchange of purchase catalogues and purchase messages,
e-Invoicing, activation service, and Software as a Service (SaaS)
services.
The company also reports an estimate of revenue to be rec-
ognized for current Automation Services agreements in the next
twelve months. Automation Services agreements are typically in
force for a fixed period of several years or until further notice.
financial PerioD January 1 – DecemBer 31, 2011
net sales
Basware Group’s net sales for the period (January-December) in-
creased by 4.5 percent to EUR 107,750 thousand (EUR 103,094
thousand). The growth in local currency terms was 3.9 percent.
During the period, the Company’s license sales decreased by
15.4 percent, accounting for 19.4 percent (23.9%) of net sales.
Saas sales grew by 16.0 percent. Maintenance revenue increased
by 8.9 percent and accounted for 33.6 percent (32.3%) of net
sales. Professional Services revenue increased by 4.5 percent and
accounted for 31.7 percent (31.7%) of net sales.
As part of license sales, sales of SEPA update-related banking
software decreased by 55.5 percent as the majority of custom-
ers had already implemented the SEPA update. Sales of third-par-
ty scanning software decreased by 38.8 percent as the customers
were soled outsourced scanning services in line with the strategy,
reported as recurring revenue under Automation Services.
During the financial period, Automation Services (SaaS, e-In-
voicing, Scan and Capture) grew by 32.3 percent and account-
ed for 15.3 percent (12.1%) of net sales. The transaction volume
processed by the Automation Services business was 20.8 million
the geographical division of net sales by the location of assets:
Net sales EUR thousand
1 0–12/20 1 1
1 0–12/2010
Change, %
1–12/20 1 1
1–12/ 2010
Change,%
Finland 16,497 16,0 1 1 3.0 57,685 53,606 7.6Scandinavia 7,977 7,708 3.5 25,693 24,188 6.2Europe 5,237 5,959 –12.1 20,940 21,347 –1.9Other 3,816 3,898 –2.1 12,737 12,1 0 1 5.3Sales between segments –3,300 –3,429 –3.8 –9,305 –8,149 14.2
Group total 30,227 30,149 0.3 107,750 1 03,094 4.5
the geographical division of net sales by the location of customers:
Net sales EUR thousand
1 0–12/20 1 1
1 0–12/2010
Change, %
1–12/20 1 1
1–12/ 2010
Change,%
Finland 13,042 13,015 0.2 48,660 46,550 4.5Scandinavia 7,987 7,488 6.7 25,381 23,346 8.7Europe 5,115 5,385 –5.0 20,187 20,249 –0.3Other 4,083 4,261 –4.2 13,522 12,949 4.4Group total 30,227 30,149 0.3 107,750 103,094 4.5
Board of Directors’ Report 1.1.– 31.12.20 1 1

37annual report 2011 | financial statements
finance anD inVestments
Basware Group’s total assets on the balance sheet at the end of
the period were EUR 121,966 thousand (EUR 91,470 thousand).
The Company’s cash and liquid assets were EUR 42,977 thousand
(EUR 13,882 thousand), of which cash and cash equivalents were
EUR 42,977 thousand (EUR 13,787 thousand) and financial assets
at fair value through profit or loss were EUR 0 (EUR 35 thousand).
Excess cash assets have been invested in fixed-term deposits in
the short term.
Equity ratio was 81.9 percent (73.3%) and gearing was –42.3
percent (–15.3%). The Company’s interest-bearing liabilities to-
taled EUR 682 thousand (EUR 3,582 thousand), of which current
liabilities accounted for EUR 158 thousand (EUR 3,550 thousand).
Return on investment was 14.9 percent (20.1%) and return on eq-
uity 1 1.6 percent (16.7%).
Cash flows from operating activities were EUR 15,207 thou-
sand (EUR 12,523 thousand). Cash flows from investments were
EUR –5,631 thousand (EUR –4,454 thousand).
The Company’s capital expenditure, resulting from regular ad-
ditional and replacement investments required for growth, was
EUR 2,014 thousand (970 thousand) in the period. Gross invest-
ments which include - in addition to those mentioned above - cap-
italized research and development expenses totaled EUR 6,331
thousand (EUR 4,567 thousand).
There are no indications of impairment of assets. Amortization
of intangible assets totaled EUR 4,390 thousand (EUR 4,579 thou-
sand), of which amortization related to mergers and acquisitions
were EUR 2,010 thousand (EUR 2,233 thousand).
The amount of invested non-restricted equity increased by
EUR 27.3 million as the result of a share issue when Basware is-
sued 1,170,000 new shares in the company to select Finnish and
international institutional investors. The new 1,170,000 shares
the geographical division of operating profit by the location of assets:
Operating profit EUR thousand
1 0–12/2011
1 0–12/20 1 0
Change, %
1–12/2011
1–12/ 20 1 0
Change,%
Finland 1,647 2,757 –40.3 6,812 7,703 –11.6Scandinavia 1,349 1,557 –13.4 4,533 4,136 9.6Europe 400 743 –46.2 1,629 2,354 –30.8Other 474 284 66.9 963 924 4.3Operating profit between segments –416 –405 2.7 –1,657 –1,629 1.7Group total 3,454 4,937 –30.0 12,280 13,487 –8.9
during the reporting period (growth of 53.0%). Favorable devel-
opment in start-up fees for services and transaction revenue con-
tinued, increasing by a total of 46.0 percent during the period.
Of this, transaction net sales increased by 59.9%. The estimated
revenue to be recognized for current Automation Services agree-
ments in production in the next twelve months is EUR 18.3 million
(growth of 6.2 percent compared to the estimate made at the end
of the previous quarter).
The international share of Basware’s net sales was 54.8 per-
cent (54.8%) in January–December. International operations
grew by 4.5 percent.
financial Performance
Basware’s operating profit for the period decreased by 8.9 per-
cent to 12,280 thousand (EUR 13,487 thousand). Operating profit
represented 1 1.4 percent (13.1%) of net sales. The operating prof-
it includes a restructuring provision of EUR 1,203 thousand due to
streamlining measures.
The company’s fixed costs were EUR 82,850 thousand (EUR
78,285 thousand) in the period, up 5.8 percent on the corre-
sponding period the previous year. Personnel costs made up 74.3
percent (73.2%) or EUR 61,575 thousand (EUR 57,337 thousand)
of the fixed costs. Bad debt and movement in bad debt accruals
are included in fixed costs. Bad debt reservations at the end of
the period amounted to EUR 1,021 thousand (EUR 996 thousand).
The research and development expenses in the period
amounted to EUR 16,489 thousand (EUR 14,883 thousand), or
15.3 percent (14.4%) of net sales. The expenses increased by 10.8
percent compared with the same period last year. Research and
development costs capitalized during the period amounted to
EUR 4,309 thousand (EUR 1,696 thousand). Basware’s research
and development costs for the period totaled EUR 12,180 thou-
sand (EUR 13,187 thousand), or 1 1.3 percent (12.8%) of net sales.
The development of next-generation software has an effect on
the amount of capitalized research and development costs.
The Company’s finance income and finance expenses were 52
thousand (EUR –162 thousand). Profit before tax was EUR 12,332
thousand (EUR 13,325 thousand). Taxes for the period amounted
to EUR 2,661 thousand (EUR 2,994 thousand). Profit for the peri-
od was EUR 9,671 thousand (EUR 10,331 thousand) or 9.0 percent
(10.0%) of net sales. Undiluted earnings per share were EUR 0.76
(EUR 0.90).

annual report 2011 | financial statements38
were registered with the Finnish Trade Register on February 16,
201 1. Public trading in the shares on NASDAQ OMX Helsinki Ltd.
commenced on February 17, 201 1 together with existing shares.
research, DeVeloPment anD neW ProDucts
The research and development expenses amounted to EUR 16,489
thousand (EUR 14,883 thousand), or 15.3 percent (14.4%) of net
sales. Research and development expenses increased by 10.8 per-
cent compared with the same period last year. Research and de-
velopment expenses capitalized during the period amounted to
EUR 4,309 thousand (EUR 1,696 thousand). Basware’s research
and development costs for the period totaled EUR 12,180 thou-
sand (EUR 13,187 thousand), or 1 1.3 percent (12.8%) of net sales.
The development of next-generation software has an effect on the
amount of capitalized research and development costs.
Basware launched a new e-Invoice service for consumer in-
voices in the Finnish market, allowing organizations to send their
sales invoices as e-Invoices to consumer customers. The service
has been developed in cooperation with Nordea Bank.
Basware introduced an accounts payable ledger outsourcing
service called InvoiceOut™. With the service, companies can out-
source the day-to-day routines of invoice processing, minimize the
costs of processing invoices and also improve the efficiency and
quality of the process of handling invoices.
Basware launched new Catalogue Services in the market. The
packaged solution offers companies comprehensive product cata-
logue services through Basware’s open network, boosting the co-
operation between customers and suppliers.
Basware is launching its next generation of software during
the first quarter of 2012. The company’s next-generation portfo-
lio will also be strongly offered as a service. The next-generation
solutions will improve the company’s competitiveness in the long
term.
A total of 31 1 (239) people worked in Products at the end of
December 201 1, 150 of them in India. The number of R&D person-
nel is expected to grow at a moderate rate.
Personnel
Basware employed 1,058 (845) people on average during the peri-
od and 1,182 (913) at the end of the period. The number of person-
nel increased by 269 persons and by 29.5 percent compared with
the same period the previous year. The increase in the number of
personnel is mainly due to an increase in the number of employ-
ees in the Indian unit. The staff in India are included in the report-
ing for the Finland segment as part of the head office functions.
The share of personnel working in foreign units has increased
compared with the previous year. At the end of the period, 61.2
percent (54.9%) of Basware personnel worked outside of Finland
and 38.8 percent (45.1%) in Finland. 1 1.3 percent of the personnel
work in sales and marketing, 55.7 percent in consulting and ser-
vices, 26.3 percent in Products, and 6.8 percent in administration.
The average age of employees is 34.2 (35.7) years. Of the em-
ployees, 27.8 percent have a Master’s degree and 32.7 percent
have a Bachelor’s degree. Women account for 24.5 percent of em-
ployees, men for 75.5 percent.
For incentive purposes, the company has a bonus program
that covers all employees.
The short-term remuneration of the top management consists
of salary, fringe benefits and a possible annual bonus based on
performance. Long-term remuneration of the top management
consists of a share-based incentive scheme. The bonus based on
performance is no more than 50 percent of annual basic salary.
The bonus is determined on the basis of the attainment of goals
supporting to the company’s growth and profitability according to
its strategy, and personal objectives. The Board of Directors mon-
itors the fulfillment of the performance and result criteria of the
incentive scheme twice a year and approves the bonus to be paid.
A share-based incentive scheme was in use in 2009–201 1. The
possible reward of the share-based incentive scheme for the vest-
ing period 2009–201 1 is based on Basware Corporation’s earnings
per share (EPS). The bonus for the vesting period 2009 was paid
in December 201 1, the bonus for the vesting period 2010 will be
Geographical distribution of personnel:
Personnel(employed, on average)
1 0–12/ 20 1 1
1 0–12/ 2010
Change, %
1–12/ 2011
1–12/ 2010
Change, %
Finland 826 584 41.5 738 539 36.8Scandinavia 120 124 –3.5 119 124 –4.6Europe 136 131 3.6 137 126 8.9Other 67 61 10.4 64 55 17.1Group total 1,149 900 27.6 1,058 845 25.3

39annual report 2011 | financial statements
paid in December 2012, and the bonus for the vesting period 201 1
in December 2013, partially as shares in the company and par-
tially in cash. The bonus of the share-based incentive scheme is
paid two years after the end of the vesting period, and therefore
no other restrictions are associated with the ownership of the
shares received.
Business oPerations
Finland
The Finland segment includes the business operations in Fin-
land, Russia, Asia-Pacific (excluding Australia) and the head office
functions.
Net sales in the period increased by 7.6 percent to EUR 57,685
thousand (EUR 53,606 thousand). The growth in net sales was
particularly boosted by growth in Automation Services. The prof-
itability of the segment decreased by 1 1.6 percent and operat-
ing profit was EUR 6,812 thousand (EUR 7,703 thousand). The de-
crease in profitability was driven by a restructuring provision due
to streamlining measures.
Net sales of the Finnish and Russian operations increased by
6.2 percent to EUR 49,936 thousand (EUR 47,013 thousand). The
main driver behind the segment’s growth was the growth of Auto-
mation Services. The profitability of operations decreased by 1.2
percent, and operating profit amounted to EUR 16,437 thousand
(EUR 16,641 thousand).
There are 14 resellers in the Finland segment and Basware em-
ployees averaged 738 (539) in the area during the period. The
staff in India are included in the reporting for the Finland seg-
ment as part of the head office function
Scandinavia
Basware’s Nordic organization consists of a centrally directed
Scandinavian (Sweden, Denmark and Norway) unit.
During the period, net sales in Scandinavia increased by 6.2
percent to EUR 25,693 thousand (EUR 24,188 thousand). In local
currency terms, net sales in the area increased by 3.1 percent. The
main driver behind the segment’s growth was the growth of Auto-
mation Services. The profitability of the operations improved by
9.6 percent and operating profit was EUR 4,533 thousand (EUR
4,136 thousand).
The operations are mainly managed by the in-house organiza-
tion, and Basware employees averaged 1 19 (124).
Europe
Basware’s European business operations consist of the units in
Germany, France, the Netherlands and the United Kingdom. Ad-
ditionally, the reseller network covers the eastern part of Central
Europe.
During the period, net sales in the Europe segment decreased
by 1.9 percent to EUR 20,940 thousand (EUR 21,347 thousand). In
local currency terms, net sales in the area decreased by 1.6 per-
cent. The main reason for the decrease in the segment’s net sales
was the decrease in license sales. The profitability of the opera-
tions decreased by 30.8 percent and operating profit was EUR
1,629 thousand (EUR 2,354 thousand).
There were 35 resellers in Europe, and Basware personnel in
the area averaged 137 (126) during the period.
Other
Business operations in North America and Australia are reported
in this segment. During the period, net sales in the area increased
by 5.3 percent to EUR 12,737 thousand (EUR 12,101 thousand). In
local currency terms, the growth in net sales was 5.9 percent. The
main driver behind the growth of the segment’s net sales was
growth in Professional Services. The profitability of the opera-
tions increased by 4.3 percent and operating profit was EUR 963
thousand (EUR 924 thousand).
The Other segment had 10 resellers at the end of the financial
period, and Basware personnel in the area averaged 64 (55) dur-
ing the period.
other eVents of the financial PerioD
Basware’s Board of Directors and company management have ad-
justed the company’s strategy and goals for the next 4-year pe-
riod. A separate stock exchange release was issued on January
25, 201 1.
Basware issued 1,170,000 new shares in the company to se-
lect Finnish and international institutional investors. In addition,
certain major Basware shareholder individuals sold a total of
800,000 existing shares in the company in conjunction with the
share issue. The new 1,170,000 shares were registered with the
Finnish Trade Register on February 16, 201 1. Following the regis-
tration, the number of issued and outstanding shares of the Com-
pany is 12,890,829. Public trading in the shares on NASDAQ OMX
Helsinki Ltd. commenced on February 17, 201 1 together with exist-
ing shares. Separate stock exchange releases on the share issue
were issued on February 14, 201 1, and February 16, 201 1.
Basware issued a profit warning on September 8, 201 1, when
the company had previously estimated that the net sales in 201 1
would grow over 10 percent and that the operating profit (EBIT)
for 201 1 was expected to be over 13 percent of net sales. Accord-
ing to the outlook, Basware estimated that its net sales would
grow 5–9 percent and operating profit (EBIT) would be 1 1.5–14.5
percent of net sales. The adjustment of the net sales and operat-

annual report 2011 | financial statements40
ing profit guidance for 201 1 was based on general financial mar-
ket instability and lower than expected software market growth,
which had resulted in the sales of Basware licenses and related
professional services developing slower than expected. A sepa-
rate stock exchange release on the profit warning was issued on
September 8, 201 1.
Basware issued a profit warning on December 7, 201 1, estimat-
ing that the growth in its net sales will be positive but below the
previous estimate, according to which the company’s net sales
for 201 1 would grow 5–9 percent. The company’s operating profit
(EBIT) for 201 1 was expected to be over 10 percent of net sales in-
stead of the previous estimate of 1 1.5–14.5 percent. The change in
net sales and operating profit guidance was based on significant-
ly lower than expected license sales in the fourth quarter. A sep-
arate stock exchange release on the profit warning was issued on
December 7, 201 1.
share anD shareholDers
Basware Corporation’s share capital totaled EUR 3,528,368.70 at
the end of the period and the number of shares was 12,931,229.
Share price and trade
During the reporting period, the highest price of the share was
EUR 28.10 (EUR 24.80), the lowest was EUR 14.95 (EUR 15.00)
and the closing price was EUR 16.45 (EUR 24.75). The average
price of the share was EUR 21.58 (EUR 19.27) during the period.
A total of 5,079,523 (2,131,071) shares were traded during the
financial period which is the equivalent of 40.1 percent (18.5%)
of the average number of shares. Market capitalization with the
period’s closing price on December 31, 201 1 was EUR 21 1,737,063
(EUR 287,093,169).
Shareholders
Basware had 15,017 (15,752) shareholders on December 31, 201 1,
including nominee-registered holdings (1 1). Nominee-regis-
tered holdings accounted for 12.4 percent of the total number of
shares.
The company holds 59,675 Basware Corporation shares, cor-
responding to 0.5 percent of all shares in the company.
Basware Corporation’s Board of Directors approved in its
meeting on January 20, 201 1 the subscription of a total of 30,805
shares subscribed for with Basware Warrant Programs. The share
subscriptions were based on the Warrant Program 2006 series C
warrants and Warrant Program 2007 series E warrants.
Basware Corporation’s Board of Directors approved in its
meeting on April 12, 201 1 the subscription of a total of 40,400
shares subscribed for with Basware Warrant Programs. The share
subscriptions were based on the Warrant Program 2006 series
C warrants (19,400 shares) and Warrant Program 2007 series E
warrants (21,000 shares). The last subscription date for Basware
Warrant Programs was March 31, 201 1
Basware announced five notifications of change in ownership:
on February 22, 201 1 the total number of shares held by Nordea
Rahastoyhtiö Suomi Oy represented more than 5% of Basware
Corporation’s share capital and voting rights; on February 15, 201 1
the total number of shares held by Kirsi Eräkangas was below
5% of Basware Corporation’s share capital and voting rights; on
February 2, 201 1 the total number of shares held by Nordea Ra-
hastoyhtiö Suomi Oy represented less than 5% of Basware Cor-
poration’s share capital and voting rights. Basware announced a
notification of change in ownership when Nordea Rahastoyhtiö
Suomi Oy reported on April 1 1, 201 1 that the total number of
shares held by it represented less than 5% of Basware Corpora-
tion’s share capital and voting rights on March 24, 201 1. Basware
announced a notification of change in ownership on June 7, 201 1
when Ilmarinen Mutual Pension Insurance Company reported that
its holding in Basware Corporation exceeded the 10% threshold
on June 7, 201 1.
Shareholding of Management and Board
According to the shareholder register managed by Euroclear Fin-
land Oy, on December 31, 201 1 CEO Esa Tihilä holds 4,875 Bas-
ware shares, Matti Copeland 2,771 shares, Mika Harjuaho 4,375
shares, Olli Hyppänen 8,490 shares, Steve Muddiman 4,375
shares, and Jukka Virkkunen 4,375 shares. Other members of the
Basware Executive Team do not hold Basware shares.
According to the shareholder register managed by Euro-
clear Finland Oy, on December 31, 201 1 Hannu Vaajoensuu holds
757,976 Basware shares, Pentti Heikkinen 2,049 shares, Ilkka
Toivola 2,790 shares, Sakari Perttunen 841,300 shares, and Eeva
Sipilä 1,033 shares.
GoVernance
The Annual General Meeting of Shareholders on February 17, 201 1,
confirmed the number of Board members as five. The Annual
General Meeting resolved to agree on the proposal and elected
Sakari Perttunen, Pentti Heikkinen, Eeva Sipilä, Ilkka Toivola, and
Hannu Vaajoensuu members of the Board of Directors.
The Annual General Meeting further resolved to elect Ernst &
Young Oy, Authorized Public Accountants as the auditor, with APA
Heikki Ilkka in charge and APA Terhi Mäkinen as the deputy auditor.
Authorizations
The Annual General Meeting decided to authorize the Board of
Directors to decide on repurchase of company’s own shares in ac-
41annual report 2011 | financial statements
cordance with the proposal of the Board of Directors. Based on
the authorization, the Board of Directors may repurchase a max-
imum of 1,160,000 shares in the company otherwise than in pro-
portion to the holdings of the shareholders using the non-re-
stricted equity at the market price of the shares on the NASDAQ
OMX Helsinki Ltd at the time of the acquisition. The shares shall
be repurchased to be used as consideration in possible acquisi-
tions or in other arrangements that are part of the company’s
business, to finance investments, as part of the company’s incen-
tive program, or to be retained, otherwise conveyed or cancelled.
The authorization to repurchase the company’s own shares is val-
id until March 31, 2012.
The Annual General Meeting decided to authorize the Board of
Directors to decide on issuing new shares and/or conveying the
company’s own shares held by the company and/or granting spe-
cial rights referred to in Chapter 10, Section 1 of the Finnish Compa-
nies Act in accordance with the proposal of the Board of Directors.
Based on the authorization, the Board of Directors may decide to
issue a maximum of 2,320,000 new shares and convey a maxi-
mum of 1,250,300 of the company’s own shares held by the com-
pany. The number of shares to be issued to the company itself to-
gether with the shares repurchased to the company on basis of
the repurchase authorization shall not exceed 1,160,000 shares.
The maximum number of new shares that may be subscribed by
virtue of the special rights granted by the company is 1,000,000
shares in total which number shall be included in the abovemen-
tioned maximum number of new shares. The authorization to re-
purchase the company’s own shares is valid until March 31, 2012.
A separate stock exchange release on the authorizations
granted to the Board of Directors and the other resolutions of the
Annual General Meeting was issued on February 17, 201 1.
The company issues a Corporate Governance Statement for
201 1, composed in accordance with Recommendation 51 of the
new Corporate Governance Code and Chapter 2, Section 6 of the
Finnish Securities Market Act. The Corporate Governance State-
ment is issued separately from the company’s annual report.
Basware’s Corporate Governance principles are available in
full on the company’s website at http://www.basware.com/Inves-
tors/corporate_governance/Pages/default.aspx
Basware Corporation’s Board of Directors appointed Executive
Team member, Senior Vice President Esa Tihilä (born 1964), as
the company’s new CEO from October 17, 201 1. A separate stock
exchange release on the appointment was issued on October 13,
201 1.
The company announced its new organization structure on
October 31, 201 1 and will adopt a globally directed function-based
organization as of January 1, 2012. By revising its business mod-
el, Basware will be able to implement its strategy more effective-
ly, clarify its functions and utilize the growth opportunities in the
market. A separate stock exchange release on the revised organi-
zation structure was issued on October 31, 201 1.
During 201 1, the composition of the Basware Executive Team
was as follows: Ilkka Sihvo CEO, January 1, 201 1 – October 16, 201 1;
Esa Tihilä, CEO October 17, 201 1 – December 31, 201 1, Senior Vice
President, Automation Services January 1, 201 1 – October 16, 201 1;
Mika Harjuaho, CFO; Mari Heusala, Vice President, HR&Dev; Olli
Hyppänen, Senior Vice President, Strategy and Global Operations;
Jorma Kemppainen, Senior Vice President, Products; Pek ka Lind-
fors, Senior Vice President, NorthEast; Steve Muddiman, Senior
Vice President, Global Marketing; Matti Rusi, Senior Vice Pres-
ident, Europe; Ari Salonen, Senior Vice President, North Ameri-
ca; and Jukka Virkkunen, Senior Vice President, Scandinavia. As
of January 25, 201 1, the Executive Team also included Matti Co-
peland, Senior Vice President, M&A, IR. Matti Copeland resigned
from the Basware Board of Directors on January 24, 201 1.
short-term risKs anD risK manaGement
In accordance with Basware’s risk management policy, risks are
divided into six categories: risks related to business operations,
products, personnel as well as legal, financial and data security
risks. Basware takes risks that are a natural part of its strategy
and objectives. These risks are managed and mitigated in various
ways. Short-term risks are considered to be risks in the current
reporting year.
During 2012, the company will be undergoing a strong trans-
formation from a software company into a service company,
which will change our operating methods, solutions, and services.
The global economy and markets are unstable, which may re-
sult in a decrease in the demand for license sales and services.
In addition, the conversion of license sales to SaaS solutions may
have an increasingly negative effect on the growth in net sales,
especially with the company’s next-generation software fami-
ly. The shift in demand from license sales towards SaaS solutions
will support the long-term growth targets of the Automation Ser-
vices business in the future.
Competitiveness in acquiring new customers is fundamental
to the growth pursued by the company.
Basware will publish a next-generation software suite during
the first quarter of 2012. The next-generation software family
aims to ensure Basware’s product leadership in Purchase to Pay
software and services as well as increase the number of new cus-
tomers.
Securing the annual maintenance and service revenue gener-

annual report 2011 | financial statements42
ated by the existing software customers is the foundation of the
company’s profitable growth. Therefore, the company aims to en-
sure that existing customers migrate to next-generation software
and services in future financial periods in a controlled way.
The long-term target in Automation Services is annual growth
of more than 50 percent. SaaS and e-Invoicing are scalable busi-
ness models with a high business potential. Achieving the target-
ed growth requires continuous strong growth in the number of
customers and transaction volumes. We restructured our organi-
zation during the last quarter of 201 1 and adopted a globally di-
rected function-based organization. The change of the business
model allows Basware to better utilize the growth opportunities
offered by the market.
Basware has complemented its organic growth through acqui-
sitions in line with its strategy. Ensuring the success of acquisi-
tions is fundamental to the company’s profitable growth. In im-
plementing acquisition projects, the aim is to follow due diligence
and utilize the company’s internal and external expertise in the
planning phase, take over phase and when integrating the ac-
quired functions into the company’s operations.
Managing the increasing costs through the cost benefits of-
fered by offshoring sites is an essential part of the continuous im-
provement of the company’s profitability. Our Indian branch has
grown at a rapid rate during 201 1, and we are surveying the pos-
sibilities of new business service functions and internal support
functions to operate from India. We are also investigating new
geographical areas.
In other respects, no significant changes have taken place in
Basware’s short-term risks and uncertainties during the financial
period.
enVironmental anD social resPonsiBility
Basware’s corporate responsibility is driven by strong business
ethics, corporate values, and legislation. The company is com-
mitted to economic, social and environmental responsibility in all
operations.
Basware’s software products reduce paper consumption in
thousands of offices around the world, leading the customer com-
panies toward the paperless office, which saves both the environ-
ment and money. Profitability and financial stability are an inte-
gral part of Basware’s responsibility. Stability and trustworthiness
yield added value to all stakeholders.
Basware has cooperated with the Plan Finland charity foun-
dation since 2002, and the company has 15 sponsored children
around the world. The company also supports the World Wildlife
Fund’s Save the Baltic Sea project.
Audit of the environmental system
Bureau Veritas Certification has audited Basware Corporation’s
offices in Espoo, Oulu, Pori, and Tampere, and given them ISO
14001:2004 certification on August 8, 201 1.
strateGy
Basware’s Board of Directors and company management adjust-
ed the company’s strategy and goals for the next 4-year peri-
od in January 201 1. The company will focus strongly on interna-
tional growth and therefore arranged a directed issue of shares
to select institutional investors in the first quarter. In order to
strengthen its international growth, Basware increased the signif-
icance of mergers and acquisitions in its strategy and organiza-
tion. The company has been active in mergers and acquisitions
and strengthened the activity further by establishing a new exec-
utive team-level M&A function.
The company aims to be a leading e-Invoice company world-
wide. Acquisitions will support the growth of the e-Invoicing ser-
vice. Its annual volume in 201 1 amounted to 20.8 million transac-
tions. The e-Invoicing market is growing strongly, and Basware
aims to reach the 100 million invoice mark by 2014.
With the acquisition of a German e-Invoice operator in Jan-
uary 2012, the company will be able to complement its portfolio
with innovative technology also to make sales invoices electronic,
which will increase growth opportunities and also benefit existing
customers worldwide.
We restructured our organization during the fourth quarter
of 201 1 and adopted a globally managed function-based organi-
zation as of January 1, 2012. The change in the operating mod-
el allows Basware to implement its strategy more efficiently, clar-
ify the functions and utilize the growth opportunities offered by
the market. We will seek entirely new customer groups with seg-
ment-based customer account management and product and ser-
vice portfolio. According to Basware’s view, the significance of the
service concept will continue its solid growth in the future as well,
which is the reason for marketing the company’s next-generation
product concept strongly also as services. Basware has adjusted
its pricing model to be very flexible according to customer needs.
From now on, software solutions will be available to customers
with one-time license fee, monthly subscription, and according to
the SaaS model.
The role of offshoring operations will continue to grow in the
company’s strategy. R&D and Automation Services operations at
Basware’s Indian office have already succeeded in gaining a sig-
nificant role. The company is surveying the development of off-
shoring in order to improve profitability also with regard to new
service business operations and internal support functions. The
company is also investigating the possibility of new geographical
regions in expanding offshoring.
The new strategic guidelines facilitate strong international
growth and positive development of operating profit margin. The
long term target is to grow annually 15–30 percent in net sales
and more than 50 percent in Automation Services. The compa-
ny’s long-term target for operating profit margin is 15–20 percent
improving towards the end of the period.
A separate stock exchange release on the strategy update was
issued on January 25, 201 1 and on the organization reform on Oc-
tober 31, 201 1.

43annual report 2011 | financial statements
manaGement anD auDitors
Ilkka Sihvo acted as the CEO of the company during January 1,
2010 – October 16, 201 1 and Esa Tihilä October 17, 201 1 – Decem-
ber 31, 201 1. The CEO is in charge of the day-to-day management
of the company in accordance with the instructions and orders
given by the Board. The Annual General Meeting of Shareholders
on February 17, 201 1, confirmed the number of Board members as
five. Pentti Heikkinen, Sakari Perttunen, Eeva Sipilä, Ilkka Toivo-
la and Hannu Vaajoensuu were elected to the Board. In its first
meeting, the Board elected Hannu Vaajoensuu as Chairman of
the Board and Sakari Perttunen as Vice Chairman.
The Annual General Meeting resolved to elect Ernst & Young
Oy, Authorized Public Accountants as the auditor, with APA Heik-
ki Ilkka in charge and APA Terhi Mäkinen as the deputy auditor.
eVents after the financial PerioD
Basware Executive Team 1.1.2012:
Esa Tihilä, CEO; Matti Copeland, Senior Vice President, Strat-
egy; Mika Harjuaho, CFO; Mari Heusala, Senior Vice President,
HR&Dev; Jorma Kemppainen, Senior Vice President, Products;
Pekka Lindfors, Senior Vice President, Volume Sales; Steve Mud-
diman, Senior Vice President, Global Marketing; Riku Roos, Se-
nior Vice President, Automation Services; Matti Rusi, Senior Vice
President, Support and Jukka Virkkunen, Senior Vice President,
Enterprise Sales.
On January 17, 2012 Basware acquired the entire share capital
of e-Invoicing operator First Businesspost GmbH. The acquisition
price amounts to approximately EUR 12.2 million. The debt free
price is approximately EUR 9.0 million in addition to which Bas-
ware takes over approximately EUR 3.2 million of parent compa-
ny loans in the company. The acquisition price will be paid in cash
in connection with the closing of the acquisition so that 20 per-
cent of the debt free price will be paid to an escrow account. The
escrow agreement is in place until the end of January 2013. Bas-
ware consolidates First Businesspost’s figures into its net sales
and profit as of January 1, 2012.
A separate stock exchange release on the acquisition was is-
sued on January 18, 2012.
future outlooK
Market estimates released in January 2012 expect the software
market to grow 6.2 percent globally (previous forecast 7.0%) and
8.0 percent in the U.S. in 201 1 (forecast unchanged). The entire IT
services market is expected to grow by 4.7 percent globally (pre-
vious estimate 6.0%) and by 6.8 percent in the U.S. (previous es-
timate 6.0%) in 2012. According to research companies, the soft-
ware market is expected to grow in 2012 at a rate of 7.0 percent
globally, IT services by 5.6% and the IT market as a whole by 7.3
percent.
The world economy and markets are unstable, which may re-
sult in a decrease in license sales and demand for services. In ad-
dition, the conversion of license sales to SaaS solutions may have
an increasingly negative effect on the growth in net sales, espe-
cially with the company’s next-generation software family. The
shift in demand from license sales towards SaaS solutions will
support the long-term growth targets of the Automation Servic-
es business in the future.
During 2012, the company will be undergoing a strong trans-
formation from a software company into a service company,
which will change our operating methods, solutions, and servic-
es. In addition, the uncertainty in the market will continue. There-
fore, Basware estimates that its net sales for 2012 will increase on
the previous year, while its operating profit (EBIT) is estimated to
reach EUR 8–18 million.
BoarD’s DiViDenD ProPosal
Basware is a growth company that aims at increased market cap-
italization and moderate dividend yield. When preparing the divi-
dend proposal, the Board considers the company’s financial posi-
tion, profitability and prospects in the near future.
At the end of 201 1, the Group parent company’s distributable
funds are EUR 95,917,650.04.
Basware’s Board of Directors proposes to the Annual General
Meeting that a dividend of EUR 0.41 per share (2010: EUR 0.40)
be paid for 201 1.
Espoo, Finland, January 25, 2012
BASWARE CORPORATION
Board of Directors
Hannu Vaajoensuu, Chairman of the Board
Sakari Perttunen
Pentti Heikkinen
Eeva Sipilä
Ilkka Toivola
Esa Tihilä, CEO

annual report 2011 | group financial statements, IFRS44
EUR thousand Notes 1.1.– 31.12.20 1 1 1.1.– 31.12.2010 Change, %
NET SALES 2,3 107,750 1 03,094 4.5
Other operating income 5 172 189 –9.0Materials and services 6 –7,788 –6,395 21.8Employee benefits expenses 7 –61,575 –57,337 7.4Depreciation and amortization –5,004 –5,1 17 –2.2
Other operating expenses 8 –21,275 –20,947 1.6
operating profit 12,280 13,487 –8.9
Financial income 9 510 202 151.9
Financial expenses 9 –458 –365 25.6
Profit before tax 12,332 13,325 –7.5
Income tax expense 1 0 –2,661 –2,994 –1 1.1
Profit for the PerioD 9,671 1 0,331 –6.4
Other comprehensive incomeExchange differences on translating foreign operations 368 1,981 –81.4
Income tax relating to components of other comprehensive income 1 0 54 –454 1 1 1.9
Other comprehensive income, net of tax 422 1,527 –72.4
total comPrehensiVe income 10,093 1 1,857 –14.9
Profit attributable to:
Owners of the parent 9,671 1 0,331 –6.4
9,671 1 0,331 –6.4
Total comprehensive income attributable to:
Owners of the parent 10,093 1 1,857 –14.9
10,093 1 1,857 –14.9
Earnings per share (undiluted), EUR 1 1 0.76 0.90 –15.0Earnings per share (diluted), EUR 1 1 0.76 0.89 –14.5
Group statement of comprehensive income 1.1.–31.12.20 1 1 (IFRS)

45annual report 2011 | group financial statements, IFRS
EUR thousand Notes 31.12.20 1 1 31.12.2010 Change, %
ASSETS
Non-current assetsIntangible assets 12 19,208 18,085 6.2Goodwill 12 32,210 32,184 0.1Tangible assets 13 1,244 1,079 15.2Available-for-sale investments 14 38 38 0.0Long-term trade and other receivables 15 0 23 –100.0Deferred tax assets 20 2,680 2,074 29.2
non-current assets 55,379 53,483 3.5
Current assetsInventories 16 143 56 156.0Trade and other receivables 17 23,091 24,066 –4.0Income tax receivables 17 374 43 769.5Financial assets at fair value through profit or loss 18 0 35 –100.0Cash and cash equivalents 19 42,977 13,787 21 1.7
current assets 66,586 37,987 75.3
total assets 121,966 91,470 33.3
EUR thousand Notes 31.12.20 1 1 31.12.2010 Change, %
EQUITY AND LIABILITIES
Shareholder's equityShare capital 23 3,528 3,507 0.6Issue of shares 23 0 255 –100.0Share premium account 23 1,187 1,187 0.0
Own shares 23 –429 –629 31.8Fair value reserve and other reserves 23 62,516 34,803 79.6
Translation differences –1,266 –1,688 25.0
Retained earnings 34,340 29,644 15.8
Parent company's shareholders' equity 99,877 67,079 48.9
shareholders' equity 99,877 67,079 48.9
Non-current liabilitiesDeferred tax liability 20 2,079 2,751 –24.4Interest-bearing liabilities 24,25 524 32 1,536.7
Non-interest-bearing liabilities 24 486 631 –22.9
non-current liabilities 3,090 3,414 –9.5
Current liabilitiesInterest-bearing liabilities 24,25 158 3,550 –95.5Trade payables and other liabilities 24 16,765 16,201 3.5Tax liability from income tax 24 873 1,226 –28.8
Provisions 26 1,203 0
current liabilities 19,000 20,977 –9.4
total eQuity anD liaBilities 121,966 91,470 33.3
Group balance sheet 1.1.–31.12.20 1 1 (IFRS)

annual report 2011 | group financial statements, IFRS46
EUR thousand 1.1.– 31.12.20 1 1 1.1.– 31.12.2010
CASH FLOW FROM OPERATING ACTIVITIES
Profit for the period 9,671 1 0,331Adjustments for profit
Employee benefits 0 235Depreciation and amortization 5,004 5,1 17Finance income and expenses 123 189Unrealized profits and losses –175 –27Income taxes 2,661 2,994
Total adjustments for profit 7,613 8,508
Working capital changesIncrease (–) / decrease (+) in inventories –87 –23Increase (–) / decrease (+) in short term non-interest bearing receivables 1,067 –4,668Increase (–) / decrease (+) in short term non-interest bearing liabilities 273 1,534Change in provisions 1,203 0
Total working capital changes 2,456 –3,158
Interest paid –285 –43Interest received 483 66Other financial items in operating activities –285 –98
Income taxes paid –4,446 –3,084
Net cash from operating activities 15,207 12,523
EUR thousand 1.1.– 31.12.20 1 1 1.1.– 31.12.2010
CASH FLOW FROM INVESTING ACTIVITIES
Purchases of tangible and intangible assets –5,631 –2,722Acquisitions of subsidiaries 0 –1,732
net cash used in investing activities –5,631 –4,454
CASH FLOW FROM FINANCING ACTIVITIES
Share issue 28,063 2,505Repayments of borrowings –3,550 –5,551Dividends paid –5,120 –4,1 00
net cash used in financing activities 19,393 –7,147
Net change in cash and cash equivalents according to cash flow statement 28,969 922
Cash and cash equivalents at the beginning of period 13,822 12,21 0Effects of exchange rate changes on cash and cash equivalents 187 690
Cash and cash equivalents at the end of period 42,977 13,822
net change in cash and cash equivalents 28,969 922
In the cash flow statement cash and cash equivalents comprise of liquid funds and term deposits as well as financial assets at fair value through profit of loss.
Group cash flow statement 1.1.– 31.12.20 1 1 (IFRS)

47annual report 2011 | group financial statements, IFRS
EUR thousandShareholders'
capital Share issue
Share premium account Own shares
Invested non–restricted
equityOther
reservesTranslation differences
Retained earnings Total
SHARE HOLDERS' EQUITY 1.1.2010 3,440 140 69 –629 33,058 540 –3,214 23,176 56,580Comprehensive income 1,527 1 0,331 1 1,857Dividend distribution –4,1 00 –4,1 00Granted warrants 235 235Changes in reporting period 67 1 15 1,1 18 1,205 2 2,506
share holDers' eQuity 31.12.2010 3,507 255 1,187 –629 34,263 540 –1,688 29,644 67,079
EUR thousandShareholders'
capital Share issue
Share premium account Own shares
Invested non–restricted
equityOther
reservesTranslation differences
Retained earnings Total
SHARE HOLDERS' EQUITY 1.1.20 1 1 3,507 255 1,187 –629 34,263 540 –1,688 29,644 67,079Comprehensive income 422 9,671 10,093Dividend distribution –5,120Share issue 27,345 27,345Granted warrants 568 568Changes in reporting period 21 –255 200 –200 145 –89
share holDers' eQuity 31.12.20 1 1 3,528 0 1,187 –429 61,976 540 –1,266 34,340 99,877
Dividend per share was EUR 0.40 in year 2010 and EUR 0.36 in year 2009.
Group statement of changes in shareholders’ equity 1.1.–31.12.20 1 1 (IFRS)

annual report 2011 | group notes, IFRS48
Basware Corporation is a public Finnish company founded under the Finnish law. The company’s domicile is Espoo, Finland. The shares of the parent company Basware Corporation have been listed on the Helsinki Stock Exchange since 2000. Basware devel-ops software for Enterprise Purchase to Pay and Financial Man-agement solutions.
A copy of the Group financial statements is available on the In-ternet at www.basware.fi or the parent company’s headquarters, address Linnoitustie 2, Espoo, Finland.
The Board of Directors has approved the financial statements on January 25, 2012. Shareholders have the right to approve or reject the financial statements in the Annual General Meeting. The financial statements may also be revised in the Annual General Meeting.
1. accountinG PrinciPles
accounting principlesBasware Corporations’ financial statements have been prepared according to the International Financial Reporting Standards (IFRS), approved for use in EU countries, in accordance with the IAS and IFRS standards and IFRIC interpretations valid on Decem-ber 31, 201 1. The Group’s Financial Statements are presented in thousands of euro, which is the primary and reporting currency of the Group’s parent company, and they are based on acquisition costs unless otherwise stated in the accounting principles.
As of January 1, 201 1, the Group has applied the following new and revised standards and interpretations: » Amended IAS 24 Related Party Disclosures. The objective of the
amendment is to clarify and simplify the definition of a related party, especially with regard to significant influence or joint con-trol. The amendment had an effect on the processing of the fol-lowing matters, among others, where the related party was ex-panded through the so-called correspondence principle. The group estimates that the amendments to the standard have not had a significant effect on the group’s financial statements.
» Amended IAS 32 Financial Instruments: Presentation – Classifica-tion of Rights Issues. The amendment particularly applies to the
classification of rights issues offered for a fixed amount of for-eign currency. Under certain terms, subscription rights related to a rights issue denominated in a foreign currency can in the fu-ture be classified as equity and not derivative instruments as be-fore. The key requirement is that the rights are issued pro rata to an entity’s all existing shareholders in the same class for a fixed amount of currency. If the subscription right was considered a de-rivative instrument, changes in the fair value of the subscription rights during the subscription period would have to be recognized through profit or loss. The group estimates that the amendments to the standard have not had a significant effect on the group’s fi-nancial statements.
» Annual improvements to IFRSs (amendments to several standards)
The following standard amendments have not had an effect on the Group » Amendment to IFRIC 14 IAS 19- The Limit on a Defined Benefit As-
set, Minimum Funding Requirements and their Interaction. » IFRIC 19: Extinguishing Financial Liabilities with Equity Instruments
The Group will adopt in 2012 the following standards and interpre-tations whose application is not yet compulsory in financial state-ments. » Amendment: IFRS 7 Financial Instruments: Disclosures – Transfers
of Financial Assets. The amendment improves the transparency of notes with regard to transfers and derecognition of financial as-sets. The amendments help users of financial statements to under-stand the effects of transfer and derecognition of financial assets and identify any risks associated with continuing involvement in derecognized assets. The group estimates that the amendments will not have a significant effect on the group’s future financial statements.
annual improvements to ifrss The Group will adopt the following standards provided that they are approved by the EU. They are not expected to have effects on the Group. » Amendment: IFRS 1 First-time Adoption of IFRSs – Severe Hyper-
inflation and Removal of Fixed Dates for First-time Adopters. The amendment to the standard defines a new deemed cost-relat-ed exception for an entity that is publishing its first IFRS financial statements in a situation where its functional currency is or has been hyperinflatory.
» Amendment: IAS 12 Income Taxes: Recovery of Underlying As-sets. Deferred tax liabilities and assets associated with investment properties measured at fair value and property, plant and equip-ment measured with the revaluation model are measured on the basis of the assumption that the carrying amount of the underly-ing asset will be recovered entirely by sale.
Principles of consolidationBasware’s Group financial statements include the parent company Basware Corporation and the subsidiaries controlled by it. With re-gard to subsidiaries, the parent company’s control is based on full ownership of the share capital or a majority holding. The Company does not own shares in joint enterprises or affiliates.
The subsidiaries have been included in the Group financial statements as of the acquisition date. Intra-group holding is elimi-nated using the acquisition cost method. Acquired companies are accounted for using the purchase method according to which the assets and liabilities of the acquired company are measured at their fair value when it has been possible to determine the value reliably. Deferred taxes of the acquisition cost adjustments are recognized according to the valid tax rate and the remainder is recognized as goodwill on the balance sheet.
Intra-group business transactions, internal liabilities and receiv-ables, and internal profit distribution are eliminated in the Group financial statements.
transactions in foreign currencies Transactions in foreign currencies are recorded in the operating currency at the approximate exchange rates prevailing at the transaction dates. Monetary items in foreign currencies have been translated into the operating currency using the exchange rates at the end of the reporting period. Non-monetary items denominated in foreign currencies are carried at the exchange rate at the date
Notes to the group financial statements (IFRS)

49annual report 2011 | group notes, IFRS
of the transaction. Foreign exchange gains and losses related to normal business operations are entered in the appropriate income statement account before operating profit.
In the Group financial statements, the income statements of for-eign subsidiaries are translated into euros at the average rate for the financial period and balance sheets at the exchange rate of the balance sheet date. Average rate difference due to different exchange rates on the statement of comprehensive income and balance sheet are entered in other comprehensive income. Trans-lation differences arising from the elimination of foreign subsidiar-ies and translation of equity items accumulated after the acquisi-tion are entered in other comprehensive income. Foreign currency gains and losses from monetary items part of the net investment in a foreign unit are recognized in other comprehensive income and entered on the statement of comprehensive income when the net investment is abandoned.
revenue recognition Revenue recognition of product sales requires that there is a bind-ing agreement of the sale, the product has been delivered, pro-ceeds from the transaction can be reliably specified, the financial gain will benefit the company with sufficient probability, and sig-nificant benefits and risks related to ownership or rights of use of the product have been transferred to the buyer. License agree-ments with a right of return or conditions related to the product’s functionality or implementation project are recognized as revenue once the right of return has expired or the above-mentioned con-ditions have been fulfilled.
Service revenue is recognized at the time of delivery. Mainte-nance revenue is allocated over the contract period.
When net sales are calculated, sales revenue is adjusted for ex-change rate differences of foreign currency sales.
other operating incomeOther operating income includes proceeds from the sale of prop-erty, plant and equipment and possible rental income, recognized on a straight-line basis over the rental period.
operating profitThe IAS 1 Presentation of Financial Statements standard does not define the concept of operating profit. The Group uses the follow-ing definition of operating profit: operating profit is the net sum of operating income added to net sales, less the cost of purchase for finished goods which is adjusted with inventory changes, less the costs resulting from employee benefits, depreciation and possible impairment loss as well as other operating expenses. All other items of the income statement are presented after operating prof-it. Exchange differences and fair value changes of derivatives are included in operating profit, provided that they result from items related to business operations; otherwise they are recognized un-der financing items.
impairment of tangible and intangible assetsThe Group performs an annual impairment test of goodwill, those intangible assets that have unlimited useful lives, and unfinished development projects. Additionally indications of impairment are evaluated regularly. In case of such indications, the recoverable amount of the cash-generating unit or asset is evaluated.
The need for impairment is evaluated at the level of the cash-generating units, or the lowest nit level mainly independent of other units and whose cash flows can be differentiated and are highly independent of the cash flows of other corresponding units.
The book value of the cash generating unit and assets allocated to the unit are compared to the unit’s recoverable amount (value in use). Value in use refers to the estimated future net cash flows from the asset or cash-generating unit in question discounted to the current value.
The current value of future cash flows is based on the so-called perpetuity assumption (time period is infinite). The forecast cash flows are estimated for a period of five years and the value of the so-called residual part of use value after the forecast period is determined using the Gordon model. Value in use is based on cash flows according to business plans for the first year (annual budget) and according to long-term predictions (Planning Frame) for the two subsequent years. The cash flows for the following two years are estimated by extrapolating the cash flow of the third
year with the zero-growth assumption. The terminal period growth rate is 1%. The discount rates employed are the weighted aver-age of capital costs and its starting point is determining the risk in accordance with CAPM. The discount rate includes a risk-free interest rate that takes the time value of money into consideration and a risk premium.
If the value in use is lower than the carrying amount of the as-set, the impairment is entered as an expense on the income state-ment and allocated primarily to goodwill and thereafter against other assets on a pro rata basis.
If there is a positive change in the estimated recoverable amount of money, depreciation loss related to tangible fixed assets and other intangible assets, excluding goodwill, is nullified. However, an impairment loss is only reversed to the extent that the asset’s carrying amount does not exceed the carrying amount that would have been determined had no impairment loss been recognized. Goodwill impairment loss is not reversed in any situation. Addi-tionally, the impairment loss of equity instruments that are recog-nized as available-for-sale financial assets is not reversed through profit and loss.
GoodwillGoodwill is measured as the excess of the cost of the acquisition over the Group’s share of the fair values of the acquiree’s net as-sets at the time of the acquisition. Goodwill is recognized at the original acquisition cost less accumulated depreciation.
other intangible assetsOther intangible assets include software, capitalized product de-velopment costs, other long-term expenses, and customer rela-tionships. Intangible assets are recognized at the original acqui-sition cost less accumulated depreciation according to plan and possible impairment. Public subsidies related to the acquisition of an intangible asset are deducted from the acquisition cost of the asset and recognized as income by reducing the depreciation charge of the asset they are related to. The expected useful lives of intangible assets are 3 —10 years.

annual report 2011 | group notes, IFRS50
research and development costsResearch expenses are booked as an expense as they are incurred. Development costs of new products and new product versions with significant enhancements are capitalized and recognized and amortized over the useful life of 3–5 years. In determining the use-ful life, the obsolescence of technology and the typical life cycle of products in the industry are taken into consideration. Amorti-zation starts once the product version is launched. Maintenance of existing products and minor enhancements are recognized as they are incurred. Unfinished development projects are tested for impairment at the balance sheet date.
tangible assets Tangible assets include machinery and equipment. Tangible assets are recognized on the balance sheet at the original acquisition cost less accumulated depreciation according to plan and possible impairment. The useful lives of tangible assets are 3–10 years.
The useful life of an asset is reviewed at least at the end of each financial year and, if necessary, any change in expectations for financial benefit is accounted for.
Sales gains and losses on disposal or transfer of tangible assets are recognized through profit or loss.
Maintenance costs are recognized through profit or loss as they are incurred.
The company recognizes borrowing costs as an expense in the period during which they are incurred. If the borrowing costs are due to an asset whose completion for the intended purpose or sale necessarily requires a considerably long time, the borrowing costs are capitalized as part of the acquisition cost of the asset.
leasesLeases on property, plant and equipment are classified as finance leases if they transfer a substantial portion of the risks and re-wards incident to ownership. Finance leases are recognized on the balance sheet at the beginning of the lease as assets and liabilities at the lower of the fair value of the leased asset and the present value of the minimum lease payments. Commodities acquired us-ing finance leases are amortized according to plan and possible
impairment losses are recognized. Finance lease liabilities are rec-ognized under interest-bearing in short and long term liabilities.
If the risks and benefits typical of ownership remain with the les-sor, the contract is handled as another rental agreement and the payments executed based on the agreement are recognized as an expense in fixed installments over the lease period.
financial assetsThe Group’s financial assets are categorized to the following cat-egories: » Financial assets at fair value through profit or loss » Held-to-maturity investment » Loans and other receivables » Available-for-sale financial assets
The categorization is based on the purpose of the acquisition of the financial assets, and it is performed in connection with the original acquisition.
Transaction costs are included in the original book value of the financial assets, when the item in question is not recognized at fair value through profit or loss. All purchases and sales of financial assets are recognized at the transaction date, which is the date on which the Group commits to purchase or sell the financial in-struments. Derecognition of a financial assets is done when the Group has lost its contractual right to money flow or when it has, for a significant extent, transferred risks and profits to outside the group.
financial assets at fair value through profit or lossA financial asset is grouped into Financial assets at fair value through profit or loss category if it is acquired as held for trading, or it is designated as at fair value through profit or loss upon initial recognition. Held-for-trading financial assets are mainly acquired in order to obtain gains from changes in short-term market prices. The assets are valued at the fair market price at the balance sheet date, and the change in value is recognized under finance income on the income statement. There were no such financing items on the balance sheet at the closing date.
Derivatives that are not eligible for hedge accounting are classi-fied as held for trading. Derivatives held for trading are included in long-term assets if they mature in more than 12 months; otherwise they are categorized in short-term assets, as are financial assets that mature in 12 months. There were no such derivatives on the balance sheet at the closing date.
held-to-maturity investmentsHeld-to-maturity investments are non-derivative financial assets with fixed or determinable payments and fixed maturity that the Group has the positive intent and ability to hold to maturity.
They are valued at amortized cost and are included in non-cur-rent assets. There were no such financing items on the balance sheet at the closing date.
loans and other receivablesLoans and other receivables are non-derivative financial assets with fixed or determinable payments that are not quoted in an active market and are not held by the Group with the intent to sell. Loans and other receivables are valued at amortized cost using the effective rate method. They are included in current or non-current trade receivables and other receivables category on the balance sheet in accordance with their nature. If the receivable matures in more than 12 months, it is categorized in long-term re-ceivables.
available-for-sale financial assetsAvailable-for-sale financial assets are non-derivative financial as-sets specifically designated to this group or not categorized oth-erwise. They are included in long-term assets unless they are in-tended to be held for less than 12 months as of the closing date, in which case they are included in short-term assets. Available-for-sale financial assets are measured at fair value. When the fair value cannot be reliably determined, they are measured at acquisi-tion cost.
Changes in the fair value of available-for-sale financial assets are entered in other comprehensive income and presented in the fair value reserve, taking into account the tax effect. Changes in

51annual report 2011 | group notes, IFRS
fair value are transferred from equity to the income statement as adjustments when the instrument is sold or its value has de-creased so that an impairment loss has to be recognized for the instrument.
cash and cash equivalentsCash and cash equivalents consist of cash, bank deposits that can be withdrawn on demand and other current highly liquid invest-ments that can be exchanged to an amount of cash assets that is known in advance, and with a low risk of changes in value. Items classified as cash and cash equivalents have a maximum maturity of three months from acquisition.
financial liabilitiesFinancial liabilities are initially recognized at fair value. Transac-tion costs have been included in the original carrying amount of financial liabilities measured at amortized cost. Subsequently, all financial liabilities, excluding derivative liabilities, are valued at amortized cost using the effective interest rate method. Financial liabilities are divided into current and non-current liabilities and they can either be interest-bearing or non-interest-bearing.
Derivative contracts Derivative contracts are recognized initially at fair value at the date on which the Group enters into the agreement, and subse-quently they are still measured at fair value. Gains and losses re-sulting from fair value measurement are treated in accounting as specified by the purpose of the derivative contract. There were no such derivative contracts on the balance sheet at the closing date.
impairment of financial assetsBased on a risk assessment, impairment is made for uncertain sales receivables. Significant financial problems of a debtor, likeli-hood of bankruptcy, default of payments or a delay of more than 180 days of a payment are indications of the impairment of sales receivables. If the amount of the impairment loss is decreased dur-ing a subsequent period and the decrease can be objectively con-sidered to be associated with an event after the impairment was
recognized, the recognized loss is reversed through profit or loss.Additionally, an assessment is conducted at each closing date to
determine if there is objective evidence of impairment of an item or a category included in the financial assets.
ProvisionsA provision is recognized when the Group has a present legal or constructive obligation as a result of a past event, it is probable that the obligation will have to be settled, and the amount of the obligation can be reliably estimated. Provisions are measured at the present value required in order to cover the obligation. The present value factor used in the calculation of the present value is selected so that it represents the market insight into the time value of money and liability-related risks at the time of the assess-ment.
PensionsThe statutory pension coverage of Basware Corporation employ-ees is provided through insurance policies taken out with a pen-sion institution. Pension coverage for personnel employed by units outside Finland is arranged in line with the requirements of lo-cal legislation and social security provisions. Payments related to defined contribution pension plans are recognized on the income statement in the year they are incurred. There are no defined ben-efit plans.
share-based payment costsThe Group has incentive schemes in which the payments are made as either equity instruments or in cash. The benefits granted in the schemes are measured at fair value at the grant date and recog-nized as an expense evenly during the earnings period. In schemes where the payments are made in cash, the liability recognized and change in its fair value is correspondingly allocated as expenses. The result impact of the schemes is presented under employee benefits expenses.
taxationThe tax expenses on the income statement comprise of tax based
on the taxable income for the financial year and deferred taxes. Tax expenses are recognized in the income statement except for the expenses entered directly to shareholders’ equity when they are entered on the balance sheet as part of shareholders’ equity. Taxes based on the results of the Group companies are recorded according to the local tax rules of each country.
Deferred taxes are calculated from all temporary differences between the carrying amount and taxable value. Deferred tax is not recognized for non-tax deductible goodwill and deferred tax is not recognized for non-distributed profits of subsidiaries in so far as the difference is not likely to be discharged in the foreseeable future.
At the closing date, a company-specific assessment of the amount of deferred tax assets included on the balance sheet is conducted and it is reduced to the extent that likely cannot be utilized in the taxation of the company in question. Deferred tax liabilities are wholly included on the balance sheet.
The most significant temporary differences arise from deprecia-tion of property, plant and equipment, unused tax losses, adjust-ments for fair values in connection with acquisitions, and restruc-turing provisions.
own sharesShare repurchase and conveyance of shares and related costs are presented under shareholders’ equity.
accounting principles requiring management’s consideration and key uncertainties relating to the estimatesWhen preparing the financial statements, estimates and supposi-tion regarding the future have to be made. Realization may, how-ever, differ from these estimates. Additionally, discretion must be used when applying the accounting principles. The estimates are based on the best views of the management at the time of the closing of the books. Possible changes in the estimates and suppo-sitions are recorded in accounting in the period when the estimate or supposition is adjusted and in all the following financial periods.
The management believes that the estimates and suppositions are accurate enough to be used as basis for fair value assessment.

annual report 2011 | group notes, IFRS52
Additionally, the Group reviews the possible indications of depre-ciation regarding both tangible and intangible assets at each clos-ing date, at the latest.
The most significant estimates included in the financial state-ments are related to measurement of assets, current sales receiv-ables (Note 17), utilization of deferred tax assets (Note 20) and capitalization of product development expenses (Note 12).
The Group performs an annual impairment test of goodwill, those intangible assets that have unlimited useful lives, and un-finished development projects and evaluates indications of impair-ment as presented above. Recoverable amounts of cash-generat-ing units have been determined by calculations based on value in use. More information on the measurement of intangible assets in company mergers can be found in note 4. Product development costs are capitalized in intangible assets regarding new products as well as product versions with significant upgrades and amor-tized during the useful life after the product has been completed.
2. oPeratinG seGmentsBasware Group’s operations are mainly led as geographical en-tities. Basware’s reported business segments are based on geo-graphical location: Finland, Scandinavia, Europe, and Other. The Finland segment includes the business operations in Finland, Rus-sia, and Asia-Pacific (excluding Australia) and the head office func-tions. The business operations in North America and Australia are reported in the Other segment.
Revenue, assets and liabilities are allocated to operating seg-ments according to the location of assets. Therefore the revenues from reseller activities in Asia-Pacific (excluding Australia as of July 1, 2009) as well as in Russia and other areas outside of Eu-rope (excluding North America), are included in the Finland seg-ment.
According to the transfer pricing regulations of the Group, transactions between Group companies are conducted on so called Arm’s Length terms. As of January 1, 2008, the so-called Transactional Net Margin method compliant with the principles of OECD’s Transfer Pricing Guidelines is applied to transfer pricing between Basware Corporation and its subsidiaries (“Revenue Gen-
erating Units”). The “Cost Plus method” is applied to “offshoring” services offered by the Non-Revenue Generating Units.
In addition, the company reports revenue from products and services as follows: License sales, Professional Services, Mainte-nance Services, and Automation Services. License Sales include the Purchase to Pay (P2P) product suite and financial control and payment automation products marketed exclusively in Finland. License Sales also include sales of third-party scanning software.
Work related to customer projects, such as software installation, business consulting and project management are included in Pro-fessional Services.
Yearly maintenance fees as well as the customer work of the personnel in the support units are included in the Maintenance and support segment.
Automation Services include paper invoice scan and capture services, exchange of purchase catalogues and purchase mes-sages, e-invoicing, supplier activation and Software as a Service (SaaS) services.
Assets and investments are allocated to products and services according to the primary function of the cost center. Non-allocated assets include cash and bank receivables, capitalized research and development costs, and goodwill. There is no non-allocated rev-enue.

53annual report 2011 | group notes, IFRS
Geographical segments
EUR thousand1.1.– 31.12.20 1 1 Finland Scandinavia Europe Others Eliminations Not allocated Group total
INCOME STATEMENT INFORMATIONExternal net sales 50,028 25,230 19,867 12,625 107,750
Internal net sales 7,657 463 1,073 1 12 –9,305
net sales 57,685 25,693 20,940 12,737 –9,305 107,750
Operating profit of the segment 6,812 4,533 1,629 963 –1,657 12,280
operating profit 12,280
Finance income and expenses –52 –52Income tax expense –2,661 –2,661
Profit for the period 6,123 3,149 1,139 381 –1,120 9,671
Profit for the period 9,671
BALANCE SHEET INFORMATIONSegment's assets 25,837 19,432 14,787 8,082 68,138
Non-allocated assets 53,828 53,828
total assets 25,837 19,432 14,787 8,082 53,828 121,966
Segment's liabilities 1 1,422 6,455 2,202 1,829 –3,067 18,841
total liabilities 11,422 6,455 2,202 1,829 –3,067 18,841
OTHER INFORMATIONNet sales, goods 8,826 4,568 4,633 2,848 20,874Net sales, services 41,203 20,662 15,234 9,777 86,875Investments 6,135 92 66 38 6,331Depreciation and amortization –1,216 –1,410 –215 –380 –1,784 –5,004

annual report 2011 | group notes, IFRS54
Geographical segments
EUR thousand1.1.– 31.12.2010 Finland Scandinavia Europe Others Eliminations Not allocated Group total
INCOME STATEMENT INFORMATIONExternal net sales 47,254 23,561 20,264 12,0 15 1 03,094
Internal net sales 6,352 627 1,083 86 –8,149
net sales 53,606 24,188 21,347 12,1 0 1 –8,149 1 03,094
Operating profit of the segment 7,703 4,136 2,354 924 –1,629 13,487
operating profit 13,487
Finance income and expenses –162 –162Income tax expense –2,994 –2,994
Profit for the period 1 1,932 3,278 1,81 0 723 –7,412 1 0,331
Profit for the period 1 0,331
BALANCE SHEET INFORMATIONSegment's assets 28,025 17,799 15,049 8,450 69,323
Non-allocated assets 22,147 22,147
total assets 28,025 17,799 15,049 8,450 22,147 91,470
Segment's liabilities 9,772 5,869 3,146 2,955 –4,314 17,427
total liabilities 9,772 5,869 3,146 2,955 –4,314 17,427
OTHER INFORMATIONNet sales, goods 1 0,1 17 4,362 5,685 4,528 24,692Net sales, services 37,137 19,200 14,579 7,487 78,402Investments 2,548 69 483 37 1,430 4,567Depreciation and amortization –1,272 –1,372 –218 –375 –1,879 –5,1 17

55annual report 2011 | group notes, IFRS
3. net sales By customer location
EUR thousand 1.1.– 31.12.20 1 1 1.1.– 31.12.20 1 0
Finland 48,660 46,550Scandinavia 25,381 23,346Europe 20,187 20,249
Other areas 13,522 12,949
net sales 107,750 1 03,094
4. acQuireD Business oPerationsIn October 2010, Basware Corporation acquired TNT Post’s Connec-tivity operations, which are part of TNT Post’s electronic invoicing operations in the Netherlands. The purchase price paid in connec-tion with the transaction was EUR 50 thousand, and an additional purchase price of EUR 100 thousand was paid during the second quarter of 201 1 on the basis of the number of customers that have migrated to the Basware e-invoicing environment.
acquisitions after the end of the financial periodBasware Corporation acquired the entire share capital of the e-invoice operator First Businesspost GmbH on January 17, 2012. The purchase price was approximately EUR 12.2 million. The debt-free purchase price was approximately EUR 9.0 million, in addition to which Basware takes over approximately EUR 3.2 million of parent company loans in First Businesspost. The acquisition price was paid
wholly in cash in connection with the closing of the acquisition so that 20% of the debt free price was paid to an escrow account. The escrow agreement is in place until the end of January 2013.
The synergy benefits of the new business combination are pri-marily derived from accelerated growth potential as Basware will be incorporating First Businesspost technology into its offering in-ternationally.
The accounting of the First Businesspost acquisition is incom-plete due to the time of the acquisition, January 17, 2012. Basware will consolidate First Businesspost in its net sales and result as of January 1, 2012. Therefore, preliminary figures on business combi-nation regarding the acquired assets, liabilities and equity shares have not been determined, and the preliminary purchase price al-location is incomplete. While the preliminary purchase price allo-cation is incomplete, its allocation to assets and goodwill has not been determined.
net sales, assets, investments by segmentsEUR thousands 20 1 1 License Sales Professional Services Maintenance Automation Services Not allocated Total
Net sales 20,874 34,179 36,247 16,449 107,750Assets 7,694 12,1 15 1,996 1,335 98,826 121,966Investments 4,148 829 1,354 6,331
EUR thousands 2010 License Sales Professional Services Maintenance Automation Services Not allocated Total
Net sales 24,688 32,702 33,273 12,431 1 03,094Assets 1 1,525 8,937 3,1 17 979 66,912 91,470Investments 1,696 2,871 4,567
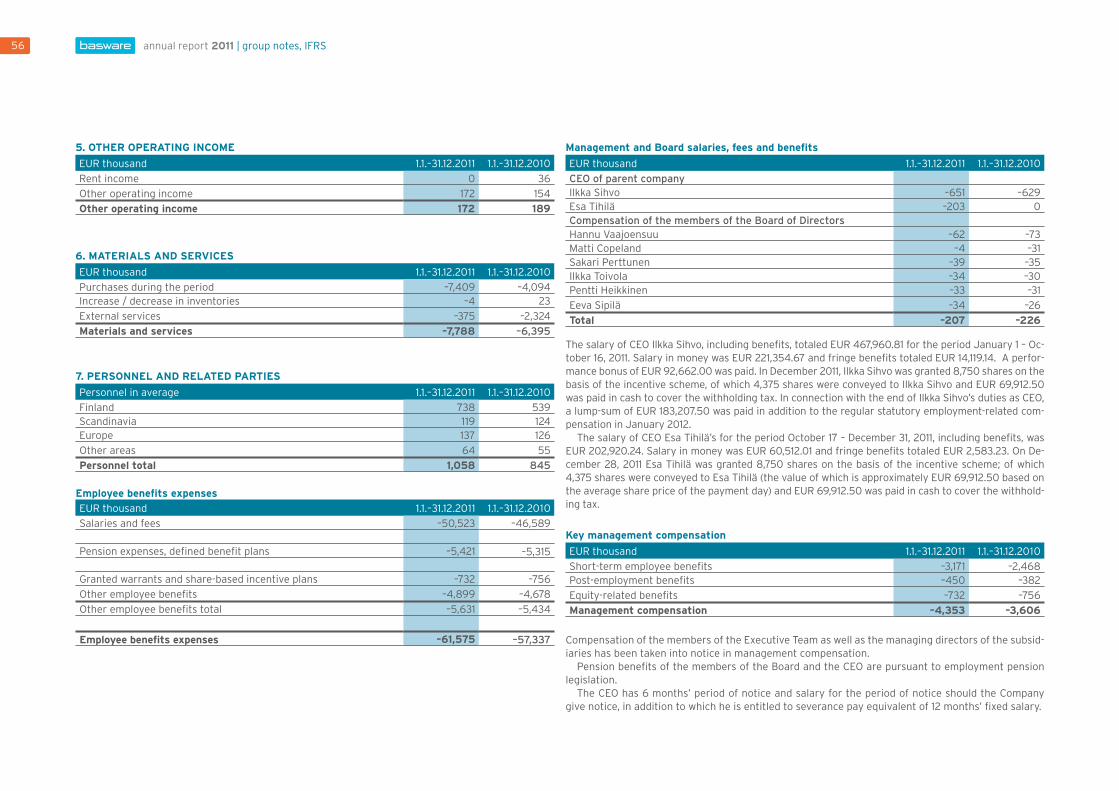
annual report 2011 | group notes, IFRS56
5. other oPeratinG income
EUR thousand 1.1.– 31.12.20 1 1 1.1.– 31.12.20 1 0
Rent income 0 36
Other operating income 172 154
other operating income 172 189
6. materials anD serVices
EUR thousand 1.1.– 31.12.20 1 1 1.1.– 31.12.20 1 0
Purchases during the period –7,409 –4,094Increase / decrease in inventories –4 23
External services –375 –2,324
materials and services –7,788 –6,395
7. Personnel anD relateD Parties
Personnel in average 1.1.– 31.12.20 1 1 1.1.– 31.12.20 1 0
Finland 738 539Scandinavia 1 19 124Europe 137 126
Other areas 64 55
Personnel total 1,058 845
employee benefits expenses
EUR thousand 1.1.– 31.12.20 1 1 1.1.– 31.12.20 1 0
Salaries and fees –50,523 –46,589
Pension expenses, defined benefit plans –5,421 –5,315
Granted warrants and share-based incentive plans –732 –756
Other employee benefits –4,899 –4,678
Other employee benefits total –5,631 –5,434
employee benefits expenses –61,575 –57,337
management and Board salaries, fees and benefits
EUR thousand 1.1.– 31.12.20 1 1 1.1.– 31.12.20 1 0
CEO of parent companyIlkka Sihvo –651 –629Esa Tihilä –203 0Compensation of the members of the Board of DirectorsHannu Vaajoensuu –62 –73Matti Copeland –4 –31Sakari Perttunen –39 –35Ilkka Toivola –34 –30Pentti Heikkinen –33 –31
Eeva Sipilä –34 –26
total –207 –226
The salary of CEO Ilkka Sihvo, including benefits, totaled EUR 467,960.81 for the period January 1 – Oc-tober 16, 2011. Salary in money was EUR 221,354.67 and fringe benefits totaled EUR 14,119.14. A perfor-mance bonus of EUR 92,662.00 was paid. In December 2011, Ilkka Sihvo was granted 8,750 shares on the basis of the incentive scheme, of which 4,375 shares were conveyed to Ilkka Sihvo and EUR 69,912.50 was paid in cash to cover the withholding tax. In connection with the end of Ilkka Sihvo’s duties as CEO, a lump-sum of EUR 183,207.50 was paid in addition to the regular statutory employment-related com-pensation in January 2012.
The salary of CEO Esa Tihilä’s for the period October 17 – December 31, 2011, including benefits, was EUR 202,920.24. Salary in money was EUR 60,512.01 and fringe benefits totaled EUR 2,583.23. On De-cember 28, 2011 Esa Tihilä was granted 8,750 shares on the basis of the incentive scheme; of which 4,375 shares were conveyed to Esa Tihilä (the value of which is approximately EUR 69,912.50 based on the average share price of the payment day) and EUR 69,912.50 was paid in cash to cover the withhold-ing tax.
Key management compensation
EUR thousand 1.1.– 31.12.20 1 1 1.1.– 31.12.20 1 0
Short-term employee benefits –3,171 –2,468Post-employment benefits –450 –382
Equity-related benefits –732 –756
management compensation –4,353 –3,606
Compensation of the members of the Executive Team as well as the managing directors of the subsid-iaries has been taken into notice in management compensation.
Pension benefits of the members of the Board and the CEO are pursuant to employment pension legislation.
The CEO has 6 months’ period of notice and salary for the period of notice should the Company give notice, in addition to which he is entitled to severance pay equivalent of 12 months’ fixed salary.

57annual report 2011 | group notes, IFRS
share-based paymentsWarrants have been granted to the key personnel to increase their commitment and work motivation. The valuation model used is Black–Scholes, and the estimated personnel reductions have been taken into account in the calculations. The expected volatility is based on the volatility of the year preceding the date of issue of warrants.
Warrants 2006C 2007E
Date of issue 31.1.2009 13.5.2007Issued number 80,005 78,1 00Subscription price 8.27 8.27Volume-weighted price on the date of issue 7.35 12.00Volume-weighted fair value on the date of issue 2.02 2.4Expected volatility 25% 25%Risk free interest 4.00% 4.00%Expected dividends 2.00% 2.00%End of subscription period 31.3.201 1 31.3.201 1
share-based incentive plan 2009 2010 2011
Basic valuesMaximum number of shares 42,000 36,000 47,175Maximum number of cash 42,000 36,000 47,175Date of issue 1 1.3.2009 18.2.2010 14.3.201 1Beginning of earning period 1 1.3.2009 18.2.2010 14.3.201 1End of earning period 31.12.201 1 31.12.2012 31.12.2013
Vesting conditions Working commitment
Working commitment
Working commitment
Criterions EPS EPS EPS
Form of the reward Shares and cash Shares and cash Shares and cashNumber of persons, date of issue 8 8 12Share price, date of issue 7.50 17.70 24.25The annual expected dividends, fair value 0.49 0.74 0.82Closing share price December 31, 2009 14.01Closing share price December 31, 20 1 0 24.75 24.75Closing share price December 31, 20 1 1 16.45 16.45Fair value December 31, 2009 589,120Fair value December 31, 20 1 0 972,650 875,910Fair value December 31, 20 1 1 908,380 1,082,773Recognized liability, cash portion 290,909 127,484
8. other oPeratinG eXPenses
EUR thousand 1.1.– 31.12.20 1 1 1.1.– 31.12.20 1 0
Rents –3,360 –3,097Non-statutory employee benefits –1,026 –960
Audit fees –228 –273Tax advices –10 –18
Other fees and services –46 –42
audit fees total –284 –333
Travel –4,160 –4,063Marketing –4,092 –3,757IT and telephone –1,920 –1,742
Other expenses –6,433 –6,995
Total –16,605 –16,557
other operating expenses total –21,275 –20,947
Research and development expensesResearch and development in income statement –12,180 –13,188
Increases in capitalized research and development expenses –4,309 –1,696
total –16,489 –14,883

annual report 2011 | group notes, IFRS58
9. financial income anD eXPenses
EUR thousand 1.1.– 31.12.20 1 1 1.1.– 31.12.2010
Finance incomeChanges in value of financial assets atfair value through profit or loss
Interest rate derivatives, no hedge accounting –8 –39Other interest and financial income 518 241
Total 510 202
Finance expensesInterest expenses for financial liabilities valued at amortized acquisition cost –32 –43Changes in value of financial assets at fair value through profit or loss
- Interest rate derivatives, no hedge accounting 9 45- Interest fund –249 0
Other finance expenses –186 –367
total –458 –365
finance income and expenses total 52 –162
Other finance income is comprised of the proceeds of fund investments and realized exchange gains.Other finance expenses are comprised of realized exchange losses and finance lease interest paid.
exchange differences recognized on income statementEUR thousand 1.1.– 31.12.20 1 1 1.1.– 31.12.20 1 0
Exchange differences included in net sales –36 –35Exchange differences included in purchases and expenses 258 298Foreign exchange gains 39 175
Foreign exchange losses –170 –31 0
exchange differences recognized on income statement 91 128
1 0. income taXes
taxes relating to other comprehensive income
EUR thousand 1.1.– 31.12.20 1 1 1.1.– 31.12.20 1 0
Taxes on foreign exchange gains from net investments 54 –454
Direct tax
EUR thousand 1.1.– 31.12.20 1 1 1.1.– 31.12.20 1 0
Income tax on operations –3,665 –3,649Tax for previous accounting periods –245 84
Change in deferred tas liabilities and tax assets 1,249 571
income tax –2,661 –2,994
tax base reconciliation
EUR thousand 1.1.– 31.12.20 1 1 1.1.– 31.12.20 1 0
Profit before taxes 12,332 13,325
Tax calculated at domestic tax rate *) –3,206 –3,465Effect on different tax rates applied to foreign subsidiaries –97 –21Non-deductible expenses –77 –73Other 143 54Tax for previous accounting periods –245 84Non-taxable income 0 85Change in parent company tax rate 4 0Untapped tax on result for the period 256 341
Taxes recognized from confirmed tax loss 562 0
tax provision on income statement –2,661 –2,994
*) Domestic (Finland) tax rate was 26 percent in 2010 and 20 1 1.
1 1. earninG Per share
1.1.– 31.12.20 1 1 1.1.– 31.12.20 1 0
Profit for the period, EUR thousand 9,671 1 0,331
average share number, 1,000 piecesundiluted 12,679 1 1,514diluted 12,687 1 1,585
EPS (undiluted), EUR 0.76 0.90EPS (diluted), EUR 0.76 0.89
Dividend per shareThe Board of Directors proposes to the Annual Generel Meeting of shareholders on February 17, 20 1 2 that a dividend of EUR 0.41 per share be paid, total of proposed dividend is EUR 5,277,337.14.

59annual report 2011 | group notes, IFRS
12. GooDWill anD other intanGiBle assets
Goodwill
EUR thousand 201 1
Acquisition cost 1.1. 32,184Translation difference 26
Additions 0
Acquisition cost 31.12. 32,210
Book value 31.12.20 1 1 32,210
Goodwill
EUR thousand 2010
Acquisition cost 1.1. 31,1 19Translation difference 793
Additions 272
Acquisition cost 31.12. 32,184
Book value 31.12.2010 32,184
Goodwill comprises of the following arrangements:
Corporate restructuring Goodwill
Momentum Doc, AB (2002) 1,091Iocore AS / Basware AS (2005) 3,102Itella Information AS/Basware AS (2009) 519Trivet Oy (2005) 669Analyste Oyj (2006) 13,874Digital Vision Technologies Ltd. (2007)/ Basware UK 7,462
Contempus AS (2008) 5,492
total 32,210
Goodwill has been allocated to cash-generating units according to the synergy benefits expected to result from unifying the operations:
Cash generating unit Goodwill
Basware Oyj 16,640Basware AB 545Basware AS 7,563
Basware UK 7,462
Total 32,210
Goodwill has been tested for impairment in the last quarter of 2011, and the discount rate used in the impairment testing is 9.49 per-cent (Basware Corporation), 9.53 percent (Basware AB), 9.71 per-cent (Basware AS), and 9.63 percent (Basware UK). The weighted average cost of capital reflects the capital structure at the time of the test. The recoverable amount evaluated in the impairment test is based on the 2012 budget and on subsequent development assessed on the basis of the budget. Key variables used in the cal-culations are the change rates of net sales and costs. The growth of net sales has been determined by taking into account the com-pany’s actual performance, market position and growth potential in the market in question.
On grounds of sensitivity analyses based on the zero-growth scenario the management of the Company estimates that it is un-likely that a change in the key variables used in the test would cre-ate a situation where the accounting value of goodwill included in the balance sheet exceeded the recoverable amount of the unit.
Growth in Basware UK’s net sales is expected to follow the target of the company’s strategy for the planning period in broad outline: annual growth of more than 50% in SaaS, Connectivity Services, and e-invoicing, and the company’s long-term target of growth of more than 15%–30% in the total net sales. The tested accounting value of the assets of the company is EUR 7.5 million. The recover-able amount according to the business plans is approximately EUR 17.2 million and correspondingly approximately EUR 7.6 million in the zero-growth scenario. If the unit’s annual growth during the planning period is between –1 and +12 percent, sensitivity analyses show that the unit’s recoverable amount is approximately EUR 7.6 million.
If Basware UK’s annual growth in net sales during the planning period remains under the range of –1 to +12 percent, this would constitute a situation with indications of impairment of goodwill. If the value in use according to testing for impairment of goodwill performed at this time was lower than the accounting value of the unit’s assets tested, the impairment would be recognized as a cost in the income statement and would be primarily allocated to good-will on the balance sheet.
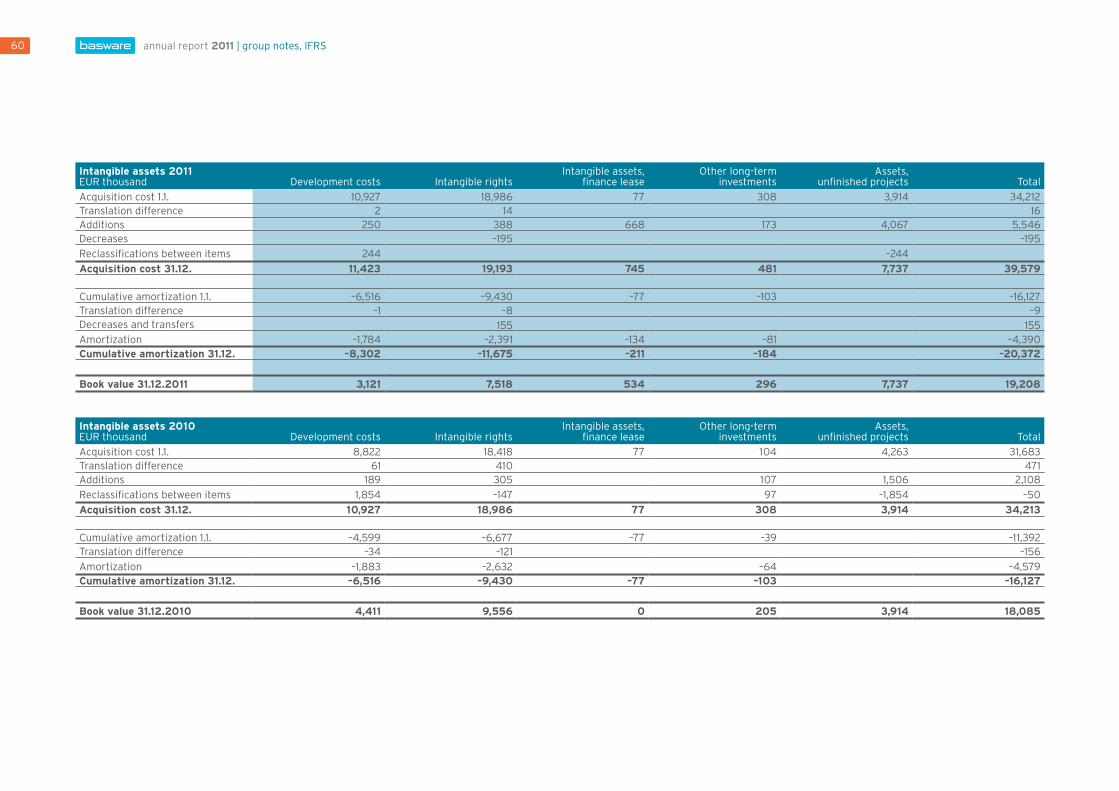
annual report 2011 | group notes, IFRS60
intangible assets 20 1 1 EUR thousand
Development costs
Intangible rights
Intangible assets, finance lease
Other long-term investments
Assets, unfinished projects
Total
Acquisition cost 1.1. 10,927 18,986 77 308 3,914 34,212Translation difference 2 14 16Additions 250 388 668 173 4,067 5,546Decreases –195 –195
Reclassifications between items 244 –244
acquisition cost 31.12. 11,423 19,193 745 481 7,737 39,579 Cumulative amortization 1.1. –6,516 –9,430 –77 –103 –16,127Translation difference –1 –8 –9Decreases and transfers 155 155Amortization –1,784 –2,391 –134 –81 –4,390cumulative amortization 31.12. –8,302 –11,675 –211 –184 –20,372
Book value 31.12.20 11 3,121 7,518 534 296 7,737 19,208
intangible assets 20 1 0 EUR thousand
Development costs
Intangible rights
Intangible assets, finance lease
Other long-term investments
Assets, unfinished projects
Total
Acquisition cost 1.1. 8,822 18,418 77 1 04 4,263 31,683Translation difference 61 41 0 471Additions 189 305 1 07 1,506 2,1 08
Reclassifications between items 1,854 –147 97 –1,854 –50
acquisition cost 31.12. 1 0,927 18,986 77 308 3,914 34,213 Cumulative amortization 1.1. –4,599 –6,677 –77 –39 –1 1,392Translation difference –34 –121 –156
Amortization –1,883 –2,632 –64 –4,579cumulative amortization 31.12. –6,516 –9,430 –77 –1 03 –16,127
Book value 31.12.20 1 0 4,41 1 9,556 0 205 3,914 18,085

61annual report 2011 | group notes, IFRS
13. tanGiBle assets
tangible assets 2011EUR thousand Machinery and equipment
Machinery and equipment, finance lease
Other tangible assets Total
Acquisition cost 1.1. 6,346 137 86 6,568Translation difference 15 15Additions 779 7 785
Disposals –5 –5
acquisition cost 31.12. 7,133 137 92 7,363
Cumulative depreciation 1.1. –5,352 –137 –5,489Translation difference –16 –16Depreciation –614 –614
cumulative depreciation 31.12. –5,982 –137 –6,119
Book value 31.12.20 1 1 1,152 0 92 1,244
tangible assets 20 1 0EUR thousand Machinery and equipment
Machinery and equipment, finance lease
Other tangible assets Total
Acquisition cost 1.1. 5,421 134 78 5,633Translation difference 126 3 128Additions 750 8 757
Disposals 50 50
acquisition cost 31.12. 6,346 137 86 6,568
Cumulative depreciation 1.1. –4,685 –126 –4,81 1Translation difference –96 –3 –99Depreciation –571 –9 –579cumulative depreciation 31.12. –5,352 –137 –5,489
Book value 31.12.20 1 0 994 0 86 1,079
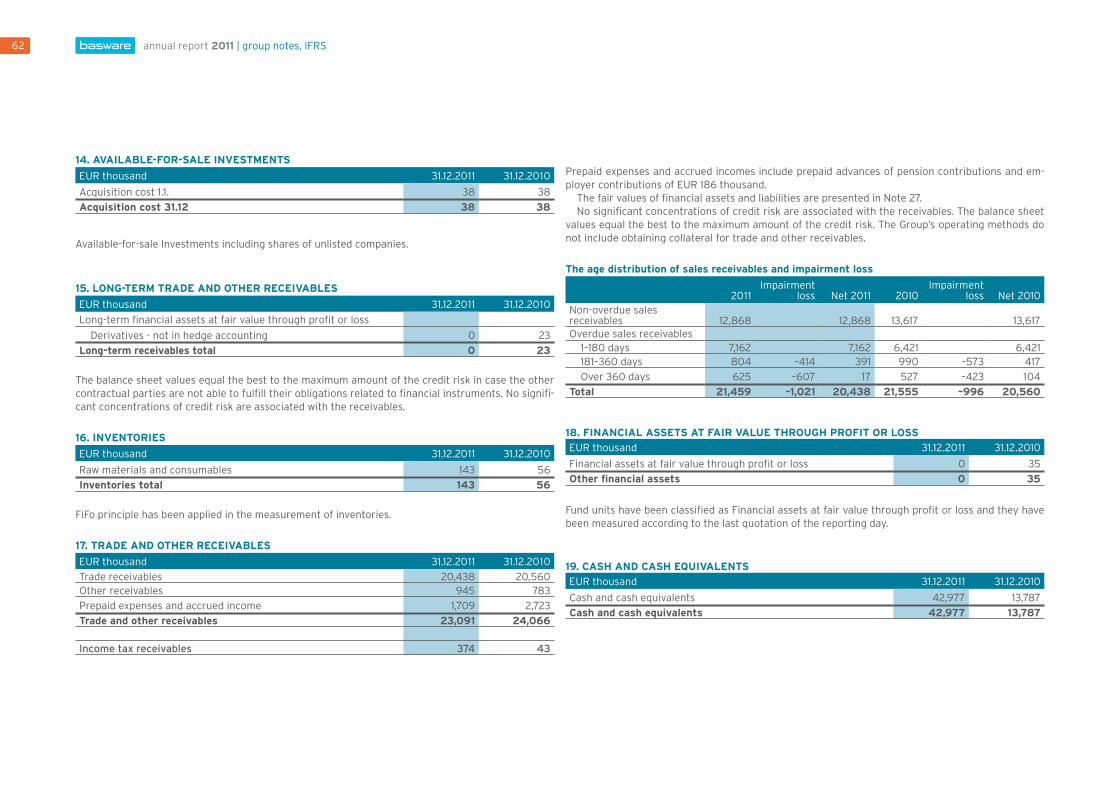
annual report 2011 | group notes, IFRS62
14. aVailaBle-for-sale inVestments
EUR thousand 31.12.20 1 1 31.12.20 1 0
Acquisition cost 1.1. 38 38
acquisition cost 31.12 38 38
Available-for-sale Investments including shares of unlisted companies.
15. lonG-term traDe anD other receiVaBles
EUR thousand 31.12.20 1 1 31.12.20 1 0
Long-term financial assets at fair value through profit or loss
Derivatives - not in hedge accounting 0 23
long-term receivables total 0 23
The balance sheet values equal the best to the maximum amount of the credit risk in case the other contractual parties are not able to fulfill their obligations related to financial instruments. No signifi-cant concentrations of credit risk are associated with the receivables.
16. inVentories
EUR thousand 31.12.20 1 1 31.12.20 1 0
Raw materials and consumables 143 56
inventories total 143 56
FiFo principle has been applied in the measurement of inventories.
17. traDe anD other receiVaBles
EUR thousand 31.12.20 1 1 31.12.20 1 0
Trade receivables 20,438 20,560Other receivables 945 783
Prepaid expenses and accrued income 1,709 2,723
trade and other receivables 23,091 24,066
Income tax receivables 374 43
the age distribution of sales receivables and impairment loss
20 1 1Impairment
loss
Net 20 1 1 2010Impairment
loss
Net 2010Non-overdue sales receivables 12,868 12,868
13,617
13,617
Overdue sales receivables1–180 days 7,162 7,162 6,421 6,421181– 360 days 804 –414 391 990 –573 417
Over 360 days 625 –607 17 527 –423 1 04
total 21,459 –1,021 20,438 21,555 –996 20,560
18. financial assets at fair Value throuGh Profit or loss
EUR thousand 31.12.20 1 1 31.12.2010
Financial assets at fair value through profit or loss 0 35
other financial assets 0 35
Fund units have been classified as Financial assets at fair value through profit or loss and they have been measured according to the last quotation of the reporting day.
19. cash anD cash eQuiValents
EUR thousand 31.12.20 1 1 31.12.2010
Cash and cash equivalents 42,977 13,787
cash and cash equivalents 42,977 13,787
Prepaid expenses and accrued incomes include prepaid advances of pension contributions and em-ployer contributions of EUR 186 thousand.
The fair values of financial assets and liabilities are presented in Note 27.No significant concentrations of credit risk are associated with the receivables. The balance sheet
values equal the best to the maximum amount of the credit risk. The Group’s operating methods do not include obtaining collateral for trade and other receivables.

63annual report 2011 | group notes, IFRS
20. DeferreD taX assets anD liaBilities
Deferred tax asset 20 1 1
EUR thousand
1.1.20 1 1
In income statement
In comprehensive income
In shareholders' equity
Companies acquired/sold
31.12.20 1 1
Losses 1,723 417 –31 2,109
Other items 352 194 18 7 571
total 2,074 611 18 –24 2,680
Deferred tax liabilities 20 1 1
EUR thousand
1.1.20 1 1
In income statement
Transfer
Exhange rate differences
Companies acquired/sold
31.12.20 1 1
Allocation of fair value on purchases 2,751 –620 –52 2,079
Other accrual differences
total 2,751 –620 –52 2,079
Deferred tax asset 20 1 0
EUR thousand
1.1.20 1 0
In income statement
In comprehensive income
In shareholders' equity
Companies acquired/sold
31.12.20 1 0
Losses 2,0 13 –383 94 1,723
Other items 186 166 352
total 2,199 –217 94 2,074
Deferred tax liabilities 20 1 0
EUR thousand
1.1.20 1 0
In income statement
Transfer
Exhange rate differences
Companies acquired/sold
31.12.20 1 0
Allocation of fair value on purchases 2,917 –665 318 131 50 2,751
Other accrual differences 1,080 –762 –318 0
total 3,997 –1,427 0 131 50 2,751
In specifying the company-specific deferred assets, the effective tax rate of each country is applied. The subsidiaries have accu-mulated unutilized tax losses of a total of EUR 5,120 thousand by the end of the financial period, for which deferred tax assets have not been recognized in line with the prudence concept. According to the transfer pricing principle applied since 2008, subsidiaries accumulate taxable income against which confirmed losses can be utilized in the future. We consider it probable that taxable
income will be generated in the subsidiaries in the future against which the unutilized tax losses can be utilized. Deferred tax assets totaling EUR 417 thousand net were additionally recognized in the financial statements for 2011 for unutilized tax losses accumulated in previous years.

annual report 2011 | group notes, IFRS64
21. manaGement of financial risKs Basware Group’s international operations involve customary financing risks. The purpose of financial risk management is to ensure the availability of sufficient financing cost-efficiently and monitor and, if necessary, limit the emerging risks by taking appro-priate measures. Risk management is centralized in the Group’s finance department. In accordance with the risk management pol-icy, the department reports to the Company’s Board of Directors at least once a year.
currency risk Basware’s net sales increased by 3.9% (7.9%) in local currency terms during 2011.
The Group’s main currency is Euro, accounting for approximate-ly 59 percent of net sales in 2011 (approximately 60% in 2010). In addition to the euro area, Basware operates in various areas, the
most significant of them being Norway, the United Kingdom and the United States in 2011. The company is exposed to exchange rate risks in these countries through intra-company trade, ex-ports and imports as well as through the equity and funding of foreign subsidiaries. The Company did not realize hedging for ex-change rate fluctuations during the financial year as the foreign exchange-denominated cash flow in the subsidiaries according to the company’s hedging policy did not exceed the annual currency-specific limit for hedging measures.
As of January 1, 2008, the capital structure of Basware Corpora-tion’s foreign subsidiaries has been changed to the extent that the majority of the long-outstanding intercompany trade receivables in the parent company have been converted to a long-term net in-vestment in a foreign operation. The purpose of the loan arrange-ment is to fund a long-term strategic investment. Foreign currency gains and losses from a net investment in a foreign operation are
recorded in a separate component of equity in the consolidated financial statements.
A sensitivity analysis of currency risk calculated as required by IFRS 7 would have had an impact of EUR +/– 0.7 million on the prof-it before tax at the closing date on December 31, 2011, assuming a rate change of +/– 5% of the local currencies (AUD, SEK, NOK, DKK, GBP, USD) against the euro. Other variables are assumed to remain unchanged. The calculation includes the foreign currency trade payables and accounts receivable in the balance sheet and net investments and subordinated loans in the subsidiaries. A sen-sitivity analysis of currency risk in foreign exchange-denominated net investments would have had an impact of +/– EUR 1.2 million on shareholders’ equity on December 31, 2011.
The parent company’s operating currency is euro. Foreign cur-rency-denominated assets and liabilities translated into the euro at the exchange rates of the closing date are as follows.
interest rate riskThe company did not have variable rate loans at the closing date.
liquidity riskThe company maintains sufficient liquidity reserves through cen-tralized Group-level cash management, payment traffic and over-draft facilities. The company has an account with a million euro overdraft facility secured by mortgage.
The Group’s liquidity remained good in 2011. The Group’s man-agement has not identified significant concentrations of liquidity risks in the financial assets or sources of finance. The table below describes a maturity analysis based on agreements. The finance lease liabilities are discounted; the other figures have not been discounted and they include loan rates and repayments of capital.
EUR thousand
Balance sheet value
Cash flow
0– 6 months 6 months – 1 year
1– 2 year
Maturity distribution of financial liabilities
Finance lease 682 713 88 88 537
Trade and other payables 17,251 16,260 15,774 291 195
Total 17,933 16,973 15,862 379 732
nominal values
2011 2010
EUR thousand USD AUD GBP SEK DKK NOK USD AUD GBP SEK DKK NOK
Non-current assets 33 33 361 1,147 34 1,826 24 42 369 1,157 12 1,856
Current assetsOther financial assets 220 535 1,787 1,561 101 5,180 443 615 950 1,018 534 2,501
Trade and other receivables 3,023 1,600 2,287 2,602 1,245 2,505 3,340 1,662 2,320 2,012 1,299 2,440
Current liabilitiesNon-interest bearing liabilities 441 318 838 1,703 594 1,898 702 677 851 1,280 442 2,466

65annual report 2011 | group notes, IFRS
credit risksThe company’s sales receivables are spread to a vast clientele and do not include significant credit risks. Credit decisions are followed and monitored centrally by the Group management. The company has not used surety bonds to secure sales receivables.
The impairment loss and the age distribution of sales receiv-ables are presented in Note 17.
22. caPital risK manaGement Shareholders’ equity reported in the Group balance sheet is man-aged as capital. The company’s capital management aims to en-sure the continuity of the company’s operations (going concern) and increase shareholder value.
The capital structure can be adjusted by decisions on, e.g., dis-tribution of dividend, share repurchase and share issues.
The total number of shares held by the company amounted to 59,675, representing approximately 0.46% of all Basware shares. A total of 30,625 shares were conveyed on the basis of the incen-tive scheme during the financial period. The average price of the purchased shares during the share repurchase program on Octo-ber 23, 2008 – March 31, 2009 was EUR 6.9475. The decision by the Company’s Board of Directors to commence the program was based on the authorization granted by the Annual General Meet-ing on February 14, 2008.
A separate stock exchange release has been issued on the
Board authorizations and other resolutions of the Annual General Meeting of Shareholders on February 17, 2011.
The Annual General Meeting authorized the Board of Directors to decide on a share repurchase as proposed by the Board. Based on the authorization, the Board of Directors may repurchase a maximum of 1,160,000 company’s own shares otherwise than in proportion to the holdings of the shareholders using the non-re-stricted equity at the market price of the shares on the NASDAQ OMX Helsinki Ltd at the time of the acquisition. The shares are re-purchased to be used as consideration in possible acquisitions or in other arrangements that are part of the company’s business, to finance investments, as part of the company’s incentive program, or to be retained, otherwise conveyed or cancelled. The authoriza-tion to repurchase the company’s own shares is valid until March 31, 2012.
The Annual General Meeting authorized the Board of Directors to decide on issuing new shares and/or conveying the company’s own shares held by the company and/or granting special rights referred to in Chapter 10, Section 1 of the Finnish Companies Act in accordance with the proposal of the Board of Directors. Based on the authorization, the Board of Directors may decide to issue a maximum of 2,320,000 new shares and convey a maximum of 1,250,300 of the company’s own shares held by the company. The number of shares to be issued to the company itself together with the shares repurchased to the company on basis of the repurchase
authorization shall not exceed 1,160,000 shares. The maximum number of new shares that may be subscribed by virtue of the special rights granted by the company is 1,000,000 shares in total which number shall be included in the abovementioned maximum number of new shares. The authorization is valid until March 31, 2012.
Equity ratio and gearing ratio are indicators of the capital struc-ture.
During 2011, the group’s objective was to maintain a strong equity ratio, a moderate gearing ratio and the AAA credit rating of Basware’s parent company. The equity ratio in 2011 was 81.9% (2010: 73.3%). The gearing ratio in 2011 was –42.3% (–15.3%). Bas-ware’s parent company’s Dun & Bradsheet credit rating was AAA in 2011 (AA).
The change in the gearing ratio in 2011 is due both to the positive development of monetary assets and a decrease in the amount of interest-bearing liabilities.
23. shareholDers’ eQuity
EUR thousand
Share number
Shareholders'
equity
Issue of shareShare pre-
mium account
Invested non-restricted
equity
Other
reserves
Own shares
Total
31.12.2010 11,599,724 3,507 255 1,187 34,263 540 –629 39,123Issue of share 1,331,505 27,913 27,934Other changes in reporting period 21 –255 –200 200 –25531.12.2011 12,931,229 3,528 0 1,187 61,976 540 –429 66,802
Shares have not nominal value.
other fundsOther funds include the fair value reserve, which includes the increase in the value of the Analyste deal shares between the publication and realization of the deal in 2006.
treasury sharesThe treasury shares reserve includes the acquisition cost of own shares held by the Group.
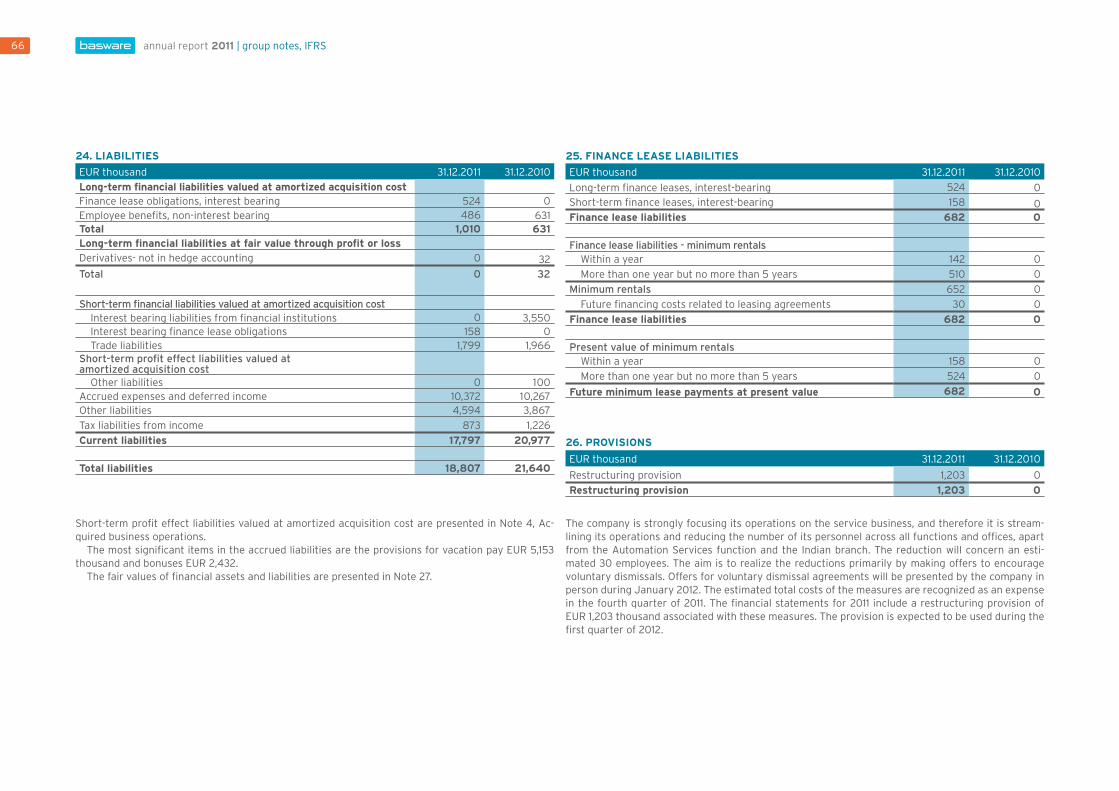
annual report 2011 | group notes, IFRS66
24. liaBilities
EUR thousand 31.12.20 1 1 31.12.2010
long-term financial liabilities valued at amortized acquisition cost Finance lease obligations, interest bearing 524 0Employee benefits, non-interest bearing 486 631total 1,010 631long-term financial liabilities at fair value through profit or loss Derivatives- not in hedge accounting 0 32Total 0 32
Short-term financial liabilities valued at amortized acquisition costInterest bearing liabilities from financial institutions 0 3,550Interest bearing finance lease obligations 158 0Trade liabilities 1,799 1,966
Short-term profit effect liabilities valued at amortized acquisition cost
Other liabilities 0 1 00Accrued expenses and deferred income 10,372 1 0,267Other liabilities 4,594 3,867
Tax liabilities from income 873 1,226
current liabilities 17,797 20,977
total liabilities 18,807 21,640
25. finance lease liaBilities
EUR thousand 31.12.20 1 1 31.12.2010
Long-term finance leases, interest-bearing 524 0Short-term finance leases, interest-bearing 158 0finance lease liabilities 682 0
Finance lease liabilities - minimum rentalsWithin a year 142 0
More than one year but no more than 5 years 510 0
Minimum rentals 652 0
Future financing costs related to leasing agreements 30 0
finance lease liabilities 682 0
Present value of minimum rentalsWithin a year 158 0
More than one year but no more than 5 years 524 0
future minimum lease payments at present value 682 0
26. ProVisions
EUR thousand 31.12.20 1 1 31.12.20 1 0
Restructuring provision 1,203 0
restructuring provision 1,203 0
Short-term profit effect liabilities valued at amortized acquisition cost are presented in Note 4, Ac-quired business operations.
The most significant items in the accrued liabilities are the provisions for vacation pay EUR 5,153 thousand and bonuses EUR 2,432.
The fair values of financial assets and liabilities are presented in Note 27.
The company is strongly focusing its operations on the service business, and therefore it is stream-lining its operations and reducing the number of its personnel across all functions and offices, apart from the Automation Services function and the Indian branch. The reduction will concern an esti-mated 30 employees. The aim is to realize the reductions primarily by making offers to encourage voluntary dismissals. Offers for voluntary dismissal agreements will be presented by the company in person during January 2012. The estimated total costs of the measures are recognized as an expense in the fourth quarter of 2011. The financial statements for 2011 include a restructuring provision of EUR 1,203 thousand associated with these measures. The provision is expected to be used during the first quarter of 2012.

67annual report 2011 | group notes, IFRS
27. fair Values of financial assets anD liaBilities
EUR thousand Note 20 1 1 Book value Fair value 20 1 0 Book value Fair value
Financial assetsAvailable-for-sale financial assets
Available-for-sale financial assets 14 38 38 38 38Financial assets at fair value through profit or loss
Financial assets held for trading 18 0 0 35 35Interest rate derivatives- not in hedge accounting 15 0 0 23 23
CurrentCash and cash equivalents 19 42,977 42,977 13,787 13,787
Trade and other receivables 17 23,091 23,091 24,066 24,066
Financial liabilitiesFinancial liabilities at fair value through profit or loss
Interest rate derivatives- not in hedge accounting 24 0 0 32 32Financial liabilities - financial liabilities valued at amortized acquisition cost
Non-currentFinancial lease liabilities, interest-bearing 24 524 524 0 0
CurrentLoans from financial institutions, interest-bearing 24 0 0 3,550 3,550Financial lease liabilities, interest-bearing 24 158 158 0 0Trade and other payables, non-interest-bearing 24 16,765 16,765 16,201 16,201
Principles of valuation of the fair value of all financial instru-ments applied by the GroupIn valuating the fair values of the financial assets and liabilities in the table, the following price quotations, assumptions and valua-tion models have been used.
available-for-sale financial assetsAvailable-for-sale financial assets consist of unlisted share invest-ments valued at cost less any impairment. Therefore, the fair value of the investments cannot be specified reliably. Unlisted shares do not have an active market, and the Group does not intend to give up these investments for the time being.
DerivatesDerivates used by the Group are interest exchange contracts to protect against interest rate fluctuations. Derivatives are recog-nized at the fair value at each closing date. The fair values of the interest exchange contracts are determined by the method based
on the future fair value of cash flow. This is supported by the mar-ket rates and other market information valid at the end of each fis-cal year. Fair values equal to the rates that the Group would need to pay or receive in case of termination of the derivate contracts.
finance leaseThe fair value of finance leases is based on discounting future cash flows using an interest rate corresponding to the interest rate of corresponding lease agreements.
trade and other receivables and payablesThe original book value of trade and other receivables and trade and other payables corresponds to their fair value as the effect of dis-counting is not substantial, taking into account the maturity of the item.
loans from financial institutionsThe floating interest rates of loans are based on 1-month euribor,
depending on the maturity of the loan. Therefore, the fair value of floating rate loans is considered to correspond to their book value.
other receivablesThe book value of other receivables corresponds to their fair value as the effect of discounting is not substantial taking into account the maturity of receivables.

annual report 2011 | group notes, IFRS68
fair value hierarchy of financial assets and liabilities at fair value
EUR thousand
Fair value of end at reporting period 31.12.2011
Tier 2
Fair value of end at reporting period 31.12.2010
Tier 2
Assets at fair valueFinancial assets at fair value through profit or loss
Interest rate derivatives 0 0 23 23Available-for-sale financial assets 0 0 35 35
total 0 0 57 57
Liabilities at fair valueFinancial liabilities at fair value through profit or loss
Interest rate derivatives 0 0 32 32
total 0 0 32 32
No transfers between tiers 1 and 2 of the fair value hierarchy took place during the financial period.
The fair values of tier 2 instruments are significantly based on quoted prices, but however on the information that can be shown directly (i.e. price) or indirectly (i.e. derived from prices) for the asset or liability in question. In determining the fair value of these instruments, the Group uses generally accepted valuation methods whose input data are, however, based on market data that can be significantly verified.
The tier of fair value hierarchy to which a certain item at fair value is classified in full is determined on the basis of the most sig-nificant lowest input data for the entire item at fair value in ques-tion. The significance of input data is determined with regard to the said asset at fair value in full.
leasesThe Group has leased the office premises it uses. The average du-rations of the leases are 3–5 years, and normally they include an opportunity for extending the agreement after the original end date. The agreements usually include an index clause.

69annual report 2011 | group notes, IFRS
28. commitments anD continGent liaBilities
EUR thousand 31.12.20 1 1 31.12.2010
Own guarantees
Business mortgage of own debt 1,200 1,200
Commitments on behalf of subsidiaries Guarantees 1,290 1,123
Other own contingent liabilities Lease liabilities
Current lease liabilities 825 848Lease liabilities maturing in 1– 5 years 899 796
total 1,723 1,644
Rental liabilitiesCurrent rental liabilities 4,551 4,054Rental liabilities maturing in 1– 5 years 7,016 9,913
total 11,568 13,967
other own contingent liabilities total 13,291 15,61 1
commitments and contingent liabilities total 15,781 17,934
30. shares in suBsiDiaries
Company Domicile Country Group holding, %
NextWare Oy Espoo Finland 1 00Basware GmbH Düsseldorf Germany 1 00Basware UK Ltd. Staffordshire United Kingdom 1 00Basware AB Stockholm Sweden 1 00Basware B.V. Amsterdam The Netherlands 1 00Basware A/S Herley Denmark 1 00Basware, Inc. Delaware United States 1 00Basware SAS Paris France 1 00Basware AS Oslo Norway 1 00Basware Pty Ltd Chatswood Australia 1 00
Value added tax is only included in vehicle leasing liabilities. The other liabilities are exclusive of value
added tax.
29. relateD Party transactionsThe Group insiders include the parent company and the subsidiaries. In addition, members of the Board of Directors and the Executive Teams, including the President and CEO, are insiders.
The Company did not have related party transactions during 2011.
31. eVents after the financial PerioD the members of the Basware executive team as of January 1, 20 1 1: Esa Tihilä, CEO; Matti Copeland, Senior Vice President, Strategy; Mika Harjuaho, CFO; Mari Heusala, Senior Vice President, HR&Dev; Jorma Kemppainen, Senior Vice President, Products; Pekka Lindfors, Senior Vice President, Volume Sales; Steve Muddiman, Senior Vice President, Global Marketing; Riku Roos, Senior Vice President, Automation Services; Matti Rusi, Senior Vice President, Support ja Jukka Virkkunen, Senior Vice President, Enterprise Sales.
On January 17, 2012 Basware acquired the entire share capital of e-Invoicing operator First Busi-nesspost GmbH. The acquisition price amounts to approximately EUR 12.2 million. The debt free price is approximately EUR 9.0 million in addition to which Basware takes over approximately EUR 3.2 mil-lion of parent company loans in the company. The acquisition price will be paid in cash in connection with the closing of the acquisition so that 20 percent of the debt free price will be paid to an escrow account. The escrow agreement is in place until the end of January 2013. Basware consolidates First Businesspost’s figures into its net sales and profit as of January 1, 2012.
A separate stock exchange release on the acquisition was issued on January 18, 2012.

annual report 2011 | parent company financial statements, FAS70
EUR thousand Notes 1.1.–31.12.20 1 1 1.1.–31.12.20 1 0
NET SALES 2 57,685 50,228
Other operating income 971
Materials and services 3 –4,786 –2,640Employee benefits expenses 4 –33,470 –28,374Depreciation and amortization 5 –4,192 –4,143
Other operating expenses 6 –10,058 –9,262
operating profit 5,179 6,779
Financial income 7 2,429 6,383
Financial expenses 7 –1,004 –772
Profit before appropriation and taxes 6,603 12,390
Income tax expense 8 –2,353 –2,580
Profit for the PerioD 4,250 9,810
Parent company income statement 1.1.– 31.12.20 1 1 (FAS)

71annual report 2011 | parent company financial statements, FAS
EUR thousand Notes 31.12.20 1 1 31.12.20 1 0
ASSETS
Non-current assetsIntangible assets 9 19,587 18,535Tangible assets 10 929 748Investments 1 1 50,334 50,394
Long-term trade and other receivables 13 0 23
non-current assets 70,850 69,699
Current assetsInventories 12 41 56Short-term trade and other receivables 14 9,123 1 1,100Financial assets at fair value through profit or loss 0 35
Cash and cash equivalents 32,150 6,034
current assets 41,314 17,225
total assets 112,164 86,924
EUR thousand Notes 31.12.20 1 1 31.12.20 1 0
EQUITY AND LIABILITIES
Shareholders' equityShare capital 3,528 3,507Issue of shares 0 255Share premium account 1,1 18 1,1 18Other reserves 62,360 34,263Retained earnings 29,308 24,418
Profit for the period 4,250 9,810
shareholders' equity 15 100,564 73,371
ProvisionsOther Provisions 16 850 0
LiabilitiesLong-term liabilities 1 7,18 177 231
Short-term liabilities 19 10,573 13,322
total liabilities 10,750 13,553
total eQuity anD liaBilities 112,164 86,924
Parent company balance sheet 31.12.20 1 1 (FAS)

annual report 2011 | parent company financial statements, FAS72
EUR thousand 1.1.–31.12.20 1 1 1.1.–31.12.20 1 0
Cash flow from operating activities
Profit for the period 4,250 9,810Adjustments for profit
Planned depreciations 4,192 4,143Unrealized exchange gains and losses –145 –1,399Other incomes and expenses, not paid –242 –970Finance income and expenses –1,279 –4,212Income taxes 2,353 2,580
Total adjustments for profit 4,879 142
Working capital changes 4,586 –1,390
Cash flow from operating activities before financial items and taxes 13,714 8,561Interest paid –285 –155Dividend received 0 1,271Interest received 1,605 1,1 18Other financial items in operating activities –107 –191Income taxes paid –2,998 –1,754
net cash from operating activities 11,929 8,850
Cash flow from investing activities Purchase of tangible and intangible assets –5,447 –2,241Acquired subsidiaries 0 –1,732Granted loans –275 –1,601Repayments of loan receivables 480 5,991
net cash used in investing activities –5,241 417
EUR thousand 1.1.–31.12.20 1 1 1.1.–31.12.20 1 0
Cash flow before financing activities 6,688 9,268
Cash flow from investing activitiesShare issue 28,063 2,505Repayments of borrowings –3,550 –6,066Dividends paid –5,120 –4,100
net cash used in financing activities 19,393 –7,662
net change in cash and cash equivalents 26,081 1,606
Cash and cash equivalents from merger of subsidiaries 0 532
Increase (–) / decrease (+) in cash and cash equivalents 26,081 2,138
Net change in cash and cash equivalents according to balance sheetCash and cash equivalents at the beginning of period 6,069 3,931Cash and cash equivalents at the end of period 32,150 6,069
Parent company cash flow statement 1.1.– 31.12.20 1 1 (FAS)
73annual report 2011 | parent company financial statements, FAS
1. accountinG PrinciPles useD in PreParinG the Parent comPany financial statements
Basware Corporation’s financial statements for 2011 have been prepared in accordance with the Finnish Accounting Act. The Group has applied the International Financial Reporting Standards (IFRS) in its reporting as from January 1, 2005.
transactions in foreign currencies Transactions in foreign currencies are recorded at the exchange rates prevailing at the transaction dates. At the end of the account-ing period, the unsettled balances on foreign currency receivables and liabilities are valued at the rates of exchange prevailing at the end of the accounting period. Foreign exchange gains and losses related to normal business operations are entered in the appropri-ate income statement account before operating profit and foreign exchange gains and losses associated with financing are entered as a net amount under financial income and expenses.
revenue recognitionRevenue recognition of product sales requires that there is a bind-ing agreement of the sale, the product has been delivered, pro-ceeds from the transaction can be reliably specified, the financial gain will benefit the company with sufficient probability, and sig-nificant benefits and risks related to ownership or rights of use of the product have been transferred to the buyer. License agree-ments with a right of return or conditions related to the product’s functionality or implementation project are recognized as revenue once the right of return has expired or the above-mentioned con-ditions have been fulfilled.Maintenance revenue is allocated over the contract period and service revenue is recognized at the time of delivery.
other operating incomeWith regard to the comparison period, other operating income in-cludes merged subsidiary’s merger profit during the accounting period.
research and development costsResearch expenses are recognized as an expense as they are in-curred. Product development expenses are recognized so that de-velopment costs of new products and product versions with signif-icant enhancements are capitalized and amortized. Maintenance of existing products and minor enhancements are recognized as they are incurred. Public subsidies related to capitalized develop-ment expenses are deducted from the acquisition costs.
PensionsThe statutory pension coverage of Basware Corporation employ-ees is provided through insurance policies taken out with a pen-sion institution. The statutory pension expenses are recognized as expenses in the year they are incurred.
intangible assetsIntangible assets include software, goodwill, capitalized product development costs, other long-term expenses, and merger losses. They are recognized in the original acquisition costs less accumu-lated depreciation. Public subsidies related to the acquisition of in-tangible assets are deducted from the acquisition cost of the asset and recognized as income by reducing the depreciation charge of the asset they are related to. The useful lives of intangible assets are 3 to 10 years.
tangible assets Tangible assets are recognized in the balance sheet at the original acquisition cost less accumulated depreciation. The useful lives of tangible assets are 3 to 5 years.
leasesIn the parent company financial statements, leasing payments are recognized as annual expenses in accordance with the Finnish Ac-counting Standards. liquid assetsLiquid assets include cash, bank balances and other liquid securi-ties.
measurement of financial instrumentsFinancial instruments are measured at fair value. Financial instru-ments such as interest rate swaps are valued at the fair market price at the balance sheet date.
taxesIncome taxes have been recognized in accordance with Finnish tax legislation. Deferred tax liabilities are calculated for the difference between taxation and financial statements, using the tax rate con-firmed for the following years at the closing date.
Notes to the parent company financial statements

annual report 2011 | notes to the parent company financial statements, FAS74
2. net sales
EUR thousand 20 11 20 1 0
Net sales by business branchesProduct sales and maintenance 32,066 30,484
Services 25,619 19,743
total 57,685 50,227
Net sales by business areasFinland 48,416 43,026
Export 9,269 7,201
total 57,685 50,227
3. materials anD serVices
EUR thousand 20 1 1 20 1 0
Purchases during the financial period –4,217 –1,1 12Change in inventories –15 23
Services purchased –554 –1,550
total –4,786 –2,639
4. notes to Personnel anD corPorate GoVernance
EUR thousand 2011 2010
Personnel expensesSalaries paid to CEO and the Board of Directors –1,061 –853Salaries paid to other personnel –26,739 –22,339Pension expenses –4,147 –3,827
Other personnel expenses –1,523 –1,355
total –33,470 –28,374
number of personnel 2011 2010
Personnel average for the period 738 512Personnel at the end of the period 859 595
The pension arrangements of CEO and the Board of Directors comply with the local rules.
5. DePreciation anD Write-offs
EUR thousand 20 11 20 1 0
Intangible assets –3,785 –3,806
Tangible assets –408 –337
total –4,192 –4,143
6. other oPeratinG eXPenses
EUR thousand 2011 2010
Rents –1,785 –1,550Travelling –1,457 –1,236Marketing –2,252 –1,971Other operating expenses –4,384 –4,314
Audit fees –133 –159Certificates –4 –2Tax advices –3 –17
Other fees and services –40 –13
Auditing fees total –180 –191
total –10,058 9,262
Notes to the income statement

75annual report 2011 | notes to the parent company financial statements, FAS
7. financial income anD eXPenses
EUR thousand 2011 2010
Income from long-term investmentsFrom group companies 0 3,279
Other interest and financial incomeFrom group companies 2,002 3,015From others 427 89
Other interest and financial income 2,429 3,104financial income total 2,429 6,383
Interest and financial expensesTo group companies –615 –450
From others –390 –322
other interest and financial expenses total –1,004 –772
total 1,425 5,611
8. Direct taXes
EUR thousand 2011 2010
Income taxes on the financial periodIncome taxes on actual business –2,375 –2,610Change of deferred taxes 22 33
Income taxes from previous financial periods 0 –2total –2,353 –2,579
9. intanGiBle assets
EUR thousand 20 1 1 20 1 0
Development costsBook value 1.1. 9,942 7,899Increase 494 252Merger increase 0 1,791Book value 31.12. 10,437 9,942
Accumulated amortization 1.1. –5,797 –4,081Accumulated amortizations relating to merger 0 –89Amortization for the financial period –1,620 –1,627
Accumulated amortization 31.12. –7,418 –5,797
Balance sheet value 31.12. 3,019 4,145
intangible rightsBook value 1.1. 2,618 2,637Increase 282 105Merger increase 0 22Decrease –1 12 –146Book value 31.12. 2,788 2,618
Accumulated amortization 1.1. –2,225 –1,931Accumulated amortizations relating to merger 0 –22Accumulated amortization on decreases 72 0Amortization for the financial period –241 –272
Accumulated amortization 31.12. –2,393 –2,225
Balance sheet value 31.12. 394 393
Notes to the Balance Sheet

annual report 2011 | notes to the parent company financial statements, FAS76
EUR thousand 2011 2010
Goodwill/merger lossBook value 1.1. 17,625 17,629Decrease 0 –4Book value 31.12. 17,625 17,625
Accumulated amortization 1.1. –7,748 –5,905Amortization for the financial period –1,843 –1,843
Accumulated amortization 31.12. –9,590 –7,748
Balance sheet value 31.12. 8,035 9,877
other long-term expensesBook value 1.1. 201 1 04Increase 280 97Book value 31.12. 481 201
Accumulated amortization 1.1. –103 –39Amortization for the financial period –81 –64
Accumulated amortization 31.12. –184 –1 03
Balance sheet value 31.12. 297 98
other assets under constructionBook value 1.1 107 182Increase 410 140Decrease –41 1 –215Book value 31.12 106 107
Balance sheet value 31.12. 106 107
assets, unfinished projectsBook value 1.1. 3,914 2,656Increase 4,067 1,506Decrease –244 –248
Book value 31.12. 7,737 3,914
Balance sheet value 31.12. 7,737 3,914
intangible assets total 19,587 18,535
1 0. tanGiBle assets
EUR thousand 20 11 2010
Machinery and equipmentBook value 1.1. 4,286 3,493Increase 582 615Merger increase 0 178Decrease –5 0Book value 31.12. 4,863 4,286
Accumulated depreciation 1.1. –3,624 –3,147Accumulated depreciation relating to merger 0 –139Accumulated depreciation on decreases 5 0Amortization for the period –408 –337
Accumulated amortization 31.12. –4,027 –3,623
Balance sheet value 31.12. 836 662
Other tangible assetsBook value 1.1. 86 78Increase 7 8
Book value 31.12. 92 86
Balance sheet value 31.12. 92 86
Tangible assets total 929 748
Total fixed assets 20,516 19,282

77annual report 2011 | notes to the parent company financial statements, FAS
12. inVentories
EUR thousand 20 1 1 2010
Raw materials and consumables 41 55
total 41 55
13. lonG-term receiVaBles
EUR thousand 20 1 1 20 1 0
Derivative financial instruments 0 22
long-term receivables total 0 22
14. short-term receiVaBles
EUR thousand 20 11 20 1 0
Accounts receivables 5,949 5,594
Receivables from group companiesAccounts receivables 818 2,108
Interest receivables 1,265 1,175
total 2,083 3,283
Prepaid expenses and accrued income 753 406Other receivables 338 1,816
total 9,123 11,099
The largest items in accrued income are lease deposits, estimated Kela occupational health care reim-bursement and income and expense accruals.
1 1. inVestments
EUR thousand 20 1 1 2010
Shares in group companiesBook value 1.1. 17,040 18,050Increase 0 52Decrease 0 –1,062Book value 31.12. 17,040 17,040
Balance sheet value 31.12 17,040 17,040
Other sharesBook value 1.1. 38 38Book value 31.12. 38 38
Receivables from group companiesLoan receivables from group companies 33,256 33,316
Investments total 50,334 50,394
shares in subsidiaries
Company Domicile CountryParent company
holding, % Nextware Oy Espoo Finland 1 00Basware GmbH Düsseldorf Germany 1 00Basware UK Ltd. Staffordshire United Kingdom 1 00Basware AB Stockholm Sweden 1 00Basware B.V. Amsterdam The Netherlands 1 00Basware A/S Herley Denmark 1 00Basware, Inc. Delaware United States 1 00Basware SAS Paris France 1 00Basware AS Oslo Norway 1 00Basware Pty Ltd Chatswood Australia 1 00

annual report 2011 | notes to the parent company financial statements, FAS78
15. shareholDers’ eQuity
EUR thousand 2011 20 1 0
Share capital 1.1. 3,507 3,440Increase for the financial period 21 67Share capital 31.12 3,528 3,507
Issue of shares 1.1. 255 140Increase for the financial period 27,729 2,505Decrease for the financial period –27,984 –2,390Issue of shares 31.1. 0 255
Share premium account 1.1. 1,1 18 0Increase for the financial period 0 1,1 18Share premium account 31.12. 1,1 18 1,1 18
Equity 31.12. 4,647 4,880
Invested non-restricted equity 1.1. 34,263 33,058Issue of shares 27,729 1,205Warrants used 568 0Transfers between items –200 0Invested non-restricted equity 31.12 62,360 34,263
Retained earnings 1.1. 34,228 28,517Dividend payment –5,120 –4,100Transfer between items 200 0Profit for the period 4,250 9,810Retained earnings 31.12. 33,558 34,228
Non-restricted equity 31.12. 95,917 68,491
Shareholders' equity 31.12. 100,564 73,371
specification of distributable fundsProfit for the period 4,250 9,810Retained earnings 29,308 24,418
Other distributable funds 62,360 34,263
Distributable funds 95,917 68,491
17. DeferreD taX liaBilities
EUR thousand 20 1 1 20 1 0
Deferred tax liabilities 0 22
16. ProVisions
EUR thousand 20 1 1 20 1 0
Other provisions
Restructuring provisions 850 0
The company is strongly focusing its operations on the service business, and therefore it is stream-lining its operations and reducing the number of its personnel across all functions and offices, apart from the Automation Services function. The aim is to realize the reductions primarily by making of-fers to encourage voluntary dismissals. The provision is expected to be used during the first quarter of 2012.

79annual report 2011 | notes to the parent company financial statements, FAS
20. commitments anD continGent liaBilities
EUR thousand 20 1 1 20 1 0
Own guaranteesBusiness mortgages of own debt 1,200 1,200
Commitments on behalf of subsidiariesGuarantees 1,290 1,123
Other own contingent liabilitiesLeasing liabilities
Current lease liabilities 247 245
Lease liabilities maturing in 1–5 years 257 79
total 504 324
Rental liabilitiesCurrent rental liabilities 3,179 2,789
Rental liabilities maturing in 1–5 years 5,723 6,774
total 8,902 9,562
commitments and contingent liabilities total 11,897 12,21 0
The lease agreements are ordinary lease agreements. The finance lease agreements are ordinary finance lease agreements and have no associated
leaseback clauses. The group does not have pledges, mortgages or guarantees on behalf of external parties.
18. lonG-term liaBilities
EUR thousand 2011 2010
Derivative financial instruments 0 32
Long-term debts to group companies 177 177
total 177 209
19. short-term liaBilities
EUR thousand 20 11 20 1 0
Non-interest bearing short-term liabilitiesAccounts payable 890 996
Liabilities to group companiesAccounts payable 559 443
Other debts 78 42
total 637 485
Other debts 2,485 1,686
Accrued expenses and deferred income 6,561 6,604
total 9,046 8,290
non-interest bearing short-term liabilities total 10,573 9,771
The most significant items in the accrued liabilities are the provisions for vacation pay EUR 3,837 thousand and bonuses EUR 2,045 thousand.
EUR thousand 20 11 20 1 0
Interest bearing short-term liablities
Amortization of long-term debts 0 3,550
Interest bearing short-term liablities total 0 3,550
Short-term liabilities total 10,573 13,322

annual report 2011 | board’s dividend proposal80
At the end of 2011, the Group parent company’s distributable funds are EUR 95,917,650.04.
Basware’s Board of Directors proposes to the Annual General Meeting that a dividend of EUR 0.41
per share (2010: EUR 0.40) be paid for 2011. No substantial changes have taken place in the compa-
ny’s financial position after the end of the financial period. The company’s liquidity is good, and the
Board’s view is that the proposed dividend payout will not endanger the company’s liquidity.
According to the Board’s decision, the dividend matching date is February 21, 2012. The Board of
Directors proposes to the Annual General Meeting that the dividend be paid after the end of the
matching period on February 28, 2012.
In Espoo, Finland, January 24, 20 12
Basware Corporation
Board of Directors
Hannu Vaajoensuu, Chairman of the board Sakari Perttunen
Pentti Heikkinen Eeva Sipilä
Ilkka Toivola
Esa Tihilä, CEO
Auditor’s note
An auditor’s report concerning the performed audit has been given to date.
In Helsinki, Finland, January 24, 2012
Ernst & Young, Authorized Public Accountant Firm
Heikki Ilkka, Authorized Public Accountant
Board’s dividend proposalBoard’s dividend proposal

81annual report 2011 | auditor’s report
Auditor’s report
to the annual General meetinG of BasWare oyJ
We have audited the accounting records, the financial statements, the report of the Board of Di-
rectors, and the administration of Basware Corporation for the financial period 1.1. – 31.12.2011. The
financial statements comprise the consolidated statement of financial position, statement of com-
prehensive income, statement of changes in equity and statement of cash flows, and notes to the
consolidated financial statements, as well as the parent company’s balance sheet, income statement,
cash flow statement and notes to the financial statements.
The responsibility of the Board of Directors and the Managing Director
The Board of Directors and the Managing Director are responsible for the preparation of consolidat-
ed financial statements that give a true and fair view in accordance with International Financial Re-
porting Standards (IFRS) as adopted by the EU, as well as for the preparation of financial statements
and the report of the Board of Directors that give a true and fair view in accordance with the laws
and regulations governing the preparation of the financial statements and the report of the Board
of Directors in Finland. The Board of Directors is responsible for the appropriate arrangement of the
control of the company’s accounts and finances, and the Managing Director shall see to it that the
accounts of the company are in compliance with the law and that its financial affairs have been ar-
ranged in a reliable manner.
Auditor’s responsibility
Our responsibility is to express an opinion on the financial statements, on the consolidated finan-
cial statements and on the report of the Board of Directors based on our audit. The Auditing Act re-
quires that we comply with the requirements of professional ethics. We conducted our audit in ac-
cordance with good auditing practice in Finland. Good auditing practice requires that we plan and
perform the audit to obtain reasonable assurance about whether the financial statements and the
report of the Board of Directors are free from material misstatement, and whether the members of
the Board of Directors of the parent company or the Managing Director are guilty of an act or negli-
gence which may result in liability in damages towards the company or have violated the Limited Li-
ability Companies Act or the articles of association of the company.
An audit involves performing procedures to obtain audit evidence about the amounts and disclo-
sures in the financial statements and the report of the Board of Directors. The procedures selected
depend on the auditor’s judgment, including the assessment of the risks of material misstatement,
whether due to fraud or error. In making those risk assessments, the auditor considers internal con-
trol relevant to the entity’s preparation of financial statements and report of the Board of Directors
that give a true and fair view in order to design audit procedures that are appropriate in the circum-
stances, but not for the purpose of expressing an opinion on the effectiveness of the company’s in-
ternal control. An audit also includes evaluating the appropriateness of accounting policies used and
the reasonableness of accounting estimates made by management, as well as evaluating the overall
presentation of the financial statements and the report of the Board of Directors.
We believe that the audit evidence we have obtained is sufficient and appropriate to provide a ba-
sis for our audit opinion.
Opinion on the consolidated financial statements
In our opinion, the consolidated financial statements give a true and fair view of the financial posi-
tion, financial performance, and cash flows of the group in accordance with International Financial
Reporting Standards (IFRS) as adopted by the EU.
Opinion on the company’s financial statements and the report of the Board of Directors
In our opinion, the financial statements and the report of the Board of Directors give a true and fair
view of both the consolidated and the parent company’s financial performance and financial position
in accordance with the laws and regulations governing the preparation of the financial statements
and the report of the Board of Directors in Finland. The information in the report of the Board of Di-
rectors is consistent with the information in the financial statements.
In Helsinki on January 24, 2012
Ernst & Young Oy
Authorized Public Accountant Firm
Heikki Ilkka
Authorized Public Accountant

annual report 2011 | group quarterly income statement82
EUR thousand 1–3/20 1 1 1–3/20 1 0 4–6/20 11 4–6/20 10 7–9/20 1 1 7–9/20 1 0 1 0–12/20 1 1 1 0–12/20 1 0
NET SALES 26,058 23,132 27,280 26,612 24,185 23,202 30,227 30,149
Other operating income 42 50 41 55 43 43 46 42
Materials and services –1,948 –1,288 –1,727 –1,754 –1,933 –1,593 –2,179 –1,760Employee benefits expenses –14,738 –13,703 –16,004 –15,184 –13,293 –1 1,959 –17,539 –16,491Depreciation and amortization –1,237 –1,236 –1,279 –1,309 –1,270 –1,294 –1,218 –1,278
Other operating expenses –5,219 –4,818 –5,478 –5,414 –4,694 –4,991 –5,883 –5,725
operating profit 2,957 2,136 2,832 3,006 3,038 3,408 3,454 4,937% 1 1.3% 9.2% 10.4% 1 1.3% 12.6% 14.7% 1 1.4% 16.4%
Financial income 51 1 16 125 4 102 –59 232 141
Financial expenses –77 –1 11 –53 –58 –1 15 42 –213 –239
Profit before tax 2,930 2,142 2,904 2,953 3,024 3,391 3,473 4,839% 1 1.2% 9.3% 10.6% 1 1.1% 12.5% 14.6% 1 1.5% 16.1%
Income tax expense –662 –560 –742 –81 1 –723 –697 –533 –926
Profit for the PerioD 2,268 1,582 2,162 2,142 2,301 2,694 2,940 3,913% 8.7% 6.8% 7.9% 8.0% 9.5% 1 1.6% 9.7% 13.0%
Group quarterly income statement

83annual report 2011 | key figures
Group Key financial Performance indicators
EUR thousand 20 1 1 20 1 0 2009 2008 2007
Net sales 107,750 103,094 92,654 86,098 73,270Growth of net sales, % 4.5% 1 1.3% 7.6% 17.5% 22.2%EBITDA 17,284 18,604 16,280 1 1,722 10,102% of net sales 16.0% 18.0% 17.6% 13.6% 13.8%Operating profit before IFRS amortization 14,290 15,691 13,788 9,730 8,224% of net sales 13.3% 15.2% 14.9% 1 1.3% 1 1.2%Operating profit 12,280 13,487 1 1,824 8,679 7,512Growth of operating profit, % –8.9% 14.1% 36.2% 15.5% –7.0%% of net sales 1 1.4% 13.1% 12.8% 10.1% 10.3%Profit before tax 12,332 13,325 1 1,590 8,410 7,704% of net sales 1 1.4% 12.9% 12.5% 9.8% 10.5%Profit for the period 9,671 10,331 9,074 6,585 4,1 12% of net sales 9.0% 10.0% 9.8% 7.6% 5.6%
Return on equity, % 1 1.6% 16.7% 17.2% 13.7% 8.9%Return on investment, % 14.9% 20.1% 18.8% 16.6% 16.2%Interest bearing liabilities 682 3,582 9,230 13,283 4,334Cash and liquid assets 42,977 13,822 12,210 8,777 7,041Gearing, % –42.3% –15.3% –5.3% 9.3% –5.7%Equity ratio, % 81.9% 73.3% 64.8% 59.5% 70.0%Total assets 121,966 91,470 87,287 81,909 67,722
Gross investments *) 6,331 4,567 7,448 12,476 12,599% of net sales 5.9% 4.4% 8.0% 14.5% 17.2%Capital expenditure 2,014 970 2,047 1,007 928% of net sales 1.9% 0.9% 2.2% 1.2% 1.3%Research and development costs 16,489 14,883 14,781 15,518 13,172% of net sales 15.3% 14.4% 16.0% 18.0% 18.0%R&D personnel at end of period 31 1 239 195 171 152
Personnel average for period 1,058 845 747 689 580Personnel at end of period 1,182 913 761 731 658Growth of personnel, % 29.5% 20.0% 4.1% 1 1.1% 24.6%
*) Includes acquisitions and capitalized R&D costs
Key figures 2007–20 1 1 IFRS

annual report 2011 | key figures84
Group share indicators
20 1 1 20 1 0 2009 2008 2007
Earnings per share, EUR (undiluted) 0.76 0.90 0.80 0.56 0.36Earnings per share, EUR (diluted) 0.76 0.89 0.80 0.56 0.36Equity per share, EUR 7.72 5.74 4.93 4.24 4.12Parent company’s shareholder’sEquity per share, EUR 7.76 5.78 4.97 4.24 4.12Dividend per share, EUR 0.41* 0.40 0.36 0.23 0.15Dividend per profit, % 53.8% 44.6% 45.2% 40.8% 41.6%Effective dividends, % 2.5% 1.6% 2.5% 3.5% 1.5%P/E ratio 21.57 27.58 18.21 1 1.68 27.89
Share price performance, share issue adjustedlowest share price, EUR 14.95 15.00 6.60 6.00 9.50highest share price, EUR 28.10 24.80 14.66 10.45 14.00average share price, EUR 21.58 19.27 10.79 7.53 12.03closing share price, EUR 16.45 24.75 14.52 6.59 10.00
Share issue adjusted average share number 31.12. 12,931,229 1 1,690,024 1 1,468,124 1 1,468,124 1 1,468,124Market value of shares 31.12., EUR 21 1,737,063 287,093,169 165,206,004 75,301,01 1 1 14,681,240
Share issue adjusted number of traded shares 5,079,523 2,131,071 2,038,565 2,298,467 2,761,995% of average share number 40.1% 18.5% 17.9% 20.1% 24.1%
Average share number:undiluted 12,679,281 1 1,513,690 1 1,381,905 1 1,463,307 1 1,468,124diluted 12,686,792 1 1,585,155 1 1,381,905 1 1,463,307 1 1,468,124
*) Board’s proposal to the Annual General Meeting of Shareholders

85annual report 2011 | calculation of key indicators, IFRS
Return on equity (ROE), %(Profit before extraordinary items, reserves and taxes - taxes) x 1 00Shareholders’ equity (average)
Return on investment (ROI), %(Profit before extraordinary items, reserves and taxes + interest and other financial expenses ) x 1 00 Balance sheet total - non-interest bearing liabilities (average)
Gearing, %(Interest bearing liabilities - cash and bank balances ) x 1 00Shareholders’ equity
Equity ratio, %(Shareholders’ equity) x 1 00Balance sheet total - advances received
Earnings per shareProfit for the period Adjusted number of shares over the financial year (average) - own shares
Equity per shareShareholders’ equity Adjusted number of shares at the end of the financial period
Dividend per shareTotal dividend Adjusted number of shares at the end of the financial period
Dividend/profit, %Dividend per share x 1 00Earnings per share
Effective dividend yield, %Dividend per share x 1 00 Adjusted share price at the end of the financial period
Price-earnings ratio (P/E)Adjusted share price at the end of the financial periodEarnings per share
Calculation of Key Indicators, IFRS

annual report 2011 | share and shareholders86
BasWare share
The Basware share has listed on the NASDAQOMX Helsinki Ltd
since February 29, 2000. The listing price of the share was EUR
5.70. Basware transferred to the Main List of the stock exchange
on October 19, 2004 and the share is listed int the Information
Technology business sector. The company code on the stock ex-
change is BAS. Basware has one series of share and the trading
code for the share is BAS1v.
At the end of 201 1, the total number of shares was 12,931,229
(1 1, 690,024). The book counter value per share is EUR 0.30. All
the shares carry one vote and an equal right to the dividend.
Share Capital
Basware Corporation’s share capital totaled EUR 3,528,368.70 at
the end of the period.
Share Price Performance and Trading
During the reporting period, the highest price of the share was
EUR 28.10 (EUR 24.80), the lowest was EUR 14.95 (EUR 15.00) and
the closing price was EUR 16.45 (EUR 24.75). The average price of
the share was EUR 21.58 (EUR 19.27) during the period.
A total of 5,079,523 (2,131,071) shares were traded during the
financial period which is the equivalent of 40.1 percent (18.5%) of
the average number of shares. Market capitalization with the peri-
od’s closing price on December 31, 201 1 was EUR 21 1,737,063 (EUR
287,093,169).
A separate stock exchange release on the authorizations
granted to the Board of Directors and the other resolutions of the
Annual General Meeting was issued on February 17, 201 1.
The Annual General Meeting decided to authorize the Board of
Directors to decide on repurchase of company’s own shares in ac-
cordance with the proposal of the Board of Directors. Based on
the authorization, the Board of Directors may repurchase a max-
imum of 1,160,000 shares in the company otherwise than in pro-
portion to the holdings of the shareholders using the non-restrict-
ed equity at the market price of the shares on the NASDAQ OMX
Helsinki Ltd at the time of the acquisition. The shares shall be re-
purchased to be used as consideration in possible acquisitions or
in other arrangements that are part of the company’s business, to
finance investments, as part of the company’s incentive program,
or to be retained, otherwise conveyed or cancelled. The authoriza-
tion to repurchase the company’s own shares is valid until March
31, 2012.
The Annual General Meeting decided to authorize the Board of
Directors to decide on issuing new shares and/or conveying the
company’s own shares held by the company and/or granting spe-
cial rights referred to in Chapter 10, Section 1 of the Finnish Com-
panies Act in accordance with the proposal of the Board of Di-
rectors. Based on the authorization, the Board of Directors may
decide to issue a maximum of 2,320,000 new shares and convey
a maximum of 1,250,300 of the company’s own shares held by the
company. The number of shares to be issued to the company itself
together with the shares repurchased to the company on basis of
the repurchase authorization shall not exceed 1,160,000 shares.
The maximum number of new shares that may be subscribed by
virtue of the special rights granted by the company is 1,000,000
shares in total which number shall be included in the abovemen-
tioned maximum number of new shares. The authorization to re-
purchase the company’s own shares is valid until March 31, 2012.
Warrant ProGrams
The following warrant programs ended in 201 1:
Warrant program 2006
The Annual General Meeting on February 15, 2006 approved the
new warrant program. Based on the program, a maximum of
300,000 warrants can be granted to the key personnel of Bas-
ware Group, each warrant entitling to subscribe on Basware share.
The warrants of Warrant Program 2006 are divided into three se-
ries, one of which is still valid having subscription period as fol-
low: April 1, 2010 – March 31,201 1. The subscription prices of the
shares correspond to the volume weighted average share price of
the Company in January – March of 2008. The terms and condi-
tions of the Warrant Program were published as a stock exchange
release on April 10, 2006.
Warrant program 2007
The Annual General Meeting on February 26, 2007 approved
the new warrant program. Based on the program, a maximum of
200,000 warrants can be granted to the key personnel of Basware
Group, each warrant entitling of subscribe one Basware share.
The warrants of Warrant Program 2007 are divided into two se-
ries, one of which is still valid having subscription period as fol-
low: April 1, 2010 – March 31, 201 1. The subscription prices of the
shares correspond to the volume weighted average share price of
the Company in January – March of 2008. The terms and condi-
tions of the Warrant Program were published as a stock exchange
release on February 26, 2007.
Share-based incentive plan
The Board of Directors of Basware Corporation has approved a
new share-based incentive plan for the Basware Group key per-
sonnel on March 1 1, 2009. The Plan includes three earning pe-
riods, calendar 2009, 2010 and 201 1. The Board of Directors de-
cides on the earnings criteria and targets to be established for
them separately for each earning period, at the beginning of each
earning period. The potential reward from the Plan for the earn-
ing period 2009 will be based on the Basware Group’s Earnings
per Share (EPS).
The bonus for the vesting period 2009 was paid in December
201 1 partially as shares in the company and partially in cash. The
part paid in cash covers the withholding tax.
Share and Shareholders
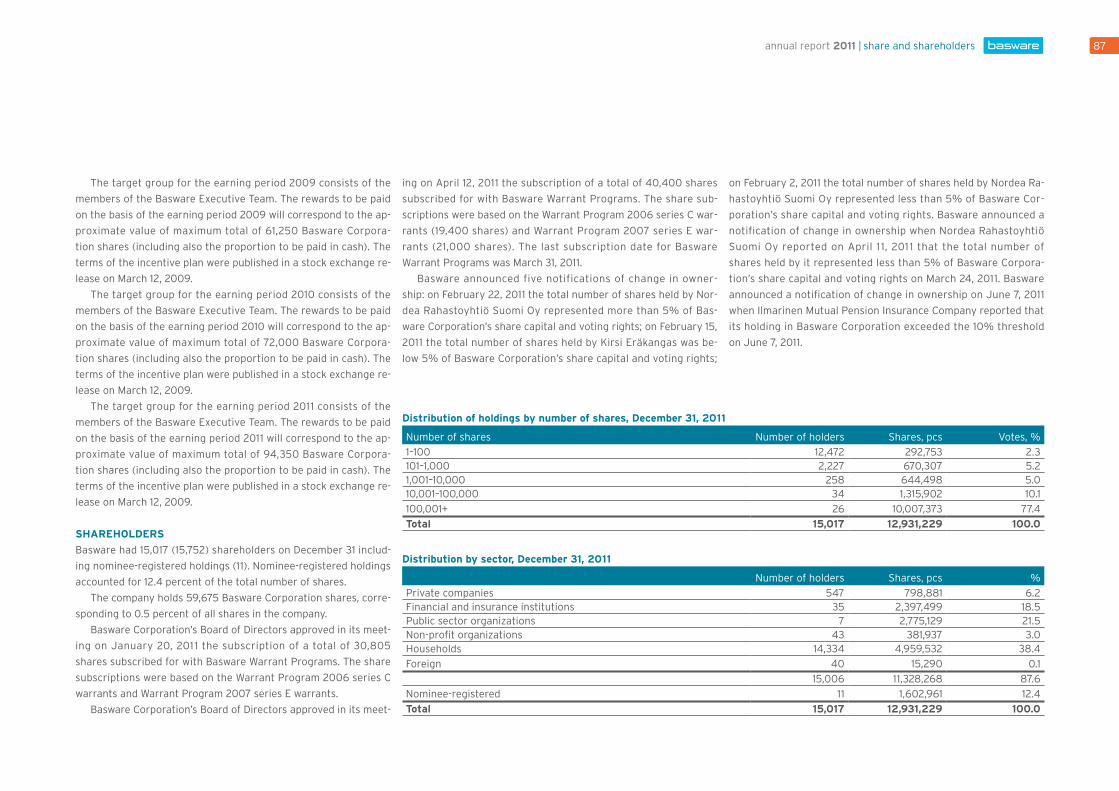
87annual report 2011 | share and shareholders
The target group for the earning period 2009 consists of the
members of the Basware Executive Team. The rewards to be paid
on the basis of the earning period 2009 will correspond to the ap-
proximate value of maximum total of 61,250 Basware Corpora-
tion shares (including also the proportion to be paid in cash). The
terms of the incentive plan were published in a stock exchange re-
lease on March 12, 2009.
The target group for the earning period 2010 consists of the
members of the Basware Executive Team. The rewards to be paid
on the basis of the earning period 2010 will correspond to the ap-
proximate value of maximum total of 72,000 Basware Corpora-
tion shares (including also the proportion to be paid in cash). The
terms of the incentive plan were published in a stock exchange re-
lease on March 12, 2009.
The target group for the earning period 201 1 consists of the
members of the Basware Executive Team. The rewards to be paid
on the basis of the earning period 201 1 will correspond to the ap-
proximate value of maximum total of 94,350 Basware Corpora-
tion shares (including also the proportion to be paid in cash). The
terms of the incentive plan were published in a stock exchange re-
lease on March 12, 2009.
shareholDers
Basware had 15,017 (15,752) shareholders on December 31 includ-
ing nominee-registered holdings (1 1). Nominee-registered holdings
accounted for 12.4 percent of the total number of shares.
The company holds 59,675 Basware Corporation shares, corre-
sponding to 0.5 percent of all shares in the company.
Basware Corporation’s Board of Directors approved in its meet-
ing on January 20, 201 1 the subscription of a total of 30,805
shares subscribed for with Basware Warrant Programs. The share
subscriptions were based on the Warrant Program 2006 series C
warrants and Warrant Program 2007 series E warrants.
Basware Corporation’s Board of Directors approved in its meet-
ing on April 12, 201 1 the subscription of a total of 40,400 shares
subscribed for with Basware Warrant Programs. The share sub-
scriptions were based on the Warrant Program 2006 series C war-
rants (19,400 shares) and Warrant Program 2007 series E war-
rants (21,000 shares). The last subscription date for Basware
Warrant Programs was March 31, 201 1.
Basware announced five notifications of change in owner-
ship: on February 22, 201 1 the total number of shares held by Nor-
dea Rahastoyhtiö Suomi Oy represented more than 5% of Bas-
ware Corporation’s share capital and voting rights; on February 15,
201 1 the total number of shares held by Kirsi Eräkangas was be-
low 5% of Basware Corporation’s share capital and voting rights;
Distribution of holdings by number of shares, December 31, 20 1 1
Number of shares Number of holders Shares, pcs Votes, %
1–100 12,472 292,753 2.3101–1,000 2,227 670,307 5.21,001–10,000 258 644,498 5.010,001–100,000 34 1,315,902 10.1
100,001+ 26 10,007,373 77.4
total 15,017 12,931,229 100.0
Distribution by sector, December 31, 20 1 1
Number of holders Shares, pcs %
Private companies 547 798,881 6.2Financial and insurance institutions 35 2,397,499 18.5Public sector organizations 7 2,775,129 21.5Non-profit organizations 43 381,937 3.0Households 14,334 4,959,532 38.4
Foreign 40 15,290 0.1
15,006 1 1,328,268 87.6
Nominee-registered 1 1 1,602,961 12.4
total 15,017 12,931,229 100.0
on February 2, 201 1 the total number of shares held by Nordea Ra-
hastoyhtiö Suomi Oy represented less than 5% of Basware Cor-
poration’s share capital and voting rights. Basware announced a
notification of change in ownership when Nordea Rahastoyhtiö
Suomi Oy reported on April 1 1, 201 1 that the total number of
shares held by it represented less than 5% of Basware Corpora-
tion’s share capital and voting rights on March 24, 201 1. Basware
announced a notification of change in ownership on June 7, 201 1
when Ilmarinen Mutual Pension Insurance Company reported that
its holding in Basware Corporation exceeded the 10% threshold
on June 7, 201 1.

annual report 2011 | share and shareholders88
major shareholders,
December 31, 20 1 1 Shares, pcs Votes, %
1 Ilmarinen Mutual Pension Insurance Company 1,590,000 12.32 Sihvo, Ilkka 881,675 6.83 Eräkangas, Kirsi 827,300 6.4
Eräkangas, Kirsi 576,900 4.5Eräkangas, Lotta 250,400 1.9
4 Vaajoensuu, Hannu 673,800 5.2Havacment Oy 266,500 2.1Vaajoensuu, Hannu 323,500 2.5Vaajoensuu, Matias 83,800 0.6
5 Perttunen, Sakari 665,900 5.16 Varma Mutual Pension Insurance Company 530,000 4.17 Nordea Nordic Small Cap Fund 387,585 3.08 Veritas Pension Insurance Company 377,782 2.99 Fondita Nordic Micro Cap 355,000 2.710 Op-Suomi Pienyhtiöt 325,000 2.51 1 Pöllänen, Antti 299,023 2.312 Valtion Eläkerahasto 256,000 2.013 Kaleva Mutual Insurance Company 223,790 1.714 Investment Fund Aktia Capital 208,313 1.615 OP-Delta Fund 202,500 1.616 FIM Fenno Fund 181,243 1.417 Perttunen, Meimi 175,400 1.418 Ahonen, Asko 168,736 1.319 Fim Forte Fund 150,000 1.220 Mandatum Life Insurance Company Ltd. 1 16,371 0.9
20 largest shareholders total 8,595,418 66.5Nominee registered shares 1,602,961 12.4Others 2,732,850 21.1Total 12,931,229 100.0
The shareholder information is based on the shareholder’s register maintained by the Finnish Central Depository Ltd.
LIST OF ACCOUNTING BOOKS USED Hard copy of journal ledger
Hard copy of general ledger
Hard copy of sales ledger
Hard copy of sales ledger

89annual report 2011 | information for shareholders
BasWare share
Basware shares are quoted on the Main List of the Helsinki Stock Exchange, in the Information Tech-
nology sector, Mid Cap segment. The trading on the Main List started on October 19, 2004. Earlier
Basware shares were traded on the NM List of the stock exchange.
Trading code BAS1V
ISIN code FI0009008403
Book-counter value EUR 0.30
Listing price on February 29, 2000 EUR 5.70
Closing price on December 31, 20 1 1 EUR 16.45
annual General meetinG
The Basware Annual General Meeting will be held on February 16, 2012 at 14:00 in Helsinki Music
Centre, Mannerheimintie 13a, Helsinki.
In order to take part in the Annual General Meeting, shareholders must be registered by February 6,
2012 in the shareholders’ register maintained by the Finnish Central Securities Depository Ltd.
Shareholders who wish to participate in the meeting should notify Basware of their intention to par-
ticipate by 10:00 on Monday February 13, 2012 either
» by Internet Web-page http://www.basware.com/about-us/investors
» by telephone to +358 20 770 6867 Monday – Friday at 9:00 to 16:00.
» by mail to the address Basware Corporation, P.O. Box 97, 02601 Espoo, Finland (please mark the
envelope with ”AGM”)
When registering by mail, fax or e-mail, notices of participation must be received by the above-men-
tioned deadline. Any powers-of-attorney should be sent with the notice.
The matters to be handled in the Annual General Meeting will be disclosed in the Notice of the meet-
ing that was published as a stock exchange release and on the Basware investor pages on the Inter-
net at www.Basware.com.
DiViDenD
The Board of Directors of Basware proposes to the Annual General Meeting that a dividend of EUR
0.41 per share be paid for 201 1. If the Board’s proposal is accepted, the dividend will be paid to those
shareholders who are entered in the shareholders’ register maintained by the Finnish Central Securi-
ties Depository Ltd. on the dividend record date February 21, 2012. The actual payment of dividends
will take place on February 28, 2012.
financial rePortinG in 2012
Release dates for interim reports:
- Interim Report January-March 2012 (Q1) on Friday, April 13, 2012
- Interim Report January-June 2012 (Q2) on Wednesday, July 1 1, 2012
- Interim Report January-September 2012 (Q3) on Wednesday, October 10, 2012
This financial statement release has been prepared in accordance with IAS 34, Interim Financial Re-
porting.
All interim reports and stock exchange releases are available on the Basware investor relations pag-
es on the Internet at www.Basware.com. The Basware e-mail list for the stock exchange releases can
be subscribed to through the pages.
chanGes of aDDress
If the address of a shareholder changes, we request sending a written notification of this to the bank
where the shareholder’s book-entry account is held.
For Shareholders

90
NORWAYBasware AS Drammensveien 288P.O. Box 241 LilleakerNO-0216 Oslo NorwayTel. +47 233 703 00Fax +47 233 703 01
Halvor Heyerdalsvei 318626 Mo i RanaTel. +47 233 703 00Fax +47 233 703 01www.basware.no
SWEDENBasware AB Gustavslundsvägen 141 A16751 BrommaTel. +46 8 505 7 44 00Fax +46 8 5057 44 99
Falugatan 2791 71 FalunSwedenTel. +46 8 505 744 00Fax +46 8 505 744 99
THE NETHERLANDSBasware B.V. Joop Geesinkweg 7011096 AZ AmsterdamThe NetherlandsTel. +31 20 850 8020Fax +31 20 850 8085www.basware.nl
UNITED KINGDOMBasware UK Ltd.7 Huxley RoadSurrey Research ParkGuildford, Surrey GU2 7RE United KingdomTel. +44 (0) 845 671 1953Fax +44 (0) 845 671 1955 www.basware.co.uk
Manchester:No. 1 Booths ParkChelford RoadKnutsfordWA16 8GSTel. +44 (0) 845 671 1953Fax +44 (0) 845 671 1955
FRANCEBasware SAS 7, rue du Général Foy75008 ParisFrance Tel. +33 1 400 818 20Fax +33 1 400 818 30www.basware.fr GERMANYBasware GmbH Roßstr. 96 D-40476 DüsseldorfGermanyTel. +49 211 415 595 50Fax +49 211 41 5 595 79www.basware.de
NORTH AMERICABasware, Inc.Basware, Inc. 60 Long Ridge Road, Suite 301 Stamford, CT 06902 Tel. +1 203 487 7900Fax +1 203 487 7950 www.basware.com
Annual report 2011 | contacts

91annual report 2011 | contacts
HEADQUARTERS:P.O. Box 97FI-02601 EspooFinlandVisiting address: Linnoitustie 2B, Cello buildingTel. +358 9 879 171Fax +358 209 341 0123
TAMPEREPyhäjärvenkatu 5 B33200 TampereFinlandTel. +358 9 879 171Fax +358 209 341 0001
OULU Sepänkatu 2090100 OuluFinlandTel. +358 9 879 171Fax +358 8 551 3976
PORI Isolinnankatu 22 B28100 PoriFinlandTel. +358 9 879 171
www.basware.com
RUSSIARepresentative offi ce of Basware Corporation in RussiaHelsinki House in Moscow4, Rostovsky per.1/2119121 Moscow RussiaTel. + 7 499 248 1673Fax + 7 499 248 0658
INDIABasware Corporation (India branch offi ce) Rajiv Gandhi IT Park (DLF Building) Tower F, Third Floor Chandigarh India - 160 001Tel. +91 172 301 2020Fax +91 172 301 2019
AUSTRALIABasware Pty LTD Level 1567 Albert AvenueChatswood NSW 2067Tel. +61 2 862 258 50Fax +61 2 862 258 99
SINGAPOREBasware Corporation 9 Penang Road,#08-08 Park MallSingapore 238459 Tel. +65 633 206 78Fax +65 633 459 81
DENMARKBasware A/SJægersborgvej 66B2800 Kgs. LyngbyDenmarkTel. +45 702 299 55Fax +45 702 299 56www.basware.dk

www.basware.com


