Download - WWV2015: Jibes Paul van der Hulst big data

1
Agenda
•Introduction
•Data driven & Data analytics?
•Examples
•Demo: Instant Insights
•How to get going
•Questions

In 5 years from now…Elephants will rule the world
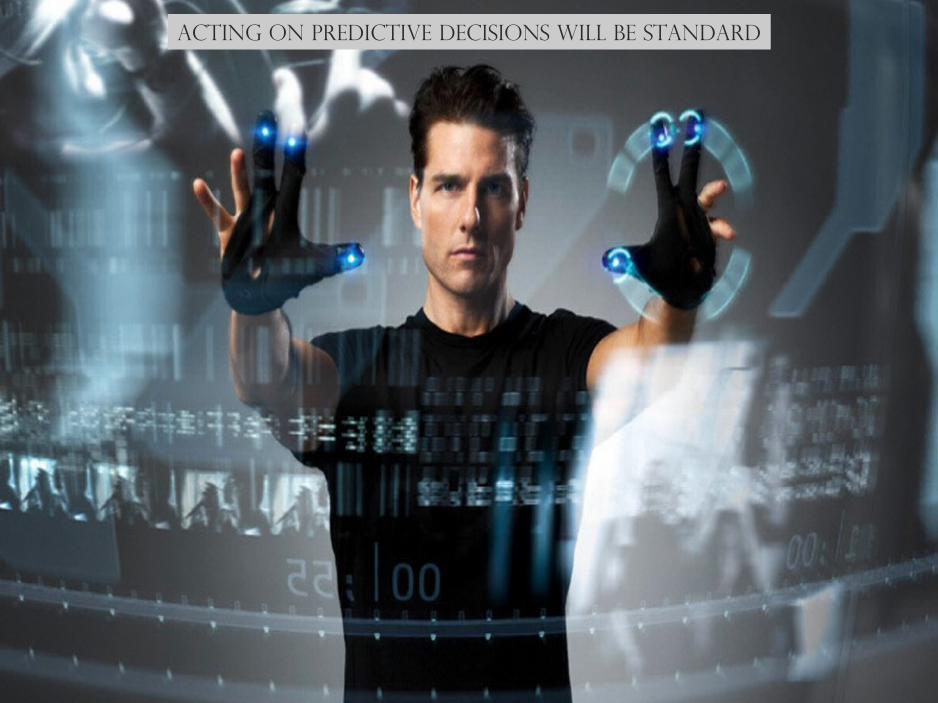
Acting on predictive Decisions will be standard

Real Time Analytics is to blame for a crash

Mobile User Interfacing will be the Standard

Data will be everywhere and Nobody knows where exactly

PRIVACY WILL STILL BE A BIG CONCERN

8
Vision Processes are not purely transactional but more and more data- and information driven
Focus Best-in-class strategy
Domains Advanced Data Analytics Data Integration & Data Quality Master Data Management Business Intelligence
Awards FD Gazelle 2011, 2012, 2013 & 2014
Team JDA curious & can do specialist ranging from front-end developers, hard core statisticians, mathemagitions, AI experts, MBA/ big four consulting and PHD’s.
We work with (amongst other)
HDFS
IntroductionWho & What is Jibes….

“TODO”Data entitlem
ent
Secure data exchange
Trus
ted
data
New ecosystems
Introduction
… and we are equiped to deliver new data ecosystems
“TODO”
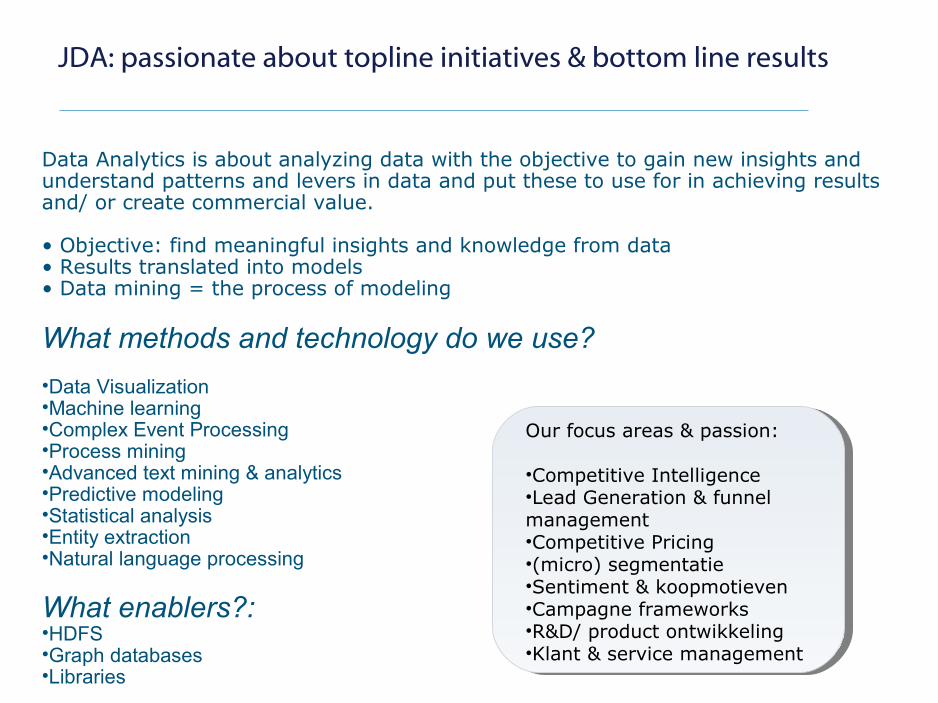
Data Analytics is about analyzing data with the objective to gain new insights and understand patterns and levers in data and put these to use for in achieving results and/ or create commercial value.
• Objective: find meaningful insights and knowledge from data• Results translated into models• Data mining = the process of modeling
What methods and technology do we use?
•Data Visualization•Machine learning•Complex Event Processing•Process mining•Advanced text mining & analytics•Predictive modeling•Statistical analysis•Entity extraction•Natural language processing
What enablers?: •HDFS•Graph databases•Libraries
Our focus areas & passion:
•Competitive Intelligence•Lead Generation & funnel management•Competitive Pricing•(micro) segmentatie•Sentiment & koopmotieven•Campagne frameworks•R&D/ product ontwikkeling•Klant & service management
JDA: passionate about topline initiatives & bottom line results

11
Agenda
•Introduction
•Context: data driven
•Data analytics?
•Examples
•Demo 1: Instant Insights
•How to get going
•Questions
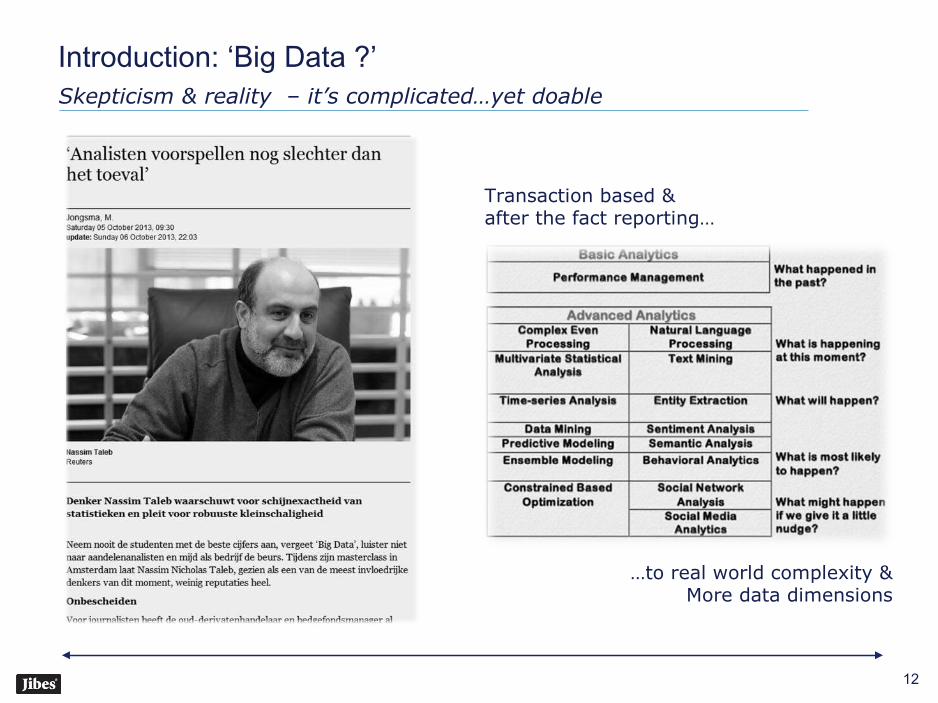
Introduction: ‘Big Data ?’
12
Skepticism & reality – it’s complicated…yet doable
Transaction based & after the fact reporting…
…to real world complexity &More data dimensions

Some statements (1/3): data types
13
Data at rest:
•Stored in databases or file
systems.
•Relatively stabile/ static
•Currenty most big-data
applications are aimed at
data at rest
Data in motion:
•Real-time data flows
•This data is not (always)
stored
•Examples:
• Sensor data
• Phone calls
• Network traffic
• Production process
• …
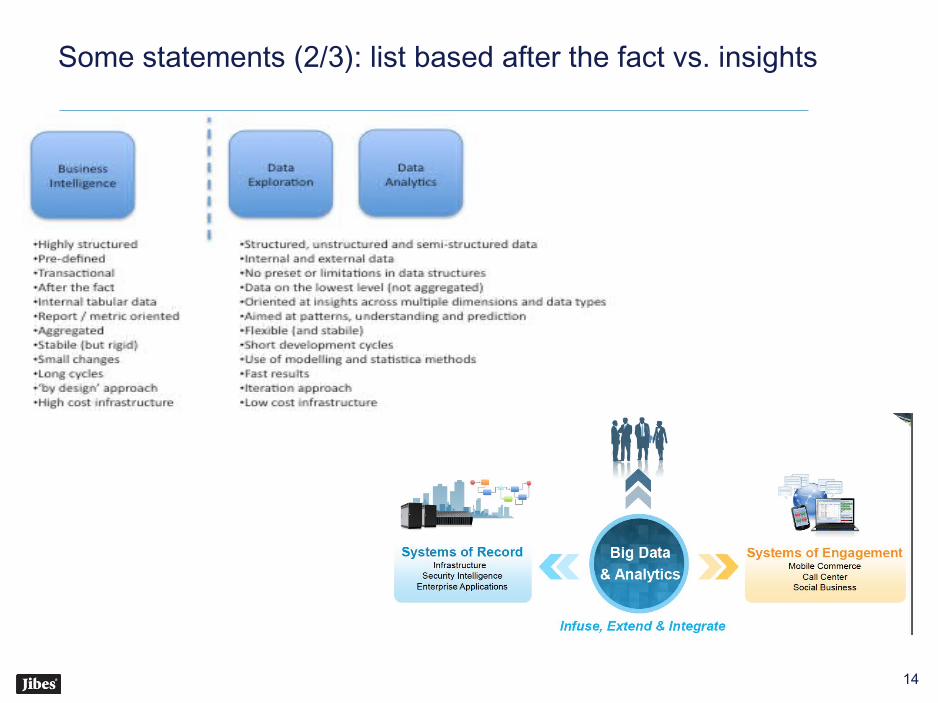
Some statements (2/3): list based after the fact vs. insights
14

Some statements (3/3): crawl, walk & run
15
Descriptive
Predictive
Prescriptive
Time
Com
plex
ity
Cognitive
Descriptive: (median, frequency spread, standard deviation, trends)
Declarative: cross reference tables, hypothesis testing, variance analysis, percentiles, pareto
Predictive: cluster analysis, correlations, regression, discriminants, factor, CHAID, neural network, associative techniques etc)

Data Evolution
16
Machine generated data. Where does it come from (and where does it go?)
Machine and man generated data
•More sensors in systems•More online and interconnected •Structured data is relatively uniform and small in size – challenge is in integration•Unstructured data is more difficult to capture and interpret
We store everything but what do we do with it? + Who dares to through something away?
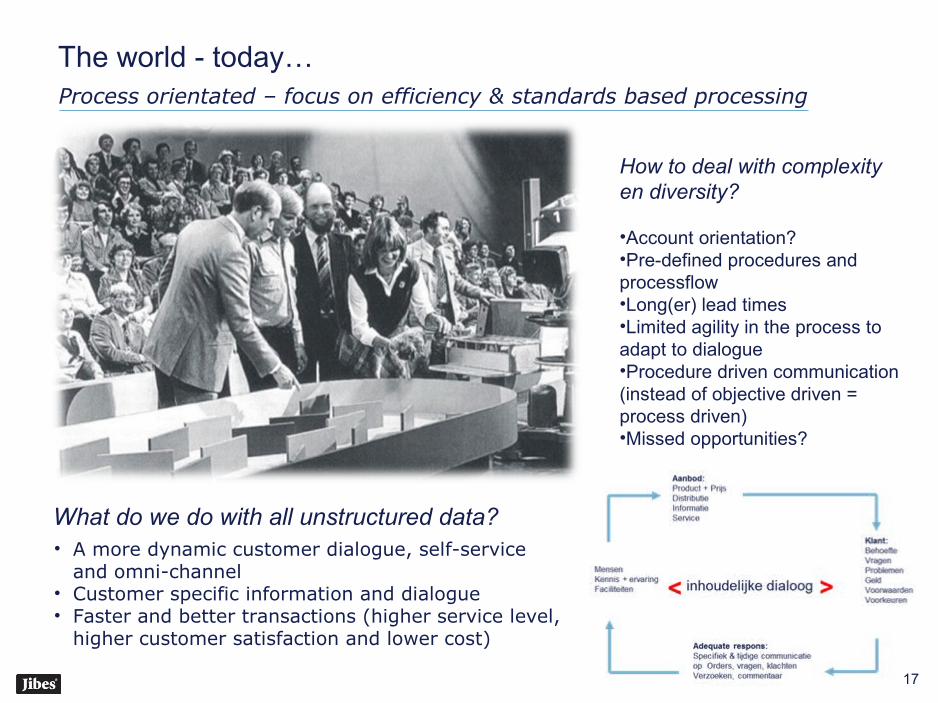
The world - today…
17
Process orientated – focus on efficiency & standards based processing
What do we do with all unstructured data?
How to deal with complexity en diversity?
•Account orientation?•Pre-defined procedures and processflow•Long(er) lead times•Limited agility in the process to adapt to dialogue •Procedure driven communication (instead of objective driven = process driven)•Missed opportunities?
• A more dynamic customer dialogue, self-service and omni-channel
• Customer specific information and dialogue• Faster and better transactions (higher service level,
higher customer satisfaction and lower cost)

The world of tomorrow…
18
Key principles:
•Network effects ! •Profiling vs. Privacy: TRUST•Data integrity & quality of data•Focus & perseverance•Intelligent interactions
Its about INSIGHTS en ACT accordingly

The world of tomorrow…
19
Consistent approach to gain customer insights and behaviour:
•Start small with a pilot group•Work on data quality•Expand target group•Add functionality•Data integration•Analytics!•Create a feedback loop!!•Loyalty•Profit
Example TESCO design for the future
A local example: Ahold
• New Loyalty system (app)• Integration BOL, Albert & AH
Theme now: ‘the Customer Journey’

The container ‘Big Data’; a break down
What is different in ‘Big Data’?
New technology which enables massive parallel data processing in distributed systems and highly scalable platforms. Examples:• Apache Hadoop• MapReduce• NoSQL databases Increased capabilities analytical tooling:•Emergence of “data science”•Predictive Analytics•Data Mining The emergence of data democracy:• data more easily available (e.g. Cloud Computing)• Business in the driver seat and not IT and/ or BI
Big Data? a new generation of software – better price/ performance

21
Agenda
•Introduction
•Data driven & Data analytics?
•Examples
•Demo: Instant Insights
•How to get going
•Questions

• Vacations (based on foreign ATM’s): an upward trend
• New unemployment benefits per month. Note an upward trend in January 2013.
• Salarisincrease & –decrease (April 2013):clearly more decrease than increase.
Advanced Data Analytics
22
Banking: life events from transaction data understand and model
Key analysis to detect and understand life events:• Salary increase and decrease• Benefits• Retirement• Vacation money,bonus• Vakantion
This is based on (anonimised) transaction data onl, so not using text descroptions. This enables very accuarate spotting and modelling of events.
Life events ontransactional data

Many customers show regular and predictable behaviour that is suitable for modeling.
Predicts balance with a reliability interval (red lines)
Advanced Data Analytics
23
Banking: from understanding and modeling to prediction
• By using time series methods we can predict balances for a large number of accounts.
• We can predict very reliable for over 70% of the accounts.
• These methods can also be used to spot life events that show strong iregularities from the predicted course of action.
Predict account balance
Outlyers are easy to spot using statistical methods.

The broadcasting model is losing ground to 2nd screen, on demand and pay TV.
Advanced Data Analytics
24
Media: from linear broadcasting to online on demand

Advanced Data Analytics
25
Other applications
1. BOL: cost reduction and high performance processing
• Lower cost due to hybrid platform (Hadoop and Oracle)• More real time processing power to feed the recommendation engine• Better pre-processing of data for analysts (higher productivity)• Higher conversion, better margins
2. Scania: advanced mobility and fleet management
• Integrated and connected systems (data from trucks to central database connected with history and other dimensions (geo, weather, demographics)
• Profiles; what is the best approach considering the circumstances• Route support• Predictive maintenance based on type of drivers, damage and fuel
consumption
3. UMCU: connect clinical data and research data (now 2 worlds):
• Better and bigger datasets through text analytics• Build a bigger data catalogue of related illnesses and treatments to design
profiles and understand patterns (more data dimensions)• Better statistical models and predictive models
Data Obesit?

26
Agenda
•Introduction
•Data driven & Data analytics?
•Examples
•Demo: Instant Insights
•How to get going
•Questions

Advanced Data Analytics &
27
Many data dimensions – How to make it consumable? Data Visualization
Instant Insights
Data Visualization
28
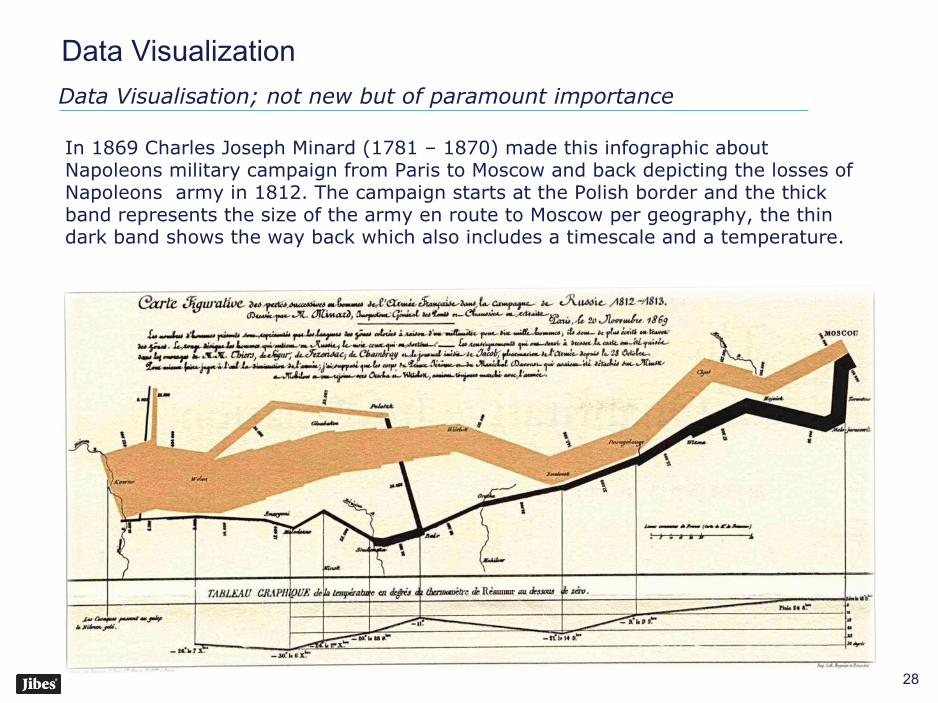
Data Visualisation; not new but of paramount importance
In 1869 Charles Joseph Minard (1781 – 1870) made this infographic about Napoleons military campaign from Paris to Moscow and back depicting the losses of Napoleons army in 1812. The campaign starts at the Polish border and the thick band represents the size of the army en route to Moscow per geography, the thin dark band shows the way back which also includes a timescale and a temperature.

Advanced Data Analytics
29
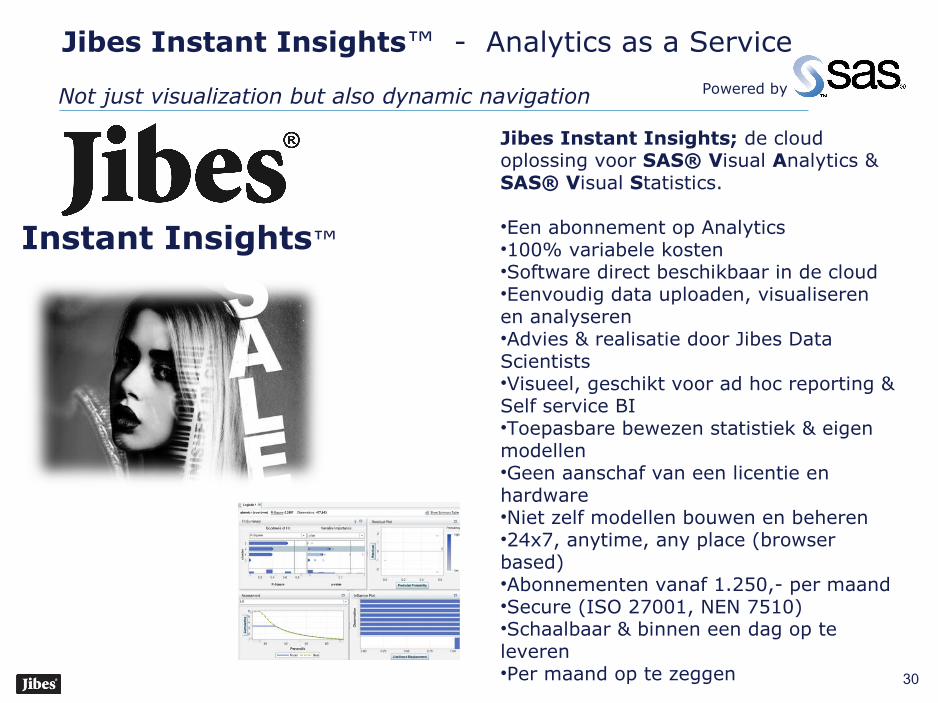
Not just visualization but also dynamic navigation
30
Not just visualization but also dynamic navigation
Instant Insights™
Jibes Instant Insights™ - Analytics as a Service Powered by
Jibes Instant Insights; de cloud oplossing voor SAS® Visual Analytics & SAS® Visual Statistics. •Een abonnement op Analytics•100% variabele kosten •Software direct beschikbaar in de cloud•Eenvoudig data uploaden, visualiseren en analyseren•Advies & realisatie door Jibes Data Scientists•Visueel, geschikt voor ad hoc reporting & Self service BI•Toepasbare bewezen statistiek & eigen modellen•Geen aanschaf van een licentie en hardware•Niet zelf modellen bouwen en beheren•24x7, anytime, any place (browser based)•Abonnementen vanaf 1.250,- per maand•Secure (ISO 27001, NEN 7510)•Schaalbaar & binnen een dag op te leveren•Per maand op te zeggen
31
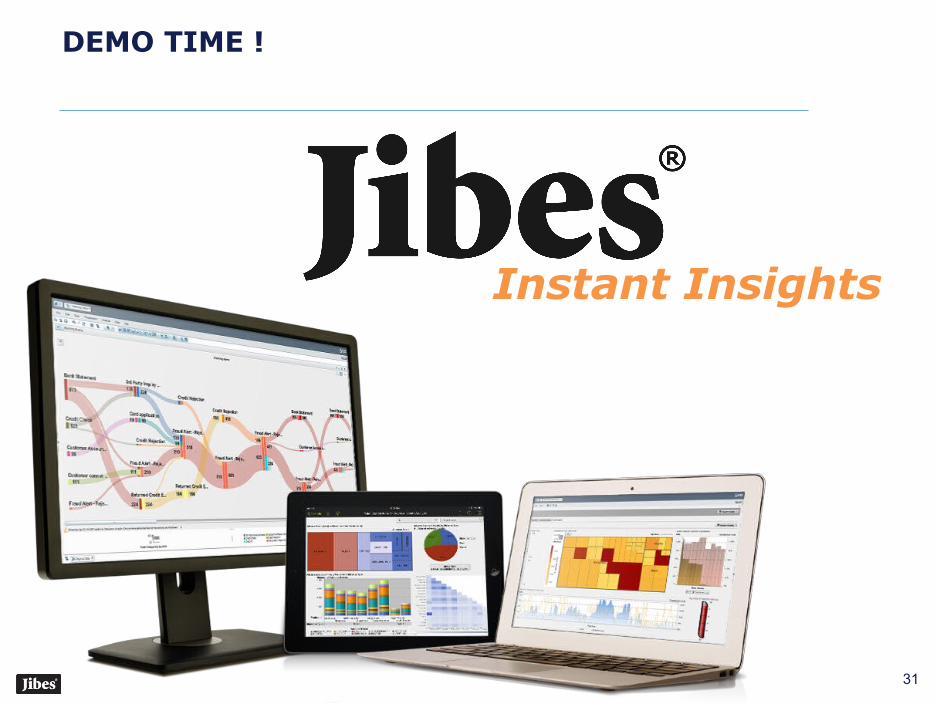
DEMO TIME !
Instant Insights

32
Agenda
•Introduction
•Data driven & Data analytics?
•Examples
•Demo: Instant Insights
•How to get going
•Questions

Go data driven
33
Building is better than talking

Go data driven
34
Building is better than talking: just keep testing
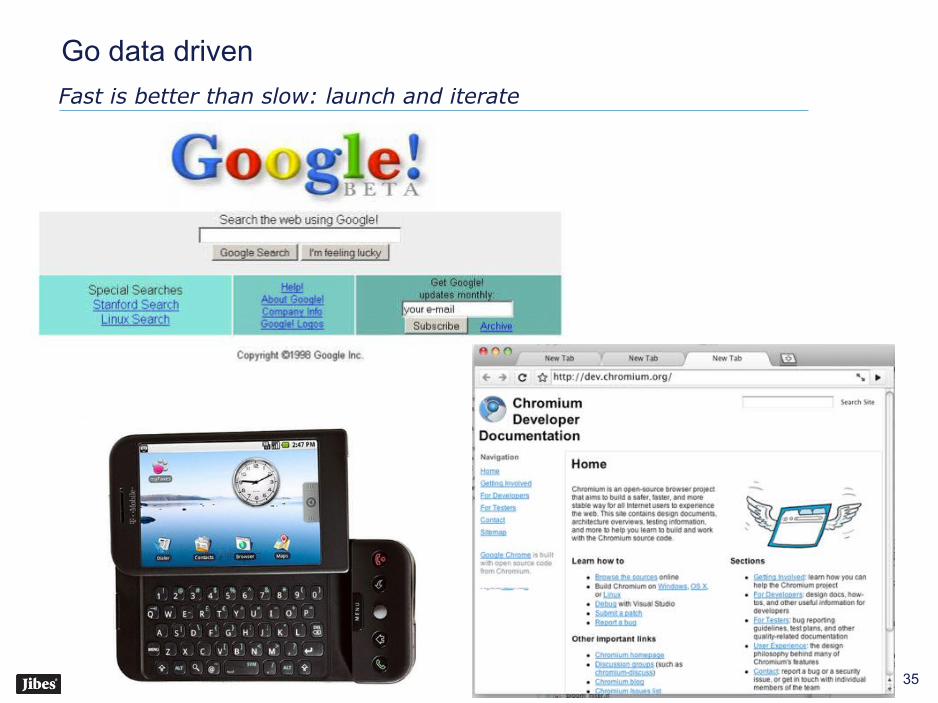
Go data driven
35
Fast is better than slow: launch and iterate

Go data driven
36
Users are better than shareholders: eat your own dogfood
Go data driven
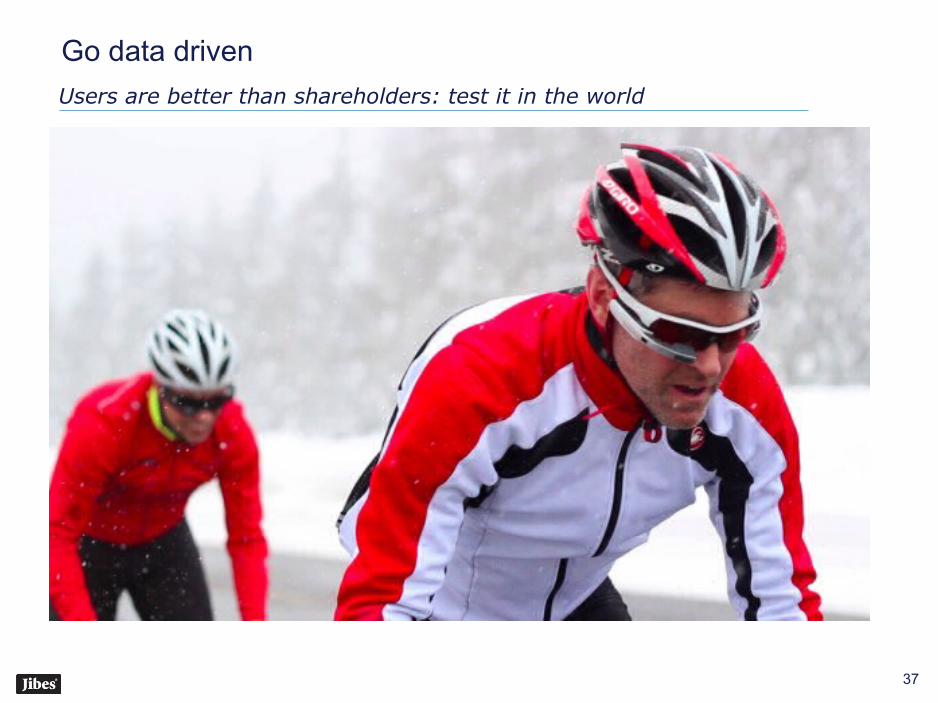
37
Users are better than shareholders: test it in the world

Go data driven
38
Data is better than opinions: measure users
T/I = %tried of % invited (user interest)Rn/T= %of retained users after n weeks (user retention)Rn+1/Rn= slope of user gain / loss over time (user loyalty)
This is the trend we need for succes
This is where products die

Go data driven
39
Data is better than opinions: run experiments
Go data driven
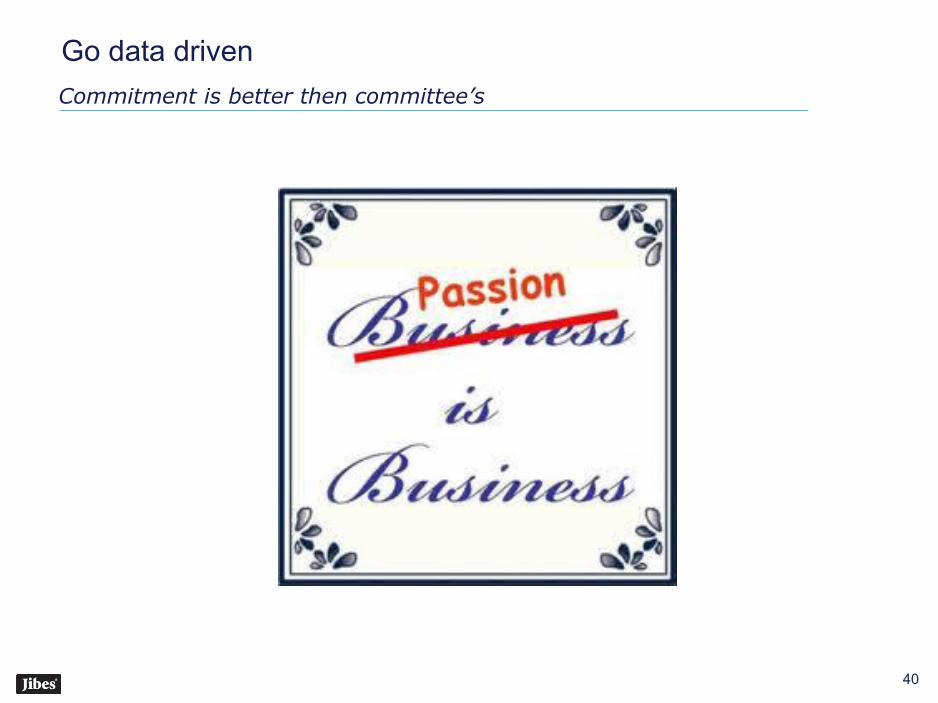
40
Commitment is better then committee’s
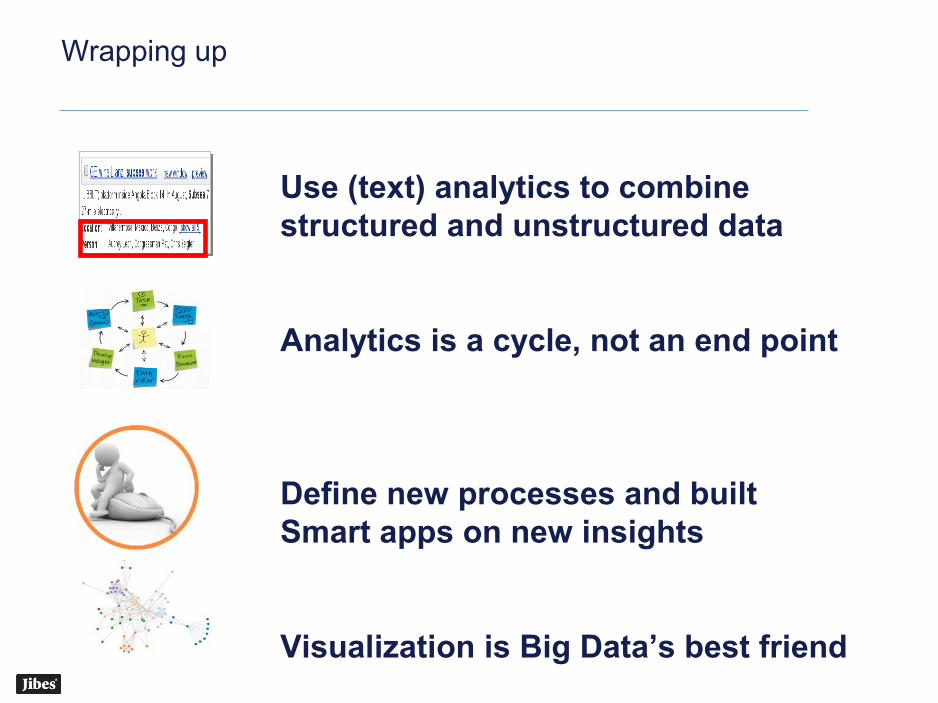
Wrapping up
Use (text) analytics to combine structured and unstructured data
Analytics is a cycle, not an end point
Define new processes and built Smart apps on new insights
Visualization is Big Data’s best friend

Wrapping up
Visit us atD 05or www.jibes.nl
Tel. 06 3466 0007


