

Income vs. Wealth
Income = flow of money into a household over a period of time
Wealth = net worth; value of a households assets minus debts at a single point in time
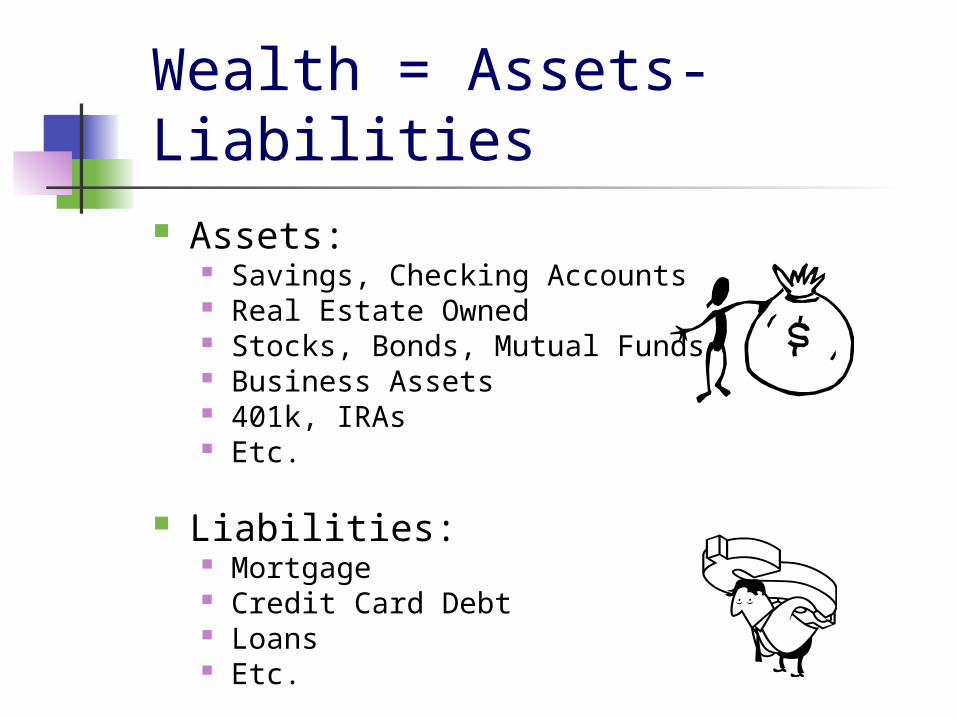
Wealth = Assets-Liabilities Assets:
Savings, Checking Accounts Real Estate Owned Stocks, Bonds, Mutual Funds Business Assets 401k, IRAs Etc.
Liabilities: Mortgage Credit Card Debt Loans Etc.
Why Wealth?
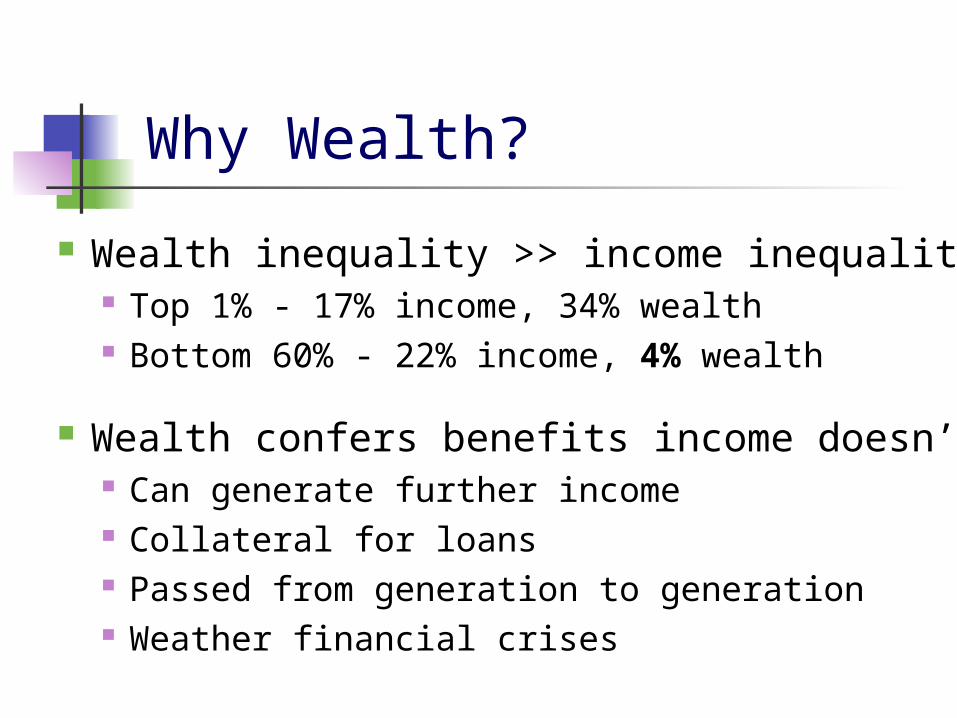
Wealth inequality >> income inequality Top 1% - 17% income, 34% wealth Bottom 60% - 22% income, 4% wealth
Wealth confers benefits income doesn’t Can generate further income Collateral for loans Passed from generation to generation Weather financial crises

Why Care About the Women’s Wealth Gap?
About half of all households are non-married households
About half of all marriages end in divorce
Married women outlive husbands; widowhood is not a financial windfall for most
Women spend more years single than married
Women need more wealth because they live longer than men
Data
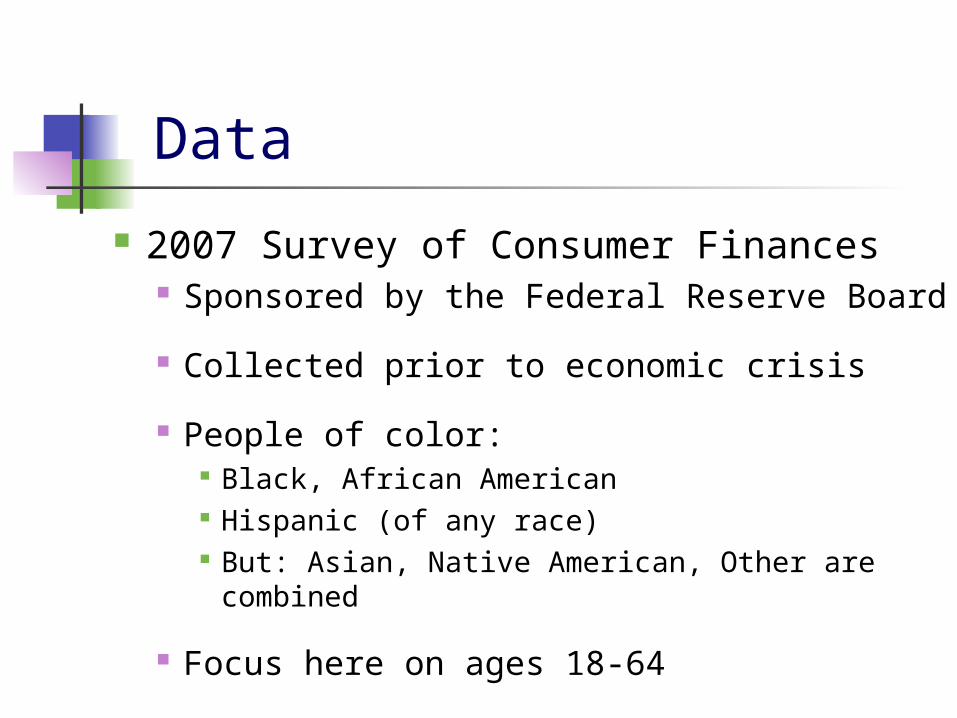
2007 Survey of Consumer Finances Sponsored by the Federal Reserve Board
Collected prior to economic crisis
People of color: Black, African American Hispanic (of any race) But: Asian, Native American, Other are
combined
Focus here on ages 18-64
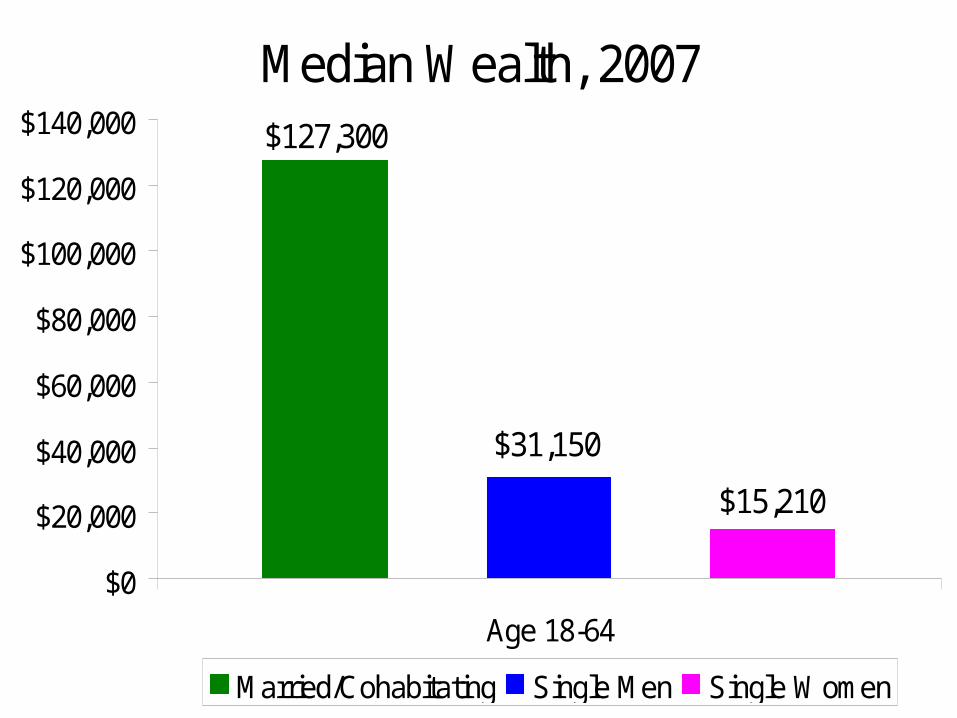
Median Wealth, 2007$127,300
$31,150
$15,210
$0
$20,000
$40,000
$60,000
$80,000
$100,000
$120,000
$140,000
Age 18-64
Married/Cohabitating Single Men Single Women

Percent with Zero or Negative Wealth, 2007
18%
25%
31%
0%
5%
10%
15%
20%
25%
30%
35%
Married/Cohabitating Single Men Single Women
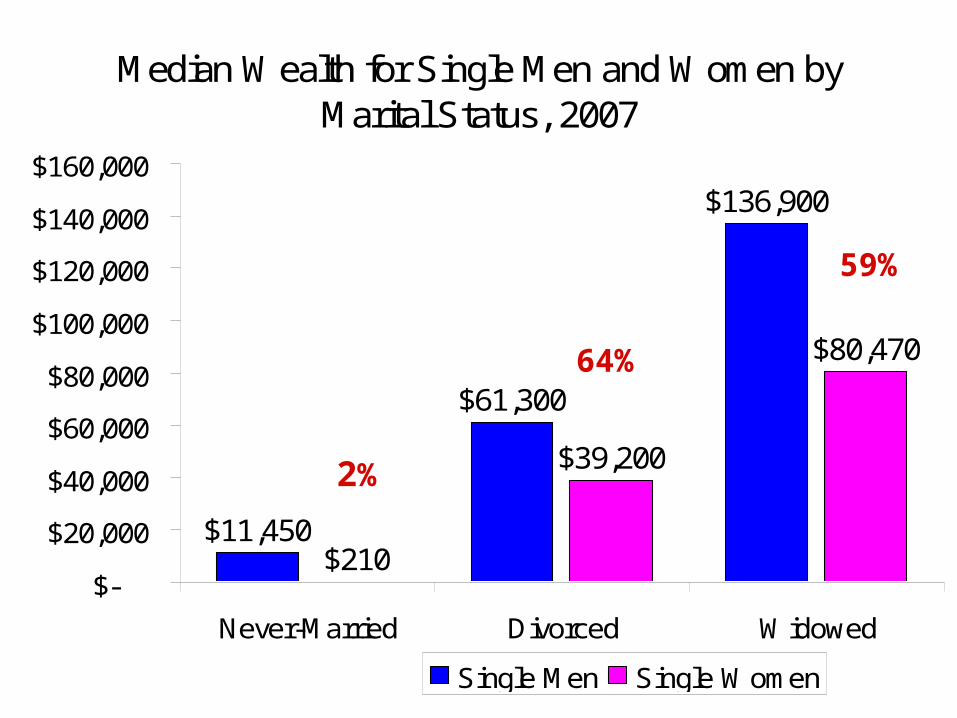
Median Wealth for Single Men and Women by Marital Status, 2007
$11,450
$61,300
$136,900
$210
$39,200
$80,470
$-
$20,000
$40,000
$60,000
$80,000
$100,000
$120,000
$140,000
$160,000
Never-Married Divorced Widowed
Single Men Single Women
2%
64%
59%

Median Wealth for Single Men and Women by Education, 2007
$226,700
$1,890 $7,170
$57,500
$18,820$10,960
$50,510
$170,000
$-
$50,000
$100,000
$150,000
$200,000
$250,000
HS/GED orless
Some College CollegeDegree
AdvancedDegree
Single Men Single Women

Median Wealth for Single Men and Women, 2007
$31,150
$7,900$9,730
$15,210
$100 $120$-
$5,000
$10,000
$15,000
$20,000
$25,000
$30,000
$35,000
All Black Hispanic
Single Men Single Women
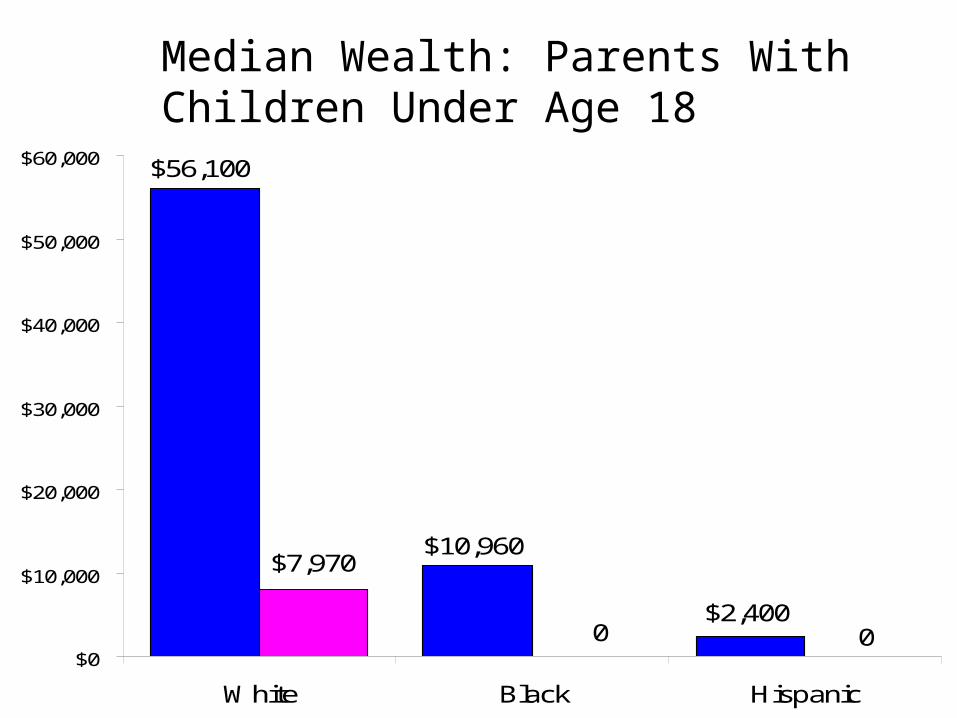
$56,100
$10,960
$2,400
$7,970
0 0$0
$10,000
$20,000
$30,000
$40,000
$50,000
$60,000
White Black Hispanic
Median Wealth: Parents With Children Under Age 18
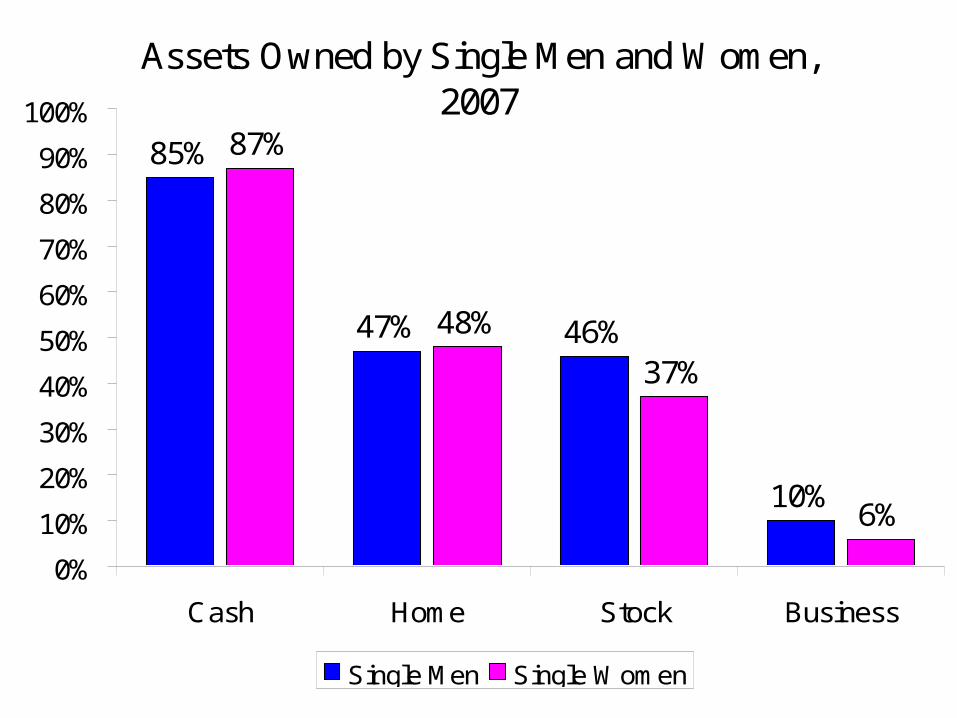
Assets Owned by Single Men and Women, 2007
85%
47% 46%
10%
87%
48%
37%
6%
0%
10%
20%
30%
40%
50%
60%
70%
80%
90%
100%
Cash Home Stock Business
Single Men Single Women
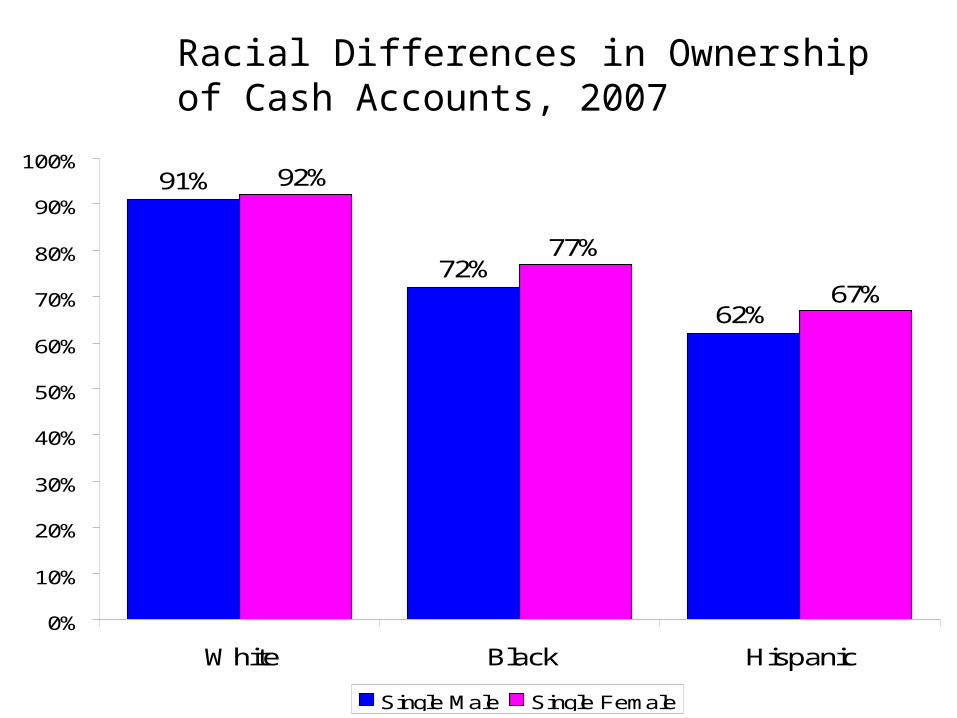
91%
72%
62%
92%
77%
67%
0%
10%
20%
30%
40%
50%
60%
70%
80%
90%
100%
White Black Hispanic
Single Male Single Female
Racial Differences in Ownership of Cash Accounts, 2007
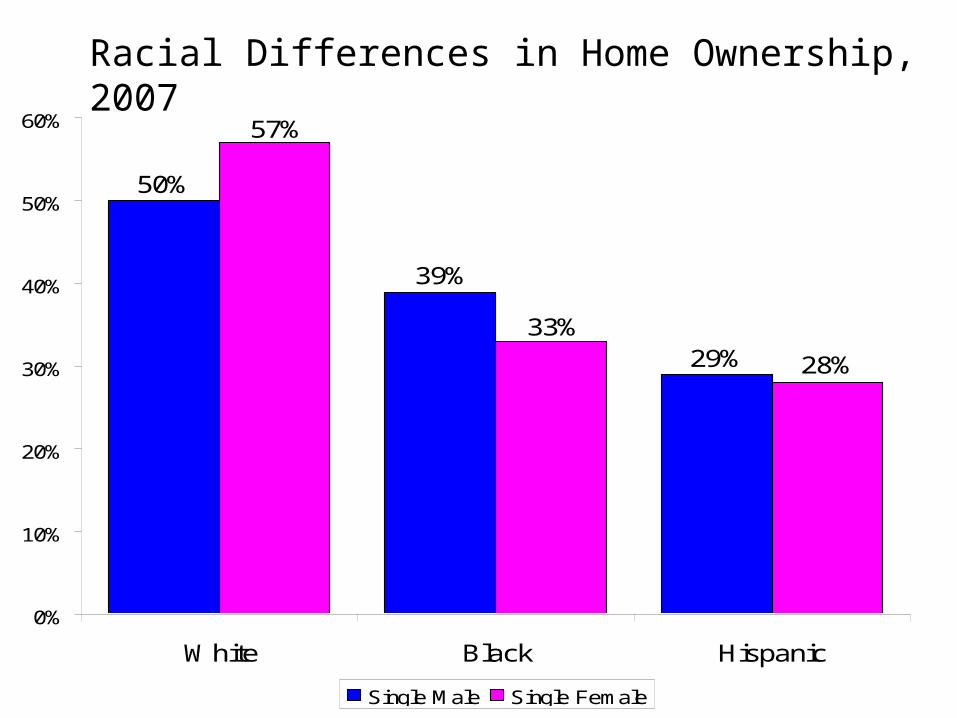
50%
39%
29%
57%
33%
28%
0%
10%
20%
30%
40%
50%
60%
White Black Hispanic
Single Male Single Female
Racial Differences in Home Ownership, 2007
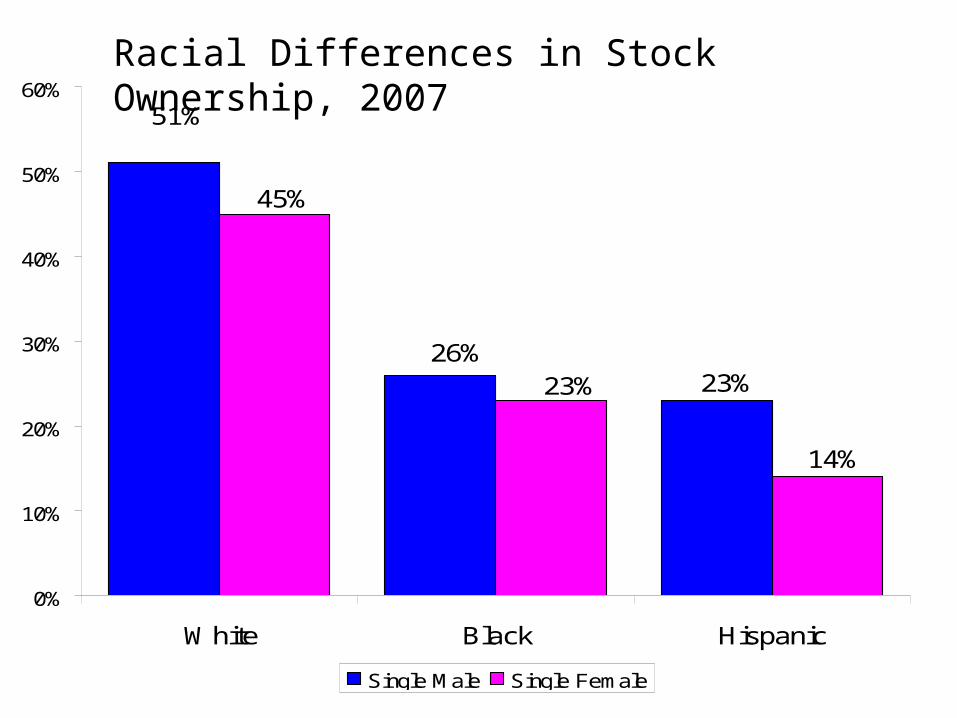
51%
26%23%
45%
23%
14%
0%
10%
20%
30%
40%
50%
60%
White Black Hispanic
Single Male Single Female
Racial Differences in Stock Ownership, 2007
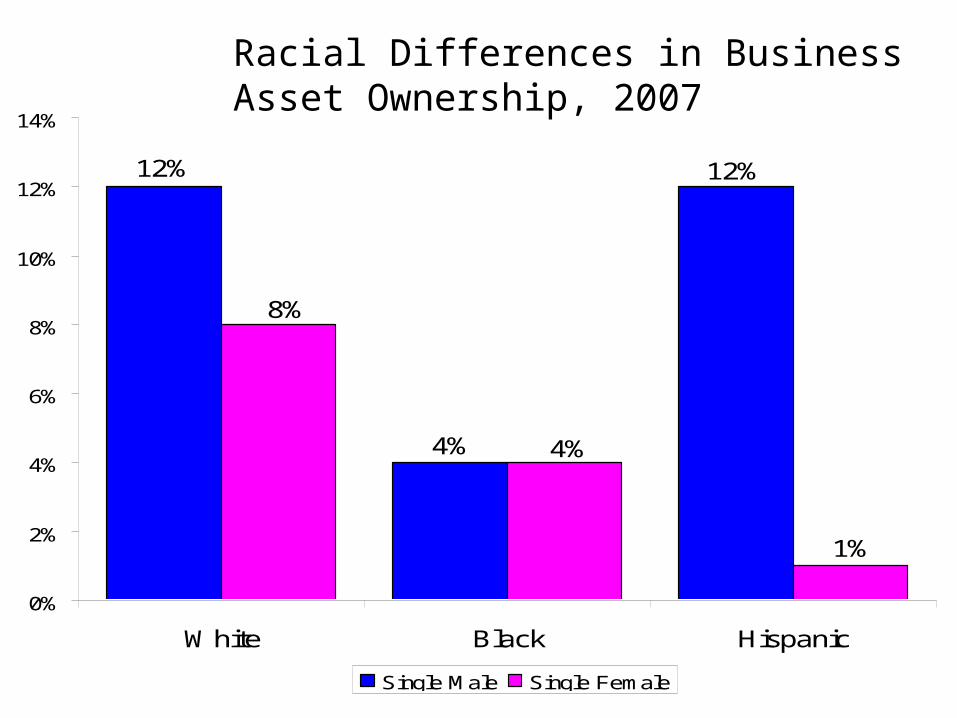
12%
4%
12%
8%
4%
1%
0%
2%
4%
6%
8%
10%
12%
14%
White Black Hispanic
Single Male Single Female
Racial Differences in Business Asset Ownership, 2007

Percent with Forms of Debt, 2007
35%
13%
38%34%
37%
20%
49%
39%
0%
10%
20%
30%
40%
50%
60%
Home Education Credit Card Installment
Single Men Single Women
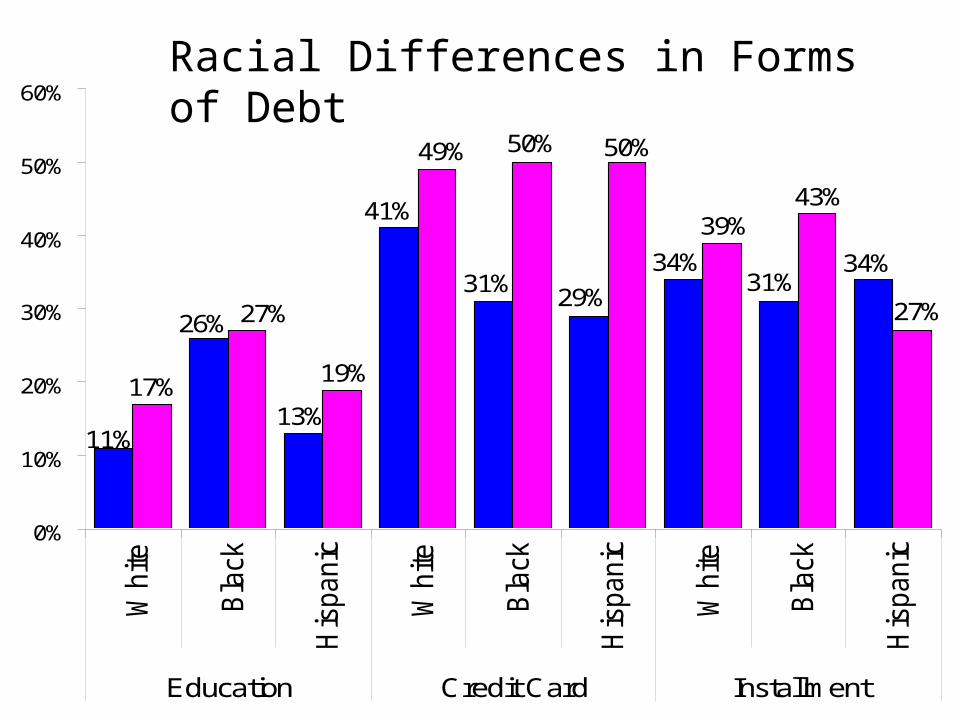
50%
34%31%
34%
29%31%
41%
26%
11%13%
27%
43%39%
50%49%
19%
27%
17%
0%
10%
20%
30%
40%
50%
60%
White
Bla
ck
His
panic
White
Bla
ck
His
panic
White
Bla
ck
His
panic
Education Credit Card Installment
Racial Differences in Forms of Debt
Why?
Earnings gap?

Median Earnings for Full-Time Workers Age18-64,
2007Women Men
Never-Married $31,246 $31,238 100%
Divorced $38,046 $43,621 87%
Widowed $36,016 $49,051 73%
Married $37,986 $52,706 72%
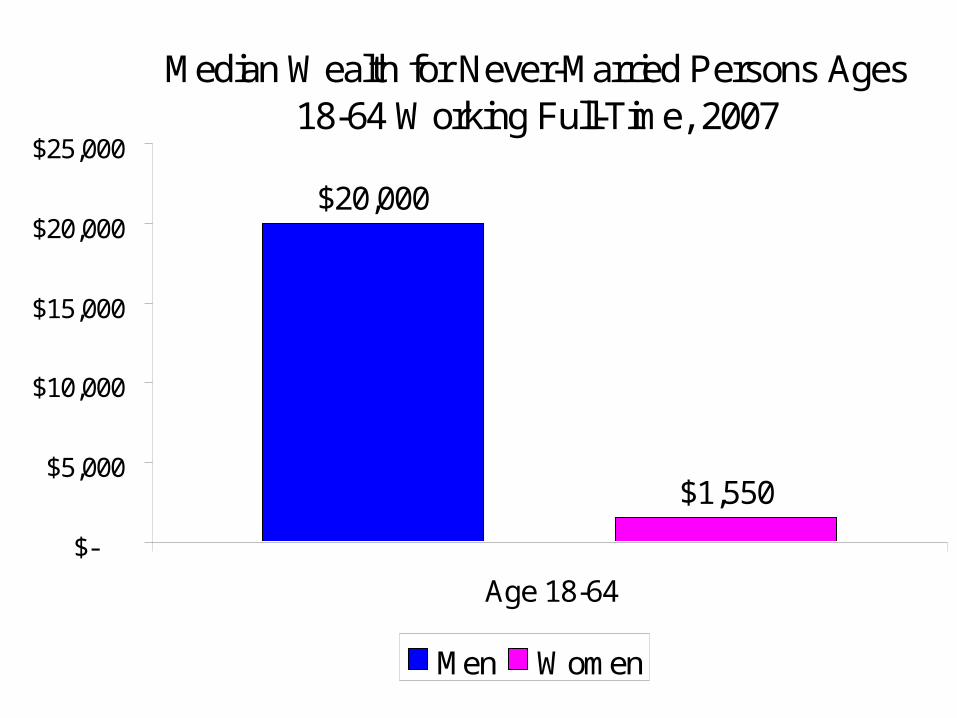
Median Wealth for Never-Married Persons Ages 18-64 Working Full-Time, 2007
$20,000
$1,550
$-
$5,000
$10,000
$15,000
$20,000
$25,000
Age 18-64
Men Women

Median Wealth for Never-Married, Childless Persons Ages 20-30 Working Full-Time, 2007
$1,600
$(6,560)$(7,000)
$(5,000)
$(3,000)
$(1,000)
$1,000
$3,000
$5,000
$7,000
1
Men Women
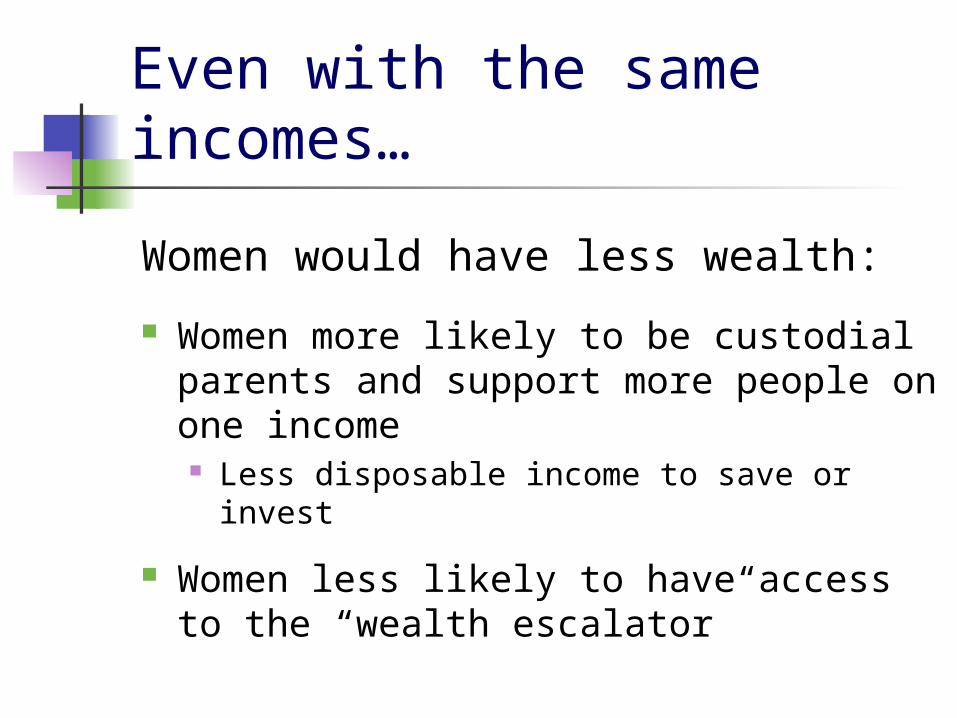
Even with the same incomes…
Women would have less wealth:
Women more likely to be custodial parents and support more people on one income Less disposable income to save or invest
Women less likely to have access to the “wealth escalator”
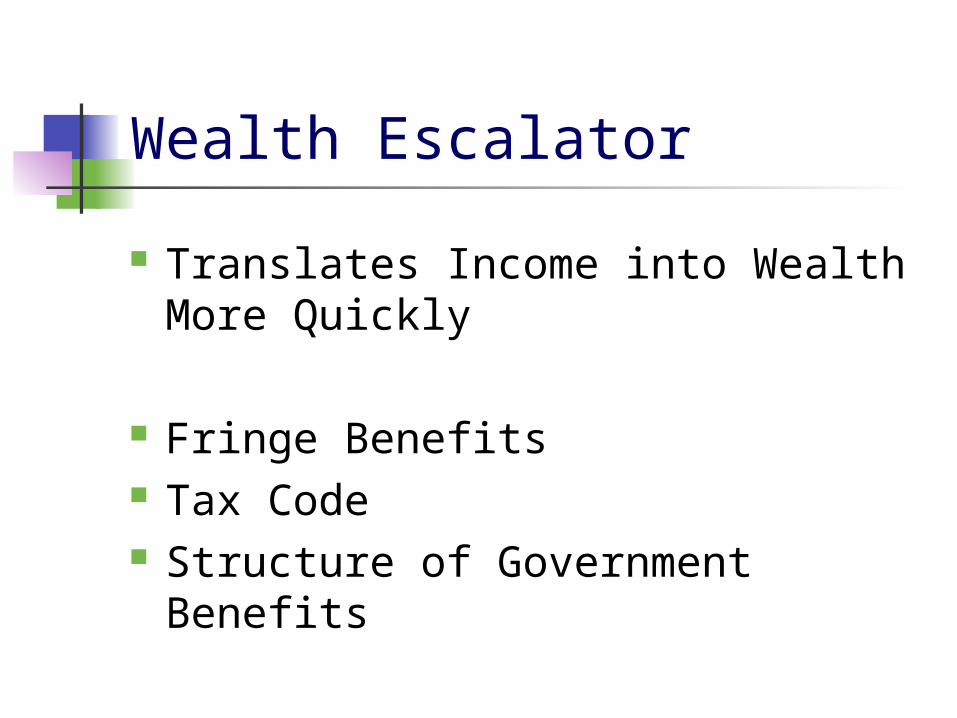
Wealth Escalator
Translates Income into Wealth More Quickly
Fringe Benefits Tax Code Structure of Government Benefits
Wealth Escalator: Fringe Benefits
Directly build wealth Ex: stock options, pension/401k
contributions
Indirectly build wealth Ex: health insurance, paid sick days
Women less likely to work in jobs with fringe benefits Service occupations Part-time employment

Wealth Escalator: Tax Code
Lower tax rates on certain forms of income Ex: long term capital gains
Tax deferral Ex: employer-sponsored retirement
contributions Tax deductions
Ex: mortgage interest deductions
Wealth Escalator: Structure of Government Benefits
Public Assistance Asset limits; “spend down assets”
Social Insurance Ex: Social Security
Economic Crisis
At all income levels women more likely to receive subprime loans Foreclosure
High and rising unemployment
Main Points
Wealth inequality is distinct from income inequality and much more severe
Racial wealth gap cannot close unless gender wealth gap closes
New strategies needed because excluded from existing strategies
Further Information:
www.mariko-chang.com
New book, Shortchanged: Why Women Have Less Wealth and What Can Be Done About It

Discussion
Policy Implications
Additional challenges due to economic crisis
Sharing information about successful asset-building programs for women
Others

Thank you


