
DI
SC
US
SI
ON
P
AP
ER
S
ER
IE
S
Forschungsinstitut zur Zukunft der ArbeitInstitute for the Study of Labor
Who Is Hit Hardest during a Financial Crisis?The Vulnerability of Young Men and Women to Unemployment in an Economic Downturn
IZA DP No. 4359
August 2009
Sher Verick

Who Is Hit Hardest during a Financial Crisis? The Vulnerability of Young Men and Women to Unemployment in an Economic Downturn
Sher Verick International Labour Organization (ILO)
and IZA
Discussion Paper No. 4359 August 2009
IZA
P.O. Box 7240 53072 Bonn
Germany
Phone: +49-228-3894-0 Fax: +49-228-3894-180
E-mail: [email protected]
Any opinions expressed here are those of the author(s) and not those of IZA. Research published in this series may include views on policy, but the institute itself takes no institutional policy positions. The Institute for the Study of Labor (IZA) in Bonn is a local and virtual international research center and a place of communication between science, politics and business. IZA is an independent nonprofit organization supported by Deutsche Post Foundation. The center is associated with the University of Bonn and offers a stimulating research environment through its international network, workshops and conferences, data service, project support, research visits and doctoral program. IZA engages in (i) original and internationally competitive research in all fields of labor economics, (ii) development of policy concepts, and (iii) dissemination of research results and concepts to the interested public. IZA Discussion Papers often represent preliminary work and are circulated to encourage discussion. Citation of such a paper should account for its provisional character. A revised version may be available directly from the author.

IZA Discussion Paper No. 4359 August 2009
ABSTRACT
Who Is Hit Hardest during a Financial Crisis? The Vulnerability of Young Men and Women to
Unemployment in an Economic Downturn*
The current financial and economic crisis has resulted in the worst global recession since World War II. The subsequent destruction of jobs and increased duration of joblessness will ensure that unemployment across the world will continue to rise and stay stubbornly high for some time to come, well after the economy has begun to recover. Beyond this generalization, such downturns have more adverse implications for vulnerable segments of the population such as youth. As presented in this paper, data for both the current and previous financial crises reveals that young people are indeed hit hardest as reflected by rising unemployment rates, which persist long after the economy is growing again. In the wake of the present downturn, young men have been particularly affected, which has been driven by a range of factors including the high proportion of young men in heavily impacted sectors such as construction. In response to this situation, policymakers should utilize targeted crisis interventions that aim to keep youth employed where possible, while also assisting new entrants and those who have lost jobs find employment (or at a minimum stay attached to the labour force), particularly as the economy recovers. JEL Classification: G01, J21, J64, J68 Keywords: unemployment, youth unemployment, financial crisis Corresponding author: Sher Verick Employment Analysis and Research Unit (EMP/ANALYSIS) International Labour Organization (ILO) 4 route des Morillons CH-1211 Genève 22 Switzerland E-mail: [email protected]
* I gratefully acknowledge comments and suggestions from Hielke Buddelmeyer, Sandrine Cazes, Iyanatul Islam, Markus Pilgrim and Catherine Saget. The views in this paper are those of the author and do not necessarily represent those of the International Labour Organization (ILO).

3
1. Introduction
The current financial and economic crisis has quickly spread from the housing and credit markets in the
United States resulting in the worst global recession since World War II. As a consequence of the
downturn, millions of workers have been laid off, while for those lucky enough to hold on to their jobs,
many have experienced cuts in hours worked, wages and others benefits as enterprises seek to reduce
labour costs in order to remain afloat. Although there is some evidence that the global economy has
reached a trough, history shows that synchronized and global crises, like the current one, result in
recessions that are more severe and longer in duration (IMF 2009). The ongoing destruction of jobs and
increased duration of joblessness will ensure that unemployment rates across the world will continue to
rise and stay stubbornly high for some time to come, well after the economy has begun to recover.
This is naturally a generalization of the impact of the present crisis on the labour market, which has
varied across (and within) countries depending on the structure of the economy, institutions in place
and how policymakers have responded. In particular, this downturn has had different implications for
various segments of the population as defined by such characteristics as gender and age. These traits
render individuals more vulnerable to a recession because of barriers they face in the labour market, in
addition to having a job in a sector that is more affected by changes in macroeconomic conditions.
Youth around the world are especially vulnerable to marginalization in the labour market because they
lack skills, work experience, job search abilities and the financial resources to find employment (United
Nations 2003, ILO 2006). As a consequence, young people are more likely to be unemployed or
employed on more precarious contracts. This is the case even during good economic times. In the midst
of a severe recession, youth find it increasingly difficult to both acquire a job as a new entrant in the
labour market, particularly as a consequence of hiring freezes, and remain employed since they are
more likely to be laid off than workers with more seniority. Overall, youth unemployment rates are far
more sensitive to the business cycle than witnessed for the adult population (OECD 2008).
This is precisely what is being witnessed during the current crisis. Indeed, since the end of 2007, an
additional 2.1 million young men and 1 million young women have become unemployed in a large
sample of countries considered in this paper consisting of most European countries, Australia, Canada
and the United States, which together represent almost 60 per cent of the global economy. Over this
period, the unemployment rate in the European Union member countries increased by 6.1 and 3.5

4
percentage points for young men and women, respectively, while it rose by a lower margin for prime-
age men (2.1 percentage points). In the United States, unemployment rates have surged by a greater
amount, especially for young men.
Governments are rightly concerned about these rising levels of youth unemployment because of not
only the direct economic costs, but also due to the social impact of joblessness as manifested by
increased crime, mental health problems, violence, drug taking and social exclusion.1 Moreover, spells of
unemployment, particularly long-term durations, can lead to scarring effects in terms of a higher
likelihood of being unemployed later in life and a wage penalty (Bell and Blanchflower 2009).
To investigate this phenomenon further, this paper analyses the impact of both previous and current
financial crises and the subsequent economic contractions on the unemployment rates of young men
and women. Though other labour market outcomes are important such as changes in real wages and
hours worked, the lack of disaggregated data prevents a detailed comparison of these dimensions for
specific demographic groups.2 The focus of the paper is on the impact of crises in OECD countries due to
the lack of relevant disaggregated data for developing economies, especially low-income countries.
The remainder of this paper is structured as follows: section 2 reviews the trends in unemployment
rates of young men and women before and after major financial crises in Spain, Norway, Finland,
Sweden, and Japan, which have been named the “Big 5 Crises” by Reinhart and Rogoff (2008b).
Following a financial meltdown, these countries all experienced a major decline or slowdown in
economic output over a longer period than witnessed in other recessions. In addition, the crises in
Mexico and Turkey in the 1990s are also analysed to provide insights into the experiences of other
regions. To link the discussion to the present global downturn, section 3 reviews developments in the
unemployment rates for young men and women since the start of the crisis in a majority of European
countries along with Australia, Canada and the United States. In section 4, a discussion on the drivers of
these unemployment trends is presented before turning to concluding remarks in section 5.
1 These direct economic costs include financing unemployment benefits, retraining schemes and other active
labour market policies, and the loss in potential output resulting from lower employment rates.
For a discussion on the costs of unemployment, see United Nations (2003) and Bell and Blanchflower (2009). 2 For example, findings presented in Fallon and Lucas (2002) indicate that there were considerable falls in real
wages in the crises of the 1990s in East Asia and Mexico. At the same time, there were smaller movements in
employment rates, though this disguised churning in the labour market.

5
2. Vulnerability of youth to unemployment during previous economic crises
In this paper, the unemployment rates for young men and women aged 15-24 are compared to the
trends for men aged 25-54 (prime-age men), who serve as a reference group since they typically
experience the fewest barriers in a given labour market. Youth unemployment rates are often reported
as a ratio to the adult rate to indicate the degree of labour market marginalization experienced by young
people. However, this ratio can in fact decrease during a crisis period. For example, in Finland, the ratio
of young male to prime-age male unemployment rates decreased from 3.75 prior to the financial crisis
of 1990 to 1.96 during the midst of that downturn in 1993. Looking at the ratios would suggest that the
situation of young men vis-à-vis prime-age males has improved, which was not the case. Rather, the
unemployment rate of Finish prime-age men was increasing from a very low initial condition. For this
reason, the focus in this paper is on the absolute increase in unemployment rates, which is more
indicative of the situation as illustrated below.
Another issue to be aware of is that unemployment rates do not only change because of entry to or exit
from unemployment, but also due to changes in labour force participation. If segments of the
population exit the labour force altogether, this will also affect the unemployment rate. For example, if
laid-off workers chose not to search for a job because of enrolling in a course, deciding to have a family
or discouragement, this will contribute to a reduction in the size of the labour force, and hence, a fall in
the denominator of the unemployment rate, leading to an increase in the figure.3 This is particularly
relevant for women.
2.1 The “Big 5 crises” – Spain, Norway, Finland, Sweden and Japan
Financial crises have occurred on a regular basis, with major episodes such as the Great Depression, the
crises of the Nordic countries in the 1990s and the East Asian experience of 1997. According to the IMF
(2009), out of their sample of 122 recessions in advanced economies since 1960, 15 were associated
with financial crises, including the “Big 5 Crises” of Spain (1977), Norway (1987), Finland (1991), Sweden
3 The unemployment rate is defined as the number of unemployed divided by the labour force (unemployed plus
employed). According to the ILO definition, the unemployed comprise all persons who during a reference period
are without work, currently available for work and are actively seeking employment.

6
(1991), and Japan (1992).4 These financial or banking crises were typically precipitated by the
liberalization of financial markets and poor banking regulation, leading to growth in credit and creation
of asset bubbles. An external shock subsequently pushed these economies over the precipice, resulting
in capital outflows and currency devaluations, and subsequently, to bank closures, freezing of credit
channels, and ultimately, deep recessions (at times depression).
As noted by the IMF (2009), recessions resulting from financial crises such as these are more severe and
longer in duration. The slower pace of recovery is due to the freezing of credit channels and the need for
both firms and households to deleverage their debts, which is also evident in the wake of the current
crisis. All of these downturns had major implications for the labour market in terms of rising
unemployment (in some countries, long-term unemployment) and changes to sectoral composition of
employment. The series for Finland, Japan, Norway, Spain and Sweden presented in Figure 1 are
continued to the latest available data point to illustrate the persistence in unemployment rates even
after economic growth has recovered (see also Table 1).5 To illustrate the timing of the crisis, the gross
domestic product per capita is also plotted in Figure 1, which illustrates the periods of recession and
economic recovery over the business cycle.
Turning first to the Nordic countries, Finland, Norway and Sweden all experienced a period of financial
liberalization followed by rapid growth in lending that collapsed after a series of external shocks
(Honkapohja and Koskela 1999). Bad loans bankrupted a number of banks. Of these countries, Finland
suffered the most, experiencing a severe depression, which resulted in a cumulative loss of gross
domestic product (GDP) of 14 per cent from 1990 to 1993 with the economy only recovering, albeit
quite strongly, in 1994. During this period, the Finish youth unemployment rate grew at a rapid rate,
reaching 31.5 and 30.4 per cent in 1994 for young men and young women, respectively (Figure 1).
4 The year the crisis began is noted in parentheses.
5 Breaks in the unemployment rate data series prevent using all data points following the crisis in Norway, Spain
and Sweden. In Finland and Japan, the series continues to 2008 (2007 for GDP per capita). In Finland’s case, there
is a break in the data prior to the downturn, leaving only two data points to use as pre-crisis observations.

7
Figure 1: Trends in unemployment rates during and after financial crises – Finland, Japan, Norway,
Spain and Finland

8

9
Source: OECD Labour Force Statistics database (unemployment rate); World Development Indicators database
(gross domestic product per capita is in constant US$ (at 2000 level)).
Notes: The vertical line denotes the starting year of the financial crisis. Breaks in the unemployment rate data
prevent using all data points following the crises in Norway, Spain and Sweden. In Finland and Japan, the series
continues to 2008 for the unemployment series (2007 for GDP per capita).
Table 1: Trough-to-peak increases in unemployment rates following a crisis
Country Unemployment rates (%)
Young men Young women Prime-age men
Trough Peak Trough Peak Trough Peak
Finland 9.4 31.5 8.3 30.7 2.5 15.5
Japan 4.6 11.6 4.1 8.7 1.4 4.7
Norway 3.9 15.0 6.2 13.2 1.0 5.7
Spain 8.5 39.5 10.6 50.6 3.5 15.4
Sweden 3.9 26.1 3.8 19.9 1.1 9.3
Source: OECD Labour Force Statistics database.
In comparison, the unemployment rate for the prime-age male population in Finland increased from 2.5
per cent in 1990 to almost 16 per cent in 1993. The high rates of youth unemployment in Finland
continued for many years even after the economy had fully recovered. In fact, the unemployment rates

10
for young men and women were still 12.6 and 16.7 percentage points higher in 1997 than the pre-crisis
figures, despite GDP per capita having recovered to its previous level. In the same year, the adult rate
was 7.9 percentage points higher than the pre-crisis figure. Youth unemployment only started
decreasing many years later, though even by 2008, it still hadn’t reached the pre-crisis rate.
Akin to the situation in Finland, the Swedish economy fell into a long, drawn-out recession with GDP per
capita sinking by an accumulative 6 per cent between 1990 and 1993. The unemployment rate for young
men rose to over 26 per cent in 1993, 21.3 percentage points higher than the pre-crisis level (1990),
while for young women, the rate reached almost 20 per cent in 1994, an increase of 15.4 percentage
points over the same period. In comparison, the unemployment rate for prime-age men rose by 8
percentage points to 9.3 per cent in 1993. In 1996, the year when the GDP per capita in Sweden
surpassed the pre-crisis level, unemployment rates for young men and women still remained 15.8 and
13.9 percentage points above their 1990 level.
The Nordic banking crisis started in Norway earlier than in Finland and Sweden, which was triggered by
the drop in oil prices in 1986.6 Economic growth ground to a halt with GDP per capita falling in 1988
before starting to pick up again quite rapidly in the following year. Overall, the fall in GDP was far
smaller than in Finland and Sweden. Nonetheless, youth unemployment increased dramatically from
1987, with the unemployment rate rising to 15 per cent for young men by 1992 and to 13.2 per cent for
young women by 1993 (an increase of 11.1 and 7 percentage points, respectively). At the same time, the
rate for prime-age males reached almost 6 per cent. As witnessed in Finland and Sweden, youth
unemployment in Norway persisted for many years after the economic recovery had begun and only fell
after a long episode of strong output growth.
The 1990s were a “lost decade” for Japan, a period of economic stagnation that proceeded the bursting
of the housing and asset bubble of the 1980s (Nakaso 2001). The economy was shaken by bank failures
in the 1990s, which resulted from non-performing loans and high levels of debt. The East Asian financial
crisis further exacerbated this situation for the Japanese banking sector, leading to the largest failure,
the Long Term Credit Bank of Japan, which spectacularly collapsed in 1998. From 1992 to 2000,
economic growth remained low or negative, without actually going into a dramatic fall as witnessed in
the Nordic countries. The largest fall in GDP per capita occurred in 1998, when it contracted by 2.3 per
6 See www.norges-bank.no/templates/article____13822.aspx

11
cent. Over the whole episode, unemployment rates continued to rise, particularly for youth. The young
male unemployment rate in Japan rose the fastest, most noticeably after the recessionary decline in
1998, peaking much later at 11.6 per cent in 2003, an increase of seven percentage points over the 1992
figure. At the same time, the rate for young women grew by 4.6 percentages points. In contrast, the
unemployment rate for prime age males increased to over 4 per cent, which was nonetheless a
historically high figure for this country.
In Spain, a banking crisis ran from 1977 to 1985, which affected almost half of all banks, accounting for
20 per cent of deposits (Haugh et al. 2009). Similar to Japan, this lead to a lengthy slowdown in
economic growth rather than a precipitous contraction as witnessed in Finland and Sweden. In this
respect, GDP per capita remained stagnant or declined marginally over a number years before taking off
again in 1984. During this period, unemployment rates nonetheless rose drastically in Spain, particularly
for youth. In contrast to the countries reviewed above, young women were clearly the most impacted
by the crisis with their unemployment rate escalating from 10.6 per cent in 1976 to a staggering 50.6 per
cent in 1985. Concurrently, the unemployment rate for young men increased from 8.6 per cent to 39.3
per cent over the same period. This trend was also affected by a decreasing labour force participation
rate for both young men and women.7 Though the level of unemployment in the prime age male
population also surged, the increase was far lower (11.9 percentage points from 1976 to 1985).
Beyond the increase in the unemployment incidence, it is also informative to consider the time it takes
for unemployment rates to peak following such financial crises. As underscored by IMF (2009), Reinhart
and Rogoff (2009) and others, the increase in unemployment rates continues well after the economic
trough has been reached. In Reinhart and Rogoff’s study on banking crises, they find that on average
unemployment rates peak 4.8 years from the previous trough in unemployment levels before the crisis
started (Reinhart and Rogoff 2009). In comparison, the cycle from peak to trough in GDP per capita is 1.9
years.
Turning to the five countries analysed in this section, a similar pattern is evident. As presented in Table
2, the duration of peak-to-trough change in GDP per capita varies from zero in Spain to four years in
Finland. Except in the Finish case, the duration of trough-to-peak changes in the unemployment rates
exceeded the duration for economic contraction. In Sweden and Finland, youth unemployment rates for
7 See OECD Labour Force Survey database.

12
young people peaked at historically high levels and persisted up to 5 years after the economy had
recovered. In Japan, Norway and Spain, where the period of economic downturn was relatively short,
unemployment rates nonetheless surged over a long period, up to 11 years in the case of Japan and
Spain. Interestingly, the duration of trough-to-peak changes in unemployment rates is not
unambiguously longer for young men and women in comparison to prime-age men. In Norway and
Spain, unemployment rates of youth are in fact adjusting more rapidly.
Table 2: Duration of economic contraction and increase in unemployment rates following a crisis
Country Duration of peak-
to-trough change
in GDP per capita
(years)
Duration of trough-to-peak
change in unemployment rates (years)
Young men Young women Prime-age men
Finland 4 4 4 3
Japan 1a 11 9 11
Norway 1 6 7 7
Spain 0 9 11 11
Sweden 3 4 5 4 Source: Author’s calculations using data cited in Figure 1.
Notes: Japan experienced two peaks-to-trough changes in GDP per capita (1997 and 2000). In both cases, the
duration was one year.
2.2 The Mexican Tequila crisis and the banking crises of Turkey in the 1990s
This section reviews changes in unemployment rates in the same way as above for Mexico and Turkey,
which experienced major financial and economic crises during the 1990s. These examples provide an
illustration of how such downturns impact youth unemployment rates in upper-middle income countries
in other regions.
The lead up to the Mexican Peso crisis of 1994-1995 started with a familiar scenario of surging inflows of
short-term capital, which took off after capital account deregulation, and government profligacy. This
contributed to real exchange rate appreciation and a worsening current account deficit, which reached 7
to 8 per cent of GDP prior to the onset of the crisis (Edwards 1997). At the end of 1994, the Peso could
no longer be supported and was subsequently devalued and then floated, resulting in a drastic loss of
confidence in the country’s economy and a massive outflow of foreign capital. As a consequence of

13
these series of events, the economy contracted by a substantial amount in 1995 (GDP per capital fell by
7.9 per cent), only to rebound quite quickly, returning to relatively strong growth in 1996.
As a consequence of this crisis, the unemployment rate for young women surged from 6.4 per cent in
1993 to 15.3 per cent in 1995, while the rate for young men increased from 4.9 per cent to 9.2 per cent
over the same period (Figure 2). Prime-age men experienced a much smaller rise in unemployment. In
contrast to the countries above, unemployment levels in Mexico peaked in the year the economy
bottomed out. However, this rate for young women was till 4.1 percentage points higher in 1997, the
year GDP had recovered the losses of the previous two years.
The Mexican economy grew strongly over the following years, which helped unemployment fall to pre-
crisis or even lower levels by 1999. After 2000, Mexico went into another period of stagnation that
lasted until 2003, after which growth picked up again. During this latter episode, the unemployment rate
of youth, particularly young women, increased again.
It should also be noted that the impact on the labour market in such countries is not only reflected in
rising unemployment rates but also in the deterioration of wages and working conditions.
Disaggregated data on these dimensions of the labour market are typically not available. Moreover,
many young people in countries like Mexico cannot afford to remain unemployed and thus seek
employment in the informal economy, which are also not reflected in available statistics.
In Turkey, the economic recession of 1994 was followed by major downturns in 1999 and 2001. In 2001,
GDP per capita fell by 7.9 per cent (Figure 2). This volatility in economic growth is reflected in the large
movements in unemployment rates for young women, which converged somewhat with the
unemployment rates for young men, while adult unemployment levels were more stabile. The economic
downturn following the 2000 crisis was more severe in terms of its impact on the labour market. Overall,
Turkish youth were the hardest hit with the unemployment rates for young men and women increasing
from 2000 to 2003 by 7.4 and 5.9 percentage points, respectively, which is when the GDP per capita
recovered to its pre-crisis level. From 2002 to 2007, GDP per capita grew by a staggering 31.5 per cent.
Despite this record performance, unemployment rates for Turkish youth remained stubbornly high.

14
Figure 2: The impact of crisis episodes on unemployment rates in Mexico and Turkey in the 1990s

15
Source: OECD Labour Force Statistics database (unemployment rate); World Development Indicators database
(gross domestic product per capita in constant US$ (at 2000 level)).
Notes: The vertical line denotes the starting year of the financial crisis.
2.3 Lessons from previous financial crises
The above analysis of the “Big 5” financial crises of Finland, Japan, Norway, Spain and Sweden, and the
episodes in Mexico and Turkey, reveals a number of important stylized facts in terms of the labour
market impact of economic downturns associated with financial shocks.
1) Firstly, as evident in all seven cases, youth are more vulnerable to rising unemployment during
and after a crisis, which is reflected by larger percentage point increases in unemployment rates
for this age group than prime-age males.
2) The increased gap between youth and adult unemployment rates remains even after the
economy has begun to recover. However, the peak in youth unemployment rates tend to be
reached earlier or at the same time as the prime-age male population indicating the changes for
young people are often more rapid.
3) Both young men and women are negatively impacted by such crises.
In the next section, the impact of the present crisis is analysed to identify whether current trends in
unemployment rates are consistent with previous downturns.
3. The impact of the current global financial and economic crisis on youth unemployment
3.1 Rising unemployment in high income countries and emerging economies
As noted above, financial crises that are global and synchronized in nature are on average more severe
not only in terms of longer periods of contraction, but also increased incidence and duration of
unemployment. The present global economic downturn is the deepest the world has witnessed since
World War II. The International Monetary Fund (IMF) predicts that the global economy will shrink by 1.3
per cent in 2009 before growing insipidly in 2010 (IMF 2009). The latest forecast from the World Bank

16
suggests a far larger contraction of 3 per cent in 2009.8 Therefore, it is expected that countries around
the world will experience rising levels of unemployment that will persist for many years to come even
after the economy has recovered and returned to a path of stronger growth. In the Global Employment
Trends Update, May 2009, the ILO revised upwards its unemployment projections to levels ranging from
210 million to 239 million unemployed worldwide in 2009, corresponding to global unemployment rates
of 6.5 and 7.4 per cent respectively. The Trends report projects an increase of between 39 and 59
million unemployed people since 2007 as the most likely range.
To investigate the impact of the current crisis on labour markets, this section also focuses on recent
changes to unemployment rates for young men and women vis-à-vis the prime-age male population,
which again serves as a reference group. Figure 3 displays the change in the monthly unemployment
rate (seasonally adjusted) of young men and young women since December 2007, which has been
identified by the National Bureau of Economic Research as the onset of the recession in the United
States, to the latest available monthly figure (up to June 2009 in most countries).9 The change in
unemployment rates is calculated as the difference between the minimum rate reached after December
2007 and the latest monthly figure. By using a country specific minimum (trough in the unemployment
rate), the measure used in this paper accounts for variation in the business cycle and a differential
impact of the crisis on economies.
The sample of countries presented in Figure 3 includes 24 European Union member States (Austria,
Belgium, Bulgaria, Croatia, Czech Republic, Denmark, Estonia, Finland, France, Germany, Greece,
Hungary, Ireland, Italy, Latvia, Lithuania, Luxembourg, Netherlands, Poland, Portugal, Romania, Slovak
Republic, Slovenia, Spain, Sweden, and United Kingdom) along with Australia, Canada, Norway, Turkey
and the United States.10 Data for the percentage point change, the initial unemployment rate of young
men (trough) and date for trough are presented in Table 3 in the Appendix.
Confirming the trends witnesses in previous crises, the main message of Figure 3 is that unemployment
rates have increased in all countries. As before, the increases for youth have outstripped the rise in
8 See World Bank press release, http://go.worldbank.org/SCK72HFI00.
9 The Business Cycle Dating Committee of the National Bureau of Economic Research determined that a peak in
economic activity occurred in the U.S. economy in December 2007. The peak marks the end of the expansion that
began in November 2001 and the beginning of a recession. See www.nber.org/cycles/dec2008.html. 10
Due to the lack of seasonally-adjusted data, Japan has been excluded from the sample.

17
unemployment of prime-age men. Overall, since December 2007, the unemployment rate in the
European Union member countries increased by 6.1 and 3.5 percentage points for young men and
women, respectively, while it rose by a lower margin for prime-age men (2.1 percentage points).
Altogether, an additional 2.1 million young men and 1 million young women have become unemployed
in the European Union, Australia, Canada, Norway, Turkey and the United States since the start of the
crisis in December 2007. In a number of countries, the number of unemployed youth as more than
doubled within an 18-month period. In terms of the timing of these trends, in almost half of the
countries in the sample, the unemployment rates for youth reached a trough before the end of the 1st
quarter in 2008 before starting on an upward trend (see Table 3 in the Appendix).
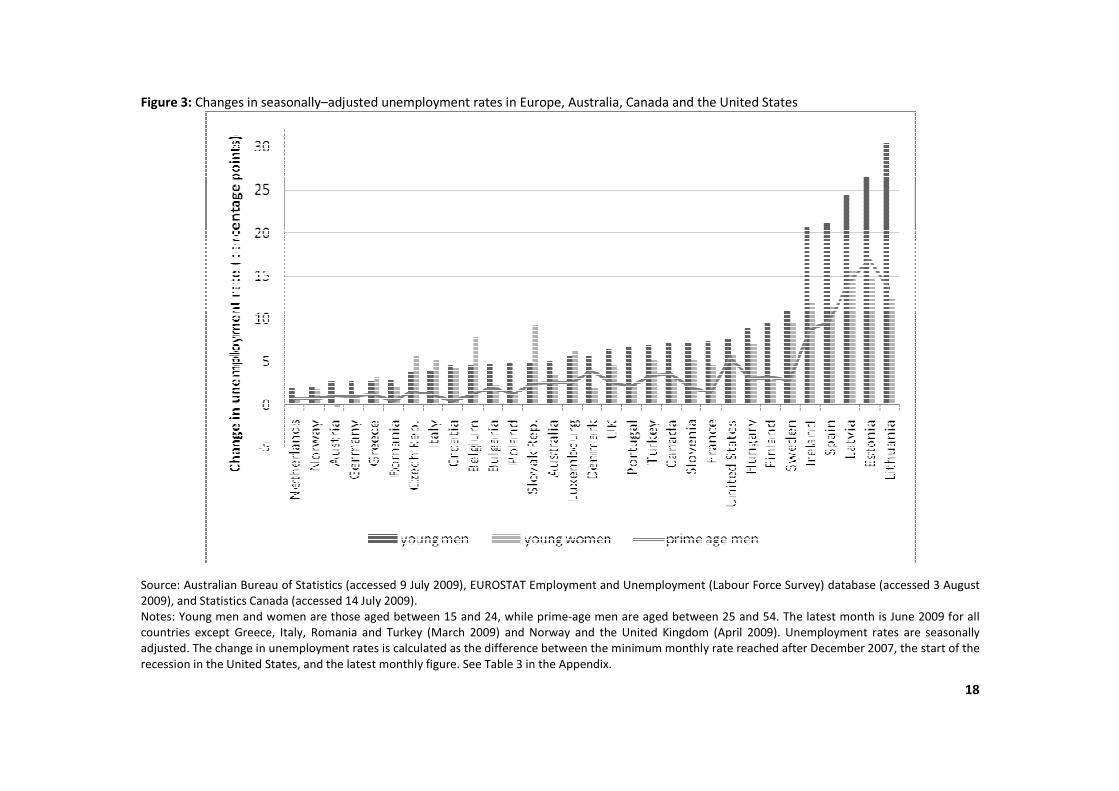
As expected, these averages mask considerable heterogeneity across countries in terms of the relative
changes in unemployment rates. There is in fact great variation in how unemployment has responded to
the economic downturn: the change in the unemployment rate for young men ranges from an increase
of 1.9 percentage points in the Netherlands to a mammoth increase of 30.5 percentage points in
Lithuania. Based on the trends presented in Figure 3, a number of general groupings can nonetheless be
made:
1. In general, youth have been hit much harder than prime-age men in terms of increasing
unemployment rates. Young men have experienced larger increases in unemployment rates
than young women, though this does not detract from the fact that the latter often have higher
initial rates of unemployment. Unemployment rates have been increasing faster since mid 2008.
2. In the five countries most affected by the crisis, Lithuania, Estonia, Latvia, Spain and Ireland,
unemployment rates have surged by at times unprecedented levels. In these countries, the rate
for young men has increased by a minimum of 20 percentage points in less than 18 months,
reflecting rapid economic contraction. In Ireland, Latvia and Spain, the increase in
unemployment rates for young women exceeded that of prime-age men.
3. A large number of countries are in the middle range, including the Luxembourg, Denmark,
United Kingdom, Portugal, Turkey, Canada, Slovenia, France, United States, Hungary, Finland
and Sweden, which have all witnessed increases in the unemployment rate of young men of
more than 5 percentage points.
18
Figure 3: Changes in seasonally–adjusted unemployment rates in Europe, Australia, Canada and the United States
Source: Australian Bureau of Statistics (accessed 9 July 2009), EUROSTAT Employment and Unemployment (Labour Force Survey) database (accessed 3 August
2009), and Statistics Canada (accessed 14 July 2009).
Notes: Young men and women are those aged between 15 and 24, while prime-age men are aged between 25 and 54. The latest month is June 2009 for all
countries except Greece, Italy, Romania and Turkey (March 2009) and Norway and the United Kingdom (April 2009). Unemployment rates are seasonally
adjusted. The change in unemployment rates is calculated as the difference between the minimum monthly rate reached after December 2007, the start of the
recession in the United States, and the latest monthly figure. See Table 3 in the Appendix.

19
4. In the Netherlands, Norway, Austria, Germany, Greece and Romania, the change in
unemployment rates have been relatively “mild”. In these six countries, the unemployment rate
amongst young males increased by three percentage points or less since December 2007.
5. In six countries, Greece, Czech Republic, Italy, Belgium, Slovak Republic and Luxembourg, young
women are experiencing a greater increase in unemployment than young men, which contrasts
the rest of the sample (Norway and Croatia have similar increases for young men and women).
3.2 United States, Germany and United Kingdom
In addition to these overall characteristics of the sample, it is informative to reflect on the situation of
the largest economies in this group, namely, the United States, Germany and United Kingdom. The IMF
estimates that these three countries will contract in 2009 by 2.8, 4.1 and 5.6 per cent, respectively. The
trends in the unemployment rates of youth and prime-age males in these three countries are mapped
out in Figure 4, which again illustrate that unemployment rates have been increasing faster for young
men.
The current crisis began in the United States and this is evident in the unemployment data. Young men
have been losing jobs the fastest, with the unemployment rate for young males increasing rapidly from
12.1 per cent in April 2008 to 19.8 per cent in June 2009 (an increase of 7.7 percentage points). This has
been driven by the collapse in such sectors as construction, manufacturing and financial services, where
young men are heavily represented, an issue further discussed in section 4. The unemployment rate for
young women in the United States now stands at 15.7 per cent, an increase of 5.9 percentage points
since April 2008. As evident in Figure 4, the rate for young women has been increasing strongly over
recent months. Prime-age men have also been joining the unemployment queues, with the
unemployment rate for this group reaching 9.2 per cent in June 2009, representing a rise of 5.5
percentage points of the level reached at the end of 2007. In fact, until recently, the increase in
unemployment rates of this group was rising faster than for young women.
Similar to the United States, unemployment rates in the United Kingdom have risen the fastest for
young men followed by young women, particularly since April 2008. The rates have increased over this
period from 15.4 to 21.8 per cent for young males and from 11.9 to 16.2 per cent for young women. The

20
rates for the prime-age male population have also risen, but to a lesser extent (from 3.6 per cent in
December 2007 to 6.2 per cent).
In comparison to the United Kingdom and the United States, unemployment started to increase in
Germany only in August 2008. Moreover, the overall rise in unemployment rates in Germany has been
so far modest despite the collapse in global trade flows and the severe contraction of the Germany
economy in 2009 (estimated to be -5.6%). Nonetheless, the largest increase in the unemployment rate
has been among young males aged 15-24, which rose from 10.3 per cent in August 2008 to 13.0 per cent
in June 2009, an increase of 2.7 percentage points, which is far lower than the other countries in the
sample (Figure 3). Both young women and prime-age males experienced a smaller increase in
unemployment rates of 0.9 percentage points.
The institutional arrangement in Germany and attempts by the government to keep workers in their
jobs through such policies as the work sharing scheme “Kurzarbeit” have played an important role in
preventing unemployment. Official figures show that as of March 2009, 1.26 million workers were
covered by this scheme, up from only 155,000 a year earlier (Bundesagentur für Arbeit 2009). This
intervention along with other measures such as the use of transfer companies for laid workers has kept
unemployment figures stable in Germany. Nonetheless, it is expected that in the coming year, there will
be a surge in the jobless numbers in Germany, unless the world economy, and hence demand for
German exports, recovers strongly in 2009/2010. Unfortunately, this appears to be an unlikely scenario
given the global reach of the crisis.
Together with the evidence from previous crises as discussed in section 2, these trends confirm that it is
youth that are the most vulnerable to increasing unemployment rates. In terms of the current crisis, it is
young men who are suffering more in the labour market. At the same time, it should also be stressed
that the impact of this present global crisis varies remarkably across countries with a few being severely
affected such as Lithuania, Latvia, Estonia, Spain and Ireland, while others including Germany and
Netherlands have yet to display adverse outcomes in their respective labour markets. In the next
section, an attempt is made to understand this variation in the labour market impact of the present
global financial and economic crisis.

21
Figure 4: Unemployment trends in Germany, United Kingdom and the United States

22
Source: EUROSTAT Employment and Unemployment (Labour Force Survey) database.
Notes: Young men and women are those aged between 15 and 24, while prime age men are aged between 25 and
54. Monthly data is seasonally adjusted.
4. Explaining the impact of the current crisis on youth unemployment rates
The considerable variation in the impact of the global crisis on youth unemployment requires further
investigation, particularly as a deeper understanding of this situation has important policy implications
for governments around the world. In this section, a number of possible explanations are explored,
namely the relationship between changes in unemployment rates and the level of economic
contraction, sectoral composition of employment and institutional setting in terms of employment
protection and utilisation of less protected contracts. The focus in this section is on explanations for
changes to unemployment rates of young men given that this is the group that has experienced the
largest increases since the start of the downturn.
Firstly, given that labour demand is dependent on aggregate demand, a collapse in the latter will have
direct implications for the former. The precise magnitude of this impact will depend on unemployment

23
elasticities, which vary across countries.11 The latest forecasts for growth reveal that there is a large
variation in the expected contraction of economies. GDP per capita in the Baltic States (Estonia, Latvia
and Lithuania) is estimated to decline by more than 10 per cent in 2009, with Ireland following closely
with a fall of 8 per cent. As already mentioned, GDP per capita in Germany, the United Kingdom and the
United States is expected to fall in 2009 by 5.6, 4.1 and 2.8 per cent, respectively. Looking at the
correlation between economic growth and unemployment rates for the sample, it is evident that
unemployment rates have unsurprisingly increased more in countries suffering a larger collapse in
economic growth, such as the ones mentioned above (Figure 5). The implied unemployment elasticity is
high (close to 1). However, once the five main affected countries (the Baltic States, Ireland and Spain)
are dropped from the sample, there is no evidence of the expected negative relationship between
change in growth and unemployment rates (the fitted line in fact becomes slightly positive).
In light of failing to find a robust relationship between changes in economic growth and unemployment
rates, it is important to delve deeper behind the impact of the collapse in aggregate demand on
unemployment rates. As a next step, this section considers the relationship between the sectoral
composition of employment and subsequent changes to youth unemployment rates. In line with
previous crises, specific sectors are contracting more than others due to their exposure to financial
dimension of the downturn (reversal in flows of capital and freezing of credit channels) and the trade
impact (drop in exports). The construction sector in particular benefited greatly from the boom years as
easy credit helped fuel a housing bubble, while the strong demand for exports boosted the
manufacturing sector in many industrialized countries. Since the start of the crisis, the collapse of the
housing bubble has resulted in a massive contraction of the construction sector. The ensuing global
recession and fall in trade has severely impacted the manufacturing sector. This situation implies that
the unemployment rate of young men should have increased more in countries where these sectors
were major employers of this group.
11
The relationship between economic growth and unemployment rates has also been described by Okun (1962) in
what became known as Okun’s Law. Estimates of Okun’s statistical relationship for the United States indicate that
there is approximately a 2 per cent decrease in output for every 1 per cent increase in unemployment. Recently,
there has been some discussion over whether this relationship remains valid for this crisis period.

24
Figure 5: The relationship between economic contraction and changes in unemployment rates for young
men
Source: EUROSTAT Employment and Unemployment (Labour Force Survey) database and International Monetary
Fund World Economic Outlook Database April 2009.
Notes: The change in unemployment rates is for young men aged 15-24 from the trough reached after December
2007 to latest month available (see notes for Figure 3 above). The change in growth rates is the difference
between GDP growth rates in 2007 and 2009, where the 2009 figure is an IMF estimate. The sample consists of AT,
AU, BE, BG, CA, CZ, DK, EE, FI, FR, DE, GR, HR, HU, IE, IT, LV, LT, LU, NL, NO, PL, PT, RO, SK, SL, ES, SE, TR, UK, US.
Evidence for this explanation is, however, mixed. As displayed in Figure 6, there is a strong, positive
relationship between the share of young men employed in the construction sector in 2007 (i.e. prior to
the crisis), and the subsequent increase in unemployment rates (sample excludes Australia, Canada and
the United States). The largest shares of young men employed in construction are in the five countries
most affected by the crisis (the Baltic States, Ireland and Spain). In these countries, the share of young
men employed in construction in 2007 ranges from 27.7 per cent in Lithuania to 33.7 per cent in Estonia.
Without these observations in the sample, the statistical relationship presented in Figure 6 weakens.
In comparison, the correlation between the increase in unemployment rates and the share of young
men in manufacturing is not as strong, even after the five main outliers are excluded from the sample as
displayed in Figure 7. Linking the sectoral composition to the trade impact, there is some evidence that
unemployment rates of young men have increased faster in countries where manufactures accounted
for a large proportion of merchandise exports, but this holds only once the five outliers have been
removed. ¨

25
Another potentially important factor is the share of youth in temporary employment, which by
definition are not as well protected as regular jobs. On average, 41 per cent of young men in the
European Union have jobs which are classified as temporary employment. Spain in particular is a
country where a large number of young people have been traditionally employed on temporary
contracts: in 2007, 63 per cent of young Spanish men were temporarily employed. In general,
unemployment is likely to have risen faster in countries where this share is higher since it is easier for
employers to lay off workers on such contracts. In this respect, the correlation between these two
variables are negative, but becomes slightly positive as expected once the outliers of the Baltic States,
Ireland and Spain are removed from the sample as illustrated in Figure 8.
Figure 6: The relationship between share of employment in construction and changes in unemployment
rates of young men since December 2007
Source: EUROSTAT Employment and Unemployment (Labour Force Survey) database.
Notes: Sample of countries includes: AT, BE, BG, CZ, DK, EE, FI, FR, DE, GR, HR, HU, IE, IT, LV, LT, LU, NL, NO, PL, PT,
RO, SK, SL, ES, SE, TR, UK. See Figure 3.

26
Figure 7: The relationship between share of employment in manufacturing and changes in
unemployment rates of young men since December 2007 (excluding Estonia, Ireland, Latvia, Lithuania
and Spain)
Source: EUROSTAT Employment and Unemployment (Labour Force Survey) database.
Notes: Sample of countries includes: AT, BE, BG, CZ, DK, FI, FR, DE, GR, HR, HU, IT, LU, NL, NO, PL, PT, RO, SK, SL, SE,
TR, UK. See Figure 3.
Figure 8: The relationship between share of young employed men in temporary employment and
changes in unemployment rates of young men since December 2007 (excluding Ireland, Latvia, Lithuania
and Spain)

27
Source: EUROSTAT Employment and Unemployment (Labour Force Survey) database.
Notes: Sample of countries includes: AT, BE, BG, CZ, DK, FI, FR, DE, GR, HR, HU, IT, LU, NL, NO, PL, PT, RO, SK, SL, ES,
SE, TR, UK. Temporary employees are expressed as a percentage of the total number of employees for young men
aged 15-24 (%) as of 2007.
Figure 9: The relationship between employment protection and changes in unemployment rates of
young men since December 2007
Source: EUROSTAT Employment and Unemployment (Labour Force Survey) database and OECD Indicators on
Employment Protection 2008.
Notes: Sample of countries includes: AU, AT, BE, BG, CA, CZ, DE, DK, FI, FR, GR, HR, HU, IT, LU, NL, NO, PL, PT, SK,
SE, TR, UK, US.
Continuing with labour market institutions, employment protection legislation (EPL) is often claimed be
a major factor behind high unemployment in certain European countries. In the context of the present
crisis, it is expected that countries with more stringent EPL would experience a smaller increase in the
unemployment rate of young men. The point here is not to find evidence that labour market institutions
such as EPL have a negative impact of adjustment. Rather, it is the opposite: it is precisely these
institutions that can potentially help countries avoid massive increases in unemployment such as
witnessed in the Baltic States, which are entail both economic and social costs.
Using the OECD indicators on employment protection for 2008, there indeed appears to be a negative
relationship between the change in young male unemployment rates and the overall employment
protection index (Figure 9). This negative correlation is stronger once the outliers of Estonia, Ireland, and

28
Spain are removed (data is lacking for Latvia and Lithuania), though it is still by no means large (R2=0.07).
Overall, it is difficult to derive a clear generalization as there are countries with rigid employment
protection that are experiencing smaller increases in unemployment such as Greece, Norway and
Germany. On the other hand there are countries with similar levels of protection that are nonetheless
going through a much more severe adjustment in the labour market such as Spain. There are similar
contrasts at the other of the employment protection spectrum. At the same time, there isn’t a clear
relationship between the gross unemployment benefit replacement rate and change in young male
unemployment rates, once the outliers of Ireland and Spain are dropped (Figure 10).
Figure 10: The relationship between gross unemployment benefits replacement rate and changes to
young male unemployment rates
Source: EUROSTAT Employment and Unemployment (Labour Force Survey) database and OECD Tax Benefit Model.
Notes: The OECD summary measure is defined as the average of the gross unemployment benefit replacement
rates for two earnings levels, three family situations and three durations of unemployment. See
www.oecd.org/els/social/workincentives. The sample consists of AT, AU, BE, CA, CZ, DK, FI, FR, DE, GR, HU, IT, NL,
NO, PL, PT, SK, SE, UK, US. The change in unemployment rates is for young men aged 15-24 from the trough
reached after December 2007 to latest month available (see notes for Figure 3 above).
Governments, as highlighted by the German case discussed above, are also implementing specific
policies to mitigate the impact of the crisis on the labour market. Once data becomes available, the

29
effectiveness of these policy responses could be further analysed in the context of keeping
unemployment lower than it would have been in the absence of such measures.
Prior to the start of the crisis, young male unemployment rates varied considerably in the sample of
countries used in this paper.12 Using country-specific troughs (i.e. the lowest rate at or reached after
December 2007), the rates ranges from 5.2 per cent in Netherlands to 20.8 per cent in Romania. As
illustrated in Figure 11, there is a positive correlation between the initial unemployment rate and the
subsequent change (excluding the five outliers of the Baltic States, Ireland and Spain). This implies that
young men have been more affected in countries which were already experiencing high levels of
unemployment. The initial level itself is the outcome of a range of factors, including structural causes of
youth unemployment (for e.g., lack of skills/skills mismatch and poor education levels of young men).
Figure 11: Initial conditions and changes to unemployment rates of young men during the crisis
Source: EUROSTAT Employment and Unemployment (Labour Force Survey) database.
Notes: The change in unemployment rates is for young men aged 15-24 from the trough reached after December
2007 to latest month available (see notes for Figure 3 above).
12
It is also worth repeating that despite the larger increases in unemployment rates of young men since the start
of the crisis, young women often experience higher permanent rates of unemployment.
30
Another way to understand changes in unemployment rates of young men is to group countries, where
the grouping reflects some commonalities in terms of institutions and labour market characteristics. This
is done for the sample of 31 countries considered in this section using a grouping commonly employed
in other studies: Anglo countries (Australia, Canada, Ireland, United Kingdom, United States);
Continental countries (Austria, Belgium, Germany, France, Luxembourg); Scandinavian countries
(Denmark, Finland, Norway, Sweden, along with the Netherlands); Mediterranean countries (Spain,
Greece, Italy, Portugal); Baltic States (Estonia, Latvia, Lithuania); and Eastern European countries
(Bulgaria, Croatia, Czech Republic, Hungary, Poland, Romania, Slovenia, Slovakia, together with Turkey).
The country-specific unemployment rates are averaged within groups using the size of the labour force
of young men aged 15-24 (as of 2007) as weights.
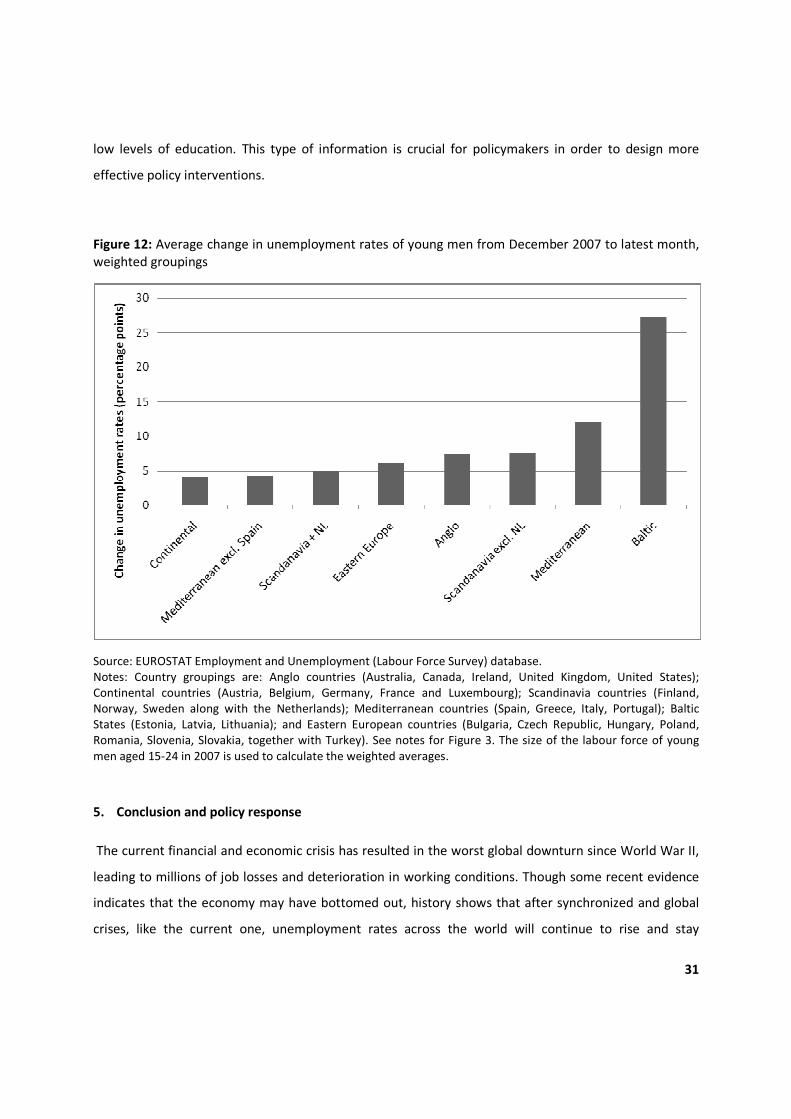
As displayed in Figure 12, there is a high degree of variation across the six groups, ranging from an
average increase in the unemployment rate for young men of 4.1 percentage points for the continental
group (Austria, Belgium, Germany, France and Luxembourg) to 27.2 percentage points for the Baltic
States (Estonia, Latvia and Lithuania). Overall, there appears to be an expected relationship: the change
in unemployment rates is greater in countries with more flexible labour markets, except for the
Mediterranean countries (12 percentage points), which is ahead of the Anglo group with 7.4 percentage
points. This is driven by Spain and leaving this country out of the group reduces the weighted average to
4.2 points. The Scandinavian group is similarly affected by one country, the Netherlands, and removing it
results in an average increase in the young male unemployment rate of 7.6 points, placing it ahead of
the Anglo group, which is not in line with the differences in labour market flexibility.
This analysis illustrates the complex interaction of different factors, which combine to determine the
impact of the current financial crisis on the unemployment rates of young men. All the factors studied
above, the change in aggregate demand, sectoral composition of employment prior to the crisis, and
institutions and the flexibility of the labour market, are potentially important factors behind rising
unemployment rates, but none clearly so in isolation. That said, it is clear that the five most affected
countries, Estonia, Ireland, Latvia, Lithuania and Spain are outliers in any correlation and therefore,
require in-depth country-level analysis. In addition, there are other countries where the trends in youth
unemployment rates also require further explanation, particular in terms of the impact on more narrow
age groups such as the 15-19 bracket who are known to be vulnerable to unemployment due to their
31
low levels of education. This type of information is crucial for policymakers in order to design more
effective policy interventions.
Figure 12: Average change in unemployment rates of young men from December 2007 to latest month,
weighted groupings
Source: EUROSTAT Employment and Unemployment (Labour Force Survey) database.
Notes: Country groupings are: Anglo countries (Australia, Canada, Ireland, United Kingdom, United States);
Continental countries (Austria, Belgium, Germany, France and Luxembourg); Scandinavia countries (Finland,
Norway, Sweden along with the Netherlands); Mediterranean countries (Spain, Greece, Italy, Portugal); Baltic
States (Estonia, Latvia, Lithuania); and Eastern European countries (Bulgaria, Czech Republic, Hungary, Poland,
Romania, Slovenia, Slovakia, together with Turkey). See notes for Figure 3. The size of the labour force of young
men aged 15-24 in 2007 is used to calculate the weighted averages.
5. Conclusion and policy response
The current financial and economic crisis has resulted in the worst global downturn since World War II,
leading to millions of job losses and deterioration in working conditions. Though some recent evidence
indicates that the economy may have bottomed out, history shows that after synchronized and global
crises, like the current one, unemployment rates across the world will continue to rise and stay

32
stubbornly high for some time to come. A review of previous financial crises in Finland, Japan, Mexico,
Norway, Spain, Sweden and Turkey shows that this labour market impact is, however, not uniform. In
particular, during and after a crisis, it is the youth who are hit hardest in terms of losing jobs and joining
the unemployment queues. The increased gap between youth and adult unemployment rates remains,
even after the economy has begun to recover.
An analysis of the current crisis confirms this heightened vulnerability of youth to unemployment, which
can be explained by a combination of the degree of economic contraction, sectoral composition of
employment prior to the crisis and institutional structures. However, it is also clear that the last
dimension does not play the leading role; rather the outcome is being driven by the collapse of
aggregate demand, which is concentrated in contracting sectors. This process subsequently interacts
with the institutional arrangements and the policy environment, which in turn influences how labour
adjusts.
Overall, these lessons indicate the importance of considering the heterogeneous impact of the crisis on
the labour market in terms of age and gender dimensions. In particular, there is an important gender
dimension to the vulnerability of youth in the current crisis as young men have been generally more
affected, reflecting that these individuals are employed in such sectors as construction and
manufacturing, which are heavily impacted by this recession. Young women nonetheless do experience
increasing unemployment rates often in a similar fashion to young men, and in some countries, they are
in fact the group that suffers the most. Moreover, this comes on top of the longer term barriers young
women continually face in the labour market.
In light of this situation, governments should ensure that youth are targeted as part of policy
interventions such as subsidies, training schemes and job search assistance programmes. Indeed, a
majority of OECD countries are precisely doing that by targeting measures at youth to mitigate the
impact of the economic downturn. This is essential to ensure that youth will not become long-term
unemployed, which would reduce their future career and earnings potential, and increase their
exclusion from society. The challenge for policymakers is to implement policies that will effectively assist
young people threatened by lay-offs, those who have already lost their jobs in such sectors as
construction and manufacturing, and new labour market entrants. This in turn requires careful
consideration of how skills development and other measures would benefit these youth so that they

33
have a chance to find employment in a new occupation or growing sector once the economy begins to
recovers.
References:
Bell, D.N.F and D.G. Blanchflower (2009). What should be done about rising unemployment in the UK?
IZA Discussion Paper, No. 4040.
Bundesagentur für Arbeit (2009). Monats bericht: Der Arbeits- und Ausbildungsmarkt in Deutschland,
Juli 2009. Available at:
http://www.pub.arbeitsagentur.de/hst/services/statistik/000000/html/start/monat/aktuell.pdf
Edwards, S. (1997). The Mexican Peso crisis? How much did we know? When did we know it? NBER
Working Paper, No.6334.
Fallon, P.R. and R.E.B. Lucas (2002). The impact of financial crises on labor markets, household incomes
and poverty: a review of evidence. The World Bank Research Observer, Spring 2002, Vol. 17, No.1, pp.21-45.
Haugh, D., Ollivaud, P. and D. Turner (2009). The macroeconomic consequences of banking crises in
OECD countries. OECD Economics Department Working Paper, No. 683. Honkapohja, S. and E. Koskela (1999). The economic crisis of the 1990s in Finland. Economic Policy, Vol.
14, No.29, pp.399-436.
International Labour Organization (ILO) (2006). Global Employment Trends for Youth. ILO, Geneva.
International Monetary Fund (IMF) (2009). From recession to recovery: how soon and how strong?
Chapter 3 in IMF (2009). World Economic Outlook (WEO) Crisis and Recovery, April 2009. IMF,
Washington, D.C.
Nakaso, H. (2001). The financial crisis in Japan during the 1990s: how the Bank of Japan responded and lessons learnt. Bank of International Settlements (BIS) Papers, No.6.
Okun, A.M. (1962). Potential GNP: its measurement and significance. American Statistical Association,
Proceedings of the Business and Economics Section, pp. 98-104.
Organization for Economic Co-operation and Development (OECD) (2008). OECD Employment Outlook
2008. OECD, Paris.
Özatay, F. and G. Sak (2002). The 2000-2001 Financial Crisis in Turkey. Unpublished paper.
Reinhart, C.M. and K.S Rogoff (2008a). Banking crises: an equal opportunity menace. National Bureau of
Economic Research (NBER) Working Paper, No. 14587.
Reinhart, C.M. and K.S Rogoff (2008b). Is the 2007 U.S. sub-prime financial crisis so different? An
international comparison. American Economic Review, No. 98. United Nations (2003). World Youth Report 2003: the Global Situation of Young People. United Nations,
New York.

34
Appendix
Table 3: Initial unemployment rate, date of unemployment trough and changes in unemployment rates of young men since the start of the
current financial crisis
Young men Young women Prime-age men
Country
Initial
unemployment
rate (trough)
Date of
trough
Change
since trough
Initial
unemployment
rate (trough)
Date of
trough
Change since
trough
Initial
unemployment
rate (trough)
Date of
trough
Change since
trough
AT 7.0 Dec 07 2.7 7.2 Jul 08 -0.2 2.7 May 08 1.0
AU 8.3 Feb 08 5.0 7.6 Aug 08 3.5 3.6 Feb 08 1.2
BE 16.2a Oct 08 4.6 16.4
a Apr 08 7.9 5.3 Mar 08 2.0
BG 13.0 Aug 08 4.8 9.0 Aug 08 2.3 4.1 Nov 08 1.6
CA 11.9 Jan 08 7.2 9.4 Mar 08 3.1 5.0 Feb 08 0.9
CZ 9.5 Apr 08 3.7 9.2 Apr 08 5.6 2.8 Jul 08 3.9
DE 10.3 Aug 08 2.7 8.4 Aug 08 0.9 6.8 Aug 08 16.9
DK 6.3a Apr 08 5.7 7.1
a Dec 07 1.9 1.9 May 08 9.7
EE 8.0a Jan 08 26.6 5.9
a Dec 07 14.7 2.6 Mar 08 3.2
ES 17.5 Dec 07 21.1 22.4 Dec 07 11.5 5.9 Dec 07 1.4
FI 15.9 Mar 08 9.5 15.4 May 08 2.9 4.4 Feb 08 1.2
FR 17.4 Feb 08 7.3 18.2 Feb 08 4.6 5.7 Apr 08 0.4
GR 15.6a Dec 07 2.7 28.6
a Apr 08 3.2 4.1
a Apr 08 3.0
HR 16.1 Oct 08 4.5 26.1 May 08 4.2 5.3 Jul 08 8.7
HU 17.7 May 08 8.9 19.8 Oct 08 7.1 6.2 Feb 08 1.1
IE 10.6 Dec 07 20.7 7.4 Jan 08 11.8 4.3 Dec 07 13.6
IT 18.1a Jan 08 3.9 23.7
a Jan 08 5.3 3.9 Dec 07 2.6
a
LT 6.1a Dec 07 30.5 10.1
a Dec 07 12.4 4.0 Dec 07 14.4
LU 12.0 Mar 08 5.6 18.9 Dec 07 6.3 2.5 Dec 07 0.7
LV 7.9a Dec 07 24.4 9.1
a Dec 07 15.8 5.3 Dec 07 0.7
NL 5.2 Jun 08 1.9 4.8 Jan 08 0.6 1.9 Jun 08 1.2
NO 7.1 May 08 2.1 5.9 May 08 1.8 1.7 Feb 08 2.2
PL 14.5 Jul 08 5.0 18.6 Aug 08 1.5 5.1 Aug 08 0.4

35
PT 12.1 Apr 08 6.7 18.7 Oct 08 2.3 5.6 Dec 07 2.8
RO 17.8a Oct 08 2.8 15.8
a Dec 07 2.2 5.1
a Jul 08 2.0
SE 16.6 May 08 11.1 18.0 Jun 08 9.6 3.6 Mar 08 2.5
SI 9.1a Apr 08 7.2 10.3
a Jul 08 5.2 3.0 Apr 08 3.4
SK 18.4 Feb 08 5.0 19.2 Apr 08 9.2 6.7 Aug 08 2.6
TR 16.2a Apr 08 6.9 16.9
a Dec 07 5.2 7.2
a Jan 08 5.5
UK 15.4 Apr 08 6.4 11.6 Feb 08 4.6 3.6 Dec 07 2.5
US 12.1 Apr 08 7.7 9.8 Apr 08 5.9 3.7 Dec 07 3.6
Source: Australian Bureau of Statistics, EUROSTAT Employment and Unemployment (Labour Force Survey) database, and Statistics Canada.
Notes: The latest month is June 2009 for all countries except Greece, Italy, Romania and Turkey (March 2009) and Norway and the United Kingdom (April
2009). Unemployment rates are seasonally adjusted. The change in unemployment rates is calculated as the difference between the minimum monthly rate
reached after December 2007, the start of the recession in the United States, and the latest monthly figure. a = these countries only provide quarterly data and
the month listed in Table 3 denotes the first month of the quarter.


