
WHITEHAVEN COAL LIMITED
AUSTRALIA’S LEADING HIGH QUALITY COAL COMPANY
BMO 2018 Global Metals and Mining Conference
Miami, Florida 26-28 February 2018

DISCLOSURE
2018 BMO GLOBAL METALS AND MINING CONFERENCE2 //
STATEMENTS CONTAINED IN THIS MATERIAL, PARTICULARLY THOSE REGARDING THE POSSIBLE OR ASSUMED FUTURE PERFORMANCE, COSTS, DIVIDENDS, RETURNS, PRODUCTION
LEVELS OR RATES, PRICES, RESERVES, POTENTIAL GROWTH OF WHITEHAVEN COAL LIMITED, INDUSTRY GROWTH OR OTHER TREND PROJECTIONS AND ANY ESTIMATED COMPANY
EARNINGS ARE OR MAY BE FORWARD LOOKING STATEMENTS. SUCH STATEMENTS RELATE TO FUTURE EVENTS AND EXPECTATIONS AND AS SUCH INVOLVE KNOWN AND UNKNOWN
RISKS AND UNCERTAINTIES. ACTUAL RESULTS, ACTIONS AND DEVELOPMENTS MAY DIFFER MATERIALLY FROM THOSE EXPRESSED OR IMPLIED BY THESE FORWARD LOOKING
STATEMENTS DEPENDING ON A VARIETY OF FACTORS.
THE PRESENTATION OF CERTAIN FINANCIAL INFORMATION MAY NOT BE COMPLIANT WITH FINANCIAL CAPTIONS IN THE PRIMARY FINANCIAL STATEMENTS PREPARED UNDER IFRS.
HOWEVER, THE COMPANY CONSIDERS THAT THE PRESENTATION OF SUCH INFORMATION IS APPROPRIATE TO INVESTORS AND NOT MISLEADING AS IT IS ABLE TO BE RECONCILED TO
THE FINANCIAL ACCOUNTS WHICH ARE COMPLIANT WITH IFRS REQUIREMENTS.
ALL DOLLARS IN THE PRESENTATION ARE AUSTRALIAN DOLLARS UNLESS OTHERWISE NOTED.
COMPETENT PERSONS STATEMENT
INFORMATION IN THIS REPORT THAT RELATES TO COAL RESOURCES AND COAL RESERVES IS BASED ON AND ACCURATELY REFLECTS REPORTS PREPARED BY THE COMPETENT
PERSON NAMED BESIDE THE RESPECTIVE INFORMATION. GREG JONES IS A PRINCIPAL CONSULTANT WITH JB MINING SERVICES. PHILLIP SIDES IS A SENIOR CONSULTANT WITH JB
MINING SERVICES. BEN THOMPSON IS A GEOLOGIST WITH WHITEHAVEN COAL. JOHN ROGIS IS A GEOLOGIST WITH WHITEHAVEN COAL. RICK WALKER IS A GEOLOGIST WITH
WHITEHAVEN COAL. GRAEME RIGG IS A FULL TIME EMPLOYEE OF RPM ADVISORY SERVICES PTY LTD. DOUG SILLAR IS A FULL TIME EMPLOYEE OF RPM ADVISORY SERVICES PTY LTD.
SHAUN TAMPLIN IS A FULL TIME EMPLOYEE OF TAMPLIN RESOURCES PTY LTD. CHARLES PARBURY IS A GEOLOGIST AND FULL TIME EMPLOYEE OF MCELROY BRYAN GEOLOGICAL
SERVICES PTY LTD. MICHAEL BARKER IS A FULL TIME EMPLOYEE OF PALARIS LTD.
NAMED COMPETENT PERSONS CONSENT TO THE INCLUSION OF MATERIAL IN THE FORM AND CONTEXT IN WHICH IT APPEARS. ALL COMPETENT PERSONS NAMED ARE MEMBERS OF
THE AUSTRALASIAN INSTITUTE OF MINING AND METALLURGY AND/OR THE AUSTRALIAN INSTITUTE OF GEOSCIENTISTS AND HAVE THE RELEVANT EXPERIENCE IN RELATION TO THE
MINERALISATION BEING REPORTED ON BY THEM TO QUALIFY AS COMPETENT PERSONS AS DEFINED IN THE AUSTRALIAN CODE FOR REPORTING OF EXPLORATION RESULTS, MINERAL
RESOURCES AND ORE RESERVES (THE JORC CODE, 2012 EDITION).
ADDITIONAL INFORMATION
ANY REFERENCES TO RESERVE AND RESOURCE ESTIMATES SHOULD BE READ IN CONJUNCTION WITH THE WHITEHAVEN’S ORE RESERVES AND COAL RESOURCES STATEMENT FOR
ITS COAL PROJECTS AT 31 MARCH 2017 AS RELEASED TO THE AUSTRALIAN SECURITIES EXCHANGE ON 17 AUGUST 2017. WHITEHAVEN CONFIRMS IN SUBSEQUENT PUBLIC REPORTS
THAT IT IS NOT AWARE OF ANY NEW INFORMATION OR DATA THAT MATERIALLY EFFECTS THE INFORMATION INCLUDED IN THE RELEVANT MARKET ANNOUNCEMENT AND IN THE CASE
OF ESTIMATES OF COAL RESOURCES OR ORE RESERVES, THAT ALL MATERIAL ASSUMPTIONS AND TECHNICAL PARAMETERS UNDERPINNING THE ESTIMATES IN THE RELEVANT
MARKET ANNOUNCEMENT CONTINUE TO APPLY AND HAVE NOT MATERIALLY CHANGED.

AGENDA
2018 BMO GLOBAL METALS AND MINING CONFERENCE3 //
– Highlights
– Safety Performance
– Financial Performance
– Operations
– Community
– Outlook for Coal Use
– Outlook for Whitehaven
– Appendices

RECORD HALF YEAR PROFIT
HIGHLIGHTS
2018 BMO GLOBAL METALS AND MINING CONFERENCE4 //
HIGHLIGHTS
Safety improved with the
TRIFR declining to 6.19 at 31
December
Record half year net profit of
$257.2 million up 63%
Equity coal sales of 9.2Mt
including purchased coal
Record EBITDA of $460.6
million up 42% on pcp
An interim dividend of
$0.13ps declared
Investment grade gearing
and leverage credit metrics

IMPROVING SAFETY PERFORMANCE AND INCREASED PRODUCTION
SAFETY PERFORMANCE
2018 BMO GLOBAL METALS AND MINING CONFERENCE5 //
SAFETY PERFORMANCE
Safehaven Rules Initiated
– Implementation of the “Safehaven
Rules” programme has driven a step
change in safety performance across
the company over the last five years
– The improved safety outcomes highlight
the effectiveness of Whitehaven’s
safety programmes in a rapidly growing
company and an expanding workforce
– Notably, several operations have been
LTI free for over three years
0
5
10
15
20
25
Whitehaven Group TRIFR and Saleable Coal Production (Mt)
Saleable Production TRIFR

FINANCIAL PERFORMANCE

RECORD HALF YEAR PROFIT, CASH FLOW AND DIVIDEND
FINANCIAL HIGHLIGHTS
2018 BMO GLOBAL METALS AND MINING CONFERENCE7 //
FINANCIAL PERFORMANCE
Profit and lossH1
FY2018
H1
FY2017Comment
Net profit after tax ($’m)
including significant items257.2 157.5 – Up 63%, record half year result
EBITDA before significant
items ($’m)460.6 324.8
– Up 42% on pcp, higher
volumes and prices
Cash generated from
operations ($’m)409.7 263.6 – Up 55% on pcp
Dividend (cps) 13 - – Return to shareholders
Unit cost per tonne ($/t) 60 56 – In line with guidance
Balance Sheet31 Dec
2017
30 June
2017
Net debt ($’m) 146.9 311.1 – Strong balance sheet and
investment grade metricsGearing (%) 4% 9%

HIGHER COAL PRICES AND SALES FLOWING DIRECTLY TO RESULTS
RECORD HALF YEAR PROFIT
2018 BMO GLOBAL METALS AND MINING CONFERENCE8 //
Financial Performance - A$ millions H1 FY2018 H2 FY2017 H1 FY2017
Revenue 1,146.4 949.8 823.5
Other income 3.6 4.1 3.6
Operating expenses (421.4) (317.7) (271.5)
Rail, Port, Marketing and Royalties (NSW Gov) (248.1) (225.5) (219.9)
Admin and other expenses (including net FX gain/loss) (19.9) (21.3) (10.9)
Operating EBITDA 460.6 389.4 324.8
Depreciation & amortisation (72.6) (65.7) (68.2)
Net interest expense (15.4) (19.4) (30.6)
Income tax expense (115.6) (94.6) (68.5)
Net profit after tax, before significant items 257.2 209.7 157.5
Significant items after tax - 38.2 -
Net profit 257.2 247.9 157.5
Earnings per share (cents per share - diluted) 25.6 24.9 15.8
FINANCIAL PERFORMANCE

HIGHER PRICES DRIVING HIGHER MARGINS
MARGINS AND COSTS
2018 BMO GLOBAL METALS AND MINING CONFERENCE9 //
H1
FY2018
H2
FY2017
H1
FY2017
Coal Sales (equity basis, excl.
purchased coal) Mt 8.6 7.7 7.8
Average revenue (excl. purchased
coal & net of NSW royalties)$A/t 114 109 97
Average cost of sales $A/t 60 59 56
EBITDA Margin on Coal Sales $A/t 54 50 41
EBITDA Margin on Coal Sales % 47% 46% 42%
– Increasing coal prices combined with
tightly controlled costs have generated
higher margins
– Realised average thermal and
metallurgical coal prices for the half year
were US$95/t and US$111/t respectively
– Change in mine mix as well as modest
cost increases at both Narrabri and
Maules Creek caused costs to rise from
$59/t in H2 FY2017 to $60/t in H1 FY2018
FINANCIAL PERFORMANCE

BALANCE SHEET IN EXCELLENT SHAPE
BALANCE SHEET
2018 BMO GLOBAL METALS AND MINING CONFERENCE10 //
31 Dec 2017
$’m
30 June 2017
$’m
Cash on hand 98.6 87.1
Senior secured bank facility 190.0 325.0
ECA and finance leases 74.6 87.2
Total interest bearing liabilities* 245.6 398.3
Net debt 146.9 311.1
Gearing 4% 9%
– Net debt at 31 December 2017 of $146.9m
after payment of capital return and
dividend
– Net cash in mid November 2017
– Redrew debt funds and paid a $198m
capital return and dividend in late
November 2017
– Strong conversion of EBITDA to cash and
investment grade credit metrics
* Shown net of capitalised borrowing costs
FINANCIAL PERFORMANCE

OPERATIONS

RECORD HALF YEAR SALES
COAL SALES
2018 BMO GLOBAL METALS AND MINING CONFERENCE12 //
OPERATIONS
Equity Basis – 000t H1 FY2018 H1 FY2017 Change
Maules Creek 3,554 3,071 16%
Narrabri 2,674 2,793 (4%)
Gunnedah Open Cuts 2,349 1,894 24%
Sales of Purchased Coal 655 38 -
Whitehaven Total 9,232 7,796 18%
-
2,000
4,000
6,000
8,000
10,000
12,000
14,000
H1 FY15 H2 FY15 H1 FY16 H2 FY16 H1 FY17 H2 FY17 H1 FY18
Whitehaven Managed Coal Sales (000's t)
Purchased Coal Open Cuts Narrabri Maules Creek

WHITEHAVEN CONTINUES TO GROW SALES INTO A GROWING SOUTH EAST ASIA MARKET
SALES TO PREMIUM MARKETS
2018 BMO GLOBAL METALS AND MINING CONFERENCE13 //
60%
12%
12%
5%
3%6%
2%
H1 FY2018 Thermal Coal Sales
Japan
Taiwan
Korea
Indonesia
Malaysia
Other Asia
Other
35%
17%13%
12%
12%
11%
H1 FY2018 Metallurgical Coal Sales
India
Japan
Korea
Taiwan
China
Vietnam
– Managed coal sales of 11.9Mt for the half were 16% ahead
of sales in the pcp
– Increased sales of higher quality coal has seen Taiwan
overtake Korea for Whitehaven’s thermal coal sales during
the half
– Sales into South East Asian countries continues to grow
– The spread of metallurgical coal sales customers is
increasing as new customers in Taiwan and Vietnam
contract for Maules Creek semi soft coking coal
OPERATIONS
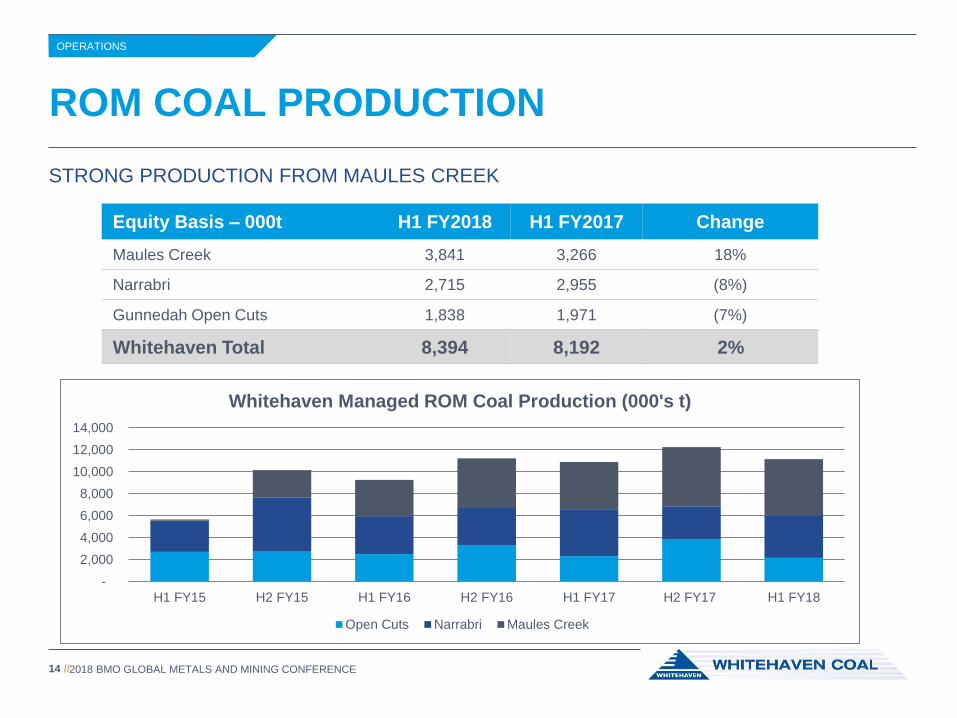
STRONG PRODUCTION FROM MAULES CREEK
ROM COAL PRODUCTION
2018 BMO GLOBAL METALS AND MINING CONFERENCE14 //
Equity Basis – 000t H1 FY2018 H1 FY2017 Change
Maules Creek 3,841 3,266 18%
Narrabri 2,715 2,955 (8%)
Gunnedah Open Cuts 1,838 1,971 (7%)
Whitehaven Total 8,394 8,192 2%
-
2,000
4,000
6,000
8,000
10,000
12,000
14,000
H1 FY15 H2 FY15 H1 FY16 H2 FY16 H1 FY17 H2 FY17 H1 FY18
Whitehaven Managed ROM Coal Production (000's t)
Open Cuts Narrabri Maules Creek
OPERATIONS

MAULES CREEK PRODUCTION RAMPING ON SCHEDULE
MAULES CREEK MINE
2018 BMO GLOBAL METALS AND MINING CONFERENCE15 //
-
2,000
4,000
6,000
8,000
10,000
12,000
FY2015 FY2016 FY2017 FY2018(f)
Maules Creek ROM Coal Production (000's t) – Maules Creek ROM coal production is
forecast to reach 11Mt in FY2018, up 13%
on FY2017 as more mining fleet is added
to the mine
– The approved production level of 13Mt
ROM coal is expected to be achieved in
FY2020
– Metallurgical coal sales for the half were
0.9Mt, 19% of total sales
– Full year sales of metallurgical coal is
expected to be in the range of 20% to 25%
of total Maules Creek product sales
OPERATIONS

A STRONG QUARTER BUT BELOW OUR EXPECTATIONS
NARRABRI MINE
2018 BMO GLOBAL METALS AND MINING CONFERENCE16 //
2,103
3,287
2,372
2,852
4,851
3,462 3,426
4,222
3,045
3,879
-
1,000
2,000
3,000
4,000
5,000
H2FY13
H1FY14
H2FY14
H1FY15
H2FY15
H1FY16
H2FY16
H1FY17
H2FY17
H1FY18
Narrabri Half Year ROM Coal Production (000's t) – ROM coal production was the 3rd best half
year of production over the last five years
– Production labour was diverted towards the
installation of additional secondary roof
support in response to the impact of
increased depth of cover
– FY2018 production is expected to be in the
range of 6.0Mt and 6.5Mt ROM coal
– The next longwall change from LW107 to
LW108 panel is scheduled to occur during
the June quarter this year
OPERATIONS

DECISION TAKEN TO MINE THROUGH FAULT IN LW108 AND LW109 FOLLOWING SUCCESSFUL MINING IN LW107
NARRABRI MINE PLAN
2018 BMO GLOBAL METALS AND MINING CONFERENCE17 //
– The next longwall changeout from LW107
to LW108 is scheduled to commence in
late April 2018 with longwall production
forecast to commence from LW108 in
June
– The decision to mine through the fault in
LW108 and LW109 bodes well for
adopting the same approach in LW110
and beyond
– Production guidance for FY2019 and
FY2020 increased to 7.7Mt and 7.0Mt
respectively
OPERATIONS

PRODUCTION RETURNED TO NORMAL AFTER THE STRONG H2 FY2017
GUNNEDAH OPEN CUTS
2018 BMO GLOBAL METALS AND MINING CONFERENCE18 //
– ROM coal production from the three open
cuts – Tarrawonga, Rocglen and Werris
Creek – reflects the impact of a strong finish
to the previous financial year
– FY2018 ROM coal production is expected to
be in the range of 5.0Mt and 5.4Mt
confirming guidance provided with the full
year results
– Whitehaven agreed to acquire Idemitsu’s
30% joint venture interest in Tarrawonga
during the half, adding a further 0.7Mtpa of
equity ROM coal production on final
approval
2,711 2,787 2,511
3,280
2,313
3,829
2,161
-
1,000
2,000
3,000
4,000
H1 FY15 H2 FY15 H1 FY16 H2 FY16 H1 FY17 H2 FY17 H1 FY18
Gunnedah Open Cut ROM Coal Production (000's t)
OPERATIONS

EIS EXPECTED TO BE LODGED LATE IN THE MARCH QUARTER
VICKERY PROJECT UPDATE
2018 BMO GLOBAL METALS AND MINING CONFERENCE19 //
Project is approved as a 4.5Mtpa open cut by the NSW Government. Whitehaven is seeking approval to increase
production to 10Mtpa ROM coal and to be a processing hub for the Vickery precinct mines
Location About 25kms north of Gunnedah
Resources and Reserves Resource of 505Mt, Underground Resources of 230Mt, Open cut Reserves of
200Mt
Ownership Whitehaven 100%, Seeking to form a JV (may sell up to 30% during approval
period)
Coal Quality Similar to Maules Creek – Metallurgical SSCC, PCI and high CV thermal coal
Start-up First coal possible in CY2021 during construction and fully ramped by H2 CY2024
Current Status EIS to be lodged with Government authorities at the end of March following
optimisation work for a 10.0Mtpa project and removal of Blue Vale coal from the
project
OPERATIONS

WHEN FULLY RAMPED WHITEHAVEN’S MANAGED PRODUCTION INCREASES TO OVER 30MTPA
VICKERY INDICATIVE TIMELINE
2018 BMO GLOBAL METALS AND MINING CONFERENCE20 //
March 2018 EIS lodged, approval process commenced
CY2018 – CY2019 Formation of JV, interested parties invited to participate
H2 CY2019 Project approved by all relevant Government authorities
H1 CY2020 Board makes final investment decision
H1 CY2020 Construction commences with an estimated capex in the range of $600m to
$700m on a 100% basis with a construction period of two years required to
build the project, estimate includes additional CHPP capacity for Tarrawonga
coal
H2 CY2020 Pre-commercial coal is mined from the open cut and shipped to customers in
Asia
H2 CY2021 Construction completed and commercial production commences
CY2024 Ramping production to 10Mtpa ROM coal and 8.5Mt saleable product
comprising 40% thermal coal and 60% metallurgical coal available for sale

COMMUNITY

WHITEHAVEN HAS STRONG POSITIVE REPUTATION IN THE REGION
WORKING WITH THE COMMUNITY
2018 BMO GLOBAL METALS AND MINING CONFERENCE22 //
COMMUNITY
COMMUNITY
> $1 BILLION INVESTMENT IN REGION SINCE 2012
PEOPLE
OVER 1,400 VISITORS TO MINE OPEN DAYS AND TOURS
COMMUNITY
OVER 40 ORGANISATIONS SUPPORTED THIS HALF YEAR
COMMUNITY
72% OF LOCAL PEOPLE POSITIVE OR NEUTRAL ON COMPANY (UP 11% SINCE 2015) *
PEOPLE
70% OF LOCAL AREA FEEL WHITEHAVEN HAS POSITIVE EFFECT ON LOCAL ECONOMY *
PEOPLE
72% OF LOCAL AREA REPORTED A MEANINGFUL INTERACTION WITH COMPANY IN THE LAST YEAR *
* Findings of community survey by Newgate Communications Pty Ltd Research
OUTLOOK FOR COAL USE
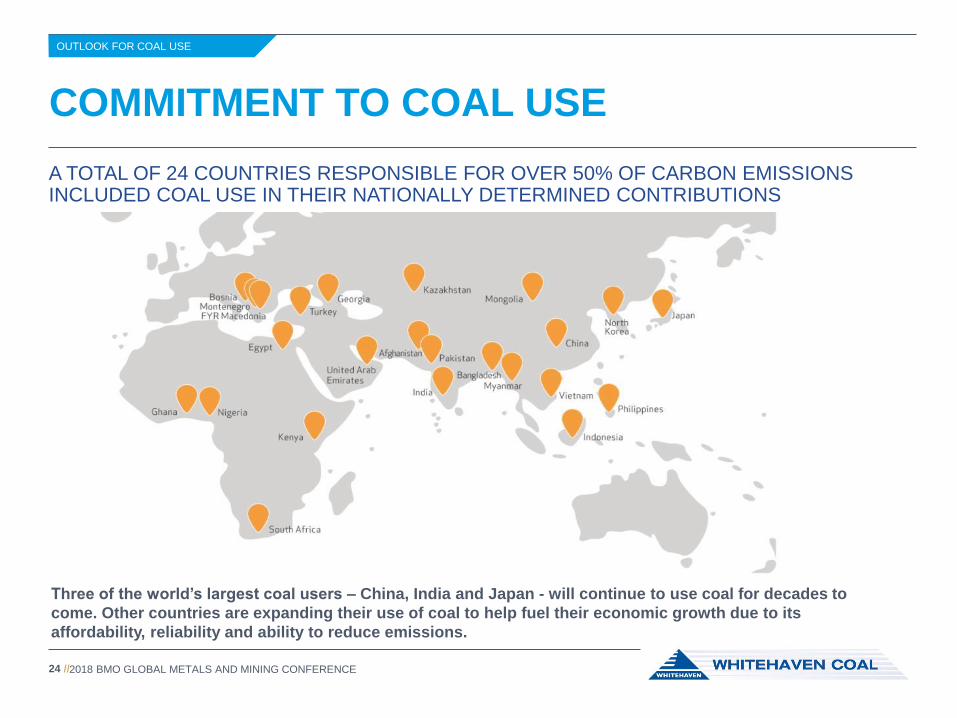
A TOTAL OF 24 COUNTRIES RESPONSIBLE FOR OVER 50% OF CARBON EMISSIONS INCLUDED COAL USE IN THEIR NATIONALLY DETERMINED CONTRIBUTIONS
COMMITMENT TO COAL USE
2018 BMO GLOBAL METALS AND MINING CONFERENCE24 //
OUTLOOK FOR COAL USE
Three of the world’s largest coal users – China, India and Japan - will continue to use coal for decades to
come. Other countries are expanding their use of coal to help fuel their economic growth due to its
affordability, reliability and ability to reduce emissions.

CONTINUED STRONG GROWTH ASIAN COAL DEMAND
ASIA THE GROWTH ENGINE
2018 BMO GLOBAL METALS AND MINING CONFERENCE25 //
1000
1500
2000
2500
3000
3500
4000
4500
5000
2016 2025 2030 2035 2040
Asian Region Coal Demand (Mtce)
China India Japan Southeast Asia Others
Source: IEA WEO 2017, New Policies Scenario
– Coal demand across the Asian region
grows from 3.96Btce in 2016 to 4.44Btce
2040, equivalent to an additional
560Mtpa of 6000k/cal coal by 2040
– Declining demand in China is
outweighed by the growth in other
countries in the region
– The growth over the forecast period is
more than double Australian’s current
thermal coal exports
OUTLOOK FOR COAL USE
The International Energy Agency (IEA) regularly makes projections about world coal demand based on various future scenarios for energy development. The “New Policies
Scenario” broadly serves as the IEA’s baseline scenario in its World Energy Outlook. Alternate scenarios include the “Current Policies Scenario (highest projected coal usage) and
the “450 Scenario” (lowest project coal usage). Further details are available at: https:/www.iea.org/publications/scenarioand projections/

COAL’S SHARE OF GENERATION INCREASES FROM 35% TO 40% BY 2040
ELECTRICITY GROWTH IN SE ASIA
2018 BMO GLOBAL METALS AND MINING CONFERENCE26 //
0
500
1000
1500
2000
2500
2016 2025 2030 2035 2040
Electricity Generation in SE Asia (TWh)
Coal Oil Gas Nuclear Hydro Bioenergy Wind Geothermal Solar
Source: IEA Southeast Asia Energy Outlook 2017, New Policies Scenario*
* Refer to footnote on slide 24Southeast Asian countries included are: Brunei, Cambodia, Indonesia, Laos, Malaysia, Myanmar, Philippines,
Singapore, Thailand and Vietnam
– Sent out electricity from coal fired
plants in SE Asia is forecast to grow
by 578TWh from 321TWh in 2016 to
898TWh in 2040, an increase of 180%
– Coal’s share of electricity generation
grows from 35% in 2016 to 40% in
2040
– Electricity generation from intermittent
renewables is set to grow by 135TWh
from 5TWh in 2016 to 140TWh, 6% of
the total in 2040
OUTLOOK FOR COAL USE

IN ASIA COAL UNDERPINS ECONOMIC GROWTH – LOW COST, RELIABLE AND SECURE
WHY IS COAL SO WIDELY USED ACROSS ASIA?
2018 BMO GLOBAL METALS AND MINING CONFERENCE27 //
0
50
100
150
200
250
Cost of Electricity Generation (US$/MWh) – The cost of coal fired electricity capacity
remains the lowest readily available and
reliable energy source in the region
– All renewables including hydro, are more
expensive and most are significantly
more expensive than HELE coal fired
generation technology
– Economics are driving increased
penetration of coal in the South East
Asian electricity generation sector
Source: IEA Southeast Asia Energy Outlook 2017, New Policies Scenario*
* Refer to footnote on slide 24
OUTLOOK FOR COAL USE

HELE TECHNOLOGY IN SE ASIA INCREASES DEMAND FOR HIGH QUALITY COAL
IMPROVING GENERATION TECHNOLOGY
2018 BMO GLOBAL METALS AND MINING CONFERENCE28 //
0
20
40
60
80
100
120
140
160
180
2016 2025 2030 2035 2040
Installed Capacity by Technology (GW)
Subcritical Super Critical Ultra-supercrtiical
– The deployment of HELE technology
increases in SE Asia - more
supercritical and ultra-supercritical
power stations are either being installed
or are being planned to be installed
– These new technologies are forecast to
comprise 50% of the installed capacity
by the end of the forecast period
– The deployment of this technology will
increase the demand of higher quality
coals
– Consuming high quality coal in HELE
power stations lowers carbon emissionsSource: IEA Southeast Asia Energy Outlook 2017, New Policies Scenario*
* Refer to footnote on slide 24
OUTLOOK FOR COAL USE

OUTLOOK FOR WHITEHAVEN

COAL DEMAND IS FORECAST TO CONTINUE GROWING OVER THE NEXT FIVE YEARS
WORLD THERMAL COAL DEMAND
2018 BMO GLOBAL METALS AND MINING CONFERENCE30 //
2,500
3,000
3,500
4,000
4,500
5,000
5,500
6,000
6,500
7,000
2017 2018 2019 2020 2021 2022
CRU Coal Demand Forecasts (Mt)
China India South East Asia JKT Europe Others
Source: CRU Thermal Coal Market Outlook, December 2017
– CRU, a respected industry consultant,
forecasts that world coal demand will grow by
400Mt over five years from an estimated 6.3Bt
in 2017 to 6.7Bt in 2022, an increase of 5.3%
– CRU’s demand growth in China is modest,
whereas IEA forecasts modest decreases
– Demand growth in other Asian countries is
strong
– With China becoming increasingly focused on
improved environmental standards for its
citizens, Whitehaven expects that high quality
coal will increasingly feature in Chinese
thermal and metallurgical coal import statistics
OUTLOOK FOR WHITEHAVEN

COAL DEMAND GROWS STRONGLY IN WHITEHAVEN’S KEY MARKETS
ASIAN DEMAND GROWTH
2018 BMO GLOBAL METALS AND MINING CONFERENCE31 //
-
100
200
300
400
500
600
700
2017 2018 2019 2020 2021 2022
Coal Demand Growth in Whitehaven's Key Markets (Mt)
South East Asia JKT
– Coal demand in Whitehaven’s key markets is forecast to grow from 567Mt in 2017 to 628Mt in 2022, a 10.8%
increase over the five years
– Coal’s share of the Asian generation mix has grown strongly over the past decade
Source: CRU Thermal Coal Market Outlook, December 2017
OUTLOOK FOR WHITEHAVEN

WHITEHAVEN’S PRODUCTION PROFILE
2018 BMO GLOBAL METALS AND MINING CONFERENCE32 //
MORE PRODUCTION GROWTH EXPECTED OVER THE NEXT FIVE YEARS
Note: Graph depicts saleable coal on a 100% basis including pre-commercial coal production from Maules Creek and the Vickery Project. The production profile shown in the
chart is fully underpinned by the Company’s Marketable Reserves from its operating mines. See slide 37 for full details of the Coal Reserves JORC table and Slide 2 for the
Competent Persons Statement.
0
5
10
15
20
25
30
35
Actual & Forecast Saleable Coal Production (100%, Mt)
Open Cuts Narrabri Maules Creek Vickery Fully Ramped
Actual Forecast
– Managed saleable coal production for
FY2018 is forecast to be in the range
of 20.5Mt to 21.0Mt
– Production growth has moderated
however, growth will resume when
Vickery is ramped to full production
OUTLOOK FOR WHITEHAVEN

CONTINUING TO DELIVER
TARGETS FOR FY2018
2018 BMO GLOBAL METALS AND MINING CONFERENCE33 //
Operations
− Continue improving safety performance
− Deliver saleable coal production guidance in the range of 20.5Mt to 21.0Mt (100% basis)
− Deliver FY2018 cost guidance of A$60/t
− Produce 11.0Mt ROM coal from Maules Creek for FY2018
− Kick-off an autonomous haulage system evaluation project at Maules Creek with the new fleet
− Increase contracted position for Maules Creek SSCC and grow metallurgical coal sales when the margin is
attractive
− Lodge EIS documentation for Vickery project
Financial
− Return surplus capital to shareholders
− Maintain the existing strong balance sheet
− Ensure that costs remain tightly controlled
OUTLOOK FOR WHITEHAVEN

THANK YOUwww.whitehavencoal.com.au

APPENDICES

LOCATION
2018 BMO GLOBAL METALS AND MINING CONFERENCE36 //
APPENDICES

RESOURCES
2018 BMO GLOBAL METALS AND MINING CONFERENCE37 //
Measured
Resource
(A)
Indicated
Resource
(B)
Measured +
Indicated
(A + B)
Inferred
Resource
(C)
Competent
Person
Report
Date
Maules Creek Opencut*CL375 AUTH346
EL8072220 400 620 30 1 Mar-17
Narrabri North Underground** ML1609 180 190 370 - 2 Mar-17
Narrabri South Underground** EL6243 30 150 180 140 3 Mar-16
Tarrawonga Opencut***EL5967 ML1579
ML1685 ML169342 18 60 13 4 Mar-17
Tarrawonga UndergroundEL5967 ML1579
ML1685 ML169310 15 25 14 4 Apr-14
Werris Creek Opencut ML1563 ML1672 15 2 17 - 4 Mar-17
Rocglen Opencut ML1620 5 4 9 - 4 Mar-17
Rocglen Underground ML1620 - 3 3 1 4 Mar-15
Vickery Opencut 230 165 395 110 5 Jul-15
Vickery Underground - 95 95 135 5 Jul-15
Gunnedah OpencutML1624 EL5183
CCL7017 47 54 89 4 Jun-14
Gunnedah UndergroundML1624 EL5183
CCL7012 138 140 24 4 Jun-14
Bonshaw Opencut EL6450 EL6587 - 4 4 7 4 Jun-14
Ferndale Opencut EL7430 103 135 238 134 6 Jan-13
Ferndale Underground EL7430 - - - 73 6 Jan-13
Oaklands North Opencut EL6861 110 260 370 580 4 Jun-14
Pearl Creek Opencut**** EPC862 - 14 14 38 7 Nov-12
954 1640 2594 1388
Whitehaven Coal Limited – Coal Resources – August 2017
CL316 EL4699
EL5831 EL7407
EL8224 ML1464
ML1471
1. Shaun Tamplin, 2. Charles Parbury, 3. Rick Walker, 4. Benjamin Thompson, 5. John Rogis, 6. Greg Jones, 7. Phill Sides
* Maules Creek Joint Venture - Whitehaven owns 75% share.
** Narrabri Joint Venture - Whitehaven owns 70% share.
*** Whitehaven owns 70% share of opencut resources within ML1579, ML1685 and ML1693. The total combined resource for Tarrawonga
Mining Leases (ML1579, 1685 and 1693) and Exploration Licence (EL5967) is reported.
**** Dingo Joint Venture - Whitehaven owns 70% share.
# The Coal Resources for active mining areas are current to the pit surface as at the report date.
TOTAL COAL RESOURCES
Tenement
APPENDICES
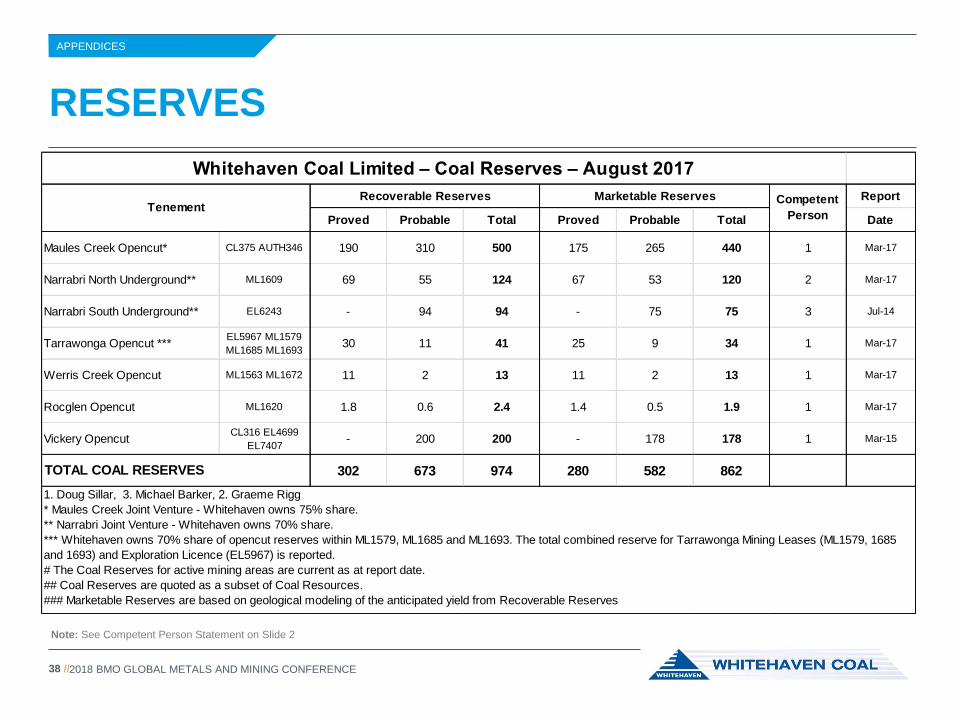
RESERVES
2018 BMO GLOBAL METALS AND MINING CONFERENCE38 //
Recoverable Reserves Marketable Reserves Report
Proved Probable Total Proved Probable Total Date
Maules Creek Opencut* CL375 AUTH346 190 310 500 175 265 440 1 Mar-17
Narrabri North Underground** ML1609 69 55 124 67 53 120 2 Mar-17
Narrabri South Underground** EL6243 - 94 94 - 75 75 3 Jul-14
Tarrawonga Opencut ***EL5967 ML1579
ML1685 ML169330 11 41 25 9 34 1 Mar-17
Werris Creek Opencut ML1563 ML1672 11 2 13 11 2 13 1 Mar-17
Rocglen Opencut ML1620 1.8 0.6 2.4 1.4 0.5 1.9 1 Mar-17
Vickery OpencutCL316 EL4699
EL7407- 200 200 - 178 178 1 Mar-15
302 673 974 280 582 862
1. Doug Sillar, 3. Michael Barker, 2. Graeme Rigg
* Maules Creek Joint Venture - Whitehaven owns 75% share.
** Narrabri Joint Venture - Whitehaven owns 70% share.
*** Whitehaven owns 70% share of opencut reserves within ML1579, ML1685 and ML1693. The total combined reserve for Tarrawonga Mining Leases (ML1579, 1685
and 1693) and Exploration Licence (EL5967) is reported.
# The Coal Reserves for active mining areas are current as at report date.
## Coal Reserves are quoted as a subset of Coal Resources.
### Marketable Reserves are based on geological modeling of the anticipated yield from Recoverable Reserves
TOTAL COAL RESERVES
Whitehaven Coal Limited – Coal Reserves – August 2017
TenementCompetent
Person
Note: See Competent Person Statement on Slide 2
APPENDICES


