| MES Inc.
White Paper Series.
China vs. India. A Sourcing Experience.
Date: October, 2015
Contents
Introduction .................................................................................................................................................. 2
Cheaper ......................................................................................................................................................... 4
Better ............................................................................................................................................................ 9
Faster .......................................................................................................................................................... 10
Sourcing Scorecard ..................................................................................................................................... 11
ANNEXES ..................................................................................................................................................... 13
| MES Inc.
Introduction
Marketing and Engineering Solutions (MES) counts as of today, on a database of 227 manufacturing
companies in China and 200 in India. After 15 years of existence as a global supply chain management
company, MES has developed a significant knowledge base with respect to global sourcing. What we
present here comes partly from lessons learned from our own mistakes and from the pain points reported
by our clients, with which we were able to assist.
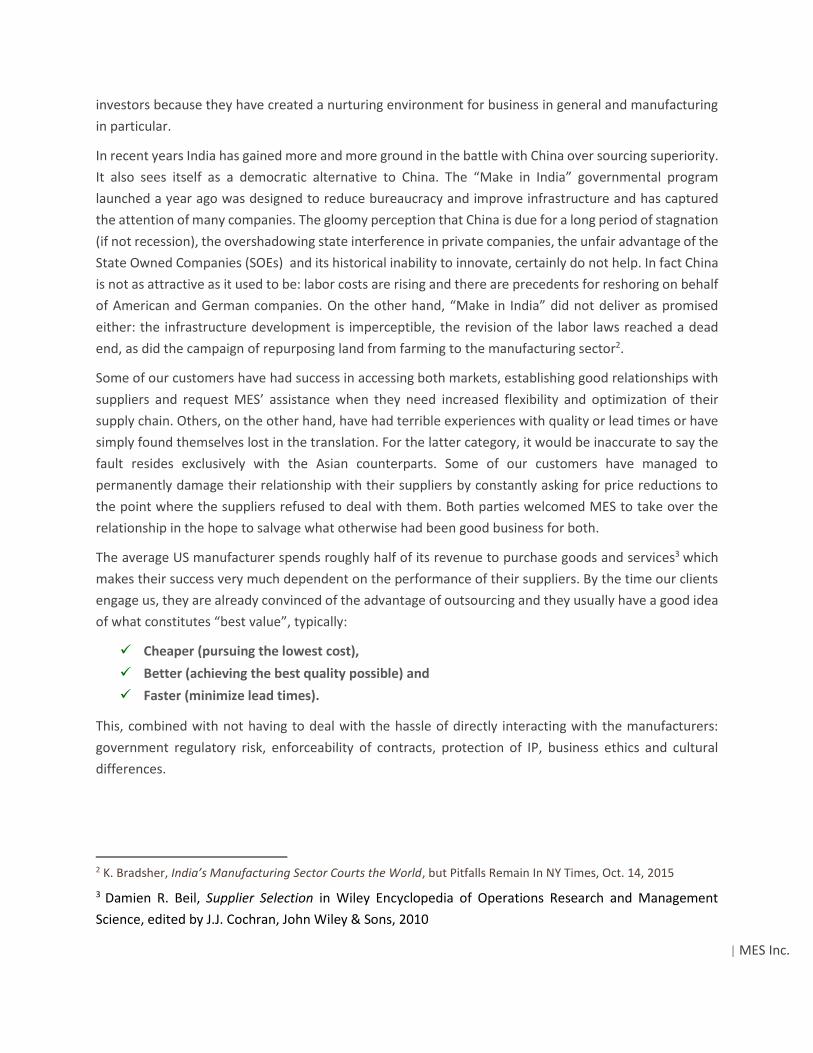
Chart 1: MES Suppliers in China and India by Geography
The highest manufacturing concentration in China is in the Pearl River Delta (Shenzen, Dongguan and
Guangzhou) and Yangtze River Delta (Shanghai, Jianggsu, Zhejiang) on the Eastern shoreline. Over 50% of
our Chinese suppliers are based in the latter, near Ningbo in the province of Zheijang, which is considered
the most entrepreneurial place in China. Having no natural resources or farming potential and being too
close to Taiwan to incite party interference, private companies have flourished and the proximity to major
ports allowed the movement of large amounts of goods. Generally, however, the Eastern coast is believed
to be oversaturated and the trend has been for foreign companies to head inland to find suppliers. The
lower labor cost and developing infrastructure makes this a solid strategy. In the past few years, the
automotive industry started to prefer Central China which caused a subsequent migration of upstream
suppliers. And the more inland you go, the closer you get to the metal smelters.
No country has more geographical disparities than India. Different levels of development, culture,
language, religion etc. are being accommodated by a democratic federalism. As Anand Mahindra, CEO of
Mahindra Group puts it, the state of Gujarat, for example, has more in common with Germany than it has
with Bihar, a state at the border with Nepal1. Almost 85% of our Indian suppliers are located in the three
states that are known as manufacturing hubs (together they account for 40% of all factories in India) as
well as for attracting record levels of FDI. These three states are particularly successful at attracting
1 Anand Mahindra, Toward a Uniquely Indian Growth Model in Reimagining India. Unlocking the Potential of Asia’s Next Superpower, McKinsey & Company Inc., 2013, p.18
| MES Inc.
investors because they have created a nurturing environment for business in general and manufacturing
in particular.
In recent years India has gained more and more ground in the battle with China over sourcing superiority.
It also sees itself as a democratic alternative to China. The “Make in India” governmental program
launched a year ago was designed to reduce bureaucracy and improve infrastructure and has captured
the attention of many companies. The gloomy perception that China is due for a long period of stagnation
(if not recession), the overshadowing state interference in private companies, the unfair advantage of the
State Owned Companies (SOEs) and its historical inability to innovate, certainly do not help. In fact China
is not as attractive as it used to be: labor costs are rising and there are precedents for reshoring on behalf
of American and German companies. On the other hand, “Make in India” did not deliver as promised
either: the infrastructure development is imperceptible, the revision of the labor laws reached a dead
end, as did the campaign of repurposing land from farming to the manufacturing sector2.
Some of our customers have had success in accessing both markets, establishing good relationships with
suppliers and request MES’ assistance when they need increased flexibility and optimization of their
supply chain. Others, on the other hand, have had terrible experiences with quality or lead times or have
simply found themselves lost in the translation. For the latter category, it would be inaccurate to say the
fault resides exclusively with the Asian counterparts. Some of our customers have managed to
permanently damage their relationship with their suppliers by constantly asking for price reductions to
the point where the suppliers refused to deal with them. Both parties welcomed MES to take over the
relationship in the hope to salvage what otherwise had been good business for both.
The average US manufacturer spends roughly half of its revenue to purchase goods and services3 which
makes their success very much dependent on the performance of their suppliers. By the time our clients
engage us, they are already convinced of the advantage of outsourcing and they usually have a good idea
of what constitutes “best value”, typically:
Cheaper (pursuing the lowest cost),
Better (achieving the best quality possible) and
Faster (minimize lead times).
This, combined with not having to deal with the hassle of directly interacting with the manufacturers:
government regulatory risk, enforceability of contracts, protection of IP, business ethics and cultural
differences.
2 K. Bradsher, India’s Manufacturing Sector Courts the World, but Pitfalls Remain In NY Times, Oct. 14, 2015
3 Damien R. Beil, Supplier Selection in Wiley Encyclopedia of Operations Research and Management
Science, edited by J.J. Cochran, John Wiley & Sons, 2010
| MES Inc.
The dynamics are particularly complicated when customers are looking for low and medium volumes
because it is hard for them to delineate where exactly on the arm’s- length-partnership relationship model
continuum they should focus their energy.
Cheaper
In the last 10 years, there have been significant changes in the structure of direct manufacturing cost
(chart 2). The cost of labor in China more than doubled, from 5.2% of the total direct manufacturing cost
to 10.6% while in India, it has decreased from 6.1% to 5%. The BCG Global Manufacturing Cost
Competitiveness4 from 2014 lists China, traditionally considered low-cost, as being “Under Pressure”,
proved by the fact that at the factory gate, China’s estimated manufacturing cost advantage over the US
has shrunk to less than 5%. By contrast, India is listed as “Holding Steadily”5 due to a rapid productivity
growth and a depreciating currency, which have helped control costs. Although in India the average
manufacturing wages doubled compared to 2004, the spike was offset by productivity gains and by the
rupee’s devaluation. When adjusting for productivity, however, the wages have been flat. The Indian
Rupee depreciated by 30% against the USD from 2006 to 2015 (chart 3). These advantages are however
overshadowed by: over bureaucratic labor laws, double standards for household and industrial energy
prices, poor performance in relevant rankings (logistics performance, corruption perception and ease of
doing business – see ANNEX).
In both countries, the cost of energy increased making it so that natural gas and energy jumped in China
from 3.20% in 2004 to 6.50% in 2014 and in India, from 2.60% in 2004 to 4.20% in 2014 of the direct
manufacturing cost.
It is important to note that despite some annual or seasonal variations, there is no change in the structure
for US direct manufacturing cost. The US did see an increase of wages in this interval but it was
counterbalanced by a simultaneous increase in productivity. Also, they were able to fully take advantage
of the shale gas boom while other countries lagged behind.
Chart 2 gives a good picture of the changes of structure in the Direct Manufacturing Cost in China and
India compared to the US but omits to present the evolution of the price of raw materials. By looking at
our own data and commodities sold, raw materials in China and India in 2014-2015 took anywhere from
26% to 53% and have not really followed the real price of the metals, nor is there a significant difference
based on volumes. For China, there is a simple explanation – economy of scale doesn’t work like in the
rest of the world because the prices of the raw materials are controlled at national level and sold at
roughly the same price irrespective of volume.
4 BCG: How Global Manufacturing Cost Competitiveness Has Shifted over the Past Decade 5 BCG: India’s Manufacturing Cost Competitiveness: Holding Steady

| MES Inc.
Chart 2: Comparative Changes in Direct Manufacturing Costs from 2004 to 2014
Source: BCG
Raw Materials as % of the Direct Manufacturing Cost
Source: MES data based on main commodities sold in 2014-2015 originating from China and India

| MES Inc.
After years of artificial appreciation, China has waged a currency war on August 11, when the Chinese
government adjusted its currency policy to allow the Chinese Yuan/ Renminbi (CNY) to be influenced by
the open market and consequently to depreciate (chart 3, graph 1). Financial analysts sustain that this
depreciation will continue and steepen by mid-2016 part of the Government initiative to salvage the
Chinese economy. An aggressive depreciation of the renminbi would give China a significant trade
advantage. August also brought a drastic decrease in the price of most metal commodities.
The Indian Rupee (INR), on the other hand, has been depreciating for 7 consecutive years hitting a
historical low in August. Similarly to China, the continuous depreciation is good news for exporters and
for the manufacturing industry.
Chart 3: Comparative evolution of the CNY and INR
From 2004 to present (left) and last 2 months (right)
Graph 1: CNY
Graph 2: INR
Source: Oanda

| MES Inc.
Raw materials
China is the largest consumer of metals from iron ore to copper and its economic
slowdown influenced downwards the global price of metal commodities and consequently of most
output commodities. In the last 5 years, the rapid expansion of the manufacturing industries
requiring aluminum, copper and steel have led to excess capacity. The over production and stocks
are now affecting the price of the commodities worldwide. Between 2011 and 2014 Chinese prices
for metal commodities (aluminum, copper, and zinc) have been significantly higher (up to 33%)
than in India and the US. Starting May 2015, the gap has been narrowing to the point where in
August both Asian countries registered the same price/kg for aluminum ingot: $1.88, a 14 cent
difference in the price/kg of copper (2%) and an 18 cent difference in the price/kg of zinc (7%) (See
charts 4-6)
In August 2015, the Chinese exports of aluminum decreased by 12% compared to the same period
the previous year and both copper and zinc hit historically low prices these past two months.
China consumes 45% of the copper outputs, compared to only 2% India. The estimated demand
forecast in China for the next two years varies from 0% to a more optimistic 3% and is attributed to
the construction sector and the electricity infrastructure development plans on the one hand and
the renewable energy projects (solar and wind) on the other. In the meanwhile, the closure of mines
in Africa are planned to reduce the supply of copper, zinc and lead 6 . Following the first
announcements the price have risen. But the excess stocks will continue to drive the prices down for
the close future. The copper price case is very close to that of the gas prices, making it more viable
to keep mines running at a loss rather than closing them down. Despite growing domestic smelting
capacity in China, imports remain an important copper source to supply domestic markets.
Direct labor cost
The national average labor cost is $0.92/hour in India and $3.52/hour in China, but manufacturers
outside the more established areas will have lower costs: manufacturers in the Chinese hinterland
will have up to 30% lower labor costs than the coastal provinces. In India, there is a wide regional
range for manufacturing, from $0.49/ hour in Punjab to $1.20/hour in Maharashtra7. However, when
adjusted for productivity, the balance shifts back in China’s favor.
Overhead
Industrial electricity prices vary throughout the provinces/states of China and India. For China, it is
very hard to accurately identify the differences in tariffs since there may be more than 1,000
different fees in existence in different parts of the country8. The prices of electricity are established
at a national level, but are strongly influenced by the local authorities which frequently offer
discounts to large consumers. The price of the electricity is pegged to the price of coal, adjusted
yearly to hedge against fluctuations of the latter. Non-ferrous metal smelting and pressing –
including aluminum – is the third-largest consumer of electricity in China after steel production and
chemical products. If market reforms to electricity pricing continue, this will likely lead to higher
prices. Higher prices will be an additional challenge to a manufacturing sector already struggling with
rising labor, capital, and exchange rate costs.
6 Red Scare in The Economist, Oct 3, 2015 7 Unskilled labor as reported by http://www.paycheck.in 8 http://www.wantchinatimes.com/news-subclass-cnt.aspx?id=20130515000080&cid=1102
| MES Inc.
In China, where the government has historically subsidized the industrial sector with low electricity
prices, the average electricity tariff (2013) per kwh is 10.81 cents, 2.7 cents less than in 2012. Gas
prices for industry average at 4.88 cents in 2013, .58 cents more than in 20129.
In India, while the average tariff (2012) per kwh is 8 cents, in Jammu and Kashmir the price is 3 cents
while at the other end, Bihar registers a high of 12 cents, almost 30% higher. India’s electricity sector
is monopolized by state-owned enterprises, both at the central and provincial levels.
Delivery
The World Shipping Council, lists 10 Chinese ports in the Top 50 World Container Ports10 by 2013
volumes with an average of 14.77 million TEU. Meanwhile India which has roughly 13 commercial
ports, is listed with only one port accounting for 4.12 million TEU. If we consider the cost of exporting
a container, China leads in 2014 with $823/container while India lags behind at $1,332/container.
Infrastructure, bureaucracy and corruption related problems will add significantly to those costs in
both countries.
Customs
Custom duties, assigned to the harmonized tariff number (HTS) of the shipment can vary from 0%
to more than 30% based on the commodity. For example, for imports of aluminum extrusions from
China, the Department of Commerce established antidumping duty margins of 33.28%, and
countervailing duty margins of 8.02% to 374.15%. Benefiting from GSP (Generalized System of
Preference) tariffs, aluminum extrusion from India are subject to a 0% duty fee. Similarly, Refined
Copper profiles from China are applied a 3% duty rate while those from India, 0%.
In 2013, following a decision of the WTO, China eliminated export quotas and duties on raw
material inputs including steel and aluminum11 and in May 2015 the export duties on rare earths,
tungsten and molybdenum, which are key inputs for electronics, automobile and renewable energy
industries12. The Chinese government provides export subsidies to some industries to some of its
domestic industries including automobile and automobile parts enterprises, however, the
complete list of subsidies maintained by central, provincial and local governments is unknown13.
Similarly, the Indian government also provides export subsidy for exporters from the Special
Economic Zones (SEZ), as well as pre and post shipment financing to exporters at a preferential
rate.
9 Enerdata – Energy Report – China March 2015 10 http://www.worldshipping.org/about-the-industry/global-trade/top-50-world-container-ports 11 WTO DISPUTE SETTLEMENT: DISPUTE DS437, United States — Countervailing Duty Measures on Certain Products from China, https://www.wto.org/english/tratop_e/dispu_e/cases_e/ds437_e.htm 12 WTO DISPUTE SETTLEMENT: DISPUTE DS431, China — Measures Related to the Exportation of Rare Earths, Tungsten and Molybdenum, https://www.wto.org/english/tratop_e/dispu_e/cases_e/ds431_e.htm 13 The 2014 National Trade Estimate Report on Foreign Trade Barriers (NTE), http://www.sice.oas.org/ctyindex/USA/USTR_Reports/2014/NTE/2014%20NTE%20Report%20on%20FTB.pdf

| MES Inc.
Better
Quality is particularly important to buyers because it has an avalanche effect: the reputation of an OEM
can be ruined by the poor performance of an assembly with faulty parts.
The quality of the products that foreign suppliers provide is directly proportional to the thoroughness and
resources (time, know-how etc.) invested in the relationship with the supplier. Theory and practice both
show that there is a higher quality risk when firms outsource and even greater when they outsource in
foreign countries. This is not necessarily because of the physical distance but because of the
culture/language differences. It is difficult to manage quality from afar but that does not mean that firms
should not outsource; however, they should plan for additional internal costs of prevention and quality
interventions as well as an increased risk of quality failures.
Some companies sourcing from China, have reported problems with the so-called “Quality Fade”14 which
has become more of an urban legend than anything else since very few companies have had success
stories in addressing the problem and reverse it. Quality fade is partially the result of the pressures buyers
exert on the suppliers to reduce costs. The latter will say they are forced to cut corners in order to be able
to maintain prices low. The quality fade is very difficult to identify and by the time the buyer finds out, it
is usually is too late. Some suppliers will send perfect samples but as they fulfil the orders they will
gradually adjust the quality and quantity of the raw materials and when it comes to metal commodities,
it is very easy to change alloys or alter materials. Sometimes, by the time the clients catch it the parts have
already entered their production and the harm is either not considered sufficient for a recall or rectifying
it is considered too resource intensive. Only when the buyer has enough leverage (usually translates in
high order volumes) will the supplier agree to rectify the problem at its own expense. This obviously poses
a big risk to companies interested in sourcing low/medium quantities. Two possible solutions have been
found:
The first solution has been employing third party testers but there are two risks involved in this case as
well:
The inability of the third party tester to identify the flaw if it doesn’t know what to look for.
Most tests are designed to give you a specific information about a product (i.e. raw materials).
Unless you know exactly what you are testing for you will not catch the glitch and testing for
everything is not feasible.
The possibility of the supplier to bribe his way out of it. While we have not faced such a problem
in dealing with the Chinese suppliers, there are almost urban legends of third party quality
engineers being on the pay rolls of the suppliers. In relation to this, see corruption index in
annexes.
14 Paul Midler, Dealing With China’s “Quality Fade” in Forbes, July 2007 Paul Midler, Poorly Made in China, John Wiley & Sons, 2011, pp.95-97
| MES Inc.
The second is to contract only those suppliers that seem large and capable enough but this automatically
puts the price significantly higher than the smaller manufacturers mainly because they are more likely to
have made investments in the plants and they will inflate the prices to make up for it.
With feet on the ground, especially for the quality team, the client should be able to ensure:
Product testability – ideally, inspecting a large number of units for as many defect types as
possible, recording it, and ensuring training for both coverage (inspect every single unit) and
thoroughness (ease of inspecting a unit for every type of defect);
Joint problem solving / audits with as many employees involved from both parties, performing
quality inspections with senior management and following-up;
Empower the quality department – giving them ample space and authority to solve problems pre
and post production;
Introduce a “carrots and sticks” system where the supplier can be penalized for defects and
rewarded for quality.
Faster
According to the World Development Indicators Published by the World Bank15 the average time to clear
exports through customs was 8 days in China in 2012 (last data available) and 6 days in India (data available
only for 2014). The lead time to export in days intended as the median time from shipment point to port
of loading was 2 days both in China and India in 2014. Since we don’t have comparative data we rely on
our own experience which taught us that the average difference in lead time can easily reach 7-8 days in
China’s favor. It can be attributed to the deficiencies in local transportation, bureaucracy or the
unavailability of express release in most of Indian states. Bottlenecks in India’s ports add days to shipping
times. In fact, the gap in the infrastructure level of the two countries remains significant. The Chinese
government understood the importance of infrastructure for economic development and started early
building roads, railways, expanding port capacity, etc.
In terms of documents needed to export, potentially contributing to the lead times, China requires 8 and
India 7. Again, from our experience, the fact that India requires one less document compared to China,
does not necessarily imply a more expedited process. On the contrary, bureaucracy in India makes these
documents hard and time consuming to obtain. Despite these factors, overall, The World Development
Indicators rate the efficiency of the customer clearance process on a scale from 1 to 5 (where 1 is low and
5 is highly efficient) and positions India at 2.72 and China at 3.21 in 2014.
15 http://data.worldbank.org/indicator/LP.EXP.DURS.MD/countries

| MES Inc.
Sourcing Scorecard
In lieu of a conclusion, please note that some of our observations can be subjective and pertinent to the
industries we serve. Companies will put emphasis on different factors based on the specificity of their
sourcing strategies. In the triangle low cost-high quality-low lead time, one will always have to make trade-
offs, sacrificing one for the sake of the other. The reader will perceive this paper through his company’s
own trade-off prism.
We are aware that in the case of these two +1B people countries, there are huge development disparities
and in the case of India also linguistic and cultural. The little information available at the level of the single
state doesn’t allow a coherent benchmarking. Most aggregated data will be significantly influenced by the
outliers of development (whether highly developed or underdeveloped states). Companies not always
understand that there is no China or India as investment destinations but tens of different local realities
and that their decision should be based on a narrow analysis of the specific geographical areas that best
meet their needs in terms of: tax policies, infrastructure, labor costs, etc.
The alarming news regarding China’s slowdown disregards the fact that it is easy to grow fast from a low
base. China, is still growing at a 6.8% rate. While it is at a historical low since 2009, the Chinese GDP is
expected to be in 2015, 3 times that of India (in absolute $ amount), which is reported to have grown by
7.3%. Comparatively, that of the United States, slightly lower than the Chinese one, is forecasted for 2015
to reach a 2.6% growth, the highest after the financial crisis16. As you can see, China is still growing, not at
the same pace but significantly more than its competitors and that is remarkable.
It is still possible to pursue low cost sourcing in both countries but the oversaturated areas, while more
business friendly, will no longer satisfy some of the foreign investors. However, nothing we have seen
thus far can fully justify the choice of some companies to bring back production in the US and Western
Europe. On the contrary, the new Chinese currency policy and the plan to salvage the Chinese economy
through currency depreciation, as well as, the resolve of the Indian government to promote “Make in
India” and sustain it through infrastructure investment and legislation are all signs that Asia will remain
the sweetheart of manufacturing.
16 IMF, World Economic Outlook via Knoema http://knoema.com/IMFWEO2015Oct/imf-world-economic-outlook-weo-october-2015
| MES Inc.
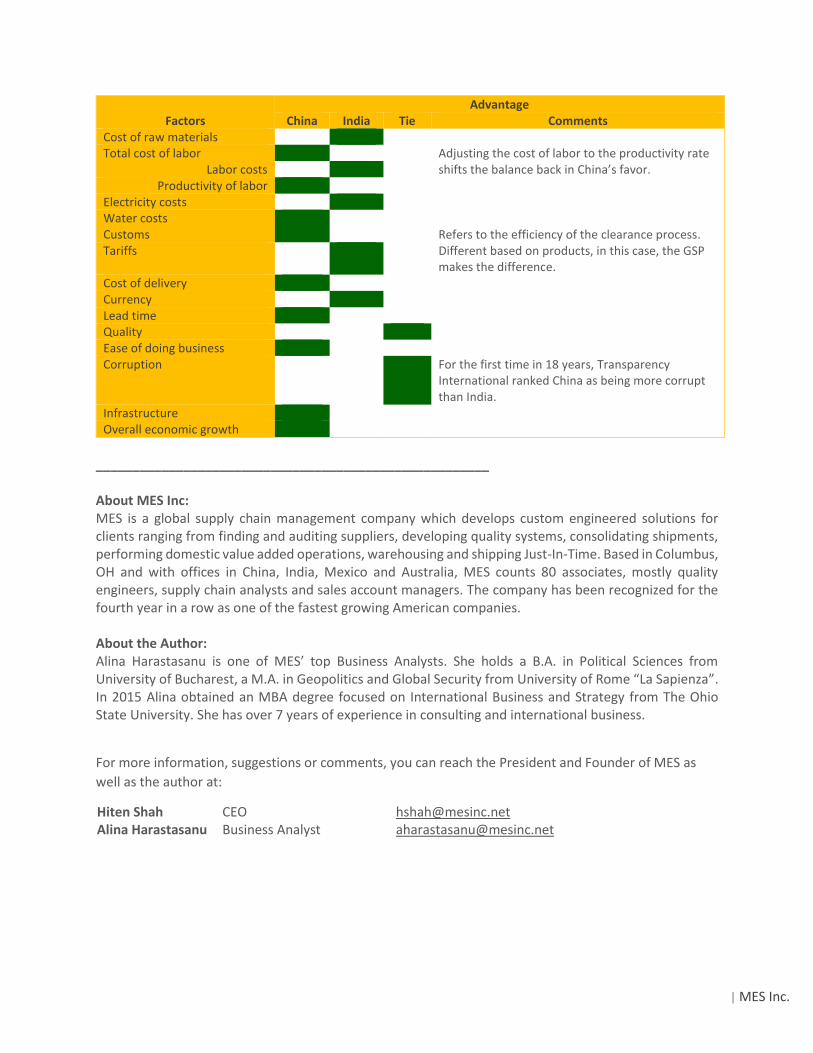
Factors
Advantage China India Tie Comments
Cost of raw materials Total cost of labor Adjusting the cost of labor to the productivity rate
shifts the balance back in China’s favor. Labor costs Productivity of labor
Electricity costs Water costs Customs Refers to the efficiency of the clearance process. Tariffs Different based on products, in this case, the GSP
makes the difference. Cost of delivery Currency Lead time Quality Ease of doing business Corruption For the first time in 18 years, Transparency
International ranked China as being more corrupt than India.
Infrastructure Overall economic growth
______________________________________________________ About MES Inc: MES is a global supply chain management company which develops custom engineered solutions for clients ranging from finding and auditing suppliers, developing quality systems, consolidating shipments, performing domestic value added operations, warehousing and shipping Just-In-Time. Based in Columbus, OH and with offices in China, India, Mexico and Australia, MES counts 80 associates, mostly quality engineers, supply chain analysts and sales account managers. The company has been recognized for the fourth year in a row as one of the fastest growing American companies. About the Author: Alina Harastasanu is one of MES’ top Business Analysts. She holds a B.A. in Political Sciences from University of Bucharest, a M.A. in Geopolitics and Global Security from University of Rome “La Sapienza”. In 2015 Alina obtained an MBA degree focused on International Business and Strategy from The Ohio State University. She has over 7 years of experience in consulting and international business.
For more information, suggestions or comments, you can reach the President and Founder of MES as
well as the author at:
Hiten Shah CEO [email protected] Alina Harastasanu Business Analyst [email protected]

13
ANNEXES
Chart 4: Comparative historical price of aluminum ingot in China/India/US in $/kg
Sources: SMM, MCX India, Oanda
Chart 5: Comparative historical price of copper in China/India/US in $/kg
Sources: SMM, MCX India, Oanda

14
Chart 6: Comparative historical price of zinc in China/India/US in $/kg
Sources: SMM, Vincemetals, MCX India, Oanda
Charts 4-6 are adjusted to local currencies on monthly averages
World Bank Logistics Performance, 2014 ranking
Co
un
try
Ye
ar
LPI R
ank
LPI S
core
Cu
sto
ms
Infr
astr
uct
ure
Inte
rnat
ion
al
Ship
me
nts
Logi
stic
s
com
pet
en
ce
Trac
kin
g &
trac
ing
Tim
elin
ess
US
2014 9 3.92 3.73 4.18 3.45 3.97 4.14 4.14
2007 14 3.84 3.52 4.07 3.58 3.85 4.01 4.11
China
2014 28 3.53 3.21 3.67 3.50 3.46 3.50 3.87
2007 30 3.32 2.99 3.2 3.31 3.4 3.37 3.68
India
2014 54 3.08 2.72 2.88 3.20 3.03 3.11 3.51
2007 39 3.07 2.69 2.9 3.08 3.27 3.03 3.47

15
The international score uses six key dimensions to benchmark countries' performance with a score from
1-5 where 1 is low and 5 is high performance.
Source: The World Bank
Corruption Perception Index 2014
Source: Transparency International

16
Ease of Doing Business Index 2014
Source: The World Bank
*Ease of doing business ranks
economies from 1 to 189, with
first place being the best
Industrial electricity prices in China and India $/kwh. Last available data:2012
Country 2013
(rank)
2014
(rank)
US 7 7
China 93 90
India 140 142
Source: Understanding China. A Guide to
Manufacturing Costs, Bloomberg
* in yellow, the provinces of origin of MES’ suppliers
** for the provinces missing, no data available

17
Source: The World Bank via Knoema
* in yellow, the 10 states of origin of MES’ suppliers
** for the states missing, no data available


