Download - What's ahead in 2015 d. broughton

A View From Wall StreetDonald Broughton
Chief Market Strategist, Managing Director
CCJ Spring SymposiumMay 20, 2015
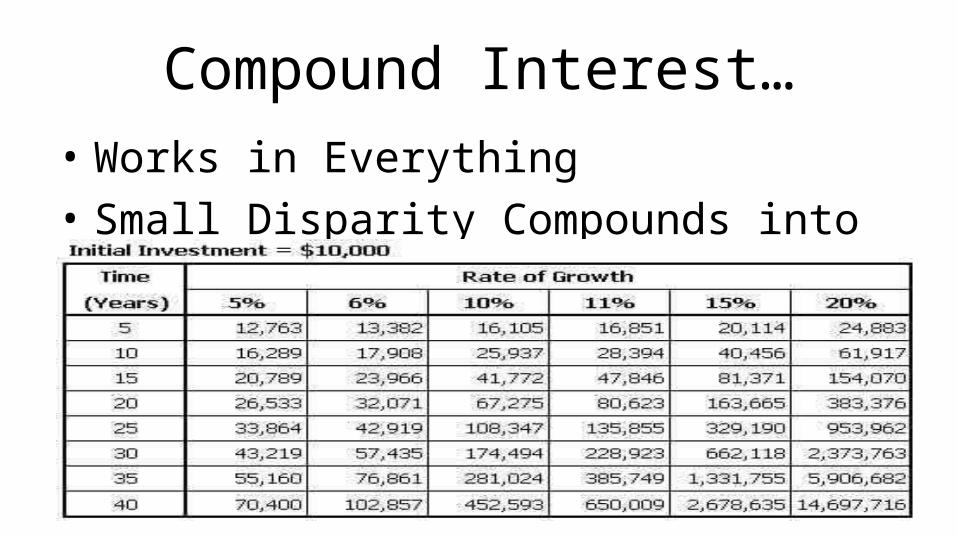
Compound Interest…• Works in Everything• Small Disparity Compounds into Large
Disparity

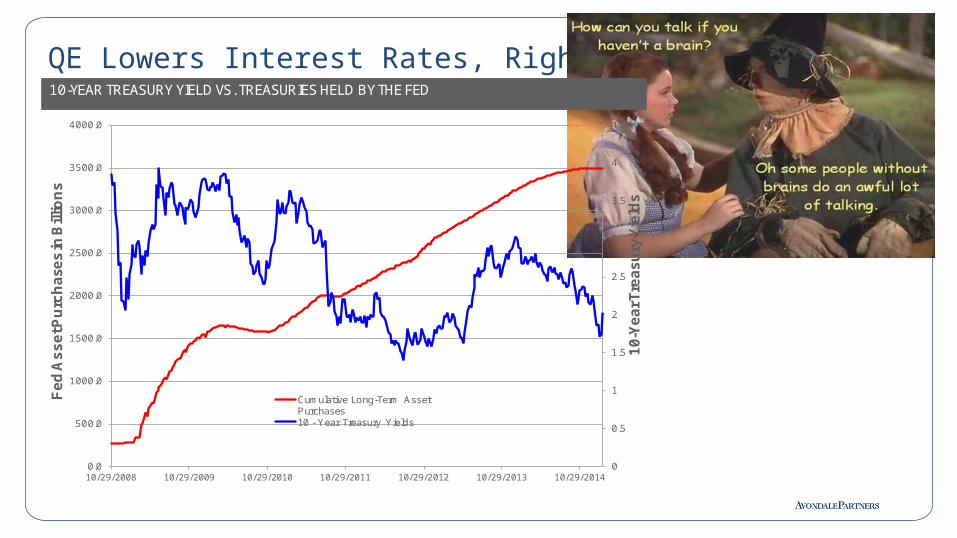
QE Lowers Interest Rates, Right?
0
0.5
1
1.5
2
2.5
3
3.5
4
4.5
0.0
500.0
1000.0
1500.0
2000.0
2500.0
3000.0
3500.0
4000.0
10/29/2008 10/29/2009 10/29/2010 10/29/2011 10/29/2012 10/29/2013 10/29/2014
10-Y
ea
r Tre
as
ury
Yie
lds
Fe
d A
ss
et P
urc
ha
ses
in B
illio
ns
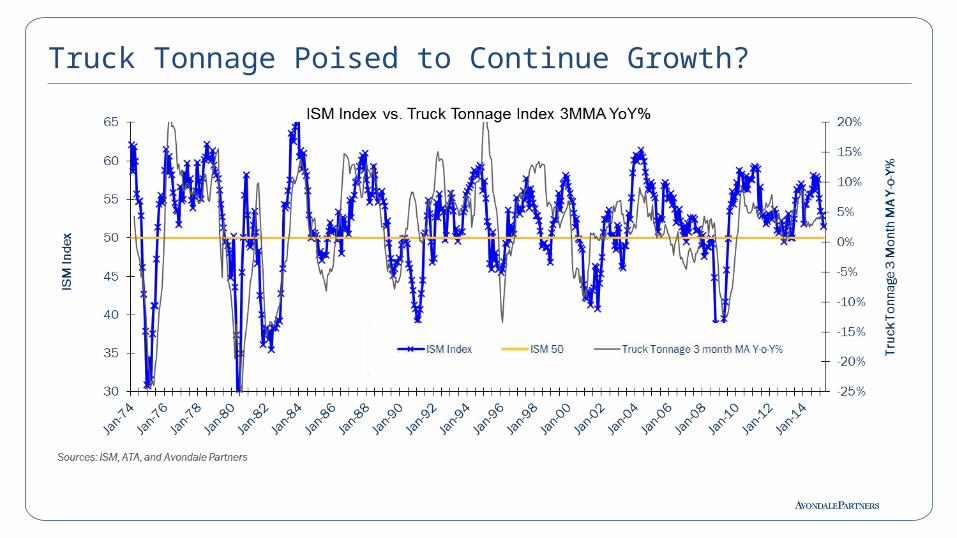
Cumulative Long-Term Asset Purchases10 - Year Treasury Yields
10-YEAR TREASURY YIELDVS. TREASURIES HELD BY THE FED
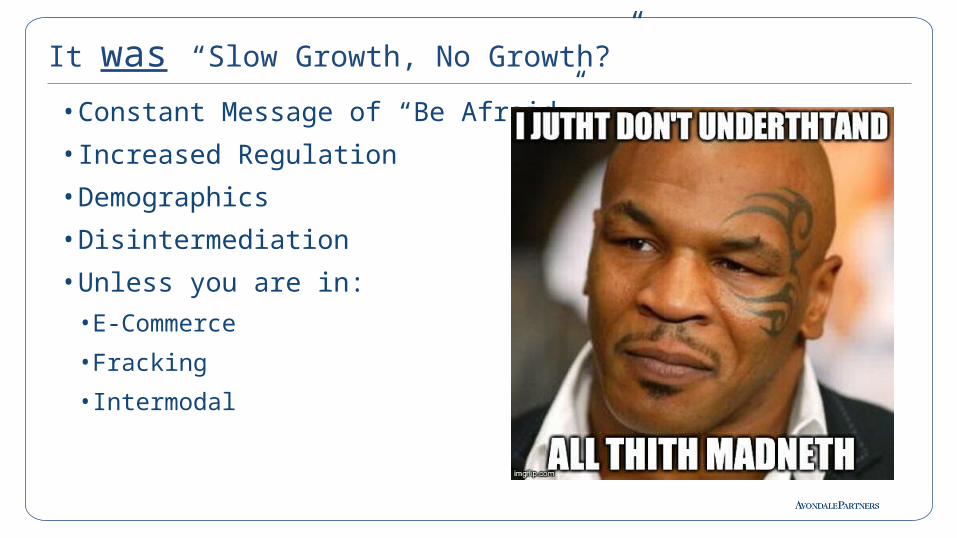
• Constant Message of “Be Afraid”
• Increased Regulation
• Demographics
• Disintermediation
• Unless you are in:•E-Commerce
•Fracking
• Intermodal
It was “Slow Growth, No Growth?”
6
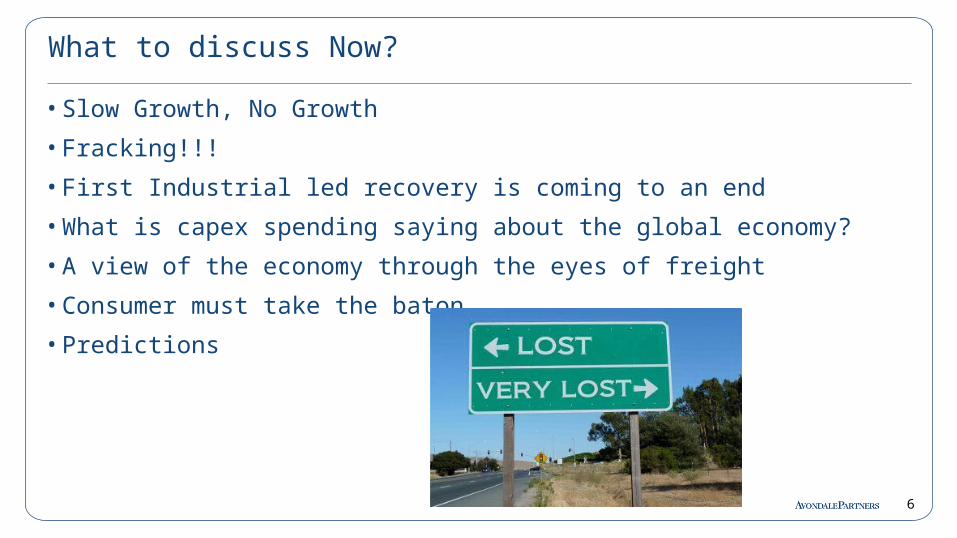
What to discuss Now?
• Slow Growth, No Growth
• Fracking!!!
• First Industrial led recovery is coming to an end
• What is capex spending saying about the global economy?
• A view of the economy through the eyes of freight
• Consumer must take the baton
• Predictions
• How plentiful is the supply
• Why is the price so low?
• Can it stay low for a long time?
Fracking! Oil & Natural Gas – Price / Supply

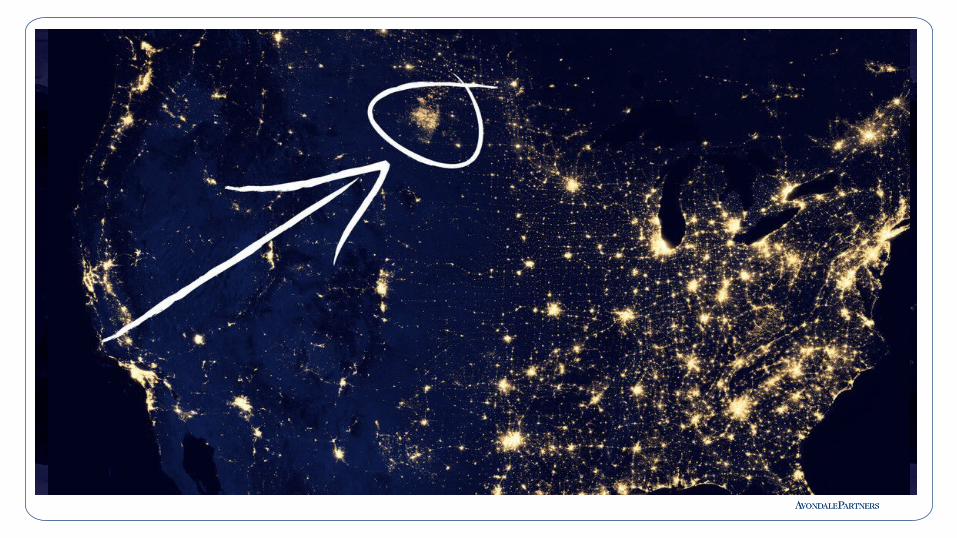
Shale Deposits are Global – Almost Everywhere
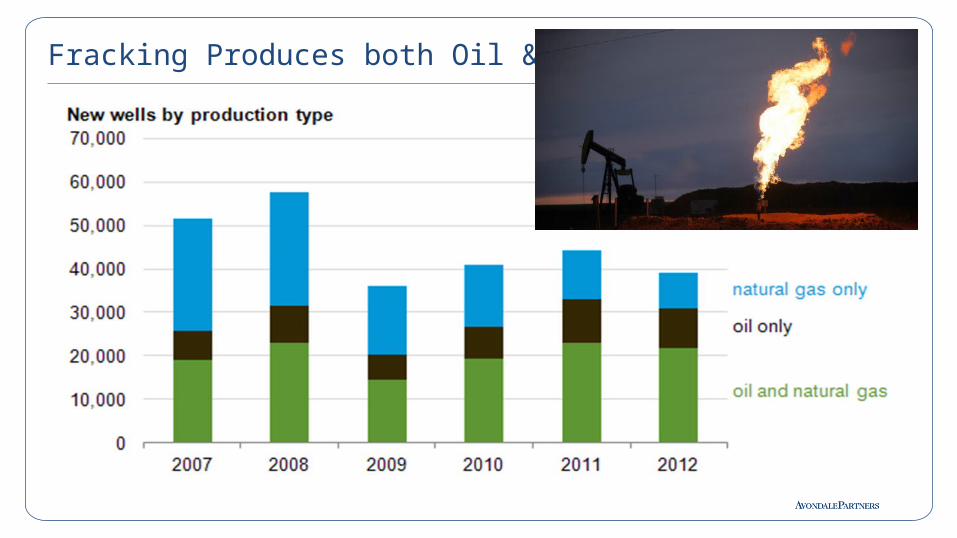
Fracking Produces both Oil & Gas
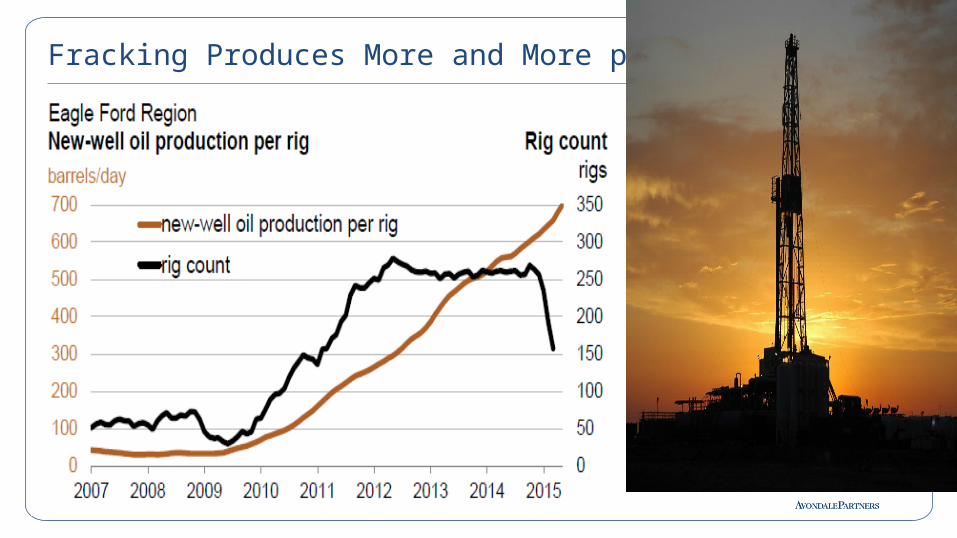
Fracking Produces More and More per Well
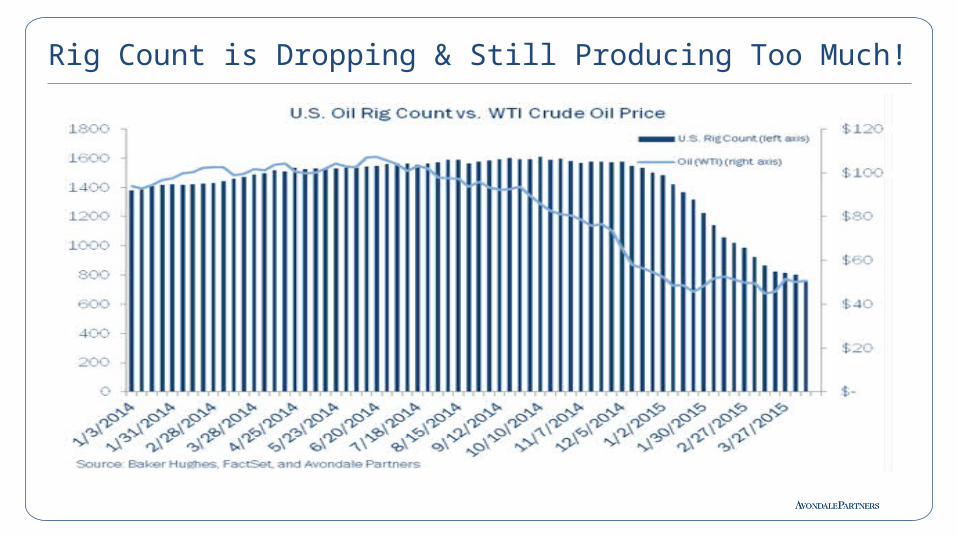
Rig Count is Dropping & Still Producing Too Much!
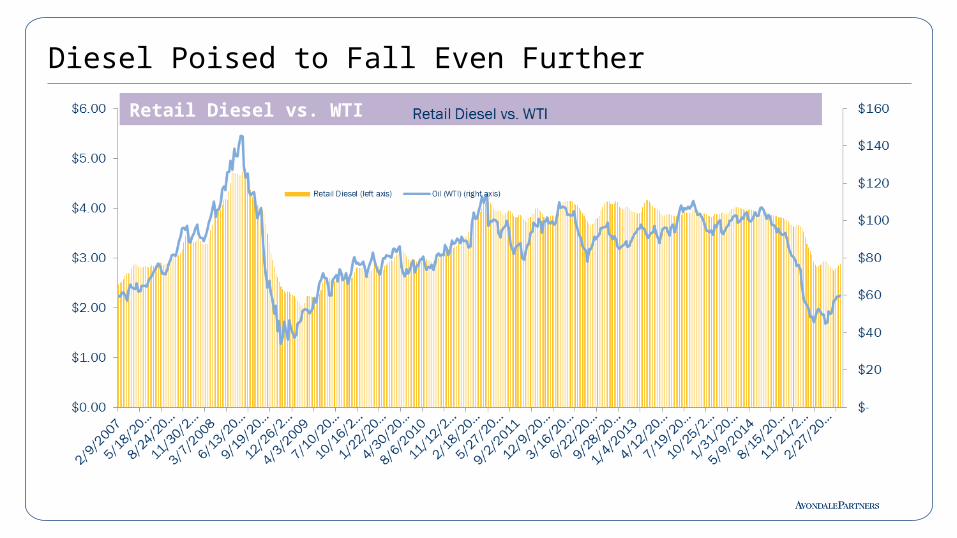
Diesel Poised to Fall Even Further
Retail Diesel vs. WTI

1.05
1.10
1.15
1.20
1.25
1.30
1.35
1.40
1.45
1.50
1.55
1.60
1.65
Source: U.S. Department of Commerce and Bureau of Economic Statistics
Avg'd1.23 from Fall '06 -Fall '08
Avg'd 1.31 last 12 months; currently 1.36
Low of 1.14 in Dec. '05
Inventory to Sales Ratio: ManufacturingInventory to Sales Ratio: Manufacturing

Inventory to Sales Ratio: WholesalersInventory to Sales Ratio: Wholesalers
1.00
1.05
1.10
1.15
1.20
1.25
1.30
1.35
1.40
1.45
1.50
Source: U.S. Department of Commerce and Bureau of Economic Statistics
Low of 1.14 in June '08
Avg'd1.18 from Fall '06 -Fall '08
Avg'd 1.19 last 12 months; currently 1.27
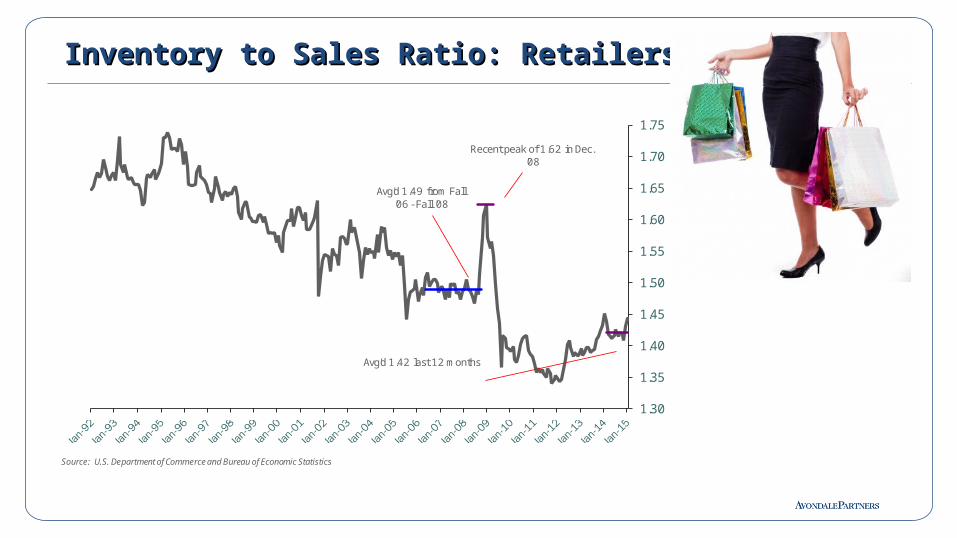
Inventory to Sales Ratio: RetailersInventory to Sales Ratio: Retailers
1.30
1.35
1.40
1.45
1.50
1.55
1.60
1.65
1.70
1.75
Source: U.S. Department of Commerce and Bureau of Economic Statistics
Recent peak of 1.62 in Dec. '08
Avg'd 1.42 last 12 months
Avg'd1.49 from Fall '06 - Fall '08
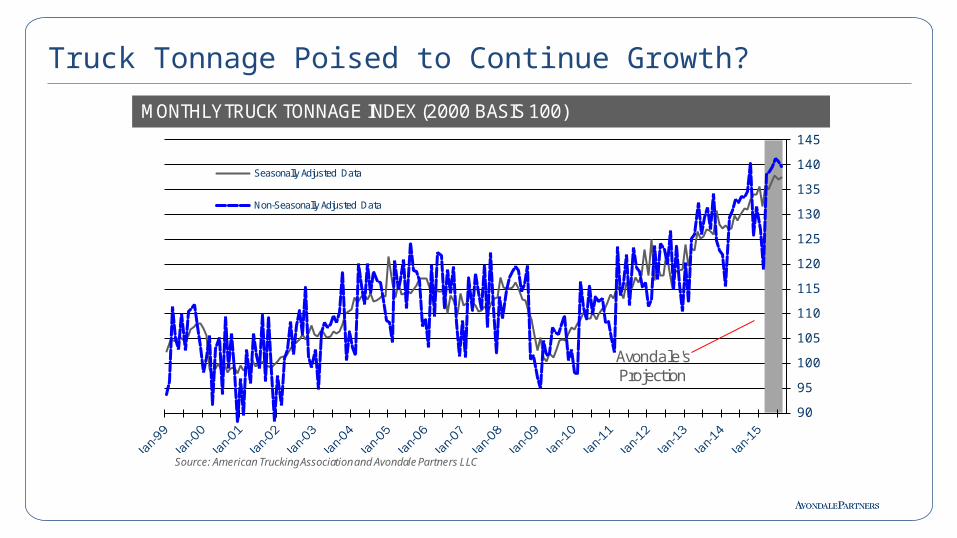
Truck Tonnage Poised to Continue Growth?
90
95
100
105
110
115
120
125
130
135
140
145
Seasonally Adjusted Data
Non-Seasonally Adjusted Data
Source: American Trucking Association and Avondale Partners LLC
Avondale's Projection
MONTHLY TRUCK TONNAGE INDEX (2000BASIS 100)

Truck Tonnage Poised to Continue Growth?
-25.00%
-20.00%
-15.00%
-10.00%
-5.00%
0.00%
5.00%
10.00%
15.00%
-6.0%
-4.0%
-2.0%
0.0%
2.0%
4.0%
6.0%
8.0%
Retail Sales ex Autos and Gasoline (right axis)
ATA Truck Loads (left axis)
Source: American Trucking Associations, BEA and Avondale PartnersLLC

Truck Tonnage Poised to Continue Growth?
Truck Tonnage Poised to Continue Growth?

Truck Tonnage Poised to Continue Growth?

22
Truck Tonnage Still Showing Strength
-15.00%
-10.00%
-5.00%
0.00%
5.00%
10.00%
Tonnage
Total Loads
Dry Van Loads
Source: American Trucking Association and Avondale Partners LLC
ATA NON-SEASONALLY ADJUSTED TRUCK VOLUMES3MMA YoY
23
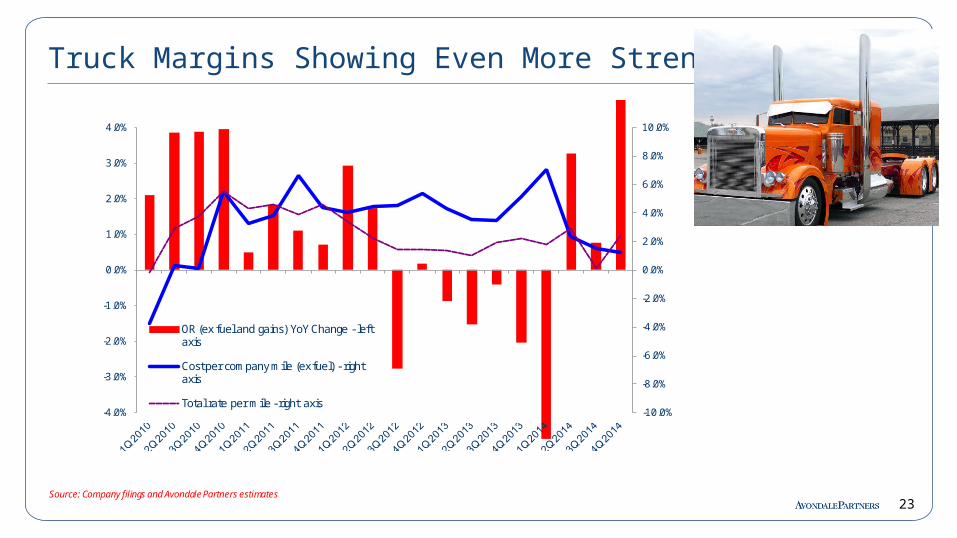
Truck Margins Showing Even More Strength
-10.0%
-8.0%
-6.0%
-4.0%
-2.0%
0.0%
2.0%
4.0%
6.0%
8.0%
10.0%
-4.0%
-3.0%
-2.0%
-1.0%
0.0%
1.0%
2.0%
3.0%
4.0%
OR (ex fuel and gains) YoY Change - left axis
Cost per company mile (ex fuel) - right axis
Total rate per mile -right axis
Source:Company filings and Avondale Partners estimates

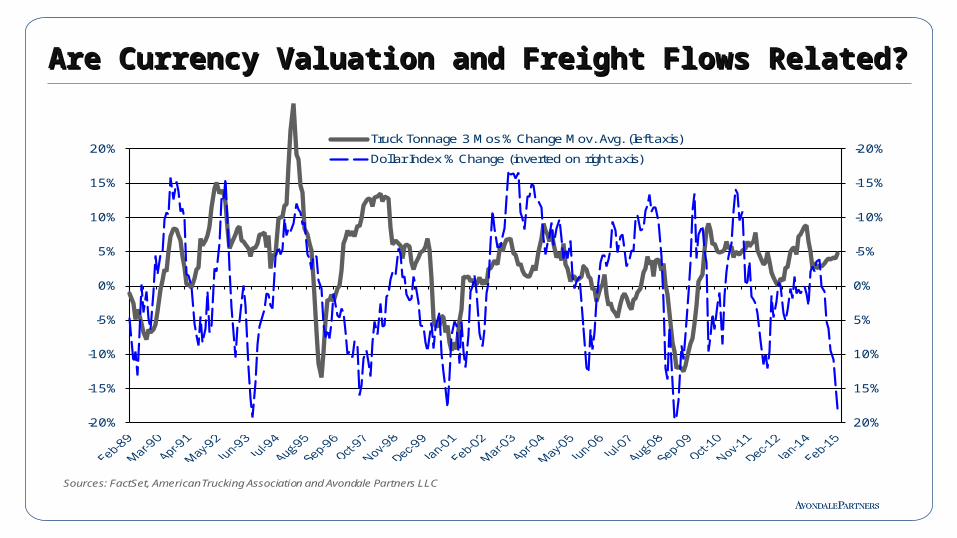
Currency Wars in Full Swing as the Fed is in Retreat
-20%
-15%
-10%
-5%
0%
5%
10%
15%
20%-20%
-15%
-10%
-5%
0%
5%
10%
15%
20%Truck Tonnage 3 Mos % Change Mov. Avg. (left axis)
Dollar Index % Change (inverted on right axis)
Sources: FactSet, American Trucking Association and AvondalePartners LLC
Are Currency Valuation and Freight Flows Related?Are Currency Valuation and Freight Flows Related?
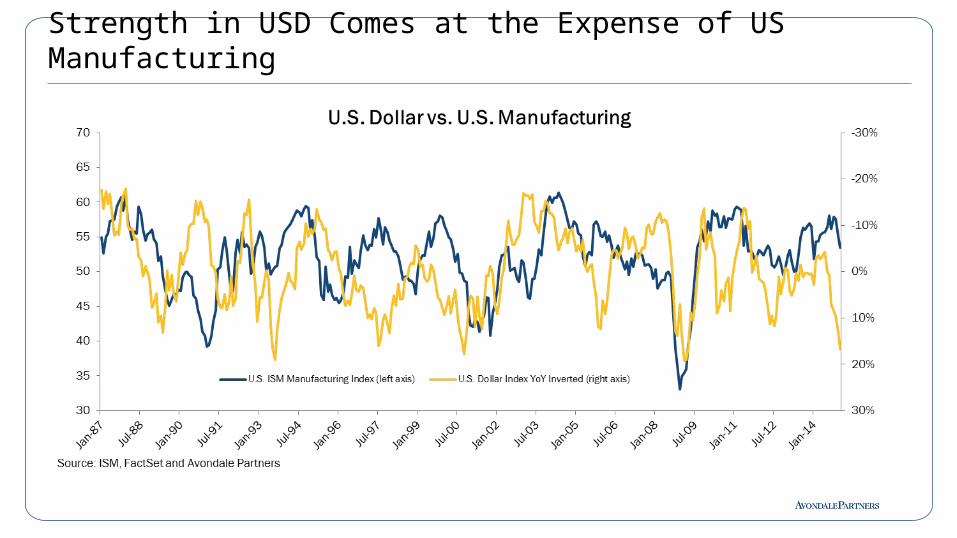
Strength in USD Comes at the Expense of US Manufacturing

Already a Negative Order Trend
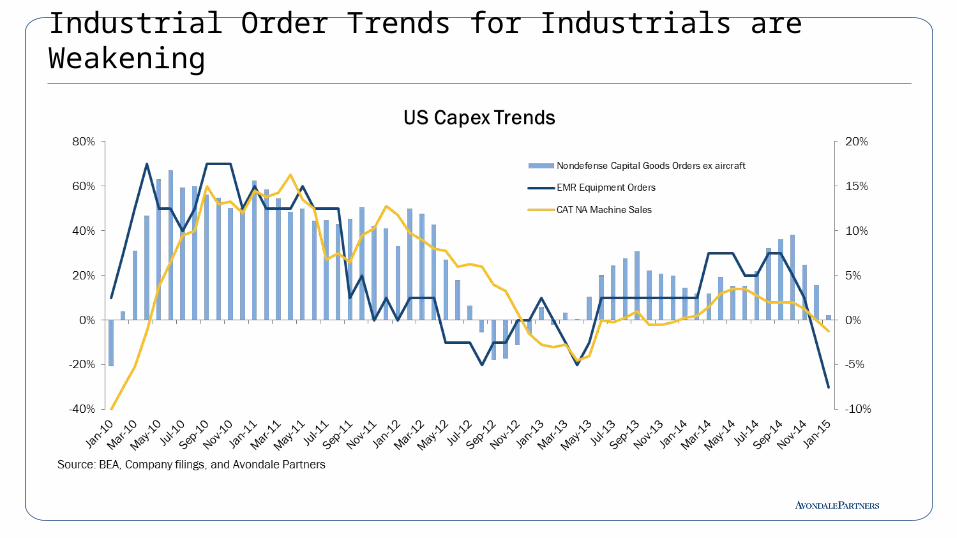
Industrial Order Trends for Industrials are Weakening

But Backlogs Are At All-Time Highs….
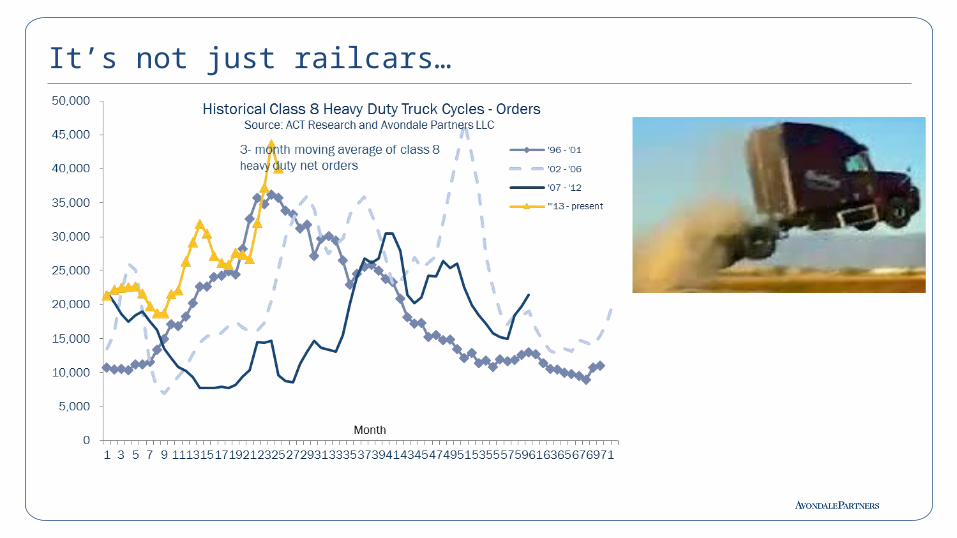
It’s not just railcars…

Even Trailers Too….
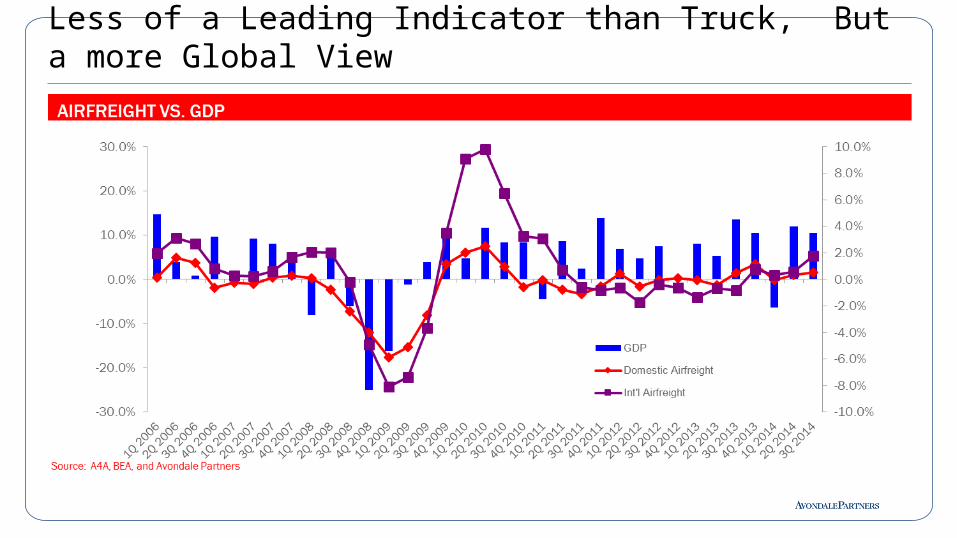
Less of a Leading Indicator than Truck, But a more Global View

The Strategery of Domestic Airfreight has Failed to Rebound
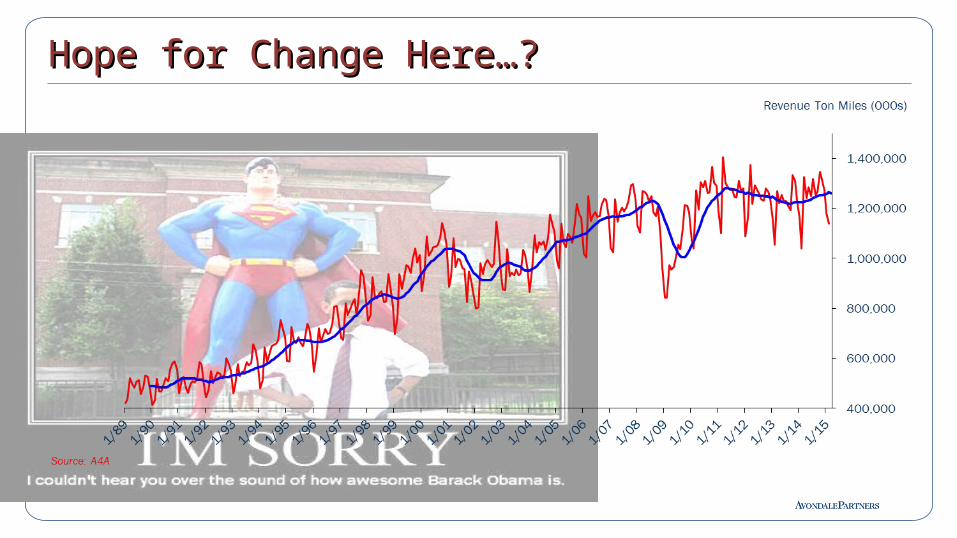
Hope for Change Here…?Hope for Change Here…?
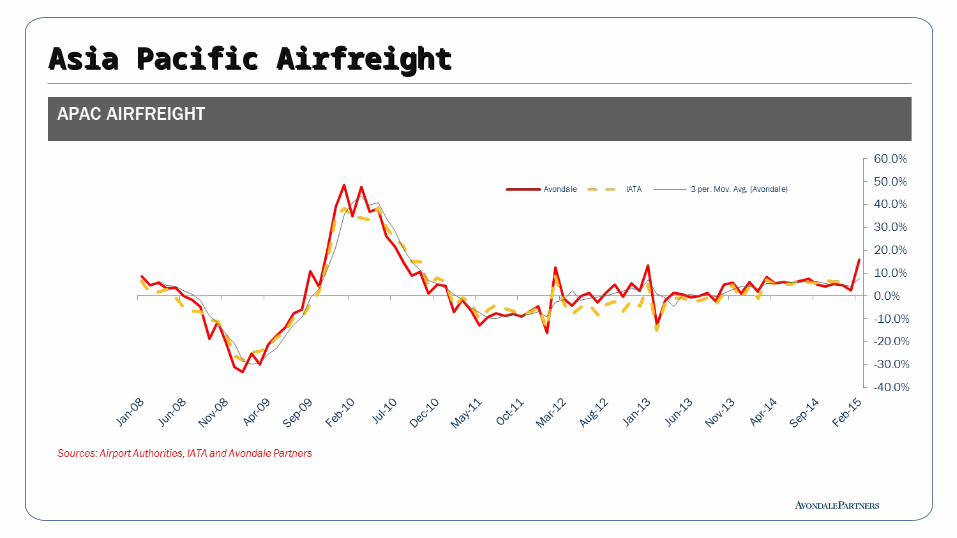
Asia Pacific AirfreightAsia Pacific Airfreight
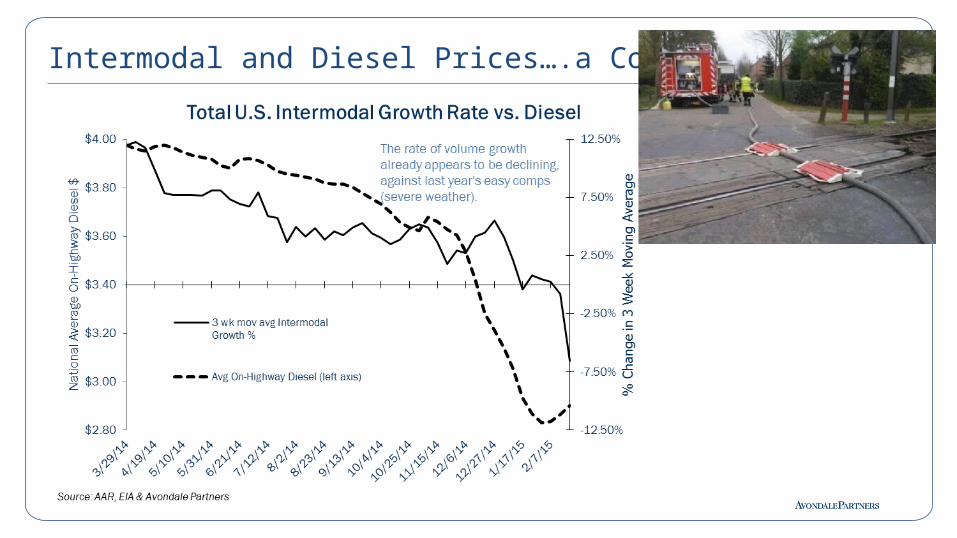
Intermodal and Diesel Prices….a Coincidence?
Intermodal and Diesel Prices….a Coincidence?
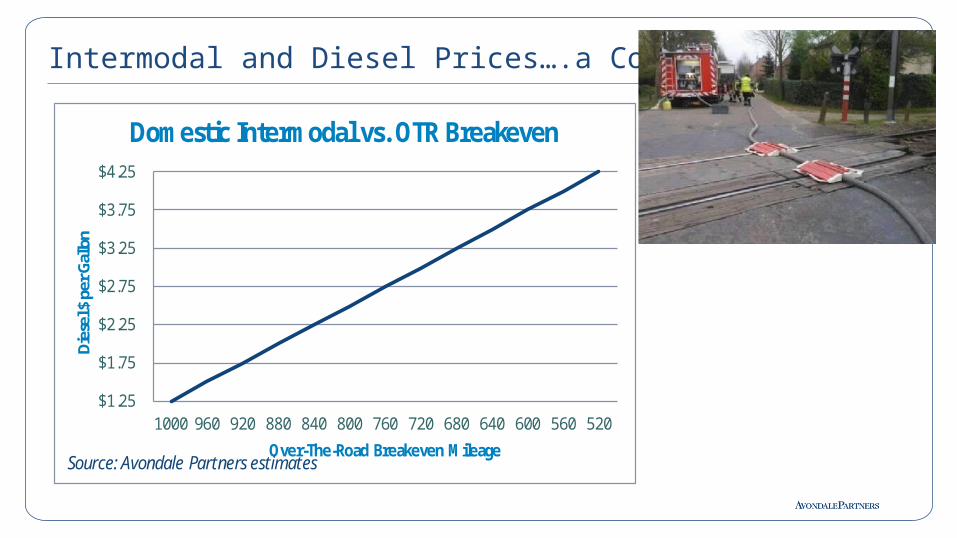
$1.25
$1.75
$2.25
$2.75
$3.25
$3.75
$4.25
1000 960 920 880 840 800 760 720 680 640 600 560 520
Dies
el $
per
Gal
lon
Over-The-Road Breakeven Mileage
Domestic Intermodal vs. OTR Breakeven
Source: Avondale Partners estimates

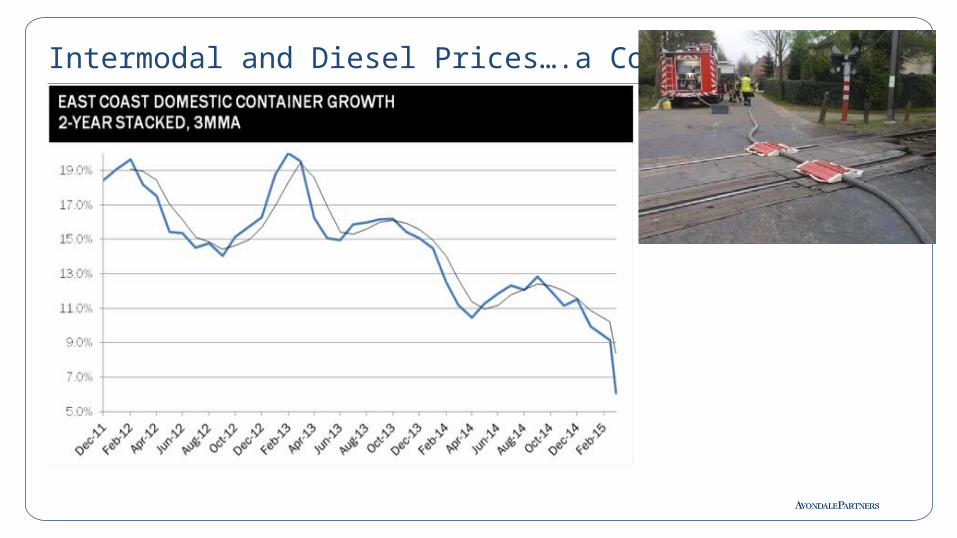
Intermodal and Diesel Prices….a Coincidence?
0.0%
5.0%
10.0%
15.0%
20.0%
25.0%
30.0%
35.0%
40.0%
45.0%
50.0%
<3,000 <2,500 <2,000 <1,500 <1,000 <500 <100
Truckload Demand by Length of Haul
Source: Avondale Partners estimates
Intermodal and Diesel Prices….a Coincidence?
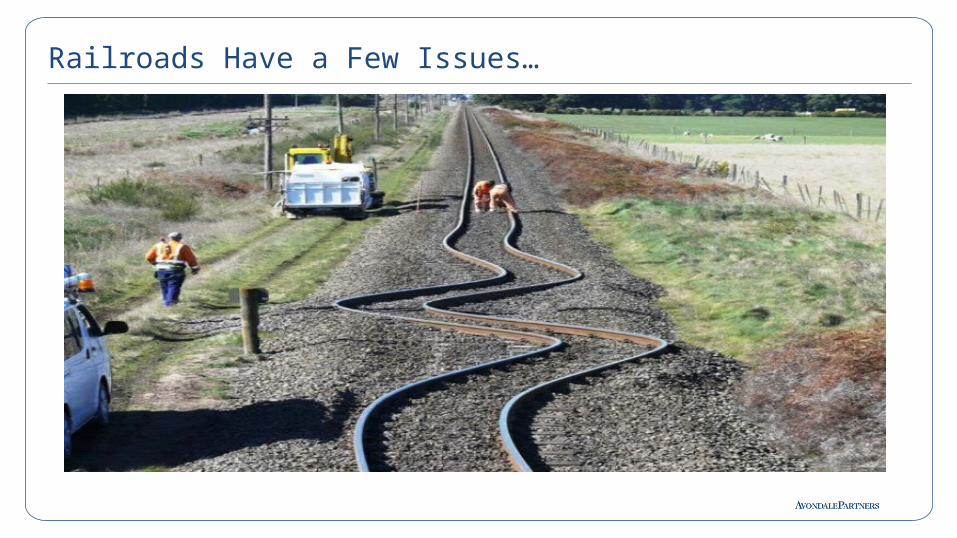
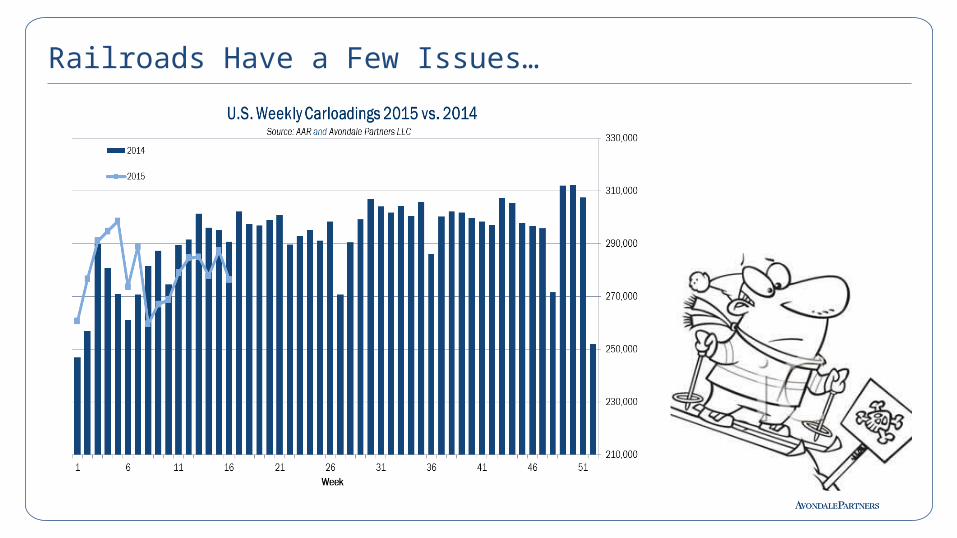
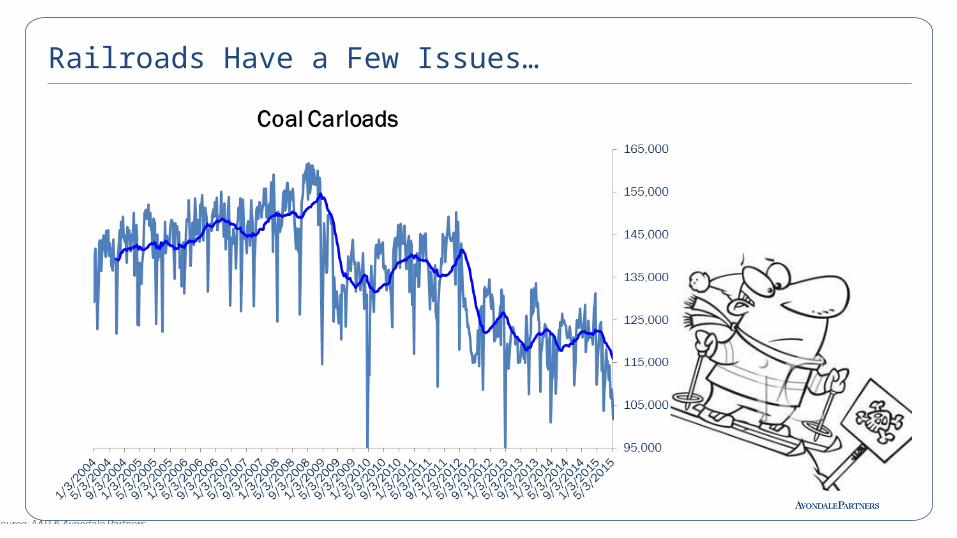
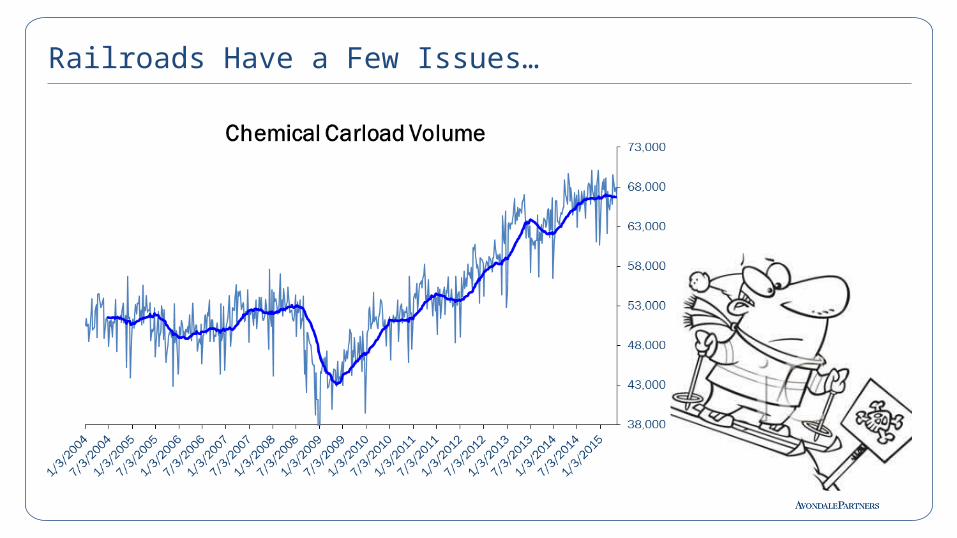
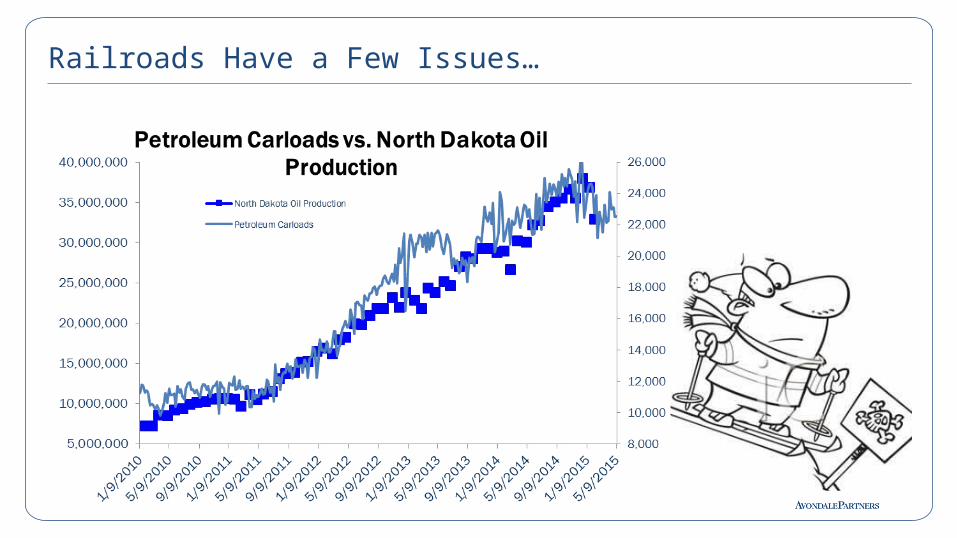
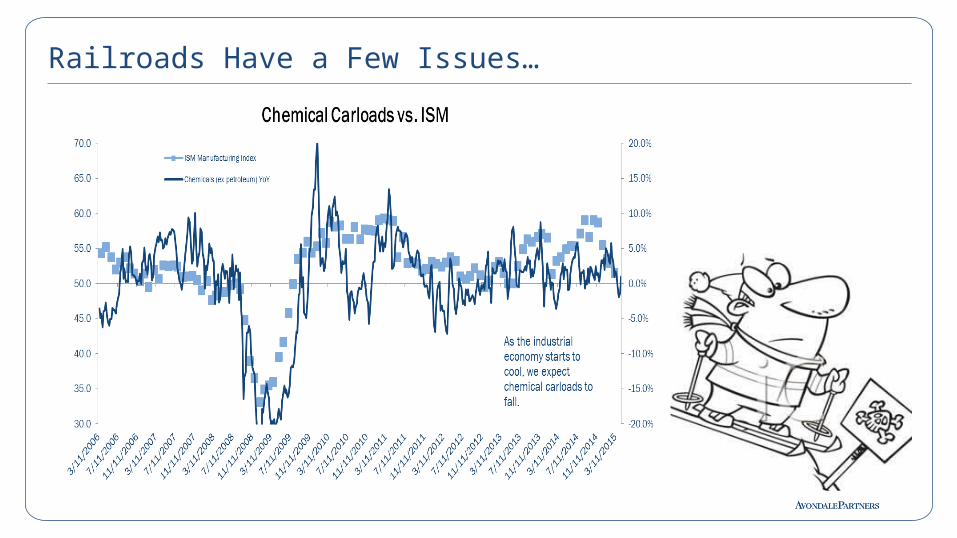
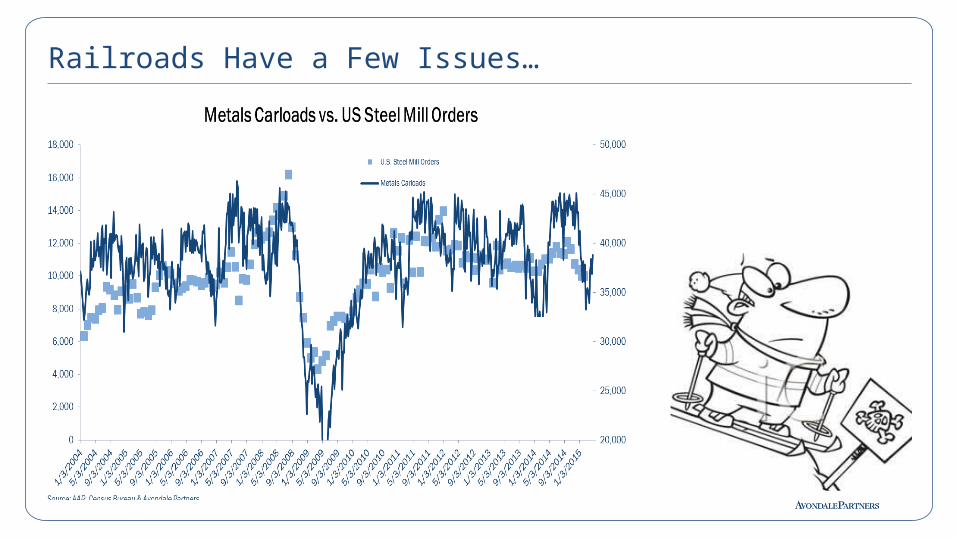
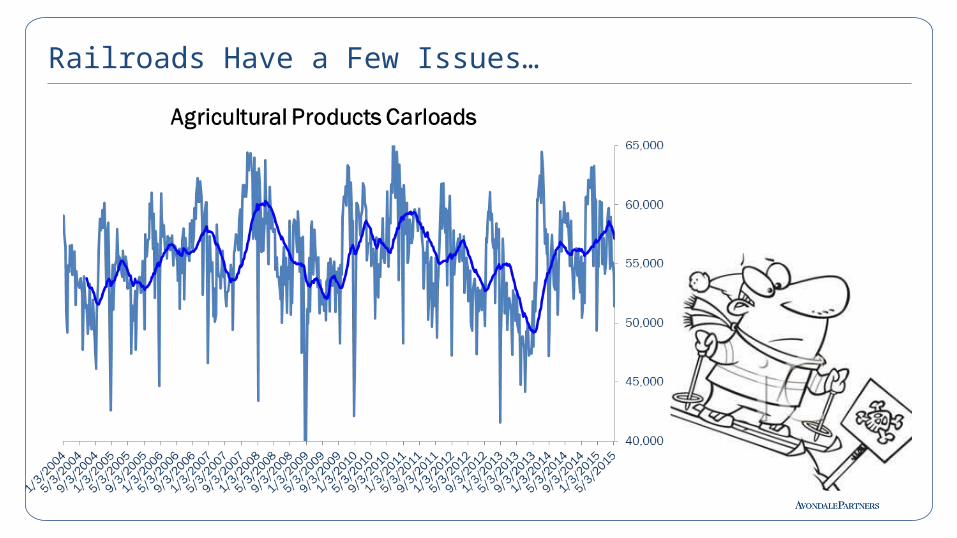
Railroads Have a Few Issues…
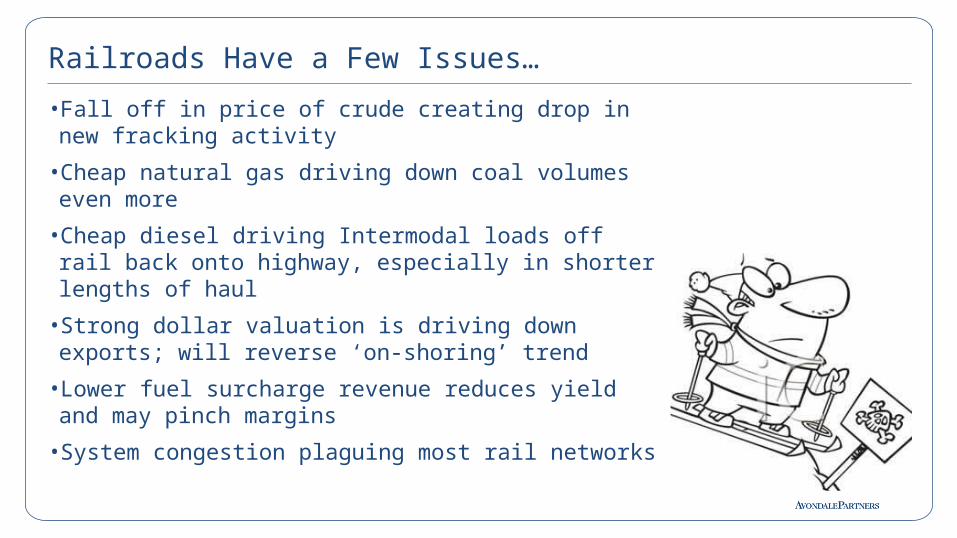
•Fall off in price of crude creating drop in new fracking activity
•Cheap natural gas driving down coal volumes even more
•Cheap diesel driving Intermodal loads off rail back onto highway, especially in shorter lengths of haul
•Strong dollar valuation is driving down exports; will reverse ‘on-shoring’ trend
•Lower fuel surcharge revenue reduces yield and may pinch margins
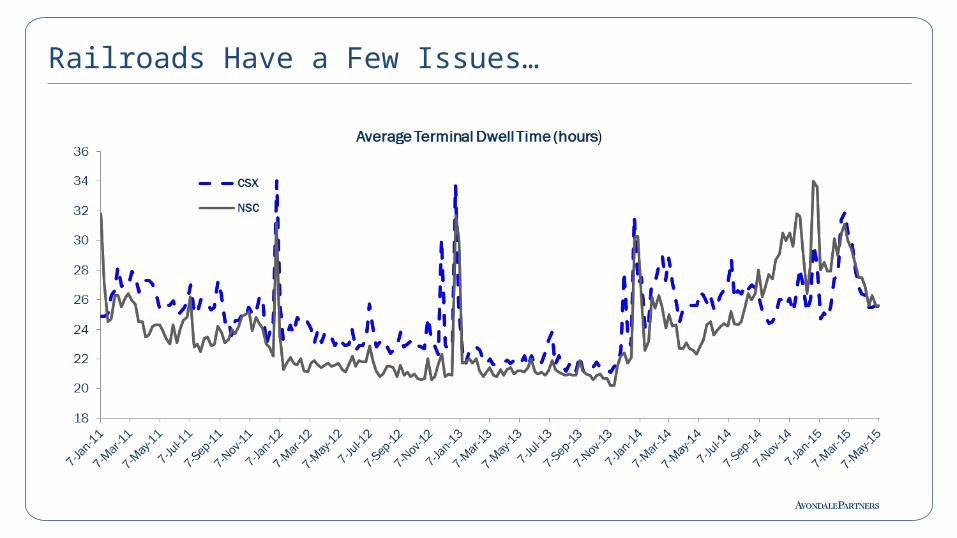
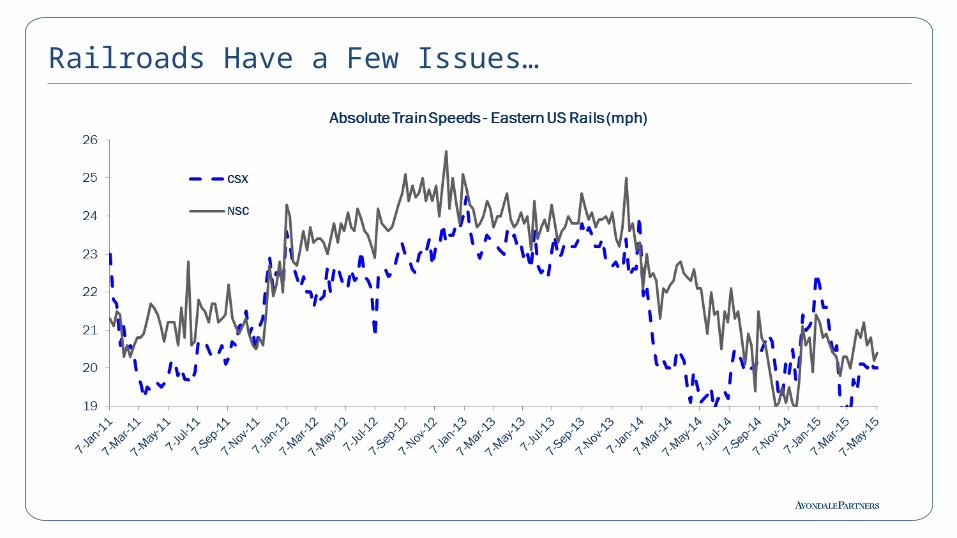
•System congestion plaguing most rail networks
Railroads Have a Few Issues…
Railroads Have a Few Issues…
Railroads Have a Few Issues…
Railroads Have a Few Issues…
Railroads Have a Few Issues…

Railroads Have a Few Issues…
Railroads Have a Few Issues…

Railroads Have a Few Issues…
Railroads Have a Few Issues…
Railroads Have a Few Issues…

Railroads Have a Few Issues…
50.0%
70.0%
90.0%
110.0%
130.0%
150.0%
170.0%
190.0%
210.0%
230.0%
250.0%
-40.0%
-30.0%
-20.0%
-10.0%
0.0%
10.0%
20.0%
30.0%
40.0%
Grain Carloads vs. Export Demand
Grain Carloads YoY
Unshipped U.S. Export Grain Balance (% of last yr)
The strong US Dollar threatens export demand.
Railroads Have a Few Issues…

Railroads Have a Few Issues…

Railroads Have a Few Issues…
Railroads Have a Few Issues…
Railroads Have a Few Issues…
57
• Truck tonnage was showing significant growth, capacity was tight, but getting a little looser. At intermodal’s expense?
• Recent rail volumes show deceleration across most commodity groups.
• Intermodal: Intermodal has decelerated. How much is due to diesel, economy or port situation?
• Overall freight volumes still show growth, but decelerating, especially in the LV / HD end of the freight spectrum.
In Tonnage We Trust
Cheaters still cheat, beware the CSA scoreDriver market gets even tougherTL pricing power of 4 to 6 %EOBR’s will have a big impact on capacity and an even
bigger impact on equipment visibilityMargins for both the equipment provider and the
broker will continue to be under pressureConsolidation in transportation poised to dramatically
increaseHard, durable assets increasingly valuableFracking and natural gas woefully under-estimatedForced Taper?
Predictions for 2014-2015
Driver market stays tough until end of cycle TL pricing power of 4 to 9% EOBR’s will have a big impact on capacity and an even bigger
impact on equipment visibility Railroad glory days take a pause, maybe even stumble and fall Cheaper diesel moves loads off-rail onto-road, increasing
truckload demand Margins for both the equipment provider and the broker will
continue to be under pressure, margins for trucker will just get better and better
Consolidation in transportation poised to dramatically increase Fracking and natural gas still woefully under-estimated Next stage of economic growth HAS to be consumer driven
Predictions for 2015-2016

A View From Wall StreetDonald Broughton
Chief Market Strategist, Managing Director
CCJ Spring SymposiumMay 20, 2015


