Download - Welcome from John Hancock - nbsbenefits.com

If you’re like most people, you’re hoping for a financially secure retirement. Achieving your retirement
dreams requires more than just hope, it requires a plan.
This PDF is one key to that plan. It can help get you on the path toward a financially secure retirement.
It will also walk you step-by-step through how to enroll.
It’s as easy as 1,2,3 Go!
Your retirement plan is a powerful savings tool that your employer is making available to you as a value-
added benefit. Seize this opportunity to quickly and easily lay the foundation for your financial future.
John Hancock – helping you enjoy getting there
How to use this PDF:
We highly recommend that you don’t print this entire PDF. Instead use it as
an electronic resource
Form to enroll – print pages |
Form to rollover qualified retirement accounts – print pages |
A chapter menu exists on the left hand side of the file so you can easily
navigate to each section.
This kit is current as of:This kit expires on:
Welcomefrom John Hancock
November 16, 2010December 16, 2010
51 - 64
125 - 126

P 17769-LTR-GE 07/10-18105
Your Personal Identification Number (PIN) will arrive shortly after John Hancock receives
your completed enrollment form. Use it to securely access your account.
In the meantime take advantage of a number of online retirement planning tools, calculators
and more on John Hancock’s website www.jhpensions.com or www.jhnypensions.com
(for plans domiciled in New York).
For a quick overview of the website
How to register for the website
1. Enter your contract number
Enter the contract number in the space provided.
You can obtain this number from your plan
administrator, enrollment form or your
quarterly statement.
2. Create a username and password
Once you’ve entered your contract number, you
will be asked to create a unique username and
password. You will need these to access your
account online in the future.
3. Enter your Personal Identification
Number (PIN)
You will be prompted to enter your PIN.
(Note: Contract and PIN numbers are not the
same and will be required at different times
when using John Hancock’s services).
Lost your PIN or forgotten yourlogin information?
If you forget your login information, you can
always use the number from your PIN and
the balance of a recent statement to access
your account.
If you receive two PIN’s, use the one with
the most recent date. Only the PIN with the
most recent issue date will permit access to
your account.
If you forget your PIN, contact a John Hancock
Retirement Plan Services customer service
representative at 1-800-395-1113 to request
a new PIN.
Accessingyour account
Take a Tour

Retirement planning that’s as easy as 1, 2, 3, Go!
EnjoyGetting
There
P 17658-GE 07/10-17658
KIT351405

John Hancock – helping you enjoy getting thereEnrolling is just the beginning!
John Hancock is there to support you every step of the way. We have more than 100 years
of leadership and experience helping millions of Americans prepare for their financial futures.
Take advantage of our award-winning communications, manage your account through our easy-to-
use website and get the tools, information and resources you need to plan for a secure retirement.
1ENJOY GETT ING THERE | RET IREMENT PLANNING THAT’S AS EASY AS 1, 2, 3, GO!
P 17324-WEL-G
E 07/10-17324
Welcome from John HancockIf you’re like most people, you’re hoping for a financiallysecure retirement. Achieving your retirement dreams requiresmore than just hope, however. It requires a plan.
The booklet you’re holding is one key to that plan. It’s simple and can help get you onthe path toward a financially secure retirement.
It’s as easy as 1, 2, 3, Go!Participating in your company’s qualified retirement plan is easy. This booklet will walkyou step-by-step through how to enroll.
Whether you were enrolled in a retirement plan with a previous employer or you’restarting fresh, participating is extremely important. It’s never too early (or too late) tostart saving for your future. And participating can provide you with key benefits, such as potential tax savings, the power of compound earnings and more.
Your retirement plan is a powerful savings tool that your employer is making availableto you as a value-added benefit. Seize this opportunity to quickly and easily lay thefoundation for your financial future.

ENJOY GETT ING THERE | RET IREMENT PLANNING THAT’S AS EASY AS 1, 2, 3, GO!2
1
2
3
GO
John Hancock Life Insurance Company (U.S.A.) (John Hancock USA) and John Hancock Life Insurance Companyof New York (John Hancock New York) are herein collectively referred to as “John Hancock”.
P 17324-WEL-G
E 07/10-17324
What is a qualified retirement plan?A qualified retirement plan is a powerful savings tool that millions of Americans arecurrently using to help prepare for their retirement.
This plan has been set up by your employer and is being offered to you as a benefit.Typically, employees make pre-tax contributions to their retirement plan accounts throughautomatic deposits from their paychecks. Over time, your savings may grow, helping you prepare for retirement.
Your qualified retirement plan can provide you with a number of savings advantages,such as the potential for reduced taxes, the ability to take advantage of compoundearnings and more. You can read more about the benefits of participating in yourretirement plan in the following pages.
Using this bookletThis guide will walk you step-by-step through how to enroll in your company’sretirement plan.
Getting started is easy. Along the side of this booklet, you’ll notice tabs, labeled 1, 2, 3 and Go! These are the main steps you will follow to enroll:
Step 1: Find out how much money you will need in retirement.
Step 2: Determine how much you will need to contribute.
Step 3: Choose your investment options.
Go!Complete your enrollment form and find answers tofrequently asked questions.
At the end of the booklet, you’ll find two additional sections. The first, called InvestmentOptions, contains details about the investments available to your plan. The other, calledWhat’s Next?, tells you what you can expect after enrollment, includes tips on investingand introduces you to online tools that can help you prepare for retirement.

Step 1How much do I need?
Learn about the benefits of participating and find retirement profiles to help you picture your retirement lifestyle.
Step 2How much do I need to contribute?
Discover potential sources of retirement income, how to calculate your contributions and find tips to help you save more.
Step 3How should I invest my retirement savings?
Learn about the fundamentals of investing and your personal tolerance for investment risk before choosing your investment options.
Go!Let the saving begin!
Find your enrollment form, an enrollment worksheet, frequently asked questions and important terminology.
Investment OptionsDiscover Fund fact sheets.
Review detailed information on the investmentoptions available under your plan.
What’s Next?What to expect after you enroll.
Discover the benefits of the website, how to read your quarterly statement and how to contact John Hancock.

How much do I need?Everyone hopes for a happy retirement, free from worries aboutmoney. But a financially secure future doesn’t just happen by itself.
A successful retirement requires a bit of foresight and planning. The good news is that there aresome things you can do right now to help put you on the path toward making your retirementdreams a reality.
The first step is to figure out how much income you’ll need once you retire. That’s the question we’ll help you answer in this section.
In the pages that follow, you’ll see:
� Why a retirement plan is so important to your future
� The tax advantages that come with your retirement plan
� How easy it can be to save
� Profiles of a cross section of Americans who are saving for retirement to help give you an idea of how much money you might need for yours.
1
Everyone has different ideas of what they want their retirement to be.
What is your life going to be like in retirement?
P 17324-S1-Tab-GE 07/10-17324

These are potential tax
savings that can really add up!
1ENJOY GETT ING THERE | RET IREMENT PLANNING THAT’S AS EASY AS 1, 2, 3, GO!
* Social Security Administration, Social Security Basic Facts, 2009
**Withdrawals of taxable amounts will be subject to ordinary income tax (state and local taxes may apply) and, if taken prior to age 591⁄2, a 10% IRS tax penalty may apply.
1 32
P 17324-S1-GE 07/10-17324
Why you need to start saving todayWould it surprise you to learn that a significant portion of your retirement income willneed to come from your personal savings?
Consider the following:
� Social Security currently covers just 40% of the income of retirees.*
� Your savings will need to last for the rest of your life. In 1935, the average lifeexpectancy of a 65-year-old was 121⁄2 years. Today, it’s 18 years.*
� Many experts believe you’ll need to replace 60% to 80% of your current annualincome, adjusted for inflation.*
� Social Security may not be sustainable. By 2016, it’s estimated that Social Securitycould be paying more in benefits than it collects in taxes.*
When you stop and think about it, these are some compelling reasons to participate in your company’s retirement plan.
The benefits of participatingBy participating in your company’s retirement plan, you’ll be able to take greater controlover your financial future. It can also let you take advantage of some attractive benefits.
The potential to pay less in taxesThe more you contribute to your plan, the larger your retirement savings (and tax savings)may be.
� Each dollar you contribute to your retirement plan is taken from your paycheck beforetaxes are applied. This may lower your taxable income. It might even put you in alower tax bracket.
� The earnings on contributions to your plan grow tax-deferred until withdrawn. Andsince you may be in a lower tax bracket in retirement, you might pay less tax when themoney is withdrawn** than if you were taxed today.

ENJOY GETT ING THERE | RET IREMENT PLANNING THAT’S AS EASY AS 1, 2, 3, GO!2
P 17324-S1-GE 07/10-17324
Watch your savings grow with compound earningsYou don’t have to pay taxes on your contributions or on the investment income those contributions generate – as long as thefunds remain in your plan. Your contributions and earnings can grow tax-deferred (also known as compounding) until youbegin taking withdrawals. As you can see from the accompanying example, compound earnings can really add up!
Y E A R S
5$33,907
$77,182
$132,412
$202,902
$292,867
$407,688
AC
CU
MU
LA
TIO
N
10 15 20 25 30
If Leslie and John saved $500 a month for 30 years,and earned an average tax-deferred annual return of5%, they would end up with$407,688! Their contributionswould total $180,000. All therest – $227,688 – would becompounded earnings!°
Howard’s taxes would be
HOWARD’S TAXABLE INCOME BEFORE CONTRIBUTING $35,000 $5,308•
ANNUAL PRE-TAX CONTRIBUTIONS ($200 X 12) $2,400
HOWARD’S TAXABLE INCOME AFTER CONTRIBUTING $32,600 $4,708§
Hypothetical mathematical illustration only.
° This example is not intended to represent investment advice. Talk to your financial representative about how this situation may relate to your own. This hypothetical example is forillustrative purposes only. There is no guarantee that the results shown will be achieved or maintained over any time period. This example assumes no withdrawals, does not takeinto account fees associated with investing which, if included, would reduce the account balance, and assumes reinvestment of earnings. Taxes are due upon withdrawal.
Howard now pays $600 less in taxes than he would if hedidn’t contribute to his plan!
See the potential tax savings from contributing
Howard earns an annual income of $35,000 and wants a retirement income of $32,000 ayear. He plans on starting his own small carpentry business when he retires. He is currentlycontributing $200 per month to his qualified retirement plan.
• This hypothetical example is for illustrative purposes only.§ Based on 2009 IRS tax tables.

3ENJOY GETT ING THERE | RET IREMENT PLANNING THAT’S AS EASY AS 1, 2, 3, GO!
P 17324-S1-GE 07/10-17324
So, how much will I really need?Envision your retirementYou already know the first step to a comfortable retirement is to figure out how much income you’ll need once you leave thework force. The six retirement profiles on the following pages can help you get an idea of the level of income you might need in your retirement.
Each profile shows a different retirement lifestyle, along with the estimated annual retirement income (in today’s dollars) neededto pay for that lifestyle. Choose the profile that best reflects your ideal retirement. Think about the activities you enjoy and howyou envision living in retirement. We’ll show you what it might cost to get there.
Note: While retirement profiles are helpful in planning the necessary contributions for retirement savings, there is no guarantee that any investment strategy will be successful in achieving investment objectives. The profiles assume a planned retirement age of 67, a life expectancy of 86 and investing with a balanced strategy. It also considers married individuals starting at age 49with an average rate of return of 3.5% and single individuals starting at age 30 with an average rate of return of 4%. The rate of return has been adjusted for an inflation rate of 3.1% and also considers the number of years to retirement.
* These MapInfo profiles are for illustrative purposes only, are not intended as financial or investment advice, and are not intended to represent the past or future performance of any investment option. Talk to your financial representative about how this situation may relate to your own.
1 32

Set a goal
ENJOY GETT ING THERE | RET IREMENT PLANNING THAT’S AS EASY AS 1, 2, 3, GO!4
P 17324-S1-GE 07/10-17324
Profile $17,500* – Debbie & Mike Wright� The Wrights have lived and worked in the same small community for years. They don’t plan on moving
when they retire.
� They enjoy a modest, yet comfortable, lifestyle. They’re involved in the community and are careful shoppers.
� In retirement, Debbie and Mike look forward to socializing, going to movies, reading and spending timewith family and friends. They may continue to work to keep busy and supplement their retirement income.
Income from retirement savings§ $2,500
Income from Social Security benefits $15,000
Total annual household income in retirement $17,500
Profile $32,000* – Maria & Tony Sanchez� Maria and Tony are active people who love spending time with family and participating in events for the
organizations they belong to.
� They attend church and share a desire to give back to the community.
� In retirement, Maria and Tony look forward to traveling occasionally, enjoying their hobbies, visiting withfamily and possibly working part-time.
Profile $45,000* – Sherry & Nigel Palmer� The Palmers dream of moving to a retirement community in Florida once they retire.
� They’re disciplined savers and smart shoppers. They’re hoping their good habits will help them live a simple,yet comfortable, life once they retire.
� In retirement, Sherry and Nigel look forward to visiting their kids. They plan on financing their visits byflying during the off-season and making their car last.
Is this you?� Do you like to take occasional trips to
relax or spend time with family?
� Would you like to devote more time toyour favorite organization once you retire?
� Are you looking at retirement as anopportunity to turn a hobby into a part-time business?
Is this you?� Do you take advantage of coupons to
help cut your grocery bills?
� Do you opt for previously-owned carsrather than buying new?
� Are you a disciplined saver?
§ Assumes a current combined annual income of $17,500, existing tax-deferred savings of $10,000 and making a combined monthly contribution of $80.∞ Assumes a current combined annual income of $32,000, existing taxable savings of $21,000 and tax-deferred savings of $15,000, and making a combined monthly contribution of $388. †Assumes a current combined annual income of $45,000, existing taxable savings of $30,000 and tax-deferred savings of $21,000, and making a combined monthly contribution of $755.
Is this you?� Do you enjoy being involved in the
community, vacationing close to home and spending time with family?
� Do you keep a car as long as you can tosave on car payments?
� Do you consider yourself a value shopper?
Income from retirement savings∞ $12,000
Income from Social Security benefits $20,000
Total annual household income in retirement $32,000
Income from retirement savings† $21,000
Income from Social Security benefits $24,000
Total annual household income in retirement $45,000

5ENJOY GETT ING THERE | RET IREMENT PLANNING THAT’S AS EASY AS 1, 2, 3, GO!
P 17324-S1-GE 07/10-17324
1 32
Profile $62,000* – Alan Browne� In retirement, Alan plans to pursue interests he doesn’t have time for today, like attending sporting
events, dinners out and visiting with friends.
� Alan is a conservative spender and plans to continue to live moderately once he retires.
� In retirement, Alan is looking forward to spending time with friends and completing some homeimprovement projects.
Is this you?� Do you occasionally dine out?
� Do you enjoy leisure activities close to home?
� Do you enjoy attending sporting events?
Profile $90,000* – Grace & Peter Wong� Grace and Peter are busy with their careers and are about to move into their dream home,
where they will continue to live once they retire.
� They want to stay active by working out and playing golf.
� In retirement, they are looking forward to spending more time with family and takingyearly vacations.
Profile $120,000* – Helen & David Burrows� Helen and David enjoy city life – museums, restaurants and theatre. They plan to live in the city when
they retire so they can continue to enjoy these pastimes.
� They have done well financially and enjoy luxuries such as new cars and exotic vacations.
� They are disciplined investors who have a clear idea of how they want to spend their retirement years.
Is this you?� Do you belong to a gym?
� Do you buy a new car every few years?
� Do you occasionally travel?
Is this you?� Do you belong to a golf, tennis or
health club?
� Do you regularly purchase new homefurnishings, automobiles, etc.?
� Do you enjoy traveling every year?
Ω Assumes a current annual income of $62,000, existing taxable savings of $7,000 and tax-deferred savings of $4,000, and making a monthly contribution of $432.≈Assumes a current combined annual income of $90,000, existing taxable savings of $62,000 and tax-deferred savings of $41,000, and making a combined monthly contribution of $2,026.ø Assumes a current combined annual income of $120,000, existing taxable savings of $82,000 and tax-deferred savings of $55,000, and making a combined monthly contribution of $2,896.
Income from retirement savingsΩ $36,000
Income from Social Security benefits $26,000
Total annual household income in retirement $62,000
Income from retirement savings≈ $52,000
Income from Social Security benefits $38,000
Total annual household income in retirement $90,000
Income from retirement savingsø $74,000
Income from Social Security benefits $46,000
Total annual household income in retirement $120,000

ENJOY GETT ING THERE | RET IREMENT PLANNING THAT’S AS EASY AS 1, 2, 3, GO!6
P 17324-S1-GE 07/10-17324
Step 1– RecapBy now, you should have an idea of which retirement profile most closely matches the retirement lifestyle you aspire to. This information will help you decide how much to contribute to reach your goal. You’re one step closer to making yourretirement dreams a reality.
Before we move on to Step 2, here’s a quick recap of what we’ve covered so far:
� A retirement plan is a powerful and important tool for your financial future
� Participating in your company’s retirement plan can translate into benefits such as:
• The potential to pay less in taxes
• The ease and convenience of automatic contributions
• Watching your savings grow with compound earnings
� Setting a retirement goal is an important first step.
Go to the Enrollment Worksheet in the Go! section to make noteof your retirement profile.
Now, let’s move on to Step 2, where you will figure out your
contribution amount.

2Step

How much do I needto contribute?After reviewing Step 1, you should have an idea of the level ofincome you’d like to have in retirement. Now it’s time to figureout how much of your current salary you should contribute toachieve your goal.
In the pages that follow, you’ll see:
� The different sources of retirement income
� How to calculate your contribution amount
� How dollar cost averaging, making small contribution increases and the advantages of starting early can help your retirement savings grow
� Where to find additional dollars to put toward your retirement.
Did you know?
“The average U.S. participant contribution is 6%”. The more you contribute today, the more you’ll have to enjoy in retirement.Source: 2009 PSCA 52nd Annual Survey.
2
P 17324-S2-Tab-GE 07/10-17324
ENJOY GETT ING THERE | RET IREMENT PLANNING THAT’S AS EASY AS 1 ,2 ,3 , GO!
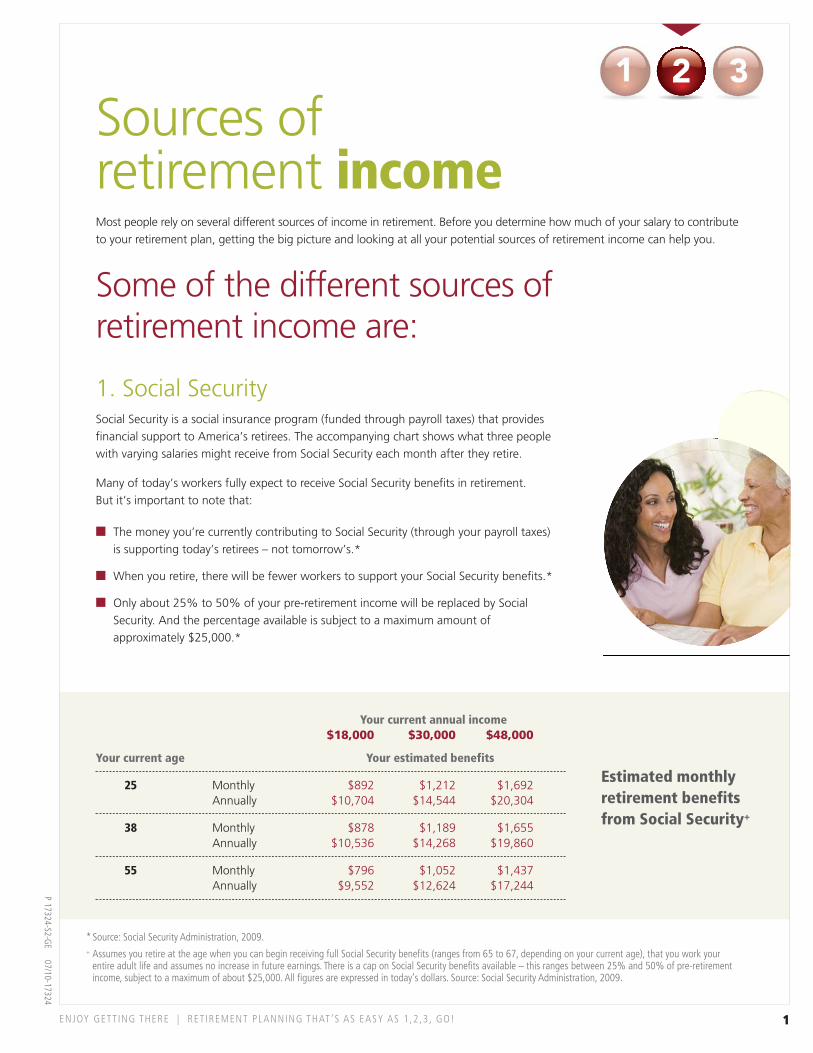
* Source: Social Security Administration, 2009.+ Assumes you retire at the age when you can begin receiving full Social Security benefits (ranges from 65 to 67, depending on your current age), that you work your
entire adult life and assumes no increase in future earnings. There is a cap on Social Security benefits available – this ranges between 25% and 50% of pre-retirementincome, subject to a maximum of about $25,000. All figures are expressed in today’s dollars. Source: Social Security Administration, 2009.
1 32
Your current annual income $18,000 $30,000 $48,000
Your current age Your estimated benefits
25 Monthly $892 $1,212 $1,692 Annually $10,704 $14,544 $20,304
38 Monthly $878 $1,189 $1,655 Annually $10,536 $14,268 $19,860
55 Monthly $796 $1,052 $1,437 Annually $9,552 $12,624 $17,244
Estimated monthlyretirement benefitsfrom Social Security+
P 17324-S2-GE 07/10-17324
Most people rely on several different sources of income in retirement. Before you determine how much of your salary to contributeto your retirement plan, getting the big picture and looking at all your potential sources of retirement income can help you.
Some of the different sources of retirement income are:
1
Sources of retirement income
1. Social SecuritySocial Security is a social insurance program (funded through payroll taxes) that providesfinancial support to America’s retirees. The accompanying chart shows what three people with varying salaries might receive from Social Security each month after they retire.
Many of today’s workers fully expect to receive Social Security benefits in retirement. But it’s important to note that:
� The money you’re currently contributing to Social Security (through your payroll taxes) is supporting today’s retirees – not tomorrow’s.*
� When you retire, there will be fewer workers to support your Social Security benefits.*
� Only about 25% to 50% of your pre-retirement income will be replaced by SocialSecurity. And the percentage available is subject to a maximum amount ofapproximately $25,000.*

Consider tax-deferred savings limitsWhile you can save as much as you want toward your retirement, you should know there are limits to how much of your savings can be tax-deferred.
For example, the 2010 IRS pre-tax contribution limit is $16,500.
If you are 50 years of age or older, you may be eligible for an additional annual catch-up contribution of $5,500.
ENJOY GETT ING THERE | RET IREMENT PLANNING THAT’S AS EASY AS 1, 2, 3, GO!2
P 17324-S2-GE 07/10-17324
2. Personal savingsAre you someone who has been putting away retirement savings over the years in places such as savings accounts and individual retirement accounts? All of thesepersonal savings sources will help contribute toward your total income once you retire.
3. Guaranteed sources of incomeMany Americans have or choose to invest in guaranteed sources of income, such as defined benefit pension plans, annuities and other investments that provide apredictable, steady stream of income on a regular basis. A guaranteed source ofretirement income lets you know how much money you will have coming in eachmonth for the rest of your life.
4. Your company’s qualified retirement planSince you’re reading this booklet, your company is offering you an opportunity toparticipate in its qualified retirement plan. Participating in this plan can be a simple yet effective way for you to save toward your retirement. Learn about a number of significant benefits from participating in this plan. All in all, it’s a simple and practicalway to help you prepare for your retirement.
Want to know what your personal Social Security benefits might look like? Call the Social Security Administration at 1-800-772-1213, or go online atwww.ssa.gov. Don’t forget to check your annual Social Security statement.

3ENJOY GETT ING THERE | RET IREMENT PLANNING THAT’S AS EASY AS 1, 2, 3, GO!
P 17324-S2-GE 07/10-17324
Calculating your contributionWith a better understanding of the benefits of participating and your potentialsources of income, and having set a retirement goal, now it’s time to determinehow much to save for your retirement.
Jamie is 30 years old, her retirement goal is $32,000 and she has no current retirement savings.
To meet her goal, she should contribute $206 per month to her qualified retirement plan.
If you used the Contribution Calculator and would like to work out your suggested contribution amount as a
percentage of your income, follow this simple example:
Jamie’s current annual income is $40,000. Here’s how to calculate her contribution amount as a percentage of income:
$206 x 12 months ÷ 40,000 = 6.2%
Formula: contribution x 12 months ÷ annual income = percentage of income
1 32
So…how much money will you need to contribute each month to reach your retirement income goal?
To help you answer this question, use the Contribution Calculator at the end of thisstep. It’s a quick and simple way to come up with an accurate contribution amountthat will help you achieve your retirement savings objective.
To use the Contribution Calculator, you’ll need the following information:
� Your retirement profile (which you selected in Step 1)
� Your current age
� The total amount of your current retirement savings.
Just follow the step-by-step directions, and in no time at all, you’ll have a suggestedmonthly contribution customized for you that will help you reach your retirementincome goal. For example:
This hypothetical example is for illustrative purposes only and is based on assumptions in the calculator.

ENJOY GETT ING THERE | RET IREMENT PLANNING THAT’S AS EASY AS 1, 2, 3, GO!4
P 17324-S2-GE 07/10-17324
This table can be used as a planning tool to helpdetermine your contributionamounts, and shows thelevel of tax savings youmight be able to benefitfrom. Average salary rangesand contribution amountsas a percentage of salaryare also shown. Select yoursalary today, then reviewthe columns to see thecontribution amounts andpotential tax savings.
This table is intended as an educational tool only and represents hypothetical mathematical illustrations only. Calculations are estimates and may not provide accurateprojections. Your actual circumstances, including current income or retirement needs, may vary. Withdrawals of taxable amounts will be subject to ordinary income taxand, if taken prior to age 591⁄2, a 10% IRS tax penalty may apply. This is not intended as investment or legal advice. To determine the actual tax impact of contributionsyou make to your retirement plan, consult your tax advisor.
++ Contribution amounts may include employee and employer contributions made to your company’s qualified retirement plan, as well as deposits to other tax-shelteredand non-tax-sheltered accounts. Contributions to tax-sheltered accounts may not exceed plan or regulatory limits.
## Calculations for those with a salary from $15,000 to $50,000 are based on an individual who is married filing jointly, reporting a taxable income of $62,000 and amarginal tax rate of 15%.
•• Calculations for those with a salary from $60,000 to $80,000 are based on an individual who is married filing jointly, reporting a taxable income of $120,000 and amarginal tax rate of 20%.
Quick Guide: Contribution amounts and potential tax savings
AnnualSalary
% ofAnnualSalary
Pre-tax MonthlyContribution++
Approx. Pre-tax AnnualContribution++
Approx. After-tax AnnualContribution
15%12%9%6%3%
15%12%9%6%3%
15%12%9%6%3%
15%12%9%6%3%
15%12%9%6%3%
15%12%9%6%3%
15%12%9%6%3%
15%12%9%6%3%
$188 $150 $113 $75 $38
$250 $200 $150 $100 $50
$375 $300 $225 $150 $75
$500 $400 $300 $200 $100
$625 $500 $375 $250 $125
$750 $600 $450 $300 $150
$875 $700 $525 $350 $175
$1,000 $800 $600 $400 $200
$161 $129 $97 $65 $32
$215 $172 $129 $86 $43
$323 $258 $194 $129 $65
$430 $344 $258 $172 $86
$538 $430 $323 $215 $108
$600 $480 $360 $240 $120
$700 $560 $420 $280 $140
$800 $640 $480 $320 $160
$2,250 $1,800 $1,350 $900 $450
$3,000 $2,400 $1,800 $1,200 $600
$4,500 $3,600 $2,700 $1,800 $900
$6,000 $4,800 $3,600 $2,400 $1,200
$7,500 $6,000 $4,500 $3,000 $1,500
$9,000 $7,200 $5,400 $3,600 $1,800
$10,500 $8,400 $6,300 $4,200 $2,100
$12,000 $9,600 $7,200 $4,800 $2,400
$1,935##
$1,548 $1,161 $774 $387
$2,580##
$2,064 $1,548 $1,032 $516
$3,870##
$3,096 $2,322 $1,548 $774
$5,160##
$4,128 $3,096 $2,064 $1,032
$6,450##
$5,160 $3,870 $2,580 $1,290
$7,200••
$5,760 $4,320 $2,880 $1,440
$8,400••
$6,720 $5,040 $3,360 $1,680
$9,600••
$7,680 $5,760 $3,840 $1,920
$15,000
$20,000
$30,000
$40,000
$50,000
$60,000
$70,000
$80,000
Approx. After-tax MonthlyContribution
Approx.Annual TaxSavings
$315 $252 $189 $126 $63
$420 $336 $252 $168 $84
$630 $504 $378 $252 $126
$840 $672 $504 $336 $168
$1,050 $840 $630 $420 $210
$1,800 $1,440 $1,080 $720 $360
$2,100 $1,680 $1,260 $840 $420
$2,400 $1,920 $1,440 $960 $480
5ENJOY GETT ING THERE | RET IREMENT PLANNING THAT’S AS EASY AS 1, 2, 3, GO!
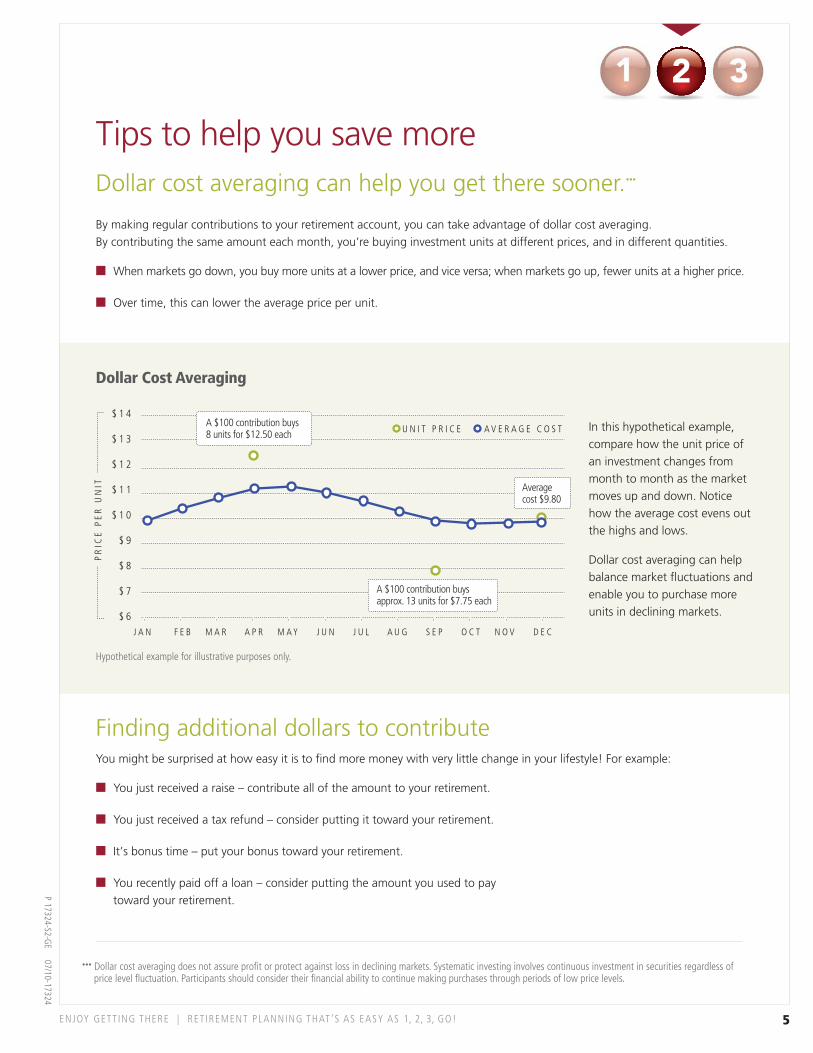
Tips to help you save moreDollar cost averaging can help you get there sooner.•••
By making regular contributions to your retirement account, you can take advantage of dollar cost averaging. By contributing the same amount each month, you’re buying investment units at different prices, and in different quantities.
� When markets go down, you buy more units at a lower price, and vice versa; when markets go up, fewer units at a higher price.
� Over time, this can lower the average price per unit.
••• Dollar cost averaging does not assure profit or protect against loss in declining markets. Systematic investing involves continuous investment in securities regardless ofprice level fluctuation. Participants should consider their financial ability to continue making purchases through periods of low price levels.
Finding additional dollars to contributeYou might be surprised at how easy it is to find more money with very little change in your lifestyle! For example:
� You just received a raise – contribute all of the amount to your retirement.
� You just received a tax refund – consider putting it toward your retirement.
� It’s bonus time – put your bonus toward your retirement.
� You recently paid off a loan – consider putting the amount you used to pay toward your retirement.
1 32
$ 1 4
$ 1 3
$ 1 2
$ 1 1
$ 1 0
$ 9
$ 8
$ 7
$ 6
PR
ICE
PE
R U
NIT
U N I T P R I C E A V E R A G E C O S TA $100 contribution buys 8 units for $12.50 each
A $100 contribution buys approx. 13 units for $7.75 each
Averagecost $9.80
J A N F E B M A R A P R M A Y J U N J U L A U G S E P O C T N O V D E C
Dollar Cost Averaging
In this hypothetical example,compare how the unit price ofan investment changes frommonth to month as the marketmoves up and down. Noticehow the average cost evens outthe highs and lows.
Dollar cost averaging can helpbalance market fluctuations andenable you to purchase moreunits in declining markets.
Hypothetical example for illustrative purposes only.
P 17324-S2-GE 07/10-17324

ENJOY GETT ING THERE | RET IREMENT PLANNING THAT’S AS EASY AS 1, 2, 3, GO!6
P 17324-S2-GE 07/10-17324
A small increase can have a big impactIt’s surprising how making small increases to your monthly contributions can really add up overtime. Let’s see exactly how it works by looking at the examples of John, Rose and Carlos.*
$ 0
$ 5 0 , 0 0 0
$ 1 0 0 , 0 0 0
$ 1 5 0 , 0 0 0
$ 2 0 0 , 0 0 0
$ 2 5 0 , 0 0 0
$ 3 0 0 , 0 0 0
$58,573
John invests$100.00 per month
$117,147
Rose invests$200.00 per month
Carlos invests$300.00 per month
$58,574more!
$117,147 more!
$175,720C O M P O U N D E A R N I N G S
T O T A L C O N T R I B U T I O N S
* Based on a 5% compound interest and monthly contributions over a 25-year period. This example is not intended to represent investment advice. Talk to your financialrepresentative about how this situation may relate to your own. This hypothetical example is for illustrative purposes only. There is no guarantee that the results shownwill be achieved or maintained over any time period. This example assumes no withdrawals, does not take into account fees associated with investing which, if included,would reduce the account balance, and assumes reinvestment of earnings. Taxes are due upon withdrawal.
John decides to invest $100 every month toward hisretirement. At the end of 25 years, he will have a total of$58,573. His actual contributions (shown in green) will total$30,000, while his compound earnings (the money he earnedon his investment, shown in red) will amount to $28,573.
Now, let’s look at Rose. After recently paying off her car loan,Rose decides to use that extra money to increase her totalinvestment to $200 per month. She still has the same amountof disposable income each month. At the end of 25 years,however, Rose will have $117,147. Her actual contributions willtotal $60,000, while her compound earnings will be $57,147.Notice that simply by increasing her monthly investment by$100, Rose retires with $58,574 more than John.
Carlos recently enjoyed a raise in pay and opts to invest ittoward his retirement, bringing his total monthly investment to $300. Carlos is still taking home the same amount of moneyeach month. He may not experience any difference in lifestyle,but at the end of the same 25-year period, Carlos will have$175,720. His actual contributions will total $90,000, while his compound earnings will amount to a whopping $85,720.Simply by putting his raise to work for his future, Carlos retireswith $117,147 more than John and $58,573 more than Rose.
7ENJOY GETT ING THERE | RET IREMENT PLANNING THAT’S AS EASY AS 1, 2, 3, GO!
P 17324-S2-GE 07/10-17324
1 32
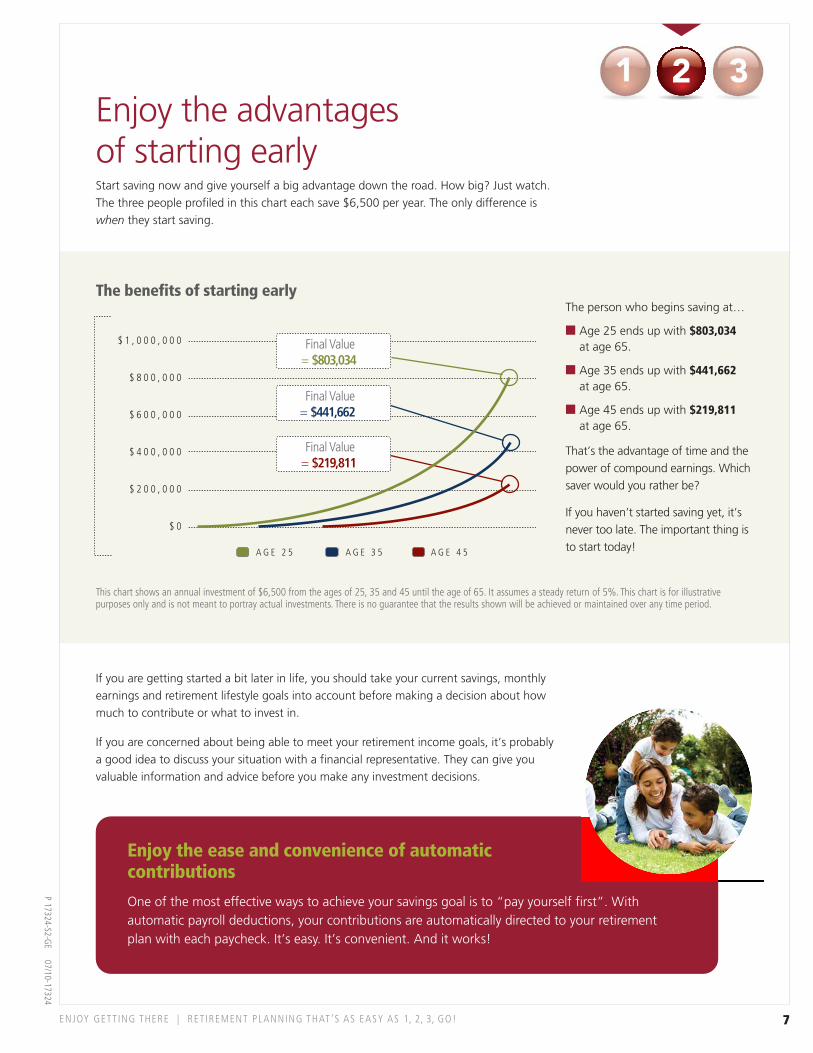
Enjoy the ease and convenience of automaticcontributions
One of the most effective ways to achieve your savings goal is to “pay yourself first”. Withautomatic payroll deductions, your contributions are automatically directed to your retirementplan with each paycheck. It’s easy. It’s convenient. And it works!
Enjoy the advantages of starting early Start saving now and give yourself a big advantage down the road. How big? Just watch.The three people profiled in this chart each save $6,500 per year. The only difference iswhen they start saving.
This chart shows an annual investment of $6,500 from the ages of 25, 35 and 45 until the age of 65. It assumes a steady return of 5%. This chart is for illustrativepurposes only and is not meant to portray actual investments. There is no guarantee that the results shown will be achieved or maintained over any time period.
A G E 2 5 A G E 3 5 A G E 4 5
$ 1 , 0 0 0 , 0 0 0
$ 8 0 0 , 0 0 0
$ 6 0 0 , 0 0 0
$ 4 0 0 , 0 0 0
$ 2 0 0 , 0 0 0
$ 0
Final Value= $803,034
Final Value= $441,662
Final Value= $219,811
The person who begins saving at…
� Age 25 ends up with $803,034at age 65.
� Age 35 ends up with $441,662at age 65.
� Age 45 ends up with $219,811at age 65.
That’s the advantage of time and thepower of compound earnings. Whichsaver would you rather be?
If you haven’t started saving yet, it’snever too late. The important thing isto start today!
If you are getting started a bit later in life, you should take your current savings, monthlyearnings and retirement lifestyle goals into account before making a decision about howmuch to contribute or what to invest in.
If you are concerned about being able to meet your retirement income goals, it’s probably a good idea to discuss your situation with a financial representative. They can give youvaluable information and advice before you make any investment decisions.
The benefits of starting early

ENJOY GETT ING THERE | RET IREMENT PLANNING THAT’S AS EASY AS 1, 2, 3, GO!
P 17324-S2-GE 07/10-17324
8
Step 2 – RecapNow you have a better idea of how much to contribute to achieveyour retirement income goal.
Before we move on to Step 3, here’s a quick summary of what you covered in Step 2:
� There are several different sources of retirement income you may be able to use to achieveyour goals
� You calculated your personal contribution amount
� Dollar cost averaging and making small increases to your contributions can help strengthenyour retirement savings
� It can be easy to find additional dollars to contribute
� Starting early is best, but it’s never too late to start.
Now that you have an idea of how much to save, go to the EnrollmentWorksheet in the Go! section to make a note of how much you’regoing to contribute.
Now, let’s move on to Step 3, where you’ll choose an investment option.

Click the button to use the calculator
Contribution Calculator
P 17770-CALC-GE 07/10-18107
Note: internet access is required
Use Calculator

3Step

How should I investmy retirement savings?You’re almost there!
In Step 1, you set a goal and determined what level of income you want in retirement. In Step 2, you decided how much of your salary to contribute.Now, in Step 3, it’s time to choose how to invest your contributions.
In the following pages, you’ll learn:
� How the relationship between risk and return can impact your investment strategy
� How diversification can benefit you
� What asset allocation is and why it’s important to your retirement savings
� About different investment types to help decide which might be appropriate for you
� About your personal tolerance for investment risk.
3
What kind of investor are you?
Regardless of your risk tolerance or investment approach,there’s an option that’s right for you.
P 17324-S3-Tab-GE 07/10-17324

The relationship between risk and returnRisk and return are directly related. While most investments entail a risk that you may lose part (or all) of the original moneyyou invested, it’s important to consider the following:
� Historically, investments with greater risk have also offered greater potential for long-term return.
� More conservative investments have lower volatility, but tend to grow more slowly and steadily.
1 5 0 %
1 0 0 %
5 0 %
0 3.7% 5.4% 9.8% 11.9%14.7%
40.4%
5.9%
42.6%54.0%
142.9%
0.0% -14.9% -8.1%
-43.3%-58.0%
L O W R I S K H I G H R I S K
Conservative Moderate Growth & Income Growth Aggressive Growth I N V E S T M E N TS T Y L E :
I N V E S T M E N TV E H I C L E :
30-DayT-Bills
Long-TermGovernment
Long-TermCorporate
S&P500
SmallStocks
RIS
K A
ND
RE
TU
RN
S
This chart shows the historicalrange of returns for differenttypes of investments. As you cansee, history has shown that themore aggressive an investment is,the more volatile it is. A goodrule of thumb is to balance theamount of risk you are willing to assume with an investment’spotential for growth.
†† The performance data shown represents past performance. Past performance is no guarantee of future results and current performance may be lower or higher than theperformance shown. Each bar represents the range of annual returns, along with compound average returns, for each asset class over the period January 1926 – December2009. Average annual rate of inflation over the same time period was 3%. The return and principal value of stocks will fluctuate with changes in market conditions.
Long-term Government bonds are represented by the Ibbotson Associates Long-term Government TR. Long-term Corporate bonds are represented by the Ibbotson AssociatesLong-term Corporate TR. Treasury bills are represented by the U.S. 30 day T-bill TR. Government bonds and treasury bills are guaranteed by the U.S. Government and, if held tomaturity, all bonds offer both a fixed rate of return and fixed principal value. The S&P 500 Stock Index is an unmanaged but commonly used measure of common stock totalreturn performance. Small Cap stocks are represented by the Ibbotson Associates Long-term U.S. Small Stock TR, an unmanaged historic index of U.S. Small Cap stockscompiled by Dimensional Fund Advisors. Small Cap stocks may be subject to a higher degree of market risk than Large Cap or more established companies’ securities. Theliquidity of the Small Cap market may adversely affect the value of an investment so that shares, when redeemed, may be worth more or less than their original cost.
Source: Ibbotson Associates, 2009. Investors may not invest directly in an index.
ENJOY GETT ING THERE | RET IREMENT PLANNING THAT’S AS EASY AS 1 ,2 ,3 , GO!
A few words oninvestingRetirement planning involves understanding investing and how to allocate and diversifyyour investments so that you can better withstand the ups and downs of investing.
While knowing how to invest the dollars in your retirement plan might seem complicatedright now, the choices will become clearer as you go through the terms, ideas andinvestment options outlined in this section.
1 32
Range of returns 1926 – 2009††
P 17324-S3-GE 07/10-17324
KIT351405
1
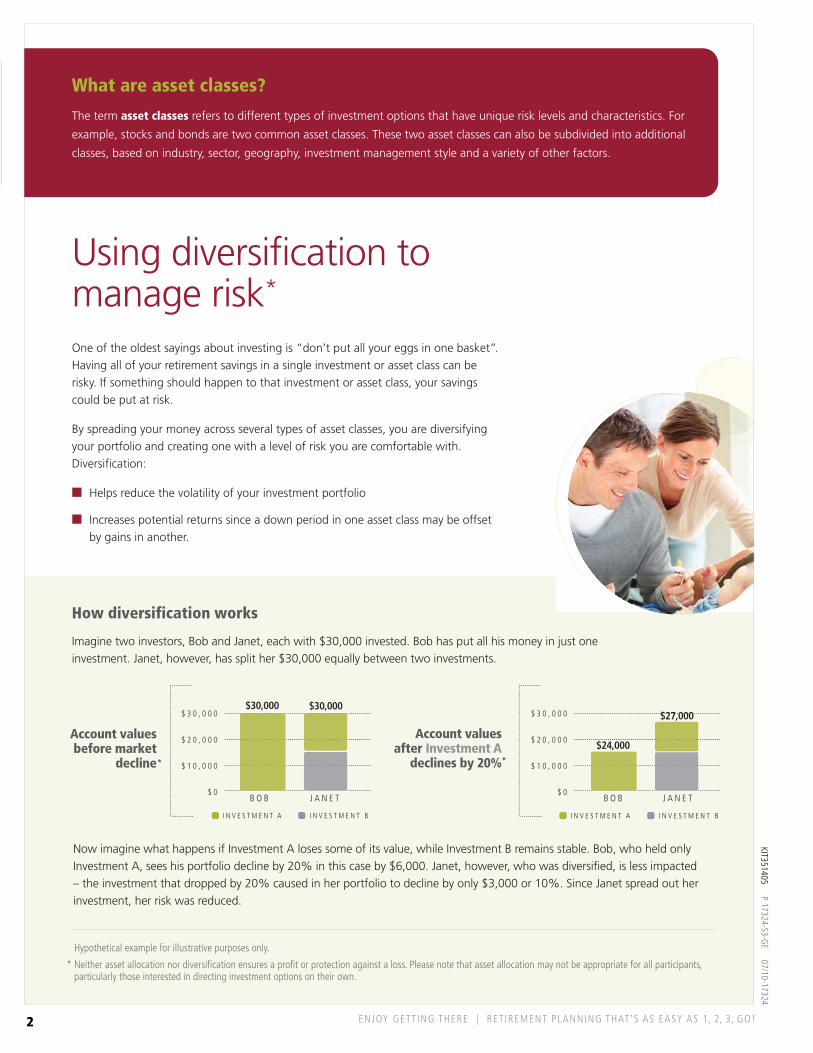
Hypothetical example for illustrative purposes only.
* Neither asset allocation nor diversification ensures a profit or protection against a loss. Please note that asset allocation may not be appropriate for all participants, particularly those interested in directing investment options on their own.
ENJOY GETT ING THERE | RET IREMENT PLANNING THAT’S AS EASY AS 1, 2, 3, GO!
P 17324-S3-GE 07/10-17324
$ 3 0 , 0 0 0
$ 2 0 , 0 0 0
$ 1 0 , 0 0 0
$ 0B O B J A N E T
$30,000 $30,000
I N V E S T M E N T A I N V E S T M E N T B
What are asset classes?
The term asset classes refers to different types of investment options that have unique risk levels and characteristics. For
example, stocks and bonds are two common asset classes. These two asset classes can also be subdivided into additional
classes, based on industry, sector, geography, investment management style and a variety of other factors.
Now imagine what happens if Investment A loses some of its value, while Investment B remains stable. Bob, who held onlyInvestment A, sees his portfolio decline by 20% in this case by $6,000. Janet, however, who was diversified, is less impacted – the investment that dropped by 20% caused in her portfolio to decline by only $3,000 or 10%. Since Janet spread out herinvestment, her risk was reduced.
Account valuesbefore market
decline
Using diversification tomanage risk*
One of the oldest sayings about investing is “don’t put all your eggs in one basket”.Having all of your retirement savings in a single investment or asset class can berisky. If something should happen to that investment or asset class, your savingscould be put at risk.
By spreading your money across several types of asset classes, you are diversifying your portfolio and creating one with a level of risk you are comfortable with.Diversification:
� Helps reduce the volatility of your investment portfolio
� Increases potential returns since a down period in one asset class may be offset by gains in another.
$ 3 0 , 0 0 0
$ 2 0 , 0 0 0
$ 1 0 , 0 0 0
$ 0B O B J A N E T
$24,000
$27,000
I N V E S T M E N T A I N V E S T M E N T B
Account valuesafter Investment A
declines by 20%* *
How diversification works
Imagine two investors, Bob and Janet, each with $30,000 invested. Bob has put all his money in just oneinvestment. Janet, however, has split her $30,000 equally between two investments.
KIT351405
2

ENJOY GETT ING THERE | RET IREMENT PLANNING THAT’S AS EASY AS 1, 2, 3, GO!
P 17324-S3-GE 07/10-17324
Achieving diversificationthrough asset allocationAsset allocation is the process of deciding how much of your retirement savings toallocate to different asset classes (such as stock funds, bond funds or money marketfunds). Diversification through asset allocation helps to minimize your risk and maximizeyour returns.
When allocating your money you may want to think about a number of factors, including:
� Your anticipated retirement date
� The length of time you have to save
� Your tolerance for risk.
Through asset allocation you create a diversified portfolio with a level of risk thatyou feel comfortable with. One way to achieve an appropriate balance is to invest in asset allocation funds.
Ways to investIn the following pages, you will learn more about variousinvestment options offered by your company’s plan.
1 32
KIT351405
3
Asset allocation portfolios are "fund of funds" which invests in a number of underlying funds. A Fund's ability to achieve its investment objective will depend largely onthe ability of the subadviser to select the appropriate mix of underlying funds and on the underlying funds' ability to meet their investment objectives. There can be noassurance that either a Fund or the underlying funds will achieve their investment objectives. A Fund is subject to the same risks as the underlying funds in which itinvests. Each Fund invests in underlying funds which invest in fixed-income securities (including in some cases high yield securities) and equity securities, includingforeign securities and engage in Hedging and Other Strategic Transactions. To the extent the Fund invests in these securities directly or engages in Hedging and OtherStrategic Transactions, the Fund will be subject to the same risks. As a Fund's asset mix becomes more conservative, the fund becomes more susceptible to risksassociated with fixed-income securities. For a more complete description of these risks, please review the underlying fund's prospectus, which is available uponrequest.
The revenue John Hancock Retirement Plan Services receives from any of its internally-managed Funds and certain asset allocation portfolios (i.e., the LifestylePortfolios and Guaranteed Income Feature Portfolios) may be higher than those advised or sub-advised exclusively by unaffiliated mutual fund companies. JohnHancock Retirement Plan Services' affiliates provide advisory and sub-advisory services to these internally-managed funds.

ENJOY GETT ING THERE | RET IREMENT PLANNING THAT’S AS EASY AS 1, 2, 3, GO!
P 17324-LS-GE 09/10-18143
John Hancock Lifestyle Portfolios∞
Retirement planning based on yourtolerance for riskDo you want to employ an asset allocation strategy based on your individual tolerance forinvestment risk? If so, Lifestyle Portfolios may be for you. They require regular ongoingmonitoring of the investments in your retirement account.
How Lifestyle Portfolios workWith Lifestyle Portfolios, simply determine your level of risk tolerance in order to establishyour investment strategy and style. Then, choose the corresponding Lifestyle Portfoliobased on your risk profile. You should periodically review your risk tolerance.
� Lifestyle Portfolios provide one-step diversification in the form of five color-codedinvestment alternatives that match five distinct risk strategies.
� Each of our Lifestyle Portfolios are carefully divided among a mix of funds under thewatchful eye of our professional fund management team.
� They review and rebalance the mix of the underlying funds for each risk target with a goal of enhancing potential returns and minimizing risk.
Each Lifestyle Portfolio corresponds to aunique risk strategy
∞ Each of the JH Lifestyle Funds invests in a pre-determined mix of underlying Funds. Not all underlying Funds may be available for direct investment through yourqualified retirement plan.
ConservativePortfolio
ModeratePortfolio
BalancedPortfolio
GrowthPortfolio
AggressivePortfolio
DetermineRiskStrategy
SelectLifestylePortfolio
Conservative Moderate Balanced Growth Aggressive
KIT351405
4

ENJOY GETT ING THERE | RET IREMENT PLANNING THAT’S AS EASY AS 1, 2, 3, GO!
P 17324-LS-GE 09/10-18143
Risk and return – the trade-offThe accompanying graph shows the historical trade-off between risk and return for the fivedifferent Lifestyle Portfolios. Over the long term, you would expect a portfolio with greaterrisk to generate a higher level of return.
1 32
To help identify your personal risk tolerance, take our simple six-question Risk Quiz in this booklet. Once you’ve determinedyour comfort level with risk, select the Lifestyle Portfolio option that is right for you. As your risk tolerance may change overtime, retake the Risk Quiz periodically to determine whether you are still in the appropriate Portfolio.
Lifestyle Portfolios may be for you if you want: � To regularly review your investments
� To gain a better understanding of your unique tolerance for risk
� Specialists to adjust and rebalance the Portfolio for you, to maintain its risk target
� A simple choice at enrollment when it comes to allocating your retirement contributions
� To revisit your risk tolerance annually.
L O W E R E X P E C T E D R I S K
EX
PE
CT
ED
RE
TU
RN
H I G H E R
HIG
HE
R
C O N S E R V A T I V E
M O D E R A T E
B A L A N C E D
G R O W T H
A G G R E S S I V E
LO
WE
R
If you think that Lifestyle Portfolios may be for you, take the Risk Quiz andgo to the Investment Options tab for more information on each Portfolio.Then, proceed to the Go! tab and complete the enrollment form.
I N C O M E
G R O W T H & I N C O M E
G R O W T H
A G G R E S S I V E G R O W T H
Investment types
KIT351405
5

Try to include several different types of funds within each risk category to builda properly diversified portfolio mix that matches your overall risk strategy.
The Risk Quiz will help you determine your personal risk tolerance.
ENJOY GETT ING THERE | RET IREMENT PLANNING THAT’S AS EASY AS 1, 2, 3, GO!
Build Your Own Portfolio MixDo-it-yourself retirement planningAre you the type of person who wants to be actively involved in the research, selection and management of your retirementaccount? If this is the case, constructing your own portfolio mix from the available Funds and handling the asset allocationyourself may be for you.
It is important to start by understanding the relationship between your tolerance for risk and the types of investments that willbe most appropriate. Below is a list of the investment types available. More information about each type is available underImportant Terminology in the Go! section.
Investment types available:� Guaranteed Interest Accounts‡
� Sub-accounts (Funds)‡‡:• Money Market Funds• Bond Funds• Stock Funds.
Although a Money Market Fund seeks to preserve the value of your investment, it is possible to lose money by investing insuch a fund. Not insured by the FDIC, the Federal Reserve Board or any agency.
Contributions to a sub-account – also called a Fund – are pooled with those of other plan participants and are invested in underlying mutual funds. The underlying mutual fundsmay invest in stocks, bonds, money market instruments and other securities. When you invest in a sub-account your contribution purchases units of that Fund. For example, if theunit value is $50 and you contribute $100, then you purchase two units of that Fund. Unit values rise and fall each day and their movements affect the overall value of the Fundand your contributions to that Fund. Sub-accounts include the Lifestyle Portfolios, the Lifecycle Portfolios and other fund options, color-coded to indicate investment risk.
Build Your Own Portfolio Mix may be for you if you want:� To frequently review your investments� To be in control of your asset allocation and construct your own portfolio mix� To handle the ongoing monitoring and rebalancing of your portfolio.
‡ When contributions are allocated to the Guaranteed Interest Account, they will be held in the John Hancock USA general account or John Hancock New York generalaccount, as applicable. Both the principal invested and interest on guaranteed accounts are subject to the claims-paying ability of John Hancock USA or John HancockNew York, as applicable, but are not insured by the FDIC, the Federal Reserve Board or any agency.
‡‡ A sub-account is an account within a separate account established or maintained by an insurance company. John Hancock’s group annuity contracts offer varioussub-accounts. These separate accounts operate apart from and are insulated from the general assets and liabilities of the company. Sub-accounts are not insured by the FDIC, the Federal Reserve Board or any agency and are subject to investment risks, including possible loss of the principal amount invested.
P 17324-BO-G
E 09/10-18143KIT351405
6

Sources: National Association of Theatre Owners, natoonline.org and boxofficemojo.com; Allears.net historical ticket prices; U.S. Department of Commerce, Bureau ofEconomic Analysis, National income and product accounts and U.S. Department of Energy. Prices based on the years 1988, 1993, 1998 and 2008.
1 32
Things to consider when building your own portfolio
1. Determining your risk tolerance and strategy
To create a portfolio that is properly diversified (and with a risk level you are comfortable with), it’s necessary to determine your risk tolerance level. Complete our short Risk Quiz to help you understand your attitudestoward risk and return. Each Fund in our lineup is color-coded to match one of five risk categories. Then,research and select the appropriate funds to create your own portfolio mix.
2. Remember to consider investment and inflation risk
When choosing your investment options, be mindful of two other types of risk that can affect your savings: investment risk and inflation risk.
There are several types of investment risk inherent in different varieties of investments. For example:
Inflation risk refers to the fact that prices go up over time (as shown below). Invest too conservatively and the growth of yourretirement savings may not keep pace with inflation and tax increases.
This chart shows the impact inflation can have on the prices of everything from movie tickets to automobiles.
ENJOY GETT ING THERE | RET IREMENT PLANNING THAT’S AS EASY AS 1, 2, 3, GO!
P 17324-BO-G
E 09/10-18143
MOVIE T ICKET DISNEYLAND TICKET NEW CAR
20 years ago $4.11 $28.00 $13,932
15 years ago $4.14 $35.00 $16,871
10 years ago $4.69 $42.00 $20,364
Now $7.08 $75.00 $23,098
� Funds that invest in stocks can decline due to market,regulatory or economic developments.
� Foreign securities may carry risks such as currencyfluctuations and changes in political or economic conditions.
� Securities of smaller companies are generally more volatilethan those of larger, more established companies.
� Specific sectors may be more volatile than a broader rangeof industries. They may also be subject to additional risks,such as increased competition or changes in legislation orgovernment regulation affecting the sector.
� Funds investing in high-yield bonds are subject to additionalrisks, such as the increased risk of default.
If you think that Build Your Own Portfolio Mix may be for you, take the Risk Quiz,and then go to the Investment Options tab for more information and to pick yourinvestments. Then, proceed to the Go! tab and complete the enrollment form.
KIT351405
7

Predictable growth year after year.
Every dollar you contribute to this feature up to retirement builds a Benefit Base, which is used to determineyour future income in retirement. Once a year before you retire, the Benefit Base will increase by 3%.1
Greater certainty in retirement.
You will have a source of guaranteed income of up to 5% of your Vested Benefit Base during yourretirement years.
Protection from unpredictable markets.
The Benefit Base will never decline due to market downturns both before and after retirement.
1 The increase is calculated by applying the equivalent daily compounding rate of 3% to the Benefit Base for each day in the 12-month period preceding the anniversarydate. See the How it works section for more information.
Guaranteed Income for Life Select provides dependable income for your retirement yearsthat is protected from market conditions.
ENJOY GETT ING THERE | RET IREMENT PLANNING THAT’S AS EASY AS 1, 2, 3, GO!
1
3
2
Guaranteed Income for Life SelectRetirement planning that incorporates a guarantee Do you want to have a source of guaranteed income for the rest of your life? If so, thenGuaranteed Income for Life Select may be for you. It can add some certainty to yourretirement planning and help address some of your concerns.
Guaranteed Income for Life Select can give you:
P 17324-GIFLS-G
E 09/10-18143KIT351405
8

Is it right for you?
While having a source of guaranteed retirement income mightsound appealing, there are some important details you shouldconsider before determining whether it is right for you.
The benefits available under Guaranteed Income for Life Select are provided subject to the terms of your company’s qualified retirement plan. Before selecting thisfeature, speak to the plan’s administrator to find out if such benefits are permitted under the terms of your plan. You must meet both the requirements of this featureand of your plan before you can take withdrawals or begin taking retirement income.
2 See the “How it works” section for a definition of terms.3 For more information on the Spousal Option see the “And the benefits continue” section.4 The investment return and principal value of Guaranteed Income for Life Select Funds are not guaranteed and will fluctuate.5 See the “Important Considerations” section for more details.6 This fee can change in accordance with the provisions of your plan’s contract with John Hancock, but will not exceed 1%.
ENJOY GETT ING THERE | RET IREMENT PLANNING THAT’S AS EASY AS 1, 2, 3, GO!
Over the next few pages, you’ll find details on the terms and conditions regardingthis feature. Review them carefully before making your enrollment decision.
1 32
� If you are approaching retirement, it is important for you toknow that you must be invested in Guaranteed Income forLife Select for at least five years before you can take income.
� If you are planning on taking early retirement (before age65), your Lifetime Income Amount (LIA) will be set at 4% of the Vested Benefit Base2 instead of 5%. You must be atleast age 591⁄2 to begin taking income.
� If you choose to extend the benefit to include your spouse,your Lifetime Income Amount will be set at 4.5%.3 Both you and your spouse will need to be 65 years old to begintaking income.
� To maximize the benefits of Guaranteed Income for LifeSelect, it is important to regularly invest and not takewithdrawals before retirement. If you are planning on taking a withdrawal or loan, or transferring out money from theGuaranteed Income for Life Select Funds,4 your Benefit Basewill be reduced. Any excess withdrawal after retirement willreduce your LIA.
� You will always have access to the market value of yourinvestments. If your company terminates its contract withJohn Hancock and you do not have a distributable event, youwill lose your guarantees from the feature.5 In some cases,you may receive a refund of the fee for this feature for up tothree years. If you are eligible to receive distributions, youmay roll over your investments in this feature.
� There is an additional annual fee to invest in this feature.This fee is deducted from the market value on a monthlybasis, and is in addition to the expense ratio of the Fundthat you select and other applicable fees. The fee is 0.50% of the Benefit Base6.
P 17324-GIFLS-G
E 09/10-18143KIT351405
9

ENJOY GETT ING THERE | RET IREMENT PLANNING THAT’S AS EASY AS 1, 2, 3, GO!
Common concerns facing Americans today The average American faces a number of potential challenges and risks along the road to retirement. Three common concerns are:
7 “America Speaks Out on Retirement: 2007 Investor Research Study.” Plan Sponsor Magazine. June 2007.8 Older Americans 2008, Key Indicators of Well-Being study, Federal Interagency Forum on Aging-Related Statistics, March 2008.
What if something goes wrong?
You’ve planned well and you’ve worked hard towards saving for your retirement. But when you retire matters.
Whether the stock market is up or down around the time of your retirement can have a significant impacton how long your savings will last. You are most vulnerable to market downturns in the few years beforeand after you leave the workforce. Poor market returns, combined with any withdrawals you make, canseriously deplete your nest egg. And withdrawing money from investments that are already suffering lossesmeans you could run out of money during retirement.
Our Solution: Guaranteed Income for Life Select can help provide a source of retirement income protectedfrom unpredictable markets.
Will my savings last through retirement?
Thanks to improvements in medical care, Americans are living longer than ever.8 In addition, thetraditional view of retirement is being transformed as retirees move toward maintaining moreactive lifestyles.
Therefore your retirement might span 20, 30 or more years. An unsettling risk is that you mayoutlive your savings. You may be looking for a retirement income that you can depend on to lastthroughout your retirement.
Our Solution: Guaranteed Income for Life Select can provide greater certainty, with retirementincome that is guaranteed for life.
Will I have enough to retire?
It is a fact of life that the stock market is unpredictable. Foreseeing what your retirement savings willlook like in the future can be challenging.
Achieving the retirement lifestyle you envision for yourself won’t happen by accident – it takesplanning. The opportunity to build a predictable source of income can help you take control of yourretirement. 97% of Baby Boomers said achieving income for life was their top retirement priority.7
Our Solution: Guaranteed Income for Life Select can provide predictable growth of the Benefit Baseyear after year to help you plan for retirement with more confidence.
1
3
2
P 17324-GIFLS-G
E 09/10-18143KIT351405
10

ENJOY GETT ING THERE | RET IREMENT PLANNING THAT’S AS EASY AS 1, 2, 3, GO!
How it worksGuaranteed Income for Life Select can provide you with benefits when you’recontributing to your retirement account and when you begin withdrawing from yourretirement account.
Finding a dependable source of retirement income
Investing in Guaranteed Income for Life Select is easy, and you can allocate as much or as little of your contributions as you want to this feature. It is a flexible choice that canprovide a guaranteed amount of income that you can count on in retirement.
Every dollar you contribute to Guaranteed Income for Life Select adds to the Benefit Baseuntil retirement.9 While your market value can increase or decrease on a daily basis, theBenefit Base is unaffected by market fluctuations.10 Also, each year before retirement, onthe Anniversary of your first contribution, the Benefit Base will increase by 3%.11
Retirement income that lasts a lifetime
Guaranteed Income for Life Select will provide you with a steady, predictable source ofincome every year, beginning on the day you are eligible to retire and choose to starttaking income, and lasting as long as you live.
When you decide to retire, the Vested Benefit Base is used to determine the LifetimeIncome Amount (LIA).12 If the vested portion of the market value of your investments inthe Guaranteed Income for Life Select Funds is higher than the Vested Benefit Base whenyou retire, the Vested Benefit Base will increase to match the market value. This meansthat the LIA is set at a higher amount. Note: Once the LIA is set, you can no longer makeadditional contributions to Guaranteed Income for Life Select.
If you take early retirement (after age 59½, but before 65), the LIA is set at 4% of theVested Benefit Base. However, if you retire at age 65, your LIA is set at 5%.
For example: Vested Benefit Base = $100,000 LIA = $5,000 (5%) every year for life
Before you start taking income:
� You must have been invested in Guaranteed Income for Life Select for at least five years13
� You must be at least age 59½.
9 The maximum Benefit Base is $5,000,000.00.10 The Benefit Base will be reduced if you take withdrawals, loans or transfer money out of this feature.11 The increase is calculated by applying the equivalent daily compounding rate of 3% to the Benefit Base for each day in the 12-month period preceding the Anniversary.
The Benefit Base is adjusted for such increase only once a year on the Anniversary. If the Benefit Base is reduced to zero at any time prior to an Anniversary, any interestaccrued after the most recent Anniversary will be forfeited.
12 Before establishing the LIA, you should consult your plan administrator to determine the vested percentage of the Benefit Base and how that will affect the amount of the LIA.13 This reset is waived for any contributions or transfers in during the first 120 days after your first contribution to Guaranteed Income for Life Select. However, this minimum
holding period will extend for five more years if your total contributions (other than regular contributions or regular loan repayments) to this option in any 365 day period exceed 20% of your Benefit Base.
1 32
P 17324-GIFLS-G
E 09/10-18143KIT351405
11

ENJOY GETT ING THERE | RET IREMENT PLANNING THAT’S AS EASY AS 1, 2, 3, GO!
Protection from declining markets
A G E
B E N E F I T B A S E M A R K E T V A L U E
5 9 6 0 6 1 6 2 6 3 6 4 6 5 6 6 6 7 6 8 6 9
VA
LU
E (
$)
Lifetime Income set at 5% of Benefit Base
G U A R A N T E E D L I F E T I M E I N C O M E
RE
TIR
EM
EN
T
Hypothetical example for illustrative purposes only.
Jim is six years from retiring, and concerned about not being able to recover if markets fall. He opted for Guaranteed Income forLife Select because every dollar he contributes builds the Benefit Base before retirement.14 Since the value of the Benefit Base isnot impacted by the markets, he is more confident investing in the market. In fact, the Benefit Base is guaranteed to increaseeach year. Jim can accurately predict his minimum Lifetime Income Amount, since he knows the Benefit Base will grow 3% eachyear before retirement.
When he retires at age 65, the Lifetime Income Amount is set at 5% of the Vested Benefit Base. He’s not concerned aboutpoor markets, since he knows he can withdraw the Lifetime Income Amount each year, no matter how long he lives, evenafter his account balance has dropped to zero. Guaranteed Income for Life Select allowed him to participate in the marketswhile not leaving his entire retirement to chance.
DefinitionsThe Benefit Base is the sum of all contributions and transfers to Guaranteed Income for Life Select, reduced bywithdrawals, transfers and loans before retirement. It is completely independent of the actual market value of yourinvestments in this feature; it has no cash value and cannot be withdrawn.
The Market Value is the amount your investments are worth if cashed out at a particular point in time. Your marketvalue changes as the market goes up and down.
P 17324-GIFLS-G
E 09/10-18143KIT351405
12

ENJOY GETTING THERE | RET IREMENT PLANNING THAT’S AS EASY AS 1, 2, 3, GO!
14 Reduced by withdrawals, loans and transfers from this feature.
Participation in strong markets
G U A R A N T E E D L I F E T I M E I N C O M E
RE
TIR
EM
EN
T
A G E
B E N E F I T B A S E M A R K E T V A L U E
4 9 5 1 5 3 5 5 5 7 5 9 6 1 6 3 6 5 6 7 6 9
VA
LU
E (
$)
Lifetime Income set at 5% of Benefit Base
Hypothetical example for illustrative purposes only.
Julie is a conservative investor and, given recent market events, is less comfortable investing in the markets. She choseGuaranteed Income for Life Select and contributed regularly. Since the Benefit Base is guaranteed never to decline due to poormarkets, it will never be less than what she contributes.14 Plus, the Benefit Base will grow 3% each year before retirement.
When Julie retires at age 65, if the market value is higher than the Benefit Base, the Benefit Base is set to equal her marketvalue. The Lifetime Income Amount will then be set at 5% of this elevated Vested Benefit Base for as long as she lives.Although her minimum scenario was 3% growth, Julie benefited from being invested in the markets, while never risking theBenefit Base.
1 32
DefinitionsThe Lifetime Income Amount (LIA) is the amount that you can withdraw every year in retirement regardless of marketconditions – guaranteed. It is available to you when you are eligible to retire and have set the LIA.
The Vested Benefit Base is the portion of the Benefit Base comprised of all employee contributions and employercontributions that you have allocated to this feature and in which you are vested in accordance with the vestingschedule of your retirement plan. Your plan administrator will be able to provide details on the vesting schedule foryour retirement plan. It has no cash value and cannot be withdrawn.
P 17324-GIFLS-G
E 10/10-181511
Benefit Base grows
KIT351405
13

ENJOY GETT ING THERE | RET IREMENT PLANNING THAT’S AS EASY AS 1, 2, 3, GO!
And the benefits continueIn addition to predictable growth and guaranteed income in retirement, this simplefeature provides a wide range of other benefits.
You’re in controlYou can choose from a range of professionally managed asset allocation investment options15 with this feature. Once you meet the retirement criteria, you choose:
� When to retire
� How much of the LIA to withdraw each year.
However, any unused portion cannot be carried over to the next year and any excess taken will result in adecreased Benefit Base and the LIA will be recalculated. (See “Important considerations”).
The ability to transfer moneyinto this featureIf you have money in other qualified retirement plans, youcan transfer a limited amount of money into GuaranteedIncome for Life Select at any time before retirement, as long as your plan permits. In some instances this may result in a reset of your minimum holding period.16 If your totalcontributions (other than regular contributions or regular loanrepayments) to this feature in any 365-day period exceed20% of the Benefit Base, your minimum holding period willreset to five years. (See “Important considerations”).
The Spousal Option17
If you are married, the spousal option allows you to extendthe lifetime income guarantee to cover both you and yourspouse. However, the LIA is reduced to 4.5% of the VestedBenefit Base. You may elect the spousal option only:
� At the time the LIA is set,
� When you and your spouse are at least age 65, and
� Where your spouse is your sole beneficiary under yourretirement plan.
Once you elect this option you cannot change this election.You should consult a tax adviser to discuss your situation.
A choice of investments You can invest in a broad choice of diversified18 professionallymanaged asset allocation portfolios with Guaranteed Incomefor Life Select. Simply determine your risk tolerance level tohelp select the appropriate fund for you.
15 The revenue John Hancock receives from any of its internally-managed Funds, and certain asset allocation portfolios (i.e., GIFL Select Funds) may be higher than those advisedor sub-advised exclusively by unaffiliated mutual fund companies. John Hancock’s affiliates provide advisory and sub-advisory services to these internally-managed funds.
16 You have to wait five years from the date of the transfer before you can take income. However, this reset is waived for any transfers in during the first 120 days after your firstcontribution to this feature.
17 For purposes of the Spousal Option, the term “spouse” is determined in accordance with the provisions of your company’s retirement plan. Note that the federal Defense ofMarriage Act (“DOMA”) defines “marriage” as a “legal union between one man and one woman as husband and wife”, and “spouse” as “a person of the opposite sex whois a husband or a wife”. DOMA applies in determining the meaning of any federal legislation, including federal tax law. Accordingly, a person who is considered a spouseunder an employer’s plan but who does not satisfy the definition of a “spouse” under DOMA will not be eligible for the favorable income-deferral options or treatmentotherwise available under federal tax law for spouses who satisfy such definition. You are strongly advised to discuss your situation with a tax advisor before selectingGuaranteed Income for Life Select.
18 Diversification does not guarantee a profit or assure against a loss. There is no guarantee that an investment strategy will achieve its objective.
P 17324-GIFLS-G
E 09/10-18143KIT351405
14

ENJOY GETT ING THERE | RET IREMENT PLANNING THAT’S AS EASY AS 1, 2, 3, GO!
1 32
Leaving Guaranteed Income for Life SelectIf your company terminates its contract withJohn Hancock
If you are not eligible to receive distributions, you forfeit anybenefits in connection with Guaranteed Income for LifeSelect, but we will refund the fees you paid for up to threeyears prior to the contract termination date.
If you are eligible to receive distributions under your plan, you may roll over the market value of your investments inthis feature (and, if applicable, the Vested Benefit Base andLIA) to an available eligible John Hancock investmentvehicle19 and maintain your guarantees.
If you are eligible to receive distributions and choose not toroll over to an eligible John Hancock investment vehicle, youwill not receive a fee refund.
If your company terminates GuaranteedIncome for Life Select
If you are eligible to receive distributions under your plan, you may rollover the market value of your investments in thisfeature (and, if applicable, the Vested Benefit Base and LIA)to an available eligible John Hancock investment vehicle19
and maintain your guarantees.
If you are not eligible to receive distributions, you are entitled to the market value of your investments in this feature. The Benefit Base and LIA will be reduced to zero as of thetermination date.
If you leave your job
Should you change your job and you are eligible to receivedistributions, you may roll over the market value of youraccount (and, if applicable, the Vested Benefit Base and LIA) to an eligible John Hancock investment vehicle and maintainyour guarantees.19
If you choose to cancel Guaranteed Income for Life Select
If you decide to cancel Guaranteed Income for Life Select,you are entitled to the market value of your investments in this feature. The Benefit Base and LIA will be reduced tozero as of the termination date. Note: you will not be able to reselect this feature for a period of five years and your five-year minimum holding period will start all over again.
Upon deathNon-spousal beneficiary
Your beneficiaries receive the market value of theinvestments in this feature in a lump sum upon your death.The Benefit Base and, if applicable, the LIA will be reduced to zero as of your date of death.
Spouse as beneficiary
Before the LIA is set: � Your spouse can choose to assume the Vested Benefit
Base. Once they are 59½ and the minimum holdingperiod has expired, they can take a LIA of 4% of theVested Benefit Base for the rest of their life. If they wait to age 65, the LIA is set at 5%. Upon your spouse’sdeath, any remaining market value of the investments in this feature is distributed in a lump sum to thebeneficiaries determined by the plan.
� They can rollover the investments in this feature (and if applicable, the Vested Benefit Base and LIA) into an available eligible John Hancock investment vehicle.19
� They can also elect to receive the market value of theinvestments in this feature in a lump sum.
After the LIA is set:� If you selected the Spousal Option, your surviving spouse,
who must be the same person who was your spousewhen the spousal option was selected, can continue totake the LIA determined for you. This amount is availableto them for the rest of their life. Upon your spouse’sdeath, any remaining market value in the investments in this feature is distributed in a lump sum to thebeneficiaries determined by the plan.
� If you did not select the Spousal Option, your spouse can elect to receive the market value of the investmentsin this feature in a lump sum.
� If your spouse is not alive, or a different person is yoursurviving spouse, any remaining market value in theinvestments in this feature is distributed in a lump sum to the beneficiaries determined by the plan.
Important Considerations
19 Recipient rollover vehicles from John Hancock are subject to availability. Formore information call 1-888-695-4472. The fees, charges and expenses, aswell as certain of the terms, conditions and funding options of GuaranteedIncome for Life Select available to qualified retirement plans through thegroup annuity contract will be different from those applicable to a recipientrollover vehicle.
P 17324-GIFLS-G
E 09/10-18143KIT351405
15
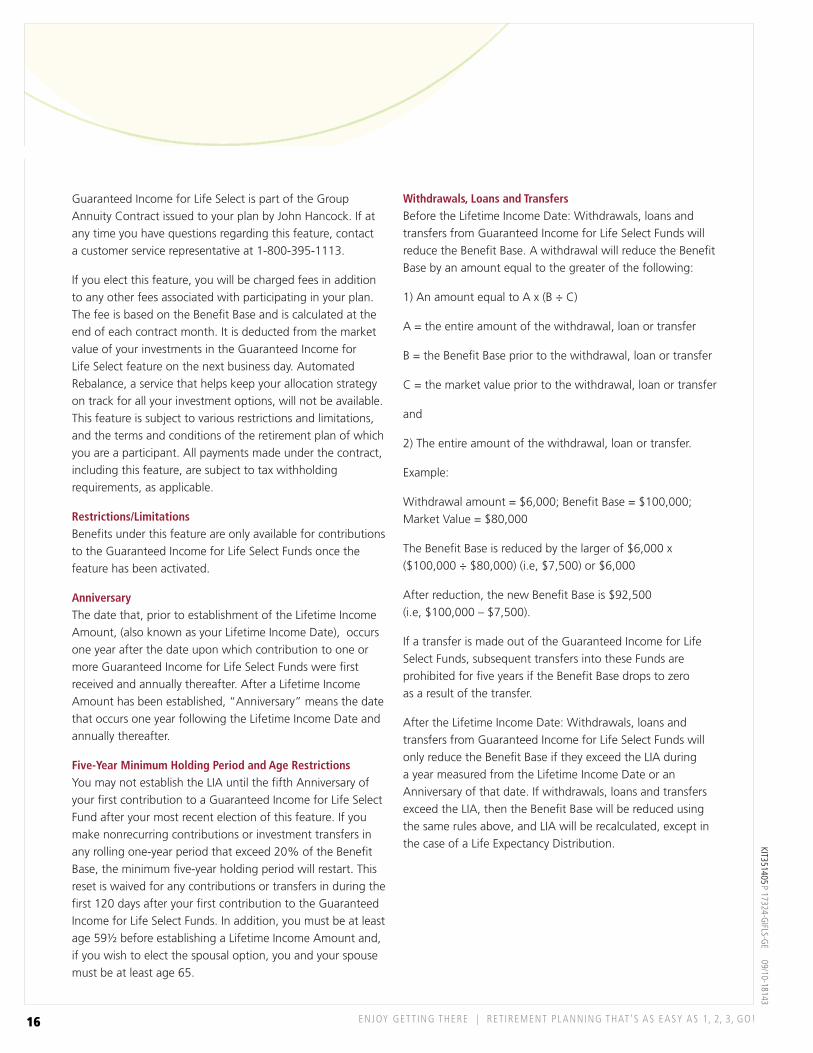
ENJOY GETT ING THERE | RET IREMENT PLANNING THAT’S AS EASY AS 1, 2, 3, GO!
Guaranteed Income for Life Select is part of the GroupAnnuity Contract issued to your plan by John Hancock. If atany time you have questions regarding this feature, contact a customer service representative at 1-800-395-1113.
If you elect this feature, you will be charged fees in addition to any other fees associated with participating in your plan.The fee is based on the Benefit Base and is calculated at theend of each contract month. It is deducted from the marketvalue of your investments in the Guaranteed Income for Life Select feature on the next business day. AutomatedRebalance, a service that helps keep your allocation strategyon track for all your investment options, will not be available.This feature is subject to various restrictions and limitations,and the terms and conditions of the retirement plan of whichyou are a participant. All payments made under the contract,including this feature, are subject to tax withholdingrequirements, as applicable.
Restrictions/LimitationsBenefits under this feature are only available for contributionsto the Guaranteed Income for Life Select Funds once thefeature has been activated.
Anniversary The date that, prior to establishment of the Lifetime IncomeAmount, (also known as your Lifetime Income Date), occursone year after the date upon which contribution to one ormore Guaranteed Income for Life Select Funds were firstreceived and annually thereafter. After a Lifetime IncomeAmount has been established, “Anniversary” means the datethat occurs one year following the Lifetime Income Date andannually thereafter.
Five-Year Minimum Holding Period and Age RestrictionsYou may not establish the LIA until the fifth Anniversary ofyour first contribution to a Guaranteed Income for Life SelectFund after your most recent election of this feature. If youmake nonrecurring contributions or investment transfers inany rolling one-year period that exceed 20% of the BenefitBase, the minimum five-year holding period will restart. Thisreset is waived for any contributions or transfers in during thefirst 120 days after your first contribution to the GuaranteedIncome for Life Select Funds. In addition, you must be at leastage 59½ before establishing a Lifetime Income Amount and,if you wish to elect the spousal option, you and your spousemust be at least age 65.
Withdrawals, Loans and Transfers Before the Lifetime Income Date: Withdrawals, loans andtransfers from Guaranteed Income for Life Select Funds willreduce the Benefit Base. A withdrawal will reduce the BenefitBase by an amount equal to the greater of the following:
1) An amount equal to A x (B ÷ C)
A = the entire amount of the withdrawal, loan or transfer
B = the Benefit Base prior to the withdrawal, loan or transfer
C = the market value prior to the withdrawal, loan or transfer
and
2) The entire amount of the withdrawal, loan or transfer.
Example:
Withdrawal amount = $6,000; Benefit Base = $100,000;Market Value = $80,000
The Benefit Base is reduced by the larger of $6,000 x($100,000 ÷ $80,000) (i.e, $7,500) or $6,000
After reduction, the new Benefit Base is $92,500 (i.e, $100,000 – $7,500).
If a transfer is made out of the Guaranteed Income for LifeSelect Funds, subsequent transfers into these Funds areprohibited for five years if the Benefit Base drops to zero as a result of the transfer.
After the Lifetime Income Date: Withdrawals, loans andtransfers from Guaranteed Income for Life Select Funds willonly reduce the Benefit Base if they exceed the LIA during a year measured from the Lifetime Income Date or anAnniversary of that date. If withdrawals, loans and transfersexceed the LIA, then the Benefit Base will be reduced usingthe same rules above, and LIA will be recalculated, except inthe case of a Life Expectancy Distribution.
P 17324-GIFLS-G
E 09/10-18143KIT351405
16

ENJOY GETT ING THERE | RET IREMENT PLANNING THAT’S AS EASY AS 1, 2, 3, GO!
Example: Benefit Base = $100,000; Market Value = $80,000; LIA = $5,000
Assume two withdrawals are made during the year: The first for $2,000 and the second for $4,000. The secondwithdrawal causes total withdrawals during the year toexceed the LIA.
The Benefit Base is reduced by the larger of $4,000 x($100,000 ÷ $80,000) (i.e, $5,000) or $4,000.
After reduction, the new Benefit Base is $95,000 ($100,000 –$5,000) and the new LIA is $4,750 (5% of $95,000).
Life Expectancy Distributions (LEDs)After retirement, the Vested Benefit Base will not decrease andthe LIA will not be recalculated if the withdrawals qualify asLife Expectancy Distributions (LEDs). LEDs, as determined byJohn Hancock and based on its understanding of the tax code,are withdrawals that satisfy all of the following conditions: (a) they are part of a series of periodic payments over your
life expectancy (or if applicable, the joint life expectancy ofyou and your spouse); (b) are paid to you to satisfy yourRequired Minimum Distribution requirements under Section401(a) (9) of the Internal Revenue Code (“RMD rules”); and (c) are withdrawn proportionately from the market value of all of your investment options under your plan (including theGuaranteed Income for Life Select Funds).
Subject to RMD rules, you are not required to withdraw themaximum LIA each year. The amount not withdrawn in anyyear, however, will not increase the LIA for any subsequent year.
John Hancock reserves the right to make any changesnecessary to comply with the Internal Revenue Code andTreasury Regulations.
Guaranteed Income for Life Select is available to Plan participants who elect to allocate all or a portion of their plan contributions to specified asset allocation portfoliosin the John Hancock investment lineup. Plan participants are charged an additional 0.50% annually applied to the market value of their contributions to these specifiedasset allocation portfolios. Plan participants may elect to participate in the Guaranteed Income for Life Select option at a later date if they do not elect the feature atthe time of enrollment.
Plan participants must be at least age 591⁄2 and have contributions in the specified asset allocation portfolios with the Guaranteed Income for Life Select option electedfor at least five (5) years before they are allowed to establish a Lifetime Income Amount and become eligible to begin making guaranteed withdrawals. Plan participants should consider the additional costs associated with electing the Guaranteed Income for Life Select option while deciding when and if to allocatecontributions to the specified asset allocation portfolios with the Guaranteed Income for Life Select option. Please contact your plan administrator if you have questionsabout the Guaranteed Income for Life Select option.
Although Guaranteed Income for Life Select provides a guaranteed income base as well as guaranteed minimum withdrawal benefits, Guaranteed Income for Life Selectinvestment options are variable investments and may lose value. Before the Lifetime Income Date, withdrawals (including loans and transfers out of this feature) willreduce the benefit base in the same proportion that the withdrawals reduces the market value of investments in this feature, or by the amount of the withdrawal ifgreater. However, after the Lifetime Income Date, this reduction will only apply when withdrawals during any year beginning after such date (or Anniversary thereof)exceeds the Lifetime Income Amount. The guarantees provided are contingent on the plan’s trustee’s election to continue maintaining its group annuity contract withJohn Hancock or the election of a participant to rollover his or her benefits to a recipient rollover vehicle available from John Hancock upon termination of participationin the plan or the termination of the group annuity contract by the plan’s trustee.
Guarantees of withdrawals provided under the Guaranteed Income for Life Select are supported by John Hancock’s general account and are contingent on the claims-paying ability of John Hancock and does not apply to the investment performance or safety of the underlying portfolios.
Important: If your employer, who is sponsoring your retirement plan, decides to leave John Hancock Retirement Plan Services, this will result in a loss of any guaranteesassociated with Guaranteed Income for Life Select, unless you qualify for, and elect to rollover your vested benefit base to an available, eligible John Hancockinvestment vehicle at that time.
If you think Guaranteed Income for Life Select may be for you, take the RiskQuiz and go to the Investment Options tab for information on each Fund. Then, proceed to the Go! tab and complete the enrollment form.
1 32
P 17324-GIFLS-G
E 09/10-18143KIT351405
17

ENJOY GETT ING THERE | RET IREMENT PLANNING THAT’S AS EASY AS 1, 2, 3, GO!
P 17324-S3-RQ-G
E 07/10-17324
The John Hancock Risk QuizSo far we’ve explored what your retirement will look like, how much it might cost and why contributing to your qualifiedretirement plan is a great way to get started toward your retirement dreams. You also need to have an idea of how comfortableyou are with investment risk – growing your money is important, but it is equally important that you are able to sleep at night.Take this Risk Quiz to find out your approach to risk and return. Fill in the number beside each item that applies to you in the“points” box, and add up the total number of points to determine your risk score.
Add up your points here for your total score:
Note the year you took this quiz:
Your age
� 20 – 29 � 50 – 59
� 30 – 39 � 60 or over
� 40 – 49
Which statement best describes your willingnessto accept risk in order to achieve potentiallyhigher returns?
� I am willing to accept a high level of risk in exchange for the potential for growth.
� I am willing to accept a moderate level of risk.
� I am willing to accept some risk in my investment options.
� I am willing to accept a little bit of risk in my investment options, but am concerned more with security.
� Security is my priority. I am willing to accept only a very low level of risk.
How many years until you plan to retire andbegin making withdrawals from your plan?
� 5 years � 20 years� 10 years � 25 years or more� 15 years
The value of some investments may fluctuatesignificantly over time. If you invest $10,000,what level of decline would you be willing totolerate over five years?
� Down to $9,500 (a 5% decline)� Down to $9,000 (a 10% decline)� Down to $8,500 (a 15% decline)� Down to $8,000 (a 20% decline)
How comfortable do you feel with at least aportion of your investments invested in thestock market?
� Very comfortable� Comfortable � Neutral � Uncomfortable � Very uncomfortable
Do you agree you can meet your retirement goalsbased on your current salary and savings outsideof your qualified investment plan?
� Strongly agree � Agree � Neutral � Disagree � Strongly disagree
P O I N T S
Your quiz results may change over time. We recommend that you take the Risk Quiz each year to make sure that your riskprofile accurately matches your risk tolerance. At any time you can take the Risk Quiz online (for participants in plans outsideof New York, www.jhpensions.com; for participants in plans domiciled in New York, www.jhnypensions.com).
1
P O I N T S
P O I N T S
P O I N T S
P O I N T S
P O I N T S
2
3
4
5
6
KIT351405
18

1 32
ENJOY GETT ING THERE | RET IREMENT PLANNING THAT’S AS EASY AS 1, 2, 3, GO!
P 17324-S3-RQ-G
E 07/10-17324
Now match your score to one of the risk strategies
LOW RISK HIGH RISK
6 – 10 points: Conservative
If the statements below apply to you, a conservative portfolio may be right for you:
Slow and steady is the best way to describe my approach to investing. I’m most comfortable contributing to my retirement plan on a regular basis and not taking much risk.
I don’t normally play the stock market but I realize it’s important to diversify my portfolio to meet my retirement goals.
11 – 15 points: Moderate
If the statements below apply to you, a moderate portfolio may be right for you:
I’m most comfortable knowing that my money is protected from extreme market fluctuations. I’m comfortable investing in some stocks, but I don’t want to worry that my retirement savings are losing money.
I want to increase my retirement savings but provide some protection for what I have.
16 – 20 points: Balanced
If the statements below apply to you, a balanced portfolio may be right for you:
I understand investing and am willing to take some risk to help my money grow, although I want a balance between building and protecting my money.
Middle of the road – that’s me. I want a diversified and balanced approach.
21 – 25 points: Growth
If the statements below apply to you, a growth portfolio may be right for you:
My aim is to make my money grow. I have very definite goals for my retirement and know that investing over the long term can help me reach them.
I understand there are short term risks and a potential for large swings in the stock market. But over the long term, I feel confident that equities offer the highest potential for growth.
26 – 29 points: Aggressive
If the statements below apply to you, an aggressive portfolio may be right for you:
I have an iron stomach and I’m willing to take significant risk for the chance to make money.
I have time to wait out market cycles because I’m confident that my savings will continue to grow.
Investment types:
Conservative Income Growth & Income Growth Aggressive Growth
30%
50%
10%5%
5%
40%
25%
20%
15%
KIT351405
19

ENJOY GETT ING THERE | RET IREMENT PLANNING THAT’S AS EASY AS 1, 2, 3, GO!
P 17324-S3-YC-GE 09/10-18143
Your choices:summing it up By now you have read about the investment strategiesavailable to you, and you should have a good ideaof how you want to allocate your contributions.
In previous sections you have also explored what your retirement might look like,how much it might cost and why contributing to your qualified retirement plan is a great way to start pursuing your retirement dreams.
To help make your final investment decision easier, here is an at-a-glance recap ofthe features of each of the asset allocation selections available.
.
KIT351405
20

ENJOY GETT ING THERE | RET IREMENT PLANNING THAT’S AS EASY AS 1, 2, 3, GO!
1 32
P 17324-S3-YC-GE 09/10-18143
KIT351405
21
In addition, you can also select an investment option that offers a source of guaranteed income in retirement. Guaranteed Incomefor Life Select can give you predictable growth year after year, greater certainty in retirement and protection from unpredictablemarkets.

ENJOY GETT ING THERE | RET IREMENT PLANNING THAT’S AS EASY AS 1, 2, 3, GO!
P 17324-S3-GE 09/10-18143
Step 3 – RecapBy now you have read about the investment strategies available and should have a good idea of how you want to allocate your contributions.
Before moving on to the Go! section, here’s a quick recap of what we covered in Step 3:
� The relationship between risk and return can have a significant impact on your investment strategy
� The benefits of diversification and asset allocation
� Your investment options and which may be right for you
� You should have a clear idea of your personal risk tolerance after completing the Risk Quiz.
Go to the Enrollment Worksheet in the Go! section and make note of your investment selection.
Now that you’ve decided where you’re headed, planned your route and chosen yourinvestment vehicles on the path to retirement, it’s time to complete the enrollment process.
KIT351405
22
• Lifestyle Portfolios
• Build your Own Portfolio
• Guaranteed Income for Life Select

GOGo!

Let the saving begin! You’ve completed Steps 1, 2 and 3. You’ve set a goal and knowhow much income you want in retirement and how much of yoursalary you need to contribute.
You’ve also chosen how to invest your retirement dollars. You’vecome a long way in a short time. Now it’s time to enroll in yourretirement plan and let the saving begin.
In this section, you’ll find:
� Your enrollment worksheet
� A summary of why people choose to invest with John Hancock
� Your enrollment form.
We’ve also included the following general information that might help answer any questionsyou might have, including:
� Frequently asked questions
� Important terminology.
GO
P 17324-GO
-Tab-GE 07/10-17324

Company Name Contract Number
DETACH PIN CARD HERE BEFORE SUBMITTING ENROLLMENT FORM.
Please keep this card for future reference.
STAPL
E
HERE
GA1216097316
Enrollment Form
ACT
ION
t Participant Name (Last Name, First Name, Initial) – PLEASE PRINT Social Security Number Date of Birth (mmm/dd/yyyy)
/ /
www.jhpensions.com 1-800-395-1113
DO NOT LOSE THIS CARD! Use this card for initial access to our ser-vices. If you forget your customized access information, you can use the PIN on the back and the balance from a recent statement to reset your account. Please note, THIS IS NOT YOUR CONTRACT NUMBER.
PIN card
Fill out each relevant section in pen, printing clearly. If you make any changes or corrections when completing this form, you must initial the correction to indicate that it was you that made the change. If you have any questions about your company’s quali� ed retirement plan with John Hancock Life Insurance Company (USA)*, contact your plan administrator.
The attached Personal Identi� cation Number (PIN) and PIN card provide you with initial access to your account. Once you have submitted this enrollment form, we will activate your PIN. Please detach and put in a safe place. Never share this information with anyone.
I elect to contribute I elect not to contribute
ACT
ION
t
Annual Contribution Increase
Your company’s quali� ed retirement plan has selected this automatic contribution increase service. If selected below, this service will automatically increase your pre-tax contributions by 1% each year until a maximum of 10% is reached. If you wish to automatically increase your contributions by a different percentage or up to a lower maximum+, you will need to log on to the participant website at www.jhpensions.com or call the John Hancock Participant Services toll-free number 1-800-395-1113.
PRE-TAX CONTRIBUTIONS
ACT
ION
t
I would like to contribute the following percentage per pay period on a pre-tax basis+: (Select one box only)
15% 12% 9% 6% 3% OR Other: ________ %
This election will be effective until my pre-tax contribution is scheduled to increase under the Annual Contribution Increase service.
YES! Please sign me up for Annual Contribution Increase. My � rst increase is scheduled to take place on December 31. However, if I enroll within 90 days of the date above, my � rst increase will not take effect until December 31 of the following year. If I provide an address via your website, one month before the contribution increase date an email will be sent reminding me of the option to change my decision.
+ Total contribution is subject to the plan’s contribution limit of 100% and IRS limits.
99270NPTT IPMEJOH DPNQBOZ
Q21917 19021.29387 22027021 462516.F12 Qbhf 2 pg 6

PIN number/No. de PIN
64543Serial number/No. de serie: KMNP654
09/18/2006
* Your company’s plan offers investment options through its group annuity contract with John Hancock Life Insurance Company (U.S.A.) Refer to your enrollment kit ‘Enjoy Getting There’ for an easy-to-understand overview of your investment options.
Contract Number
Social Security Number
ACT
ION
t
ALLOCATION INSTRUCTIONS Select your investments in one of two ways. A) EZChoice OR B) Your Choice. Be sure to review all of the material in your enrollment kit, including the Your Investment Options booklet and the Returns and Fees brochure, before choosing your investments.
A) EZChoice: I elect to allocate 100% of my contributions (including all transfer and employer contributions, if any, that I may provide instructions for) to a professionally managed and diversified asset allocation portfolio by checking below and signing the bottom of this section. Select one box only.A
CTIO
N
t
John Hancock Lifestyle Portfolios
Risk-based asset allocation using your risk tolerance, listed in order of lower to higher risk. It is recommended that you take the John Hancock Risk Quiz annually to determine if you are still invested in the Lifestyle Portfolio that matches your risk category.
100% Conservative Portfolio - CLS
100% Moderate Portfolio - MLS
100% Balanced Portfolio - BLS
100% Growth Portfolio - GLS
100% Aggressive Portfolio - ALS
I acknowledge that if I have checked multiple boxes above in A), if I have � lled out both A) and B) and/or John Hancock receives my contributions before it receives my allocation instructions, all my contributions will be allocated to the default investment option designated by my plan’s trustee, provided John Hancock has my � rst and last name and Social Security Number.
Signature of participant Date (mmm/dd/yyyy)
/ /
ACT
ION
t X
OR
B) YOUR CHOICE: I elect to allocate 100% of my contributions in the percentages and to the investment options indicated on the following pages. Remember to sign at the end of this section.
ACT
ION
t
07299
Q21917 19021.29387 22027021 462516.F12 Qbhf 3 pg 6

Social Security Number Contract Number
ACT
ION
tReminder: Skip the following pages if you selected EZChoice
• You can choose professionally constructed and mixed portfolios, create your own mix or a combination of both.
• If you wish us to allocate your ongoing contribu-tions and transfer contributions differently, you must complete BOTH columns below. If you complete only ONE column, and have both ongoing contributions and transfer contributions, both will be allocated in the same manner.
• ANY CHANGES MUST BE INITIALED IN PEN (including numbers crossed out or changed using correction fluid).
• A detailed Fund sheet is included in the your investment options booklet, which must accompany this form, along with a Returns and Fees brochure for the most recent month-end. These brochures contain important information for each investment option available under the group annuity contract, including details on the underlying mutual funds, investment objectives, level of risk, underlying allocations and
charges, as well as other important information about the investment options which should be carefully considered. Please read the brochures carefully prior to choosing your investment options.
• Each investment option you can choose from is color-coded to show the level of risk and potential return. Each color represents a different level of risk versus potential return, ranging from conservative (blue) to aggressive (red).
• The investment options available to you depend on the options chosen by your company’s plan.
• Other than the Guaranteed Interest Accounts, unit values depend on market performance and are NOT guaranteed.
• Employer contributions (if applicable) will be allocated in the same manner as your ongoing contributions, unless your company has indicated otherwise. Ongoing contributions include salary deferral contributions, salary deferral treated as catch-up contributions and, unless your company has indicated otherwise, employer
contributions (if applicable). Transfer contributions include rollovers from previous qualified plans (acceptable by your current plan) and any plan transfers through your current employer.
• Allocating assets to only one or a small number of the investment options (other than professionally constructed and mixed Portfolios) should not be considered a balanced investment program. In particular, allocating assets to a small number of options concentrated in particular business or market sectors will subject your contract account to increased risk and volatility. Examples of business or market sectors where this risk may be particularly high include: a) technology-related businesses, including Internet-related businesses, b) small cap securities and c) foreign securities. We do not provide advice regarding appropriate investment option allocations. Contact your financial consultant for more details.
• The total sum of all percentages below must equal 100%
YOUR CHOICEBelow are all the investment options available to you. Select a percentage for each investment option which your contributions will be placed in. Note that the sum of all percentages must equal 100%. Complete and sign appropriate pages and return all pages of this form to your plan sponsor.
LIFESTYLE PORTFOLIOS (listed in order of lower to higher risk) The John Hancock Lifestyle Portfolios are sub-advised by MFC Global Investments. To benefit from the convenience of the Lifestyle Portfolios – each already mixed and balanced – just select the option below that best suits your risk profile. The pie charts below represent the investment option’s risk strategy and correspond to the risk profiles from the Risk Quiz available in your enrollment kit or online at www.jhpensions.com.
GVOE OBNF POHPJOH USBOTGFS
Lifestyle Fund - Conservative Portfolio CLS & &
Lifestyle Fund - Moderate Portfolio MLS & &
Lifestyle Fund - Balanced Portfolio BLS & &
Lifestyle Fund - Growth Portfolio GLS & &
Lifestyle Fund - Aggressive Portfolio ALS & &
TVCUPUBM & &POHPJOH USBOTGFS
THE GUARANTEEd INCOmE FEATURE - GUARANTEEd INCOmE FOR LIFE SELECT If you are selecting Guaranteed Income for Life Select, ensure you provide your gender and date of birth. You should review the Guaranteed Income for Life Select brochure before selecting this option.
FemalemaleGender
GVOE OBNF POHPJOH USBOTGFS
Select Asset Allocation Conservative Portfolio- sub-advised by MFC Global Investment Mgmt SAC & &
Select Asset Allocation Moderate Portfolio- sub-advised by MFC Global Investment Mgmt SAM & &
Select Asset Allocation Balanced Portfolio- sub-advised by MFC Global Investment Mgmt SAB & &
Select Asset Allocation Growth Portfolio- sub-advised by MFC Global Investment Mgmt SAG & &
TVCUPUBM & &POHPJOH USBOTGFS
07299
Q21917 19021.29387 22027021 462516.F12 Qbhf 4 pg 6

Social Security Number Contract Number
ACT
ION
t
GUARANTEED INCOME FEATURE
GVOE OBNF POHPJOH USBOTGFS
Select Core Fundamental Holdings Portfolio- sub-advised by MFC Global Investment Mgmt SFH & &
Select Core Diversi� ed Growth & Income Portfolio- sub-advised by MFC Global Investment Mgmt SGI & &
Select Core Global Diversi� cation Portfolio- sub-advised by MFC Global Investment Mgmt SGD & &
TVCUPUBM & &POHPJOH USBOTGFS
INdIvIdUAL INvESTmENT OPTIONS (listed in order of lower to higher risk)
Conservative
FUND NAME ONGOING TRANSFER
Npofz Nbslfu Gvoe - sub-advised by MFC Global Investment Management MMR % %
SUBTOTAL % %ONGOING TRANSFER
Income
FUND NAME ONGOING TRANSFER
Upubm Sfuvso Gvoe- sub-advised by PIMCO TRF % %Pqqfoifjnfs Joufsobujpobm Cpoe Gvoe- managed by OppenheimerFunds, Inc. OIB % %
SUBTOTAL % %ONGOING TRANSFER
Growth & Income
FUND NAME ONGOING TRANSFER
Xbtijohupo Nvuvbm Jowftupst Gvoe- managed by American Funds WMI % %U/ Spxf Qsjdf Frvjuz Jodpnf Gvoe - managed by T. Rowe Price D&G % %
SUBTOTAL % %ONGOING TRANSFER
Growth
FUND NAME ONGOING TRANSFER
Gjefmjuz Dpousb Gvoe- managed by Fidelity® CON % %Uif Hspxui Gvoe pg Bnfsjdb- managed by American Funds GFA % %Hspxui Joefy Gvoe- managed by Vanguard Group, Inc. LGI % %
SUBTOTAL % %ONGOING TRANSFER
Growth
FUND NAME ONGOING TRANSFER
Gvoebnfoubm Jowftupst- managed by American Funds AFI % %Qsvefoujbm Kfoojtpo Nje Dbq Hspxui Gvoe- Investing solely in Prudential JennisonMid Cap Growth Fund JMG % %Nje Wbmvf Gvoe- sub-advised by T. Rowe Price MVF % %U/ Spxf Qsjdf Tnbmm Dbq Wbmvf Gvoe - managed by T. Rowe Price MSO % %Nje Dbq Joefy Gvoe - sub-advised by MFC Global Investment Management MCI % %Tnbmm Dbq Wbmvf Gvoe- sub-advised by Wellington Mgmt SMV % %
SUBTOTAL % %ONGOING TRANSFER
Aggressive Growth
FUND NAME ONGOING TRANSFER
FvspQbdjgjd Hspxui Gvoe- managed by American Funds EPG % %TNBMMDBQ Xpsme Gvoe- managed by American Funds ASW % %Tnbmm Dbq Hspxui Joefy Gvoe-managed by Vanguard Group, Inc. VSG % %Joufsobujpobm Wbmvf Gvoe- sub-advised by Templeton® ITV % %Pqqfoifjnfs Efwfmpqjoh Nbslfut Gvoe- managed by OppenheimerFunds, Inc. DMK % %EGB Fnfshjoh Nbslfut Wbmvf Gvoe- managed by DFA DEM % %
SUBTOTAL % %ONGOING TRANSFER
The total sum of all percentages for Ongoing and Transfer contributions must each equal 100%.
07299
Q21917 19021.29387 22027021 462516.F12 Qbhf 5 pg 6

Social Security Number Contract Number
ACT
ION
t
Signature of participant Date (mmm/dd/yyyy)
/ /X
Group annuity contracts are issued by John Hancock Life Insurance Company (U.S.A.) (John Hancock USA). In New York, products are issued by John Hancock Life Insurance Company of New York (John Hancock New York). John Hancock Investment Management Services, LLC, a registered investment adviser, provides investment information relating to the contract. NOT FDIC INSURED | MAY LOSE VALUE | NOT BANK GUARANTEED | NOT INSURED BY ANY GOVERNMENT AGENCY
© 2010 John Hancock Life Insurance Company (U.S.A.), a Manulife Financial company. All rights reserved.
+ Please contact your John Hancock USA client account representative should you have any questions about the system limitations as they relate to the pro-rating process.
I acknowledge that if I have �lled out both A) and B) and/or John Hancock USA receives my contributions before it receives my allocation instructions and/or have not signed below, all my contributions will be allocated to the default investment option designated by my plan trustee, provided John Hancock USA has my �rs t and last name and Social Security Number. If my allocation instructions do not equal 100%, John Hancock will pro-rate the allocation instructions I have provided to equal 100%, to the extent that the company’s system can process pro-rating based on the instructions provided. In the event that John Hancock USA cannot pro-rate my incorrect instructions due to system limitations+ all my contributions will be allocated to the default investment options designated by my plan trustee.
I understand that, if I have elected Guaranteed Income for Life Select, I acknowledge that I have reviewed a copy of the Guaranteed Income for Life Select brochure and that I have carefully read and understand this document together with the other materials provided in my enrollment kit. I understand that the bene�ts provide by Guaranteed Income for Life Select are subject to the terms and conditions of both the featureas well as the retirement plan of which I am a participant. By selecting to allocate any contributions to one or more of the Guaranteed Income for Life Select Funds and by signing below, I agree to the terms, conditions, restrictions and fees applicable to this feature option. I understand there is an annual fee of 0.5% for this feature that is in addition to the Expense Ratio for such Funds. This fee is calculated based on the Bene�t Base, and deducted monthly from the market value of my investments in the Guaranteed Income for Life Select Funds.
I understand that, if I have elected Guaranteed Income for Life Select, but failed to provide my Date of Birth or Gender information, my selection will not be acted upon. In cases where 100% of my investment instructions were allocated to the Guaranteed Income for Life Select Fund(s), all my contributions will be invested into the contract’s Default Investment Option. If my investment instructions were only partially allocated to the Guaranteed Income for Life Select Fund(s), those instructions will be pro-rated across the other funds that I have selected. I further understand upon provision of the missing information to John Hancock, my election of Guaranteed Income for Life Select will be activated and my account will be automatically reallocated at such time to implement my original instructions on this form.
Annual Contribution Increase is a registered trademark of John Hancock Life Insurance Company (U.S.A.) and is used under license by John Hancock Life Insurance Company of New York.
07299
Q21917 19021.29387 22027021 462516.F12 Qbhf 6 pg 6


Signature of participant Date (mmm/dd/yyyy)
Beneficiary designation information below is solely for the benefit of the plan administrator. This information shall not be maintained or acted upon by John Hancock USA. Please report any change to this information directly to the plan administrator at your company.
Please note that your plan may be subject to the joint and survivor annuity requirement. If it is, please check with your plan administrator as a different beneficiary form may be required. Your plan administrator can tell you if this requirement applies to your plan. For other plans, you must elect your spouse as sole Primary Beneficiary, unless he/she consents in writing to your naming another Primary Beneficiary.
Primary Beneficiary
I understand that I must elect my spouse as sole Primary Beneficiary under this plan unless he/she consents in writing to my naming another Primary Beneficiary. (Please see your plan administrator for a Spousal Consent Form if naming a Primary Beneficiary other than your spouse.)
I understand that the following designation becomes null and void in the event of my marriage. I will promptly inform my plan administrator of any change in my marital status.
Married participant Unmarried participant
Extra sheet attached (If additional space is required, please attach a separate page providing all designation information and the percentage share for each.)
I hereby designate the above individual(s) as my beneficiary(ies) to receive the benefit payable (if any) under this plan in respect of my death. I understand that if I outlive my Primary Beneficiary, benefits will be paid to my estate on my death unless I designate a Contingent Beneficiary(ies).
Address City State Zip Code
Social Security Number Date of birth (mmm/dd/yyyy) Relationship to participant % Share
/ /
Name (Last name, First name, Initial) Telephone number
Contingent Beneficiary
Address City State Zip Code
Social Security Number Date of birth (mmm/dd/yyyy) Relationship to participant % Share
/ /
/ /
Name (Last name, First name, Initial) Telephone number
X
Contingent Beneficiary
Address City State Zip Code
Social Security Number Date of birth (mmm/dd/yyyy) Relationship to participant % Share
Name (Last name, First name, Initial) Telephone number
/ /
Contingent Beneficiary
Address City State Zip Code
Social Security Number Date of birth (mmm/dd/yyyy) Relationship to participant % Share
Name (Last name, First name, Initial) Telephone number
/ /
Social Security Number Contract Number
ACT
ION
t
Participant Name (Last Name, First Name, Initial) – PLEASE PRINT
Beneficiary Designation Form 07299
Q21917 19021.29387 22027021 462516.F12

Blank Page

ENJOY GETT ING THERE | RET IREMENT PLANNING THAT’S AS EASY AS 1, 2, 3, GO!
P 17324-GO
-GE 10/10-18511
GO
Frequently asked questionsWhat are the IRS contribution limits for 2010?
The contribution limit for 2010 is $16,500. If you are 50 yearsof age or older, you may be eligible to contribute an additionalannual catch-up amount of $5,500.
How do I change investments in myretirement account?
To move money between investment options available underyour plan through John Hancock, simply visit us online, callour toll-free number or complete an Investment Changeform, available from your plan administrator.
Investment changes (also referred to as “exchanges” or“inter-account transfers”) are subject to our short-termtrading policy and may be cancelled or rejected if not withinthe policy guidelines, which are available online. Redemptionfees or market value adjustments may be associated withexchanges from particular investment options and aredescribed on applicable fund sheets. In addition, participanttrade activity may be restricted in a particular investmentoption if the underlying fund manager determines aparticipant’s trading is excessive.
What are my options if I leave my job?
Even if you leave your job, your contributions and your earningsbelong to you. Generally speaking, you have several options.You can roll over your money into an individual retirementaccount or you may be able to transfer it to a new employer’splan. Both of these options give your money the potential to keep growing, tax-deferred. You can also take a cashdistribution, which is taxable as ordinary income and will besubject to a 10% penalty tax if you are under the age of 591⁄2.
Call 1-888-695-4472 to speak with a Rollover EducationSpecialist, who can help you review your distribution optionsdiscuss the advantages and disadvantages of each option or introduce you to your plan’s financial representative.
Can I make changes to my contributionamount or allocation strategy?
Absolutely! You can contribute more or less of your salary(subject to plan limits) or change your allocation instructions at any time. You may be able to make changes over the phoneor online – check with your plan administrator for details.
Can I withdraw my money if I need it?
Depending on your plan’s features, you may be able towithdraw your contributions and earnings in situations offinancial hardship or life-changing events. Once youwithdraw them, however, your contributions will be taxed.Additionally, if you are under the age of 591⁄2, you will besubject to a 10% penalty tax.
As an alternative, some qualified retirement plans offer participants the opportunity to take a loan against their contributions.
Check with your plan administrator for details of what’savailable under your plan.
How will I stay informed about my accountbalance and performance?
You will receive quarterly retirement account statementsdetailing your account balance, investment optionperformance and personal rates of return. You can also go online at any time to view your account.
How do I contact John Hancock RetirementPlan Services?
Call toll-free: 1-800-395-1113 (English)Para ayuda en español, por favor marque: 1-800-363-0530
Monday to Friday – 7 A.M. to midnight (ET)Saturday – 9:30 A.M. to 5 P.M. (ET)
Customer service representatives are available to assist youweekdays between 8 A.M. to 8 P.M. (ET)
Visit the website:
KIT351405
1
www.jhpensions.com.

ENJOY GETT ING THERE | RET IREMENT PLANNING THAT’S AS EASY AS 1, 2, 3, GO!
P 17324-GO
-GE 10/10-18511
Important terminologyKIT351405
2
401(k) plan: a defined retirement contribution plan qualified under theInternal Revenue Code that allows employees to contribute pre-tax dollarsthrough salary deferral.
Annual rate of return: the percentage change (gain or loss) in asubaccounts value from the last trading day of the previous year. Return mayalso be shown for shorter or longer time periods.
Assets: the cash and other investments in a qualified retirement plan.
Beneficiary: a person chosen by a participant to take ownership of theparticipants assets in a qualified retirement plan in the event of theparticipants death.
Bond: represents money borrowed by the bonds issuer from the bondspurchaser. The bond is the issuers promise to repay the debt on a specificdate (or dates) at a specified rate of return.
Bond Funds: Bonds are issued by corporations and governments. When anissuer sells a bond, it is borrowing money from the purchaser. In return, theissuer agrees to pay interest periodically and to repay the amount invested(principal) at a future date when the bond matures. The interest earned isbased on the length of the loan and the credit status of the issuer. The valueof bonds typically increases as interest rates fall and vice versa.
Capital: the amount originally invested, also known as the principalinvestment.
Capital appreciation: an increase in the price of an investment.
Compound interest: interest paid on both the principal invested and theinterest previously earned.
Contribution: the amount of money an employee or an employercontributes into a qualified retirement plan.
Diversification: the practice of spreading risk by investing in several assetclasses with different risk characteristics.
Dividend: the portion of a companys earnings that is paid to an investor bythe company (after tax and overhead is paid) received by the investor, paid bythe company.
Dollar cost averaging: a technique whereby an investor contributes thesame amount on a fixed schedule, regardless of changes in the market. Onaverage the investor should end up buying more of a security at a lower priceand fewer investments at a higher price.
Expense ratio: This material shows expenses for a specific unit class forinvestment options available under a John Hancock group annuity contract.The Expense Ratio (ER) includes John Hancocks administrative maintenancecharge (AMC), sales and service fee and the expenses of any underlyingmutual fund (based on expense ratios reported in the most recentprospectuses available as of the date of printing) and is subject to change.John Hancocks AMC will be reduced if John Hancock or an affiliate receivesasset-based distribution charges (12b-1 fees), sub-transfer agency fees orother fees from an unaffiliated underlying mutual fund or its agent(s). Thesefees, collectively, range from 0% to 0.50%. The amount of the AMC chargedunder each sub-account has been determined net of such fees. Theunderlying fund expense is determined by the underlying mutual fundcompany and may be increased or decreased at any time to reflect changes inthe expenses of the underlying mutual fund or other factors. In addition,some fund companies charge exchange or redemption fees for mutual fundshares held for less than a certain period of time. Any such charges would bededucted from the value of a participants account. The ER applies daily at arate equivalent to the annual rate shown, and may vary to reflect changes inthe expenses of an underlying mutual fund and other factors. The ER doesnot include any contract-level or participant recordkeeping charges. Suchcharges, if applicable, will reduce the value of a participants account.
For internally-managed Funds advised and sub-advised exclusively by JohnHancock's affiliates, the total fees John Hancock and its affiliates receive fromthese Funds may be higher than those advised or sub-advised exclusively byunaffiliated mutual fund companies. These fees can come from the Fund ortrust's Rule 12b-1, sub-transfer agency, management, AMC or other fees,and may vary from Fund to Fund. Except for certain asset allocationportfolios (i.e., the Lifestyle Portfolios and Guaranteed Income FeaturePortfolios), John Hancock uses the revenue received from 12b-1, sub-transfer
agency, and management fees to determine the AMC for that Fund, suchthat the sum of 12b-1, sub transfer agency, management fees and AMCreceived by John Hancock equals 0.50%.
For the most current Expense Ratio information available for each investmentoption, please refer to the most recent monthly Returns and Fees listingavailable from John Hancock upon request. For more information, pleasecontact your Plans financial representative.
There may be an asset charge, which is calculated on the total value of assetsunder your Plans contract. The range is 0% to 4%. For more details contactyour Plan administrator. A Sales & Service Fee or Sales Expense RecoveryCharge (SERC) may be included in the total annualized asset charge underyour Plans contract. These fees may be billed to the Plan sponsor or deductedfrom participants accounts, if permitted by the Plan. This fee represents thecharge for compensation to the financial representative for services providedto the Plan. It may also include a charge for other Plan expenses, such as TPAfees that are negotiated between your Plans trustee(s) and your Plans TPA orfinancial representative, or for other services provided by John Hancock.
Commissions: The appropriately licensed financial representative that thePlan designates may be eligible for compensation in connection with the saleand service of the Plan. This compensation can be based on a percentage ofthe Plans a) contributions received, not to exceed 5% and/or b) assets undermanagement, not to exceed 1.4%.
Price Credits: Provided certain conditions are met, John Hancock may pay aportion of the charge for any asset-based commission, as noted in item (b)above, eligible to the appropriately licensed financial representativedesignated by the Plans trustee(s). The remaining charge for any commissionsthat are to be charged under the Plan and payable by the Plans trustee(s) isshown in the Proposal and Recordkeeping Agreement.
The financial representative who sold and now services the Plan may also beeligible for different levels of commission. The level of commission isdetermined by the financial representative and the Plans trustee(s). Certaincharges under the Plan are directly related to the level of commission.
Additional Compensation: Certain financial representatives (firms) may allowJohn Hancock to participate in retirement products training and educationmeetings, conferences and seminars (programs) attended by the firms salesforce. John Hancock may agree to make payments out of its own resources tothe firm in order to attend these programs. Firms may receive payments inconnection with programs sponsored by John Hancock, includingreimbursement for travel expenses and lodging for persons attending suchprograms. John Hancock may also agree to pay additional compensation tofirms based on other calculation methods, which may include the level ofsales or assets attributable to the firm. These payments, which maysometimes be referred to as revenue sharing, assist in John Hancocks effortsto promote the sale of its retirement products. Not all firms receive suchpayments and the amount of the payments varies. These payments could besignificant to a firm. John Hancock determines which firms to support and theextent of the payments it is willing to make. John Hancock generally choosesto support firms that have a strong capability to distribute John Hancockretirement products and that are willing to cooperate with John Hancockspromotional efforts.
John Hancock hopes to benefit from these payments by increasing sales ofJohn Hancock retirement products, which would result in additional revenuefor John Hancock and its affiliates. In consideration for these payments, afirm may feature John Hancock retirement products in its sales system or givepreferential access to members of its sales force or management. Thesepayments may provide the firm with an incentive to favor John Hancockretirement products. In addition, certain firms may have other compensationarrangements with John Hancock or its affiliates that are not related to JohnHancock retirement products.
The total amount of any commissions and additional compensation isreported annually to the Plan Administrator on the Form 5500 Schedule Aprovided by us. Contact your Plans financial representative for informationspecific to your Plan.
Fixed income investments: investments that pay a stated rate of returnon a fixed schedule.
Fund manager: the company that is responsible for selecting the
ENJOY GETT ING THERE | RET IREMENT PLANNING THAT’S AS EASY AS 1, 2, 3, GO!
P 17324-GO
-GE 10/10-18511
GO
KIT351405
3
investments that are bought and sold in order to meet a mutual fundsinvestment objectives.
Group annuity: an insurance contract issued to your qualified retirementplan, under which you may choose from several different investment optionsand under which you may also have the option to purchase a fixed annuityupon retirement.
Guaranteed interest account: an account through which contributionscan be accumulated with interest in John Hancocks general funds, asapplicable. As long as money is kept invested until it matures, John Hancockguarantees the return of both the principal investment and interest earned,less any applicable contract charges, according to the terms of the groupannuity contract and subject to the claims-paying ability of John Hancock.Guaranteed Interest Accounts are considered a very low-risk investment andare designed to preserve your contributions. These accounts are not insuredby the FDIC or any governmental agency.
Holding: a general term for the underlying investments of your investmentoptions under your plans group annuity contract. Holdings may includestocks, bonds and other types of investments. It may also include shares ofan underlying mutual fund.
Inflation: the increase in the cost of living over time.
Inflation risk: the possibility that increases in the cost of living will reduceor eliminate the value of investment returns.
Investment objective: the goal of a sub-account or its underlying mutualfunds, used to help determine what type of investments to purchase.
Liquidity: describes how easily an asset can be converted into cash.
Money Market Funds: Money Market Funds underlying investmentsgenerally consist of issues from the U.S. Treasury, state and localgovernments, banks and large corporations. They are considered to beamong the safest of investments but have historically provided very low ratesof return compared to other types of investment options over the long term.Stable Value Funds preserve principal and provide book value liquidity on adaily basis while earning a consistent and competitive level of income. Theunderlying investments are diversified, high-quality fixed income instrumentswith an average duration of two to five years.
Mutual fund: a single investment that pools investors money to purchase anumber of different securities.
Participant: an employee (or former employee) who participates in anemployers qualified retirement plan.
Plan administrator: the individual named by your plan who is responsiblefor managing the day-to-day activities of this plan.
Portfolio: the range of investments that a fund or individual holds.
Qualified retirement plan: a retirement plan that receives favorable taxtreatment by meeting certain conditions defined in the Internal RevenueCode.
Retirement annual income: the yearly cash flow or income you willneed upon your retirement to fund your needs, expressed in todays dollars.
Retirement goal: the end result of your retirement planning. This is theamount of money necessary to produce a projected annual retirement incomeadequate to meet your needs. You must decide now how much you need atretirement in order to set plans in motion to get there. Your retirement goalwill help you determine your asset allocation strategy and contributionamount.
Rollover: a transfer of assets from one qualified retirement plan intoanother qualified retirement plan or similar investment vehicle.
Salary deferral: the process of setting aside a portion of a participantspre-tax pay to contribute to a company-sponsored qualified retirement plan.
Securities: a general term for the investments bought by the funds towhich you contribute; bonds, stocks, etc.
Short-Term Trading Policy: account changes are subject to JohnHancocks short-term trading guidelines when exchanging investment optionsunder your companys qualified retirement plan account. See Risk Disclosures
under the Investments Options tab for details of our policy guidelines.
Stock: a share of ownership in a corporation. This is also known as equity.
Stock Funds: when an underlying fund buys a stock, it becomes a partowner of that company. The value of a stock depends on how the company isdoing and how much people are willing to pay for stock in that company. Ingeneral, stocks are considered to be among the riskiest types of investments,as stock values can rise and fall over short time periods. Stocks, however,have also historically provided higher long-term returns than other types ofinvestments. John Hancocks group annuity contracts offer various sub-accounts. Sub-account types include Money Market Funds, Bond Funds andStock Funds.
Sub-account (Funds): an account within a separate account establishedor maintained by an insurance company that operates apart from and isinsulated from the general assets and liabilities of the company. Theseaccounts pool the contributions of more than one participant and invest themin securities or an underlying mutual fund.
Todays dollars: used in financial planning to indicate that the cost of agoal, product or service is expressed in terms of what it costs today, not whatit may cost in the future. It lets you look at projected numbers in the futurewithout the effect of inflation.
Unit value: the value of a unit of a sub-account. When you contribute to asub-account, your contributions purchase units of that Fund.
Vested balance: employee contributions are 100% vested at all times.Employer contributions, however, usually become fully vested after aspecified period of time, depending on the plans vesting schedule. Vestingrules vary from plan to plan. The Plan Administrator will be able to providedetails on the vesting schedule for a retirement plan.

Our industry-leading fund lineup
We provide retirement plans with a broad investment lineup.Our Funds are managed by multiple fund companies andinclude our simple and popular asset allocation portfolios.
Easy online access to helpful tools
Our easy-to-use retirement planning and educational toolscan help you understand and take control of your financialfuture. Register online to learn more about your investmentoptions, set a retirement goal, analyze your risk tolerance,calculate the impact of contributing and more. Visit
Easily manage your account
The participant website has everything you need to easilymanage your account in a secure online environment. Review and monitor your account and track your progresstoward your retirement goal. You can also rebalance yourasset allocations, conduct transactions and view yourquarterly statement.
Consolidate your savings and make it easyfor you to manage
Do you have retirement savings with a previous employer? If after review you choose to consolidate, it’s easy to roll over your qualified retirement savings into your currentaccount. Consolidating your retirement savings into oneaccount is more convenient and offers the ability to see allyour money on one statement, pay only one set of fees anduse a single toll-free number and website to manage yourretirement savings.
The convenience of “taking it with you”
Are you worried about what happens if you leave yourcurrent employer? Rest easy. The vested account balance of your retirement plan is portable and can go with youshould you change companies. Simply ask your planadministrator for details. You can also call 1-888-695-4472and speak with a Rollover Education Specialist, who cananswer questions about your distribution options.
ENJOY GETT ING THERE | RET IREMENT PLANNING THAT’S AS EASY AS 1, 2, 3, GO!
P 17324-GO
-GE 10/10-18511
Did you know? John Hancock has been providing benefits to American workers and theirfamilies for more than a century.
John Hancock – A trusted provider to millions of people just like you With John Hancock as your retirement plan provider, you have access to a company with a proven history of leadership, integrity and commitment to helping you save for your retirement.
Millions of American workers have chosen to place theirretirement savings in our trusted hands, thanks to:
KIT351405
4
www.jhpensions.com.

ENJOY GETT ING THERE | RET IREMENT PLANNING THAT’S AS EASY AS 1, 2, 3, GO!
P 17324-GO
-GE 10/10-18511
Enrollment WorksheetYou’ve been filling out this Worksheet as you go through each step, deciding how much you’ll need and how much to contribute,and selected your investment options. Use your answers to help you complete the Enrollment Form at the front of this section.
Step 1: How much do I need to get there?As you’ll recall, you chose a profile in Step 1 based on how you’d like to live, what your retirement goals are and the type oflifestyle you can envision yourself affording.
Selected Retirement Profile:
Step 2: How much should I contribute?In this step, you determined how much you need to contribute each month to reach your goal, using the Contribution Calculator.
Suggested Monthly Contribution:
Step 3: How will I invest my contributions?Here, you learned about the importance of asset allocation and about your investment options.
Go! Congratulations! You’ve made the important decision to enroll in your company’s qualified retirement plan. Proceed to the Enrollment Formand you’re on your way to pursuing your retirement dreams.
Date:
KIT351405
5
Lifestyle: You may have taken the Risk Quiz to find out your tolerance for investment risk. Fill in your risk strategy andcorresponding Lifestyle Portfolio.
:oiloftroP elytsefiL:ygetartS ksiR
Build Your Own: You may have decided to build your own Portfolio using the color-coded investment options provided in the Fund Sheets tab. Fill in your selected strategy.
Risk Strategy:
If you’re taking this approach, be sure you know what percentage of your contributions youwant allocated to each option you have selected. Make sure as well that your allocationselections total 100%.
Guaranteed Income for Life Select: You may have decided you want a source of guaranteed income for the rest of your life. Fill in your risk strategy and corresponding Guaranteed Income for Life Select Fund.
:dnuF:ygetartS ksiR


Investment Options

P 17324-INV-Tab-G
E 07/10-17324

Table of contents
Contract Number 99270
SECTION 1 How to read Returns and Fees 1
SECTION 2 How to read a fund sheet 4
SECTION 3 Asset manager profiles 6
SECTION 4 Risk disclosures 8
Investment options (Fund Code)DFA Emerging Markets Value Fund (DEM) 41EuroPacific Growth Fund (EPG) 36Fidelity Contra Fund (CON) 27Fundamental Investors (AFI) 30Growth Index Fund (LGI) 29International Value Fund (ITV) 39Lifestyle Fund - Aggressive Portfolio (ALS) 14Lifestyle Fund - Balanced Portfolio (BLS) 12Lifestyle Fund - Conservative Portfolio (CLS) 10Lifestyle Fund - Growth Portfolio (GLS) 13Lifestyle Fund - Moderate Portfolio (MLS) 11Mid Cap Index Fund (MCI) 34Mid Value Fund (MVF) 32Money Market Fund (MMR) 22Oppenheimer Developing Markets Fund (DMK) 40Oppenheimer International Bond Fund (OIB) 24Prudential Jennison Mid Cap Growth Fund (JMG) 31SMALLCAP World Fund (ASW) 37Select Asset Allocation Balanced Portfolio (SAB) 17Select Asset Allocation Conservative Portfolio (SAC) 15Select Asset Allocation Growth Portfolio (SAG) 18Select Asset Allocation Moderate Portfolio (SAM) 16Select Core Diversified Growth & Income Portfolio (SGI) 20Select Core Fundamental Holdings Portfolio (SFH) 19Select Core Global Diversification Portfolio (SGD) 21Small Cap Growth Index Fund (VSG) 38Small Cap Value Fund (SMV) 35T. Rowe Price Equity Income Fund (D&G) 26T. Rowe Price Small Cap Value Fund (MSO) 33The Growth Fund of America (GFA) 28Total Return Fund (TRF) 23Washington Mutual Investors Fund (WMI) 25
Important notes 42
351405-E01

a
b
c
d
In this section, you will find a list of all the investment options (“Funds”)* available in your plan. The Funds have beenorganized by their risk characteristics. This provides you with a quick summary of all the Funds, including theperformance and fees for each one. You can find detailed Fund sheets for every fund following this section.
Investment informationThis consists of the Fund name, the sub-adviser or Fund Manager
who manages the fund, and the inception date, which is when
the Fund was first available under a John Hancock group annuity
contract. At the end of each row is the Morningstar Benchmark
Category, which is a standard against which the Fund’s
performance can be measured.
Performance as of month-endThis is the Fund’s performance over the 1 month, 3 month and
year-to-date periods, up to the end of the last month.
Performance as of quarter-endThis is the Fund’s performance over the past 1, 3, 5, and 10 year
periods, as well as since the inception date, up to the end of the
most recent quarter.
Expense ratiosThe breakdown of the expense ratios is as of the end of the
recent quarter. Refer to the “Important Terminology” section of
the enrollment book for a description of fees.
Here are some tips for understanding the Returns and Fees summary:
* The investment options available in your plan include sub-accounts that invest directly in underlying mutual funds and/or Guaranteed Interest Accounts which are held in the JohnHancock general account.
1
SECTION 1 How to read Returns and Fees
351405-E01

Hypo
thet
ical
retu
rns
are
show
n in
bol
d
The
perf
orm
ance
dat
a pr
esen
ted
repr
esen
ts p
ast
perf
orm
ance
. Pas
t pe
rfor
man
ce is
no
guar
ante
e of
fut
ure
resu
lts a
nd c
urre
nt p
erfo
rman
ce m
ay b
e lo
wer
or
high
er t
han
the
perf
orm
ance
quo
ted.
An
inve
stm
ent
in a
sub
-ac-
coun
t w
ill fl
uctu
ate
in v
alue
to
refle
ct t
he v
alue
of
the
sub-
acco
unt’s
und
erly
ing
secu
ritie
s an
d, w
hen
rede
emed
, may
be
wor
th m
ore
or le
ss t
han
orig
inal
cos
t. P
erfo
rman
ce d
oes
not
refle
ct a
ny a
pplic
able
con
trac
t-le
vel o
r ce
rtai
n pa
rtic
ipan
t-le
vel c
harg
es, f
ees
for
guar
ante
ed b
enefi
ts if
ele
cted
by
part
icip
ant,
or
any
rede
mpt
ion
fees
impo
sed
by a
n un
derly
ing
mut
ual f
und
com
pany
. The
se c
harg
es, i
f in
clud
ed, w
ould
oth
erw
ise
redu
ce t
he t
otal
re
turn
for
a p
artic
ipan
t’s a
ccou
nt. F
or m
onth
-end
per
form
ance
, par
ticip
ants
ple
ase
call
1-80
0-39
5-11
13, p
lan
spon
sors
ple
ase
call
1-80
0-33
3-09
63.
Sub-
Adv
iser
/Fun
d M
anag
er
(Fun
d Co
mpa
ny)2A
Inve
stm
ent
Opt
ions
1A
Ince
ptio
n D
ate3A
1mon
th
3m
onth
YT
D1y
ear
3ye
ar
5ye
ar
10y
ear
Sinc
e
In
cept
ion
+
Sale
s&
se
rvice
fe
e *
=Ex
pens
eRa
tio
Mor
ning
star
Ben
chm
ark
Cate
gory
6A
AMC
+
Fund
Expe
nse
Ratio
Asse
t Allo
catio
n - L
ifest
yle
Portf
olio
sLif
estyl
e Fun
d - Co
nserv
ative
Portf
olio13
,68M
FC G
loba
l Inv
Mgm
t10
/02/
971.
84%
4.60
%9.
72%
10.4
7%3.
92%
4.82
%5.
11%
5.50
%0.
87%
0.10
%0.
37%
1.34
%Co
nser
vativ
e Allo
catio
nLif
estyl
e Fun
d - M
odera
te Po
rtfoli
o13,31
,68M
FC G
loba
l Inv
Mgm
t10
/02/
972.
63%
6.08
%10
.13%
11.1
0%1.
20%
3.92
%4.
22%
5.01
%0.
89%
0.10
%0.
37%
1.36
%Co
nser
vativ
e Allo
catio
nLif
estyl
e Fun
d - Ba
lance
d Port
folio9,1
3,68
MFC
Glo
bal I
nv M
gmt
10/0
2/97
3.12
%7.
21%
9.40
%10
.99%
-1.7
2%2.
96%
3.47
%4.
45%
0.92
%0.
10%
0.37
%1.
39%
Mod
erate
Allo
catio
nLif
estyl
e Fun
d - Gr
owth
Portf
olio13
,68M
FC G
loba
l Inv
Mgm
t10
/02/
973.
51%
8.44
%9.
18%
10.6
5%-4
.27%
1.92
%2.
15%
3.52
%0.
94%
0.10
%0.
37%
1.41
%La
rge B
lend
Lifes
tyle F
und -
Aggre
ssive
Portf
olio13
,68M
FC G
loba
l Inv
Mgm
t10
/02/
973.
86%
9.41
%8.
30%
9.67
%-7
.34%
0.73
%0.
89%
2.23
%1.
00%
0.10
%0.
37%
1.47
%La
rge B
lend
Guar
ante
ed In
com
e Fe
atur
eß
Selec
t Ass
et All
ocati
on Co
nserv
ative
Portf
olio13
,35,91
MFC
Glo
bal I
nv M
gmt
11/0
6/09
1.21
%3.
57%
8.98
%10
.26%
3.37
%4.
53%
4.99
%5.
77%
0.81
%0.
10%
0.37
%1.
28%
Cons
erva
tive A
lloca
tion
Selec
t Ass
et All
ocati
on M
odera
te Po
rtfoli
o13,35
,91M
FC G
loba
l Inv
Mgm
t11
/06/
091.
98%
4.98
%8.
57%
10.1
0%0.
42%
3.47
%3.
99%
5.29
%0.
83%
0.10
%0.
37%
1.30
%Co
nser
vativ
e Allo
catio
nSe
lect A
sset
Alloc
ation
Balan
ced P
ortfol
io13,35
,91M
FC G
loba
l Inv
Mgm
t11
/06/
092.
22%
5.81
%8.
78%
10.5
8%-2
.28%
2.71
%3.
35%
4.90
%0.
84%
0.10
%0.
37%
1.31
%M
oder
ate A
lloca
tion
Selec
t Ass
et All
ocati
on Gr
owth
Portf
olio13
,35,91
MFC
Glo
bal I
nv M
gmt
11/0
6/09
2.89
%7.
13%
8.28
%9.
88%
-4.7
7%1.
68%
2.03
%4.
02%
0.86
%0.
10%
0.37
%1.
33%
Larg
e Blen
dSe
lect C
ore Fu
ndam
ental
Holdi
ngs P
ortfol
io13,35
MFC
Glo
bal I
nv M
gmt
11/0
6/09
2.12
%5.
50%
7.05
%8.
48%
n/a
n/a
n/a
-0.3
8%0.
60%
0.42
%0.
37%
1.39
%M
oder
ate A
lloca
tion
Selec
t Core
Dive
rsifie
d Grow
th &
Incom
e Port
folio13
,35M
FC G
loba
l Inv
Mgm
t11
/06/
092.
48%
6.06
%6.
95%
8.65
%n/
an/
an/
a-1
.64%
0.59
%0.
42%
0.37
%1.
38%
Mod
erate
Allo
catio
nSe
lect C
ore Gl
obal
Dive
rsific
ation
Portf
olio13
,35M
FC G
loba
l Inv
Mgm
t11
/06/
092.
26%
6.74
%7.
09%
7.63
%n/
an/
an/
a-1
.04%
0.64
%0.
42%
0.37
%1.
43%
Wor
ld Al
locati
onß
Ther
e is a
n ad
dition
al fee
to in
vest
in th
e Gua
rant
eed
Inco
me F
eatu
re. I
t is 0
.50%
of t
he B
enefi
t Bas
e.
Cons
erva
tive
Mone
y Mark
et Fu
nd13
,82,83
,91M
FC G
loba
l Inv
Mgm
t07
/30/
99-0
.06%
-0.1
7%-0
.46%
-0.5
0%0.
56%
1.93
%1.
66%
3.68
%0.
34%
0.24
%0.
37%
0.95
%M
oney
Mar
ket T
axab
leM
oney
Mar
ket F
und
(VS)
curre
nt 7
-day
yield
is -0
.68%
. The
curre
nt yi
eld q
uotat
ion m
ore c
losely
refle
cts th
e cur
rent
earn
ings o
f the
Mon
ey M
arke
t Fun
d as
of t
he d
ate th
is re
port
was p
repa
red
while
the A
nnua
lized
retu
rns a
bove
refer
to a
spec
ific p
ast h
olding
pe
riod
refle
cting
the p
eriod
cove
red
by th
is re
port.
Due
to S
ales &
Ser
vice f
ee, t
he su
bacc
ount
's cu
rrent
yield
may
be l
ower
than
that
of th
e und
erlyi
ng tr
ust.
Alth
ough
the f
und
strive
s to
main
tain
a pos
itive y
ield,
ther
e is n
o gu
aran
tee th
e fun
d wi
ll be a
ble to
do
so.
An in
vestm
ent i
n th
e un
derly
ing
Mon
ey M
arke
t fun
d is
not i
nsur
ed o
r gua
rant
eed
by th
e Fe
dera
l Dep
osit
Insu
ranc
e Co
rpor
atio
n or
any
oth
er g
over
nmen
t age
ncy.T
he u
nder
lying
fund
seek
s to
pres
erve
a va
lue
of $
1.00
per
shar
e bu
t it i
s pos
sible
to lo
se
mon
ey b
y inv
estin
g in
the
Mon
ey M
arke
t Fun
d th
at in
vests
in th
e un
derly
ing
fund
.
Inco
me
Total
Retur
n Fun
d62,73
PIM
CO07
/30/
990.
78%
2.81
%10
.14%
10.4
9%10
.02%
7.49
%7.
03%
6.59
%0.
78%
0.00
%0.
37%
1.15
%In
term
ediat
e-Te
rm B
ond
Oppe
nheim
er Int
ernati
onal
Bond
Fund
56Op
penh
eim
erFu
nds,
Inc.
05
/02/
081.
59%
7.46
%11
.41%
9.07
%8.
03%
8.28
%10
.94%
9.55
%0.
63%
0.25
%0.
37%
1.25
%W
orld
Bond
Grow
th &
Inco
me
Wash
ington
Mutu
al Inv
estor
s Fun
d40,61
,65Am
erica
n Fun
ds05
/02/
033.
06%
7.33
%7.
16%
11.6
4%-8
.16%
0.08
%2.
30%
3.42
%0.
42%
0.45
%0.
37%
1.24
%La
rge V
alue
T. Ro
we Pr
ice Eq
uity I
ncom
e Fun
d30,31
T. Ro
we P
rice
07/3
0/99
2.67
%5.
02%
6.02
%8.
56%
-7.4
0%0.
22%
3.31
%9.
89%
0.93
%0.
10%
0.37
%1.
40%
Larg
e Valu
e
Grow
thFid
elity
Contr
a Fun
dFi
delit
y®
03/3
1/95
4.08
%11
.19%
10.5
0%13
.74%
-4.6
3%2.
90%
3.02
%12
.03%
1.02
%0.
46%
0.37
%1.
85%
Larg
e Gro
wth
The G
rowth
Fund
of Am
erica
9,40,6
1,65
Amer
ican F
unds
05/0
2/03
4.17
%8.
50%
5.69
%7.
26%
-7.2
2%0.
92%
0.18
%5.
41%
0.40
%0.
45%
0.37
%1.
22%
Larg
e Gro
wth
Grow
th Ind
ex Fu
ndVa
ngua
rd G
roup
, Inc
.05
/04/
075.
05%
10.6
9%8.
96%
11.6
5%-5
.11%
1.21
%-2
.54%
6.53
%0.
28%
0.50
%0.
37%
1.15
%La
rge G
rowt
hFu
ndam
ental
Inve
stors13
,31,61
,65Am
erica
n Fun
ds07
/25/
083.
63%
7.99
%6.
85%
9.22
%-6
.76%
2.38
%2.
71%
11.5
7%0.
39%
0.45
%0.
37%
1.21
%La
rge B
lend
Prud
entia
l Jen
nison
Mid
Cap G
rowth
Fund
Jenn
ison A
ssoc
iate
s LLC
05/0
7/10
3.43
%10
.03%
11.6
9%14
.66%
-1.8
3%5.
06%
0.31
%8.
58%
0.91
%0.
25%
0.37
%1.
53%
Mid-
Cap
Grow
thMi
d Valu
e Fun
d31,41
,91T.
Rowe
Pric
e05
/06/
052.
01%
5.87
%7.
15%
10.2
1%-1
.64%
4.42
%5.
95%
6.44
%1.
06%
0.00
%0.
37%
1.43
%M
id-Ca
p Va
lueT.
Rowe
Price
Small
Cap V
alue F
und59
T. Ro
we P
rice
04/2
7/01
3.81
%6.
28%
11.7
0%12
.91%
-2.8
5%2.
05%
9.25
%10
.80%
1.16
%0.
10%
0.37
%1.
63%
Small
Blen
dMi
d Cap
Inde
x Fun
d13,48
,57,76
,82,91
MFC
Glo
bal I
nv M
gmt
08/1
8/00
3.33
%9.
23%
14.5
3%16
.78%
-2.4
3%2.
91%
4.45
%5.
61%
0.55
%0.
00%
0.37
%0.
92%
Mid-
Cap
Blen
dSm
all Ca
p Valu
e Fun
d23,91
Wel
lingt
on M
gmt
05/0
6/05
3.33
%6.
51%
12.4
3%14
.77%
-1.3
0%3.
28%
9.76
%12
.17%
1.16
%0.
00%
0.37
%1.
53%
Small
Valu
e
Perf
orm
ance
As
of4A
Oc
tobe
r 31
, 201
0Ex
pens
e Ra
tio A
s of
****
Sept
embe
r 30
, 201
0Pe
rfor
man
ce A
s of
4A
Sept
embe
r 30
, 201
0
Hypoth
etical r
eturns
are sh
own in
bold
The p
erform
ance
data
presen
ted re
presen
ts past
perfo
rman
ce. Pa
st perf
orman
ce is n
o gua
rantee
of fu
ture r
esults
and c
urren
t perf
orman
ce ma
y be lo
wer o
r high
er tha
n the
perfo
rman
ce qu
oted.
An in
vestm
ent in
a sub
-ac-
count
will fl
uctua
te in
value
to re
flect
the va
lue of
the s
ub-ac
count’
s und
erlyin
g secu
rities
and,
when
rede
emed
, may
be w
orth m
ore or
less th
an or
iginal c
ost. P
erform
ance
does
not re
flect
any a
pplica
ble co
ntract
-level
or
certai
n part
icipan
t-level
charg
es, fe
es for
guara
nteed
bene
fits if
electe
d by p
articip
ant, o
r any
redem
ption
fees
impo
sed by
an un
derlyi
ng m
utual f
und c
ompa
ny. Th
ese ch
arges,
if inc
luded
, wou
ld oth
erwise
redu
ce the
total
ret
urn fo
r a pa
rticipa
nt’s a
ccoun
t. For
month
-end p
erform
ance,
partic
ipants
pleas
e call
1-800
-395-1
113,
plan s
ponso
rs plea
se cal
l 1-80
0-333
-0963
.
Sub-Ad
viser/
Fund M
anager
(Fu
nd Co
mpany
)2AInv
estme
nt Op
tions1A
Incept
ion
Date3A
1mont
h3m
onth
YTD1ye
ar3y
ear
5year
10
year
Since
Incept
ion
+
Sales&
ser
vice
fee*=
Expens
eRat
io
Mornin
gstar B
enchm
ark Ca
tegory
6A
AMC+
Fund
Expens
eRat
io
Asset A
llocatio
n - Life
style P
ortfoli
osLifes
tyle Fund
- Conser
vative Po
rtfolio13,6
8MFC
Global
Inv Mgm
t10/0
2/971.84
%4.60
%9.72
%10.4
7%3.92
%4.82
%5.11
%5.50
%0.87
%0.10
%0.37
%1.34
%Con
servativ
e Alloca
tionLifes
tyle Fund
- Moder
ate Portfo
lio13,31,68
MFC Glo
bal Inv
Mgmt
10/02/97
2.63%
6.08%
10.13%
11.10%
1.20%
3.92%
4.22%
5.01%
0.89%
0.10%
0.37%
1.36%
Conserv
ative Al
location
Lifestyle
Fund - Ba
lanced P
ortfolio9,13
,68MFC
Global
Inv Mgm
t10/0
2/973.12
%7.21
%9.40
%10.9
9%-1.7
2%2.96
%3.47
%4.45
%0.92
%0.10
%0.37
%1.39
%Mod
erate Al
location
Lifestyle
Fund - Gr
owth Por
tfolio13,6
8MFC
Global
Inv Mgm
t10/0
2/973.51
%8.44
%9.18
%10.6
5%-4.2
7%1.92
%2.15
%3.52
%0.94
%0.10
%0.37
%1.41
%Larg
e Blend
Lifestyle
Fund - Ag
gressive
Portfoli
o13,68
MFC Glo
bal Inv
Mgmt
10/02/97
3.86%
9.41%
8.30%
9.67%
-7.34%
0.73%
0.89%
2.23%
1.00%
0.10%
0.37%
1.47%
Large Bl
end
Guara
nteed
Incom
e Feat
ureß
Select As
set Alloca
tion Cons
ervative
Portfolio
13,35,91
MFC Glo
bal Inv
Mgmt
11/06/09
1.21%
3.57%
8.98%
10.26%
3.37%
4.53%
4.99%
5.77%
0.81%
0.10%
0.37%
1.28%
Conserv
ative Al
location
Select As
set Alloca
tion Mod
erate Po
rtfolio13,3
5,91MFC
Global
Inv Mgm
t11/0
6/091.98
%4.98
%8.57
%10.
10%0.4
2%3.4
7%3.9
9%5.29
%0.83
%0.10
%0.37
%1.30
%Con
servativ
e Alloca
tionSele
ct Asset A
llocation
Balanced
Portfoli
o13,35,91
MFC Glo
bal Inv
Mgmt
11/06/09
2.22%
5.81%
8.78%
10.58%
-2.28%
2.71%
3.35%
4.90%
0.84%
0.10%
0.37%
1.31%
Moderat
e Alloca
tionSele
ct Asset A
llocation
Growth P
ortfolio13,3
5,91MFC
Global
Inv Mgm
t11/0
6/092.89
%7.13
%8.28
%9.8
8%-4.7
7%1.6
8%2.0
3%4.02
%0.86
%0.10
%0.37
%1.33
%Larg
e Blend
Select Co
re Funda
mental H
oldings P
ortfolio13,3
5MFC
Global
Inv Mgm
t11/0
6/092.12
%5.50
%7.05
%8.4
8%n/a
n/an/a
-0.38%
0.60%
0.42%
0.37%
1.39%
Moderat
e Alloca
tionSele
ct Core D
iversified
Growth
& Incom
e Portfol
io13,35
MFC Glo
bal Inv
Mgmt
11/06/09
2.48%
6.06%
6.95%
8.65%
n/an/a
n/a-1.6
4%0.59
%0.42
%0.37
%1.38
%Mod
erate Al
location
Select Co
re Globa
l Diversif
ication P
ortfolio13,3
5MFC
Global
Inv Mgm
t11/0
6/092.26
%6.74
%7.09
%7.6
3%n/a
n/an/a
-1.04%
0.64%
0.42%
0.37%
1.43%
World
Allocati
onß Th
ere is a
n additio
nal fee
to inves
t in the
Guarant
eed Inc
ome Fea
ture. It
is 0.50%
of the B
enefit B
ase.
Conser
vative
Money M
arket Fun
d13,82,83
,91MFC
Global
Inv Mgm
t07/3
0/99-0.0
6%-0.1
7%-0.4
6%-0.5
0%0.56
%1.93
%1.66
%3.68
%0.34
%0.24
%0.37
%0.95
%Mon
ey Marke
t Taxab
leMon
ey Marke
t Fund (
VS) cur
rent 7-d
ay yield
is -0.68
%. The
current
yield q
uotation
more c
losely re
flects th
e curren
t earnin
gs of th
e Mone
y Marke
t Fund a
s of the
date th
is repor
t was pr
epared
while th
e Annua
lized ret
urns ab
ove ref
er to a
specific
past ho
lding
period r
eflectin
g the pe
riod cov
ered by
this rep
ort. Du
e to Sal
es & Ser
vice fee
, the sub
accoun
t's curre
nt yield
may be
lower t
han tha
t of the
underly
ing trus
t. Altho
ugh the
fund st
rives to
mainta
in a pos
itive yie
ld, there
is no gu
arantee
the fund
will be
able to
do so. An
investm
ent in t
he unde
rlying M
oney M
arket fu
nd is no
t insure
d or gua
ranteed
by the
Federa
l Depos
it Insura
nce Co
rporati
on or an
y other
govern
ment ag
ency.Th
e under
lying fu
nd seek
s to pre
serve a
value of
$1.00 p
er shar
e but it
is poss
ible to l
ose
money b
y inves
ting in t
he Mone
y Marke
t Fund t
hat inve
sts in t
he unde
rlying f
und.
Incom
eTota
l Return
Fund62,7
3PIM
CO07/3
0/990.78
%2.81
%10.1
4%10.4
9%10.0
2%7.49
%7.03
%6.59
%0.78
%0.00
%0.37
%1.15
%Inte
rmediat
e-Term
Bond
Oppenhe
imer Inte
rnationa
l Bond F
und56Opp
enheim
erFunds
, Inc.
05/02/08
1.59%
7.46%
11.41%
9.07%
8.03%
8.28%
10.94%
9.55%
0.63%
0.25%
0.37%
1.25%
World
Bond
Growth
& Inc
ome
Washing
ton Mutua
l Investo
rs Fund40,6
1,65Ame
rican Fu
nds05/0
2/033.06
%7.33
%7.16
%11.6
4%-8.1
6%0.08
%2.3
0%3.42
%0.42
%0.45
%0.37
%1.24
%Larg
e Value
T. Rowe
Price Eq
uity Inco
me Fund30,3
1T. R
owe Pri
ce07/3
0/992.67
%5.02
%6.02
%8.56
%-7.4
0%0.22
%3.31
%9.89
%0.93
%0.10
%0.37
%1.40
%Larg
e Value
Growth
Fidelity C
ontra Fu
ndFide
lity® 03/3
1/954.08
%11.1
9%10.5
0%13.7
4%-4.6
3%2.90
%3.02
%12.0
3%1.02
%0.46
%0.37
%1.85
%Larg
e Grow
thThe
Growth Fu
nd of Am
erica9,40
,61,65
America
n Funds
05/02/03
4.17%
8.50%
5.69%
7.26%
-7.22%
0.92%
0.18%
5.41%
0.40%
0.45%
0.37%
1.22%
Large G
rowth
Growth In
dex Fund
Vangua
rd Group
, Inc.
05/04/07
5.05%
10.69%
8.96%
11.65%
-5.11%
1.21%
-2.54%
6.53%
0.28%
0.50%
0.37%
1.15%
Large G
rowth
Fundame
ntal Inve
stors13,3
1,61,65
America
n Funds
07/25/08
3.63%
7.99%
6.85%
9.22%
-6.76%
2.38%
2.71%
11.57%
0.39%
0.45%
0.37%
1.21%
Large Bl
endPrud
ential Jen
nison Mi
d Cap Gr
owth Fun
dJen
nison As
sociate
s LLC
05/07/10
3.43%
10.03%
11.69%
14.66%
-1.83%
5.06%
0.31%
8.58%
0.91%
0.25%
0.37%
1.53%
Mid-Ca
p Grow
thMid
Value Fu
nd31,41,91
T. Rowe
Price
05/06/05
2.01%
5.87%
7.15%
10.21%
-1.64%
4.42%
5.95%
6.44%
1.06%
0.00%
0.37%
1.43%
Mid-Ca
p Value
T. Rowe
Price Sm
all Cap V
alue Fun
d59T. R
owe Pri
ce04/2
7/013.81
%6.28
%11.7
0%12.9
1%-2.8
5%2.05
%9.2
5%10.8
0%1.16
%0.10
%0.37
%1.63
%Sm
all Blend
Mid Cap
Index Fu
nd13,48,57
,76,82,9
1MFC
Global
Inv Mgm
t08/1
8/003.33
%9.23
%14.5
3%16.7
8%-2.4
3%2.91
%4.45
%5.61
%0.55
%0.00
%0.37
%0.92
%Mid
-Cap B
lendSma
ll Cap Va
lue Fund23,9
1Wel
lington
Mgmt
05/06/05
3.33%
6.51%
12.43%
14.77%
-1.30%
3.28%
9.76%
12.17%
1.16%
0.00%
0.37%
1.53%
Small V
alue
Perfor
mance
As of4A
Octobe
r 31,
2010
Expens
e Ratio
As of***
* Sep
tember
30, 2
010
Perfor
mance
As of4A
Septem
ber 30
, 201
0
351405-E01

Hypo
thet
ical
retu
rns
are
show
n in
bol
d
Sub-
Adv
iser
/Fun
d M
anag
er
(Fun
d Co
mpa
ny)2A
Inve
stm
ent
Opt
ions
1A
Ince
ptio
n D
ate3A
1mon
th
3m
onth
YT
D1y
ear
3ye
ar
5ye
ar
10y
ear
Sinc
e
In
cept
ion
Sale
s&
se
rvice
fe
e*
=Ex
pens
eRa
tio
Mor
ning
star
Ben
chm
ark
Cate
gory
6AAM
C+
+
Fund
Ex
pens
eRa
tio
Aggr
essi
ve G
row
thEu
roPac
ific Gr
owth
Fund
40,41
,47,61
,65,85
Amer
ican F
unds
05/0
2/03
3.15
%10
.28%
6.37
%6.
46%
-5.1
6%5.
16%
4.54
%11
.40%
0.56
%0.
45%
0.37
%1.
38%
Fore
ign L
arge
Blen
dSM
ALLC
AP W
orld F
und13
,61,65
Amer
ican F
unds
07/2
5/08
3.66
%12
.15%
17.3
5%18
.52%
-5.6
5%5.
35%
2.79
%9.
06%
0.82
%0.
45%
0.37
%1.
64%
Wor
ld St
ock
Small
Cap G
rowth
Index
Fund
41Va
ngua
rd G
roup
, Inc
.11
/03/
064.
45%
10.7
8%15
.79%
15.4
4%-3
.66%
2.64
%4.
22%
5.28
%0.
28%
0.50
%0.
37%
1.15
%Sm
all G
rowt
hInt
ernati
onal
Value
Fund
9,23,4
7,73
Tem
plet
on®
07/3
0/99
4.44
%9.
93%
5.29
%1.
70%
-7.3
3%2.
30%
4.70
%4.
09%
0.96
%0.
00%
0.37
%1.
33%
Fore
ign L
arge
Valu
eOp
penh
eimer
Deve
loping
Mark
ets Fu
nd21
,56Op
penh
eim
erFu
nds,
Inc.
11
/22/
963.
50%
13.8
6%20
.23%
26.7
3%4.
14%
14.8
3%17
.05%
16.3
7%1.
08%
0.25
%0.
37%
1.70
%Di
vers
ified
Emer
ging
Mar
kets
DFA E
mergi
ng M
arkets
Value
Fund
DFA
11/0
3/06
3.35
%13
.49%
15.6
4%21
.69%
-0.0
7%15
.47%
17.6
7%16
.94%
0.62
%0.
50%
0.37
%1.
49%
Dive
rsifie
d Em
ergin
g M
arke
ts
Mar
ket I
ndex
es (c
ompa
rison
pur
pose
s on
ly)
Stand
ard &
Poor'
s 500
Stoc
k Ind
ex3.
81%
7.96
%7.
84%
10.1
6%-7
.17%
0.63
%-0
.43%
n/a
n/a
n/a
n/a
n/a
n/a
Barcl
ay's
Capit
al Go
vt/Co
rp Bo
nd0.
01%
2.14
%8.
96%
8.73
%7.
46%
6.15
%6.
52%
n/a
n/a
n/a
n/a
n/a
n/a
Lippe
r Inter
natio
nal In
dex
3.66
%10
.19%
7.13
%6.
00%
-7.9
3%3.
50%
3.50
%n/
an/
an/
an/
an/
an/
aRu
ssell
2000
Inde
x4.
09%
8.40
%13
.59%
13.3
5%-4
.29%
1.62
%4.
04%
n/a
n/a
n/a
n/a
n/a
n/a
Perf
orm
ance
As
of4A
Oc
tobe
r 31
, 201
0Ex
pens
e Ra
tio A
s of
****
Sept
embe
r 30
, 201
0Pe
rfor
man
ce A
s of
4A
Sept
embe
r 30
, 201
0Hyp
othetic
al retu
rns are
show
n in bo
ld
Sub-Ad
viser/
Fund M
anager
(Fu
nd Co
mpany
)2AInv
estme
nt Op
tions1A
Incept
ion
Date3A
1mont
h3m
onth
YTD1ye
ar3y
ear
5year
10
year
Since
Incept
ion
Sales&
ser
vice
fee *=
Expens
eRat
io
Mornin
gstar B
enchm
ark Ca
tegory
6AAM
C+
+
Fund
Expens
eRat
io
Aggres
sive G
rowth
EuroPaci
fic Growt
h Fund40,4
1,47,61,
65,85
America
n Funds
05/02/03
3.15%
10.28%
6.37%
6.46%
-5.16%
5.16%
4.54%
11.40%
0.56%
0.45%
0.37%
1.38%
Foreign
Large Bl
endSMA
LLCAP W
orld Fun
d13,61,65
America
n Funds
07/25/08
3.66%
12.15%
17.35%
18.52%
-5.65%
5.35%
2.79%
9.06%
0.82%
0.45%
0.37%
1.64%
World
Stock
Small Ca
p Growth
Index Fu
nd41Van
guard G
roup, Inc
.11/0
3/064.45
%10.7
8%15.7
9%15.4
4%-3.6
6%2.6
4%4.2
2%5.28
%0.28
%0.50
%0.37
%1.15
%Sm
all Grow
thInter
national V
alue Fun
d9,23,47,
73Tem
pleton®
07/30/99
4.44%
9.93%
5.29%
1.70%
-7.33%
2.30%
4.70%
4.09%
0.96%
0.00%
0.37%
1.33%
Foreign
Large Va
lueOpp
enheimer
Develop
ing Marke
ts Fund21,5
6Opp
enheim
erFunds
, Inc.
11/22/96
3.50%
13.86%
20.23%
26.73%
4.14%
14.83%
17.05%
16.37%
1.08%
0.25%
0.37%
1.70%
Diversifi
ed Emer
ging Ma
rkets
DFA Eme
rging Ma
rkets Valu
e Fund
DFA11/0
3/063.35
%13.4
9%15.6
4%21.6
9%-0.0
7%15.
47%17.
67%16.9
4%0.62
%0.50
%0.37
%1.49
%Dive
rsified E
merging
Market
s
Marke
t Index
es (co
mpari
son pu
rposes
only)
Standard
& Poor'
s 500 St
ock Inde
x3.81
%7.96
%7.84
%10.1
6%-7.1
7%0.63
%-0.4
3%n/a
n/an/a
n/an/a
n/aBarc
lay's Cap
ital Govt
/Corp Bo
nd0.01
%2.14
%8.96
%8.73
%7.46
%6.15
%6.52
%n/a
n/an/a
n/an/a
n/aLipp
er Intern
ational In
dex3.66
%10.1
9%7.13
%6.00
%-7.9
3%3.50
%3.50
%n/a
n/an/a
n/an/a
n/aRuss
ell 2000
Index
4.09%
8.40%
13.59%
13.35%
-4.29%
1.62%
4.04%
n/an/a
n/an/a
n/an/a
Perfor
mance
As of4A
Octobe
r 31,
2010
Expens
e Ratio
As of***
* Sep
tember
30, 2
010
Perfor
mance
As of4A
Septem
ber 30
, 201
0
351405-E01
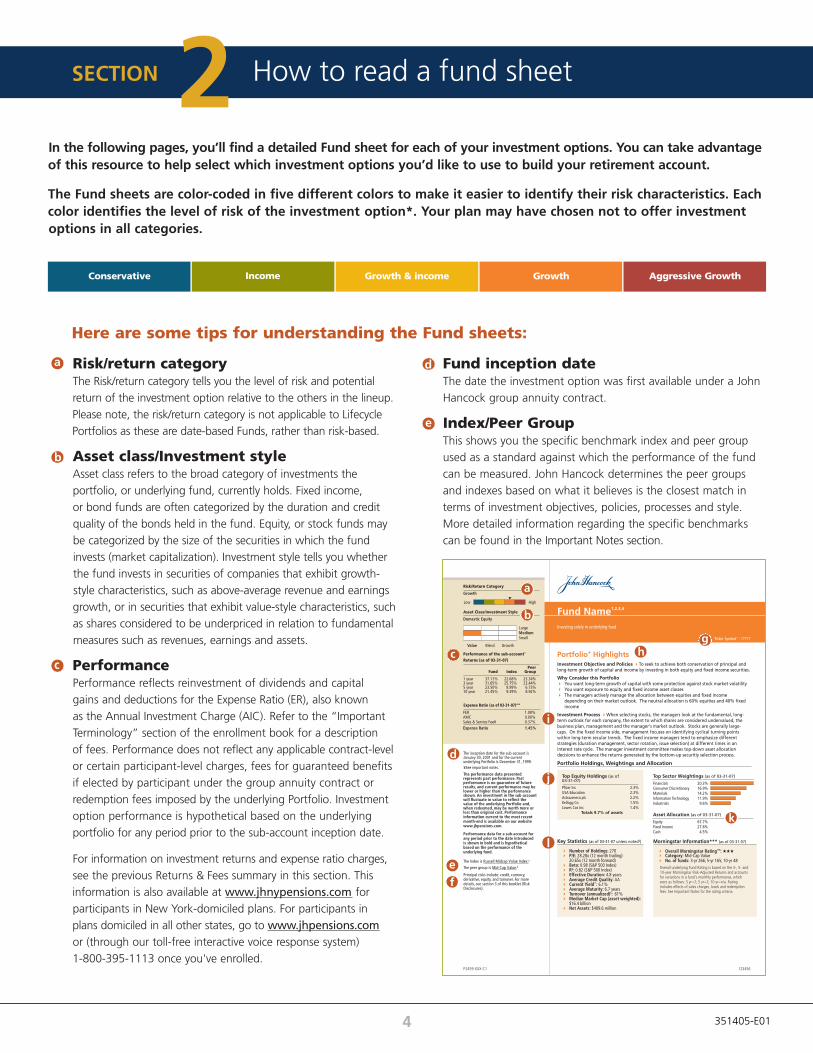
e
d
In the following pages, you’ll find a detailed Fund sheet for each of your investment options. You can take advantageof this resource to help select which investment options you’d like to use to build your retirement account.
The Fund sheets are color-coded in five different colors to make it easier to identify their risk characteristics. Eachcolor identifies the level of risk of the investment option*. Your plan may have chosen not to offer investmentoptions in all categories.
Risk/return categoryThe Risk/return category tells you the level of risk and potential
return of the investment option relative to the others in the lineup.
Please note, the risk/return category is not applicable to Lifecycle
Portfolios as these are date-based Funds, rather than risk-based.
Asset class/Investment styleAsset class refers to the broad category of investments the
portfolio, or underlying fund, currently holds. Fixed income,
or bond funds are often categorized by the duration and credit
quality of the bonds held in the fund. Equity, or stock funds may
be categorized by the size of the securities in which the fund
invests (market capitalization). Investment style tells you whether
the fund invests in securities of companies that exhibit growth-
style characteristics, such as above-average revenue and earnings
growth, or in securities that exhibit value-style characteristics, such
as shares considered to be underpriced in relation to fundamental
measures such as revenues, earnings and assets.
PerformancePerformance reflects reinvestment of dividends and capital
gains and deductions for the Expense Ratio (ER), also known
as the Annual Investment Charge (AIC). Refer to the “Important
Terminology” section of the enrollment book for a description
of fees. Performance does not reflect any applicable contract-level
or certain participant-level charges, fees for guaranteed benefits
if elected by participant under the group annuity contract or
redemption fees imposed by the underlying Portfolio. Investment
option performance is hypothetical based on the underlying
portfolio for any period prior to the sub-account inception date.
For information on investment returns and expense ratio charges,
see the previous Returns & Fees summary in this section. This
information is also available at www.jhnypensions.com for
participants in New York-domiciled plans. For participants in
plans domiciled in all other states, go to www.jhpensions.comor (through our toll-free interactive voice response system)
1-800-395-1113 once you've enrolled.
a
b
c
Conservative Income Growth & income Growth Aggressive Growth
Here are some tips for understanding the Fund sheets:
Fund inception dateThe date the investment option was first available under a John
Hancock group annuity contract.
Index/Peer GroupThis shows you the specific benchmark index and peer group
used as a standard against which the performance of the fund
can be measured. John Hancock determines the peer groups
and indexes based on what it believes is the closest match in
terms of investment objectives, policies, processes and style.
More detailed information regarding the specific benchmarks
can be found in the Important Notes section.
Fund Name1,2,3,4
Investing solely in underlying fund
Risk/Return Category
Growth
Low High
Asset Class/Investment Style
Domestic Equity
Large Medium Small
Value Blend Growth
Performance of the sub-account *
Returns (as of 03-31-07)
Fund Index Peer
Group
1 year 37.11% 22.68% 23.34% 3 year 31.65% 25.75% 23.44% 5 year 23.50% 8.99% 6.73% 10 year 21.45% 9.39% 8.92%
The inception date for the sub-account is January 30, 2001 and for the current underlying Portfolio is December 31, 1999.
The performance data presented represents past performance. Past performance is no guarantee of future results, and current performance may belower or higher than the performanceshown. An investment in the sub-accountwill fluctuate in value to reflect thevalue of the underlying Portfolio and, when redeemed, may be worth more orless than original cost.
The Index is Russell Midcap Value Index.
The peer group is Mid-Cap Value.
Portfolio * Highlights Investment Objective and Policies To seek to achieve both conservation of long - term growth of capital and income by investing in both equity and fixed income securities.
Why Consider this Portfolio You want long - term growth of capital with some protection against stock market volatility You want exposure to equity and fixed income asset classes The managers actively manage the allocation between equities and fixed income depending on their market outlook. The neutral allocation is 60% equities and 40% fixed income
Investment Process When selecting stocks, the managers look at the fundamental, long - term outlook for each company, the extent to which shares are considered undervalued, the business plan, management and the manager's market outlook. Stocks are generally large - caps. On the fixed income side, management focuses on identifying cyclical turning points within long - term secular trends. The fixed income managers tend to emphasize different strategies (duration management, sector rotation, issue selection) at different times in an interest rate cycle. The manager investment committee makes top - down asset allocation decisions to enhance the returns generated by the bottom - up securitiy selection process.
Portfolio Holdings, Weightings and Allocation
Top Equity Holdings (as of 03-31-07)
Pfizer Inc 2.3% USA Education 2.3% Astrazeneca plc 2.2% Kellogg Co 1.5% Lowes Cos Inc 1.4%
Totals 9.7% of assets
Top Sector Weightings (as of 03-31-07)
Financials 20.3% Consumer Discretionary 16.9% Materials 14.2% Information Technology 11.9% Industrials 9.6%
Asset Allocation (as of 03-31-07)
Equity 67.7% Fixed Income 27.8% Cash 4.5%
Key Statistics (as of 03-31-07 unless noted§)
Number of Holdings: 270 P/E: 28.28x (12 month trailing) 20.65x (12 month forward) Beta: 0.98 (S&P 500 Index) R²: 0.82 (S&P 500 Index) Effective Duration: 4.8 years Average Credit Quality: AA Current Yield^: 6.1% Average Maturity: 6.7 years Turnover (annualized)§: 61% Median Market Cap (asset weighted): $16.4 billion Net Assets: $489.6 million
Morningstar Information*** (as of 03-31-07)
Category: Mid - Cap Value No. of funds: 3 - yr 266; 5 - yr 165; 10 - yr 48
Expense Ratio (as of 03-31-07)**
FER 1.08% AMC 0.00% Sales & Service Fee¥ 0.37% Expense Ratio 1.45%
Principal risks include: credit, currency, derivative, equity, and turnover. For more details, see section 3 of this booklet (Risk Disclosures).
Performance information current to the most recent month-end is available on our website www.jhpensions.com.
e
h
P2459-XXX-C1 123456
Ticker Symbol+ : ?????
Overall underlying Fund Rating is based on the 3-, 5- and 10-year Morningstar Risk-Adjusted Returns and accounts for variations in a fund's monthly performance, which were as follows: 3 yr=2; 5 yr=2; 10 yr=n/a. Rating includes effects of sales charges, loads and redemption fees. See Important Notes for the rating criteria.
Overall Morningstar Rating™:
¥See important notes.
Performance data for a sub-account for any period prior to the date introduced is shown in bold and is hypothetical based on the performance of the underlying fund.
principal and
b
e
f
ghc
d
a
j
i
k
l
4
SECTION 2 How to read a fund sheet
351405-E01

* The placement of investment options within style boxes and according to potential risk/return shows John Hancock’s assessment of those options relative to one another and are not necessarilycomparable with other investment options available outside of John Hancock. John Hancock determines peer groups and indexes based on what it believes is the closest match in terms ofinvestment objectives, policies, processes and style. Each investment option’s peer group, index, and style box and risk/return spectrum placement is subject to change.
**The underlying mutual fund companies have the right to restrict trade activity without prior notice if a participant's trading is determined to be inexcess of their exchange policy, as stated in the fund prospectus which is available upon request. See the Important Notes section of theInvestments information for details of John Hancock's short-term trading policy.
Risk Disclosure(s)This section outlines potential risks associated with the particularsub-account. Detailed descriptions of these risks and of additionalrisks that apply to investments in mutual funds generally appearunder the Risk Disclosures section.
Ticker symbolWhen contributions are allocated to Funds under your employer’sgroup annuity contract with John Hancock, they will be held in asub-account (also referred to as “Fund”), which invests solely inshares of the specified underlying mutual fund. The ticker symbolsshown are for the underlying mutual funds in which sub-accountsare invested. The ticker symbols do not directly apply to the JohnHancock sub-account and therefore any public information accessedusing these symbols will not reflect the unit value of the subaccount,nor will such information reflect sub-account or contract-levelcharges under your plan’s group annuity contract.
Portfolio highlightsThe Objectives and Policies are described here, along withany features of interest about the Fund or its management.
Investment process This section explains the manager’s approach to investing and thetypes of investments the Fund typically holds, including sectorsor industries, markets, company size, etc.
Top holdingsThis shows you the investments that make up the largestproportion of assets in the portfolio. If this is a stock fund, you willalso see information on sector (or industry) weightings, showingyou how much the fund holds in each major industrial sector. If it isan international fund, you will also see information on countryweightings, or how much the fund holds in different countries.
Asset allocationThis shows how the fund’s holdings are allocated betweengeneral asset classes: equity, fixed income and cash.
Key statisticsThis section provides additional statistics about the underlyingfund. Following is some of the information you will find here,depending on whether the fund invests in bonds or stocks:
Number of holdings: The number of holdings the fund iscurrently invested in
g
f Turnover Ratio: The lesser of the total sales or purchases ofa fund in a year divided by its average monthly assets for theyear. The Turnover Ratio shown is based on the most recentavailable financial statements for the underlying mutual fund asof the date of printing and is subject to change
Net assets: The combined net value of all the holdings in the Fund
P/E Ratio: The current share price divided by twelve-months’earnings per share. Shows you what the value of a stock is,compared to its earnings strength
Beta: Shows the volatility of the fund relative to its benchmarkindex. A beta greater than 1.0 means the fund historically hasbeen more volatile than its index, while a beta less than 1.0 meansthe fund has historically been less volatile than its index
R-squared: The degree to which the fund and its benchmarkindex are correlated. The closer it is to 1.0, the more similar thehistorical performance between the two
Effective duration: The weighted maturity of a bond’s cashflows, used to estimate the price sensitivity of bonds for a givenchange in interest rates. Always equal to or shorter than thematurity, it shows the risk of interest rate changes on reinvestingthe periodic interest payments of a bond
Current yield: Current Yield is an annualized figure basedon the yield earned in the previous month net of annualinvestment charges. The Current Yield is as of the date ofprinting and is subject to change
Average maturity: The average of the maturity lengths (thedates the bonds come due) of all the bonds in a fixed income fund
Median market cap: The market capitalization of the single stock,which represents the middle of the fund’s securities ranked by marketcapitalization. Half of the securities in the fund is invested in stockslarger than the median and the other half is invested in stockssmaller than the median
Portfolio managementThis is the next section and provides information about the assetmanager responsible for managing the fund.
Important notesThis is the last section and provides important additionalinformation about the investment option’s holdings andhistorical performance, and our short term trading guidelines**.
j
k
l
h
i
5 351405-E01
How to read a fund sheet CONTINUED
6
SECTION 3 Asset manager profiles
John Hancock USAAll financial obligations under the group annuity contract are the sole obligation of John Hancock Life Insurance Company (U.S.A.).
John Hancock is a unit of Manulife Financial Corporation (the Company), a leading Canadian-based financial services group serving millions of customers in 22 countries and territories worldwide. Operating as Manulife Financial in Canada and Asia, and primarily through John Hancock in the United States, the Company offers clients a diverse range of financial protection products and wealth management services through its extensive network of employees, agents and distribution partners. Funds under management by Manulife Financial and its subsidiaries were Cdn$446 billion (US$440 billion) as at March 31, 2010.
4
Manulife Financial Corporation trades as 'MFC' on the TSX, NYSE and PSE, and under '0945' on the SEHK. Manulife Financial can be found on the Internet at www.manulife.com.
4
The John Hancock unit, through its insurance companies, comprises one of the largest life insurers in the United States. John Hancock offers a broad range of financial products and services, including whole life, term life, variable life, and universal life insurance, as well as college savings products, fixed and variable annuities, long-term care insurance, mutual funds and various forms of business insurance.
4
American Funds Group (American Funds)American Funds(R) are managed by Capital Research and Management Company SM - one of the world's largest investment management companies, serving investors since 1931. American Funds is one of the nation's largest mutual fund families, with more than $650 billion in investments and over 50 million shareholder accounts. American Funds uses a unique approach to portfolio management called the multiple portfolio counselor system. Developed 50 years ago, it blends teamwork with individual accountability and has provided American Funds with a sustainable method of achieving fund objectives.
4
Please note that the assets under management (more than $650bn) is as of March 31, 2009, while the number of shareholder accounts is as of December 31, 2008 (updated on annual basis).
4
Dimensional Fund AdvisorsWorking years ahead of the industry, Dimensional forged a new way to invest. The firm inaugurated its strategies in 1981 with early research into the stronger performance of small cap stocks. Later, a comprehensive analysis of stock prices worldwide deepened the strategy repertoire and set a new standard for portfolio design. This evolution reflects an abiding belief in financial science and the efficacy of capital markets. Broad Range of Strategies around the World $153.2 billion under Management as of September 30, 2009.
4
Fidelity Investments (Fidelity)Fidelity Investments is one of the world's largest providers of financial services including managed assets of $1.4 trillion, as of June 30, 2010. Fidelity offers investment management, retirement planning, brokerage, and human resources and benefits outsourcing services to over 20 million individuals and institutions as well as through 5,000 financial intermediary firms. The firm is the largest mutual fund company in the United States, the No. 1 provider of workplace retirement savings plans, the largest mutual fund supermarket and a leading online brokerage firm.
4
Franklin TempletonFranklin Resources, Inc., is a global investment management organization known as Franklin Templeton Investments. Our headquarters are located just south of San Francisco, in San Mateo, California. We have offices in over 30 countries around the world and offer investment solutions and services in more than 150. We offer investment solutions under the Franklin, Templeton, Mutual Series, Bissett, Fiduciary Trust and Darby Overseas names. We manage investment vehicles for individuals, institutions, pension plans, trusts, partnerships and other clients. The San Mateo, CA-based company has more than 60 years of investment experience and over $553 billion in assets under management as of December 31, 2009.
4
MFC Global Investment Management (U.S.A.) LimitedMFC Global Investment Management (U.S.A.) Limited is a Registered Investment Adviser for MFC Global's investment strategies managed in Canada and Hong Kong. These strategies are available to U.S. institutional investors through MFC Global Investment Management (U.S.), LLC, an affiliated company located in Boston, Massachusetts. MFC Global Investment Management® is the asset management division of Manulife Financial. MFC Global Investment Management's diversified group of companies and affiliates provide comprehensive asset management solutions for institutional investors, investment funds and individuals in key markets around the world. This investment expertise extends across a full range of asset classes including equity, fixed income and alternative investments such as oil & gas, real estate, timber, farmland, as well as asset allocation strategies
4
MFC Global Investment Management has investment offices in the United States, Canada, the United Kingdom, Japan, Hong Kong, and throughout Asia. As of September 30, 2009, assets managed exceeded US$277 billion. Additional information about MFC Global Investment Management may be found at www.mfcglobal.com. MFC Global Investment Management®, Manulife and the block design are trademarks of The Manufacturers Life Insurance Company and are used by it and its affiliates including Manulife Financial Corporation
4
351405-E01
7
MFC Global Investment Mgmt (U.S.), LLCMFC Global Investment Management (U.S.A.) Limited is a Registered Investment Adviser for MFC Global's investment strategies managed in Canada and Hong Kong. These strategies are available to U.S. institutional investors through MFC Global Investment Management (U.S.), LLC, an affiliated company located in Boston, Massachusetts. MFC Global Investment Management® is the asset management division of Manulife Financial. MFC Global Investment Management's diversified group of companies and affiliates provide comprehensive asset management solutions for institutional investors, investment funds and individuals in key markets around the world. This investment expertise extends across a full range of asset classes including equity, fixed income and alternative investments such as oil & gas, real estate, timber, farmland, as well as asset allocation strategies
4
MFC Global Investment Management has investment offices in the United States, Canada, the United Kingdom, Japan, Hong Kong, and throughout Asia. As of September 30, 2009, assets managed exceeded US$277 billion. Additional information about MFC Global Investment Management may be found at www.mfcglobal.com. MFC Global Investment Management®, Manulife and the block design are trademarks of The Manufacturers Life Insurance Company and are used by it and its affiliates including Manulife Financial Corporation
4
OppenheimerFunds®
OppenheimerFunds, Inc. has been helping investors achieve their financial goals since 1960. We are one of the nation's largest and most respected asset management companies. OppenheimerFunds and its controlled affiliates offer a broad range of products and services to individuals, corporations and institutions, including mutual funds, separately managed accounts, investment management for institutions, qualified retirement plans and subadvisory investment-management services.
4
Pacific Investment Management Company (PIMCO)Founded in 1971, PIMCO manages over $1 trillion in assets under management as of December 31, 2009, and is a subsidiary of Allianz Global Investors. With an emphasis on fixed income management, PIMCO is one of the largest active bond managers in the United States. The investment team is led by Bill Gross, Morningstar's 1998, 2000, and 2007 Fixed Income Manager of the Year, Morningstar's first triple winner.
4
Prudential Jennison Associates LLCJennison Associates began managing investments in 1969 for tax-free, domestic large cap growth equity accounts. The firm has since expanded its investment capabilities to include a range of equity, balanced, and fixed income strategies for institutional, retail, and subadvisory clients. As of June 30, 2010, Jennison's assets under management totaled $98.1 billion. Additional information about the firm is available at Jennison.com.
4
T. Rowe Price Associates, Inc. (T. Rowe Price)Founded in 1937, T. Rowe Price and its affiliates manage over $366 billion in assets as of September 30, 2009. T. Rowe Price provides a broad array of mutual funds, subadvisory services, and separate account management for individual and institutional investors, retirement plans, and financial intermediaries. Portfolio Managers access analysts based in the U.S. and around the world in key financial centers such as Hong Kong, Buenos Aires, Singapore, and London. The firm supports one of the industry's largest proprietary research efforts providing a disciplined, risk-aware investment approach focused on diversification, style consistency, and fundamental research.
4
Vanguard Group, Inc. (Vanguard)Founded in 1975, Vanguard has approximately $1.4 trillion in assets under management and more than 150 domestic funds, as of June 30, 2010.
4
Wellington Management Company, LLPAs of September 30, 2010, Wellington Management had $598.5 billion in assets under management. Wellington Management serves as an investment advisor to over 1,600 institutions located in over 40 countries.
4
We are not brokers, lenders or underwriters. Our expertise is investments - from global equities and fixed income to currencies and commodities.
4
We like to describe ourselves as a collection of teams that create solutions designed to respond to specific client needs. Our most distinctive strength is our proprietary, independent research, which is shared across all areas of the organization and used only for managing our clients' portfolios.
4
Wellington Management Company, LLP is a private partnership. We exist solely to meet the needs of our clients. An independent structure and collegial culture are two of the main reasons investment professionals join Wellington Management - and stay for their entire careers.
4
351405-E01
Asset manager profiles CONTINUED

8
SECTION 4 Risk disclosures
Allocating assets to only one or a small number of the investment options (other than Lifecycle or Lifestyle options) should not be considered a balanced investment program. In particular, allocating assets to a small number of options concentrated in particular business or market sectors will subject your account to increased risk and volatility. Examples of business or market sectors where this risk may be particularly high include: a) technology-related businesses, including Internet-related businesses, b) small-cap securities and c) foreign securities. John Hancock does not provide advice regarding appropriate investment allocations.
Risks Applicable to All Funds
Credit and Counterparty Risk. A fund is subject to the risk that the issuer or guarantor of a fixed-income security or other obligation, the counterparty to a derivatives contract or repurchase agreement, or the borrower of a fund’s securities will be unable or unwilling to make timely principal, interest, or settlement payments, or otherwise to honor its obligations.
Issuer Risk. An issuer of a security purchased by a fund may perform poorly, and, therefore, the value of its stocks and bonds may decline. Poor performance may be caused by poor management decisions, competitive pressures, breakthroughs in technology, reliance on suppliers, labor problems or shortages, corporate restructurings, fraudulent disclosures, or other factors.
Liquidity Risk. A fund is exposed to liquidity risk when trading volume, lack of a market maker, or legal restrictions impair the fund's ability to sell particular securities or close derivative positions at an advantageous price. Funds with investment strategies that involve securities of companies with smaller market capitalizations, foreign securities, derivatives, or securities with substantial market and/or credit risk tend to have the greatest exposure to liquidity risk.
Manager Risk. The performance of a fund that is actively managed will reflect in part the ability of the manager to make investment decisions that are suited to achieving the fund’s investment objective. Depending on the manager's investment decisions, a fund may not reach its investment objective or it could underperform its peers or lose money.
Market Risk. The value of a fund’s securities may go down in response to overall stock or bond market movements. Markets tend to move in cycles, with periods of rising prices and periods of falling prices. Stocks tend to go up and down in value more than bonds. If the fund’s investments are concentrated in certain sectors, its performance could be worse than the overall market.
Merger and Replacement Transition Risk. In the case of Fund mergers and replacements, the affected Funds that are being merged or replaced may implement the redemption of your interest by payment in cash or by distributing assets in kind. In either case, the redemption of your interest by the affected Fund, as well as the investment of the redemption proceeds by the "new" Fund, may result in transaction costs to the Funds because the affected Funds may find it necessary to sell securities and the "new" Funds will find it necessary to invest the redemption proceeds. Also, the redemption and reinvestment processes, including any transition period that may be involved in completing such mergers and replacements, could be subject to market gains or losses, including those from currency exchange rates. The transaction costs and potential market gains or losses could have an impact on the value of your investment in the affected Fund and in the "new" Fund, and such market gains or losses could also have an impact on the value of any existing investment that you or other investors may have in the "new" Fund. Although there can be no assurances that all risks can be eliminated, John Hancock will use its best efforts to manage and minimize such risks and costs. Where the redemption of your interest is implemented through a distribution of assets in kind, the effective date of the merger or replacement may vary from the target date due to the transition period, commencing either before or after the target date, that is required to liquidate or transition the assets for investment in the "new" Fund.
Additional Risks Applicable to Certain Funds
Commodity Risk. Commodity investments involve the risk of volatile market price fluctuations of commodities resulting from fluctuating demand, supply disruption, speculation and other factors.
Currency Risk. Funds that invest directly in foreign currencies and in securities that trade in, or receive revenues in, foreign currencies are subject to the risk that those currencies will decline in value relative to the currency being hedged.
Derivatives Risk. A fund’s use of certain derivative instruments (such as options, futures and swaps) could produce disproportionate gains or losses. Derivatives are generally considered more risky than direct investments and, in a down market, could become harder to value or sell at a fair price.
Equity Securities Risk. Stock markets are volatile, and the price of equity securities such as common and preferred stocks (and their equivalents) will fluctuate. The value of equity securities purchased by the fund could decline if the financial condition of the companies in which the fund invests decline or if overall market and economic conditions deteriorate.
Exchange Traded Funds ("ETF"s) Risk. Exchange Traded Funds are a type of investment company bought and sold on a securities exchange. An ETF often represents a fixed portfolio of securities designed to track a particular market index. The risks of owning an ETF generally reflect the risks of owning the underlying securities the ETF is designed to track.
Fixed-Income Securities Risk. Fixed-income securities or bonds are subject to credit risk and interest rate risk. The credit rating of bonds in the fund could be downgraded or the issuer of a bond could default on its obligations. In general, lower-rated fixed-income securities involve more credit risk. When interest rates rise, bond prices generally fall.
Foreign Securities Risk. Foreign securities involve special risks, including potentially unfavorable currency exchange rates, limited government regulation (including less stringent investor protection and disclosure standards) and exposure to possible economic, political and social instability. To the extent the fund invests in emerging market countries, it’s foreign securities risk will be higher.
351405-E01
9
Fund of Funds Risk. A fund of funds invests in a number of underlying funds. A fund of fund's ability to achieve its investment objective will depend largely on the ability of its investment manager to select the appropriate mix of underlying funds and on the underlying funds ability to meet their investment objectives. A fund of funds is subject to the same risks as the underlying funds in which it invests. Each fund of funds bears its own expenses and indirectly bears its proportionate share of expenses of the underlying funds in which it invests.
Growth Stock Risk. Because growth securities typically do not make dividend payments to shareholders, investment returns are based on capital appreciation, making returns dependent on market increases and decreases. The market prices of growth stocks are highly sensitive to future earnings expectations. Growth stocks may therefore be more volatile than non-growth stocks.
Index Management Risk. Certain factors may cause the fund to track its Index less closely. For example, the manager may select securities that are not fully representative of the Index, and the fund’s transaction expenses, and the size and timing of the its cash flows, may result in the fund’s performance being different than that of its Index.
Initial Public Offerings (“IPO”) Risk. The fund is subject to the risks associated with purchases of shares issued in IPOs by companies that have little operating history as public companies. The market for IPO issuers has been volatile and share prices of certain newly-public companies have fluctuated in significant amounts over short periods of time.
Interest Rate Risk. Fixed-income securities are affected by changes in interest rates. When interest rates decline, the market value of fixed-income securities generally will increase. Conversely, when interest rates rise, the market value of fixed-income securities will generally decrease. The longer the remaining maturity of instruments held by the fund, the more sensitive the fund is to interest rate risk.
Large Cap Risk. The fund’s strategy of investing in large cap stocks carries the risk that in certain markets large cap stocks will underperform small cap or mid cap stocks.
Leverage Risk. The fund may engage in transactions, including the use of synthetic instruments and derivatives, which may give rise to a form of leverage. Leverage may cause the fund to be more volatile than if the fund had not been leveraged because leverage can exaggerate the effect of any increase or decrease in the value of securities held by the fund.
Mid Cap Stock Risk. Investments in mid-cap companies are subject to more erratic price movements than investments in larger, more established companies. In particular, mid-sized companies may pose greater risk due to narrow product lines, limited financial resources, less depth in management or a limited trading market for their securities.
Mortgage-Backed and Asset-Backed Securities Risk. When interest rates fall, homeowners are more likely to prepay their mortgage loans. An increased rate of prepayments on the fund's mortgage-backed securities will result in an unforeseen loss of interest income to the fund as the fund may be required to reinvest assets at a lower interest rate. Asset-backed securities include interests in pools of debt securities, commercial or consumer loans, or their receivables. The value of these securities depends on may factors, including changes in interest rates, the availability of information concerning the pool and its structure, the credit quality of the underlying assets, the market's perception of the servicer of the pool, and any credit enhancement provided. In addition, asset-backed securities have prepayment risks similar to mortgage-backed securities.
Non-Diversification Risk. A fund that is non-diversified may invest a high percentage of its assets in the securities of a small number of issuers. This approach may result in more volatile performance relative to more diversified funds. The less diversified a fund's holdings are, the more a specific security's poor performance is likely to affect the fund's performance.
Sector Risk. When a fund's investments are concentrated in a particular industry or sector of the economy (e.g., real estate, technology, financial services), they are not as diversified as the investments of most mutual funds and are far less diversified than the broad securities markets. Funds concentrating in a particular industry sector tend to be more volatile than other mutual funds, and the values of their investments tend to go up and down more rapidly. A fund that invests in a particular industry or sector is particularly susceptible to the impact of market, economic, regulatory and other factors affecting than industry or sector.
Short Sale Risk. The fund may sell a security that it does not own. A fund will lose money if the price of the security which it has sold short increases between the time of the short sale and the date when the fund acquires the security sold short.
Small Cap Stock Risk. The fund’s investments in smaller companies are subject to more erratic price movements than investments in larger, more established companies. Small cap companies may be developing or marketing new products or services for which markets are not yet and may never become established. Although small, unseasoned companies may offer greater opportunities for capital growth than larger, more established companies, they also involve greater risks and should be considered speculative.
Small/Mid Cap Stock Risk. The fund’s investments in small-cap and mid-cap companies are subject to more erratic price movements than investments in larger, more established companies. In particular, mid-sized companies may pose greater risk due to narrow product lines, limited financial resources, less depth in management or a limited trading market for their securities. Similarly, small cap companies may be developing or marketing new products or services for which markets are not yet and may never become established. While small, unseasoned companies may offer greater opportunities for capital growth than larger, more established companies, they also involve greater risks and should be considered speculative.
Turnover Risk. Active and frequent trading of fund securities results in a high fund turnover rate. Funds with high turnover rates often have higher transaction costs, which are paid by the fund, that may have an adverse impact on fund performance, and may generate short-term capital gains on which taxes may be imposed.
U.S. Government Securities Risk. U.S. government securities do not involve the degree of credit risk associated with investments in lower quality fixed-income securities. As a result, the yields available from U.S. government securities are generally lower than the yields available from many other fixed-income securities. These securities, like other fixed-income securities, are subject to interest rate risk.
Value Stock Risk. The fund’s investments in value stocks carry the risk that the market will not recognize a security’s intrinsic value for a long time or that a stock believed to be undervalued may actually be appropriately priced.
351405-E01
Risk disclosures CONTINUED

Lifestyle Fund - Conservative Portfolio13,68
Investing solely in John Hancock Funds II - Lifestyle Conservative Portfolio (Class 1)Subadvisors: MFC Global Investment Management (U.S.A.) Limited
Ticker Symbol+: JILCX
P2459-CLS-C6 Printed 11/10-18374
Risk/Return Category
Conservative
Low High
Asset Class/Investment Style
Lifestyle
Performance of the sub-account**
Returns (as of 9-30-10)
Fund Index1 Index2Peer
Group
1 year 10.47% 8.16% 8.89% 9.55%3 year 3.92% 7.42% 4.72% 0.98%5 year 4.82% 6.20% 5.32% 3.34%10 year 5.11% 6.41% 5.26% 3.53%
Expense Ratio (as of 9-30-10)****
Fund Expense Ratio 0.87%AMC 0.10%Sales & Service Fee¥ 0.37%Expense Ratio**** 1.34%
The inception date for the sub-account+ is October 2, 1997 and for the current underlying Portfolio is October 14, 2005.
¥See important notes.
The revenue John Hancock receives from any of its internally-managed Funds may be higher than those advised or sub-advised exclusively by unaffiliated mutual fund companies. John Hancock's affiliates provide advisory and sub-advisory services to these internally-managed funds. For more information, refer to the "Expense Ratio" section of this document.
The performance data presented represents past performance. Past performance is no guarantee of future results and current performance may be lower or higher than the performance quoted. An investment in a sub-account will fluctuate in value to reflect the value of the underlying portfolio and, when redeemed, may be worth more or less than original cost. Performance does not reflect any applicable contract-level or participant-level charges, fees for guaranteed benefits if elected by participant, or any redemption fees imposed by an underlying mutual fund company. These charges, if included, would otherwise reduce the total return for a participant’s account. Performance information current to the most recent month-end is available on our website www.jhpensions.com.
Performance data for a sub-account for any period prior to the date introduced is shown in bold and is hypothetical based on the performance of the underlying fund.
Performance shown for all periods has been adjusted to reflect the current sub-account charge and would be lower if it reflected the sub-account charge that was in effect prior to October 14, 2005, which was 0.20% higher than the current sub-account charge.
The Index1 is Barclays Capital Aggregate Bond Index.i15
The Index2 is 20% S&P 500/80% BarCap Agg Bond Index.i07
The peer group is Conservative Allocation.p2
Principal risks include: fund of funds, credit and counterparty, equity securities, fixed-income securities, foreign securities, interest rate, issuer, liquidity, manager, market and merger and replacement transition. For more details, see section 3 of this booklet (Risk Disclosures).
Portfolio* HighlightsInvestment Objective and Policies 4To seek to achieve a high level of current income with some consideration given to growth of capital by investing approximately 80% of the portfolio's assets in underlying portfolios that invest primarily in fixed-income securities and 20% of its assets in underlying portfolios that invest primarily in equity securities.
Why Consider this Portfolio*
You want a long-term investment horizon and seek a balance between a high level of current income and growth of capital with greater emphasis on current income
4
You want instant and broad diversification with exposure to a wide range of asset classes and investment styles, including domestic and international stocks
4
This asset allocation Fund is managed using sophisticated quantitative models designed by MFC Global Investment Management (MFC Global (U.S.A.)) in consultation with Deutsche Asset Management (DeAM) with the intention of providing an optimal mix of a broad range of asset classes and individual portfolios for your specific risk tolerance
4
Investment Process 4There are four main steps involved in the design of the John Hancock Lifestyle Funds. First, asset classes and underlying funds are selected for potential inclusion in the portfolios. Next, sophisticated optimization techniques are used to establish the appropriate weightings given to each asset class. In the third step, an advanced statistical process is used to determine the optimal mix of managers. In the fourth and final step, the economic environment and investment markets are continually monitored to determine if any changes are needed, and to keep the portfolio up-to-date and consistent with its investment policies and objectives.
Weightings± Emerging Markets Value (DFA)0.5%Global Shareholder Yield (Epoch)2.6%
U.S. Multi Sector (GMO)1.0%Blue Chip Growth (T. Rowe Price)2.6%Mid Value (T. Rowe Price)0.3%Small Company Value (T. Rowe Price)0.3%
Equity Income (T. Rowe Price)2.8%500 Index (MFC Global USA)1.8%Fundamental Value (Davis)2.6%Currency Strategies Fund (First Quadrant
1.4%
Global High Yield (Stone Harbor)1.7%Global Bond (PIMCO)4.6%Short-Term Government Income (MFC Global US)
4.5%
Active Bond (Declaration/MFC Global US)
8.9%
Core Bond (Wells Capital)6.0%Investment Quality Bond (Wellington)5.6%Total Bond Market (Declaration)5.3%
Natural Resources (Wellington) 0.5%Real Estate Equity (T. Rowe Price) 1.0%Global Real Estate (DeAM) 1.6%International Value (Franklin Templeton)
1.3%
International Core (GMO) 1.3%Small Cap Growth (Wellington) 0.3%Mid Cap Stock (Wellington) 0.3%
Real Return Bond (PIMCO) 4.0%Floating Rate Income (WAMCO) 5.0%U.S. High Yield Bond (Wells Capital) 2.2%High Yield Bond (WAMCO) 2.7%High Income (MFC Global US) 1.6%Multi Sector Bond (Stone Harbor) 5.1%Strategic Income Opportunities (MFC Global US)
5.5%
Spectrum Income (T. Rowe Price) 5.4%Total Return Bond (PIMCO) 9.7%
Weightings as of September 30, 2010Weightings are subject to change
10 351405-E01

Lifestyle Fund - Moderate Portfolio13,31,68
Investing solely in John Hancock Funds II - Lifestyle Moderate Portfolio (Class 1)Subadvisors: MFC Global Investment Management (U.S.A.) Limited
Ticker Symbol+: JILMX
P2459-MLS-C6 Printed 11/10-18374
Risk/Return Category
Income
Low High
Asset Class/Investment Style
Lifestyle
Performance of the sub-account**
Returns (as of 9-30-10)
Fund Index1 Index2Peer
Group
1 year 11.10% 8.16% 9.45% 9.55%3 year 1.20% 7.42% 1.90% 0.98%5 year 3.92% 6.20% 4.32% 3.34%10 year 4.22% 6.41% 4.00% 3.53%
Expense Ratio (as of 9-30-10)****
Fund Expense Ratio 0.89%AMC 0.10%Sales & Service Fee¥ 0.37%Expense Ratio**** 1.36%
The inception date for the sub-account+ is October 2, 1997 and for the current underlying Portfolio is October 14, 2005.
¥See important notes.
The revenue John Hancock receives from any of its internally-managed Funds may be higher than those advised or sub-advised exclusively by unaffiliated mutual fund companies. John Hancock's affiliates provide advisory and sub-advisory services to these internally-managed funds. For more information, refer to the "Expense Ratio" section of this document.
The performance data presented represents past performance. Past performance is no guarantee of future results and current performance may be lower or higher than the performance quoted. An investment in a sub-account will fluctuate in value to reflect the value of the underlying portfolio and, when redeemed, may be worth more or less than original cost. Performance does not reflect any applicable contract-level or participant-level charges, fees for guaranteed benefits if elected by participant, or any redemption fees imposed by an underlying mutual fund company. These charges, if included, would otherwise reduce the total return for a participant’s account. Performance information current to the most recent month-end is available on our website www.jhpensions.com.
Performance data for a sub-account for any period prior to the date introduced is shown in bold and is hypothetical based on the performance of the underlying fund.
Performance shown for all periods has been adjusted to reflect the current sub-account charge and would be lower if it reflected the sub-account charge that was in effect prior to October 14, 2005, which was 0.20% higher than the current sub-account charge.
The Index1 is Barclays Capital Aggregate Bond Index.i15
The Index2 is 40% S&P 500/60% BarCap Agg Bond Index.i10
The peer group is Conservative Allocation.p2
Principal risks include: fund of funds, credit and counterparty, equity securities, fixed-income securities, foreign securities, interest rate, issuer, liquidity, manager, market and merger and replacement transition. For more details, see section 3 of this booklet (Risk Disclosures).
Portfolio* HighlightsInvestment Objective and Policies 4To seek to achieve a balance between a high level of current income and growth of capital, with a greater emphasis on income by investing approximately 60% of the portfolio's assets in underlying portfolios that invest primarily in fixed-income securities and 40% of its assets in portfolios that invest primarily in equity securities.
Why Consider this Portfolio*
You have a long-term investment horizon and seek a balance between a high level of current income and growth of capital with a greater emphasis on income. You can accept levels of risk similar to or greater than that of equity markets
4
You want instant and broad diversification with exposure to a wide range of asset classes and investment styles, including domestic and international stocks
4
This asset allocation Fund is managed using sophisticated quantitative models designed in consultation by MFC Global Investment Management (MFC Global (U.S.A.)) with Deutsche Asset Management (DeAM) with the intention of providing an optimal mix of a broad range of asset classes and individual portfolios for your specific risk tolerance
4
Investment Process 4There are four main steps involved in the design of the John Hancock Lifestyle Funds. First, asset classes and underlying funds are selected for potential inclusion in the portfolios. Next, sophisticated optimization techniques are used to establish the appropriate weightings given to each asset class. In the third step, an advanced statistical process is used to determine the optimal mix of managers. In the fourth and final step, the economic environment and investment markets are continually monitored to determine if any changes are needed, and to keep the portfolio up-to-date and consistent with its investment policies and objectives.
Weightings±
Natural Resources (Wellington)0.5%Emerging Markets Value (DFA)1.1%Global Shareholder Yield (Epoch)2.4%
Value & Restructuring (Columbia)1.4%Alpha Opportunities (Wellington)1.8%U.S. Multi Sector (GMO)2.4%Blue Chip Growth (T. Rowe Price)4.9%Capital Appreciation (Jennison)1.4%Mid Value (T. Rowe Price)1.5%Small Cap Value (Wellington)0.3%Small Company Value (T. Rowe Price)0.5%
Equity Income (T. Rowe Price)2.9%500 Index (MFC Global USA)3.1%Fundamental Value (Davis)3.4%Currency Strategies Fund (First Quadrant
1.2%
Global High Yield (Stone Harbor)1.2%Global Bond (PIMCO)3.8%Active Bond (Declaration/MFC Global US)
6.6%
Core Bond (Wells Capital)5.0%Investment Quality Bond (Wellington)3.2%Total Bond Market (Declaration)2.7%
Real Estate Equity (T. Rowe Price) 1.0%Global Real Estate (DeAM) 1.6%International Growth Stock (Invesco Advisers)
0.2%
International Opportunities (Marsico) 1.3%International Value (Franklin Templeton)
1.9%
International Core (GMO) 1.6%Smaller Company Growth (MFC Global USA, Frontier, Perimeter)
0.3%
Small Company Growth (Invesco Advisers)
0.3%
Small Cap Growth (Wellington) 0.3%Mid Cap Stock (Wellington) 1.6%Rainier Growth (Rainier) 0.7%
Real Return Bond (PIMCO) 3.7%Floating Rate Income (WAMCO) 4.7%U.S. High Yield Bond (Wells Capital) 2.4%High Yield Bond (WAMCO) 2.8%High Income (MFC Global US) 3.3%Multi Sector Bond (Stone Harbor) 4.8%Strategic Income Opportunities (MFC Global US)
3.6%
Spectrum Income (T. Rowe Price) 4.9%Total Return Bond (PIMCO) 7.7%
Weightings as of September 30, 2010Weightings are subject to change
11 351405-E01

Lifestyle Fund - Balanced Portfolio9,13,68
Investing solely in John Hancock Funds II - Lifestyle Balanced Portfolio (Class 1)Subadvisors: MFC Global Investment Management (U.S.A.) Limited
Ticker Symbol+: JILBX
P2459-BLS-C6 Printed 11/10-18374
Risk/Return Category
Growth & Income
Low High
Asset Class/Investment Style
Lifestyle
Performance of the sub-account**
Returns (as of 9-30-10)
Fund Index1 Index2Peer
Group
1 year 10.99% 10.16% 9.86% 9.13%3 year -1.72% -7.16% -1.03% -2.34%5 year 2.96% 0.64% 3.21% 2.46%10 year 3.47% -0.43% 2.62% 2.56%
Expense Ratio (as of 9-30-10)****
Fund Expense Ratio 0.92%AMC 0.10%Sales & Service Fee¥ 0.37%Expense Ratio**** 1.39%
The inception date for the sub-account+ is October 2, 1997 and for the current underlying Portfolio is October 14, 2005.
¥See important notes.
The revenue John Hancock receives from any of its internally-managed Funds may be higher than those advised or sub-advised exclusively by unaffiliated mutual fund companies. John Hancock's affiliates provide advisory and sub-advisory services to these internally-managed funds. For more information, refer to the "Expense Ratio" section of this document.
The performance data presented represents past performance. Past performance is no guarantee of future results and current performance may be lower or higher than the performance quoted. An investment in a sub-account will fluctuate in value to reflect the value of the underlying portfolio and, when redeemed, may be worth more or less than original cost. Performance does not reflect any applicable contract-level or participant-level charges, fees for guaranteed benefits if elected by participant, or any redemption fees imposed by an underlying mutual fund company. These charges, if included, would otherwise reduce the total return for a participant’s account. Performance information current to the most recent month-end is available on our website www.jhpensions.com.
Performance data for a sub-account for any period prior to the date introduced is shown in bold and is hypothetical based on the performance of the underlying fund.
Performance shown for all periods has been adjusted to reflect the current sub-account charge and would be lower if it reflected the sub-account charge that was in effect prior to October 14, 2005, which was 0.20% higher than the current sub-account charge.
The Index1 is S&P 500 Index.i58
The Index2 is 60% S&P 500/40% BarCap Agg Bond Index.i08
The peer group is Moderate Allocation.p20
Principal risks include: fund of funds, credit and counterparty, equity securities, fixed-income securities, foreign securities, interest rate, issuer, liquidity, manager, market and merger and replacement transition. For more details, see section 3 of this booklet (Risk Disclosures).
Portfolio* HighlightsInvestment Objective and Policies 4To seek to achieve a balance between a high level of current income and growth of capital, with a greater emphasis on growth of capital, by investing approximately 40% of the portfolio's assets in underlying portfolios that invest primarily in fixed-income securities and approximately 60% of its assets in underlying portfolios that invest primarily in equity securities.Why Consider this Portfolio*
You have a long-term investment horizon and seek a balance between a high level of current income and growth of capital with greater emphasis on growth of capital. You can accept levels of risk similar to or greater than that of equity markets
4
You want instant and broad diversification with exposure to a wide range of asset classes and investment styles, including domestic and international stocks
4
This asset allocation Fund is managed using sophisticated quantitative models designed by MFC Global Investment Management (MFC Global (U.S.A.)) in consultation with Deutsche Asset Management (DeAM) with the intention of providing an optimal mix of a broad range of asset classes and individual portfolios for your specific risk tolerance
4
Investment Process 4There are four main steps involved in the design of the John Hancock Lifestyle Funds. First, asset classes and underlying funds are selected for potential inclusion in the portfolios. Next, sophisticated optimization techniques are used to establish the appropriate weightings given to each asset class. In the third step, an advanced statistical process is used to determine the optimal mix of managers. In the fourth and final step, the economic environment and investment markets are continually monitored to determine if any changes are needed, and to keep the portfolio up-to-date and consistent with its investment policies and objectives.Weightings±
Natural Resources (Wellington)1.5%Smaller Company Growth (MFC Global USA, Frontier, Perimeter)
0.3%
Small Company Growth (Invesco Advisers)
0.3%
Blue Chip Growth (T. Rowe Price)4.2%Alpha Opportunities (Wellington)3.4%All Cap Core (DeAM)2.0%All Cap Value (Lord Abbett)1.2%Value & Restructuring (Columbia)1.4%U.S. Multi Sector (GMO)2.9%Large Cap Value (BlackRock)1.2%Capital Appreciation (Jennison)3.0%Mid Cap Value Equity (Columbia)0.5%Mid Value (T. Rowe Price)1.0%Value (Invesco Advisers)0.5%Small Cap Value (Wellington)0.3%Small Company Value (T. Rowe Price)0.8%
Equity Income (T. Rowe Price)2.2%Optimized Value (MFC Global USA)1.0%Disciplined Value (Boston Partners)1.2%Mutual Shares (Franklin Templeton)0.5%500 Index (MFC Global USA)3.1%Fundamental Value (Davis)3.7%Large Cap (UBS Global)1.0%Currency Strategies Fund (First Quadrant
1.3%
Total Return Bond (PIMCO)5.3%Global Bond (PIMCO)3.3%Active Bond (Declaration/MFC Global US)
4.0%
Real Estate Equity (T. Rowe Price) 1.0%Global Real Estate (DeAM) 1.5%International Small Cap (Franklin Templeton)
0.2%
International Small Company (DFA) 0.2%International Growth Stock (Invesco Advisers)
0.2%
International Opportunities (Marsico) 2.0%Small Cap Intrinsic Value (MFC Global US)
0.3%
Heritage (American Century) 0.5%Small Cap Opportunities (DFA / Invesco Advisers)
0.3%
Technical Opportunities (Wellington) 1.5%Small Cap Growth (Wellington) 0.4%Emerging Markets Value (DFA) 4.1%International Value (Franklin Templeton)
2.2%
International Core (GMO) 2.3%Mid Cap Stock (Wellington) 1.5%Rainier Growth (Rainier) 2.3%
Real Return Bond (PIMCO) 3.0%Floating Rate Income (WAMCO) 3.7%U.S. High Yield Bond (Wells Capital) 2.8%High Yield Bond (WAMCO) 3.4%High Income (MFC Global US) 2.3%Investment Quality Bond (Wellington) 0.8%Strategic Income Opportunities (MFC Global US)
2.8%
Spectrum Income (T. Rowe Price) 3.2%Global High Yield (Stone Harbor) 1.0%Multi Sector Bond (Stone Harbor) 3.0%Core Bond (Wells Capital) 2.4%
Weightings as of September 30, 2010Weightings are subject to change
12 351405-E01

Lifestyle Fund - Growth Portfolio13,68
Investing solely in John Hancock Funds II - Lifestyle Growth Portfolio (Class 1) Subadvisors: MFC Global Investment Management (U.S.A.) Limited
Ticker Symbol+: JILGX
P2459-GLS-C6 Printed 11/10-18374
Risk/Return Category
Growth
Low High
Asset Class/Investment Style
Lifestyle
Performance of the sub-account**
Returns (as of 9-30-10)
Fund Index1 Index2Peer
Group
1 year 10.65% 10.16% 10.09% 8.87%3 year -4.27% -7.16% -4.05% -7.22%5 year 1.92% 0.64% 1.98% 0.40%10 year 2.15% -0.43% 1.15% 0.17%
Expense Ratio (as of 9-30-10)****
Fund Expense Ratio 0.94%AMC 0.10%Sales & Service Fee¥ 0.37%Expense Ratio**** 1.41%
The inception date for the sub-account+ is October 2, 1997 and for the current underlying Portfolio is October 14, 2005.
¥See important notes.
The revenue John Hancock receives from any of its internally-managed Funds may be higher than those advised or sub-advised exclusively by unaffiliated mutual fund companies. John Hancock's affiliates provide advisory and sub-advisory services to these internally-managed funds. For more information, refer to the "Expense Ratio" section of this document.
The performance data presented represents past performance. Past performance is no guarantee of future results and current performance may be lower or higher than the performance quoted. An investment in a sub-account will fluctuate in value to reflect the value of the underlying portfolio and, when redeemed, may be worth more or less than original cost. Performance does not reflect any applicable contract-level or participant-level charges, fees for guaranteed benefits if elected by participant, or any redemption fees imposed by an underlying mutual fund company. These charges, if included, would otherwise reduce the total return for a participant’s account. Performance information current to the most recent month-end is available on our website www.jhpensions.com.
Performance data for a sub-account for any period prior to the date introduced is shown in bold and is hypothetical based on the performance of the underlying fund.
Performance shown for all periods has been adjusted to reflect the current sub-account charge and would be lower if it reflected the sub-account charge that was in effect prior to October 14, 2005, which was 0.20% higher than the current sub-account charge.
The Index1 is S&P 500 Index.i58
The Index2 is 80% S&P 500/20% BarCap Agg Bond Index.i95
The peer group is Large Blend.p12
Principal risks include: fund of funds, credit and counterparty, equity securities, fixed-income securities, foreign securities, growth stock, interest rate, issuer, liquidity, manager, market and merger and replacement transition. For more details, see section 3 of this booklet (Risk Disclosures).
Portfolio* HighlightsInvestment Objective and Policies 4To seek to achieve long-term growth of capital by investing approximately 80% of the portfolio's assets in underlying portfolios that invest primarily in equity securities and approximately 20% of its assets in portfolio's that invest primarily in fixed-income securities. Current income is also a consideration.Why Consider this Portfolio*
You have a long-term investment horizon and seek maximum potential for growth of capital, with no consideration given to current income. You can accept levels of risk similar to or greater than that of equity markets
4
You want instant and broad diversification with exposure to a wide range of asset classes and investment styles, including domestic and international, stocks
4
This asset allocation Fund is managed using sophisticated quantitative models designed by MFC Global Investment Management (MFC Global (U.S.A.)) in consultation with Deutsche Asset Management (DeAM) with the intention of providing an optimal mix of a broad range of asset classes and individual portfolios for your specific risk tolerance
4
Investment Process 4There are four main steps involved in the design of the John Hancock Lifestyle Funds. First, asset classes and underlying funds are selected for potential inclusion in the portfolios. Next, sophisticated optimization techniques are used to establish the appropriate weightings given to each asset class. In the third step, an advanced statistical process is used to determine the optimal mix of managers. In the fourth and final step, the economic environment and investment markets are continually monitored to determine if any changes are needed, and to keep the portfolio up-to-date and consistent with its investment policies and objectives.Weightings± Rainier Growth (Rainier)3.1%
Mid Cap Stock (Wellington)1.8%Heritage (American Century)0.8%Small Cap Intrinsic Value (MFC Global US)
0.5%
Small Cap Opportunities (DFA / Invesco Advisers)
0.5%
Small Cap Growth (Wellington)0.5%Small Company Growth (Invesco Advisers)
0.4%
Smaller Company Growth (MFC Global USA, Frontier, Perimeter)
0.4%
International Core (GMO)3.1%International Value (Franklin Templeton)
3.1%
International Equity Index A (SSgA)1.0%International Opportunities (Marsico)2.9%International Growth Stock (Invesco Advisers)
0.2%
International Small Company (DFA)0.7%International Small Cap (Franklin Templeton)
0.7%
Global Real Estate (DeAM)1.5%Real Estate Equity (T. Rowe Price)1.0%Natural Resources (Wellington)2.0%Emerging Markets Value (DFA)6.4%Technical Opportunities (Wellington)1.5%
Large Cap Value (BlackRock)1.3%Value & Restructuring (Columbia)1.8%All Cap Core (DeAM)2.5%All Cap Value (Lord Abbett)1.5%Alpha Opportunities (Wellington)5.0%U.S. Multi Sector (GMO)4.0%
Real Return Bond (PIMCO) 1.7%Floating Rate Income (WAMCO) 3.0%U.S. High Yield Bond (Wells Capital) 1.1%High Yield Bond (WAMCO) 1.9%High Income (MFC Global US) 1.2%Multi Sector Bond (Stone Harbor) 1.5%Strategic Income Opportunities (MFC Global US)
1.5%
Spectrum Income (T. Rowe Price) 1.6%Total Return Bond (PIMCO) 3.3%Active Bond (Declaration/MFC Global US)
0.9%
Global Bond (PIMCO) 1.0%Global High Yield (Stone Harbor) 0.5%
Currency Strategies Fund (First Quadrant
1.3%
Large Cap (UBS Global) 1.0%Fundamental Value (Davis) 5.0%500 Index (MFC Global USA) 3.0%Mutual Shares (Franklin Templeton) 0.5%Disciplined Value (Boston Partners) 1.5%Optimized Value (MFC Global USA) 1.3%Equity Income (T. Rowe Price) 3.9%
Small Company Value (T. Rowe Price) 0.8%Small Cap Value (Wellington) 0.5%Mid Cap Index (MFC Global USA) 2.0%Value (Invesco Advisers) 0.5%Mid Value (T. Rowe Price) 1.5%Mid Cap Value Equity (Columbia) 0.5%Capital Appreciation (Jennison) 4.0%Blue Chip Growth (T. Rowe Price) 5.3%
Weightings as of September 30, 2010Weightings are subject to change
13 351405-E01

Lifestyle Fund - Aggressive Portfolio13,68
Investing solely in John Hancock Funds II - Lifestyle Aggressive Portfolio (Class 1)Subadvisors: MFC Global Investment Management (U.S.A.) Limited
Ticker Symbol+: JILAX
P2459-ALS-C6 Printed 11/10-18374
Risk/Return Category
Aggressive Growth
Low High
Asset Class/Investment Style
Lifestyle
Performance of the sub-account**
Returns (as of 9-30-10)
Fund IndexPeer
Group
1 year 9.67% 10.16% 8.87%3 year -7.34% -7.16% -7.22%5 year 0.73% 0.64% 0.40%10 year 0.89% -0.43% 0.17%
Expense Ratio (as of 9-30-10)****
Fund Expense Ratio 1.00%AMC 0.10%Sales & Service Fee¥ 0.37%Expense Ratio**** 1.47%
The inception date for the sub-account+ is October 2, 1997 and for the current underlying Portfolio is October 14, 2005.
¥See important notes.
The performance data presented represents past performance. Past performance is no guarantee of future results and current performance may be lower or higher than the performance quoted. An investment in a sub-account will fluctuate in value to reflect the value of the underlying portfolio and, when redeemed, may be worth more or less than original cost. Performance does not reflect any applicable contract-level or certain participant-level charges, or any redemption fees imposed by an underlying mutual fund company. These charges, if included, would otherwise reduce the total return for a participant’s account. Performance information current to the most recent month-end is available on our website www.jhpensions.com.
Performance data for a sub-account for any period prior to the date introduced is shown in bold and is hypothetical based on the performance of the underlying fund.
The revenue John Hancock receives from any of its internally-managed Funds may be higher than those advised or sub-advised exclusively by unaffiliated mutual fund companies. John Hancock's affiliates provide advisory and sub-advisory services to these internally-managed funds. For more information, refer to the "Expense Ratio" section of this document.
Performance shown for all periods has been adjusted to reflect the current sub-account charge and would be lower if it reflected the sub-account charge that was in effect prior to October 14, 2005, which was 0.20% higher than the current sub-account charge.
The Index is S&P 500 Index.i58
The peer group is Large Blend.p12
Principal risks include: fund of funds, credit and counterparty, equity securities, foreign securities, growth stock, issuer, liquidity, manager, market, merger and replacement transition and small/mid cap stock. For more details, see section 3 of this booklet (Risk Disclosures).
Portfolio* HighlightsInvestment Objective and Policies 4To seek to achieve long-term growth of capital by investing 100% of the portfolio's assets in underlying portfolios that invest primarily in equity securities. Current income is not a consideration.
Why Consider this Portfolio*
You have a long-term investment horizon and seek maximum potential for growth of capital, with no consideration given to current income. You can accept levels of risk similar to or greater than that of equity markets
4
You want instant and broad diversification with exposure to a wide range of asset classes and investment styles, including domestic and international stocks
4
You want the convenience of having a portfolio that does not require you to monitor the financial markets in an effort to capitalize on short-term market trends and cycles
4
This asset allocation Fund is managed using sophisticated quantitative models designed by MFC Global Investment Management (MFC Global (U.S.A.)) in consultation with Deutsche Asset Management (DeAM) with the intention of providing an optimal mix of a broad range of asset classes and individual portfolios for your specific risk tolerance
4
Investment Process 4There are four main steps involved in the design of the John Hancock Lifestyle Funds. First, asset classes and underlying funds are selected for potential inclusion in the portfolios. Next, sophisticated optimization techniques are used to establish the appropriate weightings given to each asset class. In the third step, an advanced statistical process is used to determine the optimal mix of managers. In the fourth and final step, the economic environment and investment markets are continually monitored to determine if any changes are needed, and to keep the portfolio up-to-date and consistent with its investment policies and objectives.
Weightings± Small Cap Opportunities (DFA / Invesco Advisers)
1.0%
Small Cap Growth (Wellington)0.9%Small Company Growth (Invesco Advisers)
0.8%
Smaller Company Growth (MFC Global USA, Frontier, Perimeter)
0.8%
International Core (GMO)4.2%International Value (Franklin Templeton)
4.1%
International Equity Index A (SSgA)0.7%International Opportunities (Marsico)3.5%International Growth Stock (Invesco Advisers)
0.4%
International Small Company (DFA)1.4%International Small Cap (Franklin Templeton)
1.4%
Global Real Estate (DeAM)0.5%Real Estate Equity (T. Rowe Price)0.5%Natural Resources (Wellington)3.0%Emerging Markets Value (DFA)9.5%Technical Opportunities (Wellington)1.5%
Large Cap Value (BlackRock)1.5%Value & Restructuring (Columbia)1.9%All Cap Core (DeAM)2.5%All Cap Value (Lord Abbett)1.6%Alpha Opportunities (Wellington)5.0%U.S. Multi Sector (GMO)3.9%
Small Cap Intrinsic Value (MFC Global US)
1.0%
Small Cap Index (MFC Global USA) 0.5%Heritage (American Century) 1.4%Mid Cap Stock (Wellington) 2.8%Rainier Growth (Rainier) 3.4%
Currency Strategies Fund (First Quadrant
1.3%
Large Cap (UBS Global) 1.0%Fundamental Value (Davis) 5.1%500 Index (MFC Global USA) 4.9%Mutual Shares (Franklin Templeton) 0.4%Disciplined Value (Boston Partners) 1.7%Optimized Value (MFC Global USA) 1.5%Equity Income (T. Rowe Price) 4.8%
Small Company Value (T. Rowe Price) 1.5%Small Cap Value (Wellington) 1.0%Mid Cap Index (MFC Global USA) 2.4%Value (Invesco Advisers) 1.0%Mid Value (T. Rowe Price) 2.0%Mid Cap Value Equity (Columbia) 1.0%Capital Appreciation (Jennison) 4.9%Blue Chip Growth (T. Rowe Price) 5.8%
Weightings as of September 30, 2010Weightings are subject to change
14 351405-E01

Select Asset Allocation Conservative Portfolio13,35,91
Investing solely in JHT - Lifestyle Conservative Trust (Class 1)Sub-advised by MFC Global Investment Mgmt
Ticker Symbol+: JELCX
P2459-SAC-C6 Printed 11/10-18374
Risk/Return Category
Conservative
Low High
Asset Class/Investment Style
Guaranteed Income Feature
Performance of the sub-account**
Returns (as of 9-30-10)
Fund Index1 Index2Peer
Group
1 year 10.26% 8.16% 8.89% 9.55%3 year 3.37% 7.42% 4.72% 0.98%5 year 4.53% 6.20% 5.32% 3.34%10 year 4.99% 6.41% 5.26% 3.53%
Expense Ratio (as of 9-30-10)****
Fund Expense Ratio 0.81%AMC 0.10%Sales & Service Fee¥ 0.37%Expense Ratio**** 1.28%
The inception date for the sub-account+ is November 6, 2009 and for the current underlying Portfolio is January 7, 1997.
¥See important notes.
The revenue John Hancock receives from any of its internally-managed Funds may be higher than those advised or sub-advised exclusively by unaffiliated mutual fund companies. John Hancock's affiliates provide advisory and sub-advisory services to these internally-managed funds. For more information, refer to the "Expense Ratio" section of this document.
The performance data presented represents past performance. Past performance is no guarantee of future results and current performance may be lower or higher than the performance quoted. An investment in a sub-account will fluctuate in value to reflect the value of the underlying portfolio and, when redeemed, may be worth more or less than original cost. Performance does not reflect any applicable contract-level or participant-level charges, fees for guaranteed benefits if elected by participant, or any redemption fees imposed by an underlying mutual fund company. These charges, if included, would otherwise reduce the total return for a participant’s account. Performance information current to the most recent month-end is available on our website www.jhpensions.com.
Performance data for a sub-account for any period prior to the date introduced is shown in bold and is hypothetical based on the performance of the underlying fund.
The Index1 is Barclays Capital Aggregate Bond Index.i15
The Index2 is 20% S&P 500/80% BarCap Agg Bond Index.i07
The peer group is Conservative Allocation.p2
Principal risks include: small/mid cap stock, sector, non-diversification, mortgage-backed and asset-backed securities, merger and replacement transition, market, manager, liquidity, issuer, initial public offerings, fund of funds, foreign securities, fixed-income securities, exchange traded funds, equity securities and credit and counterparty. For more details, see section 3 of this booklet (Risk Disclosures).
Portfolio* HighlightsInvestment Objective and Policies 4To seek to achieve a high level of current income with some consideration given to growth of capital by investing approximately 80% of the portfolio's assets in underlying JHT portfolios that invest primarily in fixed-income securities and approximately 20% of its assets in underlying JHT portfolios that invest primarily in equity securities. The portfolio's investment objective does allow for a variation of plus or minus 10% from the typical weightings.
Why Consider this Portfolio*
You have a short to intermediate investment time horizon and seek current income as the primary focus, with some consideration given to growth of capital. You can accept levels of risk below that of equity markets
4
You want instant and broad diversification with exposure to a wide range of asset classes and investment styles including domestic stocks, international stocks and fixed-income securities
4
Investment Process 4There are four main steps involved in the design of the John Hancock Lifestyle Funds. First, asset classes and underlying funds are selected for potential inclusion in the portfolios. Next, sophisticated optimization techniques are used to establish the appropriate weightings given to each asset class. In the third step, an advanced statistical process is used to determine the optimal mix of managers. In the fourth and final step, the economic environment and investment markets are continually monitored to determine if any changes are needed, and to keep the portfolio up-to-date and consistent with its investment policies and objectives.
Weightings±International Value (Templeton)0.8%International Index (MFC Global USA)2.1%International Opportunities (Marsico)0.8%
U.S. Multi Sector (GMO)1.3%Blue Chip Growth (T. Rowe Price)2.5%Mid Cap Index (MFC Global USA)1.6%
Equity Income (T. Rowe Price)2.5%Index 500 (MFC Global USA)5.2%Fundamental Value (Davis)1.8%
Short-Term Government Income (MFC Global US)
1.6%
Bond (MFC Global US)26.2%
International Core (GMO) 1.0%Small Cap Index (MFC Global USA) 1.3%
Global Bond (PIMCO) 3.4%Floating Rate Income (WAMCO) 0.8%High Yield Bond (WAMCO) 0.7%High Income (MFC Global US) 0.3%Strategic Income Opportunities (MFC Global US)
0.7%
New Income (T. Rowe Price) 15.7%Strategic Bond (WAMCO) 0.2%Total Bond Market (Declaration) 4.9%Total Return Bond (PIMCO) 15.0%Core Bond (WCM) 9.6%
Weightings as of September 30, 2010Weightings are subject to change
15 351405-E01

Select Asset Allocation Moderate Portfolio13,35,91
Investing solely in JHT - Lifestyle Moderate Trust (Class 1)Sub-advised by MFC Global Investment Mgmt
Ticker Symbol+: JELMX
P2459-SAM-C6 Printed 11/10-18374
Risk/Return Category
Income
Low High
Asset Class/Investment Style
Guaranteed Income Feature
Performance of the sub-account**
Returns (as of 9-30-10)
Fund Index1 Index2Peer
Group
1 year 10.10% 8.16% 9.45% 9.55%3 year 0.42% 7.42% 1.90% 0.98%5 year 3.47% 6.20% 4.32% 3.34%10 year 3.99% 6.41% 4.00% 3.53%
Expense Ratio (as of 9-30-10)****
Fund Expense Ratio 0.83%AMC 0.10%Sales & Service Fee¥ 0.37%Expense Ratio**** 1.30%
The inception date for the sub-account+ is November 6, 2009 and for the current underlying Portfolio is January 7, 1997.
¥See important notes.
The revenue John Hancock receives from any of its internally-managed Funds may be higher than those advised or sub-advised exclusively by unaffiliated mutual fund companies. John Hancock's affiliates provide advisory and sub-advisory services to these internally-managed funds. For more information, refer to the "Expense Ratio" section of this document.
The performance data presented represents past performance. Past performance is no guarantee of future results and current performance may be lower or higher than the performance quoted. An investment in a sub-account will fluctuate in value to reflect the value of the underlying portfolio and, when redeemed, may be worth more or less than original cost. Performance does not reflect any applicable contract-level or participant-level charges, fees for guaranteed benefits if elected by participant, or any redemption fees imposed by an underlying mutual fund company. These charges, if included, would otherwise reduce the total return for a participant’s account. Performance information current to the most recent month-end is available on our website www.jhpensions.com.
Performance data for a sub-account for any period prior to the date introduced is shown in bold and is hypothetical based on the performance of the underlying fund.
The Index1 is Barclays Capital Aggregate Bond Index.i15
The Index2 is 40% S&P 500/60% BarCap Agg Bond Index.i10
The peer group is Conservative Allocation.p2
Principal risks include: small/mid cap stock, sector, non-diversification, mortgage-backed and asset-backed securities, merger and replacement transition, market, manager, liquidity, issuer, initial public offerings, fund of funds, foreign securities, fixed-income securities, exchange traded funds, equity securities and credit and counterparty. For more details, see section 3 of this booklet (Risk Disclosures).
Portfolio* HighlightsInvestment Objective and Policies 4To seek to achieve a balance between a high level of current income and growth of capital, with a greater emphasis on income by investing approximately 60% of the portfolio's assets in underlying JHT portfolios that invest primarily in fixed-income securities and approximately 40% of its assets in underlying JHT portfolios that invest primarily in equity securities. The portfolio's investment objectivedoes allow for a variation of plus or minus 10% from the typical weightings.
Why Consider this Portfolio*
You have an intermediate investment time horizon and seek a balance between current income and capital growth, with a greater focus on the former. You can accept levels of risk below that of equity markets
4
You want instant and broad diversification with exposure to a wide range of asset classes and investment styles including domestic stocks, international stocks, and fixed-income securities
4
Investment Process 4There are four main steps involved in the design of the John Hancock Lifestyle Funds. First, asset classes and underlying funds are selected for potential inclusion in the portfolios. Next, sophisticated optimization techniques are used to establish the appropriate weightings given to each asset class. In the third step, an advanced statistical process is used to determine the optimal mix of managers. In the fourth and final step, the economic environment and investment markets are continually monitored to determine if any changes are needed, and to keep the portfolio up-to-date and consistent with its investment policies and objectives.
Weightings±
International Opportunities (Marsico)1.3%International Growth Stock (Invesco Advisers)
0.2%
Large Cap Value (BlackRock)0.5%Value & Restructuring (Columbia)1.0%All Cap Value (Lord Abbett)0.7%U.S. Multi Sector (GMO)1.0%Blue Chip Growth (T. Rowe Price)2.8%Capital Appreciation (Jennison)2.3%Mid Value (T. Rowe Price)0.9%Mid Cap Index (MFC Global USA)1.2%Small Company Value (T. Rowe Price)0.5%Small Cap Value (Wellington)0.4%
Equity Income (T. Rowe Price)2.8%Index 500 (MFC Global USA)10.0%Alpha Opportunities (Wellington)2.0%Fundamental Value (Davis)2.0%
Short-Term Government Income (MFC Global US)
1.2%
Bond (MFC Global US)19.3%
International Index (MFC Global USA) 4.1%International Value (Templeton) 1.6%International Core (GMO) 2.6%Smaller Company Growth (MFC Global USA, Frontier, Perimeter)
0.3%
Small Company Growth (Invesco Advisers)
0.3%
Small Cap Growth (Wellington) 0.3%Small Cap Index (MFC Global USA) 0.8%Mid Cap Stock (Wellington) 0.9%
Global Bond (PIMCO) 2.6%Floating Rate Income (WAMCO) 0.4%U.S. High Yield Bond (Wells Capital) 0.2%High Yield Bond (WAMCO) 0.6%High Income (MFC Global US) 0.6%Strategic Income Opportunities (MFC Global US)
0.6%
New Income (T. Rowe Price) 11.8%Total Bond Market (Declaration) 3.7%Total Return Bond (PIMCO) 11.2%Core Bond (WCM) 7.3%
Weightings as of September 30, 2010Weightings are subject to change
16 351405-E01

Select Asset Allocation Balanced Portfolio13,35,91
Investing solely in JHT - Lifestyle Balanced Trust (Class 1)Sub-advised by MFC Global Investment Mgmt
Ticker Symbol+: JELBX
P2459-SAB-C6 Printed 11/10-18374
Risk/Return Category
Growth & Income
Low High
Asset Class/Investment Style
Guaranteed Income Feature
Performance of the sub-account**
Returns (as of 9-30-10)
Fund Index1 Index2Peer
Group
1 year 10.58% 10.16% 9.68% 9.13%3 year -2.28% -7.16% 0.45% -2.34%5 year 2.71% 0.64% 3.78% 2.46%10 year 3.35% -0.43% 3.32% 2.56%
Expense Ratio (as of 9-30-10)****
Fund Expense Ratio 0.84%AMC 0.10%Sales & Service Fee¥ 0.37%Expense Ratio**** 1.31%
The inception date for the sub-account+ is November 6, 2009 and for the current underlying Portfolio is January 7, 1997.
¥See important notes.
The revenue John Hancock receives from any of its internally-managed Funds may be higher than those advised or sub-advised exclusively by unaffiliated mutual fund companies. John Hancock's affiliates provide advisory and sub-advisory services to these internally-managed funds. For more information, refer to the "Expense Ratio" section of this document.
The performance data presented represents past performance. Past performance is no guarantee of future results and current performance may be lower or higher than the performance quoted. An investment in a sub-account will fluctuate in value to reflect the value of the underlying portfolio and, when redeemed, may be worth more or less than original cost. Performance does not reflect any applicable contract-level or participant-level charges, fees for guaranteed benefits if elected by participant, or any redemption fees imposed by an underlying mutual fund company. These charges, if included, would otherwise reduce the total return for a participant’s account. Performance information current to the most recent month-end is available on our website www.jhpensions.com.
Performance data for a sub-account for any period prior to the date introduced is shown in bold and is hypothetical based on the performance of the underlying fund.
The Index1 is S&P 500 Index.i58
The Index2 is 50% S&P 500/50% BarCap Agg Bond Index.i75
The peer group is Moderate Allocation.p20
Principal risks include: small/mid cap stock, sector, non-diversification, mortgage-backed and asset-backed securities, merger and replacement transition, market, manager, liquidity, issuer, initial public offerings, fund of funds, foreign securities, fixed-income securities, exchange traded funds, equity securities and credit and counterparty. For more details, see section 3 of this booklet (Risk Disclosures).
Portfolio* HighlightsInvestment Objective and Policies 4To seek to achieve a balance between a high level of current income and growth of capital, with a greater emphasis on growth of capital, by investing approximately 30-50% of the portfolio's assets in underlying JHT portfolios that invest primarily in fixed-income securities and approximately 50-70% of its assets in underlying JHT portfolios that invest primarily in equity securities.
Why Consider this Portfolio*
You have an intermediate to long-term investment time horizon and seek a balance between capital growth and current income, with a greater focus on the former. You can accept levels of risk below that of equity markets
4
You want instant and broad diversification with exposure to a wide range of asset classes and investment styles including domestic stocks, international stocks and fixed-income securities
4
Investment Process 4There are four main steps involved in the design of the John Hancock Lifestyle Funds. First, asset classes and underlying funds are selected for potential inclusion in the portfolios. Next, sophisticated optimization techniques are used to establish the appropriate weightings given to each asset class. In the third step, an advanced statistical process is used to determine the optimal mix of managers. In the fourth and final step, the economic environment and investment markets are continually monitored to determine if any changes are needed, and to keep the portfolio up-to-date and consistent with its investment policies and objectives.
Weightings±
International Growth Stock (Invesco Advisers)
0.2%
Emerging Markets Value (DFA)3.1%
Large Cap Value (BlackRock)0.5%Value & Restructuring (Columbia)1.0%All Cap Value (Lord Abbett)0.7%All Cap Core (DeAM)1.0%U.S. Multi Sector (GMO)2.0%Blue Chip Growth (T. Rowe Price)2.3%Growth Equity (Rainier)1.2%Capital Appreciation (Jennison)1.7%Mid Cap Value Equity (Columbia)0.5%Mid Value (T. Rowe Price)0.8%Mid Cap Index (MFC Global USA)1.5%Small Company Value (T. Rowe Price)0.6%Small Cap Value (Wellington)0.5%
Equity Income (T. Rowe Price)2.5%Optimized Value (MFC Global USA)0.5%Index 500 (MFC Global USA)12.4%Alpha Opportunities (Wellington)2.5%Fundamental Value (Davis)2.5%
Short-Term Government Income (MFC Global US)
1.0%
Bond (MFC Global US)14.4%
International Opportunities (Marsico) 1.3%International Index (MFC Global USA) 5.0%International Value (Templeton) 1.5%International Core (GMO) 2.0%Smaller Company Growth (MFC Global USA, Frontier, Perimeter)
0.4%
Small Company Growth (Invesco Advisers)
0.3%
Small Cap Growth (Wellington) 0.4%Small Cap Index (MFC Global USA) 1.0%Heritage (American Century) 0.5%Mid Cap Stock (Wellington) 0.7%
Global Bond (PIMCO) 2.1%Floating Rate Income (WAMCO) 0.4%U.S. High Yield Bond (Wells Capital) 0.2%High Yield Bond (WAMCO) 1.7%High Income (MFC Global US) 0.4%Strategic Income Opportunities (MFC Global US)
0.7%
New Income (T. Rowe Price) 9.8%Strategic Bond (WAMCO) 0.1%Total Bond Market (Declaration) 3.0%Total Return Bond (PIMCO) 9.2%Core Bond (WCM) 5.9%
Weightings as of September 30, 2010Weightings are subject to change
17 351405-E01

Select Asset Allocation Growth Portfolio13,35,91
Investing solely in JHT - Lifestyle Growth Trust (Class 1)Sub-advised by MFC Global Investment Mgmt
Ticker Symbol+: JELGX
P2459-SAG-C6 Printed 11/10-18374
Risk/Return Category
Growth
Low High
Asset Class/Investment Style
Guaranteed Income Feature
Performance of the sub-account**
Returns (as of 9-30-10)
Fund Index1 Index2Peer
Group
1 year 9.88% 10.16% 10.00% 8.87%3 year -4.77% -7.16% -2.53% -7.22%5 year 1.68% 0.64% 2.61% 0.40%10 year 2.03% -0.43% 1.90% 0.17%
Expense Ratio (as of 9-30-10)****
Fund Expense Ratio 0.86%AMC 0.10%Sales & Service Fee¥ 0.37%Expense Ratio**** 1.33%
The inception date for the sub-account+ is November 6, 2009 and for the current underlying Portfolio is January 7, 1997.
¥See important notes.
The revenue John Hancock receives from any of its internally-managed Funds may be higher than those advised or sub-advised exclusively by unaffiliated mutual fund companies. John Hancock's affiliates provide advisory and sub-advisory services to these internally-managed funds. For more information, refer to the "Expense Ratio" section of this document.
The performance data presented represents past performance. Past performance is no guarantee of future results and current performance may be lower or higher than the performance quoted. An investment in a sub-account will fluctuate in value to reflect the value of the underlying portfolio and, when redeemed, may be worth more or less than original cost. Performance does not reflect any applicable contract-level or participant-level charges, fees for guaranteed benefits if elected by participant, or any redemption fees imposed by an underlying mutual fund company. These charges, if included, would otherwise reduce the total return for a participant’s account. Performance information current to the most recent month-end is available on our website www.jhpensions.com.
Performance data for a sub-account for any period prior to the date introduced is shown in bold and is hypothetical based on the performance of the underlying fund.
The Index1 is S&P 500 Index.i58
The Index2 is 70% S&P 500/30% BarCap Agg Bond Index.i20
The peer group is Large Blend.p12
Principal risks include: manager, liquidity, issuer, initial public offerings, fund of funds, foreign securities, fixed-income securities, exchange traded funds, equity securities, credit and counterparty, small/mid cap stock, sector, non-diversification, mortgage-backed and asset-backed securities, merger and replacement transition and market. For more details, see section 3 of this booklet (Risk Disclosures).
Portfolio* HighlightsInvestment Objective and Policies 4To seek to achieve long-term growth of capital by investing approximately 70-90% of the portfolio's assets in underlying JHT portfolios that invest primarily in equity securities and approximately 10-30% of its assets in underlying JHT portfolios that invest primarily in fixed-income securities. Current income is also a consideration.
Why Consider this Portfolio*
You have a long-term investment time horizon and seek growth of capital as the primary focus, with some consideration given to current income. You can accept levels of risk similar to that of equity markets
4
You want instant and broad diversification with exposure to a wide range of asset classes and investment styles including domestic stocks, international stocks, and fixed-income securities
4
Investment Process 4There are four main steps involved in the design of the John Hancock Lifestyle Funds. First, asset classes and underlying funds are selected for potential inclusion in the portfolios. Next, sophisticated optimization techniques are used to establish the appropriate weightings given to each asset class. In the third step, an advanced statistical process is used to determine the optimal mix of managers. In the fourth and final step, the economic environment and investment markets are continually monitored to determine if any changes are needed, and to keep the portfolio up-to-date and consistent with its investment policies and objectives.
Weightings±
International Value (Templeton)2.0%International Index (MFC Global USA)7.5%International Opportunities (Marsico)1.8%International Growth Stock (Invesco Advisers)
0.3%
Emerging Markets Value (DFA)4.1%
Large Cap Value (BlackRock)0.8%Value & Restructuring (Columbia)1.1%All Cap Value (Lord Abbett)1.0%All Cap Core (DeAM)1.0%U.S. Multi Sector (GMO)3.2%Blue Chip Growth (T. Rowe Price)3.0%Growth Equity (Rainier)2.0%Capital Appreciation (Jennison)2.5%Mid Cap Value Equity (Columbia)0.5%Mid Value (T. Rowe Price)1.0%Mid Cap Index (MFC Global USA)2.0%Small Company Value (T. Rowe Price)0.7%Small Cap Value (Wellington)0.5%Small Cap Opportunities (DFA, Invesco Advisers)
0.5%
Equity Income (T. Rowe Price)3.7%Optimized Value (MFC Global USA)0.8%Index 500 (MFC Global USA)17.2%
International Core (GMO) 2.5%Smaller Company Growth (MFC Global USA, Frontier, Perimeter)
0.4%
Small Company Growth (Invesco Advisers)
0.4%
Small Cap Growth (Wellington) 0.4%Small Cap Index (MFC Global USA) 1.5%Heritage (American Century) 0.5%Mid Cap Stock (Wellington) 1.0%
Global Bond (PIMCO) 1.2%Floating Rate Income (WAMCO) 0.6%U.S. High Yield Bond (Wells Capital) 0.1%High Yield Bond (WAMCO) 0.9%High Income (MFC Global US) 0.3%Strategic Income Opportunities (MFC Global US)
0.3%
New Income (T. Rowe Price) 5.8%Total Bond Market (Declaration) 1.8%Total Return Bond (PIMCO) 5.5%Core Bond (WCM) 3.5%Bond (MFC Global US) 8.5%Short-Term Government Income (MFC Global US)
0.6%
Fundamental Value (Davis) 3.5%Alpha Opportunities (Wellington) 3.5%
Weightings as of September 30, 2010Weightings are subject to change
18 351405-E01

Select Core Fundamental Holdings Portfolio13,35
Investing solely in John Hancock Funds II - Core Fundamental Holdings Portfolio (Class 1)Sub-advised by MFC Global Investment Mgmt
Ticker Symbol+: JAFOX
P2459-SFH-C6 Printed 11/10-18374
Risk/Return Category
Growth & Income
Low High
Asset Class/Investment Style
Guaranteed Income Feature
Performance of the sub-account**
Returns (as of 9-30-10)
Fund Index1 Index2Peer
Group
1 year 8.48% 10.16% 9.93% 9.13%Since inception
-0.38% n/a n/a n/a
Expense Ratio (as of 9-30-10)****
Fund Expense Ratio 0.60%AMC 0.42%Sales & Service Fee¥ 0.37%Expense Ratio**** 1.39%
The inception date for the sub-account+ is November 6, 2009 and for the current underlying Portfolio is July 1, 2008.
¥See important notes.
The revenue John Hancock receives from any of its internally-managed Funds may be higher than those advised or sub-advised exclusively by unaffiliated mutual fund companies. John Hancock's affiliates provide advisory and sub-advisory services to these internally-managed funds. For more information, refer to the "Expense Ratio" section of this document.
The performance data presented represents past performance. Past performance is no guarantee of future results and current performance may be lower or higher than the performance quoted. An investment in a sub-account will fluctuate in value to reflect the value of the underlying portfolio and, when redeemed, may be worth more or less than original cost. Performance does not reflect any applicable contract-level or participant-level charges, fees for guaranteed benefits if elected by participant, or any redemption fees imposed by an underlying mutual fund company. These charges, if included, would otherwise reduce the total return for a participant’s account. Performance information current to the most recent month-end is available on our website www.jhpensions.com.
Performance data for a sub-account for any period prior to the date introduced is shown in bold and is hypothetical based on the performance of the underlying fund.
The Index1 is S&P 500 Index.i58
The Index2 is 65% S&P 500/35% BarCap Agg Bond Index.i93
The peer group is Moderate Allocation.p20
Principal risks include: credit and counterparty, derivatives, equity securities, exchange traded funds, fixed-income securities, foreign securities, fund of funds, issuer, liquidity, manager, market, merger and replacement transition, mortgage-backed and asset-backed securities, sector and small/mid cap stock. For more details, see section 3 of this booklet (Risk Disclosures).
Portfolio* HighlightsInvestment Objective and Policies 4To seek long-term growth of capital by investing approximately 60% of the portfolio's assets in equity securities and approximately 40% of the portfolio's assets in fixed income securities.
Why Consider this Portfolio*
You want exposure to underlying funds managed by American Funds4You want long-term growth of capital with some protection against stock market volatility, but can accept the inherent risks of investing in stocks.
4
You want instant and broad diversification with exposure to a range of asset classes, including domestic stocks, international stocks and fixed income securities.
4
Allocations to the underlying funds are monitored and rebalanced for you.4
Investment Process 4The portfolio invests approximately 60% of assets in equity securities and 40% of assets in fixed income securities, with some flexibility to actively manage the asset allocation. It provides broad exposure to U.S. equity and fixed-income markets, as well as some exposure to international equities, and aims to provide investors with a balanced asset allocation. The mix of underlying portfolios includes actively managed funds from American Funds and index funds. To determine the optimal mix of portfolios, MFC Global uses some of the most sophisticated modeling techniques available. First, they establish expected returns, volatilities, and correlations between the various asset classes. These are used to develop an efficient frontier of optimal portfolios. MFC Global then uses optimization techniques (similar to Monte Carlo simulations) to generate thousands of different outcomes, or efficient frontiers. Next, they average all the possible outcomes to come up with an enhanced efficient frontier. The portfolios on the enhanced frontier are well diversified and can be expected to deliver more robust performance in a wider range of environments than portfolios developed using standard optimization techniques.
Weightings±
Washington Mutual Investors Fund (American Funds)
7.1%
Investment Company of America (American Funds)
14.1%
Index 500 (MFC Global USA)18.8%
Total Bond Market (Declaration)15.9%
Growth Fund of America (American Funds)
7.1%
International Equity Index (SSgA) 5.2%Europacific Growth Fund (American Funds)
7.9%
U.S. Government Securities Fund (American Funds)
23.9%
Weightings as of September 30, 2010Weightings are subject to change
19 351405-E01

Select Core Diversified Growth & Income Portfolio13,35
Investing solely in John Hancock Funds II - Core Diversified Growth & Income Portfolio (Class 1)Sub-advised by MFC Global Investment Mgmt
Ticker Symbol+: JADOX
P2459-SGI-C6 Printed 11/10-18374
Risk/Return Category
Growth & Income
Low High
Asset Class/Investment Style
Guaranteed Income Feature
Performance of the sub-account**
Returns (as of 9-30-10)
Fund Index1 Index2Peer
Group
1 year 8.65% 10.16% 10.05% 9.13%Since inception
-1.64% n/a n/a n/a
Expense Ratio (as of 9-30-10)****
Fund Expense Ratio 0.59%AMC 0.42%Sales & Service Fee¥ 0.37%Expense Ratio**** 1.38%
The inception date for the sub-account+ is November 6, 2009 and for the current underlying Portfolio is July 1, 2008.
¥See important notes.
The revenue John Hancock receives from any of its internally-managed Funds may be higher than those advised or sub-advised exclusively by unaffiliated mutual fund companies. John Hancock's affiliates provide advisory and sub-advisory services to these internally-managed funds. For more information, refer to the "Expense Ratio" section of this document.
The performance data presented represents past performance. Past performance is no guarantee of future results and current performance may be lower or higher than the performance quoted. An investment in a sub-account will fluctuate in value to reflect the value of the underlying portfolio and, when redeemed, may be worth more or less than original cost. Performance does not reflect any applicable contract-level or participant-level charges, fees for guaranteed benefits if elected by participant, or any redemption fees imposed by an underlying mutual fund company. These charges, if included, would otherwise reduce the total return for a participant’s account. Performance information current to the most recent month-end is available on our website www.jhpensions.com.
Performance data for a sub-account for any period prior to the date introduced is shown in bold and is hypothetical based on the performance of the underlying fund.
The Index1 is S&P 500 Index.i58
The Index2 is 75% S&P 500/25% BarCap Agg Bond Index.i76
The peer group is Moderate Allocation.p20
Principal risks include: credit and counterparty, derivatives, equity securities, exchange traded funds, fixed-income securities, foreign securities, fund of funds, issuer, liquidity, manager, market, merger and replacement transition and small/mid cap stock. For more details, see section 3 of this booklet (Risk Disclosures).
Portfolio* HighlightsInvestment Objective and Policies 4To seek long term growth of capital and income by investing approximately 75% of the portfolio's assets in equity securities and approximately 25% of the portfolio's assets in fixed income securities.
Why Consider this Portfolio*
You want exposure to underlying funds managed by American Funds4You want long-term growth of capital with some protection against stock market volatility, but can accept the inherent risks of investing in stocks.
4
You want instant and broad diversification with exposure to a range of asset classes, including domestic stocks, international stocks and fixed income securities.
4
Allocations to the underlying funds are monitored and rebalanced for you.4
Investment Process 4The portfolio invests approximately 75% of assets in equity securities and 25% of assets in fixed income securities, with some flexibility to actively manage the asset allocation. It provides broad exposure to U.S. equity and fixed-income markets, as well as exposure to international equities, and aims to provide investors with a balanced asset allocation. The mix of underlying portfolios includes actively managed funds from American Funds and index funds. To determine the optimal mix of portfolios, MFC Global uses some of the most sophisticated modeling techniques available. First, they establish expected returns, volatilities, and correlations between the various asset classes. These are used to develop an efficient frontier of optimal portfolios. MFC Global then uses optimization techniques (similar to Monte Carlo simulations) to generate thousands of different outcomes, or efficient frontiers. Next, they average all the possible outcomes to come up with an enhanced efficient frontier. The portfolios on the enhanced frontier are well diversified and can be expected to deliver more robust performance in a wider range of environments than portfolios developed using standard optimization techniques.
Weightings±
Capital World Growth & Income (American Funds)
3.0%
New Perspective Fund (American Funds)
3.0%
Washington Mutual Investors Fund (American Funds)
8.1%
Investment Company of America (American Funds)
16.2%
Index 500 (MFC Global USA)23.6%
Growth Fund of America (American Funds)
8.1%
International Equity Index (SSgA) 4.4%Europacific Growth Fund (American Funds)
3.6%
U.S. Government Securities Fund (American Funds)
18.0%
Total Bond Market (Declaration) 12.0%
Weightings as of September 30, 2010Weightings are subject to change
20 351405-E01
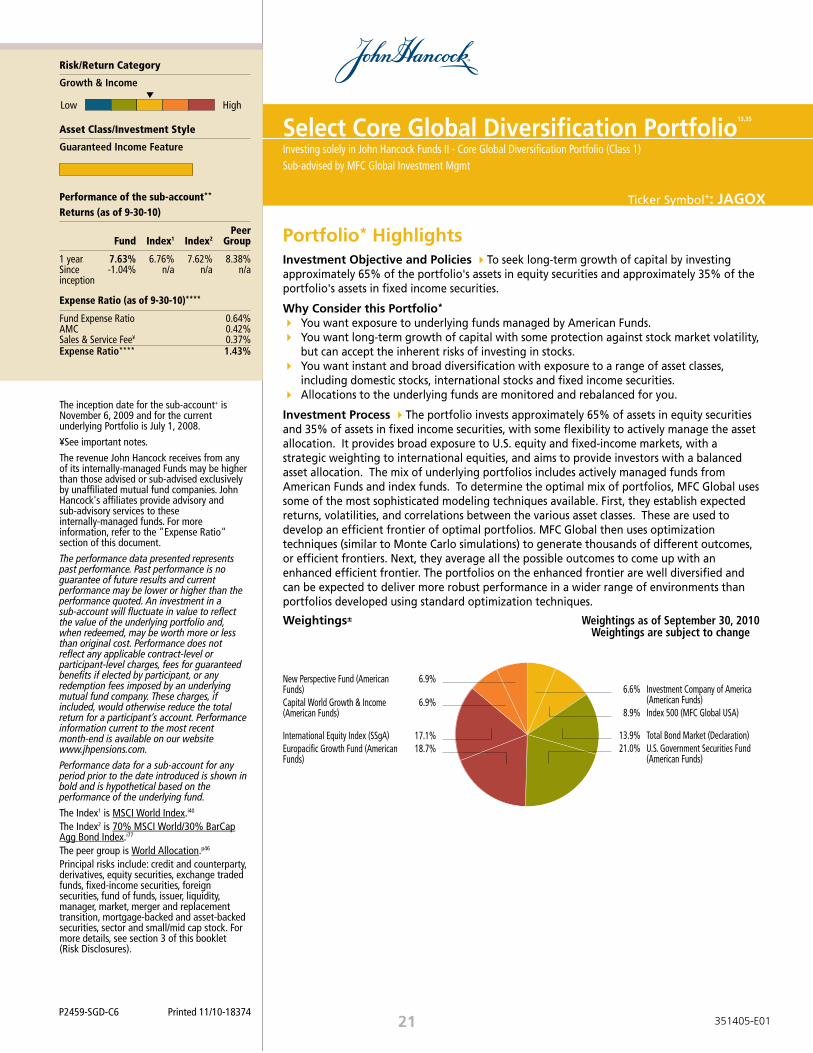
Select Core Global Diversification Portfolio13,35
Investing solely in John Hancock Funds II - Core Global Diversification Portfolio (Class 1)Sub-advised by MFC Global Investment Mgmt
Ticker Symbol+: JAGOX
P2459-SGD-C6 Printed 11/10-18374
Risk/Return Category
Growth & Income
Low High
Asset Class/Investment Style
Guaranteed Income Feature
Performance of the sub-account**
Returns (as of 9-30-10)
Fund Index1 Index2Peer
Group
1 year 7.63% 6.76% 7.62% 8.38%Since inception
-1.04% n/a n/a n/a
Expense Ratio (as of 9-30-10)****
Fund Expense Ratio 0.64%AMC 0.42%Sales & Service Fee¥ 0.37%Expense Ratio**** 1.43%
The inception date for the sub-account+ is November 6, 2009 and for the current underlying Portfolio is July 1, 2008.
¥See important notes.
The revenue John Hancock receives from any of its internally-managed Funds may be higher than those advised or sub-advised exclusively by unaffiliated mutual fund companies. John Hancock's affiliates provide advisory and sub-advisory services to these internally-managed funds. For more information, refer to the "Expense Ratio" section of this document.
The performance data presented represents past performance. Past performance is no guarantee of future results and current performance may be lower or higher than the performance quoted. An investment in a sub-account will fluctuate in value to reflect the value of the underlying portfolio and, when redeemed, may be worth more or less than original cost. Performance does not reflect any applicable contract-level or participant-level charges, fees for guaranteed benefits if elected by participant, or any redemption fees imposed by an underlying mutual fund company. These charges, if included, would otherwise reduce the total return for a participant’s account. Performance information current to the most recent month-end is available on our website www.jhpensions.com.
Performance data for a sub-account for any period prior to the date introduced is shown in bold and is hypothetical based on the performance of the underlying fund.
The Index1 is MSCI World Index.i40
The Index2 is 70% MSCI World/30% BarCap Agg Bond Index.i77
The peer group is World Allocation.p46
Principal risks include: credit and counterparty, derivatives, equity securities, exchange traded funds, fixed-income securities, foreign securities, fund of funds, issuer, liquidity, manager, market, merger and replacement transition, mortgage-backed and asset-backed securities, sector and small/mid cap stock. For more details, see section 3 of this booklet (Risk Disclosures).
Portfolio* HighlightsInvestment Objective and Policies 4To seek long-term growth of capital by investing approximately 65% of the portfolio's assets in equity securities and approximately 35% of the portfolio's assets in fixed income securities.
Why Consider this Portfolio*
You want exposure to underlying funds managed by American Funds.4You want long-term growth of capital with some protection against stock market volatility, but can accept the inherent risks of investing in stocks.
4
You want instant and broad diversification with exposure to a range of asset classes, including domestic stocks, international stocks and fixed income securities.
4
Allocations to the underlying funds are monitored and rebalanced for you.4
Investment Process 4The portfolio invests approximately 65% of assets in equity securities and 35% of assets in fixed income securities, with some flexibility to actively manage the asset allocation. It provides broad exposure to U.S. equity and fixed-income markets, with a strategic weighting to international equities, and aims to provide investors with a balanced asset allocation. The mix of underlying portfolios includes actively managed funds from American Funds and index funds. To determine the optimal mix of portfolios, MFC Global uses some of the most sophisticated modeling techniques available. First, they establish expected returns, volatilities, and correlations between the various asset classes. These are used to develop an efficient frontier of optimal portfolios. MFC Global then uses optimization techniques (similar to Monte Carlo simulations) to generate thousands of different outcomes, or efficient frontiers. Next, they average all the possible outcomes to come up with an enhanced efficient frontier. The portfolios on the enhanced frontier are well diversified and can be expected to deliver more robust performance in a wider range of environments than portfolios developed using standard optimization techniques.
Weightings±
Investment Company of America (American Funds)
6.6%
Index 500 (MFC Global USA)8.9%
Total Bond Market (Declaration)13.9%U.S. Government Securities Fund (American Funds)
21.0%
New Perspective Fund (American Funds)
6.9%
Capital World Growth & Income (American Funds)
6.9%
International Equity Index (SSgA) 17.1%Europacific Growth Fund (American Funds)
18.7%
Weightings as of September 30, 2010Weightings are subject to change
21 351405-E01

Money Market Fund13,82,83,91
Investing solely in JHT- Money Market Trust (Class 1)Sub-advised by MFC Global Investment Mgmt
Ticker Symbol+: JHOXX
P2459-MMR-C6 Printed 11/10-18374
Risk/Return Category
Conservative
Low High
Asset Class/Investment Style
Domestic Fixed Income
HighMediumLow
Short Int Long
Performance of the sub-account**
Returns (as of 9-30-10)
Fund IndexPeer
Group
1 year -0.50% 0.12% 0.04%3 year 0.56% 1.01% 1.22%5 year 1.93% 2.48% 2.47%10 year 1.66% 2.41% 2.22%
Expense Ratio (as of 9-30-10)****
Fund Expense Ratio 0.34%AMC 0.24%Sales & Service Fee¥ 0.37%Expense Ratio**** 0.95%
The inception date for the sub-account+ is July 30, 1999 and for the current underlying Portfolio is August 2, 1999.
¥See important notes.
The performance data presented represents past performance. Past performance is no guarantee of future results and current performance may be lower or higher than the performance quoted. An investment in a sub-account will fluctuate in value to reflect the value of the underlying portfolio and, when redeemed, may be worth more or less than original cost. Performance does not reflect any applicable contract-level or certain participant-level charges, or any redemption fees imposed by an underlying mutual fund company. These charges, if included, would otherwise reduce the total return for a participant’s account. Performance information current to the most recent month-end is available on our website www.jhpensions.com.
Performance data for a sub-account for any period prior to the date introduced is shown in bold and is hypothetical based on the performance of the underlying fund.
The revenue John Hancock receives from any of its internally-managed Funds may be higher than those advised or sub-advised exclusively by unaffiliated mutual fund companies. John Hancock's affiliates provide advisory and sub-advisory services to these internally-managed funds. For more information, refer to the "Expense Ratio" section of this document.
The Index is Citigroup U.S. Domestic 3-Month T-Bill Index.i3
The peer group is Money Market Taxable.p21
Principal risks include: credit and counterparty, foreign securities, interest rate, issuer, liquidity, manager, market and merger and replacement transition. For more details, see section 3 of this booklet (Risk Disclosures).
Portfolio* HighlightsInvestment Objective and Policies 4To seek to achieve maximum current income consistent with preservation of principal and liquidity by investing in high-quality, U.S. dollar-denominated money market.
Why Consider this Portfolio*
You want to preserve capital and liquidity with a minimal amount of risk4This portfolio will seek to maintain a stable net asset value4
Investment Process 4MFC Global Investment Management's managers invest in high-quality, short-term U.S. dollar-denominated money market instruments. Examples include obligations issued or guaranteed as to principal and interest by the U.S. government, certificates of deposit, and bank notes. Also included are time deposits and bankers' acceptance of U.S. banks, commercial paper and corporate obligations and repurchase agreements.
Portfolio Holdings, Weightings and Allocation
Top Fixed-Income Holdings (as of 9-30-10)¤
US TREASURY BILLS 7.6%GE CAP FRN, 1.222% 5.3%IBRD DISCOUNT NOTE, 0.170% 4.1%FHLB FRN, 0.590% 3.1%BANK OF NOVA SCOTIA NY CP, 0.230% 2.9%
Totals 23.0% of assets
Top Sector Weightings (as of 9-30-10)¤
Corporates 66.7%Government Bonds 18.6%Agency 14.7%
Asset Allocation (as of 9-30-10)¤
Bond 100.0%
Key Statistics (as of 9-30-10 unless noted§)¤
Number of Holdings: 654Effective Duration: 1 years4
Average Maturity: .1 years4Net Assets: $4.3 billion4
Money Market Fund current 7-day yield is -0.61%. The current yield quotation more closely reflects the current earnings of the Money Market Fund as of the date this report was prepared while the Annualized returns above refer to a specific past holding period reflecting the period covered by this report. Due to Sales & Service fee, the subaccount's current yield may be lower than that of the underlying trust. Although the fund strives to maintain a positive yield, there is no guarantee the fund will be able to do so.
An investment in the underlying Money Market fund is not insured or guaranteed by the Federal Deposit Insurance Corporation or any other government agency.The underlying fund seeks to preserve a value of $1.00 per share but it is possible to lose money by investing in the Money Market Fund that invests in the underlying fund.
22 351405-E01

Total Return Fund62,73
Investing solely in John Hancock Funds II - Total Return Fund (Class 1)Sub-advised by Pacific Investment Management Company
Ticker Symbol+: JITRX
P2459-TRF-C6 Printed 11/10-18374
Risk/Return Category
Income
Low High
Asset Class/Investment Style
Domestic Fixed Income
HighMediumLow
Short Int Long
Performance of the sub-account**
Returns (as of 9-30-10)
Fund IndexPeer
Group
1 year 10.49% 8.16% 10.02%3 year 10.02% 7.42% 6.51%5 year 7.49% 6.20% 5.40%10 year 7.03% 6.41% 5.84%
Expense Ratio (as of 9-30-10)****
Fund Expense Ratio 0.78%AMC 0.00%Sales & Service Fee¥ 0.37%Expense Ratio**** 1.15%
The inception date for the sub-account+ is July 30, 1999 and for the current underlying Portfolio is August 2, 1999.
¥See important notes.
The performance data presented represents past performance. Past performance is no guarantee of future results and current performance may be lower or higher than the performance quoted. An investment in a sub-account will fluctuate in value to reflect the value of the underlying portfolio and, when redeemed, may be worth more or less than original cost. Performance does not reflect any applicable contract-level or certain participant-level charges, or any redemption fees imposed by an underlying mutual fund company. These charges, if included, would otherwise reduce the total return for a participant’s account. Performance information current to the most recent month-end is available on our website www.jhpensions.com.
Performance data for a sub-account for any period prior to the date introduced is shown in bold and is hypothetical based on the performance of the underlying fund.
The Index is Barclays Capital Aggregate Bond Index.i15
The peer group is Intermediate-Term Bond.p11
Principal risks include: turnover, short sale, mortgage-backed and asset-backed securities, merger and replacement transition, market, manager, liquidity, issuer, interest rate, foreign securities, fixed-income securities, derivatives, currency and credit and counterparty. For more details, see section 3 of this booklet (Risk Disclosures).
Portfolio* HighlightsInvestment Objective and Policies 4To seek to achieve maximum total return, consistent with preservation of capital and prudent investment management. Under normal market conditions, the fund invests at least 65% of its total assets in a diversified portfolio of fixed income instruments of varying maturities, which may be represented by forwards or derivatives, such as options, futures contracts, or swap agreements.
Managed in a Style Similar to 4PIMCO Total Return Fund
Why Consider this Portfolio*
You want a portfolio of securities with the potential to offer a steady stream of investment income and some protection against stock market volatility
4
You want a portfolio that is similar in quality and duration to broad bond market indices4Pacific Investment Management Company (PIMCO)'s managers attempt to reduce the risk of underperformance from any one source by employing multiple investment strategies
4
This portfolio is managed by Bill Gross and the PIMCO bond team, twice selected Morningstar's "Fixed Income Manager of the Year" (1998, 2000)
4
Investment Process 4PIMCO seeks to add value through a variety of techniques that attempt to maximize return and minimize volatility. PIMCO's investment process begins with the formation of top-down strategies based on their three to five-year outlook for the global economy and interest rates and how these outlooks apply to the upcoming three to twelve-month periods. Bottom-up analysis based on quantitative research, credit analysis and individual security selection is then meshed with the top-down strategies to add value.
Portfolio Holdings, Weightings and Allocation
Top Fixed-Income Holdings (as of 9-30-10)¤
US TREASURY NOTE, 2.500% 4.3%FIN FUT US 10YR CBT, 6.000% 4.2%US TREASURY NOTE, 3.125% 2.7%US TREASURY NOTE, 2.375% 2.4%US TREASURY NOTE, 1.875% 2.3%
Totals 15.9% of assets
Top Sector Weightings (as of 9-30-10)¤
U.S. Treasury/Agency 38.0%Corporates 19.3%Mortgage Backed
Securities 13.1%Other 8.2%Total Foreign Weight 7.7%
Asset Allocation (as of 9-30-10)¤
Bond 91.5%Cash 8.5%
Morningstar Information*** (as of 9-30-10)¤
Overall Morningstar Rating™: 222224Category: Intermediate-Term Bond4No. of funds: 3yr 1006; 5yr 861; 10yr 5384
Overall underlying Fund Rating is based on the 3-, 5- and 10-year Morningstar Risk-Adjusted Returns and accounts for variations in a fund's monthly performance, which were as follows: 3yr=5; 5yr=n/a; 10yr=n/a. Rating includes effects of sales charges, loads and redemption fees. See Important Notes for the rating criteria.
Key Statistics (as of 9-30-10 unless noted§)¤
Number of Holdings: 7274Effective Duration: 4.5 years4Average Maturity: 6.8 years4Turnover (annualized)§: 291% 4Net Assets: $2.2 billion4
23 351405-E01

Oppenheimer International Bond Fund56
Investing solely in Oppenheimer International Bond Fund (Class Y)Managed by OppenheimerFunds, Inc.
Ticker Symbol+: OIBYX
P2459-OIB-C6 Printed 11/10-18374
Risk/Return Category
Income
Low High
Asset Class/Investment Style
Global Fixed Income
Short Int Long
Performance of the sub-account**
Returns (as of 9-30-10)
FundPeer
Group
1 year 9.07% 8.22%3 year 8.03% 7.39%5 year 8.28% 6.30%10 year 10.94% 7.17%
Expense Ratio (as of 9-30-10)****
Fund Expense Ratio 0.63%AMC 0.25%Sales & Service Fee¥ 0.37%Expense Ratio**** 1.25%
The inception date for the sub-account+ is May 2, 2008 and for the current underlying Portfolio is June 15, 1995.
¥See important notes.
The performance data presented represents past performance. Past performance is no guarantee of future results and current performance may be lower or higher than the performance quoted. An investment in a sub-account will fluctuate in value to reflect the value of the underlying portfolio and, when redeemed, may be worth more or less than original cost. Performance does not reflect any applicable contract-level or certain participant-level charges, or any redemption fees imposed by an underlying mutual fund company. These charges, if included, would otherwise reduce the total return for a participant’s account. Performance information current to the most recent month-end is available on our website www.jhpensions.com.
Performance data for a sub-account for any period prior to the date introduced is shown in bold and is hypothetical based on the performance of the underlying fund.
The Index is Citigroup Non-U.S. Dollar World Government Bond Index.i69
The peer group is World Bond.p47
Principal risks include: credit and counterparty, currency, derivatives, foreign securities, interest rate, issuer, leverage, liquidity, manager, market, merger and replacement transition and non-diversification. For more details, see section 3 of this booklet (Risk Disclosures).
Portfolio* HighlightsInvestment Objective and Policies 4This fund seeks total return. At times, the Fund may emphasize seeking income when consistent with total return. The Fund invests mainly in a diversified portfolio of international bonds, focusing in part on government debt issued in developed and emerging market countries.
Why Consider this Portfolio*
You want a portfolio of international bonds that provide the potential for high returns and diversification from the U.S. fixed income markets
4
You want exposure to fixed-income investing through a bond fund with a proven track record
4
You want a portfolio that is diversified broadly across a range of countries, regions and securities to help dampen market volatility
4
OppenheimerFunds is a well-respected leader in international fixed income investing. The investment team focuses heavily on research to identify opportunities and help reduce unintended risks
4
Investment Process 4To help identify potential investment opportunities, the Oppenheimer Funds International team searches for industries that may benefit from industry trends. The managers then evaluate each potential investment based on its fundamentals, as well as the additional expenses and special risks that are inherent with foreign investing. These include currency fluctuations, foreign taxes and political and economic factors.
Portfolio Holdings, Weightings and Allocation
Top Fixed-Income Holdings (as of 9-30-10)¤
JAPAN (GOVT OF)SR UNSEC BDS 5YR, 0.500% 5.1%
JAPAN (GOVT OF)SR UNSEC BDS 10YR, 1.300% 5.1%
JAPAN (GOVT OF) SR. UNSEC BDS 2YR, 0.200 3.8%
JAPAN (GOVT OF) BDS 20YR SER 112, 2.100% 3.7%
EURO-BUNDESOBLIGATION FUTURES 3.3%Totals 21.0% of assets
Top Country Holdings (as of 9-30-10)¤
Japan 15.2%Brazil 11.6%Germany 7.1%United States 5.7%Mexico 5.6%
Asset Allocation (as of 9-30-10)¤
Bond 99.2%Cash 2.0%
Morningstar Information*** (as of 9-30-10)¤
Overall Morningstar Rating™: 222224Category: World Bond4No. of funds: 3yr 185; 5yr 153; 10yr 1054
Overall underlying Fund Rating is based on the 3-, 5- and 10-year Morningstar Risk-Adjusted Returns and accounts for variations in a fund's monthly performance, which were as follows: 3yr=4; 5yr=5; 10yr=n/a. Rating includes effects of sales charges, loads and redemption fees. See Important Notes for the rating criteria.
Key Statistics (as of 9-30-10 unless noted§)¤
Number of Holdings: 2024Effective Duration: 6.7 years4Average Maturity: 6.5 years4Turnover (annualized)§: 112% 4
24 351405-E01

Washington Mutual Investors Fund40,61,65
Investing solely in Washington Mutual Investors FundSM (Class R5)Managed by American Funds Group
Ticker Symbol+: RWMFX
P2459-WMI-C6 Printed 11/10-18374
Risk/Return Category
Growth & Income
Low High
Asset Class/Investment Style
Domestic Equity
LargeMediumSmall
Value Blend Growth
Performance of the sub-account**
Returns (as of 9-30-10)
Fund IndexPeer
Group
1 year 11.64% 10.16% 8.01%3 year -8.16% -7.16% -8.44%5 year 0.08% 0.64% -0.27%10 year 2.30% -0.43% 2.46%
Expense Ratio (as of 9-30-10)****
Fund Expense Ratio 0.42%AMC 0.45%Sales & Service Fee¥ 0.37%Expense Ratio**** 1.24%
The inception date for the sub-account+ is May 2, 2003 and for the current underlying Portfolio is July 31, 1952.
¥See important notes.
Class R shares became available for purchase on May 15, 2002. Results prior to that date are hypothetical based on Share Class A results, adjusted for typical estimated expenses, and are calculated without a sales charge.
The performance data presented represents past performance. Past performance is no guarantee of future results and current performance may be lower or higher than the performance quoted. An investment in a sub-account will fluctuate in value to reflect the value of the underlying portfolio and, when redeemed, may be worth more or less than original cost. Performance does not reflect any applicable contract-level or certain participant-level charges, or any redemption fees imposed by an underlying mutual fund company. These charges, if included, would otherwise reduce the total return for a participant’s account. Performance information current to the most recent month-end is available on our website www.jhpensions.com.
Performance data for a sub-account for any period prior to the date introduced is shown in bold and is hypothetical based on the performance of the underlying fund.
The Index is S&P 500 Index.i58
The peer group is Large Value.p14
Principal risks include: value stock, merger and replacement transition, market, manager, liquidity, issuer, foreign securities, equity securities and credit and counterparty. For more details, see section 3 of this booklet (Risk Disclosures).
Portfolio* HighlightsInvestment Objective and Policies 4To seek to produce income and provide the opportunity for capital appreciation by investing primarily in common stocks. The portfolio, under normal circumstances, will invest at least 95% of its assets in equity securities. The Fund invests in stocks that meet strict standards evolving from requirements originally established by the U.S. District Court for the District of Columbia for the investment of trust funds. The portfolio may invest a portion of its assets in securities of issuers domiciled outside the U.S. and not included in the Standard & Poor's 500 Composite Index.
Why Consider this Portfolio*
You want long-term growth of capital and can accept the inherent risks of investing in stocks4You want exposure to value stocks that typically pay dividends4American Funds' multiple portfolio counselor system allows each investment professional to implement his or her best investment ideas and helps to provide diversification for the overall portfolio
4
The team averages 26 years of investment experience4
Investment Process 4In the selection of securities for investment, the Fund's portfolio counselors consider companies that currently pay dividends, have the potential to pay future dividends, and companies that offer the potential for long-term capital appreciation. The Fund strives to achieve an overall portfolio with above-average yield and a below-average price-to-earnings ratio in relation to the S&P 500 Index. The Fund has an eligible list of securities in which it may invest, governed by a strict set of financial standards. The Fund may not invest in securities that derive their primary revenues from alcohol or tobacco.
Portfolio Holdings, Weightings and Allocation
Top Equity Holdings (as of 9-30-10)¤
CHEVRON CORP. 5.0%VERIZON COMMUNICATIONS 4.0%MERCK & COMPANY 3.6%MCDONALD'S CORP. 3.4%ROYAL DUTCH SHELL PLC 3.0%
Totals 19.0% of assets
Top Sector Weightings (as of 9-30-10)¤
Industrials 16.0%Health Care 13.7%Energy 12.8%Utilities 10.0%Financials 9.6%
Asset Allocation (as of 9-30-10)¤
Stock 98.4%Cash 1.6%
Morningstar Information*** (as of 9-30-10)¤
Overall Morningstar Rating™: 22224Category: Large Value4No. of funds: 3yr 1121; 5yr 940; 10yr 4904
Overall underlying Fund Rating is based on the 3-, 5- and 10-year Morningstar Risk-Adjusted Returns and accounts for variations in a fund's monthly performance, which were as follows: 3yr=4; 5yr=4; 10yr=n/a. Rating includes effects of sales charges, loads and redemption fees. See Important Notes for the rating criteria.
Key Statistics (as of 9-30-10 unless noted§)¤
Number of Holdings: 1104Beta: 0.9100 (S&P 500 Index)4R²: 0.9800 (S&P 500 Index)4Turnover (annualized)§: 22% 4Median Market Cap (asset weighted): $55.0 billion
4
25 351405-E01

T. Rowe Price Equity Income Fund30,31
Investing solely in T. Rowe Price Equity Income Fund (Advisor Class)Managed by T. Rowe Price Associates, Inc.
Ticker Symbol+: PAFDX
P2459-D&G-C6 Printed 11/10-18374
Risk/Return Category
Growth & Income
Low High
Asset Class/Investment Style
Domestic Equity
LargeMediumSmall
Value Blend Growth
Performance of the sub-account**
Returns (as of 9-30-10)
Fund IndexPeer
Group
1 year 8.56% 8.90% 8.01%3 year -7.40% -9.39% -8.44%5 year 0.22% -0.48% -0.27%10 year 3.31% 2.59% 2.46%
Expense Ratio (as of 9-30-10)****
Fund Expense Ratio 0.93%AMC 0.10%Sales & Service Fee¥ 0.37%Expense Ratio**** 1.40%
The inception date for the sub-account+ is July 30, 1999 and for the current underlying Portfolio is October 31, 1985.
¥See important notes.
The performance data presented represents past performance. Past performance is no guarantee of future results and current performance may be lower or higher than the performance quoted. An investment in a sub-account will fluctuate in value to reflect the value of the underlying portfolio and, when redeemed, may be worth more or less than original cost. Performance does not reflect any applicable contract-level or certain participant-level charges, or any redemption fees imposed by an underlying mutual fund company. These charges, if included, would otherwise reduce the total return for a participant’s account. Performance information current to the most recent month-end is available on our website www.jhpensions.com.
Performance data for a sub-account for any period prior to the date introduced is shown in bold and is hypothetical based on the performance of the underlying fund.
The Index is Russell 1000 Value Index.i46
The peer group is Large Value.p14
Principal risks include: credit and counterparty, equity securities, foreign securities, issuer, liquidity, manager, market, merger and replacement transition and value stock. For more details, see section 3 of this booklet (Risk Disclosures).
Portfolio* HighlightsInvestment Objective and Policies 4To seek to provide substantial dividend income and long-term capital appreciation by investing primarily in common stocks of well-established companies. T. Rowe Price will normally invest at least 80% of the fund's net assets in common stocks, with 65% in the common stocks of well-established companies paying above-average dividends.
Why Consider this Portfolio*
You want long-term growth of capital and can accept the inherent risks of investing in stocks4You want exposure to value stocks of companies that typically pay above-average dividends4This portfolio is managed with a conservative, value oriented approach that uses fundamental research to find undervalued stocks along with stocks that pay above average dividends
4
The manager has over 20 years of investment experience at T. Rowe Price4
Investment Process 4T. Rowe Price narrows the universe of companies down to approximately 300-400 companies by screening for market capitalization, liquidity, valuation characteristics (such as price-earnings, price-book and price-sales), and earnings and dividend streams that appear to be mispriced. Management conducts traditional fundamental analysis and rigorously evaluate companies to find undervalued companies across a range of industries. They focus on large capitalization companies that are either at discounts to historical valuations or undervalued based on relative valuations, and have the ability to benefit from changes in investor perception or the emergence of a catalyst.
Portfolio Holdings, Weightings and Allocation
Top Equity Holdings (as of 9-30-10)¤
JP MORGAN CHASE & CO. 2.9%CHEVRON CORP. 2.6%GENERAL ELECTRIC 2.6%AMERICAN EXPRESS 2.1%AT&T INC. 2.1%
Totals 12.3% of assets
Top Sector Weightings (as of 9-30-10)¤
Financials 18.9%Consumer Discretionary 14.9%Industrials and Business
Services 13.6%Energy 13.2%Utilities 8.3%
Asset Allocation (as of 9-30-10)¤
Stock 94.9%Bond 1.0%Cash 4.1%
Morningstar Information*** (as of 9-30-10)¤
Overall Morningstar Rating™: 22224Category: Large Value4No. of funds: 3yr 1121; 5yr 940; 10yr 4904
Overall underlying Fund Rating is based on the 3-, 5- and 10-year Morningstar Risk-Adjusted Returns and accounts for variations in a fund's monthly performance, which were as follows: 3yr=4; 5yr=4; 10yr=4. Rating includes effects of sales charges, loads and redemption fees. See Important Notes for the rating criteria.
Key Statistics (as of 9-30-10 unless noted§)¤
Number of Holdings: 1184P/E: 15.6x (12 month trailing)13x (12 month forward)
4
Beta: 1.0500 (S&P 500 Index)1.0000 (Russell 1000 Value Index)
4
R²: 0.9600 (S&P 500 Index)0.9800 (Russell 1000 Value Index)
4
Turnover (annualized)§: 14% 4Median Market Cap (asset weighted): $28.1 billion
4
26 351405-E01

Fidelity Contra FundInvesting solely in Fidelity ContrafundManaged by Fidelity Management & Research Company (Fidelity)
Ticker Symbol+: FCNTX
P2459-CON-C6 Printed 11/10-18374
Risk/Return Category
Growth
Low High
Asset Class/Investment Style
Domestic Equity
LargeMediumSmall
Value Blend Growth
Performance of the sub-account**
Returns (as of 9-30-10)
Fund IndexPeer
Group
1 year 13.74% 12.65% 10.35%3 year -4.63% -4.36% -6.05%5 year 2.90% 2.06% 1.18%10 year 3.02% -3.44% -2.21%
Expense Ratio (as of 9-30-10)****
Fund Expense Ratio 1.02%AMC 0.46%Sales & Service Fee¥ 0.37%Expense Ratio**** 1.85%
The inception date for the sub-account+ is March 31, 1995 and for the current underlying Portfolio is December 31, 1975.
¥See important notes.
The performance data presented represents past performance. Past performance is no guarantee of future results and current performance may be lower or higher than the performance quoted. An investment in a sub-account will fluctuate in value to reflect the value of the underlying portfolio and, when redeemed, may be worth more or less than original cost. Performance does not reflect any applicable contract-level or certain participant-level charges, or any redemption fees imposed by an underlying mutual fund company. These charges, if included, would otherwise reduce the total return for a participant’s account. Performance information current to the most recent month-end is available on our website www.jhpensions.com.
Performance data for a sub-account for any period prior to the date introduced is shown in bold and is hypothetical based on the performance of the underlying fund.
The Index is Russell 1000 Growth Index.i44
The peer group is Large Growth.p13
Principal risks include: credit and counterparty, equity securities, foreign securities, growth stock, issuer, liquidity, manager, market, merger and replacement transition and value stock. For more details, see section 3 of this booklet (Risk Disclosures).
Portfolio* HighlightsInvestment Objective and Policies 4To seek to achieve capital appreciation by investing primarily in common stocks. The portfolio seeks to invest in growth as well as value stocks of both U.S. and foreign companies.
Why Consider this Portfolio*
You want long-term growth of capital and can accept the inherent risks of investing in stocks4You want exposure to a portfolio focusing on large-cap stocks but with the flexibility to invest some assets in mid-cap and small-cap stocks
4
The portfolio manager has 20 years of experience, all with Fidelity, and 15 years as manager of this fund
4
Investment Process 4The Fund invests in companies whose value the manager believes is not fully recognized by the public. These types of companies include companies that are experiencing positive fundamental change, such as a new management team or product launch, a significant cost-cutting initiative, a merger or acquisition, or a reduction in industry capacity that should lead to improved pricing. It may also include companies whose earnings potential has increased or is expected to increase more than generally perceived or those that have enjoyed recent market popularity but which appear to have fallen temporarily out of favor for reasons that are considered non-recurring or short-term. Lastly, the manager also considers companies that may be undervalued in relation to securities of other companies in the same industry. The Fund, as a result, is not constrained by any particular investment style and may tend to purchase both growth and value stocks. When purchasing securities, Fidelity relies on fundamental analysis of each issuer and its potential for success in light of its current financial condition, its industry position as well as economic and market conditions. Factors considered include growth potential, earnings estimates and management.
Portfolio Holdings, Weightings and Allocation
Top Equity Holdings (as of 9-30-10)¤
APPLECOCA-COLAMCDONALD'S CORP.NIKENOBLE ENERGY INC.
Top Sector Weightings (as of 9-30-10)¤
Information Technology 32.0%Consumer Discretionary 18.8%Financials 9.7%Health Care 9.1%Materials 7.7%
Asset Allocation (as of 9-30-10)¤
Stock 94.0%Cash 6.0%
Morningstar Information*** (as of 9-30-10)¤
Overall Morningstar Rating™: 222224Category: Large Growth4No. of funds: 3yr 1518; 5yr 1279; 10yr 7524
Overall underlying Fund Rating is based on the 3-, 5- and 10-year Morningstar Risk-Adjusted Returns and accounts for variations in a fund's monthly performance, which were as follows: 3yr=5; 5yr=5; 10yr=5. Rating includes effects of sales charges, loads and redemption fees. See Important Notes for the rating criteria.
Key Statistics (as of 9-30-10 unless noted§)¤
Number of Holdings: 4894P/E: 21.2x (12 month trailing)16.4x (12 month forward)
4
Beta: 0.8900 (S&P 500 Index)0.8900 (Russell 1000 Growth Index)
4
R²: 0.8800 (S&P 500 Index)0.8800 (Russell 1000 Growth Index)
4
Turnover (annualized)§: 58% 4Median Market Cap (asset weighted): $30.4 billion
4
27 351405-E01

The Growth Fund of America9,40,61,65
Investing solely in The Growth Fund of America®(Class R5)Managed by American Funds Group
Ticker Symbol+: RGAFX
P2459-GFA-C6 Printed 11/10-18374
Risk/Return Category
Growth
Low High
Asset Class/Investment Style
Domestic Equity
LargeMediumSmall
Value Blend Growth
Performance of the sub-account**
Returns (as of 9-30-10)
Fund IndexPeer
Group
1 year 7.26% 10.16% 10.35%3 year -7.22% -7.16% -6.05%5 year 0.92% 0.64% 1.18%10 year 0.18% -0.43% -2.21%
Expense Ratio (as of 9-30-10)****
Fund Expense Ratio 0.40%AMC 0.45%Sales & Service Fee¥ 0.37%Expense Ratio**** 1.22%
The inception date for the sub-account+ is May 2, 2003 and for the current underlying Portfolio is December 1, 1973.
¥See important notes.
Class R shares became available for purchase on May 15, 2002. Results prior to that date are hypothetical based on Share Class A results, adjusted for typical estimated expenses, and are calculated without a sales charge.
The performance data presented represents past performance. Past performance is no guarantee of future results and current performance may be lower or higher than the performance quoted. An investment in a sub-account will fluctuate in value to reflect the value of the underlying portfolio and, when redeemed, may be worth more or less than original cost. Performance does not reflect any applicable contract-level or certain participant-level charges, or any redemption fees imposed by an underlying mutual fund company. These charges, if included, would otherwise reduce the total return for a participant’s account. Performance information current to the most recent month-end is available on our website www.jhpensions.com.
Performance data for a sub-account for any period prior to the date introduced is shown in bold and is hypothetical based on the performance of the underlying fund.
The Index is S&P 500 Index.i58
The peer group is Large Growth.p13
Principal risks include: credit and counterparty, equity securities, growth stock, issuer, liquidity, manager, market, merger and replacement transition and value stock. For more details, see section 3 of this booklet (Risk Disclosures).
Portfolio* HighlightsInvestment Objective and Policies 4To seek to achieve growth of capital by investing primarily in common stocks of companies that appear to offer superior opportunities for growth. The Growth portfolio may also invest up to 15% of its assets in equity securities of issuers domiciled outside the U.S. and Canada and not included in the S&P 500 Composite Index.
Why Consider this Portfolio*
You want long-term growth of capital and can accept the inherent risks of investing in stocks4You want exposure to a portfolio of growth stocks that have the potential for strong earnings growth, but with a more conservative approach to growth investing
4
American Funds' multiple portfolio counselor system allows each investment professional to implement his or her best investment ideas and helps to provide diversification for the overall portfolio
4
The team averages 29 years of investment experience4
Investment Process 4The Fund's investment professionals look for companies that offer the potential to provide strong earnings growth. Investments include the traditional growth company, as well as opportunities in cyclical companies and those in a turnaround situation that appear to be under-valued. The management of this Fund is more conservative than the traditional growth portfolio with more aversion to the risk inherent in the peer group.
Portfolio Holdings, Weightings and Allocation
Top Equity Holdings (as of 9-30-10)¤
GOOGLE 2.8%ORACLE CORP. 2.8%MICROSOFT 2.5%APPLE 1.9%BARRICK GOLD CORP. 1.5%
Totals 11.5% of assets
Top Sector Weightings (as of 9-30-10)¤
Information Technology 21.2%Consumer Discretionary 11.8%Health Care 11.2%Financials 11.0%Energy 9.7%
Asset Allocation (as of 9-30-10)¤
Stock 88.8%Bond 1.4%Cash 9.8%
Morningstar Information*** (as of 9-30-10)¤
Overall Morningstar Rating™: 22224Category: Large Growth4No. of funds: 3yr 1518; 5yr 1279; 10yr 7524
Overall underlying Fund Rating is based on the 3-, 5- and 10-year Morningstar Risk-Adjusted Returns and accounts for variations in a fund's monthly performance, which were as follows: 3yr=3; 5yr=4; 10yr=n/a. Rating includes effects of sales charges, loads and redemption fees. See Important Notes for the rating criteria.
Key Statistics (as of 9-30-10 unless noted§)¤
Number of Holdings: 2804Beta: 0.9600 (S&P 500 Index)4R²: 0.9300 (S&P 500 Index)4Turnover (annualized)§: 38% 4Median Market Cap (asset weighted): $39.0 billion
4
28 351405-E01

Growth Index FundInvesting solely in Vanguard Growth Index Fund (Investor Class)Managed by Vanguard Group, Inc.
Ticker Symbol+: VIGRX
P2459-LGI-C6 Printed 11/10-18374
®
Risk/Return Category
Growth
Low High
Asset Class/Investment Style
Domestic Equity
LargeMediumSmall
Value Blend Growth
Performance of the sub-account**
Returns (as of 9-30-10)
Fund IndexPeer
Group
1 year 11.65% 11.46% 10.35%3 year -5.11% -5.34% -6.05%5 year 1.21% 1.10% 1.18%10 year -2.54% -4.47% -2.21%
Expense Ratio (as of 9-30-10)****
Fund Expense Ratio 0.28%AMC 0.50%Sales & Service Fee¥ 0.37%Expense Ratio**** 1.15%
The inception date for the sub-account+ is May 4, 2007 and for the current underlying Portfolio is November 2, 1992.
¥See important notes.
The performance data presented represents past performance. Past performance is no guarantee of future results and current performance may be lower or higher than the performance quoted. An investment in a sub-account will fluctuate in value to reflect the value of the underlying portfolio and, when redeemed, may be worth more or less than original cost. Performance does not reflect any applicable contract-level or certain participant-level charges, or any redemption fees imposed by an underlying mutual fund company. These charges, if included, would otherwise reduce the total return for a participant’s account. Performance information current to the most recent month-end is available on our website www.jhpensions.com.
Performance data for a sub-account for any period prior to the date introduced is shown in bold and is hypothetical based on the performance of the underlying fund.
The Index is MSCI US Prime Market Growth Index.i63
The peer group is Large Growth.p13
Principal risks include: index management, issuer, liquidity, manager, market, merger and replacement transition, credit and counterparty, equity securities and growth stock. For more details, see section 3 of this booklet (Risk Disclosures).
Portfolio* HighlightsInvestment Objective and Policies 4The Fund seeks to track the performance of the MSCI US Prime Market Growth Index, a benchmark index that measures the investment return of large-capitalization growth stocks.
Why Consider this Portfolio*
You want a simple, low-cost way to invest in large-capitalization growth stocks4You want to track the performance of the MSCI US Prime Market Growth Index4You have a long time horizon (at least five years) and are seeking long-term growth of capital
4
Investment Process 4The Fund employs a "passive management" or indexing investment approach designed to track the performance of the MSCI US Prime Market Growth Index, a broadly diversified index of growth stocks of large U.S. companies. The Fund attempts to replicate the target index by investing all, or substantially all, of its assets in the stocks that make up the Index, holding each stock in approximately the same proportion as its weighting in the Index.
Portfolio Holdings, Weightings and Allocation
Top Equity Holdings (as of 9-30-10)¤
APPLE 4.6%MICROSOFT CORP. 3.4%INTERNATIONAL BUSINESS MACHINES
CORP. 3.0%GOOGLE INC. 2.3%CISCO SYSTEMS 2.2%
Totals 15.5% of assets
Top Sector Weightings (as of 9-30-10)¤
Information Technology 33.1%Consumer Discretionary 14.6%Consumer Staples 12.5%Health Care 10.5%Industrials 10.5%
Asset Allocation (as of 9-30-10)¤
Stock 100.0%
Morningstar Information*** (as of 9-30-10)¤
Overall Morningstar Rating™: 22224Category: Large Growth4No. of funds: 3yr 1518; 5yr 1279; 10yr 7524
Overall underlying Fund Rating is based on the 3-, 5- and 10-year Morningstar Risk-Adjusted Returns and accounts for variations in a fund's monthly performance, which were as follows: 3yr=4; 5yr=4; 10yr=3. Rating includes effects of sales charges, loads and redemption fees. See Important Notes for the rating criteria.
Key Statistics (as of 9-30-10 unless noted§)¤
Number of Holdings: 4254P/E: 18.3x (12 month trailing)14.4x (12 month forward)
4
Beta: 0.9900 (S&P 500 Index)1.0000 (MSCI US Prime Market Growth Index)
4
R²: 0.9400 (S&P 500 Index)1.0000 (MSCI US Prime Market Growth Index)
4
Turnover (annualized)§: 29% 4Median Market Cap (asset weighted): $32.2 billion
4
29 351405-E01

Fundamental Investors13,31,61,65
Investing solely in Fundamental InvestorsSM (Class R5)Managed by American Funds Group
Ticker Symbol+: RFNFX
P2459-AFI-C6 Printed 11/10-18374
Risk/Return Category
Growth
Low High
Asset Class/Investment Style
Domestic Equity
LargeMediumSmall
Value Blend Growth
Performance of the sub-account**
Returns (as of 9-30-10)
Fund IndexPeer
Group
1 year 9.22% 10.16% 8.87%3 year -6.76% -7.16% -7.22%5 year 2.38% 0.64% 0.40%10 year 2.71% -0.43% 0.17%
Expense Ratio (as of 9-30-10)****
Fund Expense Ratio 0.39%AMC 0.45%Sales & Service Fee¥ 0.37%Expense Ratio**** 1.21%
The inception date for the sub-account+ is July 25, 2008 and for the current underlying Portfolio is August 1, 1978.
Class R shares became available for purchase on May 15, 2002. Results prior to that date are hypothetical based on Share Class A results, adjusted for typical estimated expenses, and are calculated without a sales charge.
¥See important notes.
The performance data presented represents past performance. Past performance is no guarantee of future results and current performance may be lower or higher than the performance quoted. An investment in a sub-account will fluctuate in value to reflect the value of the underlying portfolio and, when redeemed, may be worth more or less than original cost. Performance does not reflect any applicable contract-level or certain participant-level charges, or any redemption fees imposed by an underlying mutual fund company. These charges, if included, would otherwise reduce the total return for a participant’s account. Performance information current to the most recent month-end is available on our website www.jhpensions.com.
Performance data for a sub-account for any period prior to the date introduced is shown in bold and is hypothetical based on the performance of the underlying fund.
The Index is S&P 500 Index.i58
The peer group is Large Blend.p12
Principal risks include: commodity, credit and counterparty, currency, equity securities, foreign securities, interest rate, issuer, liquidity, manager, market, merger and replacement transition and large cap. For more details, see section 3 of this booklet (Risk Disclosures).
Portfolio* HighlightsInvestment Objective and Policies 4This fund seeks to provide income primarily through investments in common stocks of large, established companies that offer growth potential at reasonable prices.
Why Consider this Portfolio*
You want long-term growth of capital and can accept the relatively high levels of risk and volatility that typically accompany investments in global stocks
4
American Funds' multiple portfolio counselor system allows each investment professional to implement his or her best investment ideas and helps to provide diversification for the overall portfolio
4
You have a long-term investment horizon and understand the benefits of a long-term value-oriented investment approach
4
Investment Process 4Using principles of fundamental analysis, the fund seeks undervalued and overlooked opportunities with the potential for long-term growth. Companies under consideration for the portfolio often have strong balance sheets, high-quality products and leading market share. The fund's holdings typically represent good value and possess above-average potential for growth in sales, earnings and dividends.
Portfolio Holdings, Weightings and Allocation
Top Equity Holdings (as of 9-30-10)¤
MERCK & COMPANY 3.5%SUNCOR ENERGY 2.3%ORACLE CORP. 2.1%MCDONALD'S CORP. 2.0%MICROSOFT CORP. 1.9%
Totals 11.8% of assets
Top Sector Weightings (as of 9-30-10)¤
Information Technology 15.8%Health Care 13.3%Energy 11.7%Financials 11.5%Industrials 11.4%
Asset Allocation (as of 9-30-10)¤
Stock 95.5%Cash 4.5%
Morningstar Information*** (as of 9-30-10)¤
Overall Morningstar Rating™: 222224Category: Large Blend4No. of funds: 3yr 1711; 5yr 1411; 10yr 7554
Overall underlying Fund Rating is based on the 3-, 5- and 10-year Morningstar Risk-Adjusted Returns and accounts for variations in a fund's monthly performance, which were as follows: 3yr=4; 5yr=5; 10yr=n/a. Rating includes effects of sales charges, loads and redemption fees. See Important Notes for the rating criteria.
Key Statistics (as of 9-30-10 unless noted§)¤
Number of Holdings: 2104Turnover (annualized)§: 30% 4Median Market Cap (asset weighted): $41.8 billion
4
30 351405-E01

Prudential Jennison Mid Cap Growth FundInvesting solely in Prudential Jennison Mid Cap Growth Fund (Class Z)Managed by Jennison Associates LLC
Ticker Symbol+: PEGZX
P2459-JMG-C6 Printed 11/10-18374
Risk/Return Category
Growth
Low High
Asset Class/Investment Style
Domestic Equity
LargeMediumSmall
Value Blend Growth
Performance of the sub-account**
Returns (as of 9-30-10)
Fund IndexPeer
Group
1 year 14.66% 18.27% 15.97%3 year -1.83% -3.90% -5.11%5 year 5.06% 2.86% 2.50%10 year 0.31% -0.88% 0.04%
Expense Ratio (as of 9-30-10)****
Fund Expense Ratio 0.91%AMC 0.25%Sales & Service Fee¥ 0.37%Expense Ratio**** 1.53%
The inception date for the sub-account+ is May 7, 2010 and for the current underlying Portfolio is December 31, 1996.
¥See important notes.
The performance data presented represents past performance. Past performance is no guarantee of future results and current performance may be lower or higher than the performance quoted. An investment in a sub-account will fluctuate in value to reflect the value of the underlying portfolio and, when redeemed, may be worth more or less than original cost. Performance does not reflect any applicable contract-level or certain participant-level charges, or any redemption fees imposed by an underlying mutual fund company. These charges, if included, would otherwise reduce the total return for a participant’s account. Performance information current to the most recent month-end is available on our website www.jhpensions.com.
Performance data for a sub-account for any period prior to the date introduced is shown in bold and is hypothetical based on the performance of the underlying fund.
The Index is Russell Midcap Growth Index.i41
The peer group is Mid-Cap Growth.p18
Principal risks include: credit and counterparty, derivatives, equity securities, exchange traded funds, fixed-income securities, foreign securities, growth stock, initial public offerings, issuer, liquidity, manager, market, merger and replacement transition and U.S. government securities. For more details, see section 3 of this booklet (Risk Disclosures).
Portfolio* HighlightsInvestment Objective and Policies 4The Fund seeks long-term capital appreciation by investing in the stocks of attractively priced mid-size companies that can generate above-average earnings growth. In pursuing its objective, the Fund normally invest at least 80% of its investable assets in equity and equity-related securities of medium-sized companies with the potential for above-average growth.
Why Consider this Portfolio*
You want long-term growth of capital and can accept the relatively high levels of risk and volatility that typically accompany investments in mid-cap stocks
4
You are looking for a fund focused on mid-sized company stocks with the potential for growth
4
You want exposure to an asset class that has historically provided higher returns than large caps with less volatility than small caps
4
Investment Process 4The Fund looks for small and medium-sized companies that have growth in sales and earnings driven by products or services. These companies usually have a unique market niche, a strong new product profile or superior management. The portfolio manager analyzes companies using fundamental and/or quantitative techniques.
Portfolio Holdings, Weightings and Allocation
Top Equity Holdings (as of 9-30-10)¤
DAVITA INC. 2.5%AMERICAN TOWER CORP. 2.3%ANNALY CAPITAL MANAGEMENT 2.3%CROWN CASTLE INTERNATIONAL 2.2%VERISIGN INC. 2.2%
Totals 11.5% of assets
Top Sector Weightings (as of 9-30-10)¤
Information Technology 21.4%Health Care 16.3%Consumer Discretionary 15.6%Industrials 14.6%Consumer Staples 6.6%
Asset Allocation (as of 9-30-10)¤
Stock 97.7%Cash 2.3%
Morningstar Information*** (as of 9-30-10)¤
Overall Morningstar Rating™: 22224Category: Mid-Cap Growth4No. of funds: 3yr 690; 5yr 597; 10yr 3544
Overall underlying Fund Rating is based on the 3-, 5- and 10-year Morningstar Risk-Adjusted Returns and accounts for variations in a fund's monthly performance, which were as follows: 3yr=5; 5yr=5; 10yr=3. Rating includes effects of sales charges, loads and redemption fees. See Important Notes for the rating criteria.
Key Statistics (as of 9-30-10 unless noted§)¤
Number of Holdings: 824P/E: 19.3x (12 month trailing)16.4x (12 month forward)
4
Turnover (annualized)§: 45% 4Median Market Cap (asset weighted): $7.1 billion
4
31 351405-E01

Mid Value Fund31,41,91
Investing solely in JHT - Mid Value Trust (Class 1)Sub-advised by T. Rowe Price Associates, Inc.
Ticker Symbol+: JEMUX
P2459-MVF-C6 Printed 11/10-18374
Risk/Return Category
Growth
Low High
Asset Class/Investment Style
Domestic Equity
LargeMediumSmall
Value Blend Growth
Performance of the sub-account**
Returns (as of 9-30-10)
Fund IndexPeer
Group
1 year 10.21% 16.93% 14.08%3 year -1.64% -4.78% -4.85%5 year 4.42% 1.97% 1.81%10 year 5.95% 7.80% 6.64%
Expense Ratio (as of 9-30-10)****
Fund Expense Ratio 1.06%AMC 0.00%Sales & Service Fee¥ 0.37%Expense Ratio**** 1.43%
The inception date for the sub-account+ is May 6, 2005 and for the current underlying Portfolio is May 9, 2005.
¥See important notes.
The performance data presented represents past performance. Past performance is no guarantee of future results and current performance may be lower or higher than the performance quoted. An investment in a sub-account will fluctuate in value to reflect the value of the underlying portfolio and, when redeemed, may be worth more or less than original cost. Performance does not reflect any applicable contract-level or certain participant-level charges, or any redemption fees imposed by an underlying mutual fund company. These charges, if included, would otherwise reduce the total return for a participant’s account. Performance information current to the most recent month-end is available on our website www.jhpensions.com.
Performance data for a sub-account for any period prior to the date introduced is shown in bold and is hypothetical based on the performance of the underlying fund.
The Index is Russell Midcap Value Index.i43
The peer group is Mid-Cap Value.p19
Principal risks include: credit and counterparty, derivatives, equity securities, foreign securities, initial public offerings, issuer, liquidity, manager, market, merger and replacement transition, mid cap stock, small/mid cap stock and value stock. For more details, see section 3 of this booklet (Risk Disclosures).
Portfolio* HighlightsInvestment Objective and Policies 4To seek long-term capital appreciation. The portfolio invests, under normal market conditions, primarily in a diversified mix of common stocks of mid-size U.S. companies that are believed to be undervalued by various measures and offer good prospects for capital appreciation. Under normal market conditions, the fund invests at least 80% of its net assets in companies with market capitalizations that are within the S&P Mid Cap 400 Index ($42 million to $4.6 billion as of February 28, 2009) or the Russell MidCap Value Index ($41 million to $13.8 billion as of February 28, 2009).Managed in a Style Similar to 4T. Rowe Price Mid-Cap Value FundWhy Consider this Portfolio*
You want a moderately aggressive approach to building capital and can accept the relatively high levels of risk and volatility that typically accompany investments in mid-cap stocks
4
You want exposure to stocks that tend to perform best when value investing is in favor4Management utilizes a contrarian, bottom-up approach to identify mid-cap companies that are inefficiently priced
4
The portfolio manager has been with T. Rowe price since 19904Investment Process 4The manager seeks to identify companies whose stock prices do not appear to reflect their underlying values. In selecting investments, the process begins with initial screens that look for mid-sized companies that have attractive fundamentals such as favorable industry structure, strong market position, and experienced management. From there, the manager conducts value and risk assessments to determine which companies to buy. The manager generally favors companies with one or more of the following: demonstrated or potentially attractive margins or cash flow generation, sound balance sheet and financial management, employee stock ownership or low stock price relative to earnings, cash flow, sales, net assets, book value, or private market value.
Portfolio Holdings, Weightings and Allocation
Top Equity Holdings (as of 9-30-10)¤
SOUTHWEST AIRLINES CO. 1.9%ALBERTO CULVER CO. 1.6%ALLEGHENY ENERGY 1.6%HEALTHSOUTH CORP. 1.6%NEXEN INC. 1.6%
Totals 8.3% of assets
Top Sector Weightings (as of 9-30-10)¤
Financials 23.0%Consumer Discretionary 13.5%Industrials and Business
Services 9.1%Utilities 8.7%Energy 8.1%
Asset Allocation (as of 9-30-10)¤
Stock 89.0%Bond 2.5%Cash 8.5%
Morningstar Information*** (as of 9-30-10)¤
Overall Morningstar Rating™: 22224Category: Mid-Cap Value4No. of funds: 3yr 340; 5yr 268; 10yr 884
Overall underlying Fund Rating is based on the 3-, 5- and 10-year Morningstar Risk-Adjusted Returns and accounts for variations in a fund's monthly performance, which were as follows: 3yr=4; 5yr=4; 10yr=n/a. Rating includes effects of sales charges, loads and redemption fees. See Important Notes for the rating criteria.
Key Statistics (as of 9-30-10 unless noted§)¤
Number of Holdings: 1394P/E: 18.3x (12 month trailing)15.1x (12 month forward)
4
Beta: 1.0700 (S&P 500 Index)0.8900 (Russell Mid Cap Value Index)
4
R²: 0.9300 (S&P 500 Index)0.9700 (Russell Mid Cap Value Index)
4
Turnover (annualized)§: 89% 4Median Market Cap (asset weighted): $5.6 billion
4
Net Assets: $745.9 million4
32 351405-E01

T. Rowe Price Small Cap Value Fund59
Investing solely in T. Rowe Price Small Cap Value Fund (Advisor Class)Managed by T. Rowe Price Associates, Inc.
Ticker Symbol+: PASVX
P2459-MSO-C6 Printed 11/10-18374
Risk/Return Category
Growth
Low High
Asset Class/Investment Style
Domestic Equity
LargeMediumSmall
Value Blend Growth
Performance of the sub-account**
Returns (as of 9-30-10)
Fund IndexPeer
Group
1 year 12.91% 11.84% 13.55%3 year -2.85% -4.99% -4.61%5 year 2.05% 0.73% 1.11%10 year 9.25% 7.72% 5.55%
Expense Ratio (as of 9-30-10)****
Fund Expense Ratio 1.16%AMC 0.10%Sales & Service Fee¥ 0.37%Expense Ratio**** 1.63%
The inception date for the sub-account+ is April 27, 2001 and for the current underlying Portfolio is July 1, 1988.
¥See important notes.
The performance data presented represents past performance. Past performance is no guarantee of future results and current performance may be lower or higher than the performance quoted. An investment in a sub-account will fluctuate in value to reflect the value of the underlying portfolio and, when redeemed, may be worth more or less than original cost. Performance does not reflect any applicable contract-level or certain participant-level charges, or any redemption fees imposed by an underlying mutual fund company. These charges, if included, would otherwise reduce the total return for a participant’s account. Performance information current to the most recent month-end is available on our website www.jhpensions.com.
Performance data for a sub-account for any period prior to the date introduced is shown in bold and is hypothetical based on the performance of the underlying fund.
The Index is Russell 2000 Value Index.i49
The peer group is Small Blend.p24
Principal risks include: credit and counterparty, equity securities, foreign securities, issuer, liquidity, manager, market, merger and replacement transition, small cap stock and value stock. For more details, see section 3 of this booklet (Risk Disclosures).
Portfolio* HighlightsInvestment Objective and Policies 4To seek to achieve long-term growth of capital by investing primarily in small companies whose common stocks are believed to be undervalued. Reflecting a value approach to investing, the fund will seek the stocks of companies whose current stock prices do not appear to adequately reflect their underlying value as measured by assets, earnings, cash flow, or business franchises. Normally, the fund will invest at least 80% of its net assets in companies with a market capitalization that is within or below the range of companies in the Russell 2000 Index.Why Consider this Portfolio*
You want long-term growth of capital and can accept the relatively high levels of risk and volatility that typically accompany investments in small company stocks
4
You want a portfolio that invests in small-cap value stocks, a historically strong asset class (past performance is no guarantee of future results)
4
The manager utilizes a contrarian, bottom-up approach to identify underfollowed companies that are inefficiently priced. The strategy's broad diversification helps to control risk while the low turnover and patient orientation helps the manager fully exploit valuation anomalies
4
Portfolio manager, Preston Athey, has been with T. Rowe Price since 19794Investment Process 4T. Rowe Price's managers seek securities they believe are undervalued as measured by assets, earnings, cash flow or business franchises. In selecting investments, they generally look for low price-book, price-earnings and price-cash flow ratios and an above-average dividend yield. Most companies will exhibit experienced management, a sound balance sheet and other positive financial characteristics.
Portfolio Holdings, Weightings and Allocation
Top Equity Holdings (as of 9-30-10)¤
WHITING PETROLEUM 1.8%LANDSTAR SYSTEM 1.7%PROASSURANCE 1.5%GENESEE & WYOMING 1.4%EAST WEST BANCORP INC. 1.3%
Totals 7.7% of assets
Top Sector Weightings (as of 9-30-10)¤
Industrials and Business Services 22.8%
Financials 22.6%Information Technology 11.6%Consumer Discretionary 11.0%Materials 7.7%
Asset Allocation (as of 9-30-10)¤
Stock 94.0%Bond 2.1%Cash 3.9%
Morningstar Information*** (as of 9-30-10)¤
Overall Morningstar Rating™: 22224Category: Small Blend4No. of funds: 3yr 556; 5yr 475; 10yr 2544
Overall underlying Fund Rating is based on the 3-, 5- and 10-year Morningstar Risk-Adjusted Returns and accounts for variations in a fund's monthly performance, which were as follows: 3yr=4; 5yr=4; 10yr=5. Rating includes effects of sales charges, loads and redemption fees. See Important Notes for the rating criteria.
Key Statistics (as of 9-30-10 unless noted§)¤
Number of Holdings: 3094P/E: 22.2x (12 month trailing)16.2x (12 month forward)
4
Beta: 1.0900 (S&P 500 Index)0.9000 (Russell 2000 Value Index)
4
R²: 0.8500 (S&P 500 Index)0.9600 (Russell 2000 Value Index)
4
Turnover (annualized)§: 8% 4Median Market Cap (asset weighted): $900.0 million
4
IMPORTANT NOTE: Redemption fee of 1% on all exchanges within a 90 day period. See Important Notes for details.59
33 351405-E01
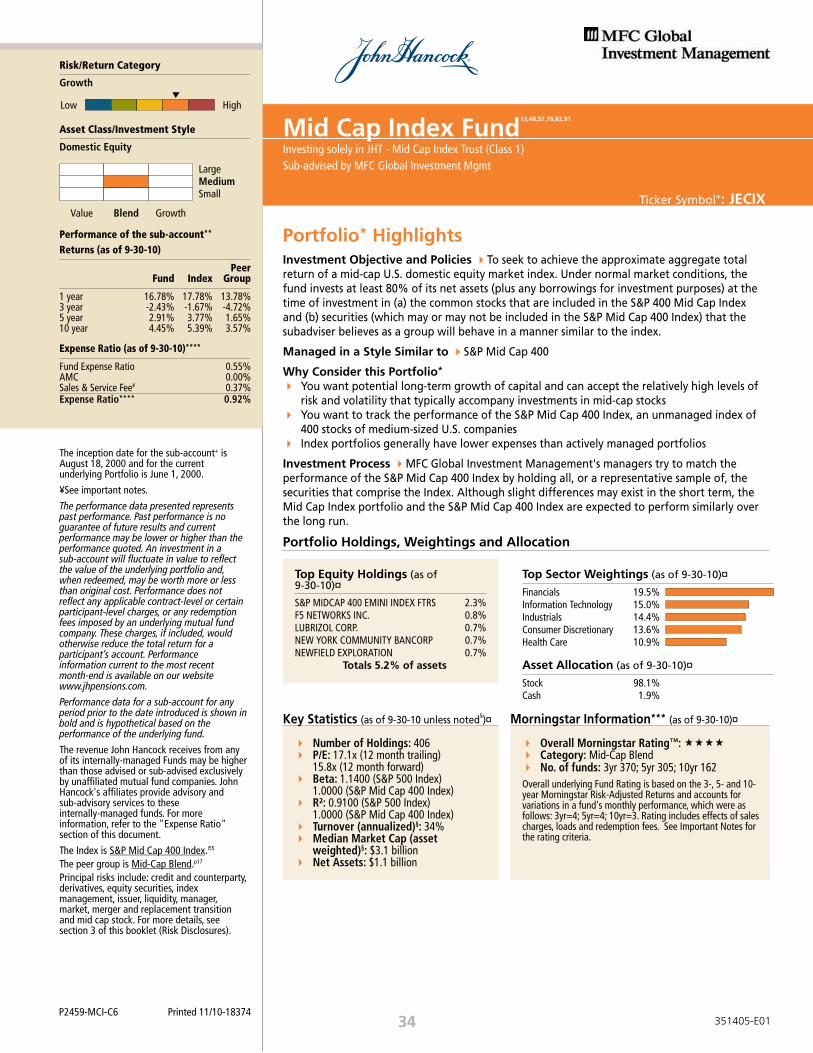
Mid Cap Index Fund13,48,57,76,82,91
Investing solely in JHT - Mid Cap Index Trust (Class 1)Sub-advised by MFC Global Investment Mgmt
Ticker Symbol+: JECIX
P2459-MCI-C6 Printed 11/10-18374
Risk/Return Category
Growth
Low High
Asset Class/Investment Style
Domestic Equity
LargeMediumSmall
Value Blend Growth
Performance of the sub-account**
Returns (as of 9-30-10)
Fund IndexPeer
Group
1 year 16.78% 17.78% 13.78%3 year -2.43% -1.67% -4.72%5 year 2.91% 3.77% 1.65%10 year 4.45% 5.39% 3.57%
Expense Ratio (as of 9-30-10)****
Fund Expense Ratio 0.55%AMC 0.00%Sales & Service Fee¥ 0.37%Expense Ratio**** 0.92%
The inception date for the sub-account+ is August 18, 2000 and for the current underlying Portfolio is June 1, 2000.
¥See important notes.
The performance data presented represents past performance. Past performance is no guarantee of future results and current performance may be lower or higher than the performance quoted. An investment in a sub-account will fluctuate in value to reflect the value of the underlying portfolio and, when redeemed, may be worth more or less than original cost. Performance does not reflect any applicable contract-level or certain participant-level charges, or any redemption fees imposed by an underlying mutual fund company. These charges, if included, would otherwise reduce the total return for a participant’s account. Performance information current to the most recent month-end is available on our website www.jhpensions.com.
Performance data for a sub-account for any period prior to the date introduced is shown in bold and is hypothetical based on the performance of the underlying fund.
The revenue John Hancock receives from any of its internally-managed Funds may be higher than those advised or sub-advised exclusively by unaffiliated mutual fund companies. John Hancock's affiliates provide advisory and sub-advisory services to these internally-managed funds. For more information, refer to the "Expense Ratio" section of this document.
The Index is S&P Mid Cap 400 Index.i55
The peer group is Mid-Cap Blend.p17
Principal risks include: credit and counterparty, derivatives, equity securities, index management, issuer, liquidity, manager, market, merger and replacement transition and mid cap stock. For more details, see section 3 of this booklet (Risk Disclosures).
Portfolio* HighlightsInvestment Objective and Policies 4To seek to achieve the approximate aggregate total return of a mid-cap U.S. domestic equity market index. Under normal market conditions, the fund invests at least 80% of its net assets (plus any borrowings for investment purposes) at the time of investment in (a) the common stocks that are included in the S&P 400 Mid Cap Index and (b) securities (which may or may not be included in the S&P Mid Cap 400 Index) that the subadviser believes as a group will behave in a manner similar to the index.
Managed in a Style Similar to 4S&P Mid Cap 400
Why Consider this Portfolio*
You want potential long-term growth of capital and can accept the relatively high levels of risk and volatility that typically accompany investments in mid-cap stocks
4
You want to track the performance of the S&P Mid Cap 400 Index, an unmanaged index of 400 stocks of medium-sized U.S. companies
4
Index portfolios generally have lower expenses than actively managed portfolios4
Investment Process 4MFC Global Investment Management's managers try to match the performance of the S&P Mid Cap 400 Index by holding all, or a representative sample of, the securities that comprise the Index. Although slight differences may exist in the short term, the Mid Cap Index portfolio and the S&P Mid Cap 400 Index are expected to perform similarly over the long run.
Portfolio Holdings, Weightings and Allocation
Top Equity Holdings (as of 9-30-10)¤
S&P MIDCAP 400 EMINI INDEX FTRS 2.3%F5 NETWORKS INC. 0.8%LUBRIZOL CORP. 0.7%NEW YORK COMMUNITY BANCORP 0.7%NEWFIELD EXPLORATION 0.7%
Totals 5.2% of assets
Top Sector Weightings (as of 9-30-10)¤
Financials 19.5%Information Technology 15.0%Industrials 14.4%Consumer Discretionary 13.6%Health Care 10.9%
Asset Allocation (as of 9-30-10)¤
Stock 98.1%Cash 1.9%
Morningstar Information*** (as of 9-30-10)¤
Overall Morningstar Rating™: 22224Category: Mid-Cap Blend4No. of funds: 3yr 370; 5yr 305; 10yr 1624
Overall underlying Fund Rating is based on the 3-, 5- and 10-year Morningstar Risk-Adjusted Returns and accounts for variations in a fund's monthly performance, which were as follows: 3yr=4; 5yr=4; 10yr=3. Rating includes effects of sales charges, loads and redemption fees. See Important Notes for the rating criteria.
Key Statistics (as of 9-30-10 unless noted§)¤
Number of Holdings: 4064P/E: 17.1x (12 month trailing)15.8x (12 month forward)
4
Beta: 1.1400 (S&P 500 Index)1.0000 (S&P Mid Cap 400 Index)
4
R²: 0.9100 (S&P 500 Index)1.0000 (S&P Mid Cap 400 Index)
4
Turnover (annualized)§: 34% 4Median Market Cap (asset weighted)§: $3.1 billion
4
Net Assets: $1.1 billion4
34 351405-E01
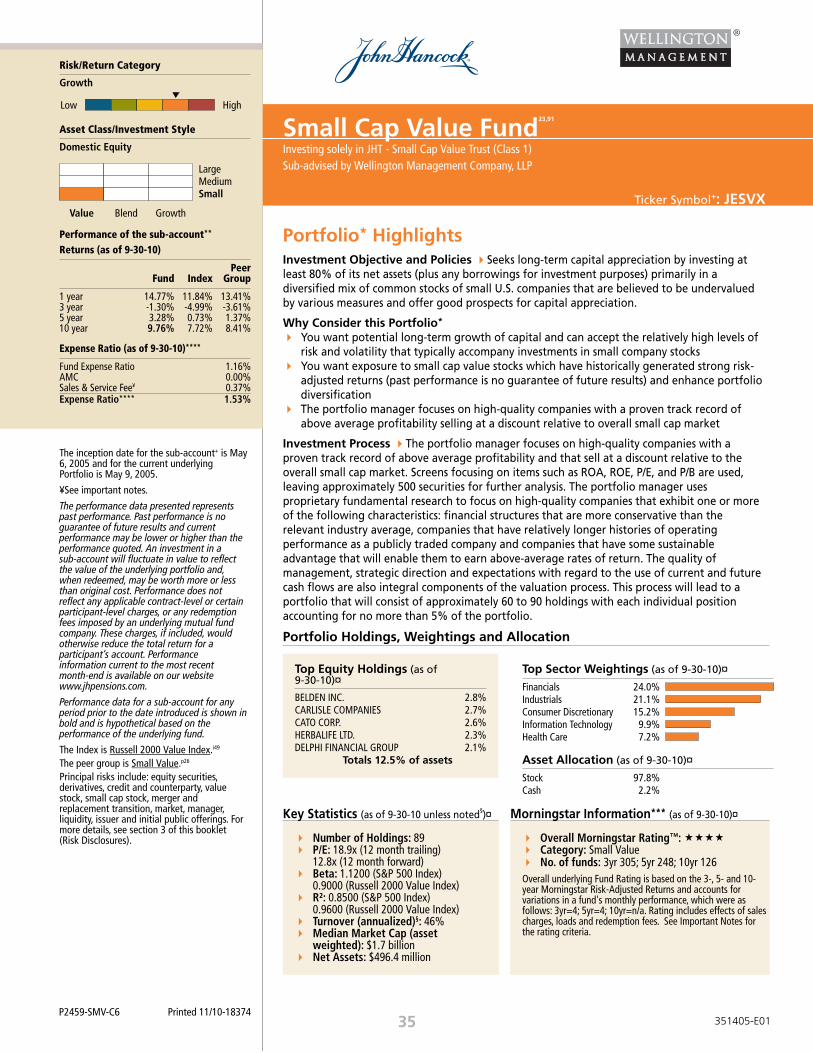
Small Cap Value Fund23,91
Investing solely in JHT - Small Cap Value Trust (Class 1)Sub-advised by Wellington Management Company, LLP
Ticker Symbol+: JESVX
P2459-SMV-C6 Printed 11/10-18374
Risk/Return Category
Growth
Low High
Asset Class/Investment Style
Domestic Equity
LargeMediumSmall
Value Blend Growth
Performance of the sub-account**
Returns (as of 9-30-10)
Fund IndexPeer
Group
1 year 14.77% 11.84% 13.41%3 year -1.30% -4.99% -3.61%5 year 3.28% 0.73% 1.37%10 year 9.76% 7.72% 8.41%
Expense Ratio (as of 9-30-10)****
Fund Expense Ratio 1.16%AMC 0.00%Sales & Service Fee¥ 0.37%Expense Ratio**** 1.53%
The inception date for the sub-account+ is May 6, 2005 and for the current underlying Portfolio is May 9, 2005.
¥See important notes.
The performance data presented represents past performance. Past performance is no guarantee of future results and current performance may be lower or higher than the performance quoted. An investment in a sub-account will fluctuate in value to reflect the value of the underlying portfolio and, when redeemed, may be worth more or less than original cost. Performance does not reflect any applicable contract-level or certain participant-level charges, or any redemption fees imposed by an underlying mutual fund company. These charges, if included, would otherwise reduce the total return for a participant’s account. Performance information current to the most recent month-end is available on our website www.jhpensions.com.
Performance data for a sub-account for any period prior to the date introduced is shown in bold and is hypothetical based on the performance of the underlying fund.
The Index is Russell 2000 Value Index.i49
The peer group is Small Value.p26
Principal risks include: equity securities, derivatives, credit and counterparty, value stock, small cap stock, merger and replacement transition, market, manager, liquidity, issuer and initial public offerings. For more details, see section 3 of this booklet (Risk Disclosures).
Portfolio* HighlightsInvestment Objective and Policies 4Seeks long-term capital appreciation by investing at least 80% of its net assets (plus any borrowings for investment purposes) primarily in a diversified mix of common stocks of small U.S. companies that are believed to be undervalued by various measures and offer good prospects for capital appreciation.
Why Consider this Portfolio*
You want potential long-term growth of capital and can accept the relatively high levels of risk and volatility that typically accompany investments in small company stocks
4
You want exposure to small cap value stocks which have historically generated strong risk-adjusted returns (past performance is no guarantee of future results) and enhance portfolio diversification
4
The portfolio manager focuses on high-quality companies with a proven track record of above average profitability selling at a discount relative to overall small cap market
4
Investment Process 4The portfolio manager focuses on high-quality companies with a proven track record of above average profitability and that sell at a discount relative to the overall small cap market. Screens focusing on items such as ROA, ROE, P/E, and P/B are used, leaving approximately 500 securities for further analysis. The portfolio manager uses proprietary fundamental research to focus on high-quality companies that exhibit one or more of the following characteristics: financial structures that are more conservative than the relevant industry average, companies that have relatively longer histories of operating performance as a publicly traded company and companies that have some sustainable advantage that will enable them to earn above-average rates of return. The quality of management, strategic direction and expectations with regard to the use of current and future cash flows are also integral components of the valuation process. This process will lead to a portfolio that will consist of approximately 60 to 90 holdings with each individual position accounting for no more than 5% of the portfolio.
Portfolio Holdings, Weightings and Allocation
Top Equity Holdings (as of 9-30-10)¤
BELDEN INC. 2.8%CARLISLE COMPANIES 2.7%CATO CORP. 2.6%HERBALIFE LTD. 2.3%DELPHI FINANCIAL GROUP 2.1%
Totals 12.5% of assets
Top Sector Weightings (as of 9-30-10)¤
Financials 24.0%Industrials 21.1%Consumer Discretionary 15.2%Information Technology 9.9%Health Care 7.2%
Asset Allocation (as of 9-30-10)¤
Stock 97.8%Cash 2.2%
Morningstar Information*** (as of 9-30-10)¤
Overall Morningstar Rating™: 22224Category: Small Value4No. of funds: 3yr 305; 5yr 248; 10yr 1264
Overall underlying Fund Rating is based on the 3-, 5- and 10-year Morningstar Risk-Adjusted Returns and accounts for variations in a fund's monthly performance, which were as follows: 3yr=4; 5yr=4; 10yr=n/a. Rating includes effects of sales charges, loads and redemption fees. See Important Notes for the rating criteria.
Key Statistics (as of 9-30-10 unless noted§)¤
Number of Holdings: 894P/E: 18.9x (12 month trailing)12.8x (12 month forward)
4
Beta: 1.1200 (S&P 500 Index)0.9000 (Russell 2000 Value Index)
4
R²: 0.8500 (S&P 500 Index)0.9600 (Russell 2000 Value Index)
4
Turnover (annualized)§: 46% 4Median Market Cap (asset weighted): $1.7 billion
4
Net Assets: $496.4 million4
35 351405-E01

EuroPacific Growth Fund40,41,47,61,65,85
Investing solely in EuroPacific Growth Fund® (Class R5)Managed by American Funds Group
Ticker Symbol+: RERFX
P2459-EPG-C6 Printed 11/10-18374
Risk/Return Category
Aggressive Growth
Low High
Asset Class/Investment Style
International/Global Equity
Value Blend Growth
Performance of the sub-account**
Returns (as of 9-30-10)
Fund IndexPeer
Group
1 year 6.46% 7.56% 5.54%3 year -5.16% -7.42% -9.42%5 year 5.16% 4.26% 2.22%10 year 4.54% 4.33% 1.97%
Expense Ratio (as of 9-30-10)****
Fund Expense Ratio 0.56%AMC 0.45%Sales & Service Fee¥ 0.37%Expense Ratio**** 1.38%
The inception date for the sub-account+ is May 2, 2003 and for the current underlying Portfolio is April 16, 1984.
¥See important notes.
Class R shares became available for purchase on May 15, 2002. Results prior to that date are hypothetical based on Share Class A results, adjusted for typical estimated expenses, and are calculated without a sales charge.
The performance data presented represents past performance. Past performance is no guarantee of future results and current performance may be lower or higher than the performance quoted. An investment in a sub-account will fluctuate in value to reflect the value of the underlying portfolio and, when redeemed, may be worth more or less than original cost. Performance does not reflect any applicable contract-level or certain participant-level charges, or any redemption fees imposed by an underlying mutual fund company. These charges, if included, would otherwise reduce the total return for a participant’s account. Performance information current to the most recent month-end is available on our website www.jhpensions.com.
Performance data for a sub-account for any period prior to the date introduced is shown in bold and is hypothetical based on the performance of the underlying fund.
The Index is MSCI All Country World ex US.i34
The peer group is Foreign Large Blend.p5
Principal risks include: credit and counterparty, equity securities, foreign securities, growth stock, issuer, liquidity, manager, market, merger and replacement transition and value stock. For more details, see section 3 of this booklet (Risk Disclosures).
Portfolio* HighlightsInvestment Objective and Policies 4To seek to achieve long-term growth of capital by investing in securities of growing companies based primarily in Europe and the Pacific Basin. Holdings may range from small firms to large corporations. Under normal market conditions, the portfolio will invest almost all its assets in securities of issuers based outside the United States. The portfolio may invest in securities of issuers based in developing countries.
Why Consider this Portfolio*
You want long-term growth of capital and can accept the inherent risks of investing in international economies and stocks of those economies
4
You are seeking international diversification through equities with a long-term perspective, and can tolerate potentially wide price fluctuations
4
American Funds' multiple portfolio counselor system allows each investment professional to implement his or her best investment ideas and helps to provide diversification for the overall portfolio
4
The team averages 21 years of investment experience at Capital Research and Management Company or affiliate
4
Investment Process 4The Fund's investment professionals seek to provide, in aggregate, a well-diversified and moderately aggressive portfolio through patient stock picking. Management tends to show strong conviction in their holdings and takes a long-term investment approach, often recognizing market contractions as buying opportunities.
Portfolio Holdings, Weightings and Allocation
Top Equity Holdings (as of 9-30-10)¤
AMERICA MOVIL 2.9%ANHEUSER-BUSCH INBEV NV 2.1%NOVARTIS AG 2.0%NOVO-NORDISK 2.0%BAYER AG SPONSORED ADR 1.9%
Totals 10.9% of assets
Top Country Holdings (as of 9-30-10)¤
United Kingdom 10.2%Japan 9.6%Germany 8.3%Switzerland 8.2%France 7.5%
Top Sector Weightings (as of 9-30-10)¤
Financials 19.0%Health Care 10.6%Consumer Staples 10.6%Consumer Discretionary 9.4%Information Technology 9.0%
Asset Allocation (as of 9-30-10)¤
Stock 89.9%Bond 0.1%Cash 10.0%
Morningstar Information*** (as of 9-30-10)¤
Overall Morningstar Rating™: 222224Category: Foreign Large Blend4No. of funds: 3yr 664; 5yr 476; 10yr 2684
Overall underlying Fund Rating is based on the 3-, 5- and 10-year Morningstar Risk-Adjusted Returns and accounts for variations in a fund's monthly performance, which were as follows: 3yr=5; 5yr=5; 10yr=n/a. Rating includes effects of sales charges, loads and redemption fees. See Important Notes for the rating criteria.
Key Statistics (as of 9-30-10 unless noted§)¤
Number of Holdings: 2804Beta: 1.0500 (S&P 500 Index)0.9500 (MSCI ACWI Free ex-USA Index)
4
R²: 0.8100 (S&P 500 Index)0.9600 (MSCI ACWI Free ex-USA Index)
4
Turnover (annualized)§: 26% 4Median Market Cap (asset weighted): $41.2 billion
4
36 351405-E01

SMALLCAP World Fund13,61,65
Investing solely in SMALLCAP World Fund® (Class R5)Managed by American Funds Group
Ticker Symbol+: RSLFX
P2459-ASW-C6 Printed 11/10-18374
Risk/Return Category
Aggressive Growth
Low High
Asset Class/Investment Style
International/Global Equity
Value Blend Growth
Performance of the sub-account**
Returns (as of 9-30-10)
Fund IndexPeer
Group
1 year 18.52% 16.91% 9.32%3 year -5.65% -3.62% -7.16%5 year 5.35% 5.60% 2.23%10 year 2.79% 8.38% 1.63%
Expense Ratio (as of 9-30-10)****
Fund Expense Ratio 0.82%AMC 0.45%Sales & Service Fee¥ 0.37%Expense Ratio**** 1.64%
The inception date for the sub-account+ is July 25, 2008 and for the current underlying Portfolio is April 30, 1990.
Class R shares became available for purchase on May 15, 2002. Results prior to that date are hypothetical based on Share Class A results, adjusted for typical estimated expenses, and are calculated without a sales charge.
¥See important notes.
The performance data presented represents past performance. Past performance is no guarantee of future results and current performance may be lower or higher than the performance quoted. An investment in a sub-account will fluctuate in value to reflect the value of the underlying portfolio and, when redeemed, may be worth more or less than original cost. Performance does not reflect any applicable contract-level or certain participant-level charges, or any redemption fees imposed by an underlying mutual fund company. These charges, if included, would otherwise reduce the total return for a participant’s account. Performance information current to the most recent month-end is available on our website www.jhpensions.com.
Performance data for a sub-account for any period prior to the date introduced is shown in bold and is hypothetical based on the performance of the underlying fund.
The Index is S&P Global<$3 Billion Index.i89
The peer group is World Stock.p48
Principal risks include: commodity, credit and counterparty, currency, equity securities, foreign securities, interest rate, issuer, liquidity, manager, market, merger and replacement transition and small cap stock. For more details, see section 3 of this booklet (Risk Disclosures).
Portfolio* HighlightsInvestment Objective and Policies 4The portfolio seeks to achieve long-term growth of capital by investing primarily in stocks of smaller companies located around the world, including the United States. It normally invests at least 80% of assets in equity securities of companies with small market capitalizations. "Small market capitalization" is defined as companies to be companies with market capitalizations of $3.5 billion or less. The portfolio may invest up to 100% of assets outside the United States, though, in practice, the portfolio has historically had a substantial U.S. allocation.
Why Consider this Portfolio*
You want long-term growth of capital and can accept the inherent risks of investing in smaller capitalization stocks, international economies and stocks of those economies
4
You are seeking international diversification through equities with a long-term perspective, and can tolerate potentially wide price fluctuations
4
American Funds' multiple portfolio counselor system allows each investment professional to implement his or her best investment ideas and helps to provide diversification for the overall portfolio
4
The team averages 18 years of experience with Capital Research and Management Company or affiliate
4
Investment Process 4The portfolio's investment professionals are focused on identifying small market capitalization companies worldwide that display strong underlying business fundamentals. The bottom-up research process and the multi-portfolio counselor system result in a portfolio broadly diversified across both geography and industries. Management tends to show strong conviction in their holdings and takes a long-term investment approach, often recognizing market contractions as buying opportunities.
Portfolio Holdings, Weightings and Allocation
Top Equity Holdings (as of 9-30-10)¤
CONTAINER CORPORATION OF INDIA 1.0%KINGBOARD CHEMICAL HOLDINGS 0.9%XINAO GAS HOLDINGS LIMITED 0.9%MSC INDUSTRIAL DIRECT 0.8%THORATEC 0.8%
Totals 4.4% of assets
Top Country Holdings (as of 9-30-10)¤
United States 39.3%United Kingdom 7.7%India 5.7%China 5.1%Australia 3.7%
Top Sector Weightings (as of 9-30-10)¤
Consumer Discretionary 16.1%Industrials 16.0%Information Technology 13.4%Financials 12.5%Health Care 11.4%
Asset Allocation (as of 9-30-10)¤
Stock 91.0%Bond 1.5%Cash 7.5%
Morningstar Information*** (as of 9-30-10)¤
Overall Morningstar Rating™: 22224Category: World Stock4No. of funds: 3yr 607; 5yr 483; 10yr 2624
Overall underlying Fund Rating is based on the 3-, 5- and 10-year Morningstar Risk-Adjusted Returns and accounts for variations in a fund's monthly performance, which were as follows: 3yr=3; 5yr=4; 10yr=n/a. Rating includes effects of sales charges, loads and redemption fees. See Important Notes for the rating criteria.
Key Statistics (as of 9-30-10 unless noted§)¤
Number of Holdings: 5504Turnover (annualized)§: 56% 4Median Market Cap (asset weighted): $1.9 billion
4
37 351405-E01

Small Cap Growth Index Fund41
Investing solely in Vanguard Small Cap Growth Index Fund (Investor Class)Managed by Vanguard Group, Inc.
Ticker Symbol+: VISGX
P2459-VSG-C6 Printed 11/10-18374
®
Risk/Return Category
Aggressive Growth
Low High
Asset Class/Investment Style
Domestic Equity
LargeMediumSmall
Value Blend Growth
Performance of the sub-account**
Returns (as of 9-30-10)
Fund IndexPeer
Group
1 year 15.44% 16.48% 14.26%3 year -3.66% -2.85% -5.61%5 year 2.64% 3.55% 1.37%10 year 4.22% 1.96% 0.71%
Expense Ratio (as of 9-30-10)****
Fund Expense Ratio 0.28%AMC 0.50%Sales & Service Fee¥ 0.37%Expense Ratio**** 1.15%
The inception date for the sub-account+ is November 3, 2006 and for the current underlying Portfolio is May 21, 1998.
¥See important notes.
The performance data presented represents past performance. Past performance is no guarantee of future results and current performance may be lower or higher than the performance quoted. An investment in a sub-account will fluctuate in value to reflect the value of the underlying portfolio and, when redeemed, may be worth more or less than original cost. Performance does not reflect any applicable contract-level or certain participant-level charges, or any redemption fees imposed by an underlying mutual fund company. These charges, if included, would otherwise reduce the total return for a participant’s account. Performance information current to the most recent month-end is available on our website www.jhpensions.com.
Performance data for a sub-account for any period prior to the date introduced is shown in bold and is hypothetical based on the performance of the underlying fund.
The Index is MSCI US Small Cap Growth Index.i31
The peer group is Small Growth.p25
Principal risks include: small cap stock, merger and replacement transition, market, manager, liquidity, issuer, index management, growth stock, foreign securities, equity securities and credit and counterparty. For more details, see section 3 of this booklet (Risk Disclosures).
Portfolio* HighlightsInvestment Objective and Policies 4The Fund seeks to track the performance of a benchmark index that measures the investment return of small-capitalization growth stocks.
Why Consider this Portfolio*
You want a simple, low-cost way to invest in small-capitalization growth stocks4You want to track the performance of the MSCI US Small Cap Growth Index, an index which targets the growth stocks of the MSCI US Small Cap 1750 Index
4
You have a long-term investment horizon (at least five years)4
Investment Process 4The Fund employs a "passive management" or indexing investment approach designed to track the performance of the MSCI US Small Cap Growth Index, a broadly diversified index of growth stocks of smaller U.S. companies. The Fund attempts to replicate the target index by investing all, or substantially all, of its assets in the stocks that make up the Index, holding each stock in approximately the same proportion as its weighting in the Index.
Portfolio Holdings, Weightings and Allocation
Top Equity Holdings (as of 9-30-10)¤
CORE LABORATORIES 0.6%ATMEL CORP. 0.5%INFORMATICA CORP. 0.5%JONES LANG LASALLE INC. 0.5%MICROS SYSTEMS 0.5%
Totals 2.6% of assets
Top Sector Weightings (as of 9-30-10)¤
Information Technology 28.6%Consumer Discretionary 17.4%Industrials 16.7%Health Care 16.2%Energy 6.9%
Asset Allocation (as of 9-30-10)¤
Stock 100.0%
Morningstar Information*** (as of 9-30-10)¤
Overall Morningstar Rating™: 22224Category: Small Growth4No. of funds: 3yr 675; 5yr 556; 10yr 3194
Overall underlying Fund Rating is based on the 3-, 5- and 10-year Morningstar Risk-Adjusted Returns and accounts for variations in a fund's monthly performance, which were as follows: 3yr=3; 5yr=4; 10yr=4. Rating includes effects of sales charges, loads and redemption fees. See Important Notes for the rating criteria.
Key Statistics (as of 9-30-10 unless noted§)¤
Number of Holdings: 10094P/E: 32.3x (12 month trailing)16.9x (12 month forward)
4
Beta: 1.2500 (S&P 500 Index)0.8900 (MSCI US Small Cap Growth Index)
4
R²: 0.8600 (S&P 500 Index)0.9500 (MSCI US Small Cap Growth Index)
4
Turnover (annualized)§: 38% 4Median Market Cap (asset weighted): $1.5 billion
4
38 351405-E01

International Value Fund9,23,47,73
Investing solely in John Hancock Funds II - International Value Fund (Class 1)Sub-advised by Franklin Templeton
Ticker Symbol+: JIVIX
P2459-ITV-C6 Printed 11/10-18374
Risk/Return Category
Aggressive Growth
Low High
Asset Class/Investment Style
International/Global Equity
Value Blend Growth
Performance of the sub-account**
Returns (as of 9-30-10)
Fund IndexPeer
Group
1 year 1.70% 3.27% 2.43%3 year -7.33% -9.51% -9.86%5 year 2.30% 1.97% 1.45%10 year 4.70% 2.56% 3.98%
Expense Ratio (as of 9-30-10)****
Fund Expense Ratio 0.96%AMC 0.00%Sales & Service Fee¥ 0.37%Expense Ratio**** 1.33%
The inception date for the sub-account+ is July 30, 1999 and for the current underlying Portfolio is August 2, 1999.
¥See important notes.
The performance data presented represents past performance. Past performance is no guarantee of future results and current performance may be lower or higher than the performance quoted. An investment in a sub-account will fluctuate in value to reflect the value of the underlying portfolio and, when redeemed, may be worth more or less than original cost. Performance does not reflect any applicable contract-level or certain participant-level charges, or any redemption fees imposed by an underlying mutual fund company. These charges, if included, would otherwise reduce the total return for a participant’s account. Performance information current to the most recent month-end is available on our website www.jhpensions.com.
Performance data for a sub-account for any period prior to the date introduced is shown in bold and is hypothetical based on the performance of the underlying fund.
The Index is MSCI EAFE Index.i35
The peer group is Foreign Large Value.p7
Principal risks include: credit and counterparty, equity securities, fixed-income securities, foreign securities, issuer, liquidity, manager, market, merger and replacement transition and value stock. For more details, see section 3 of this booklet (Risk Disclosures).
Portfolio* HighlightsInvestment Objective and Policies 4To seek to achieve long-term growth of capital by investing primarily in equity securities of companies located outside the United States, including those in emerging markets.
Why Consider this Portfolio*
You want potential long-term growth of capital and can accept the inherent risks of investing in international stocks
4
You want exposure to value stocks of companies located outside the United States4Franklin® Templeton® has a disciplined, long-term, value-oriented investment philosophy that has often helped them identify successful investment opportunities before they are more widely recognized
4
Franklin® Templeton® has significant international investment experience. They launched one of the first global mutual funds in 1954
4
Investment Process 4The portfolio managers focus on identifying companies that they believe are selling at the greatest discount to future value. They identify these stocks using fundamental analysis, proprietary screens, and a worldwide network of experienced research sources. Over 12,000 stocks are maintained in the firm's proprietary database. The most undervalued stocks with sound fundamentals are placed on the Franklin Templeton Bargain List. New purchases for the portfolio are taken from this list. The portfolio is constructed using bottom-up (company-specific) stock selection with country allocation decisions playing a minimal role.
Portfolio Holdings, Weightings and Allocation
Top Equity Holdings (as of 9-30-10)¤
VODAFONE GROUP PLC 4.0%ING GROEP NV 3.2%SANOFI-AVENTIS 3.1%FRANCE TELECOM 2.6%TELENOR ASA 2.4%
Totals 15.3% of assets
Top Country Holdings (as of 9-30-10)¤
United Kingdom 22.1%France 10.5%Germany 9.6%Switzerland 7.7%Japan 6.7%
Asset Allocation (as of 9-30-10)¤
Stock 99.1%Cash 0.9%
Morningstar Information*** (as of 9-30-10)¤
Overall Morningstar Rating™: 22224Category: Foreign Large Value4No. of funds: 3yr 286; 5yr 217; 10yr 1254
Overall underlying Fund Rating is based on the 3-, 5- and 10-year Morningstar Risk-Adjusted Returns and accounts for variations in a fund's monthly performance, which were as follows: 3yr=4; 5yr=n/a; 10yr=n/a. Rating includes effects of sales charges, loads and redemption fees. See Important Notes for the rating criteria.
Key Statistics (as of 9-30-10 unless noted§)¤
Number of Holdings: 844P/E: 13.1x (12 month trailing)11.1x (12 month forward)
4
Beta: 1.1500 (S&P 500 Index)0.9900 (MSCI EAFE Index)
4
R²: 0.8700 (S&P 500 Index)0.9500 (MSCI EAFE Index)
4
Turnover (annualized)§: 46% 4Median Market Cap (asset weighted): $18.6 billion
4
Net Assets: $1.2 billion4
39 351405-E01

Oppenheimer Developing Markets Fund
21,56
Investing solely in Oppenheimer Developing Markets Fund (Class Y)Managed by OppenheimerFunds, Inc.
Ticker Symbol+: ODVYX
P2459-DMK-C6 Printed 11/10-18374
Risk/Return Category
Aggressive Growth
Low High
Asset Class/Investment Style
International/Global Equity
Value Blend Growth
Performance of the sub-account**
Returns (as of 9-30-10)
Fund IndexPeer
Group
1 year 26.73% 20.22% 19.57%3 year 4.14% -1.48% -3.27%5 year 14.83% 12.74% 11.08%10 year 17.05% n/a 12.73%
Expense Ratio (as of 9-30-10)****
Fund Expense Ratio 1.08%AMC 0.25%Sales & Service Fee¥ 0.37%Expense Ratio**** 1.70%
The inception date for the sub-account+ is November 22, 1996 and for the current underlying Portfolio is November 1, 1996.
¥See important notes.
The performance data presented represents past performance. Past performance is no guarantee of future results and current performance may be lower or higher than the performance quoted. An investment in a sub-account will fluctuate in value to reflect the value of the underlying portfolio and, when redeemed, may be worth more or less than original cost. Performance does not reflect any applicable contract-level or certain participant-level charges, or any redemption fees imposed by an underlying mutual fund company. These charges, if included, would otherwise reduce the total return for a participant’s account. Performance information current to the most recent month-end is available on our website www.jhpensions.com.
Performance data for a sub-account for any period prior to the date introduced is shown in bold and is hypothetical based on the performance of the underlying fund.
The Index is MSCI Emerging Markets Index.i36
The peer group is Diversified Emerging Markets.p3
Principal risks include: credit and counterparty, equity securities, foreign securities, growth stock, issuer, liquidity, manager, market and merger and replacement transition. For more details, see section 3 of this booklet (Risk Disclosures).
Portfolio* HighlightsInvestment Objective and Policies 4To seek to achieve capital appreciation by investing primarily in the common stock of issuers in emerging and developing markets throughout the world.
Why Consider this Portfolio*
You want long-term growth of capital and can accept the inherent risks of investing in international stocks
4
You want exposure to companies with high growth potential in emerging markets4The portfolio manager has over 15 years of experience in global financial markets4
Investment Process 4Your Manager has had a very productive quarter since taking over the Fund on 1 May, 2007. During the quarter, we began the reorientation of the portfolio towards a more concentrated and long haul growth orientation, which have been the hallmarks of the Fund historically. We spent much of the quarter on the road, searching for fresh ideas and evaluating progress across portfolio companies. During the quarter, we spent time in Turkey, Korea, Taiwan, Mexico, Brazil, Russia, China and India. Your Fund's historic (out-) performance has reflected a singular focus on investing in companies (not countries) with the right economic characteristics. These include durable structural growth, high - and defendable - returns on invested capital, management teams that are mindful of prudent capital allocation and sensible prices. We look through cycles - economic, credit and inventory - for underlying long haul growth opportunities.
Portfolio Holdings, Weightings and Allocation
Top Equity Holdings (as of 9-30-10)¤
INFOSYS TECHNOLOGIES LTD. 4.3%AMERICA MOVIL 3.5%PETROLEO BRAS SA PETRO 3.1%NHN CORP. 2.8%MEDIATEK INC. 2.6%
Totals 16.3% of assets
Top Country Holdings (as of 9-30-10)¤
Brazil 14.1%India 13.8%Hong Kong 10.2%Mexico 8.9%Taiwan 6.9%
Asset Allocation (as of 9-30-10)¤
Stock 97.7%Bond 0.1%Cash 2.2%
Morningstar Information*** (as of 9-30-10)¤
Overall Morningstar Rating™: 222224Category: Diversified Emerging Markets4No. of funds: 3yr 265; 5yr 200; 10yr 1214
Overall underlying Fund Rating is based on the 3-, 5- and 10-year Morningstar Risk-Adjusted Returns and accounts for variations in a fund's monthly performance, which were as follows: 3yr=5; 5yr=n/a; 10yr=n/a. Rating includes effects of sales charges, loads and redemption fees. See Important Notes for the rating criteria.
Key Statistics (as of 9-30-10 unless noted§)¤
Number of Holdings: 1174P/E: 14.6x (12 month trailing)11.8x (12 month forward)
4
Beta: 1.3300 (S&P 500 Index)0.9300 (MSCI Emerging Markets Index)
4
R²: 0.7600 (S&P 500 Index)0.9600 (MSCI Emerging Markets Index)
4
Turnover (annualized)§: 55% 4Median Market Cap (asset weighted): $9.0 billion
4
40 351405-E01

DFA Emerging Markets Value FundInvesting solely in DFA Emerging Markets Value FundManaged by Dimensional Fund Advisors, Inc. (DFA)
Ticker Symbol+: DFEVX
P2459-DEM-C6 Printed 11/10-18374
Risk/Return Category
Aggressive Growth
Low High
Asset Class/Investment Style
International/Global Equity
Value Blend Growth
Performance of the sub-account**
Returns (as of 9-30-10)
Fund IndexPeer
Group
1 year 21.69% 20.22% 19.57%3 year -0.07% -1.48% -3.27%5 year 15.47% 12.74% 11.08%10 year 17.67% n/a 12.73%
Expense Ratio (as of 9-30-10)****
Fund Expense Ratio 0.62%AMC 0.50%Sales & Service Fee¥ 0.37%Expense Ratio**** 1.49%
The inception date for the sub-account+ is November 3, 2006 and for the current underlying Portfolio is April 1, 1998.
¥See important notes.
The performance data presented represents past performance. Past performance is no guarantee of future results and current performance may be lower or higher than the performance quoted. An investment in a sub-account will fluctuate in value to reflect the value of the underlying portfolio and, when redeemed, may be worth more or less than original cost. Performance does not reflect any applicable contract-level or certain participant-level charges, or any redemption fees imposed by an underlying mutual fund company. These charges, if included, would otherwise reduce the total return for a participant’s account. Performance information current to the most recent month-end is available on our website www.jhpensions.com.
Performance data for a sub-account for any period prior to the date introduced is shown in bold and is hypothetical based on the performance of the underlying fund.
The Index is MSCI Emerging Markets Index.i36
The peer group is Diversified Emerging Markets.p3
Principal risks include: credit and counterparty, currency, derivatives, equity securities, foreign securities, issuer, liquidity, manager, market, merger and replacement transition and small cap stock. For more details, see section 3 of this booklet (Risk Disclosures).
Portfolio* HighlightsInvestment Objective and Policies 4To seek to achieve long-term capital appreciation. The portfolio seeks to achieve its objective by purchasing the stocks of emerging market equity securities that the Advisor determines to be value stocks at the time of purchase.
Why Consider this Portfolio*
You want long-term growth of capital and can accept the relatively high levels of risk and volatility inherent in emerging markets equities
4
Emerging markets stocks have exhibited lower correlations to U.S. stocks than foreign large cap stocks (from developed markets), potentially providing better diversification benefits to portfolios
4
You want exposure to value stocks in emerging countries including Brazil, Chile, Czech Republic, Hungary, India, Indonesia, Israel, South Korea, Malaysia, Mexico, Philippines, Poland, South Africa, Taiwan, Thailand and Turkey
4
Investment Process 4The primary objective of the fund is to capture the return premiums of the emerging markets asset class by investing in a well-diversified portfolio of securities. Dimensional uses strict country selection criteria to assess whether each emerging market has an adequate legal structure and market liquidity. Within each approved country, companies that meet the market capitalization and value requirements and have passed the qualitative and quantitative screening process are eligible for purchase in the portfolio. The market cap threshold will vary from country to country based on individual country factors.
Portfolio Holdings, Weightings and Allocation
Top Equity Holdings (as of 9-30-10)¤
OAO GAZPROM ADR 2.9%BANK OF CHINA LTD. 2.0%BM&F BOVESPA SA 1.7%ICICI BANK LTD. 1.5%PETROLEO BRASILEIRO SA 1.5%
Totals 9.6% of assets
Top Country Holdings (as of 9-30-10)¤
Brazil 13.4%South Korea 12.7%China 12.3%Taiwan 11.9%India 10.9%
Top Sector Weightings (as of 9-30-10)¤
Financials 29.9%Materials 19.0%Energy 11.9%Industrials 11.4%Consumer Discretionary 9.0%
Asset Allocation (as of 9-30-10)¤
Stock 98.3%Cash 1.7%
Morningstar Information*** (as of 9-30-10)¤
Overall Morningstar Rating™: 22224Category: Diversified Emerging Markets4No. of funds: 3yr 265; 5yr 200; 10yr 1214
Overall underlying Fund Rating is based on the 3-, 5- and 10-year Morningstar Risk-Adjusted Returns and accounts for variations in a fund's monthly performance, which were as follows: 3yr=3; 5yr=4; 10yr=5. Rating includes effects of sales charges, loads and redemption fees. See Important Notes for the rating criteria.
Key Statistics (as of 9-30-10 unless noted§)¤
Number of Holdings: 20334P/E: 12.5x (12 month trailing)4Beta: 1.5400 (S&P 500 Index)1.0800 (MSCI Emerging Markets Free Index)
4
R²: 0.7500 (S&P 500 Index)0.9600 (MSCI Emerging Markets Free Index)
4
Turnover (annualized)§: 20% 4Median Market Cap (asset weighted): $20.8 billion
4
41 351405-E01
42
Important notes
Please call 1-800-395-1113 to obtain John Hancock USA group annuity investment option Fund Sheets for its sub-accounts and prospectuses for the sub-accounts' underlying mutual funds, which are available upon request. The prospectuses for the sub-accounts' underlying mutual funds contain complete details on investment objectives, risks, fees, charges and expenses as well as other information about the underlying mutual funds which should be carefully considered before investing.
Contributions under a group annuity contract issued by John Hancock Life Insurance Company (U.S.A.) (John Hancock USA) are allocated to investment options which: (a) invest solely in shares of an underlying mutual fund or (b) are Guaranteed Interest Accounts and which will be held in the John Hancock USA general account. For more information on a particular investment option, please refer to John Hancock USA's Fund sheets, available through the Web site or your John Hancock USA representative.
Allocating assets to only one or a small number of the investment options (other than Lifestyle or Lifecycle options) should not be considered a balanced investment program. In particular, allocating assets to a small number of options concentrated in particular business or market sectors will subject your account or contract to increased risk and volatility. Examples of business or market sectors where this risk may be particularly high include: a) technology-related businesses, including Internet related businesses, b) small-cap securities and c) foreign securities. John Hancock USA does not provide advice regarding appropriate investment allocations. Contact your financial representative for more details.
+ When contributions are allocated to Funds under your employer's group annuity contract with John Hancock, they will be held in a sub-account (also referred to as "Fund"), which invests solely in shares of the specified underlying mutual fund. The ticker symbols shown are for the underlying mutual funds in which sub-accounts are invested. The ticker symbols do not directly apply to the John Hancock sub-account and therefore any public information accessed using these symbols will not reflect the unit value of the subaccount, nor will such information reflect sub-account or contract-level charges under your plan's group annuity contract.
Information Concerning John Hancock's Short-Term Trading Policy
The group annuity contract is not designed for short-term trading. The effect of short-term trading may disrupt or be potentially disruptive to the management of the fund underlying an investment option and may thereby adversely impact the underlying fund's performance, either by impacting fund management practices or by increasing fund transaction costs. These impacts are absorbed by other fund investors, including retirement plan participants. For the protection of the participants, account changes are subject to the following short-term trading guidelines when exchanging investment options under your company's qualified retirement plan account with John Hancock. Requests may be cancelled if not within our guidelines.
Participants are allowed a maximum of two exchanges per calendar month. An exchange is defined as the full rebalance of a participant's account, or single or multiple fund-to-fund transfers that involve multiple investment options (also referred to as "inter-account transfers") on one day, and may be made over the Web, by fax, courier or mail, through our toll-free participant services line, or with a client account representative.
Recognizing that there may be extreme market or other circumstances requiring a participant to make a further change, John Hancock will allow a participant to move 100% of their assets to a Money Market or Stable Value Fund (as available under the contract after the exchange limit has been reached; no subsequent exchanges may be made for 30 days. Once the 30-day hold has expired, participants can trade again in accordance with the above guidelines.
The guidelines do not apply to regular allocations, loans, or withdrawals.
In addition, on an ongoing basis, participant account activity is reviewed for trading activity that, though within the monthly exchange limit, could be detrimental to an underlying mutual fund and/or contrary to its exchange policies, as described in the fund's prospectus. As a result of this review, or if requested by a fund company, additional restrictions may be imposed on a participant's retirement account, including but not limited to:
• Applying redemption fees and/or trade restrictions as requested by the underlying fund manager. Such trade restrictions may be more restrictive than the above guidelines
• Restricting the number of exchanges made during a defined period
• Restricting the dollar amount of exchange
• Restricting the method used to submit exchanges (e.g., requiring exchange requests to be submitted in writing via U.S. mail)
• Restricting exchanges into and out of certain investment options
Participants can read about the short-term trading policy at www.jhpensions.com or www.jhnypensions.com (for plans domiciled in New York) under the "modify your account - change account" feature. Redemption fees or market value adjustments associated with exchanges from particular investment options are described on applicable fund sheets, which are available online. For more information or to order prospectuses for the underlying investments, call 1-800-395-1113 and speak to a client account representative.
* Portfolio All references to "portfolio" refer to: a) the underlying mutual fund in which a Fund (sub-account) invests, b) to the mix of fixed and other securities in which this Fund directly invests, or c) to the John Hancock USA Guaranteed Interest Accounts. The information is current as of the most recent calendar quarter-end (unless otherwise stated) and is not a guarantee of subsequent investment composition, which is subject to change at the discretion of the portfolio manager.
351405-E01
43
± Weightings Each Lifestyle/Lifecycle Portfolio has a target percentage allocation designed to meet the investment objectives of a corresponding investment orientation. Allocation percentages may vary or be adjusted due to market or economic conditions or other reasons as set out in the prospectus. Due to abnormal market conditions or redemption activity the fund may temporarily invest in cash and cash equivalents.
The underlying mutual fund companies have the right to restrict trade activity without prior notice if a participant's trading is determined to be in excess of their exchange policy, as stated in the fund prospectus.
¤The information shown is based on the most recent available information for the underlying mutual fund as of the date of printing and is subject to change. Listed holdings do not represent all of the holdings in the Fund.
1A. Your company's qualified retirement plan offers participants the opportunity to contribute to investment options available under a group annuity contract with John Hancock Life Insurance Company (U.S.A.) (John Hancock USA). These investment options may be sub-accounts (pooled funds) investing directly in underlying mutual funds, or they may be Guaranteed Interest Accounts.
The placement of investment options within style boxes and according to potential risk/return shows John Hancock USA's assessment of those options relative to one another and should not be used to compare these investment options with other investment options available outside John Hancock USA.
2A. Manager or Sub-Adviser refers to the manager of the underlying portfolio or to the sub-adviser of the underlying John Hancock Trust, John Hancock Funds II, or John Hancock Funds III portfolio in which the sub-account invests.
3A. Date sub-account or Guaranteed Interest Account first available under group annuity contract. This class was introduced April 27, 1999. If the sub-account inception date is after April 27, 1999, then the class introduction date is the same as the sub-account inception date. A "class" represents a pre-determined level of the Sales & Service Fee that is applied to all investment options selected in the Contract.
4A. The performance data for a sub-account for any period prior to the sub-account Inception Date is hypothetical based on the performance of the underlying investment. All other performance data is actual (except as otherwise indicated). Returns for any period greater than one year are annualized. Performance data reflects changes in the prices of a sub-account's investments (including the shares of an underlying mutual fund), reinvestment of dividends and capital gains and deductions for the expense ratio.
The performance data presented represents past performance. Past performance is no guarantee of future results and current performance may be lower or higher than the performance quoted. An investment in a sub-account will fluctuate in value to reflect the value of the sub-account's underlying securities and, when redeemed, may be worth more or less than original cost. Performance does not reflect any applicable contract-level or certain participant-level charges, fees for guaranteed benefits if elected by participant, or any redemption fees imposed by an underlying mutual fund company. These charges, if included, would otherwise reduce the total return for a participant's account. Performance current to the most recent month-end is available at www.jhpensions.com.
**** Expense Ratio (ER), also known as the Annual Investment Charge (AIC) This material shows expenses for a specific unit class for investment options available under a John Hancock USA group annuity contract. The Expense Ratio (ER) includes John Hancock USA's administrative maintenance charge (AMC), sales and service fee, and the expenses of any underlying mutual fund (based on expense ratios reported in the most recent prospectuses available as of the date of printing) and is subject to change. John Hancock USA's AMC will be reduced if John Hancock USA or an affiliate receives asset based distribution charges ("12b-1 fees"), sub-transfer agency fees, or other fees from an unaffiliated underlying mutual fund or its agent(s). These fees, collectively, range from 0% to 0.50%. The amount of the AMC charged under each sub-account has been determined net of such fees. The underlying fund expense is determined by the underlying mutual fund company and may be increased or decreased at any time to reflect changes in the expenses of the underlying mutual fund or other factors. In addition, some fund companies charge exchange or redemption fees for mutual fund shares held for less than a certain period of time. Any such charges would be deducted from the value of a participant's account. The ER applies daily at a rate equivalent to the annual rate shown, and may vary to reflect changes in the expenses of an underlying mutual fund and other factors. The ER does not include any contract-level or participant recordkeeping charges. Such charges, if applicable, will reduce the value of a participant's account. For internally-managed Funds advised and sub-advised exclusively by John Hancock's affiliates, the total fees John Hancock and its affiliates receive from these Funds may be higher than those advised or sub-advised exclusively by unaffiliated mutual fund companies. These fees can come from the Fund or trust's Rule 12b-1, sub-transfer agency, management, AMC or other fees, and may vary from Fund to Fund. Except for certain asset allocation portfolios (i.e., the Lifecycle Portfolios, Lifestyle Portfolios, Core Portfolios and the Guaranteed Income Feature Portfolios), John Hancock uses the revenue received from 12b-1, sub-transfer agency, and management fees to determine the AMC for that Fund, such that the sum of 12b-1, sub transfer agency, management fees and AMC received by John Hancock equals 0.50%. For the most current Expense Ratio information available for each investment option, please refer to the most recent monthly "Returns and Fees" listing available from John Hancock USA upon request. For more information, please contact your financial representative.
¥There may be an asset charge which is calculated on the total value of assets under your plan's contract. The range is 0% to 4%. For more details contact your plan administrator. A Sales and Service Fee or Sales Expense Recovery Charge (SERC) may be included in the total annualized asset charge under your plan's contract. These fees may be billed to the plan sponsor or deducted from participants' accounts, if permitted by the plan.
This fee represents the charge for compensation to your financial representative for services provided to the plan. It may also include a charge for other plan expenses, such as TPA fees that are negotiated between your Plan trustee(s) and your TPA or financial representative, or for other services provided by John Hancock USA.
351405-E01
Important notes CONTINUED

44
Commissions The appropriately licensed financial representative that the plan designates may be eligible for compensation in connection with the sale and service of this contract. This compensation can be based on a percentage of your contract's:a) Contributions received; not to exceed 5% and/or b) Assets under management; not to exceed 1.4%
Price Credits: Provided certain conditions are met, John Hancock may pay a portion of the charge for any asset-based commission, as noted in item (b) above, eligible to the appropriately licensed financial representative designated by the plan trustee(s). The remaining charge for any commissions that is to be charged under the contract and payable by the plan trustee(s) is shown in the Proposal and Recordkeeping Agreement.
The financial representative who sold and now services the contract may also be eligible for different levels of commission. The level of commission is determined by the financial representative and the plan trustee(s). Certain charges under the contract are directly related to the level of commission.
Additional Compensation Certain financial representatives (firms) may allow John Hancock USA to participate in retirement products training and education meetings, conferences and seminars (programs) attended by the firm's sales force. John Hancock USA may agree to make payments out of its own resources to the firm in order to attend these programs. Firms may receive payments in connection with programs sponsored by John Hancock USA, including reimbursement for travel expenses and lodging for persons attending such programs. John Hancock USA may also agree to pay additional compensation to firms based on other calculation methods, which may include the level of sales or assets attributable to the firm. These payments, which may sometimes be referred to as "revenue sharing", assist in John Hancock USA's efforts to promote the sale of its retirement products. Not all firms receive such payments and the amount of the payments varies. These payments could be significant to a firm. John Hancock USA determines which firms to support and extent of the payments it is willing to make. John Hancock USA generally chooses to support firms that have a strong capability to distribute John Hancock USA retirement products and that are willing to cooperate with John Hancock USA's promotional efforts.
John Hancock USA hopes to benefit from these payments by increasing sales of John Hancock USA retirement products, which would result in additional fees for John Hancock USA and its affiliates. In consideration for these payments, a firm may feature John Hancock USA retirement products in its sales system or give preferential access to members of its sales force or management. These payments may provide the firm with an incentive to favor John Hancock USA retirement products. In addition, certain firms may have other compensation arrangements with John Hancock USA or its affiliates that are not related to John Hancock USA retirement products.
The total amount of any commissions and additional compensation is reported annually to you on the Form 5500 Schedule A provided by us. Contact your financial representative for information specific to your contract.
** Performance of the sub-account The performance data for a sub-account for any period prior to the sub-account Inception Date is hypothetical based on the performance of the underlying portfolio. +This class was introduced April 27, 1999. If the sub-account inception date is after April 27, 1999, then the class introduction date is the same as the sub-account inception date. A "class" represents a pre-determined level of the Sales & Service Fee that is applied to all investment options selected in the Contract. All other performance data is actual (except as otherwise indicated). Returns for any period greater than one year are annualized. Performance data reflects changes in the prices of a sub-account's investments (including the shares of an underlying mutual fund), reinvestment of dividends and capital gains and deductions for the Expense Ratio (ER), also known as the Annual Investment Charge (AIC). Performance does not reflect any applicable contract-level or certain participant-level charges, fees for guaranteed benefits if elected by participant under the group annuity contract or redemption fees imposed by the underlying Portfolio. These charges, if included, would otherwise reduce the total return for a participant's account. All performance calculations shown have been prepared solely by John Hancock USA. The underlying fund company has not reviewed the sub-account's performance.
6A. Risk/Return Category: The placement of investment options within style boxes and according to potential risk/return shows John Hancock USA's assessment of those options relative to one another and should not be used to compare these investment options with other investment options available outside of John Hancock USA. John Hancock USA determines peer groups and indexes based on what it believes is the closest match in terms of investment objectives, policies, processes and style. Each investment option's peer group, index and style box and risk/return spectrum placement is subject to change.
*** Morningstar Portfolio Ratings All Morningstar data is © 2010 by Morningstar, Inc. All rights reserved. The information contained herein: (1) is proprietary to Morningstar and/or its content providers; (2) may not be copied or distributed; and (3) is not warranted to be accurate, complete or timely. Neither Morningstar nor its content providers are responsible for any damages or losses arising from any use of this information. All funds with at least a 3-year history are ranked in a "category". Morningstar categories are assigned to a fund based on the underlying securities a fund has invested in over the past 3 years. Funds with scores in the top 10% of each category receive 5 stars (highest); the next 22.5%, 4 stars (above average); the next 35%, 3 stars (average); the next 22.5%, 2 stars (below average); and the bottom 10%, 1 star (lowest). Past performance is no guarantee of future results. Morningstar ratings are applicable to the underlying portfolio only and reflect historical risk-adjusted performance as of the most recent calendar quarter-end. Although gathered from reliable sources, the information is not represented or warranted by Morningstar to be accurate, correct, complete or timely.
9. Account balance reported may include assets transferred from another Fund, which was permanently closed on or about April 30, 2007. Contact your John Hancock representative for more information
13. For internally-managed Funds advised and sub-advised exclusively by John Hancock's affiliates, the total fees John Hancock and its affiliates receive from these Funds may be higher than those advised or sub-advised exclusively by unaffiliated mutual fund companies. These fees can come from the Fund or trust's Rule 12b-1, sub-transfer agency, management, AMC or other fees, and may vary from Fund to Fund. Except for certain asset allocation portfolios (i.e., the Lifecycle Portfolios, Lifestyle Portfolios, Core Portfolios and the Guaranteed Income Feature Portfolios), John Hancock uses the revenue received from 12b-1, sub-transfer agency, and management fees to determine the AMC for that Fund, such that the sum of 12b-1, sub transfer agency, management fees and AMC received by John Hancock equals 0.50%.
21. This sub-account previously invested in a different underlying portfolio. It began investing in the current underlying portfolio effective May 17, 2004. Performance shown for periods prior to that date is based on the performance of the current underlying portfolio.
351405-E01

45
23. Account balance reported may include assets transferred from another Fund, which was permanently closed on or about October 29, 2007. Consult your John Hancock representative for more information.
30. This sub-account previously invested in a different underlying portfolio. It began investing in the current underlying portfolio effective November 25, 2002. Performance shown for periods prior to that date is based on the performance of the current underlying portfolio.
31. Account balance reported may include assets transferred from another Fund, which was permanently closed on or about April 27, 2009. Contact your John Hancock representative for more information.
35. Although the Guaranteed Income feature provides a guaranteed income base as well as guaranteed minimum withdrawal benefits, the Guaranteed Income feature investment options are variable investments and may lose value. Asset allocation portfolios are "fund of funds" which invests in a number of underlying funds. For a complete description of the risks associated with the Fund, please review the underlying fund's prospectus, which is available upon request. Diversification does not assure against loss. Note: There is an additional fee to invest in this feature. It is 0.50% of the Benefit Base
40. This sub-account previously invested in a different share class of the same underlying portfolio. It began investing in the current share class effective on or about July 28, 2008. Performance shown for periods prior to that date is based on the performance of the current share class.
41. Account balance reported may include assets transferred from another Fund, which was permanently closed on or about October 27, 2008. Contact your John Hancock representative for more information.
47. Account balance reported may include assets transferred from another sub-account which was permanently closed between April 22, 2005 and May 7, 2005.
48. Account balance reported may include assets transferred from another Fund, which was permanently closed on or about October 25, 2010. Please contact your John Hancock representative for more information.
56. This sub-account previously invested in a different share class of the same underlying portfolio. It began investing in the current share class effective on or about November 10, 2008. Performance shown for periods prior to that date is based on the performance of the current share class.
57. Account balance reported may include assets transferred from another Fund, which was permanently closed on or about October 26, 2009. Contact your John Hancock representative for more information
59. Important Redemption Fee Information: T. Rowe Price Small Cap Value Fund - Effective January 1, 2005, the underlying fund will impose a 1% redemption fee on all selling/exchanges of the fund within a 90-day period. The "First-In/First-Out" ("FIFO") method will be used to determine whether the shares have been held for the prescribed holding period and, therefore, whether the redemption fee will be applied.
61. This sub-account previously invested in a different share class of the same underlying portfolio. It began investing in the current share class effective on or about November 9, 2009. Performance shown for periods prior to that date is based on the performance of the current share class.
62. Account balance reported may include assets transferred from another Fund which was permanently closed between April 25, 2003 and May 5, 2003.
65. This sub-account previously invested in a different share class of the same underlying portfolio. It began investing in the current share class effective on or about June 1, 2009. Performance shown for periods prior to that date is based on the performance of the current share class.
68. This sub-account previously invested in another underlying portfolio. It began investing in the current underlying portfolio effective October 14, 2005. Performance shown for periods prior to that date is based on the performance of the current underlying portfolio. Performance shown for all periods has been adjusted to reflect the current sub-account charge and would be lower if it reflected the subaccount charge that was in effect prior to October 14, 2005, which was .20% higher than the current sub-account charge.
73. This sub-account previously invested in a different underlying portfolio. It began investing in the current underlying portfolio effective October 14, 2005.
76. None of the Index Funds nor the underlying portfolios are sponsored, endorsed, managed, advised, sold or promoted by any of the respective companies that sponsor the broad-based securities market index, and these companies make no representation regarding the advisability of investing in the Index Fund. Indexes are unmanaged and cannot be invested in directly. Since the underlying portfolios are not actively managed, the Funds will generally reflect the performance of their indexes even in markets when the indexes do not perform well.
82. Account balance reported may include assets transferred from another Fund, which was permanently closed on or about October 30, 2006. Contact your John Hancock representative for more information.
83. This investment option is deemed a "Competing" investment option with the John Hancock Stable Value Fund and may not be available. An investment in this portfolio is not insured or guaranteed by The Federal Deposit Insurance Corporation or any other government agency. Although the underlying portfolio seeks to preserve the value of an investment, it is possible to lose money by investing in this portfolio.
85. Account balance reported may include assets transferred from another Fund, which was permanently closed on or about April 22, 2006. Contact your John Hancock representative for more information.
91. The underlying John Hancock Trust portfolio is not a retail mutual fund and is only available under variable annuity contracts, variable life policies or through participation in tax qualified retirement plans. Although the portfolios' investment adviser or sub-advisers may manage retail mutual funds with similar names and investment objectives, no representation is made, and no assurance is given, that any portfolio's investment results will be comparable to the investment results of any other fund, including other funds with the same investment adviser or sub-adviser. Past performance is no guarantee of future results.
†† Morgan Stanley Investment Management Inc., the sub-adviser to this portfolio, does business in certain instances using the name Van Kampen Investments.
Index Performance: Index performance shown is for a broad-based securities market index. Indexes are unmanaged and cannot be invested in directly. Index returns were prepared using Ibbotson Associates software and data. The performance of an Index does not include any portfolio or insurance-related charges. If these charges were reflected, performance would be lower. Past performance is not a guarantee of future results.
i03. Citigroup U.S. Domestic 3-Month T-Bill Index: An unmanaged, market capitalization weighted, index of 3-month Treasury bills
i07. 20% S&P 500/80% BarCap Agg Bond Index: A combination of 20% S&P 500/80% BarCap Agg Bond Index
i08. 60% S&P 500/40% Barcap Agg Bond Index: A combination of 60% S&P 500/40% Barcap Agg Bond Index
i10. 40% S&P 500/60% BarCap Agg Bond Index: A combination of 40% S&P 500/60% BarCap Agg Bond Index
351405-E01
Important notes CONTINUED

46
i15. Barclays Capital U.S. Aggregate Bond Index: Made up of bonds from the Treasury, Government-Related, Corporate, Mortgage-Backed Security, Asset-Backed Security and Commercial Mortgage-Backed Security sectors. These include securities that are of investment-grade quality or better and have at least one year to maturity.
i20. 70% S&P 500/30% BarCap Agg Bond Index: A combination of 70% S&P 500/30% BarCap Agg Bond Index
i31. MSCI US Small Cap Growth Index: Represents the growth companies of the MSCI US Small Cap 1750 Index. (The MSCI US Small Cap 1750 Index represents the universe of small capitalization companies in the US equity market. This index targets for inclusion 1,750 companies and represents, as of October 29, 2004, approximately 12% of the capitalization of the US equity market).
i34. MSCI All Country World ex US: Free float-adjusted market capitalization index that is designed to measure equity market performance in the global developed and emerging markets.
i35. MSCI EAFE Index: Free float-adjusted market capitalization index that is designed to measure developed market equity performance, excluding the US & Canada.
i36. MSCI Emerging Markets Index: Free float-adjusted market capitalization index that is designed to measure equity market performance in the global emerging markets.
i40. MSCI World Index: Free float-adjusted market capitalization index that is designed to measure global developed market equity performance.
i41. Russell Midcap Growth Index: Offers investors access to the mid-cap growth segment of the U.S. equity universe and is constructed to provide a comprehensive and unbiased barometer of the mid-cap growth market
i43. Russell Midcap Value Index: Offers investors access to the mid-cap value segment of the U.S. equity universe and is constructed to provide a comprehensive and unbiased barometer of the mid-cap value market.
i44. Russell 1000 Growth Index: Offers investors access to the large-cap growth segment of the U.S. equity universe and is constructed to provide a comprehensive and unbiased barometer of the large-cap growth market.
i46. Russell 1000 Value Index: Offers investors access to the large-cap value segment of the U.S. equity universe and is constructed to provide a comprehensive and unbiased barometer of the large-cap value market.
i49. Russell 2000 Value Index: Offers investors access to the small-cap value segment of the U.S. equity universe and is constructed to provide a comprehensive and unbiased barometer of the small-cap value market.
i55. S&P Mid Cap 400 Index: A market capitalization weighted composed of 400 companies with market cap in the range of US$1 billion to US$4 billion
i58. S&P 500 Index: A market capitalization-weighted index, composed of 500 widely-held common stocks. This index is designed to be a leading indicator of U.S. equities and is meant to reflect the risk/return characteristics of the large-cap universe.
i63. MSCI US Prime Market Growth Index: A broadly diversified index predominantly made up of growth stocks of large U.S. companies.
i69. Citigroup Non-U.S. Dollar World Government Bond Index: Is a market-weighted index designed to reflect the performance of the international developed-government fixed income markets in the following 20 countries as of January 1999.
i75. 50% S&P 500/50% BarCap Agg Bond Index: A combination of 50% S&P 500/50% BarCap Agg Bond Index
i76. 75% S&P 500/25% BarCap Agg Bond Index: A combination of 75% S&P 500/25% BarCap Agg Bond Index
i77. 70% MSCI World, 30% BarCap Agg Bond Index: A combination of 70% MSCI World, 30% BarCap Agg Bond
i89. S&P Global<$3 Billion Index: S&P Global <$3 Billion Index series break down the world’s stock markets according to absolute levels of total company market capitalization less than $3 billion.
i93. 65% S&P 500/35% BarCap Agg Bond Index: A combination of 65% S&P 500/35% BarCap Agg Bond Index
i95. 80% S&P 500/20% BarCap Agg Bond Index: A combination of 80% S&P 500/20% BarCap Agg Bond Index
Peer Group Performance: Source: Morningstar Principia Plus for Mutual Funds, as of the most recent calendar quarter-end. Morningstar data is © 2010 by Morningstar, Inc. All rights reserved. Although gathered from reliable sources, the information is not represented or warranted by Morningstar to be accurate, correct, complete or timely. Peer groups are unmanaged and cannot be invested in directly.
p02. Conservative Allocation: Conservative-allocation portfolios seek to provide both capital appreciation and income by investing in three major areas: stocks, bonds, and cash. These portfolios tend to hold smaller positions in stocks than moderate-allocation portfolios. These portfolios typically have 20% to 50% of assets in equities and 50% to 80% of assets in fixed income and cash.
p03. Diversified Emerging Markets: Diversified emerging-markets portfolios tend to divide their assets among 20 or more nations, although they tend to focus on the emerging markets of Asia and Latin America rather than on those of the Middle East, Africa, or Europe. These portfolios invest at least 70% of total assets in equities and invest at least 50% of stock assets in emerging markets.
p05. Foreign Large Blend: Foreign large-blend portfolios invest in a variety of big international stocks. Most of these portfolios divide their assets among a dozen or more developed markets, including Japan, Britain, France, and Germany. These portfolios primarily invest in stocks that have market caps in the top 70% of each economically integrated market (such as Europe or Asia ex-Japan). The blend style is assigned to portfolios where neither growth nor value characteristics predominate. These portfolios typically will have less than 20% of assets invested in U.S. stocks.
p07. Foreign Large Value: Foreign large-value portfolios invest mainly in big international stocks that are less expensive or growing more slowly than other large-cap stocks. Most of these portfolios divide their assets among a dozen or more developed markets, including Japan, Britain, France, and Germany. These portfolios primarily invest in stocks that have market caps in the top 70% of each economically integrated market (such as Europe or Asia ex-Japan). Value is defined based on low valuations (low price ratios and high dividend yields) and slow growth (low growth rates for earnings, sales, book value, and cash flow). These portfolios typically will have less than 20% of assets invested in U.S. stocks.
p11. Intermediate-Term Bond: Intermediate-term bond portfolios invest primarily in corporate and other investment-grade U.S. fixed-income issues and have durations of 3.5 to six years (or, if duration is unavailable, average effective maturities of four to 10 years). These portfolios are less sensitive to interest rates, and therefore less volatile, than portfolios that have longer durations.
p12. Large Blend: Large-blend portfolios are fairly representative of the overall U.S. stock market in size, growth rates, and price. Stocks in the top 70% of the capitalization of the U.S. equity market are defined as large-cap. The blend style is assigned to portfolios where neither growth nor value characteristics predominate. These portfolios tend to invest across the spectrum of U.S. industries, and owing to their broad exposure, the portfolios returns are often similar to those of the S&P 500 Index.
351405-E01

47
p13. Large Growth: Large-growth portfolios invest in big U.S. companies that are projected to grow faster than other large-cap stocks. Stocks in the top 70% of the capitalization of the U.S. equity market are defined as large-cap. Growth is defined based on fast growth (high growth rates for earnings, sales, book value, and cash flow) and high valuations (high price ratios and low dividend yields). Most of these portfolios focus on companies in rapidly expanding industries.
p14. Large Value: Large-value portfolios invest primarily in big U.S. companies that are less expensive or growing more slowly than other large-cap stocks. Stocks in the top 70% of the capitalization of the U.S. equity market are defined as large-cap. Value is defined based on low valuations (low price ratios and high dividend yields) and slow growth (low growth rates for earnings, sales, book value, and cash flow).
p17. Mid-Cap Blend: The typical mid-cap blend portfolio invests in U.S. stocks of various sizes and styles, giving it a middle-of-the-road profile. Most shy away from high-priced growth stocks, but aren't so price-conscious that they land in value territory. The U.S. mid-cap range for market capitalization typically falls between $1 billion-$8 billion and represents 20% of the total capitalization of the U.S. equity market. The blend style is assigned to portfolios where neither growth nor value characteristics predominate.
p18. Mid-Cap Growth: Some mid-cap growth portfolios invest in stocks of all sizes, thus leading to a mid-cap profile, but others focus on midsize companies. Mid-cap growth portfolios target U.S. firms that are projected to grow faster than other mid-cap stocks, therefore commanding relatively higher prices. The U.S. mid-cap range for market capitalization typically falls between $1 billion-$8 billion and represents 20% of the total capitalization of the U.S. equity market. Growth is defined based on fast growth (high growth rates for earnings, sales, book value, and cash flow) and high valuations (high price ratios and low dividend yields).
p19. Mid-Cap Value: Some mid-cap value portfolios focus on medium-size companies while others land here because they own a mix of small-, mid-, and large-cap stocks. All look for U.S. stocks that are less expensive or growing more slowly than the market. The U.S. mid-cap range for market capitalization typically falls between $1 billion and $8 billion and represents 20% of the total capitalization of the U.S. equity market. Value is defined based on low valuations (low price ratios and high dividend yields) and slow growth (low growth rates for earnings, sales, book value, and cash flow).
p20. Moderate Allocation: Moderate-allocation portfolios seek to provide both capital appreciation and income by investing in three major areas: stocks, bonds, and cash. These portfolios tend to hold larger positions in stocks than conservative-allocation portfolios. These portfolios typically have 50% to 70% of assets in equities and the remainder in fixed income and cash.
p21. Money Market Taxable: These portfolios invest in short-term money market securities in order to provide a level of current income that is consistent with the preservation of capital.
p24. Small Blend: Small-blend portfolios favor U.S. firms at the smaller end of the market-capitalization range. Some aim to own an array of value and growth stocks while others employ a discipline that leads to holdings with valuations and growth rates close to the small-cap averages. Stocks in the bottom 10% of the capitalization of the U.S. equity market are defined as small-cap. The blend style is assigned to portfolios where neither growth nor value characteristics predominate.
p25. Small Growth: Small-growth portfolios focus on faster-growing companies whose shares are at the lower end of the market-capitalization range. These portfolios tend to favor companies in up-and-coming industries or young firms in their early growth stages. Because these businesses are fast-growing and often richly valued, their stocks tend to be volatile. Stocks in the bottom 10% of the capitalization of the U.S. equity market are defined as small-cap. Growth is defined based on fast growth (high growth rates for earnings, sales, book value, and cash flow) and high valuations (high price ratios and low dividend yields).
p26. Small Value: Small-value portfolios invest in small U.S. companies with valuations and growth rates below other small-cap peers. Stocks in the bottom 10% of the capitalization of the U.S. equity market are defined as small-cap. Value is defined based on low valuations (low price ratios and high dividend yields) and slow growth (low growth rates for earnings, sales, book value, and cash flow).
p46. World Allocation: World-allocation portfolios seek to provide both capital appreciation and income by investing in three major areas: stocks, bonds, and cash. While these portfolios do explore the whole world, most of them focus on the U.S., Canada, Japan, and the larger markets in Europe. It is rare for such portfolios to invest more than 10% of their assets in emerging markets. These portfolios typically have at least 10% of assets in bonds, less than 70% of assets in stocks, and at least 40% of assets in non-U.S. stocks or bonds.
p47. World Bond: World bond portfolios invest 40% or more of their assets in foreign bonds. Some world bond portfolios follow a conservative approach, favoring high-quality bonds from developed markets. Others are more adventurous, and own some lower-quality bonds from developed or emerging markets. Some portfolios invest exclusively outside the U.S., while others regularly invest in both U.S. and non-U.S. bonds.
p48. World Stock: World-stock portfolios have few geographical limitations. It is common for these portfolios to invest the majority of their assets in the U.S., Europe, and Japan, with the remainder divided among the globe’s smaller markets. These portfolios typically have 20%-60% of assets in U.S. stocks.
Key Statistics
§ The Turnover Ratio shown is based on the most recent available financial statements for the underlying mutual fund as of the date of printing and is subject to change.
^ Current Yield is an annualized figure based on the yield earned in the previous month net of annual investment charges. The Current Yield is as of the date of printing and is subject to change.
351405-E01
Important notes CONTINUED

What’s Next? ?

What’s next?By taking the time to enroll in your company’s retirement plan, youhave taken a very important step toward creating a more financiallysecure future.
As a participant, you’ll be able to take advantage of the many benefits and advantages of participation – benefits such as:
� Potential tax savings that can really add up
� Watching your savings grow with compound earnings
� The satisfaction that comes with making an investment in your future.
What can I expect now that I’ve enrolled?
John Hancock takes your retirement planning as seriously as you do. When you enroll in yourcompany’s plan, rest assured that we will be there for you every step of the way.
You have access to the tools, tips and resources to help make saving for your retirement simple,straightforward and enjoyable. In the following pages we’ll show you how to:
� Register for the John Hancock website
� Get your customized Retirement Action Plan
� Access online tools and resources to help you along the way
� Read your quarterly retirement plan statement
� Consolidate your retirement savings in one place
� Contact John Hancock, and more.
?
P 17324-WN
-Tab-GE 07/10-17324

ENJOY GETT ING THERE | RET IREMENT PLANNING THAT’S AS EASY AS 1, 2, 3, GO!
Access the websiteOnline tools to help you alongthe way – ready when you are.John Hancock is committed to providing you with tools and resources to help you makeinformed retirement planning decisions. Enjoy 24-hour online access to your account, as well as a wide range of retirement planning tools and resources through the JohnHancock website. Go online to:
� Access, review and manage your account
� Set and manage your retirement goal
� Receive a personalized Retirement Action Plan
� Determine your risk profile with the Risk Quiz
� Get tips about how much to contribute
� Review your quarterly statements and newsletters
� Use interactive financial planning tools
� Learn more on the fundamentals of investing.
How to register: Visit www.jhpensions.com or www.jhnypensions.com (for plans domiciled in New York).
1. Enter your contract number
Enter the contract number in the space provided. Youcan obtain this number from your plan administrator,enrollment form or your quarterly statement.
2. Create a username and password
Once you’ve entered your contract number, you will beasked to create a unique username and password. You willneed these to access your account online in the future.
3. Enter your Personal Identification Number (PIN)
You will be prompted to enter your PIN. You can find this number on the PIN cardattached to your enrollment form or sent separately. (Note: contract and PIN numbers arenot the same and will be required at different times when using John Hancock’s services.)
Lost your PIN or forgotten your login information?
� If you forget your login information, you can always use your PIN and thebalance of a recent statement to accessyour account.
� If you receive two PINs, use the onewith the most recent date. Only thecard with the most recent issue date will permit access to your account.
� If you forget your PIN, contact a JohnHancock Retirement Plan Servicescustomer service representative torequest a new PIN.
?
P 17324-WN
-GE 07/10-17324
KIT351405
1

Want a Retirement Action Plan instantly? Visit www.jhpensions.com or www.jhnypensions.com (for plans domiciled in New York) and in 15 minutes or less John Hancockwill give you a personalized action plan. You can change and model different scenarios in real time until you have a strategy thatworks for you.
ENJOY GETT ING THERE | RET IREMENT PLANNING THAT’S AS EASY AS 1, 2, 3, GO!
P 17324-WN
-GE 07/10-17324
Set a goal, get a plan andtrack your progressTo reach your goal, you’ll need a plan.
You’ve invested the time it takes to set a retirementgoal. Now it’s time to get a plan – a personalizedRetirement Action Plan.
How? Go to the mailer at the end of this section (pictured here) and fill it out.Then, tear it out, fold in half and mail it back to us.
In four to six weeks, you’ll receive your personalized Retirement Action Plan. Itshows you your retirement goal, an overview of your investment strategy and a recommended contribution amount to help you achieve your goal.
The Retirement Action PlanThis is your personalized plan to help you reach your retirement goal. You’llfind a detailed snapshot of your investment strategy and your projectedretirement income summary. It also provides you with valuable suggestions,such as revised contribution amounts to help you achieve your goal.
We encourage you to review the suggested contribution amount and makeadjustments as required.
KIT351405
2

ENJOY GETT ING THERE | RET IREMENT PLANNING THAT’S AS EASY AS 1, 2, 3, GO!
P 17324-WN
-GE 07/10-17324
Tracking your progressAs you make your way along the path to retirement, John Hancock will be there for you every step of the way. Once you’ve set agoal by sending in the self-mailer or following the instructions online, you’ll have access to powerful tools that will help you trackand monitor your progress:
The Action Plan UpdateEach year, John Hancock will send you an Action Plan Update with your first quarterly statement. This update is based on yourcontributions over the previous year, and includes:
� A series of questions to help you conduct a personal and financial review
� An overview of the goal you’ve selected
� A snapshot of your current investment strategy, portfolio and projected retirement income
� Current and suggested contribution amounts.
Based on the Action Plan Update, it’s easy to change the amount you contribute if you need to. Simply contact your PlanAdministrator and advise them of the change, or login through our website and update through the account management feature.
KIT351405
3

ENJOY GETT ING THERE | RET IREMENT PLANNING THAT’S AS EASY AS 1, 2, 3, GO!
P 17324-WN
-GE 07/10-17324
How to read your retirement plan statement
Useful quarterly statementsYour quarterly statements will include summaries of portfolio performanceand account activity for the period, lists of investment options selected andmuch more. They’re personalized, practical and easy to understand. Yourstatements for the previous two years are available on our website.
Each quarter, you’ll receive a detailed statement providing you with a summary of your retirement planning progress. Key information is highlighted in easy-to-read sections, such as Looking back, Your personal rate of return, Looking ahead,This period and more.
� Your personal rate of returnThis section shows you how youraccount performed over thedifferent reporting periods.
� This periodDetails your opening balance, whatmoney went in and what moneywent out, and the ending balance of your account.
� Looking backThis chart shows the change in youraccount. If this is your first statement,this chart will not be shown.
KIT351405
4
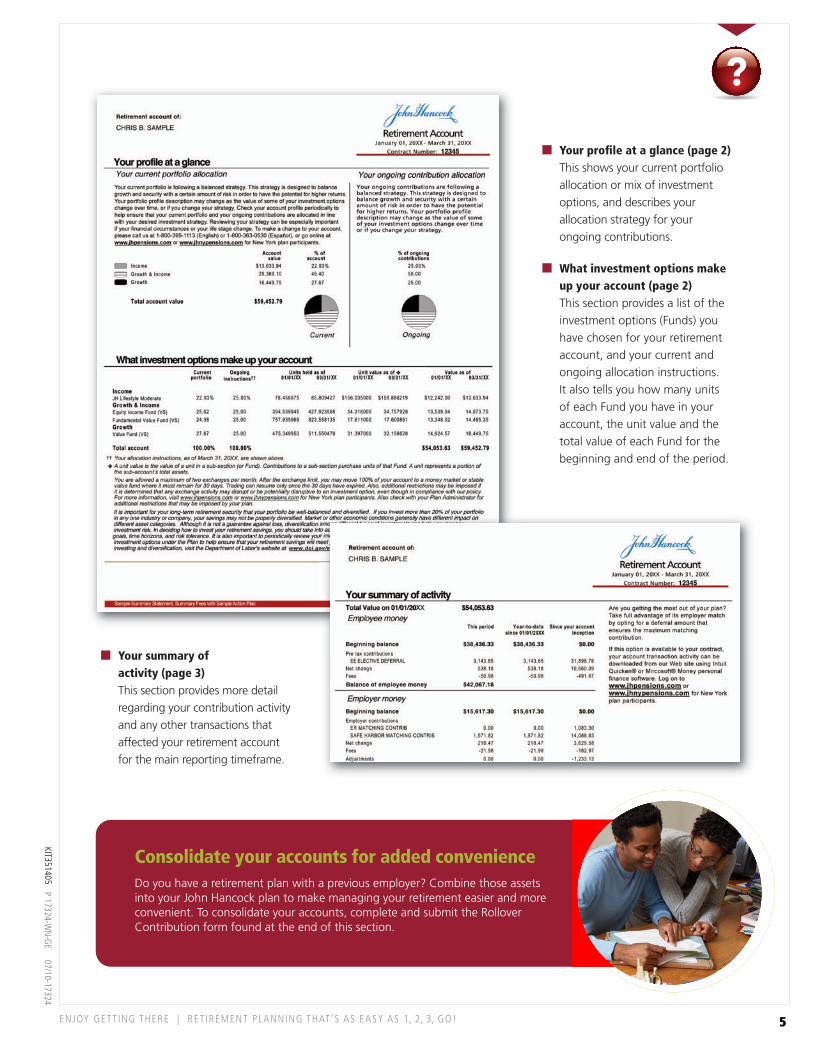
ENJOY GETT ING THERE | RET IREMENT PLANNING THAT’S AS EASY AS 1, 2, 3, GO!
P 17324-WN
-GE 07/10-17324
Consolidate your accounts for added convenienceDo you have a retirement plan with a previous employer? Combine those assetsinto your John Hancock plan to make managing your retirement easier and moreconvenient. To consolidate your accounts, complete and submit the RolloverContribution form found at the end of this section.
� Your profile at a glance (page 2)This shows your current portfolioallocation or mix of investmentoptions, and describes your allocation strategy for your ongoing contributions.
� What investment options makeup your account (page 2)This section provides a list of theinvestment options (Funds) youhave chosen for your retirementaccount, and your current andongoing allocation instructions. It also tells you how many units of each Fund you have in youraccount, the unit value and thetotal value of each Fund for thebeginning and end of the period.
� Your summary of activity (page 3)This section provides more detailregarding your contribution activityand any other transactions thataffected your retirement account for the main reporting timeframe.
?
KIT351405
5

ENJOY GETT ING THERE | RET IREMENT PLANNING THAT’S AS EASY AS 1, 2, 3, GO!
P 17324-WN
-GE 07/10-17324
Take advantage of consolidationDo you have retirement assets in multiple accounts?Consolidate them and simplify your path to retirement.
If you’ve changed jobs in the past, you likely have retirement assets still in your previousemployers’ qualified retirement plans. Given the demands on your time, you may not bemanaging those old retirement accounts as carefully as you used to, making it morechallenging to reach your retirement goal.
Consolidate and stay in controlThere’s an easy option that lets you manage all your retirement assets in one place.Simply consolidate or roll over your qualified retirement accounts into your currentqualified plan with John Hancock.
Benefits of rolling over� Get one statement that’s easy to review.
� Pay no withholding tax or current income tax on funds you directly roll over into yourcurrent qualified plan.
� Continue to defer taxes on your qualified account so your savings can grow.
� Pay only one set of fees.
If your plan accepts rollovers, simply followthese three steps:1. Contact your previous retirement plan Trustee or financial institution. Tell them youwish to directly roll over your retirement account balance into your qualified retirementaccount with your current employer.
2. Complete a distribution form. Your previous plan Trustee can send you this form.Send the completed form to your previous plan Trustee or financial institution andrequest that the distribution check be made payable to your current employer’s qualifiedretirement plan for the benefit of you.
3. Complete the rollover form at the end of this section and give it to your currentplan Trustee. It’s that simple. Contact your Plan Administrator today and find out justhow easy it is to consolidate your retirement savings.
KIT351405
6

ENJOY GETT ING THERE | RET IREMENT PLANNING THAT’S AS EASY AS 1, 2, 3, GO!
P 17324-WN
-GE 07/10-17324
Enjoy getting there! Creating the retirement incomeof your dreams is a journey.
By setting a goal, determining a contribution amount and choosing your investment options,you’ve taken an important step on the journey toward achieving your retirement objectives.
� Participating in your company’s retirement plan will help you get there.
� You will benefit from compound earnings and significant tax savings.
� With each paycheck, you will be closer to achieving your dreams for your retirement.
As you travel down the road to retirement, John Hancock will be with you every step of theway with the tips, tools, information and insights you need to help you stay the course.
By making saving for your retirement as easy and convenient as possible, you’ll be able to enjoy getting there.
?
KIT351405
7

ENJOY GETT ING THERE | RET IREMENT PLANNING THAT’S AS EASY AS 1, 2, 3, GO!
P 17324-WN
-GE 07/10-17324
How to contactJohn Hancock Via phone Call toll-free: 1-800-395-1113 (English)Para ayuda en español, por favor marque: 1-800-363-0530
Monday to Friday – 7 A.M. to midnight (ET)Saturday – 9:30 A.M. to 5 P.M. (ET)
Customer service representatives are available to assist you weekdaysbetween 8 A.M. to 8 P.M. (ET)
Here’s what you can do through ourtoll-free phone service� Find out your account balance
� Make changes to your investment options
� Get information on distributions
� Get investment option unit values, investment returns and interest rates.
Changing jobs or retiring?Call 1-888-695-4472. Our Rollover Education Specialists can answerquestions about your distribution options or introduce you to your plan’sfinancial representative.
Via the web www.jhpensions.com or www.jhnypensions.com (for plansdomiciled in New York).
24-hour information at your fingertips. View our interactive demo. Find additional information, educate yourself on a wide array of retirement and financial planning topics, and perform transactions. Our website has something for everyone!
KIT351405
8

Instructions for Rollover Contribution
GP1111US (06/2010)
Section A - General InformationComplete contractholder name (trustee), contract number, participant's name, and social security number of participant.
First year of designated Roth Contribution under prior plan - Complete this item only if the rollover consists of Roth 401(k) contribution and therollover is a direct rollover. If the year is not provided, we will use the first year in which the participant makes a regular Roth 401(k) contributionunder this group annuity contract to determine if the participant's distribution satisfies the 5-year requirement of a "qualified distribution". You donot need to complete this item if the rollover from the Roth 401(k) account is not a direct rollover.
Section D - Acceptance and investment of rollover contribution - To be completed by plan trustee or authorized plan representative
Section B - Rollover Amount
Section C - Designation of Rollover Amount Your Third Party Administrator is responsible for keeping track of after-tax monies attributable to pre-1987 and post-1986 contributions.John Hancock Retirement Plan Services does not record-keep this information.
Each rollover contribution must be accompanied by this form, duly completed and signed by the trustee/authorized plan representative. Rolloveramounts will not be invested in the participant's account under your plan's John Hancock Retirement Plan Services group annuity contract unlessaccompanied by such form.The rollover contribution check(s) should be made payable to the trustee of the plan For Benefit Of the participant. Example: "Trustee of XYZ Corp Savings Plan FBO Jane Doe" The trustee should then endorse the check(s) to John Hancock.
Beginning in 2007, after tax contributions held in a Section 403(b) plan may be directly rolled over into a qualified 401(a) plan if your Plan permitsand if certain conditions are satisfied. Please check with your Plan Administrator for details.Indirect Roth 401(k) Rollover - If a distribution from a designated Roth 401(k) account is made to a participant and the participant then rolls overthe distribution within 60 days from the date of the distribution, such a rollover is an indirect rollover. Only the portion of the distribution that isincludible in gross income (i.e. earnings) is permitted to be rolled over in an indirect rollover.
If the rollover contribution is to be invested according to the participant's latest allocation instructions on file with John Hancock Retirement PlanServices, select Box A; if the participant has elected investment selections specific to this rollover contribution, select Box B. If Box B is selected,Section E must be completed and signed by the participant. The participant's signature is not required if Box A has been selected.If none of the boxes in Section D are checked and Section E is blank, the rollover contribution will be invested according to the participant's latestallocation instructions on file with John Hancock Retirement Plan Services. In the absence of any such allocation instructions, the rollovercontribution will be invested in the designated default investment option approved by the plan's Trustee, provided that John Hancock RetirementPlan Services. has been provided with the participant's first and last name and Social Security Number and the form has been duly authorized bythe plan trustee or authorized plan representative.
Section E - Allocation instructions for rollover contribution - To be completed by participant Complete this section only if you wish to provide separate allocation instructions for this rollover contribution. Except as otherwise describedbelow, if Box B in Section D is checked, the investment instructions provided on this Form will apply to this rollover contribution only. If you wish tomake alternative allocation choices for existing or future contributions you will need to provide separate instructions accordingly. However if youdo not currently have investment instructions on record or are default enrolled, the options provided in Section E will be applied to this rollovercontribution and your current account balance or future contributions. If investment instructions are used in Section E of the rollover form toupdate the current account balance and future contributions, changes will not be accepted on an Enrollment Form.If completing Section E, please note:1. Indicate the selected investment option in Column A and the percentage allocation for that investment option in Column B.2. Please use the three digit code or investment option name to identify allocation instructions. For the codes and investment option names,
please refer to your quarterly statement, or log onto www.jhpensions.com (in New York, www.jhnypensions.com).
3. Some fund companies charge redemption fees for fund shares sold within a specified period of time. Please visit our website or call ourtoll-free service line 1-800-395-1113, for more information.
4. If Section E is completed, a participant signature is required.
Both John Hancock Life Insurance Company (U.S.A.) and John Hancock Life Insurance Company of New York do business under certain instances using the John Hancock Retirement Plan Services name.Group annuity contracts and recordkeeping agreements are issued by: John Hancock Life Insurance Company (U.S.A.), Boston, MA 02210 (not licensed in New York) andJohn Hancock Life Insurance Company of New York, Valhalla, NY 10595. Product features and availability may differ by state.
KIT351405

Signature of trustee/authorized plan representative
Instructions for Rollover Contribution
Section B - Rollover AmountTotal rollover amount $
Section C - Designation of Rollover Amount - If you require assistance in identifying the correct money type, please consult your Third Party Administrator. Pre-tax rollover amount $ After-tax rollover amount $
CodePlease indicate the appropriate money type(s) and contribution amount(s). Please indicate the appropriate money type(s) and contribution amount(s).
Money will not be invested until this information is received.Description Balance
First year of designated Roth contribution under prior plan Year
Signature of participant Name - please print
I, the contractholder named above (or its authorized plan representative), hereby:1.
2.
certify that I have reasonably concluded that the the total rollover amount received by John Hancock Retirement Plan Services with respect tothe above mentioned participant is a valid rollover contribution (as defined in Treas. Reg. Section 1.401(a)(31)-1, Q&A 14 and acceptable underthe terms of the company's plan); anddirect John Hancock Retirement Plan Services to invest the rollover contributionAB
According to the participant's latest allocation instructions on file with John Hancock Retirement Plan Services;According to the instructions provided below in Section E - Please have participant complete and sign off in Section E.
Description Amount Attributable to Contribution
Amount Attributable to Earnings
Section D - Allocation instructions for rollover contribution - To be completed by plan trustee/authorized plan representative.
Example
$401(a) RolloverEERC
$IRA RolloverEEIRA
$Governmental 457(b) RolloverEE457
$403(b) Rollover EE403
$SEP RolloverEESEP
$SIMPLE IRA RolloverEESIR
401(a) Rollover $
403(a) Rollover $
Direct Roth 401(k) /403(b) Rollover
$Direct403(b) Rollover
$Indirect Roth 401(k) /403(b) Rollover
Section A - General InformationContractholder Name Contract Number
Participant Name (Last Name, First Name, Initial) Social Security Number
Column ACode/investment option name
Column B Indicate % to be
allocated to new selectionColumn A
Code/investment option name
MMR
Column B Indicate % to be
allocated to new selection
100%
%
%
%
%
%
Selections must total 100%
I understand that if I later determine that the rollover amount was an invalid rollover contribution, I am responsible for informing John Hancock Retirement PlanServices and providing the necessary instructions to remove the contribution, plus any earnings attributable thereto, within a reasonable time after such determination.
DateName - please print
Signature
Section E - Investment instructions - To be completed by participant if 2. B is selected under Section D.
• To complete this form, please read the instruction page attached to this form.
The Trustees of Plan (the "Plan")
Code
EEAT1
EEAT1
EEAT2
EERRT
EERRT
$
$
$
$
$
Both John Hancock Life Insurance Company (U.S.A.) and John Hancock Life Insurance Company of New York do business under certain instances using the John Hancock Retirement Plan Services name.Group annuity contracts and recordkeeping agreements are issued by: John Hancock Life Insurance Company (U.S.A.), Boston, MA 02210 (not licensed in New York) andJohn Hancock Life Insurance Company of New York, Valhalla, NY 10595. Product features and availability may differ by state.
Page 1 of 1 GP1111US (06/2010)
Date
%
%
%
%
%
%
KIT351405

This information does not constitute legal or tax advice with respect to any taxpayer. It was neither written nor intended for use by any such taxpayer for the purpose of avoiding penalties, and it cannot be so used. If it is used or referred to in promoting, marketing orrecommending any transaction or matter addressed herein, it should be understood as having been written to support such promotion,marketing or recommendation, and any taxpayer receiving it should seek advice based on the taxpayer’s particular circumstances from an independent tax advisor.
To obtain group annuity investment option Fund sheets and prospectuses for each sub-account’s underlying investmentvehicle, call 1-877-346-8378. These documents contain complete details on investment objectives, risks, fees, charges andexpenses as well as other information about the underlying investment vehicle, which should be considered carefully.Please read these documents carefully prior to investing.
Both John Hancock Life Insurance Company (U.S.A.) and John Hancock Life Insurance Company of New York do business under certaininstances using the John Hancock Retirement Plan Services name. Group annuity contracts and recordkeeping agreements are issued byJohn Hancock Life Insurance Company (U.S.A.), Boston, MA 02210 (not licensed in New York) and John Hancock Life Insurance Companyof New York, Valhalla, NY 10595. Product features and availability may differ by state.
NOT FDIC INSURED | MAY LOSE VALUE | NOT BANK GUARANTEED | NOT INSURED BY ANY GOVERNMENT AGENCY
© 2010 John Hancock. All rights reserved.
P 17324-GE 07/10-17324 GA1221097374


