
WEBSITE:www.fermentor.co.in
Fermentation (biochemistry)From Wikipedia, the free encyclopedia
For other uses, see Fermentation (disambiguation).
Fermentation in progress: scum formed by CO2 gas bubbles and fermenting material.
Fermentation is a form of anaerobic digestion that generates ATP by the oxidation of certain organic compounds, such as carbohydrates. Fermentation uses
an endogenous, organic electron acceptor.[1] In contrast, respiration is where electrons are donated to an exogenous electron acceptor, such as oxygen, via an
electron transport chain. Fermentation is important in anaerobic conditions when there is no oxidative phosphorylationto maintain the production of ATP
(adenosine triphosphate) by glycolysis. During fermentation, pyruvate is metabolized to various compounds. Homolactic fermentation is the production
of lactic acid from pyruvate; alcoholic fermentation is the conversion of pyruvate into ethanol and carbon dioxide; and heterolactic fermentation is the
production of lactic acid as well as other acids and alcohols. Fermentation does not necessarily have to be carried out in an anaerobic environment. For

example, even in the presence of abundant oxygen, yeast cells greatly prefer fermentation to oxidative phosphorylation, as long as sugars are readily available
for consumption (a phenomenon known as the Crabtree effect).[2] The antibiotic activity of hopsalso inhibits aerobic metabolism in yeast.
Sugars are the most common substrate of fermentation, and typical examples of fermentation products are ethanol, lactic acid, lactose, and hydrogen.
However, more exotic compounds can be produced by fermentation, such as butyric acid and acetone. Yeast carries out fermentation in the production
of ethanol in beers, wines, and other alcoholic drinks, along with the production of large quantities of carbon dioxide. Fermentation occurs
in mammalianmuscle during periods of intense exercise where oxygen supply becomes limited, resulting in the creation of lactic acid.[3]
Contents
[hide]
1 Chemistry
o 1.1 Lactic acid fermentation
o 1.2 Glycolysis
o 1.3 Aerobic respiration
2 Hydrogen gas production in
fermentation
3 Methane gas production in
fermentation
4 History
5 Etymology
6 See also
7 References
8 External links
[edit]Chemistry

Comparison of aerobic respiration and most known fermentation types ineucaryotic cell.[4] Numbers in circles indicate counts of carbon atoms in molecules, C6
isglucose C6H12O6, C1 carbon dioxide CO2.Mitochondrial outer membrane is omitted.
Fermentation products contain chemical energy (they are not fully oxidized), but are considered waste products, since they cannot be metabolized further
without the use of oxygen.
The chemical equation below shows the alcoholic fermentation of glucose, whose chemical formula is C6H12O6.[5] One glucose molecule is converted into
two ethanol molecules and two carbon dioxide molecules:
C6H12O6 → 2 C2H5OH + 2 CO2
C2H5OH is the chemical formula for ethanol.
Before fermentation takes place, one glucose molecule is broken down into two pyruvate molecules. This is known as glycolysis.[5][6]
[edit]Lactic acid fermentation
Lactic acid fermentation is the simplest type of fermentation. In essence, it is a redox reaction. In anaerobic conditions, the cell’s primary mechanism
ofATP production is glycolysis. Glycolysis reduces (i.e. transfers electrons to) nicotinamide adenine dinucleotide (NAD+), forming NADH. However there is a
limited supply of NAD+ available in any given cell. For glycolysis to continue, NADH must be oxidized (i.e. have electrons taken away) to regenerate the

NAD+ that is used in glycolysis. In an aerobic environment, where oxygen is available, oxidation of NADH is usually done through an electron transport
chain in a process called oxidative phosphorylation, but oxidative phosphorylation cannot occur in anaerobic environments because oxygen is absent due
to the pathway's dependence on the terminal electron acceptor of oxygen.[7] Instead, the NADH donates its extra electrons to the pyruvate molecules
formed during glycolysis. Since the NADH has lost electrons, NAD+ regenerates and is again available for glycolysis. Lactic acid, for which this process is
named, is formed by the reduction of pyruvate.[7]
In heterolactic acid fermentation, one molecule of pyruvate is converted to lactate; the other is converted to ethanol and carbon dioxide. In homolactic
acid fermentation, both molecules of pyruvate are converted to lactate. Homolactic acid fermentation is unique because it is one of the only respiration
processes to not produce a gas as a byproduct.
Homolactic fermentation breaks down the pyruvate into lactate. It occurs in the muscles of animals when they need energy faster than the blood can
supply oxygen. It also occurs in some kinds of bacteria (such as lactobacilli) and some fungi. It is this type of bacteria that converts lactose into lactic acid
in yogurt, giving it its sour taste. These lactic acid bacteria can be classed as homofermentative, where the end-product is mostly lactate, or
heterofermentative, where some lactate is further metabolized and results in carbon dioxide, acetate, or other metabolic products.
The process of lactic acid fermentation using glucose is summarized below.[8] In homolactic fermentation, one molecule of glucose is converted to two
molecules of lactic acid:
C6H12O6 → 2 CH3CHOHCOOH.
or one molecule of lactose and one molecule of water make four molecules of lactate (as in some yogurts and cheeses):
C12H22O11 + H2O → 4 CH3CHOHCOOH.
In heterolactic fermentation, the reaction proceeds as follows, with one molecule of glucose being converted to one molecule of lactic acid, one
molecule of ethanol, and one molecule of carbon dioxide:[8]
C6H12O6 → CH3CHOHCOOH + C2H5OH + CO2
Before lactic acid fermentation can occur, the molecule of glucose must be split into two molecules of pyruvate. This process is
called glycolysis.[9]

[edit]Glycolysis
Main article: Glycolysis
To extract chemical energy from glucose, the glucose molecule must be split into two molecules of pyruvate.[9] This process generates two
molecules of NADH and also four molecules ofadenosine triphosphate (ATP), yet there is only net gain of two ATP molecules considering the
two initially consumed.[8]
C6H12O6 + 2 ADP + 2 Pi + 2 NAD+ → 2 CH3COCOO− + 2 ATP + 2 NADH + 2 H2O + 2H+
The chemical formula of pyruvate is CH3COCOO−. Pi stands for the inorganic phosphate. As shown by the reaction
equation, glycolysis causes the reduction of two molecules of NAD+ toNADH.[8] Two ADP molecules are also converted to two ATP and
two water molecules via substrate-level phosphorylation.
[edit]Aerobic respiration
In aerobic respiration, the pyruvate produced by glycolysis is oxidized completely, generating additional ATP and NADH in the citric acid
cycle and by oxidative phosphorylation. However, this can occur only in the presence of oxygen. Oxygen is toxic to organisms that
are obligate anaerobes, and are not required by facultative anaerobic organisms. In the absence of oxygen, one of the fermentation
pathways occurs in order to regenerate NAD+; lactic acid fermentation is one of these pathways.[8]
[edit]Hydrogen gas production in fermentation
Hydrogen gas is produced in many types of fermentation (mixed acid fermentation, butyric
acid fermentation, caproate fermentation, butanol fermentation, glyoxylate fermentation), as a way to regenerate NAD+ from
NADH. Electrons are transferred to ferredoxin, which in turn is oxidized by hydrogenase, producing H2.[5] Hydrogen gas is
a substrate for methanogens and sulfate reducers, which keep the concentration of hydrogen low and favor the production of such an
energy-rich compound,[10] but hydrogen gas at a fairly high concentration can nevertheless be formed, as in flatus.
As an example of mixed acid fermentation, bacteria such as Clostridium pasteurianum ferment glucose
producing butyrate, acetate, carbon dioxide and hydrogen gas:[11] The reaction leading to acetate is:

C6H12O6 + 4 H2O → 2 CH3COO- + 2 HCO3- + 4 H+ + 4 H2
Glucose could theoretically be converted into just CO2 and H2, but the global reaction releases little energy.
[edit]Methane gas production in fermentation
Acetic acid can also undergo a dismutation reaction to produce methane and carbon dioxide:[12][13]
CH3COO– + H+ → CH4 + CO2 ΔG° = -36 kJ/reaction
This disproportionation reaction is catalysed by methanogen archaea in their fermentative metabolism. One electron is
transferred from the carbonyl function (e– donor) of the carboxylic group to the methyl group (e– acceptor) of acetic acid to
respectively produce CO2 and methane gas.
[edit]History
The first solid evidence of the living nature of yeast appeared between 1837 and 1838 when three publications appeared by C.
Cagniard de la Tour, T. Swann, and F. Kuetzing, each of whom independently concluded as a result of microscopic
investigations that yeast is a living organism that reproduces by budding. The word yeast, it should be noted, is cognate with
the Sanskrit word meaning boiling.[14] It is perhaps because wine, beer, and bread were each basic foods in Europe that most
of the early studies on fermentation were done on yeasts, with which they were made. Soon, bacteria were also discovered;
the term was first used in English in the late 1840s, but it did not come into general use until the 1870s, and then largely in
connection with the new germ theory of disease.[15]
Louis Pasteur (1822–1895), during the 1850s and 1860s, showed that fermentation is initiated by living organisms in a series
of investigations.[7] In 1857, Pasteur showed that lactic acid fermentation is caused by living organisms.[16] In 1860, he
demonstrated that bacteria cause souring in milk, a process formerly thought to be merely a chemical change, and his work in
identifying the role of microorganisms in food spoilage led to the process of pasteurization.[17] In 1877, working to improve the
French brewing industry, Pasteur published his famous paper on fermentation, "Etudes sur la Bière", which was translated
into English in 1879 as "Studies on Fermentation".[18] He defined fermentation (incorrectly) as "Life without air",[19] but
correctly showed that specific types of microorganisms cause specific types of fermentations and specific end-products.

Although showing fermentation to be the result of the action of living microorganisms was a breakthrough, it did not explain
the basic nature of the fermentation process, or prove that it is caused by the microorganisms that appear to be always
present. Many scientists, including Pasteur, had unsuccessfully attempted to extract the
fermentation enzyme from yeast.[19] Success came in 1897 when the German chemist Eduard Buechner ground up yeast,
extracted a juice from them, then found to his amazement that this "dead" liquid would ferment a sugar solution, forming
carbon dioxide and alcohol much like living yeasts.[20] The "unorganized ferments" behaved just like the organized ones. From
that time on, the term enzyme came to be applied to all ferments. It was then understood that fermentation is caused by
enzymes that are produced by microorganisms.[21] In 1907, Buechner won the Nobel Prize in chemistry for his work.[22]
Advances in microbiology and fermentation technology have continued steadily up until the present. For example, in the late
1970s, it was discovered that microorganisms could be mutated with physical and chemical treatments to be higher-yielding,
faster-growing, tolerant of less oxygen, and able to use a more concentrated
medium.[23] Strain selection and hybridization developed as well, affecting most modern food fermentations.
[edit]Etymology
The word fermentation is derived from the Latin verb fervere, which means to boil (same root as effervescence). It is thought
to have been first used in the late fourteenth century in alchemy, but only in a broad sense. It was not used in the modern
scientific sense until around 1600.[24]
[edit]See also
Acetone-butanol-ethanol fermentation
Dark fermentation
Fermentation (wine)
Fermentation (food)
Fermentative hydrogen production
Industrial fermentation

Fermentation lock
Fed-batch
Chemostat
Ethanol fermentation
Non-fermenter
Photofermentation
[edit]References

1.Acetone-butanol-ethanol fermentationFrom Wikipedia, the free encyclopedia
Acetone-butanol-ethanol (ABE) fermentation is a process that uses bacterial Fermentation to produce acetone, n-Butanol, and ethanol from starch. It
was the primary process used to makeacetone during World War I, such as to produce cordite. The process is anaerobic (done in the absence of oxygen),
similar to how yeast ferments sugars to produce ethanol for wine, beer, or fuel. The process produces these solvents in a ratio of 3-6-1, or 3 parts
acetone, 6 parts butanol and 1 part ethanol. It usually uses a strain of bacteria from the Clostridia Class (Clostridium Family).Clostridium acetobutylicum is
the most well-known strain, although Clostridium beijerinckii has also been used for this process with good results.
The production of butanol by biological means was first performed by Louis Pasteur in 1861. In 1905, Schardinger found that acetone could similarly be
produced. Fernbach's work of 1911 involved the use of potato starch as a feedstock in the production of butanol. Industrial exploitation of ABE
fermentation started in 1916 with Chaim Weizmann's isolation of Clostridium acetobutylicum, as described in U.S. patent 1315585.
In order to make ABE fermentation profitable, many in-situ product recovery systems have been developed. These include gas stripping, pervaporation,
membrane extraction, adsorption, andreverse osmosis. However, at this time none of them have been implemented at an industrial scale.
For gas stripping, the most common gases used are the off-gases from the fermentation itself, a mixture of carbon dioxide and hydrogen gas.
ABE fermentation, however, is not profitable when compared to the production of these solvents from petroleum. As such there are no currently operating
ABE plants. During the 1950s and 1960s, ABE fermentation was replaced by petroleum chemical plants. Due to different raw materials costs, ABE
fermentation was viable in South Africa until the early 1980s, with the last plant closing in 1983.

2-Dark fermentationFrom Wikipedia, the free encyclopedia
Dark fermentation is the fermentative conversion of organic substrate to biohydrogen. It is a complex process manifested by diverse group of bacteria by
a series of biochemical reactions involving three steps similar to anaerobic conversion. Dark fermentation differs from photofermentation because it
proceeds without the presence of light.
Fermentative/hydrolytic microorganisms hydrolyze complex organic polymers to monomers which are further converted to a mixture of lower molecular
weight organic acids and alcohols by obligatory producing acidogenic bacteria.
Utilization of wastewater as a potential substrate for biohydrogen production has been drawing considerable interest in recent years especially in the dark
fermentation process. Industrial wastewater as a fermentative substrate for H2 production addresses most of the criteria required for substrate selection
viz., availability, cost and biodegradability (Angenent, et al., 2004; Kapdan and Kargi, 2006). Chemical wastewater (Venkata Mohan, et al., 2007a,b), cattle
wastewater (Tang, et al., 2008), dairy process wastewater (Venkata Mohan, et al. 2007c), starch hydrolysate wastewater (Chen, et al., 2008) and
designed synthetic wastewater (Venkata Mohan, et al., 2007a,2008b) have been reported to produce biohydrogen apart from wastewater treatment from
dark fermentation processes using selectively enriched mixed cultures under acidophilic conditions. Various wastewaters viz., paper mill wastewater
(Idania, et al., 2005), starch effluent (Zhang, et al., 2003), food processing wastewater (Shin et al., 2004, van Ginkel, et al., 2005), domestic wastewater
(Shin, et al., 2004, 2008e), rice winery wastewater (Yu et al., 2002), distillery and molasses based wastewater (Ren, et al., 2007, Venkata Mohan, et al.,
2008a), wheat straw wastes (Fan, et al., 2006) and palm oil mill wastewater (Vijayaraghavan and Ahmed, 2006) were also studied as fermentable
substrates for H2 production along with wastewater treatment. Using wastewater as a fermentable substrate facilitates both wastewater treatment apart
from H2 production. The efficiency of the dark fermentative H2 production process was found to depend on pre-treatment of the mixed consortia used as

a biocatalyst, operating pH, and organic loading rate apart from wastewater characteristics (Venkata Mohan, et al., 2007d,2008c,d, Vijaya Bhaskar, et al.,
2008d).
In spite of its advantages, the main challenge observed with fermentative H2 production processes are relatively low energy conversion efficiency from the
organic source. Typical H2 yields range from 1 to 2 mol of H2/mol of glucose, which results in 80-90% of the initial COD remaining in the wastewater in the
form of various volatile organic acids (VFAs) and solvents, such as acetic, propionic, and butyric acids and ethanol . Even under optimal conditions about
60-70% of the original organic matter remains in solution. Bioaugmentation with selectively enriched acidogenicconsortia to enhance H2 production was
also reported (Venkata Mohan, et al., 2007b). Generation and accumulation of soluble acid metabolites causes a sharp drop in the system pH and inhibits
the H2 production process. Usage of unutilized carbon sources present in acidogenic process for additional biogas production sustains the practical
applicability of the process. One way to utilize/recover the remaining organic matter in a usable form is to produce additional H2 by terminal integration
of photo-fermentative processes of H2 production (Venkata Mohan, et al., 2008e) and methane by integrating acidogenic processes to
terminal methanogenic processes.
[edit]See also
2.1-Biogas
2.2-Biohydrogen
2.3-Biological hydrogen production (Algae)
2.4-Biomass
2.5-Electrohydrogenesis
2.6-Fermentation (biochemistry)
2.7-Microbial fuel cell

2.1 BiogasFrom Wikipedia, the free encyclopedia

Pipes carrying biogas (foreground), natural gasand condensate
Sustainable energy
Renewable energy
Anaerobic digestion
Biomass
Geothermal
Hydroelectricity
Solar
Tidal
Wind
Energy conservation

Cogeneration
Energy efficiency
Geothermal
Green building
Microgeneration
Passive solar
Organic Rankine cycle
Sustainable transport
Carbon neutral fuel
Electric vehicle
Green vehicle
Plug-in hybrid
Environment portal
V
T

E
Biogas typically refers to a gas produced by breakdown of organic matter in the absence of oxygen. Organic waste such as dead plant and animal
material, animal feces, and kitchen waste can be converted into a gaseous fuel called biogas. Biogas originates from biogenic material and is a type of bio
fuel.
Biogas is produced by the anaerobic digestion or fermentation of biodegradable materials such as biomass, manure, sewage, municipal waste,green
waste, plant material, and crops.[1] Biogas comprises primarily methane (CH4) and carbon dioxide (CO2) and may have small amounts ofhydrogen
sulphide (H2S), moisture and siloxanes.
The gases methane, hydrogen, and carbon monoxide (CO) can be combusted or oxidized with oxygen. This energy release allows biogas to be used as a
fuel. Biogas can be used as a fuel in any country for any heating purpose, such as cooking. It can also be used in anaerobic digesters where it is typically
used in a gas engine to convert the energy in the gas into electricity and heat.[2] Biogas can be compressed, much like natural gas, and used to
power motor vehicles. In the UK, for example, biogas is estimated to have the potential to replace around 17% of vehicle fuel.[3]Biogas is a renewable fuel
so it qualifies for renewable energy subsidies in some parts of the world. Biogas can also be cleaned and upgraded to natural gas standards when it
becomes bio methane.
Contents
[hide]
1 Production
2 Composition
3 Benefits
4 Applications
o 4.1 Biogas upgrading
o 4.2 Biogas gas-grid injection
o 4.3 Biogas in transport

5 Legislation
6 Development around the world
o 6.1 United States
o 6.2 UK
o 6.3 Germany
o 6.4 Indian subcontinent
o 6.5 China
o 6.6 In developing nations
7 In popular culture
8 See also
9 References
10 Further reading
11 External links
[edit]Production
Main article: anaerobic digestion
Biogas production in rural Germany

Bio gas is practically produced as landfill gas (LFG) or digested gas. A bio gas plant is the name often given to an anaerobic digester that treats farm
wastes or energy crops. Bio gas can be produced using anaerobic digesters. These plants can be fed with energy crops such as maize silage
orbiodegradable wastes including sewage sludge and food waste. During the process, as an air-tight tank transforms biomass waste into methane
producing renewable energy that can be used for heating, electricity, and many other operations that use any variation of an internal combustion engine,
such as GE Backbencher gas engines.[4] There are two key processes: Mesophilic and Thermophilic digestion.[5] In experimental work at University of
Alaska Fairbanks, a 1000-litre digester using psychrophiles harvested from "mud from a frozen lake in Alaska" has produced 200–300 liters of methane
per day, about 20–30% of the output from digesters in warmer climates.[6]
Landfill gas is produced by wet organic waste decomposing under anaerobic conditions in a landfill.[7][8] The waste is covered and mechanically
compressed by the weight of the material that is deposited from above. This material prevents oxygen exposure thus allowing anaerobic microbes to
thrive. This gas builds up and is slowly released into the atmosphere if the landfill site has not been engineered to capture the gas. Landfill gas is
hazardous for three key reasons. Landfill gas becomes explosive when it escapes from the landfill and mixes with oxygen. The lower explosive limit is 5%
methane and the upper explosive limit is 15% methane.[9] The methane contained within biogas is 20 times more potent as a greenhouse gas than is
carbon dioxide. Therefore, uncontained landfill gas, which escapes into the atmosphere may significantly contribute to the effects of global warming. In
addition, landfill gas impact in global warming, volatile organic compounds (VOCs) contained within landfill gas contribute to the formation
of photochemical smog.
[edit]Composition
Typical composition of biogas[10]
Compound Chem %
Methane CH4 50–75

Carbon dioxide CO2 25–50
Nitrogen N2 0–10
Hydrogen H2 0–1
Hydrogen sulphide H2S 0–3
Oxygen O2 0–0
The composition of biogas varies depending upon the origin of the anaerobic digestion process. Landfill gas typically has methane concentrations around
50%. Advanced waste treatment technologies can produce biogas with 55–75% methane,[11] which for reactors with free liquids can be increased to 80-
90% methane using in-situ gas purification techniques[12] As-produced, biogas also contains water vapor. The fractional volume of water vapor is a
function of biogas temperature; correction of measured gas volume for both water vapor content and thermal expansion is easily done via a simple
mathematic algorithm[13] which yields the standardized volume of dry biogas.
In some cases, biogas contains siloxanes. These siloxanes are formed from the anaerobic decomposition of materials commonly found in soaps and
detergents. During combustion of biogas containing siloxanes, silicon is released and can combine with free oxygen or various other elements in
thecombustion gas. Deposits are formed containing mostly silica (SiO2) or silicates (SixOy) and can also contain calcium, sulfur, zinc, phosphorus.
Such white mineral deposits accumulate to a surface thickness of several millimeters and must be removed by chemical or mechanical means.
Practical and cost-effective technologies to remove siloxanes and other biogas contaminants are currently available.[14]
[edit]Benefits

When biogas is used, many advantages arise. In North America, utilization of biogas would generate enough electricity to meet up to three percent of the
continent's electricity expenditure. In addition, biogas could potentially help reduce global climate change. Normally, manure that is left to decompose
releases two main gases that cause global climate change: nitrogen dioxide andmethane. Nitrogen dioxide (NO2) warms the atmosphere 310 times more
than carbon dioxide and methane 21 times more than carbon dioxide. By converting cow manure into methane biogas viaanaerobic digestion, the millions
of cows in the United States would be able to produce one hundred billion kilowatt hours of electricity, enough to power millions of homes across the
United States. In fact, one cow can produce enough manure in one day to generate three kilowatt hours of electricity; only 2.4 kilowatt hours of electricity
are needed to power a single one hundred watt light bulb for one day.[15] Furthermore, by converting cow manure into methane biogas instead of letting it
decompose, global warming gases could be reduced by ninety-nine million metric tons or four percent.[16] In Nepal biogas is being used as a reliable
source of rural energy.
[edit]Applications
A biogas bus in Linköping, Sweden
Biogas can be utilized for electricity production on sewage works,[17] in a CHP gas engine, where the waste heat from the engine is conveniently used for
heating the digester; cooking; space heating; water heating; and process heating. If compressed, it can replace compressed natural gasfor use in
vehicles, where it can fuel an internal combustion engine or fuel cells and is a much more effective displacer of carbon dioxide than the normal use in on-
site CHP plants. [18]
Methane within biogas can be concentrated via a biogas upgrader to the same standards as fossil natural gas, which itself has had to go through a
cleaning process, and becomes biomethane. If the local gas network allows for this, the producer of the biogas may utilize the local gas distribution

networks. Gas must be very clean to reach pipeline quality, and must be of the correct composition for the local distribution network to accept. Carbon
dioxide, water, hydrogen sulfide, and particulates must be removed if present.
[edit]Biogas upgrading
Raw biogas produced from digestion is roughly 60% methane and 29% CO2 with trace elements of H2S, and is not high quality enough to be used as fuel
gas for machinery. The corrosive nature of H2S alone is enough to destroy the internals of a plant. The solution is the use of biogas upgrading or
purification processes whereby contaminants in the raw biogas stream are absorbed or scrubbed, leaving more methane per unit volume of gas. There
are four main methods of biogas upgrading, these include water washing, pressure swing absorption, selexol absorption, and amine gas treating.[19] The
most prevalent method is water washing where high pressure gas flows into a column where the carbon dioxide and other trace elements are scrubbed by
cascading water running counter-flow to the gas. This arrangement could deliver 98% methane with manufacturers guaranteeing maximum 2% methane
loss in the system. It takes roughly between 3-6% of the total energy output in gas to run a biogas upgrading system.
[edit]Biogas gas-grid injection
Gas-grid injection is the injection of biogas into the methane grid (natural gas grid). Injections includes biogas:[20] until the breakthrough of micro combined
heat and power two-thirds of all the energy produced by biogas power plants was lost (the heat), using the grid to transport the gas to customers, the
electricity and the heat can be used for on-site generation[21] resulting in a reduction of losses in the transportation of energy. Typical energy losses in
natural gas transmission systems range from 1–2%. The current energy losses on a large electrical system range from 5–8%.[22]
[edit]Biogas in transport
If concentrated and compressed, it can also be used in vehicle transportation. Compressed biogas is becoming widely used in Sweden, Switzerland, and
Germany. A biogas-powered train has been in service in Sweden since 2005.[23][24] Biogas also powers automobiles and in 1974, a British documentary
film entitled Sweet as a Nut detailed the biogas production process from pig manure, and how the biogas fueled a custom-adapted combustion
engine.[25][26] In 2007, an estimated 12,000 vehicles were being fueled with upgraded biogas worldwide, mostly in Europe.[27]
[edit]Legislation
The European Union presently has some of the strictest legislation regarding waste management and landfill sites called the Landfill Directive.[citation
needed] The United States legislates against landfill gas as it contains VOCs. The United States Clean Air Act and Title 40 of the Code of Federal

Regulations (CFR) requires landfill owners to estimate the quantity of non-methane organic compounds (NMOCs) emitted. If the estimated NMOC
emissions exceeds 50 tonnes per year, the landfill owner is required to collect the landfill gas and treat it to remove the entrained NMOCs. Treatment of
the landfill gas is usually by combustion. Because of the remoteness of landfill sites, it is sometimes not economically feasible to produce electricity from
the gas. However, countries such as the United Kingdom and Germany now have legislation in force that provides farmers with long-term revenue and
energy security.[28]
[edit]Development around the world
[edit]United States
With the many benefits of biogas, it is starting to become a popular source of energy and is starting to be utilized in the United States more. In 2003, the
United States consumed 147 trillion BTU of energy from "landfill gas", about 0.6% of the total U.S. natural gas consumption.[27] Methane biogas derived
from cow manure is also being tested in the U.S. According to a 2008 study, collected by the Science and Children magazine, methane biogas from cow
manure would be sufficient to produce 100 billion kilowatt hours enough to power millions of homes across America. Furthermore, methane biogas has
been tested to prove that it can reduce 99 million metric tons of greenhouse gas emissions or about 4% of the greenhouse gases produced by the United
States.[29]
In Vermont, for example, biogas generated on dairy farms around the state is included in the CVPS Cow Power program. The Cow Power program is
offered by Central Vermont Public Service Corporation as a voluntary tariff. Customers can elect to pay a premium on their electric bill, and that premium
is passed directly to the farms in the program. In Sheldon, Vermont, Green Mountain Dairy has provided renewable energy as part of the Cow Power
program. It all started when the brothers who own the farm, Bill and Brian Rowell, wanted to address some of the manure management challenges faced
by dairy farms, including manure odor, and nutrient availability for the crops they need to grow to feed the animals. They installed an anaerobic digester to
process the cow and milking center waste from their nine hundred and fifty cows to produce renewable energy, a bedding to replace sawdust, and a plant
friendly fertilizer. The energy and environmental attributes are sold. On average, the system run by the Rowell brothers produces enough electricity to
power three hundred to three hundred fifty other homes. The generator capacity is about three hundred kiloWatts.[30]
In Hereford, Texas, cow manure is being used to power an ethanol power plant. By switching to methane biogas, the ethanol power plant has saved one
thousand barrels of oil a day. Overall, the power plant has reduced transportation costs and will be opening many more jobs for future power plants that
will be relying on biogas.[31]

[edit]UK
There are currently around 60 non-sewage biogas plants in the UK, most are on-farm, but some larger facilities exist off-farm, which are taking food and
consumer wastes.[32]
On 5 October 2010, biogas was injected into the UK gas grid for the first time. Sewage from over 30,000 Oxfordshire homes is sent to Didcot sewage
treatment works, where it is treated in an anaerobic digestor to produce biogas, which is then cleaned to provide gas for approximately 200 homes.[33]
[edit]Germany
Germany is Europe's biggest biogas producer[34] as it is the market leader in biogas technology.[35] In 2010 there were 5,905 biogas plants operating
throughout the whole country, in which Lower Saxony, Bavaria and the eastern federal states are the main regions.[36] Most of these plants are employed
as power plants. Usually the biogas plants are directly connected with a CHP which produces electric power by burning the bio methane. The electrical
power is then fed into the public power grid.[37] In 2010, the total installed electrical capacity of these power plants was 2,291 MW.[36] The electricity supply
was approximately 12.8 TWh, which is 12.6 per cent of the total generated renewable electricity.[38] Biogas in Germany is primarily extracted by the co-
fermentation of energy crops (called ‘NawaRo’, an abbreviation of ‘nachwachsende Rohstoffe’, which is German for renewable resources) mixed with
manure, the main crop utilized is corn. Organic waste and industrial and agricultural residues such as waste from the food industry are also used for
biogas generation.[39] In this respect, Biogas production in Germany differs significantly from the UK, where biogas generated from landfill sites is most
common.[34]
Biogas production in Germany has developed rapidly over the last 20 years. The main reason for this development is the legally created frameworks.
Governmental support of renewable energies started at the beginning of the 1990s with the Law on Electricity Feed (StrEG). This law guaranteed the
producers of energy from renewable sources the feed into the public power grid, thus the power companies were forced to take all produced energy from
independent private producers of green energy.[40] In 2002 the Law on Electricity Feed was replaced by the Renewable Energy Source Act (EEG). This
law even guaranteed a fixed compensation for the produced electric power over 20 years. The amount of ca. 0.08 Euro gave particular farmers the
opportunity to become an energy supplier and gaining a further source of income in the same place.[39] The German agricultural biogas production was
given a further push in 2004 by implementing the so-called NawaRo-Bonus. This is a special bonus payment given for the usage of renewable resources
i.e. energy crops.[41] In 2007 the German government stressed its intention to invest further effort and support in improving the renewable energy supply to
provide an answer on growing climate challenges and increasing oil prices by the ‘Integrated Climate and Energy Programme’.

This continual trend of renewable energy promotion induces a number of challenges facing the management and organisation of renewable energy supply
that has also several impacts on the biogas production.[42] The first challenge to be noticed is the high area-consuming of the biogas electric power supply.
In 2011 energy crops for biogas production consumed an area of circa 800,000 ha in Germany.[43] This high demand of agricultural areas generates new
competitions with the food industries that did not exist yet. Moreover new industries and markets were created in predominately rural regions entailing
different new players with an economic, political and civil background. Their influence and acting has to be governed to gain all advantages this new
source of energy is offering. Finally biogas will furthermore play an important role in the German renewable energy supply if good governance is
focused.[42]
[edit]Indian subcontinent
In India, Nepal, Pakistan and Bangladesh biogas produced from the anaerobic digestion of manure in small-scale digestion facilities is called gobar gas; it
is estimated that such facilities exist in over two million households in India and in thousands in Pakistan, particularly North Punjab, due to the thriving
population of livestock. The digester is an airtight circular pit made of concrete with a pipe connection. The manure is directed to the pit, usually directly
from the cattle shed. The pit is then filled with a required quantity of wastewater. The gas pipe is connected to the kitchen fireplace through control valves.
The combustion of this biogas has very little odour or smoke. Owing to simplicity in implementation and use of cheap raw materials in villages, it is one of
the most environmentally sound energy sources for rural needs. One type of these system is the Sintex Digester. Some designs use vermiculture to
further enhance the slurry produced by the biogas plant for use as compost.[44] In order to create awareness and associate the people interested in biogas,
an association "Indian Biogas Association" (www.biogas-India.com)[45] is formed. The “Indian Biogas Association” aspires to be a unique blend of;
nationwide operators, manufacturers and planners of biogas plants, and representatives from science and research. The association was founded in 2010
and is now ready to start mushrooming. The sole motto of the association is “propagating Biogas in a sustainable way”.
The Deenabandhu Model is a new biogas-production model popular in India. (Deenabandhu means "friend of the helpless.") The unit usually has a
capacity of 2 to 3 cubic metres. It is constructed using bricks or by a ferrocement mixture. In India, the brick model costs slightly more than the
ferrocement model; however, India's Ministry of New and Renewable Energy offers some subsidy per model constructed.
In Pakistan, the Rural Support Programmes Network is running the Pakistan Domestic Biogas Programme[46] which has installed over 1500 biogas plants
and has trained in excess of 200 masons on the technology and aims to develop the Biogas Sector in Pakistan.

Also PAK-Energy Solution[46] has taken the most innovative and responsible initiatives in biogas technology. In this regard, the company is also awarded
by 1st prize in "Young Entrepreneur Business Plan Challenge" jointly organized by Punjab Govt. & LCCI.[46][47][48][49] They have designed and developed
Uetians Hybrid Model, in which they have combined fixed dome and floating drums and Uetians Triplex Model. Moreover, Pakistan Dairy Development
Company has also taken an initiative to develop this kind of alternative source of energy for Pakistani farmers. Biogas is now running diesel engines, gas
generators, kitchen ovens, geysers, and other utilities in Pakistan. In Nepal, the government provides subsidies to build biogas plant.
[edit]China
The Chinese have been experimenting with the applications of biogas since 1958. Around 1970, China had installed 6,000,000 digesters in an effort to
make agriculture more efficient. During the last years the technology has met high growth rates. This seems to be the earliest developments in generating
biogas from agricultural waste.
[edit]In developing nations
Domestic biogas plants convert livestock manure and night soil into biogas and slurry, the fermented manure. This technology is feasible for small holders
with livestock producing 50 kg manure per day, an equivalent of about 6 pigs or 3 cows. This manure has to be collectable to mix it with water and feed it
into the plant. Toilets can be connected. Another precondition is the temperature that affects the fermentation process. With an optimum at 36 C° the
technology especially applies for those living in a (sub) tropical climate. This makes the technology for small holders in developing countries often suitable.
Simple sketch of household biogas plant
Depending on size and location, a typical brick made fixed dome biogas plant can be installed at the yard of a rural household with the investment
between 300 to 500 US $ in Asian countries and up to 1400 US $ in the African context. A high quality biogas plant needs minimum maintenance costs

and can produce gas for at least 15–20 years without major problems and re-investments. For the user, biogas provides clean cooking energy, reduces
indoor air pollution, and reduces the time needed for traditional biomass collection, especially for women and children. The slurry is a clean organic
fertilizer that potentially increases agricultural productivity.
Domestic biogas technology is a proven and established technology in many parts of the world, especially Asia.[50] Several countries in this region have
embarked on large-scale programmes on domestic biogas, such as China[51][52] and India. The Netherlands Development Organisation, SNV,[53] supports
national programmes on domestic biogas that aim to establish commercial-viable domestic biogas sectors in which local companies market, install and
service biogas plants for households. In Asia, SNV is working in Nepal,[54] Vietnam,[55]Bangladesh,[56] Bhutan, Cambodia,[56] Lao PDR,[57] Pakistan[58] and
Indonesia,[59] and in Africa; Rwanda,[60] Senegal, Burkina Faso, Ethiopia,[61] Tanzania,[62] Uganda, Kenya, Benin and Cameroon.
[edit]In popular culture
In the 1985 Australian film Mad Max Beyond Thunderdome the post-apocalyptic settlement Bartertown is powered by a central biogas system based upon
a piggery. As well as providing electricity, methane is used to power Bartertown's vehicles.
[edit]See also
Sustainable development portal
Energy portal
2.1.1-Anaerobic digestion
2.1.2-Biodegradability
2.1.3-Bioenergy
2.1.4-Biofuel
2.1.5-Biohydrogen
2.1.6-Landfill gas monitoring
2.1.7-MSW/LFG (municipal solid waste and landfill gas)

2.1.8-Natural gas
2.1.9-Renewable energy
2.1.10-Renewable natural gas
2.1.11-Relative cost of electricity generated by different sources
2.1.12-Tables of European biogas utilisation
Thermal hydrolysis
Waste management
2.1.1-Anaerobic digestion

2.1.1-Anaerobic digestionFrom Wikipedia, the free encyclopedia
Anaerobic digestion and regenerative thermal oxidiser component of Lübeck mechanical biological treatment plant in Germany, 2007
Sustainable energy
Renewable energy
Anaerobic digestion
Biomass
Geothermal

Hydroelectricity
Solar
Tidal
Wind
Energy conservation
Cogeneration
Energy efficiency
Geothermal
Green building
Microgeneration
Passive solar
Organic Rankine cycle
Sustainable transport
Carbon neutral fuel
Electric vehicle
Green vehicle

Plug-in hybrid
Environment portal
V
T
E
Renewable energy
Biofuel
Biomass
Geothermal
Hydroelectricity
Solar energy

Tidal power
Wave power
Wind power
Topics by country
V
T
E
Anaerobic digestion is a series of processes in which microorganisms break down biodegradable material in the absence of oxygen.[1] It is used for
industrial or domestic purposes to manage waste and/or to release energy. Much of the fermentation used industrially to produce food and drink products,
as well as home fermentation, uses anaerobic digestion. Silage is produced by anaerobic digestion.
The digestion process begins with bacterial hydrolysis of the input materials to break down insoluble organic polymers, such ascarbohydrates, and make
them available for other bacteria. Acidogenic bacteria then convert the sugars and amino acids into carbon dioxide,hydrogen, ammonia, and organic
acids. Acetogenic bacteria then convert these resulting organic acids into acetic acid, along with additional ammonia, hydrogen, and carbon dioxide.
Finally, methanogens convert these products to methane and carbon dioxide.[2] The methanogenic archaea populations play an indispensable role in
anaerobic wastewater treatments.[3]
It is used as part of the process to treat biodegradable waste and sewage sludge. As part of an integrated waste management system, anaerobic
digestion reduces the emission of landfill gas into the atmosphere. Anaerobic digesters can also be fed with purpose-grown energy crops, such as
maize.[4]

Anaerobic digestion is widely used as a source of renewable energy. The process produces a biogas, consisting of methane, carbon dioxide and traces of
other ‘contaminant’ gases.[1] This biogas can be used directly as cooking fuel, in combined heat and power gas engines[5] or upgraded to natural gas-
quality biomethane. The use of biogas as a fuel helps to replace fossil fuels. The nutrient-rich digestate also produced can be used asfertilizer.
Anaerobic digestion facilities have been recognized by the United Nations Development Programme as one of the most useful decentralized sources of
energy supply, as they are less capital-intensive than large power plants.[6] With increased focus on climate change mitigation, the re-use of waste as a
resource and new technological approaches which have lowered capital costs, anaerobic digestion has in recent years received increased attention
among governments in a number of countries, among these the United Kingdom (2011),[7] Germany [8] and Denmark (2011).[9]
Contents
[hide]
1 History
2 Process
o 2.1 Process stages
o 2.2 Configuration
2.2.1 Batch or continuous
2.2.2 Temperature
2.2.3 Solids content
2.2.4 Complexity
o 2.3 Residence time
3 Feedstocks
o 3.1 Moisture content
o 3.2 Contamination
o 3.3 Substrate composition
4 Applications

o 4.1 Waste treatment
o 4.2 Power generation
o 4.3 Grid injection
o 4.4 Fertiliser and soil conditioner
o 4.5 Cooking gas
5 Products
o 5.1 Biogas
o 5.2 Digestate
o 5.3 Wastewater
6 See also
7 References
8 External links
[edit]History

Gas street lamp
Scientific interest in the manufacturing of gas produced by the natural decomposition of organic matter was first reported in the 17th century by Robert
Boyle and Stephen Hale, who noted that flammable gas was released by disturbing the sediment of streams and lakes.[10] In 1808, Sir Humphry
Davy determined that methane was present in the gases produced by cattle manure.[11][12] The first anaerobic digester was built by a leper
colony in Bombay, India, in 1859. In 1895, the technology was developed in Exeter, England, where a septic tank was used to generate gas for the sewer
gas destructor lamp, a type of gas lighting. Also in England, in 1904, the first dual-purpose tank for both sedimentation and sludge treatment was installed
in Hampton. In 1907, in Germany, a patent was issued for the Imhoff tank,[13] an early form of digester.[citation needed]

Through scientific research, anaerobic digestion gained academic recognition in the 1930s. This research led to the discovery of anaerobic bacteria, the
microorganisms that facilitate the process. Further research was carried out to investigate the conditions under which methanogenic bacteria were able to
grow and reproduce.[14] This work was developed during World War II, during which in both Germany and France, there was an increase in the application
of anaerobic digestion for the treatment of manure.
[edit]Process
Main article: Anaerobic respiration
Many microorganisms are involved in the process of anaerobic digestion, including acetic acid-forming bacteria (acetogens) and methane-
forming archaea(methanogens). These organisms feed upon the initial feedstock, which undergoes a number of different processes, converting it to
intermediate molecules, including sugars, hydrogen, and acetic acid, before finally being converted to biogas.[15]
Different species of bacteria are able to survive at different temperature ranges. Ones living optimally at temperatures between 35 and 40 °C are
called mesophiles or mesophilic bacteria. Some of the bacteria can survive at the hotter and more hostile conditions of 55 to 60 °C; these are
called thermophiles or thermophilic bacteria.[16] Methanogens come from the domain of archaea. This family includes species that can grow in the hostile
conditions of hydrothermal vents, so are more resistant to heat, and can, therefore, operate at high temperatures, a property unique to thermophiles.[17]
As with aerobic systems, the bacteria, the growing and reproducing microorganisms within anaerobic systems, require a source of elemental oxygen to
survive,[18]but in anaerobic systems, there is an absence of gaseous oxygen. Gaseous oxygen is prevented from entering the system through physical
containment in sealed tanks. Anaerobes access oxygen from sources other than the surrounding air, which can be the organic material itself or may be
supplied by inorganic oxides from within the input material. When the oxygen source in an anaerobic system is derived from the organic material itself, the
'intermediate' end products are primarily alcohols, aldehydes, and organic acids, plus carbon dioxide. In the presence of specialised methanogens, the
intermediates are converted to the 'final' end products of methane, carbon dioxide, and trace levels of hydrogen sulfide.[19] In an anaerobic system, the
majority of the chemical energy contained within the starting material is released by methanogenic bacteria as methane.[10]
Populations of anaerobic microorganisms typically take a significant period of time to establish themselves to be fully effective. Therefore, common
practice is to introduce anaerobic microorganisms from materials with existing populations, a process known as "seeding" the digesters, typically
accomplished with the addition of sewage sludge or cattle slurry.[20]

[edit]Process stages
The key process stages of anaerobic digestion
There are four key biological and chemical stages of anaerobic digestion:[12]
1. Hydrolysis
2. Acidogenesis
3. Acetogenesis
4. Methanogenesis
In most cases, biomass is made up of large organic polymers. For the bacteria in anaerobic digesters to access the energy potential of the material, these
chains must first be broken down into their smaller constituent parts. These constituent parts, or monomers, such as sugars, are readily available to other
bacteria. The process of breaking these chains and dissolving the smaller molecules into solution is called hydrolysis. Therefore, hydrolysis of these high-
molecular-weight polymeric components is the necessary first step in anaerobic digestion.[21] Through hydrolysis the complex organic molecules are
broken down into simple sugars, amino acids, and fatty acids.
Acetate and hydrogen produced in the first stages can be used directly by methanogens. Other molecules, such as volatile fatty acids (VFAs) with a chain
length greater than that of acetate must first be catabolised into compounds that can be directly used by methanogens.[22]

The biological process of acidogenesis results in further breakdown of the remaining components by acidogenic (fermentative) bacteria. Here, VFAs are
created, along with ammonia, carbon dioxide, and hydrogen sulfide, as well as other byproducts.[23] The process of acidogenesis is similar to the way milk
sours.
The third stage of anaerobic digestion is acetogenesis. Here, simple molecules created through the acidogenesis phase are further digested by acetogens
to produce largely acetic acid, as well as carbon dioxide and hydrogen.[24]
The terminal stage of anaerobic digestion is the biological process of methanogenesis. Here, methanogens use the intermediate products of the preceding
stages and convert them into methane, carbon dioxide, and water. These components make up the majority of the biogas emitted from the system.
Methanogenesis is sensitive to both high and low pHs and occurs between pH 6.5 and pH 8.[25] The remaining, indigestible material the microbes cannot
use and any dead bacterial remains constitute the digestate.
A simplified generic chemical equation for the overall processes outlined above is as follows:
C6H12O6 → 3CO2 + 3CH4
[edit]Configuration
Farm-based maize silage digester located nearNeumünster in Germany, 2007 - the green, inflatable biogas holder is shown on top of the digester.

Anaerobic digesters can be designed and engineered to operate using a number of different process configurations:
Batch or continuous
Temperature: Mesophilic or thermophilic
Solids content: High solids or low solids
Complexity: Single stage or multistage
[edit]Batch or continuous
Anaerobic digestion can be performed as a batch process or a continuous process.
In a batch system biomass is added to the reactor at the start of the process. The reactor is then sealed for the duration of the process.
In its simplest form batch processing needs inoculation with already processed material to start the anaerobic digestion. In a typical scenario, biogas
production will be formed with a normal distribution pattern over time. Operator can use this fact to determine when they believe the process of digestion
of the organic matter has completed. There can be severe odour issues if a batch reactor is opened and emptied before the process is well completed.
A more advanced type of batch approach has limited the odour issues by integrating anaerobic digestion with in-vessel composting. In this approach
inoculation takes place through the use of recirculated degasified percolate. After anaerobic digestion has completed, the biomass is kept in the reactor
which is then used for in-vessel composting before it is opened [26]
As the batch digestion is simple and requires less equipment and lower levels of design work, it is typically a cheaper form of digestion.[27] Using more
than one batch reactor at a plant can ensure constant production of biogas.
In continuous digestion processes, organic matter is constantly added (continuous complete mixed) or added in stages to the reactor (continuous plug
flow; first in – first out). Here, the end products are constantly or periodically removed, resulting in constant production of biogas. A single or multiple
digesters in sequence may be used. Examples of this form of anaerobic digestion include continuous stirred-tank reactors, upflow anaerobic sludge
blankets, expanded granular sludge beds and internal circulation reactors.[28][29]
[edit]Temperature
The two conventional operational temperature levels for anaerobic digesters are determined by the species of methanogens in the digesters:[30]

Mesophilic digestion takes place optimally around 30 to 38 °C, or at ambient temperatures between 20 and 45 °C, where mesophiles are the
primary microorganism present.
Thermophilic digestion takes place optimally around 49 to 57 °C, or at elevated temperatures up to 70 °C, where thermophiles are the primary
microorganisms present.
A limit case has been reached in Bolivia, with anaerobic digestion in temperature working conditions of less than 10 °C. The anaerobic process is very
slow, taking more than three times the normal mesophilic time process.[31] In experimental work at University of Alaska Fairbanks, a 1000 litre digester
using psychrophiles harvested from "mud from a frozen lake in Alaska" has produced 200–300 litres of methane per day, about 20 to 30% of the output
from digesters in warmer climates.[32]
Mesophilic species outnumber thermophiles, and they are also more tolerant to changes in environmental conditions than thermophiles. Mesophilic
systems are, therefore, considered to be more stable than thermophilic digestion systems.
Though thermophilic digestion systems are considered to be less stable and the energy input is higher, more energy is removed from the organic matter.
The increased temperatures facilitate faster reaction rates and, hence, faster gas yields. Operation at higher temperatures facilitates greater sterilization of
the end digestate. In countries where legislation, such as the Animal By-Products Regulations in the European Union, requires end products to meet
certain levels of reduction in the amount of bacteria in the output material, this may be a benefit.[33]
Certain processes shred the waste finely and use a thermal pretreatment stage (hygienisation) to significantly enhance the gas output of the following
standard mesophilic stage. The hygienisation process is also applied to reduce the pathogenic micro-organisms in the feedstock. Hygienisation may be
achieved by using a Landia BioChop hygienisation unit [34] or similar method of combined heat treatment and solids maceration.
A drawback of operating at thermophilic temperatures is that more heat energy input is required to achieve the correct operational temperatures, which
may not be outweighed by the increase in the outputs of biogas from the systems. Therefore, it is important to consider an energy balance for these
systems.
[edit]Solids content
In a typical scenario, three different operational parameters are associated with the solids content of the feedstock to the digesters:

High solids (dry—stackable substrate)
High solids (wet—pumpable substrate)
Low solids (wet—pumpable substrate)
High solids (dry) digesters are designed to process materials with a solids content between 25 and 40%. Unlike wet digesters that process pumpable
slurries, high solids (dry – stackable substrate) digesters are designed to process solid substrates without the addition of water. The primary styles of dry
digesters are continuous vertical plug flow and batch tunnel horizontal digesters. Continuous vertical plug flow digesters are upright, cylindrical tanks
where feedstock is continuously fed into the top of the digester, and flows downward by gravity during digestion. In batch tunnel digesters, the feedstock is
deposited in tunnel-like chambers with a gas-tight door. Neither approach has mixing inside the digester. The amount of pretreatment, such as
contaminant removal, depends both upon the nature of the waste streams being processed and the desired quality of the digestate. Size reduction
(gringing) is beneficial in continuous vertical systems, as it accelerates digestion, while batch systems avoid grinding and instead require structure (e.g.
yard waste) to reduce compaction of the stacked pile. Continuous vertical dry digesters have a smaller footprint due to the shorter effective retention time
and vertical design.
Wet digesters can be designed to operate in either a high-solids content, with a total suspended solids (TSS) concentration greater than ~20%, or a low-
solids concentration less than ~15%.[35][36]
High solids (wet) digesters process a thick slurry that requires more energy input to move and process the feedstock. The thickness of the material may
also lead to associated problems with abrasion. High solids digesters will typically have a lower land requirement due to the lower volumes associated
with the moisture.[citation needed] High solids digesters also require correction of conventional performance calculations (e.g. gas production, retention time,
kinetics, etc.) originally based on very dilute sewage digestion concepts, since larger fractions of the feedstock mass are potentially convertible to
biogas.[37]
Low solids (wet) digesters can transport material through the system using standard pumps that require significantly lower energy input. Low solids
digesters require a larger amount of land than high solids due to the increased volumes associated with the increased liquid-to-feedstock ratio of the
digesters. There are benefits associated with operation in a liquid environment, as it enables more thorough circulation of materials and contact between
the bacteria and their food. This enables the bacteria to more readily access the substances on which they are feeding, and increases the rate of gas
production.[citation needed]
[edit]Complexity
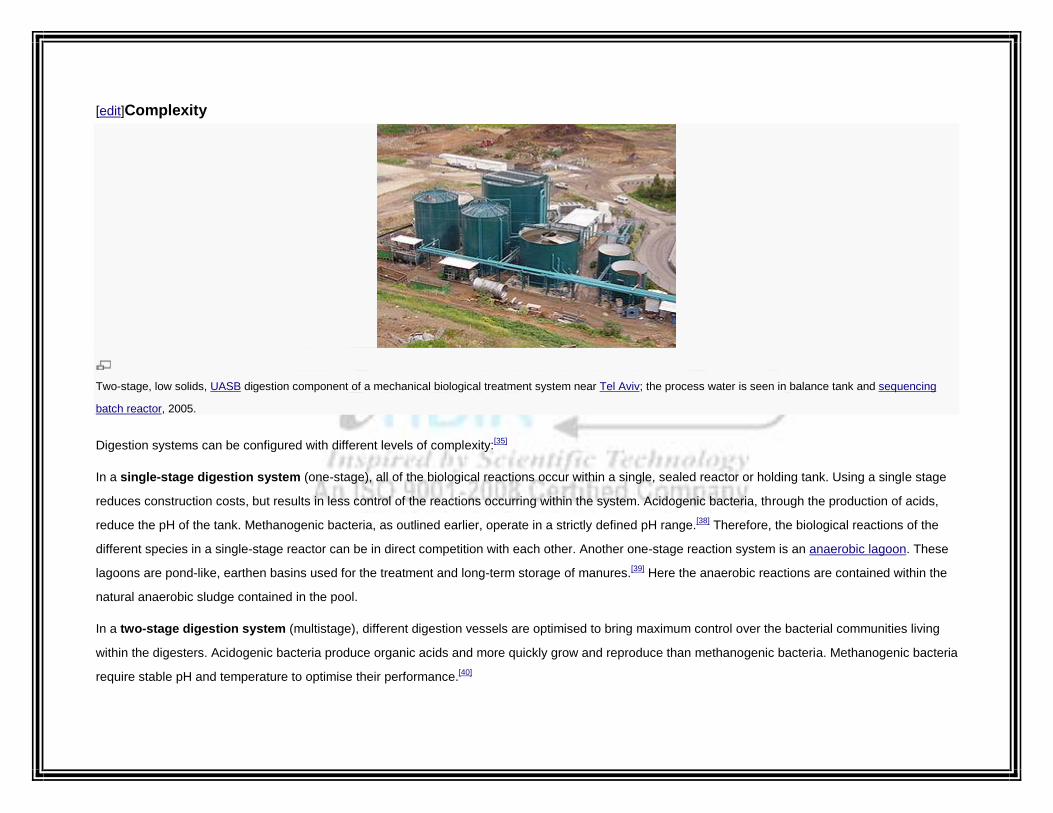
Two-stage, low solids, UASB digestion component of a mechanical biological treatment system near Tel Aviv; the process water is seen in balance tank and sequencing
batch reactor, 2005.
Digestion systems can be configured with different levels of complexity:[35]
In a single-stage digestion system (one-stage), all of the biological reactions occur within a single, sealed reactor or holding tank. Using a single stage
reduces construction costs, but results in less control of the reactions occurring within the system. Acidogenic bacteria, through the production of acids,
reduce the pH of the tank. Methanogenic bacteria, as outlined earlier, operate in a strictly defined pH range.[38] Therefore, the biological reactions of the
different species in a single-stage reactor can be in direct competition with each other. Another one-stage reaction system is an anaerobic lagoon. These
lagoons are pond-like, earthen basins used for the treatment and long-term storage of manures.[39] Here the anaerobic reactions are contained within the
natural anaerobic sludge contained in the pool.
In a two-stage digestion system (multistage), different digestion vessels are optimised to bring maximum control over the bacterial communities living
within the digesters. Acidogenic bacteria produce organic acids and more quickly grow and reproduce than methanogenic bacteria. Methanogenic bacteria
require stable pH and temperature to optimise their performance.[40]

Under typical circumstances, hydrolysis, acetogenesis, and acidogenesis occur within the first reaction vessel. The organic material is then heated to the
required operational temperature (either mesophilic or thermophilic) prior to being pumped into a methanogenic reactor. The initial hydrolysis or
acidogenesis tanks prior to the methanogenic reactor can provide a buffer to the rate at which feedstock is added. Some European countries require a
degree of elevated heat treatment to kill harmful bacteria in the input waste.[41] In this instance, there may be a pasteurisation or sterilisation stage prior to
digestion or between the two digestion tanks. Notably, it is not possible to completely isolate the different reaction phases, and often some biogas is
produced in the hydrolysis or acidogenesis tanks.
[edit]Residence time
The residence time in a digester varies with the amount and type of feed material, the configuration of the digestion system, and whether it be one-stage
or two-stage.
In the case of single-stage thermophilic digestion, residence times may be in the region of 14 days, which, compared to mesophilic digestion, is relatively
fast. The plug-flow nature of some of these systems will mean the full degradation of the material may not have been realised in this timescale. In this
event, digestate exiting the system will be darker in colour and will typically have more odour.[citation needed]
In two-stage mesophilic digestion, residence time may vary between 15 and 40 days.[42]
In the case of mesophilic UASB digestion, hydraulic residence times can be 1 hour to 1 day, and solid retention times can be up to 90 days. In this
manner, the UASB system is able to separate solids and hydraulic retention times with the use of a sludge blanket.[43]
Continuous digesters have mechanical or hydraulic devices, depending on the level of solids in the material, to mix the contents, enabling the bacteria and
the food to be in contact. They also allow excess material to be continuously extracted to maintain a reasonably constant volume within the digestion
tanks.[citation needed]
[edit]Feedstocks

Anaerobic lagoon and generators at the Cal Poly Dairy,United States 2003
The most important initial issue when considering the application of anaerobic digestion systems is the feedstock to the process. Almost any organic
material can be processed with anaerobic digestion;[44] however, if biogas production is the aim, the level of putrescibility is the key factor in its successful
application.[45] The more putrescible (digestible) the material, the higher the gas yields possible from the system.
Feedstocks can include biodegradable waste materials, such as waste paper, grass clippings, leftover food, sewage, and animal waste.[1]Woody wastes
are the exception, because they are largely unaffected by digestion, as most anaerobes are unable to degrade lignin, Xylophalgeous anaerobes (lignin
consumers) or using high temperature pretreatment, such as pyrolysis, can be used to break down the lignin. Anaerobic digesters can also be fed with
specially grown energy crops, such as silage, for dedicated biogas production. In Germany and continental Europe, these facilities are referred to as
"biogas" plants. A codigestion or cofermentation plant is typically an agricultural anaerobic digester that accepts two or more input materials for
simultaneous digestion.[46]
Anaerobes can break down material with varying degrees of success from readily, in the case of short-chain hydrocarbons such as sugars, to over longer
periods of time, in the case of cellulose and hemicellulose.[47] Anaerobic microorganisms are unable to break down long-chain woody molecules, such as
lignin.[48]

Anaerobic digesters were originally designed for operation using sewage sludge and manures. Sewage and manure are not, however, the material with
the most potential for anaerobic digestion, as the biodegradable material has already had much of the energy content taken out by the animals that
produced it. Therefore, many digesters operate with codigestion of two or more types of feedstock. For example, in a farm-based digester that uses dairy
manure as the primary feedstock, the gas production may be significantly increased by adding a second feedstock, e.g., grass and corn (typical on-farm
feedstock), or various organic byproducts, such as slaughterhouse waste, fats, oils and grease from restaurants, organic household waste, etc. (typical
off-site feedstock).[49]
Digestors processing dedicated energy crops can achieve high levels of degradation and biogas production.[36][50][51] Slurry-only systems are generally
cheaper, but generate far less energy than those using crops, such as maize and grass silage; by using a modest amount of crop material (30%), an
anaerobic digestion plant can increase energy output tenfold for only three times the capital cost, relative to a slurry-only system.[52]
[edit]Moisture content
A second consideration related to the feedstock is moisture content. Dryer, stackable substrates, such as food and yard waste, are suitable for digestion in
tunnel-like chambers. Tunnel-style systems typically have near-zero wastewater discharge, as well, so this style of system has advantages where the
discharge of digester liquids are a liability. The wetter the material, the more suitable it will be to handling with standard pumps instead of energy-intensive
concrete pumps and physical means of movement. Also, the wetter the material, the more volume and area it takes up relative to the levels of gas
produced. The moisture content of the target feedstock will also affect what type of system is applied to its treatment. To use a high-solids anaerobic
digester for dilute feedstocks, bulking agents, such as compost, should be applied to increase the solids content of the input material.[53] Another key
consideration is the carbon:nitrogen ratio of the input material. This ratio is the balance of food a microbe requires to grow; the optimal C:N ratio is 20–
30:1.[54] Excess N can lead to ammonia inhibition of digestion.[50]
[edit]Contamination
The level of contamination of the feedstock material is a key consideration. If the feedstock to the digesters has significant levels of physical contaminants,
such as plastic, glass, or metals, then processing to remove the contaminants will be required for the material to be used.[55] If it is not removed, then the
digesters can be blocked and will not function efficiently. It is with this understanding that mechanical biological treatment plants are designed. The higher
the level of pretreatment a feedstock requires, the more processing machinery will be required, and, hence, the project will have higher capital costs.[56]

After sorting or screening to remove any physical contaminants from the feedstock, the material is often shredded, minced, and mechanically or
hydraulically pulped to increase the surface area available to microbes in the digesters and, hence, increase the speed of digestion. The maceration of
solids can be achieved by using a chopper pump to transfer the feedstock material into the airtight digester, where anaerobic treatment takes place.
[edit]Substrate composition
Substrate composition is a major factor in determining the methane yield and methane production rates from the digestion of biomass. Techniques to
determine the compositional characteristics of the feedstock are available, while parameters such as solids, elemental, and organic analyses are
important for digester design and operation.[57]
[edit]Applications
Using anaerobic digestion technologies can help to reduce the emission of greenhouse gases in a number of key ways:
Replacement of fossil fuels
Reducing or eliminating the energy footprint of waste treatment plants
Reducing methane emission from landfills
Displacing industrially produced chemical fertilizers
Reducing vehicle movements
Reducing electrical grid transportation losses
Reducing usage of LP Gas for cooking
[edit]Waste treatment
Anaerobic digestion is particularly suited to organic material, and is commonly used for effluent and sewage treatment.[58] Anaerobic digestion, a simple
process, can greatly reduce the amount of organic matter which might otherwise be destined to be dumped at sea,[59] dumped in landfills, or burnt
in incinerators.[60]
Pressure from environmentally related legislation on solid waste disposal methods in developed countries has increased the application of anaerobic
digestion as a process for reducing waste volumes and generating useful byproducts. It may either be used to process the source-separated fraction of

municipal waste or alternatively combined with mechanical sorting systems, to process residual mixed municipal waste. These facilities are called
mechanical biological treatment plants.[61][62][63]
If the putrescible waste processed in anaerobic digesters were disposed of in a landfill, it would break down naturally and often anaerobically. In this case,
the gas will eventually escape into the atmosphere. As methane is about 20 times more potent as a greenhouse gas than carbon dioxide, this has
significant negative environmental effects.[64]
In countries that collect household waste, the use of local anaerobic digestion facilities can help to reduce the amount of waste that requires transportation
to centralized landfill sites or incineration facilities. This reduced burden on transportation reduces carbon emissions from the collection vehicles. If
localized anaerobic digestion facilities are embedded within an electrical distribution network, they can help reduce the electrical losses associated with
transporting electricity over a national grid.[65]
[edit]Power generationSee also: Electrical energy efficiency on United States farms
In developing countries, simple home and farm-based anaerobic digestion systems offer the potential for low-cost energy for cooking and
lighting.[31][66][67][68] Anaerobic digestion facilities have been recognized by the United Nations Development Programme as one of the most useful
decentralized sources of energy supply.[6] From 1975, China and India have both had large, government-backed schemes for adaptation of small biogas
plants for use in the household for cooking and lighting.[69] At present, projects for anaerobic digestion in the developing world can gain financial support
through the United Nations Clean Development Mechanism if they are able to show they provide reduced carbon emissions.[70]
Methane and power produced in anaerobic digestion facilities can be used to replace energy derived from fossil fuels, and hence reduce emissions of
greenhouse gases, because the carbon in biodegradable material is part of a carbon cycle. The carbon released into the atmosphere from the combustion
of biogas has been removed by plants for them to grow in the recent past, usually within the last decade, but more typically within the last growing season.
If the plants are regrown, taking the carbon out of the atmosphere once more, the system will be carbon neutral.[71][72] In contrast, carbon in fossil fuels has
been sequestered in the earth for many millions of years, the combustion of which increases the overall levels of carbon dioxide in the atmosphere.
Biogas from sewage works is sometimes used to run a gas engine to produce electrical power, some or all of which can be used to run the sewage
works.[73] Some waste heat from the engine is then used to heat the digester. The waste heat is, in general, enough to heat the digester to the required

temperatures. The power potential from sewage works is limited – in the UK, there are about 80 MW total of such generation, with the potential to increase
to 150 MW, which is insignificant compared to the average power demand in the UK of about 35,000 MW. The scope for biogas generation from
nonsewage waste biological matter – energy crops, food waste, abattoir waste, etc. - is much higher, estimated to be capable of about 3,000 MW.[citation
needed] Farm biogas plants using animal waste and energy crops are expected to contribute to reducing CO2 emissions and strengthen the grid, while
providing UK farmers with additional revenues.[74]
Some countries offer incentives in the form of, for example, feed-in tariffs for feeding electricity onto the power grid to subsidize green energy
production.[1][75]
In Oakland, California at the East Bay Municipal Utility District’s main wastewater treatment plant (EBMUD), food waste is currently codigested with
primary and secondary municipal wastewater solids and other high-strength wastes. Compared to municipal wastewater solids digestion alone, food
waste codigestion has many benefits. Anaerobic digestion of food waste pulp from the EBMUD food waste process provides a higher normalized energy
benefit, compared to municipal wastewater solids: 730 to 1,300 kWh per dry ton of food waste applied compared to 560 to 940 kWh per dry ton of
municipal wastewater solids applied.[76][77]
[edit]Grid injection
Biogas grid-injection is the injection of biogas into the natural gas grid.[78] As an alternative, the electricity and the heat can be used for on-site
generation,[79] resulting in a reduction of losses in the transportation of energy. Typical energy losses in natural gas transmission systems range from 1–
2%, whereas the current energy losses on a large electrical system range from 5–8%.[80]
In October 2010, Didcot Sewage Works became the first in the UK to produce biomethane gas supplied to the national grid, for use in up to 200 homes
in Oxfordshire.[81]
[edit]Fertiliser and soil conditioner
The solid, fibrous component of the digested material can be used as a soil conditioner to increase the organic content of soils. Digester liquor can be
used as a fertiliser to supply vital nutrients to soils instead of chemical fertilisers that require large amounts of energy to produce and transport. The use of
manufactured fertilisers is, therefore, more carbon-intensive than the use of anaerobic digester liquor fertiliser. In countries such as Spain, where many
soils are organically depleted, the markets for the digested solids can be equally as important as the biogas.[82]

[edit]Cooking gas
By using a bio-digester, which produces the bacteria required for decomposing, cooking gas is generated. The organic garbage like fallen leaves, kitchen
waste, food waste etc are fed into a crusher unit, where the mixture is conflated with a small amount of water. The mixture is then fed into the bio-digester,
where the bacteria decomposes it to produce cooking gas. This gas is piped to kitchen stove. A 2 cubic meter bio-digester can produce 2 cubic meter of
cooking gas. This is equivalent to 1 kg of LPG. The notable advantage of using a bio-digester is the sludge which is a rich organic manure.[83]
[edit]Products
The three principal products of anaerobic digestion are biogas, digestate, and water.[35][84][85]
[edit]BiogasMain article: Biogas
Typical composition of biogas[86]
Matter %
Methane, CH4 50–75
Carbon dioxide, CO2 25–50
Nitrogen, N2 0–10
Hydrogen, H2 0–1

Hydrogen sulfide, H2S 0–3
Oxygen, O2 0–2
Biogas holder with lightning protection rods and backupgas flare

Biogas carrying pipes
Biogas is the ultimate waste product of the bacteria feeding off the input biodegradable feedstock (the methanogenesis stage of anaerobic digestion is
performed by archaea - a micro-organism on a distinctly different branch of the phylogenetic tree of life to bacteria), and is mostly methane and carbon
dioxide,[87][88] with a small amount hydrogen and trace hydrogen sulfide. (As-produced, biogas also contains water vapor, with the fractional water vapor
volume a function of biogas temperature).[37] Most of the biogas is produced during the middle of the digestion, after the bacterial population has grown,
and tapers off as the putrescible material is exhausted.[89] The gas is normally stored on top of the digester in an inflatable gas bubble or extracted and
stored next to the facility in a gas holder.
The methane in biogas can be burned to produce both heat and electricity, usually with a reciprocating engine or microturbine[90] often in
a cogenerationarrangement where the electricity and waste heat generated are used to warm the digesters or to heat buildings. Excess electricity can be
sold to suppliers or put into the local grid. Electricity produced by anaerobic digesters is considered to be renewable energy and may attract
subsidies.[91] Biogas does not contribute to increasing atmospheric carbon dioxide concentrations because the gas is not released directly into the
atmosphere and the carbon dioxide comes from an organic source with a short carbon cycle.

Biogas may require treatment or 'scrubbing' to refine it for use as a fuel.[92] Hydrogen sulfide, a toxic product formed from sulfates in the feedstock, is
released as a trace component of the biogas. National environmental enforcement agencies, such as the U.S. Environmental Protection Agency or the
English and Welsh Environment Agency, put strict limits on the levels of gases containing hydrogen sulfide, and, if the levels of hydrogen sulfide in the gas
are high, gas scrubbing and cleaning equipment (such as amine gas treating) will be needed to process the biogas to within regionally accepted
levels.[93] Alternatively, the addition of ferrous chloride FeCl2 to the digestion tanks inhibits hydrogen sulfide production.[94]
Volatile siloxanes can also contaminate the biogas; such compounds are frequently found in household waste and wastewater. In digestion facilities
accepting these materials as a component of the feedstock, low-molecular-weight siloxanes volatilise into biogas. When this gas is combusted in a gas
engine, turbine, or boiler, siloxanes are converted into silicon dioxide (SiO2), which deposits internally in the machine, increasing wear and
tear.[95][96] Practical and cost-effective technologies to remove siloxanes and other biogas contaminants are available at the present time.[97] In certain
applications, in situ treatment can be used to increase the methane purity by reducing the offgas carbon dioxide content, purging the majority of it in a
secondary reactor.[98]
In countries such as Switzerland, Germany, and Sweden, the methane in the biogas may be compressed for it to be used as a vehicle transportation fuel
or input directly into the gas mains.[99] In countries where the driver for the use of anaerobic digestion are renewable electricity subsidies, this route of
treatment is less likely, as energy is required in this processing stage and reduces the overall levels available to sell.[100]
[edit]DigestateMain article: digestate
Digestate is the solid remnants of the original input material to the digesters that the microbes cannot use. It also consists of the mineralised remains of
the dead bacteria from within the digesters. Digestate can come in three forms: fibrous, liquor, or a sludge-based combination of the two fractions. In two-
stage systems, different forms of digestate come from different digestion tanks. In single-stage digestion systems, the two fractions will be combined and,
if desired, separated by further processing.[101][102]

Acidogenic anaerobic digestate
The second byproduct (acidogenic digestate) is a stable, organic material consisting largely of lignin and cellulose, but also of a variety of mineral
components in a matrix of dead bacterial cells; some plastic may be present. The material resembles domestic compost and can be used as such or to
make low-grade building products, such as fibreboard.[103][104] The solid digestate can also be used as feedstock for ethanol production.[105]
The third byproduct is a liquid (methanogenic digestate) rich in nutrients, which can be used as a fertiliser, depending on the quality of the material being
digested.[106] Levels of potentially toxic elements (PTEs) should be chemically assessed. This will depend upon the quality of the original feedstock. In the
case of most clean and source-separated biodegradable waste streams, the levels of PTEs will be low. In the case of wastes originating from industry, the
levels of PTEs may be higher and will need to be taken into consideration when determining a suitable end use for the material.
Digestate typically contains elements, such as lignin, that cannot be broken down by the anaerobic microorganisms. Also, the digestate may contain
ammonia that is phytotoxic, and may hamper the growth of plants if it is used as a soil-improving material. For these two reasons, a maturation or
composting stage may be employed after digestion. Lignin and other materials are available for degradation by aerobic microorganisms, such as fungi,
helping reduce the overall volume of the material for transport. During this maturation, the ammonia will be oxidized into nitrates, improving the fertility of
the material and making it more suitable as a soil improver. Large composting stages are typically used by dry anaerobic digestion technologies.[107][108]
[edit]Wastewater

The final output from anaerobic digestion systems is water, which originates both from the moisture content of the original waste that was treated and
water produced during the microbial reactions in the digestion systems. This water may be released from the dewatering of the digestate or may be
implicitly separate from the digestate.
The wastewater exiting the anaerobic digestion facility will typically have elevated levels of biochemical oxygen demand (BOD) andchemical oxygen
demand (COD). These measures of the reactivity of the effluent indicate an ability to pollute. Some of this material is termed 'hard COD', meaning it
cannot be accessed by the anaerobic bacteria for conversion into biogas. If this effluent were put directly into watercourses, it would negatively affect them
by causing eutrophication. As such, further treatment of the wastewater is often required. This treatment will typically be an oxidation stage wherein air is
passed through the water in a sequencing batch reactors or reverse osmosis unit.[109][110][111]
[edit]See also
Renewable energy portal
Energy portal
Environment portal
Sustainable development portal
2.1.1.1-Anaerobic digester types
2.1.1.2-Bioconversion of biomass to mixed alcohol fuels
2.1.1.3-Biogas
2.1.1.4-Carbon dioxide air capture
2.1.1.5-Dissolved oxygen
2.1.1.6-Environmental issues with energy
2.1.1.7-Eutrophication
2.1.1.8-Hypoxia (environmental)
2.1.1.9-Mass balance

2.1.1.10-Mesophilic digester
2.1.1.11-Methane capture
2.1.1.12-Methane clathrate
2.1.1.13-Microbiology of decomposition
2.1.1.14-Relative cost of electricity generated by different sources
2.1.1.15-Sewage treatment
2.1.1.16-Sludge bulking
2.1.1.17-Thermophilic digester
2.1.1.18-Upflow anaerobic sludge blanket digestion (UASB)
2.1.1.19-Wastewater quality indicators
2.1.1.2-Bioconversion of biomass to mixed alcohol fuelsFrom Wikipedia, the free encyclopedia
The bioconversion of biomass to mixed alcohol fuels can be accomplished using the MixAlco process. Through bioconversion of biomass to a
mixed alcohol fuel, more energy from the biomass will end up as liquid fuels than in converting biomass to ethanol by yeast fermentation.
The process involves a biological/chemical method for converting any biodegradable material (e.g., urban wastes, such as municipal solid
waste, biodegradable waste, and sewage sludge, agricultural residues such as corn stover, sugarcane bagasse, cotton gin trash, manure) into useful
chemicals, such as carboxylic acids (e.g., acetic, propionic, butyric acid), ketones (e.g., acetone, methyl ethyl ketone, diethyl ketone) and biofuels, such as
a mixture of primary alcohols (e.g., ethanol, propanol, n-butanol) and/or a mixture of secondary alcohols (e.g., isopropanol, 2-butanol, 3-pentanol).
Because of the many products that can be economically produced, this process is a true biorefinery.[1][2][3]

Pilot Plant (College Station, Texas)
The process uses a mixed culture of naturally occurring microorganisms found in natural habitats such as the rumen of cattle, termite guts, and marine
and terrestrial swamps to anaerobically digest biomass into a mixture of carboxylic acids produced during the acidogenic and acetogenic stages
of anaerobic digestion, however with the inhibition of the methanogenic final stage. The more popular methods for production of ethanol and cellulosic
ethanol use enzymes that must be isolated first to be added to the biomass and thus convert the starch or cellulose into simple sugars, followed then by
yeast fermentation into ethanol. This process does not need the addition of such enzymes as these microorganisms make their own.[4]
As the microoganisms anaerobically digest the biomass and convert it into a mixture of carboxylic acids, the pH must be controlled. This is done by the
addition of a buffering agent (e.g., ammonium bicarbonate, calcium carbonate), thus yielding a mixture of carboxylate salts. Methanogenesis, being the
natural final stage of anaerobic digestion, is inhibited by the presence of the ammonium ions or by the addition of an inhibitor (e.g., iodoform). The
resulting fermentation broth contains the produced carboxylate salts that must be dewatered. This is achieved efficiently by vapor-compression
evaporation. Further chemical refining of the dewatered fermentation broth may then take place depending on the final chemical or biofuel product
desired.
The condensed distilled water from the vapor-compression evaporation system is recycled back to the fermentation. On the other hand, if raw sewage or
other waste water with high BOD in need of treatment is used as the water for the fermentation, the condensed distilled water from the evaporation can be
recycled back to the city or to the original source of the high-BOD waste water. Thus, this process can also serve as a water treatment facility, while
producing valuable chemicals or biofuels.

Because the system uses a mixed culture of microorganisms, besides not needing any enzyme addition, the fermentation requires no sterility or aseptic
conditions, making this front step in the process more economical than in more popular methods for the production of cellulosic ethanol. These savings in
the front end of the process, where volumes are large, allows flexibility for further chemical transformations after dewatering, where volumes are small.
Contents
[hide]
1 Carboxylic acids
2 Ketones
3 Alcohols
o 3.1 Primary alcohols
o 3.2 Secondary alcohols
4 Drop-in biofuels
5 Acetic acid versus ethanol
6 Stage of development
7 See also
8 References
[edit]Carboxylic acids
For more details on this topic, see Carboxylic acid.
Carboxylic acids can be regenerated from the carboxylate salts using a process known as "acid springing". This process makes use of a high-molecular-
weight tertiary amine (e.g., trioctylamine), which is switched with the cation (e.g., ammonium or calcium). The resulting amine carboxylate can then be
thermally decomposed into the amine itself, which is recycled, and the correspondingcarboxylic acid. In this way, theoretically, no chemicals are
consumed or wastes produced during this step.[5]
[edit]Ketones

For more details on this topic, see Ketone.
There are two methods for making ketones. The first one consists on thermally converting calcium carboxylate salts into the corresponding ketones. This
was a common method for making acetone from calcium acetate during World War I.[6] The other method for making ketones consists on converting the
vaporized carboxylic acids on a catalytic bed of zirconium oxide.[7]
[edit]Alcohols
For more details on this topic, see Alcohol.
[edit]Primary alcohols
The undigested residue from the fermentation may be used in gasification to make hydrogen (H2). This H2 can then be used
to hydrogenolyze the esters over a catalyst (e.g., copper chromite),[8]which are produced by esterifying either the ammonium carboxylate salts
(e.g., ammonium acetate, propionate, butyrate) or the carboxylic acids (e.g., acetic, propionic, butyric acid) with a high-molecular-weight alcohol
(e.g., hexanol, heptanol).[9] From the hydrogenolysis, the final products are the high-molecular-weight alcohol, which is recycled back to the esterification,
and the corresponding primary alcohols (e.g., ethanol, propanol, butanol).
[edit]Secondary alcohols
The secondary alcohols (e.g., isopropanol, 2-butanol, 3-pentanol) are obtained by hydrogenating over a catalyst (e.g., Raney nickel) the corresponding
ketones (e.g., acetone, methyl ethyl ketone, diethyl ketone).[10]
[edit]Drop-in biofuels
The primary or secondary alcohols obtained as described above may undergo conversion to drop-in biofuels, fuels which are compatible with current fossil
fuel infrastructure such as biogasoline,green diesel and bio-jet fuel. Such is done by subjecting the alcohols to dehydration followed by oligomerization
using zeolite catalysts in a manner similar to the methanex process, which used to produce gasoline from methanol in New Zealand.[11]
[edit]Acetic acid versus ethanol

Cellulosic-ethanol -manufacturing plants are bound to be net exporters of electricity because a large portion of the lignocellulosic biomass, namely lignin,
remains undigested and it must be burned, thus producing electricity for the plant and excess electricity for the grid. As the market grows and this
technology becomes more widespread, coupling the liquid fuel and the electricity markets will become more and more difficult.
Acetic acid, unlike ethanol, is biologically produced from simple sugars without the production of carbon dioxide:
C6H12O6 → 2 CH3CH2OH + 2 CO2
(Biological production of ethanol)
C6H12O6 → 3 CH3COOH
(Biological production of acetic acid)
Because of this, on a mass basis, the yields will be higher than in ethanol fermentation. If then, the undigested residue (mostly lignin) is used to produce
hydrogen by gasification, it is ensured that more energy from the biomass will end up as liquid fuels rather than excess heat/electricity.[12]
3 CH3COOH + 6 H2 → 3 CH3CH2OH + 3 H2O
(Hydrogenation of acetic acid)
C6H12O6 (from cellulose) + 6 H2 (from lignin) → 3 CH3CH2OH + 3 H2O
(Overall reaction)
A more comprehensive description of the economics of each of the fuels is given on the pages alcohol fuel and ethanol fuel, more information about the
economics of various systems can be found on the central page biofuel.
[edit]Stage of development
The system has been in development since 1991, moving from the laboratory scale (10 g/day) to the pilot scale (200 lb/day) in 2001. A small
demonstration-scale plant (5 ton/day) has been constructed and is under operation and a 220 ton/day demonstration plant is expected in 2012.
[edit]See also

Energy portal
Anaerobic digestion
Mechanical biological treatment
2.1.1.3-BiogasBiogasFrom Wikipedia, the free encyclopedia
Pipes carrying biogas (foreground), natural gasand condensate

Sustainable energy
Renewable energy
Anaerobic digestion
Biomass
Geothermal
Hydroelectricity
Solar
Tidal
Wind
Energy conservation
Cogeneration

Energy efficiency
Geothermal
Green building
Microgeneration
Passive solar
Organic Rankine cycle
Sustainable transport
Carbon neutral fuel
Electric vehicle
Green vehicle
Plug-in hybrid
Environment portal
V
T
E

Biogas typically refers to a gas produced by breakdown of organic matter in the absence of oxygen. Organic waste such as dead plant and animal
material, animal feces, and kitchen waste can be converted into a gaseous fuel called biogas. Biogas originates from biogenic material and is a type of bio
fuel.
A rapid growth in population and a dynamic industrialisation around the world is leading to a significant increase in energy consumption, which is largely
based on burning fossil fuels. This results in large amounts of carbon dioxide being entered into the atmosphere, which is causing considerable damage to
our climate and the environment.
Besides solar and wind energy, biogas is also an important renewable energy source. Furthermore, biogas can be produced from renewable, regionally
available raw materials and energy-producing recyclable waste and is particularly environmentally friendly and CO2 neutral. Biogas uses the natural
energy from organic material.
Biogas is produced by the anaerobic digestion or fermentation of biodegradable materials such as biomass, manure, sewage, municipal waste,green
waste, plant material, and crops.[1] Biogas comprises primarily methane (CH4) and carbon dioxide (CO2) and may have small amounts ofhydrogen
sulphide (H2S), moisture and siloxanes.
The gases methane, hydrogen, and carbon monoxide (CO) can be combusted or oxidized with oxygen. This energy release allows biogas to be used as a
fuel. Biogas can be used as a fuel in any country for any heating purpose, such as cooking. It can also be used in anaerobic digesters where it is typically
used in a gas engine to convert the energy in the gas into electricity and heat.[2] Biogas can be compressed, much like natural gas, and used to
power motor vehicles. In the UK, for example, biogas is estimated to have the potential to replace around 17% of vehicle fuel.[3] Biogas is a renewable fuel
so it qualifies for renewable energy subsidies in some parts of the world. Biogas can also be cleaned and upgraded to natural gas standards when it
becomes bio methane.
Contents
[hide]
1 Production
2 Composition
3 Benefits

4 Applications
o 4.1 Biogas upgrading
o 4.2 Biogas gas-grid injection
o 4.3 Biogas in transport
5 Legislation
6 Development around the world
o 6.1 United States
o 6.2 UK
o 6.3 Germany
o 6.4 Indian subcontinent
o 6.5 China
o 6.6 In developing nations
7 In popular culture
8 See also
9 References
10 Further reading
11 External links
[edit]Production
Main article: anaerobic digestion

Biogas production in rural Germany
Bio gas is practically produced as landfill gas (LFG) or digested gas. A bio gas plant is the name often given to an anaerobic digester that treats farm
wastes or energy crops. Bio gas can be produced using anaerobic digesters. These plants can be fed with energy crops such as maize silage
orbiodegradable wastes including sewage sludge and food waste. During the process, as an air-tight tank transforms biomass waste into methane
producing renewable energy that can be used for heating, electricity, and many other operations that use any variation of an internal combustion engine,
such as GE Backbencher gas engines.[4] There are two key processes: Mesophilic and Thermophilic digestion.[5] In experimental work at University of
Alaska Fairbanks, a 1000-litre digester using psychrophiles harvested from "mud from a frozen lake in Alaska" has produced 200–300 liters of methane
per day, about 20–30% of the output from digesters in warmer climates.[6] Landfill gas is produced by wet organic waste decomposing under anaerobic
conditions in a landfill.[7][8] The waste is covered and mechanically compressed by the weight of the material that is deposited from above. This material
prevents oxygen exposure thus allowing anaerobic microbes to thrive. This gas builds up and is slowly released into the atmosphere if the landfill site has
not been engineered to capture the gas. Landfill gas is hazardous for three key reasons. Landfill gas becomes explosive when it escapes from the landfill
and mixes with oxygen. The lower explosive limit is 5% methane and the upper explosive limit is 15% methane.[9] The methane contained within biogas is
20 times more potent as a greenhouse gas than is carbon dioxide. Therefore, uncontained landfill gas, which escapes into the atmosphere may
significantly contribute to the effects ofglobal warming. In addition, landfill gas impact in global warming, volatile organic compounds (VOCs) contained
within landfill gas contribute to the formation of photochemical smog.
[edit]Composition

Typical composition of biogas[10]
Compound Chem %
Methane CH4 50–75
Carbon dioxide CO2 25–50
Nitrogen N2 0–10
Hydrogen H2 0–1
Hydrogen sulphide H2S 0–3
Oxygen O2 0–0
The composition of biogas varies depending upon the origin of the anaerobic digestion process. Landfill gas typically has methane concentrations around
50%. Advanced waste treatment technologies can produce biogas with 55–75% methane,[11] which for reactors with free liquids can be increased to 80-
90% methane using in-situ gas purification techniques[12] As-produced, biogas also contains water vapor. The fractional volume of water vapor is a
function of biogas temperature; correction of measured gas volume for both water vapor content and thermal expansion is easily done via a simple
mathematic algorithm[13] which yields the standardized volume of dry biogas.
In some cases, biogas contains siloxanes. These siloxanes are formed from the anaerobic decomposition of materials commonly found in soaps and
detergents. During combustion of biogas containing siloxanes, silicon is released and can combine with free oxygen or various other elements in

thecombustion gas. Deposits are formed containing mostly silica (SiO2) or silicates (SixOy) and can also contain calcium, sulfur, zinc, phosphorus.
Such white mineral deposits accumulate to a surface thickness of several millimeters and must be removed by chemical or mechanical means.
Practical and cost-effective technologies to remove siloxanes and other biogas contaminants are currently available.[14]
[edit]Benefits
When biogas is used, many advantages arise. In North America, utilization of biogas would generate enough electricity to meet up to three percent of the
continent's electricity expenditure. In addition, biogas could potentially help reduce global climate change. Normally, manure that is left to decompose
releases two main gases that cause global climate change: nitrogen dioxide andmethane. Nitrogen dioxide (NO2) warms the atmosphere 310 times more
than carbon dioxide and methane 21 times more than carbon dioxide. By converting cow manure into methane biogas viaanaerobic digestion, the millions
of cows in the United States would be able to produce one hundred billion kilowatt hours of electricity, enough to power millions of homes across the
United States. In fact, one cow can produce enough manure in one day to generate three kilowatt hours of electricity; only 2.4 kilowatt hours of electricity
are needed to power a single one hundred watt light bulb for one day.[15] Furthermore, by converting cow manure into methane biogas instead of letting it
decompose, global warming gases could be reduced by ninety-nine million metric tons or four percent.[16] In Nepal biogas is being used as a reliable
source of rural energy.
[edit]Applications
A biogas bus in Linköping, Sweden

Biogas can be utilized for electricity production on sewage works,[17] in a CHP gas engine, where the waste heat from the engine is conveniently used for
heating the digester; cooking; space heating; water heating; and process heating. If compressed, it can replace compressed natural gasfor use in
vehicles, where it can fuel an internal combustion engine or fuel cells and is a much more effective displacer of carbon dioxide than the normal use in on-
site CHP plants. [18]
Methane within biogas can be concentrated via a biogas upgrader to the same standards as fossil natural gas, which itself has had to go through a
cleaning process, and becomes biomethane. If the local gas network allows for this, the producer of the biogas may utilize the local gas distribution
networks. Gas must be very clean to reach pipeline quality, and must be of the correct composition for the local distribution network to accept. Carbon
dioxide, water, hydrogen sulfide, and particulates must be removed if present.
[edit]Biogas upgrading
Raw biogas produced from digestion is roughly 60% methane and 29% CO2 with trace elements of H2S, and is not high quality enough to be used as fuel
gas for machinery. The corrosive nature of H2S alone is enough to destroy the internals of a plant. The solution is the use of biogas upgrading or
purification processes whereby contaminants in the raw biogas stream are absorbed or scrubbed, leaving more methane per unit volume of gas. There
are four main methods of biogas upgrading, these include water washing, pressure swing absorption, selexol absorption, and amine gas treating.[19] The
most prevalent method is water washing where high pressure gas flows into a column where the carbon dioxide and other trace elements are scrubbed by
cascading water running counter-flow to the gas. This arrangement could deliver 98% methane with manufacturers guaranteeing maximum 2% methane
loss in the system. It takes roughly between 3-6% of the total energy output in gas to run a biogas upgrading system....
[edit]Biogas gas-grid injection
Gas-grid injection is the injection of biogas into the methane grid (natural gas grid). Injections includes biogas:[20] until the breakthrough of micro combined
heat and power two-thirds of all the energy produced by biogas power plants was lost (the heat), using the grid to transport the gas to customers, the
electricity and the heat can be used for on-site generation[21] resulting in a reduction of losses in the transportation of energy. Typical energy losses in
natural gas transmission systems range from 1–2%. The current energy losses on a large electrical system range from 5–8%.[22]
[edit]Biogas in transport

If concentrated and compressed, it can also be used in vehicle transportation. Compressed biogas is becoming widely used in Sweden, Switzerland, and
Germany. A biogas-powered train has been in service in Sweden since 2005.[23][24] Biogas also powers automobiles and in 1974, a British documentary
film entitled Sweet as a Nut detailed the biogas production process from pig manure, and how the biogas fueled a custom-adapted combustion
engine.[25][26] In 2007, an estimated 12,000 vehicles were being fueled with upgraded biogas worldwide, mostly in Europe.[27]
[edit]Legislation
The European Union presently has some of the strictest legislation regarding waste management and landfill sites called the Landfill Directive.[citation
needed] The United States legislates against landfill gas as it contains VOCs. The United States Clean Air Act and Title 40 of the Code of Federal
Regulations (CFR) requires landfill owners to estimate the quantity of non-methane organic compounds (NMOCs) emitted. If the estimated NMOC
emissions exceeds 50 tonnes per year, the landfill owner is required to collect the landfill gas and treat it to remove the entrained NMOCs. Treatment of
the landfill gas is usually by combustion. Because of the remoteness of landfill sites, it is sometimes not economically feasible to produce electricity from
the gas. However, countries such as the United Kingdom and Germany now have legislation in force that provides farmers with long-term revenue and
energy security.[28]
[edit]Development around the world
[edit]United States
With the many benefits of biogas, it is starting to become a popular source of energy and is starting to be utilized in the United States more. In 2003, the
United States consumed 147 trillion BTU of energy from "landfill gas", about 0.6% of the total U.S. natural gas consumption.[27] Methane biogas derived
from cow manure is also being tested in the U.S. According to a 2008 study, collected by the Science and Children magazine, methane biogas from cow
manure would be sufficient to produce 100 billion kilowatt hours enough to power millions of homes across America. Furthermore, methane biogas has
been tested to prove that it can reduce 99 million metric tons of greenhouse gas emissions or about 4% of the greenhouse gases produced by the United
States.[29]
In Vermont, for example, biogas generated on dairy farms around the state is included in the CVPS Cow Power program. The Cow Power program is
offered by Central Vermont Public Service Corporation as a voluntary tariff. Customers can elect to pay a premium on their electric bill, and that premium
is passed directly to the farms in the program. In Sheldon, Vermont, Green Mountain Dairy has provided renewable energy as part of the Cow Power

program. It all started when the brothers who own the farm, Bill and Brian Rowell, wanted to address some of the manure management challenges faced
by dairy farms, including manure odor, and nutrient availability for the crops they need to grow to feed the animals. They installed an anaerobic digester to
process the cow and milking center waste from their nine hundred and fifty cows to produce renewable energy, a bedding to replace sawdust, and a plant
friendly fertilizer. The energy and environmental attributes are sold. On average, the system run by the Rowell brothers produces enough electricity to
power three hundred to three hundred fifty other homes. The generator capacity is about three hundred kiloWatts.[30]
In Hereford, Texas, cow manure is being used to power an ethanol power plant. By switching to methane biogas, the ethanol power plant has saved one
thousand barrels of oil a day. Overall, the power plant has reduced transportation costs and will be opening many more jobs for future power plants that
will be relying on biogas.[31]
[edit]UK
There are currently around 60 non-sewage biogas plants in the UK, most are on-farm, but some larger facilities exist off-farm, which are taking food and
consumer wastes.[32]
On 5 October 2010, biogas was injected into the UK gas grid for the first time. Sewage from over 30,000 Oxfordshire homes is sent to Didcot sewage
treatment works, where it is treated in an anaerobic digestor to produce biogas, which is then cleaned to provide gas for approximately 200 homes.[33]
[edit]Germany
Germany is Europe's biggest biogas producer[34] as it is the market leader in biogas technology.[35] In 2010 there were 5,905 biogas plants operating
throughout the whole country, in which Lower Saxony, Bavaria and the eastern federal states are the main regions.[36] Most of these plants are employed
as power plants. Usually the biogas plants are directly connected with a CHP which produces electric power by burning the bio methane. The electrical
power is then fed into the public power grid.[37] In 2010, the total installed electrical capacity of these power plants was 2,291 MW.[36] The electricity supply
was approximately 12.8 TWh, which is 12.6 per cent of the total generated renewable electricity.[38] Biogas in Germany is primarily extracted by the co-
fermentation of energy crops (called ‘NawaRo’, an abbreviation of ‘nachwachsende Rohstoffe’, which is German for renewable resources) mixed with
manure, the main crop utilized is corn. Organic waste and industrial and agricultural residues such as waste from the food industry are also used for
biogas generation.[39] In this respect, Biogas production in Germany differs significantly from the UK, where biogas generated from landfill sites is most
common.[34]

Biogas production in Germany has developed rapidly over the last 20 years. The main reason for this development is the legally created frameworks.
Governmental support of renewable energies started at the beginning of the 1990s with the Law on Electricity Feed (StrEG). This law guaranteed the
producers of energy from renewable sources the feed into the public power grid, thus the power companies were forced to take all produced energy from
independent private producers of green energy.[40] In 2002 the Law on Electricity Feed was replaced by the Renewable Energy Source Act (EEG). This
law even guaranteed a fixed compensation for the produced electric power over 20 years. The amount of ca. 0.08 Euro gave particular farmers the
opportunity to become an energy supplier and gaining a further source of income in the same place.[39] The German agricultural biogas production was
given a further push in 2004 by implementing the so-called NawaRo-Bonus. This is a special bonus payment given for the usage of renewable resources
i.e. energy crops.[41] In 2007 the German government stressed its intention to invest further effort and support in improving the renewable energy supply to
provide an answer on growing climate challenges and increasing oil prices by the ‘Integrated Climate and Energy Programme’.
This continual trend of renewable energy promotion induces a number of challenges facing the management and organisation of renewable energy supply
that has also several impacts on the biogas production.[42] The first challenge to be noticed is the high area-consuming of the biogas electric power supply.
In 2011 energy crops for biogas production consumed an area of circa 800,000 ha in Germany.[43] This high demand of agricultural areas generates new
competitions with the food industries that did not exist yet. Moreover new industries and markets were created in predominately rural regions entailing
different new players with an economic, political and civil background. Their influence and acting has to be governed to gain all advantages this new
source of energy is offering. Finally biogas will furthermore play an important role in the German renewable energy supply if good governance is
focused.[42]
[edit]Indian subcontinent
In India, Nepal, Pakistan and Bangladesh biogas produced from the anaerobic digestion of manure in small-scale digestion facilities is called gobar gas; it
is estimated that such facilities exist in over two million households in India and in thousands in Pakistan, particularly North Punjab, due to the thriving
population of livestock. The digester is an airtight circular pit made of concrete with a pipe connection. The manure is directed to the pit, usually directly
from the cattle shed. The pit is then filled with a required quantity of wastewater. The gas pipe is connected to the kitchen fireplace through control valves.
The combustion of this biogas has very little odour or smoke. Owing to simplicity in implementation and use of cheap raw materials in villages, it is one of
the most environmentally sound energy sources for rural needs. One type of these system is the Sintex Digester. Some designs use vermiculture to
further enhance the slurry produced by the biogas plant for use as compost.[44] In order to create awareness and associate the people interested in biogas,
an association "Indian Biogas Association" (www.biogas-India.com)[45] is formed. The “Indian Biogas Association” aspires to be a unique blend of;

nationwide operators, manufacturers and planners of biogas plants, and representatives from science and research. The association was founded in 2010
and is now ready to start mushrooming. The sole motto of the association is “propagating Biogas in a sustainable way”.
The Deenabandhu Model is a new biogas-production model popular in India. (Deenabandhu means "friend of the helpless.") The unit usually has a
capacity of 2 to 3 cubic metres. It is constructed using bricks or by a ferrocement mixture. In India, the brick model costs slightly more than the
ferrocement model; however, India's Ministry of New and Renewable Energy offers some subsidy per model constructed.
In Pakistan, the Rural Support Programmes Network is running the Pakistan Domestic Biogas Programme[46] which has installed over 1500 biogas plants
and has trained in excess of 200 masons on the technology and aims to develop the Biogas Sector in Pakistan.
Also PAK-Energy Solution[46] has taken the most innovative and responsible initiatives in biogas technology. In this regard, the company is also awarded
by 1st prize in "Young Entrepreneur Business Plan Challenge" jointly organized by Punjab Govt. & LCCI.[46][47][48][49] They have designed and developed
Uetians Hybrid Model, in which they have combined fixed dome and floating drums and Uetians Triplex Model. Moreover, Pakistan Dairy Development
Company has also taken an initiative to develop this kind of alternative source of energy for Pakistani farmers. Biogas is now running diesel engines, gas
generators, kitchen ovens, geysers, and other utilities in Pakistan. In Nepal, the government provides subsidies to build biogas plant.
[edit]China
The Chinese have been experimenting with the applications of biogas since 1958. Around 1970, China had installed 6,000,000 digesters in an effort to
make agriculture more efficient. During the last years the technology has met high growth rates. This seems to be the earliest developments in generating
biogas from agricultural waste.
[edit]In developing nations
Domestic biogas plants convert livestock manure and night soil into biogas and slurry, the fermented manure. This technology is feasible for small holders
with livestock producing 50 kg manure per day, an equivalent of about 6 pigs or 3 cows. This manure has to be collectable to mix it with water and feed it
into the plant. Toilets can be connected. Another precondition is the temperature that affects the fermentation process. With an optimum at 36 C° the
technology especially applies for those living in a (sub) tropical climate. This makes the technology for small holders in developing countries often suitable.

Simple sketch of household biogas plant
Depending on size and location, a typical brick made fixed dome biogas plant can be installed at the yard of a rural household with the investment
between 300 to 500 US $ in Asian countries and up to 1400 US $ in the African context. A high quality biogas plant needs minimum maintenance costs
and can produce gas for at least 15–20 years without major problems and re-investments. For the user, biogas provides clean cooking energy, reduces
indoor air pollution, and reduces the time needed for traditional biomass collection, especially for women and children. The slurry is a clean organic
fertilizer that potentially increases agricultural productivity.
Domestic biogas technology is a proven and established technology in many parts of the world, especially Asia.[50] Several countries in this region have
embarked on large-scale programmes on domestic biogas, such as China[51][52] and India. The Netherlands Development Organisation, SNV,[53] supports
national programmes on domestic biogas that aim to establish commercial-viable domestic biogas sectors in which local companies market, install and
service biogas plants for households. In Asia, SNV is working in Nepal,[54] Vietnam,[55]Bangladesh,[56] Bhutan, Cambodia,[56] Lao PDR,[57] Pakistan[58] and
Indonesia,[59] and in Africa; Rwanda,[60] Senegal, Burkina Faso, Ethiopia,[61] Tanzania,[62] Uganda, Kenya, Benin and Cameroon.
[edit]In popular culture
In the 1985 Australian film Mad Max Beyond Thunderdome the post-apocalyptic settlement Bartertown is powered by a central biogas system based upon
a piggery. As well as providing electricity, methane is used to power Bartertown's vehicles.
[edit]See also


2.1.1.4-Carbon dioxide air captureCarbon dioxide removalFrom Wikipedia, the free encyclopedia
(Redirected from Carbon dioxide air capture)
Carbon dioxide removal (CDR) methods refers to a number of technologies which reduce the levels of carbon dioxide in the atmosphere.[1] Among such technologies
are bio-energy with carbon capture and storage, biochar, direct air capture, ocean fertilization and enhanced weathering.[1] CDR is a different approach to removing
CO2 from the stack emissions of large fossil fuel point sources, such as power stations, as this reduces emission to the atmosphere but cannot reduce the amount of carbon
dioxide already in the atmosphere. It is by some regarded as a branch ofgeoengineering,[1] while other commentators regard CDR as a form of carbon capture and
storage.[2]
CDR methods are supported by a range of individuals and organisations such as IPCC chief Rajendra Pachauri,[3] the UNFCCC executive secretary Christiana
Figueres,[4] the World Watch Institute,[5] the World Wide Fund for Nature WWF[6] and the Lenfest Center for Sustainable Energy at the Earth Institute, Columbia
University,[7] and the OECD.[8]
As CDR removes carbon dioxide from the atmosphere, it creates negative emissions, which is a cost effective way of dealing with small and dispersed point sources such
as domestic heating systems, airplanes and vehicle exhausts.[9][10]
The mitigation effectiveness of air capture is limited by societal investment, land use, and availability of geologic reservoirs. These reservoirs are estimated to be
sufficient to sequester all anthropogenically generated CO2.[11]
Contents
[hide]
1 Methods
o 1.1 Bio-energy with carbon capture and storage
o 1.2 Biochar
o 1.3 Enhanced weathering

o 1.4 Artificial trees
o 1.5 Scrubbing towers
1.5.1 Example CO2 scrubbing chemistry
o 1.6 Quicklime process
2 Economic factors
3 See also
4 References
[edit]Methods
[edit]Bio-energy with carbon capture and storage
Main article: Bio-energy with carbon capture and storage
Bio-energy with carbon capture and storage, or BECCS, utilises biomass to extract carbon dioxide from the atmosphere, and carbon capture and storage technologies to
concentrate and permanently store it in deep geological formations.
BECCS is currently (as of October 2012) the only CDR technology deployed at full industrial scale, with 550 000 tonnes CO2/year in total capacity operating, divided
between three different facilities (as of January 2012).[12][13][14][15][16]
The Imperial College London, the UK Met Office Hadley Centre for Climate Prediction and Research, the Tyndall Centre for Climate Change Research, the Walker
Institute for Climate System Research, and the Grantham Institute for Climate Change issued a joint report on carbon dioxide removal technologies as part of the AVOID:
Avoiding dangerous climate change research program, stating that "Overall, of the technologies studied in this report, BECCS has the greatest maturity and there are no
major practical barriers to its introduction into today’s energy system. The presence of a primary product will support early deployment."[17]
According to the OECD, "Achieving lower concentration targets (450 ppm) depends significantly on the use of BECCS".[8]
[edit]Biochar
Main article: Biochar

[edit]Enhanced weathering
Main article: Enhanced weathering
Enhanced weathering refers to chemical approach to geoengineering involving land or ocean based techniques. Examples of land based enhanced weathering techniques
are in-situ carbonation of silicates. Ultramafic rocks, for example, have the potential to store thousands of years worth of CO2 emissions according to one estimate. Ocean
based techniques involve alkalinity enhancement, such as, grinding, dispersing and dissolving olivine, limestone, silicates, or calcium hydroxide to address ocean
acidification and CO2 sequestration. Enhanced weathering is considered as one of the least expensive of geoengineering options. One example of a research project on the
feasibility of enhanced weathering is the CarbFix project in Iceland.[citation needed]
[edit]Artificial trees
A notable example of an atmospheric scrubbing process are the artificial trees.[18][19] This concept, proposed by climate scientist Wallace S. Broecker and science
writer Robert Kunzig,[20]imagines huge numbers of artificial trees around the world to remove ambient CO2. The technology is now being pioneered by Klaus Lackner, a
researcher at the Earth Institute, Columbia University,[21] whose artificial tree technology can suck up to 1,000 times more CO2 from the air than real trees can,[citation
needed] at a rate of about one ton of carbon per day if the artificial tree is approximately the size of an actual tree.[22][23] The CO2 would be captured in a filter and then
removed from the filter and stored.
The chemistry used is a variant of that described below, as it is based on sodium hydroxide. However, in a more recent design proposed by Klaus Lackner, the process
can be carried out at only 40 °C by using a polymer-based ion exchange resin, which takes advantage of changes in humidity to prompt the release of captured CO2,
instead of using a kiln. This reduces the energy required to operate the process.[24]
[edit]Scrubbing towers
In 2008, the Discovery Channel covered[25] the work of David Keith,[26] of University of Calgary, who built a tower, 4 feet wide and 20 feet tall, with a fan at the bottom
that sucks air in, which comes out again at the top. In the process, about half the CO2 is removed from the air.
This device uses the chemical process described in detail below. The system demonstrated on the Discovery Channel was a 1/90,000th scale test system of the capture
section, the reagents are regenerated in a separate facility. The main costs of a the full plant will be the cost to build it, and the energy input to regenerate the chemicals
and produce a pure stream of CO2.

To put this into perspective, people in the U.S. emit about 20 tonnes of CO2 per person annually.[citation needed] In other words, each person in the U.S. would require a tower
like the one featured by the Discovery Channel to remove this amount of CO2 from the air, requiring an annual 2 Megawatt-hours of electricity to operate it. By
comparison, a refrigerator consumes about 1.2 Megawatt-hours annually (2001 figures).[27] But by combining many small systems such as this into one large system the
construction costs and energy use can be reduced.
It has been proposed that the Solar updraft tower to generate electricity from thermal air currents also be used at the same time for amine gravity scrubbing of
CO2.[28] Some heat would be required to regenerate the amine.
[edit]Example CO2 scrubbing chemistry
Main article: Carbon dioxide scrubber
[edit]Quicklime process
Quicklime will absorb CO2 from atmospheric air mixed with steam at 400 °C (forming calcium carbonate) and release it at 1,000 °C. This process, proposed by Steinfeld,
can be performed usingrenewable energy from thermal concentrated solar power.[29]
[edit]Economic factors
A crucial issue for CDR methods is their cost, which differs substantially among the different technologies, some which are not developed enough to perform cost
assessments of. The American Physical Society estimates the costs for direct air capture to $600/tonne with optimistic assumptions.[30] The IEA Greenhouse Gas R&D
Programme and Ecofys provides an estimate where 3.5 billion tonnes could be removed annually from the atmosphere with BECCS (Bio-Energy with Carbon Capture
and Storage) at carbon prices as low as €50,[31] whereas a report from Biorecro and the Global Carbon Capture and Storage Institute estimates costs "below €100" per
tonne for large scale BECCS deployment.[2]
Legal regulation like carbon permits, carbon taxes, or rebates can be implemented to reduce carbon emission. Governing entities can distribute or sell carbon permits to
industries for the rights to emit a certain amount of carbon dioxide. If the certificates are tradable, then polluting organizations can buy certificates from their less
polluting counterparts. Theoretically this will encourages polluting industries to develop technologies that emit less carbon dioxide because they won’t have to buy extra
carbon permits from others. Overtime the demand for carbon dioxide certificates will drop in price because fewer entities need to buy them.

Carbon taxes respond similarly to carbon credit but require regulating as technology changes. Carbon taxes address the external social cost among the emitters by taxing
either the supplier or the buyer. Either way, buyers are going to end up facing higher prices. Higher prices will discourage consumers, demand will fall, and suppliers will
have to cut back production.
Rebates are popular among producers and consumers alike. If the government has enough money in their coffers, they can create a program which offers rebates to
consumers for buying pricy energy efficient, water saving, or environmental friendly product. Consumers can now afford new fancy products while producers reap the
profits from selling their high-end products.
[edit]See also
Bio-energy with carbon capture and storage (BECCS)
Climate change mitigation
Climate change mitigation scenarios
Geoengineering
Greenhouse gas remediation
Lithium peroxide
List of emerging technologies
Low-carbon economy
Negative carbon dioxide emission
Virgin Earth Challenge[edit]
2.1.1.5-Dissolved oxygen
Oxygen saturationFrom Wikipedia, the free encyclopedia
(Redirected from Dissolved oxygen)
Oxygen saturation or dissolved oxygen (DO) is a relative measure of the amount of oxygen that is dissolved or carried in a given medium. It can be
measured with a dissolved oxygen probe such as an oxygen sensor or an optode in liquid media, usually water. The standard unit is milligrams per litre
(ppm), or mgL-1.
Oxygen saturation can be measured regionally and non-invasively. Arterial oxygenation is commonly measured using pulse oximetry. Tissue saturation at
peripheral scale can be measured usingNIRS. This technique can be applied on both muscle and brain.
[edit]Oxygen in medicine
Main article: Oxygenation (medical)
In medicine, oxygen saturation refers to oxygenation, or when oxygen molecules (O2) enter the tissues of the body. In this case blood is oxygenated in
the lungs, where oxygen molecules travel from the air and into the blood. Oxygen saturation, or (O2) sats measure the percentage of hemoglobin binding
sites in the bloodstream occupied by oxygen. Fish, invertebrates, plants, and aerobic bacteria all require oxygen for respiration. Blood is also vital to the
body system. The optimal levels in an estuary for Dissolved Oxygen (DO) is higher than 6 ppm.
[edit]Environmental oxygen saturation
Main article: Oxygenation (environmental)

Oxygen saturation in the environment generally refers to the amount of oxygen dissolved in the soil or bodies of water. Environmental oxygenation can be
important to the sustainability of a particular ecosystem. A well-mixed body of water will be fully saturated, with approximately 10mg/L at 15 °C (here is a
table of dissolved oxygen versus temperature). Insufficient oxygen (environmental hypoxia), often caused by the decomposition of organic matter, may
occur in bodies of water such as ponds and rivers, tending to suppress the presence of aerobic organismssuch as fish. Deoxygenation increases the
relative population of anaerobic organisms such as plants and some bacteria, resulting in fish kills and other adverse events. The net effect is to alter
the balance of nature by increasing the concentration of anaerobic over aerobic species.

2.1.1.6-Environmental issues with energy
Environmental impact of the energy industryFrom Wikipedia, the free encyclopedia
(Redirected from Environmental issues with energy)

Rate of world energy usage in terawatts (TW), 1965-2005.[1]
Energy consumption per capita per country (2001). Red hues indicate increase, green hues decrease of consumption during the 1990s.[2]
The environmental impact of the energy industry is diverse. Energy has been harnessed by humans for millennia. Initially it was with the use of fire for
light, heat, cooking and for safety, and its use can be traced back at least 1.9 million years.[3] In recent years there has been a trend towards the
increased commercialization of various renewable energy sources.
Consumption of fossil fuel resources lead to global warming and climate change. In most parts of the world little change is being made to slow these
changes. If the peak oil theory proves true, and more explorations of viable alternative energy sources are made, our impact could be less hostile to our
environment.
Rapidly advancing technologies can achieve a transition of energy generation, water and waste management, and food production towards better
environmental and energy usage practices using methods of systems ecology and industrial ecology.[4][5]

Contents
[hide]
1 Issues
o 1.1 Climate change
o 1.2 Biofuel use
1.2.1 Bio-diesel
1.2.2 Firewood
o 1.3 Fossil fuel use
1.3.1 Coal
1.3.2 Petroleum
1.3.3 Gas
o 1.4 Electricity generation
o 1.5 Reservoirs
o 1.6 Nuclear power
o 1.7 Wind power
2 Mitigation
o 2.1 Energy conservation
o 2.2 Energy policy
o 2.3 Sustainable energy
2.3.1 Economic instruments
3 See also
4 References
5 External links
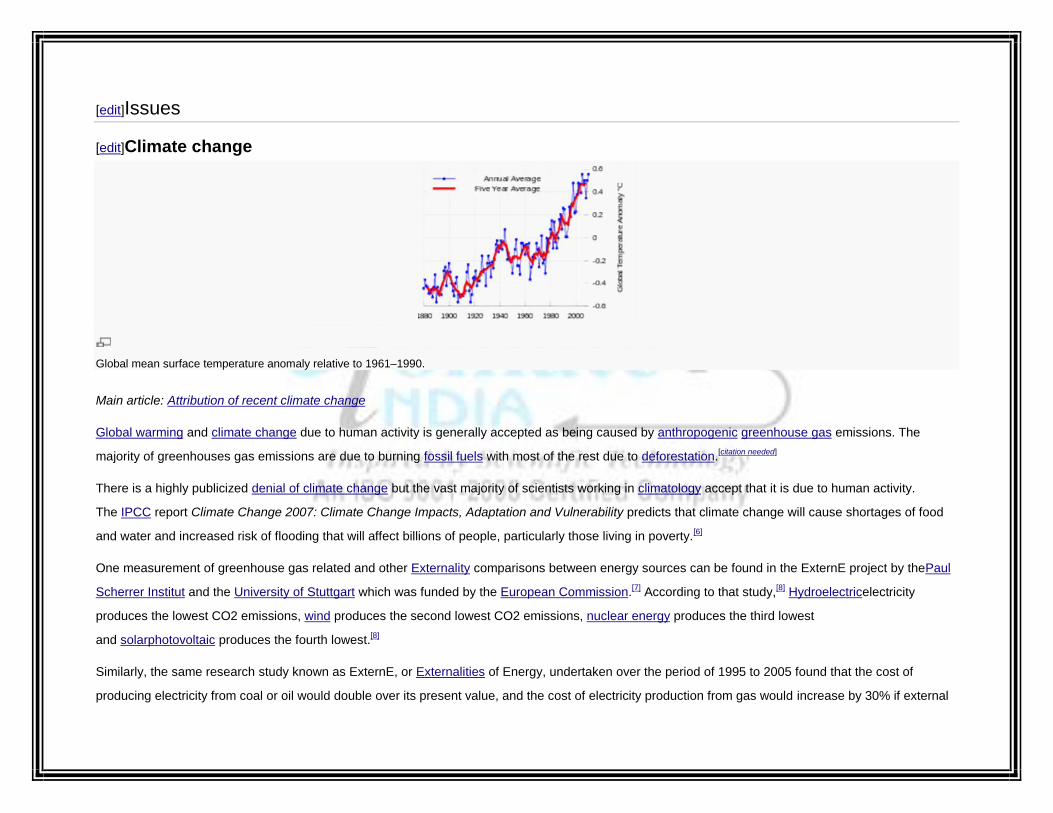
[edit]Issues
[edit]Climate change
Global mean surface temperature anomaly relative to 1961–1990.
Main article: Attribution of recent climate change
Global warming and climate change due to human activity is generally accepted as being caused by anthropogenic greenhouse gas emissions. The
majority of greenhouses gas emissions are due to burning fossil fuels with most of the rest due to deforestation.[citation needed]
There is a highly publicized denial of climate change but the vast majority of scientists working in climatology accept that it is due to human activity.
The IPCC report Climate Change 2007: Climate Change Impacts, Adaptation and Vulnerability predicts that climate change will cause shortages of food
and water and increased risk of flooding that will affect billions of people, particularly those living in poverty.[6]
One measurement of greenhouse gas related and other Externality comparisons between energy sources can be found in the ExternE project by thePaul
Scherrer Institut and the University of Stuttgart which was funded by the European Commission.[7] According to that study,[8] Hydroelectricelectricity
produces the lowest CO2 emissions, wind produces the second lowest CO2 emissions, nuclear energy produces the third lowest
and solarphotovoltaic produces the fourth lowest.[8]
Similarly, the same research study known as ExternE, or Externalities of Energy, undertaken over the period of 1995 to 2005 found that the cost of
producing electricity from coal or oil would double over its present value, and the cost of electricity production from gas would increase by 30% if external

costs such as damage to the environment and to human health, from the airborne particulate matter, nitrogen oxides, chromium VI and arsenic emissions
produced by these sources, were taken into account. It was estimated in the study that these external, downstream, fossil fuel costs amount up to 1%-2%
of the EU’s entire Gross Domestic Product (GDP), and this was before the external cost of global warming from these sources was even included.[9] The
study also found that the environmental and health costs of nuclear power, per unit of energy delivered, was €0.0019/kWh, which was found to be lower
than that of many renewable sources including that caused by biomass and photovoltaic solar panels, and was thirty times lower than coal at €0.06/kWh,
or 6 cents/kWh, with the energy sources of the lowest external environmental and health costs associated with it being wind power at €0.0009/kWh.[10]
[edit]Biofuel use
Biofuel is defined as solid, liquid or gaseous fuel obtained from relatively recently lifeless or living biological material and is different from fossil fuels, which
are derived from long dead biological material. Also, various plants and plant-derived materials are used for biofuel manufacturing.
[edit]Bio-diesel
Main article: Environmental effects of biodiesel
See also: Indirect land use change impacts of biofuels and Sustainable biofuel
High use of bio-diesel leads to land use changes including deforestation.
[edit]Firewood
Unsustainable firewood harvesting can lead to loss of biodiversity and erosion due to loss of forest cover. An example of this is a 40 year study done by
the University of Leeds of African forests, which account for a third of the world's total tropical forest which demonstrates that Africa is a significant carbon
sink. A climate change expert, Lee White states that "To get an idea of the value of the sink, the removal of nearly 5 billion tonnes of carbon dioxide from
the atmosphere by intact tropical forests is at issue.
According to the U.N. the continent is losing forest twice as fast as the rest of the world. "Once upon a time, Africa boasted seven million square
kilometers of forest but a third of that has been lost, most of it to charcoal."[11]
[edit]Fossil fuel use

Global fossil carbon emission by fuel type, 1800-2007 AD.
The three fossil fuel types are coal, petroleum and natural gas. It was estimated by the Energy Information Administration that in 2006 primary sources of
energy consisted of petroleum 36.8%, coal 26.6%, natural gas 22.9%, amounting to an 86% share for fossil fuels in primary energy production in the
world.[12]
The burning of fossil fuels produces around 21.3 billion tonnes (21.3 gigatonnes) of carbon dioxide per year, but it is estimated that natural processes can
only absorb about half of that amount, so there is a net increase of 10.65 billion tonnes of atmospheric carbon dioxide per year (one tonne of atmospheric
carbon is equivalent to 44/12 or 3.7 tonnes of carbon).[13] Carbon dioxide is one of the greenhouse gases that enhances radiative forcingand contributes
to global warming, causing the average surface temperature of the Earth to rise in response, which climate scientists agree will cause major
adverse effects.
[edit]Coal
Main article: Environmental impact of coal mining and burning
The environmental impact of coal mining and burning is diverse.[14] Legislation passed by the U.S. Congress in 1990 required the United States
Environmental Protection Agency (EPA) to issue a plan to alleviate toxic pollution from coal-fired power plants. After delay and litigation, the EPA now has
a court-imposed deadline of March 16, 2011, to issue its report.
[edit]Petroleum

Main article: Environmental impact of petroleum
A beach after an oil spill
The environmental impact of petroleum is often negative because it is toxic to almost all forms of life. The possibility of climate change exists. Petroleum,
commonly referred to as oil, is closely linked to virtually all aspects of present society, especially for transportation and heating for both homes and for
commercial activities.
[edit]Gas
Natural gas is often described as the cleanest fossil fuel, producing less carbon dioxide per joule delivered than either coal or oil.,[15] and far fewer
pollutants than other fossil fuels. However, in absolute terms it does contribute substantially to global carbon emissions, and this contribution is projected
to grow. According to the IPCC Fourth Assessment Report,[16] in 2004 natural gas produced about 5,300 Mt/yr of CO2 emissions, while coal and oil
produced 10,600 and 10,200 respectively (Figure 4.4); but by 2030, according to an updated version of the SRES B2 emissions scenario, natural gas
would be the source of 11,000 Mt/yr, with coal and oil now 8,400 and 17,200 respectively. (Total global emissions for 2004 were estimated at over 27,200
Mt.)
In addition, natural gas itself is a greenhouse gas far more potent than carbon dioxide when released into the atmosphere but is released in smaller
amounts.

[edit]Electricity generationMain article: Environmental impact of electricity generation
The environmental impact of electricity generation is significant because modern society uses large amounts of electrical power. This power is
normally generated at power plants that convert some other kind of energy into electrical power. Each such system has advantages and disadvantages,
but many of them pose environmental concerns.
[edit]ReservoirsMain article: Environmental impact of reservoirs
The environmental impact of reservoirs is coming under ever increasing scrutiny as the world demand for water and energy increases and the number and
size of reservoirs increases. Dams and the reservoirs can be used to supply drinking water, generate hydroelectric power, increasing the water supply
for irrigation, provide recreational opportunities and to improve certain aspects of the environment. However, adverse environmental and sociological
impacts have also been identified during and after many reservoir constructions. Whether reservoir projects are ultimately beneficial or detrimental—to
both the environment and surrounding human populations— has been debated since the 1960s and probably long before that. In 1960 the construction
of Llyn Celyn and the flooding of Capel Celyn provoked political uproar which continues to this day. More recently, the construction of Three Gorges
Dam and other similar projects throughout Asia, Africa and Latin America have generated considerable environmental and political debate.
[edit]Nuclear powerMain article: Environmental impact of nuclear power

Nuclear power activities involving the environment; mining, enrichment, generation and geological disposal.
The environmental impact of nuclear power results from the nuclear fuel cycle, operation, and the effects of accidents such as the Chernobyl
disaster(1986) and Fukushima I nuclear accidents (2011).
[edit]Wind powerMain article: Environmental impact of wind power
Compared to the environmental effects of traditional energy sources, the environmental effects of wind power are relatively minor. Wind power consumes
no fuel, and emits almost negligible air pollution, unlike fossil fuel power sources. The energy consumed to manufacture and transport the materials used
to build a wind power plant is equal to the new energy produced by the plant within a few months. While a wind farm may cover a large area of land, many
land uses such as agriculture are compatible, with only small areas of turbine foundations and infrastructure made unavailable for use.[17]
A study published in Atmospheric Chemistry and Physics suggested that using wind turbines to meet 10 percent of global energy demand in 2100 could
have a global warming effect, causing temperatures to rise by 1 °C (1.8 °F) in the regions on land where the wind farms are installed, including a smaller
increase in areas beyond those regions. This is due to the effect of wind turbines on both horizontal and vertical atmospheric circulation. Whilst turbines
installed in water would have a cooling effect, the net impact on global surface temperatures would be an increase of 0.15 °C (0.27 °F). Author Ron Prinn
cautioned against interpreting the study "as an argument against wind power, urging that it be used to guide future research". "We’re not pessimistic about
wind," he said. "We haven’t absolutely proven this effect, and we’d rather see that people do further research".[18]
[edit]Mitigation
[edit]Energy conservationMain article: Energy conservation
Energy conservation refers to efforts made to reduce energy consumption. Energy conservation can be achieved through increased efficient energy use,
in conjunction with decreased energy consumption and/or reduced consumption from conventional energy sources.

Energy conservation can result in increased financial capital, environmental quality, national security, personal security, and human comfort.[citation
needed] Individuals and organizations that are direct consumers of energy choose to conserve energy to reduce energy costs and promote economic
security. Industrial and commercial users can increase energy use efficiency to maximizeprofit.
[edit]Energy policyMain article: Energy policy
Energy policy is the manner in which a given entity (often governmental) has decided to address issues of energy development including energy
production, distribution and consumption. The attributes of energy policy may include legislation, international treaties, incentives to investment, guidelines
for energy conservation, taxation and other public policy techniques.
[edit]Sustainable energyMain article: Sustainable energy
Sustainable energy is the provision of energy that meets the needs of the present without compromising the ability of future generations to meet their
needs. Sustainable energy sources are most often regarded as including all renewable energy sources, such as hydroelectricity, solar energy, wind
energy, wave power, geothermal energy, bioenergy, and tidal power. It usually also includes technologies that improve energy efficiency.
[edit]Economic instruments
Various economic instruments can be used to steer society toward sustainable energy. Some of these methods include ecotaxes and emissions trading.
Ecological economics aims to address some of the interdependence and coevolution of human economies and natural ecosystems over time and
space.[19] Environmental economics, is themainstream economic analysis of the environment, which views the economy as a subsystem of the ecosystem,
while ecological economics emphasis is upon preserving natural capital.[20] [21]
Biophysical economics sometimes referred to as thermoeconomics is discussed in the field of ecological economics and relates directly to energy
conversion, which itself is related to the fields ofsustainability and sustainable development especially in the area of carbon burning.[22]
[edit]See also

Energy portal
Environment portal
Ecology portal
List of environmental issues
Energy
Energy economics
Energy accounting
Energy transformation
Energetics
Energy quality
Ecological energetics
Systems ecology
Thermoeconomics
Industrial ecology
Index of energy articles
Energy and Environment
Environmental impact of aviation
The Venus Project
Environmental impact of electricity generation
[edit]References

2.1.1.7-Eutrophication

EutrophicationFrom Wikipedia, the free encyclopedia
The eutrophication of the Potomac Riveris evident from the bright green water, caused by a dense bloom of cyanobacteria.
Eutrophication (Greek: eutrophia—healthy, adequate nutrition, development; German: Eutrophie) or more precisely hypertrophication, is the
ecosystem response to the addition of artificial or natural substances, such as nitrates and phosphates, through fertilizers or sewage, to an aquatic
system.[1] One example is the "bloom" or great increase of phytoplankton in a water body as a response to increased levels of nutrients. Negative
environmental effects include hypoxia, the depletion of oxygen in the water, which induces reductions in specific fish and other animal populations. Other
species (such as Nomura's jellyfish in Japanese waters) may experience an increase in population that negatively affects other species.
Contents
[hide]

1 Lakes and rivers
2 Ocean waters
3 Terrestrial ecosystems
4 Ecological effects
o 4.1 Decreased biodiversity
o 4.2 New species invasion
o 4.3 Toxicity
5 Sources of high nutrient runoff
o 5.1 Point sources
o 5.2 Nonpoint sources
5.2.1 Soil retention
5.2.2 Runoff to surface water and leaching to groundwater
5.2.3 Atmospheric deposition
o 5.3 Other causes
6 Prevention and reversal
o 6.1 Effectiveness
o 6.2 Minimizing nonpoint pollution: future work
6.2.1 Riparian buffer zones
6.2.2 Prevention policy
6.2.3 Nitrogen testing and modeling
6.2.4 Organic farming
7 Cultural eutrophication

8 See also
9 References
10 External links
[edit]Lakes and rivers
Eutrophication can be human-caused or natural. Untreated sewage effluent and agricultural run-off carrying fertilizers are examples of human-caused
eutrophication. However, it also occurs naturally in situations where nutrients accumulate (e.g. depositional environments), or where they flow into
systems on an ephemeral basis. Eutrophication generally promotes excessive plant growth and decay, favouring simple algae and plankton over other
more complicated plants, and causes a severe reduction in water quality. Phosphorus is a necessary nutrient for plants to live, and is the limiting factor for
plant growth in many freshwater ecosystems. The addition of phosphorus increases algal growth, but not all phosphates actually feed algae.[2] These
algae assimilate the other necessary nutrients needed for plants and animals. When algae die they sink to the bottom where they are decomposed and
the nutrients contained in organic matter are converted into inorganic form by bacteria. The decomposition process uses oxygen and deprives the deeper
waters of oxygen which can kill fish and other organisms. Also the necessary nutrients are all at the bottom of the aquatic ecosystem and if they are not
brought up closer to the surface, where there is more available light allowing for photosynthesis for aquatic plants, a serious strain is placed on algae
populations. Enhanced growth of aquatic vegetation or phytoplankton and algal blooms disrupts normal functioning of the ecosystem, causing a variety of
problems such as a lack of oxygenneeded for fish and shellfish to survive. The water becomes cloudy, typically coloured a shade of green, yellow, brown,
or red. Eutrophication also decreases the value of rivers, lakes, and estuaries for recreation, fishing, hunting, and aesthetic enjoyment. Health problems
can occur where eutrophic conditions interfere with drinking water treatment.[3]
Eutrophication was recognized as a water pollution problem in European and North American lakes and reservoirs in the mid-20th century.[4] Since then, it
has become more widespread. Surveys showed that 54% of lakes in Asia are eutrophic; in Europe, 53%; in North America, 48%; in South America, 41%;
and in Africa, 28%.[5]
Although eutrophication is commonly caused by human activities, it can also be a natural process particularly in lakes. Eutrophy occurs in many lakes in
temperate grasslands, for instance.Paleolimnologists now recognise that climate change, geology, and other external influences are critical in regulating
the natural productivity of lakes. Some lakes also demonstrate the reverse process (meiotrophication), becoming less nutrient rich with time.[6][7]

Eutrophication can also be a natural process in seasonally inundated tropical floodplains. In the Barotse Floodplain of the Zambezi River, the first
floodwaters of the rainy season are usuallyhypoxic because of material such as cattle manure and previous decay of vegetation which grew during the dry
season. These so-called "red waters" kill many fish.[8] The process can be made worse by the use of fertilizers in crops such as maize, rice, and
sugarcane grown on the floodplain.
Human activities can accelerate the rate at which nutrients enter ecosystems. Runoff from agriculture and development, pollution from septic
systems and sewers, and other human-related activities increase the flow of both inorganic nutrients and organic substances into ecosystems. Elevated
levels of atmospheric compounds of nitrogen can increase nitrogen availability.Phosphorus is often regarded as the main culprit in cases of eutrophication
in lakes subjected to "point source" pollution from sewage pipes. The concentration of algae and the trophic state of lakes correspond well to phosphorus
levels in water. Studies conducted in the Experimental Lakes Area in Ontario have shown a relationship between the addition of phosphorus and the rate
of eutrophication. Humankind has increased the rate of phosphorus cycling on Earth by four times, mainly due to agricultural fertilizer production and
application. Between 1950 and 1995, an estimated 600,000,000 tonnes of phosphorus were applied to Earth's surface, primarily on croplands.[9] Policy
changes to control point sources of phosphorus have resulted in rapid control of eutrophication.[citation needed]
[edit]Ocean waters
Eutrophication is a common phenomenon in coastal waters. In contrast to freshwater systems, nitrogen is more commonly the key limiting nutrient of
marine waters; thus, nitrogen levels have greater importance to understanding eutrophication problems in salt water. Estuaries tend to be naturally
eutrophic because land-derived nutrients are concentrated where run-off enters a confined channel. Upwelling in coastal systems also promotes
increased productivity by conveying deep, nutrient-rich waters to the surface, where the nutrients can be assimilated by algae.
The World Resources Institute has identified 375 hypoxic coastal zones in the world, concentrated in coastal areas in Western Europe, the Eastern and
Southern coasts of the US, and East Asia, particularly Japan.[10]
In addition to runoff from land, atmospheric fixed nitrogen can enter the open ocean. A study in 2008 found that this could account for around one third of
the ocean’s external (non-recycled) nitrogen supply, and up to 3% of the annual new marine biological production.[11] It has been suggested that
accumulating reactive nitrogen in the environment may prove as serious as putting carbon dioxide in the atmosphere.[12]
[edit]Terrestrial ecosystems

Terrestrial ecosystems are subject to similarly adverse impacts from eutrophication.[13] Increased nitrates in soil are frequently undesirable for plants.
Many terrestrial plant species are endangered as a result of soil eutrophication, such as the majority of orchid species in Europe.[14] Meadows, forests, and
bogs are characterized by low nutrient content and slowly growing species adapted to those levels, so they can be overgrown by faster growing and more
competitive species. In meadows, tall grasses that can take advantage of higher nitrogen levels may change the area so that natural species may be lost.
Species-rich fens can be overtaken by reed or reedgrass species. Forest undergrowth affected by run-off from a nearby fertilized field can be turned into a
nettle and bramble thicket.
Chemical forms of nitrogen are most often of concern with regard to eutrophication, because plants have high nitrogen requirements so that additions of
nitrogen compounds will stimulate plant growth. Nitrogen is not readily available in soil because N2, a gaseous form of nitrogen, is very stable and
unavailable directly to higher plants. Terrestrial ecosystems rely on microbial nitrogen fixation to convert N2 into other forms such as nitrates. However,
there is a limit to how much nitrogen can be utilized. Ecosystems receiving more nitrogen than the plants require are called nitrogen-saturated. Saturated
terrestrial ecosystems then can contribute both inorganic and organic nitrogen to freshwater, coastal, and marine eutrophication, where nitrogen is also
typically alimiting nutrient.[15] This is also the case with increased levels of phosphorus. However, because phosphorus is generally much less soluble than
nitrogen, it is leached from the soil at a much slower rate than nitrogen. Consequently, phosphorus is much more important as a limiting nutrient in aquatic
systems.[16]
[edit]Ecological effects

Eutrophication is apparent as increased turbidity in the northern part of the Caspian Sea, imaged from orbit.
Many ecological effects can arise from stimulating primary production, but there are three particularly troubling ecological impacts: decreased biodiversity,
changes in species composition and dominance, and toxicity effects.
Increased biomass of phytoplankton
Toxic or inedible phytoplankton species
Increases in blooms of gelatinous zooplankton
Increased biomass of benthic and epiphytic algae
Changes in macrophyte species composition and biomass
Decreases in water transparency (increased turbidity)
Colour, smell, and water treatment problems
Dissolved oxygen depletion
Increased incidences of fish kills
Loss of desirable fish species
Reductions in harvestable fish and shellfish
Decreases in perceived aesthetic value of the water body
[edit]Decreased biodiversity
When an ecosystem experiences an increase in nutrients, primary producers reap the benefits first. In aquatic ecosystems, species such as algae
experience a population increase (called analgal bloom). Algal blooms limit the sunlight available to bottom-dwelling organisms and cause wide swings in
the amount of dissolved oxygen in the water. Oxygen is required by all aerobicallyrespiring plants and animals and it is replenished in daylight
by photosynthesizing plants and algae. Under eutrophic conditions, dissolved oxygen greatly increases during the day, but is greatly reduced after dark by
the respiring algae and by microorganisms that feed on the increasing mass of dead algae. When dissolved oxygen levels decline to hypoxic levels, fish
and other marine animals suffocate. As a result, creatures such as fish, shrimp, and especially immobile bottom dwellers die off.[17] In extreme

cases, anaerobic conditions ensue, promoting growth of bacteria such as Clostridium botulinum that produces toxins deadly to birds and mammals. Zones
where this occurs are known as dead zones.
[edit]New species invasion
Eutrophication may cause competitive release by making abundant a normally limiting nutrient. This process causes shifts in the species composition of
ecosystems. For instance, an increase in nitrogen might allow new, competitive species to invade and out-compete original inhabitant species. This has
been shown to occur[18] in New England salt marshes.
[edit]Toxicity
Some algal blooms, otherwise called "nuisance algae" or "harmful algal blooms", are toxic to plants and animals. Toxic compounds they produce can
make their way up the food chain, resulting in animal mortality.[19] Freshwater algal blooms can pose a threat to livestock. When the algae die or are
eaten, neuro- and hepatotoxins are released which can kill animals and may pose a threat to humans.[20][21] An example of algal toxins working their way
into humans is the case of shellfish poisoning.[22] Biotoxins created during algal blooms are taken up by shellfish (mussels, oysters), leading to these
human foods acquiring the toxicity and poisoning humans. Examples include paralytic, neurotoxic, and diarrhoetic shellfish poisoning. Other marine
animals can bevectors for such toxins, as in the case of ciguatera, where it is typically a predator fish that accumulates the toxin and then poisons
humans.
[edit]Sources of high nutrient runoff
Characteristics of point and nonpoint sources of chemical inputs ([9] modified from Novonty and Olem 1994)
Point sources
Wastewater effluent (municipal and industrial)
Runoff and leachate from waste disposal systems
Runoff and infiltration from animal feedlots

Runoff from mines, oil fields, unsewered industrial sites
Overflows of combined storm and sanitary sewers
Runoff from construction sites less than 20,000 m² (220,000 ft²)
Untreated sewage
Nonpoint sources
Runoff from agriculture/irrigation
Runoff from pasture and range
Urban runoff from unsewered areas
Septic tank leachate
Runoff from construction sites >20,000 m²
Runoff from abandoned mines
Atmospheric deposition over a water surface
Other land activities generating contaminants
In order to gauge how to best prevent eutrophication from occurring, specific sources that contribute to nutrient loading must be identified. There are two
common sources of nutrients and organic matter: point and nonpoint sources.
[edit]Point sources
Point sources are directly attributable to one influence. In point sources the nutrient waste travels directly from source to water. Point sources are relatively
easy to regulate.
[edit]Nonpoint sources
Nonpoint source pollution (also known as 'diffuse' or 'runoff' pollution) is that which comes from ill-defined and diffuse sources. Nonpoint sources are
difficult to regulate and usually vary spatially and temporally (with season, precipitation, and other irregular events).

It has been shown that nitrogen transport is correlated with various indices of human activity in watersheds,[23][24] including the amount of
development.[18] Ploughing in agriculture and development are activities that contribute most to nutrient loading. There are three reasons that nonpoint
sources are especially troublesome:[16]
[edit]Soil retention
Nutrients from human activities tend to accumulate in soils and remain there for years. It has been shown[25] that the amount ofphosphorus lost to surface
waters increases linearly with the amount of phosphorus in the soil. Thus much of the nutrient loading in soil eventually makes its way to water. Nitrogen,
similarly, has a turnover time of decades or more.
[edit]Runoff to surface water and leaching to groundwater
Nutrients from human activities tend to travel from land to either surface or ground water. Nitrogen in particular is removed throughstorm drains, sewage
pipes, and other forms of surface runoff. Nutrient losses in runoff and leachate are often associated withagriculture. Modern agriculture often involves the
application of nutrients onto fields in order to maximise production. However, farmers frequently apply more nutrients than are taken up by crops[26] or
pastures. Regulations aimed at minimising nutrient exports from agriculture are typically far less stringent than those placed on sewage treatment
plants[9] and other point source polluters. It should be also noted that lakes within forested land are also under surface runoff influences. Runoff can wash
out the mineral nitrogen and phosphorus from detritus and in consequence supply the water bodies leading to slow, natural eutrophication.[27]
[edit]Atmospheric deposition
Nitrogen is released into the air because of ammonia volatilization and nitrous oxide production. The combustion of fossil fuels is a large human-initiated
contributor to atmospheric nitrogen pollution. Atmospheric deposition (e.g., in the form of acid rain) can also affect nutrient concentration in
water,[28] especially in highly industrialized regions.
[edit]Other causes
Any factor that causes increased nutrient concentrations can potentially lead to eutrophication. In modeling eutrophication, the rate of water renewal plays
a critical role; stagnant water is allowed to collect more nutrients than bodies with replenished water supplies. It has also been shown that the drying
of wetlands causes an increase in nutrient concentration and subsequent eutrophication blooms.[29]
[edit]Prevention and reversal
Eutrophication poses a problem not only to ecosystems, but to humans as well. Reducing eutrophication should be a key concern when considering future
policy, and a sustainable solution for everyone, including farmers and ranchers, seems feasible. While eutrophication does pose problems, humans
should be aware that natural runoff (which causes algal blooms in the wild) is common in ecosystems and should thus not reverse nutrient concentrations
beyond normal levels.
[edit]Effectiveness
Cleanup measures have been mostly, but not completely, successful. Finnish phosphorus removal measures started in the mid-1970s and have targeted
rivers and lakes polluted by industrial and municipal discharges. These efforts have had a 90% removal efficiency.[30] Still, some targeted point sources did
not show a decrease in runoff despite reduction efforts.
[edit]Minimizing nonpoint pollution: future work
Nonpoint pollution is the most difficult source of nutrients to manage. The literature suggests, though, that when these sources are controlled,
eutrophication decreases. The following steps are recommended to minimize the amount of pollution that can enter aquatic ecosystems from ambiguous
sources.
[edit]Riparian buffer zones
Studies show that intercepting non-point pollution between the source and the water is a successful means of prevention.[9] Riparian buffer zones are
interfaces between a flowing body of water and land, and have been created near waterways in an attempt to filter pollutants; sediment and nutrients are
deposited here instead of in water. Creating buffer zones near farms and roads is another possible way to prevent nutrients from traveling too far. Still,
studies have shown[31] that the effects of atmospheric nitrogen pollution can reach far past the buffer zone. This suggests that the most effective means of
prevention is from the primary source.
[edit]Prevention policy
Laws regulating the discharge and treatment of sewage have led to dramatic nutrient reductions to surrounding ecosystems,[16] but it is generally agreed
that a policy regulating agricultural use offertilizer and animal waste must be imposed. In Japan the amount of nitrogen produced by livestock is adequate
to serve the fertilizer needs for the agriculture industry.[32] Thus, it is not unreasonable to command livestock owners to clean up animal waste—which
when left stagnant will leach into ground water.

Policy concerning the prevention and reduction of eutrophication can be broken down into four sectors: Technologies, public participation, economic
instruments, and cooperation.[33] The term technology is used loosely, referring to a more widespread use of existing methods rather than an appropriation
of new technologies. As mentioned before, nonpoint sources of pollution are the primary contributors to eutrophication, and their effects can be easily
minimized through common agricultural practices. Reducing the amount of pollutants that reach a watershed can be achieved through the protection of its
forest cover, reducing the amount of erosion leeching into a watershed. Also, through the efficient, controlled use of land using sustainable agricultural
practices to minimize land degradation, the amount of soil runoff and nitrogen-based fertilizers reaching a watershed can be reduced.[34] Waste disposal
technology constitutes another factor in eutrophication prevention. Because a major contributor to the nonpoint source nutrient loading of water bodies is
untreated domestic sewage, it is necessary to provide treatment facilities to highly urbanized areas, particularly those in underdeveloped nations, in which
treatment of domestic waste water is a scarcity.[35] The technology to safely and efficiently reuse waste water, both from domestic and industrial sources,
should be a primary concern for policy regarding eutrophication.
The role of the public is a major factor for the effective prevention of eutrophication. In order for a policy to have any effect, the public must be aware of
their contribution to the problem, and ways in which they can reduce their effects. Programs instituted to promote participation in the recycling and
elimination of wastes, as well as education on the issue of rational water use are necessary to protect water quality within urbanized areas and adjacent
water bodies.
Economic instruments, “which include, among others, property rights, water markets, fiscal and financial instruments, charge systems and liability
systems, are gradually becoming a substantive component of the management tool set used for pollution control and water allocation
decisions."[33] Incentives for those who practice clean, renewable, water management technologies are an effective means of encouraging pollution
prevention. By internalizing the costs associated with the negative effects on the environment, governments are able to encourage a cleaner water
management.
Because a body of water can have an effect on a range of people reaching far beyond that of the watershed, cooperation between different organizations
is necessary to prevent the intrusion of contaminants that can lead to eutrophication. Agencies ranging from state governments to those of water resource
management and non-governmental organizations, going as low as the local population, are responsible for preventing eutrophication of water bodies.
[edit]Nitrogen testing and modeling

Soil Nitrogen Testing (N-Testing) is a technique that helps farmers optimize the amount of fertilizer applied to crops. By testing fields with this method,
farmers saw a decrease in fertilizer application costs, a decrease in nitrogen lost to surrounding sources, or both.[36] By testing the soil and modeling the
bare minimum amount of fertilizer needed, farmers reap economic benefits while reducing pollution.
[edit]Organic farming
There has been a study that found that organically fertilized fields "significantly reduce harmful nitrate leaching" over conventionally fertilized
fields.[37] However, a more recent study found that eutrophication impacts are in some cases higher from organic production than they are from
conventional production.[38]
[edit]Cultural eutrophication
Cultural eutrophication is the process that speeds up natural eutrophication because of human activity.[39] Due to clearing of land and building of towns
and cities, land runoff is accelerated and more nutrients such as phosphates and nitrate are supplied to lakes and rivers, and then to coastal estuaries and
bays. Extra nutrients are also supplied by treatment plants, golf courses, fertilizers, and farms.
These nutrients result in an excessive growth of plant life known as an algal bloom. This can change a lake's natural food web, and also reduce the
amount of dissolved oxygen in the water for organisms to breathe. Both these things cause animal and plant death rates to increase as the plants take in
poisonous water while the animals drink the poisoned water. This contaminates water, making it undrinkable, and sediment quickly fills the lake. Cultural
eutrophication is a form of water pollution.

Cultural eutrophication also occurs when excessive fertilizers run into lakes and rivers. This encourages the growth of algae (algal bloom) and
other aquatic plants. Following this, overcrowding occurs and plants compete for sunlight, space and oxygen. Overgrowth of water plants also blocks
sunlight and oxygen for aquatic life in the water, which in turn threatens their survival. Algae also grows easily, thus threatening other water plants no
matter whether they are floating, half-submerged, or fully submerged. Not only does this cause algal blooming, it can cause an array of more long term
effects on the water such as damage to coral reefs and deep sea animal life. It also speeds up the damage of both marine and also affects humans if the
effects of algal blooming is too drastic. Fish will die and there will be lack of food in the area. Nutrient pollution is a major cause of algal blooming, and
should be minimized.
The Experimental Lakes Area (ELA), Ontario, Canada is a fully equipped, year-round, permanent field station that uses the whole ecosystem
approach and long-term, whole-lake investigations of freshwater focusing on cultural eutrophication. ELA is currently cosponsored by the Canadian
Departments of Environment and Fisheries and Oceans, with a mandate to investigate the aquatic effects of a wide variety of stresses on lakes and their
catchments [40][41]
[edit]See also
Algal bloom
Anaerobic digestion
Auxanography
Biodilution
Biogeochemical cycle
Coastal fish
Drainage basin
Fish kill
Hypoxia (environmental)
Hypoxia in fish
Lake Erie

Lake ecosystem
Limnology
Nitrogen cycle
No-till farming
Outwelling
Phoslock
Riparian zone
Upland and lowland (freshwater ecology)

2.1.1.8-Hypoxia (environmental)
Hypoxia (environmental)From Wikipedia, the free encyclopedia
Hypoxia refers to low oxygen conditions. Normally oxygen exerts a partial pressure of 20.9%[1] in the air. In water however; oxygen levels are much
lower,approximately 1%, and fluctuate locally depending on the presence of photosynthetic organisms and relative distance to the surface (there is more
oxygen in the air, which will diffuse across the partial pressure gradient).[2]
Contents
[hide]
1 Atmospheric hypoxia
2 Aquatic hypoxia
o 2.1 Where hypoxia occurs
o 2.2 Causes of hypoxia
o 2.3 Solutions

o 2.4 Bog chemistry
3 See also
4 References
5 External links
[edit]Atmospheric hypoxia
Atmospheric hypoxia occurs naturally at high altitudes. Total atmospheric pressure decreases as altitude increases, causing a lower partial pressure of
oxygen which is defined as hypobarichypoxia. Oxygen remains at 20.9% of the total gas mixture, differing from hypoxic hypoxia, where the percentage of
oxygen in the air (or blood) is decreased. This is common, for example, in the sealed burrows of some subterranean animals, such as blesmols.[3]
[edit]Aquatic hypoxia
Oxygen depletion, is a phenomenon that occurs in aquatic environments as dissolved oxygen (DO; molecular oxygen dissolved in the water) becomes
reduced in concentration to a point where it becomes detrimental to aquatic organisms living in the system. Dissolved oxygen is typically expressed as a
percentage of the oxygen that would dissolve in the water at the prevailing temperature and salinity (both of which affect the solubility of oxygen in water;
see oxygen saturation and underwater). An aquatic system lacking dissolved oxygen (0% saturation) is termed anaerobic, reducing, or anoxic; a system
with low concentration—in the range between 1 and 30% saturation—is called hypoxic or dysoxic. Most fish cannot live below 30% saturation. A
"healthy" aquatic environment should seldom experience less than 80%. The exaerobic zone is found at the boundary of anoxic and hypoxic zones.
[edit]Where hypoxia occurs
Hypoxia can occur throughout the water column and also at high altitudes as well as near sediments on the bottom. It usually extends throughout 20-50%
of the water column, but depending on the water depth and location of pycnoclines (rapid changes in water density with depth)[4] it can occur in 10-80% of
the water column. For example, in a 10-meter water column, it can reach up to 2 meters below the surface. In a 20-meter water column, it can extend up
to 8 meters below the surface.[5]
[edit]Causes of hypoxia

Decline of oxygen saturation to anoxia, measured during the night in Kiel Fjord, Germany. Depth = 5 m
Oxygen depletion can result from a number of natural factors, but is most often a concern as a consequence of pollution and eutrophication in which plant
nutrients enter a river, lake, or ocean, and phytoplankton blooms are encouraged. While phytoplankton, through photosynthesis, will raise DO saturation
during daylight hours, the dense population of a bloom reduces DO saturation during the night by respiration. When phytoplankton cells die, they sink
towards the bottom and are decomposed by bacteria, a process that further reduces DO in the water column. If oxygen depletion progresses
to hypoxia, fish kills can occur and invertebrates like worms and clams on the bottom may be killed as well.
Still frame from an underwater video of the sea floor. The floor is covered with crabs, fish, and clams apparently dead or dying from oxygen depletion.
Hypoxia may also occur in the absence of pollutants. In estuaries, for example, because freshwater flowing from a river into the sea is less dense than salt
water, stratification in the water column can result. Vertical mixing between the water bodies is therefore reduced, restricting the supply of oxygen from the

surface waters to the more saline bottom waters. The oxygen concentration in the bottom layer may then become low enough for hypoxia to occur. Areas
particularly prone to this include shallow waters of semi-enclosed water bodies such as the Waddenzee or the Gulf of Mexico, where land run-off is
substantial. In these areas a so-called "dead zone" can be created. The World Resources Institute has identified 375 hypoxic coastal zones around the
world, concentrated in coastal areas in Western Europe, the Eastern and Southern coasts of the US, and East Asia, particularly in Japan.[6]
Jubilee photo from Mobile Bay
Hypoxia may also be the explanation for periodic phenomena such as the Mobile Bay jubilee, where aquatic life suddenly rushes to the shallows, perhaps
trying to escape oxygen-depleted water. Recent widespread shellfish kills near the coasts of Oregon and Washington are also blamed on cyclic dead
zone ecology.[7]
[edit]Solutions
To combat hypoxia, it is essential to reduce the amount of land-derived nutrients reaching rivers in runoff. Defensively this can be done by improving
sewage treatment and by reducing the amount of fertilizers leaching into the rivers. Offensively this can be done by restoring natural environments along a
river; marshes are particularly effective in reducing the amount of phosphorus and nitrogen (nutrients) in water.
Technological solutions are also possible, such as that used in the redeveloped Salford Docks area of theManchester Ship Canal in England, where years
of runoff from sewers and roads had accumulated in the slow running waters. In 2001 a compressed air injection system was introduced, which raised the
oxygen levels in the water by up to 300%. The resulting improvement in water quality led to an increase in the number of invertebrate species, such as

freshwater shrimp, to more than 30. Spawning and growth rates of fish species such as roach and perch also increased to such an extent that they are
now amongst the highest in England.[8]
Graphs of oxygen and salinity levels at Kiel Fjord in September 1998.
In a very short time the oxygen saturation can drop to zero when offshore blowing winds drive surface water out and anoxic depthwater rises up. At the
same time a decline in temperature and a rise in salinity is observed (from the longterm ecological observatory in the seas at Kiel Fjord, Germany). New
approaches of long-term monitoring of oxygen regime in the ocean observe online the behavior of fish and zooplankton, which changes drastically under
reduced oxygen saturations (ecoSCOPE) and already at very low levels of water pollution.
[edit]Bog chemistry
In certain northern European sphagnum acidic bogs, a condition of hypoxia arises that prevents tissue decay by impeding micro-organisms in the soil and
groundwater. Remarkable preservation of human mummies has occurred in some cases such as the discovery of Haraldskær Woman andTollund
Man in Jutland, Denmark and Lindow man in Cheshire, England.

[edit]See also
Algal blooms
Altitude
Altitude atmospheric pressure variation
Anoxic event
Dead zone (ecology)
Denitrification
Eutrophication
Fish kill
Hypoxia in fish
Oxygen saturation
Wastewater quality indicators discusses both BOD and COD as measures of water quality.
Winkler test for dissolved oxygen — for instructions on how to determine the amount of oxygen dissolved in fresh water.
[edit]References

2.1.1.9-Mass balance
Mass balanceFrom Wikipedia, the free encyclopedia
This article needs additional citations for verification. Please help improve this article by adding citations to reliable sources.Unsourced material may be challenged and removed. (November 2008)
A mass balance, also called a material balance, is an application of conservation of mass to the analysis of physical systems. By accounting for material
entering and leaving a system, mass flows can be identified which might have been unknown, or difficult to measure without this technique. The
exact conservation law used in the analysis of the system depends on the context of the problem but all revolve around mass conservation, i.e.
that matter cannot disappear or be created spontaneously.[1]

Therefore, mass balances are used widely in engineering and environmental analyses. For example mass balance theory is used to design chemical
reactors, analyse alternative processes to produce chemicals as well as in pollution dispersion models and other models of physical systems. Closely
related and complementary analysis techniques include the population balance,energy balance and the somewhat more complex entropy balance. These
techniques are required for thorough design and analysis of systems such as the refrigeration cycle.
In environmental monitoring the term budget calculations is used to describe mass balance equations where they are used to evaluate the monitoring
data (comparing input and output, etc.) In biology the dynamic energy budget theory for metabolic organisation makes explicit use of mass and energy
balances.
Contents
[hide]
1 Introduction
2 Illustrative example
3 Mass feedback (recycle)
4 Differential mass balances
o 4.1 Ideal batch reactor
4.1.1 Reactive example
o 4.2 Ideal tank reactor/continuously stirred tank reactor
4.2.1 Example
o 4.3 Ideal plug flow reactor (PFR)
5 More complex problems
6 Commercial use
7 Mass balance of ice sheets
8 See also
9 References

10 External links
[edit]Introduction
The general form quoted for a mass balance is The mass that enters a system must, by conservation of mass, either leave the system or accumulate
within the system .
Mathematically the mass balance for a system without a chemical reaction is as follows:[1]
Strictly speaking the above equation holds also for systems with chemical reactions if the terms in the balance equation are taken to refer to total
mass i.e. the sum of all the chemical species of the system. In the absence of a chemical reaction the amount of any chemical species flowing in and
out will be the same; This gives rise to an equation for each species in the system. However if this is not the case then the mass balance equation
must be amended to allow for the generation or depletion (consumption) of each chemical species. Some use one term in this equation to account for
chemical reactions, which will be negative for depletion and positive for generation. However, the conventional form of this equation is written to
account for both a positive generation term (i.e. product of reaction) and a negative consumption term (the reactants used to produce the products).
Although overall one term will account for the total balance on the system, if this balance equation is to be applied to an individual species and then
the entire process, both terms are necessary. This modified equation can be used not only for reactive systems, but for population balances such as
occur in particle mechanics problems. The equation is given below; Note that it simplifies to the earlier equation in the case that the generation term is
zero.[1]
In the absence of a nuclear reaction the number of atoms flowing in and out are the same, even in the presence of a chemical reaction
To perform a balance the boundaries of the system must be well defined
Mass balances can be taken over physical systems at multiple scales.
Mass balances can be simplified with the assumption of steady state, where the accumulation term is zero
[edit]Illustrative example

Diagram showing clarifier example
A simple example can illustrate the concept. Consider the situation in which a slurry is flowing into a settling tank to remove the solids in the tank,
solids are collected at the bottom by means of a conveyor belt partially submerged in the tank, and water exits via an overflow outlet.
In this example, there are two substances, solids and water. The water-overflow outlet carries an increased concentration of water relative to
solids, as compared to the slurry inlet, and the exit of the conveyor belt carries an increased concentration of solids relative to water.
Assumptions
Steady state
Non-reactive system
Analysis
The slurry inlet composition (by mass) is 50% solid and 50% water, with a mass flow of 100 kg per minute. The tank is assumed to be operating
at steady state, and as such accumulation is zero, so input and output must be equal for both the solids and water. If we know that the removal
efficiency for the slurry tank is 60%, then the water outlet will contain 20kg/min of solids (40% times 100kg/min times 50% solids). If we measure
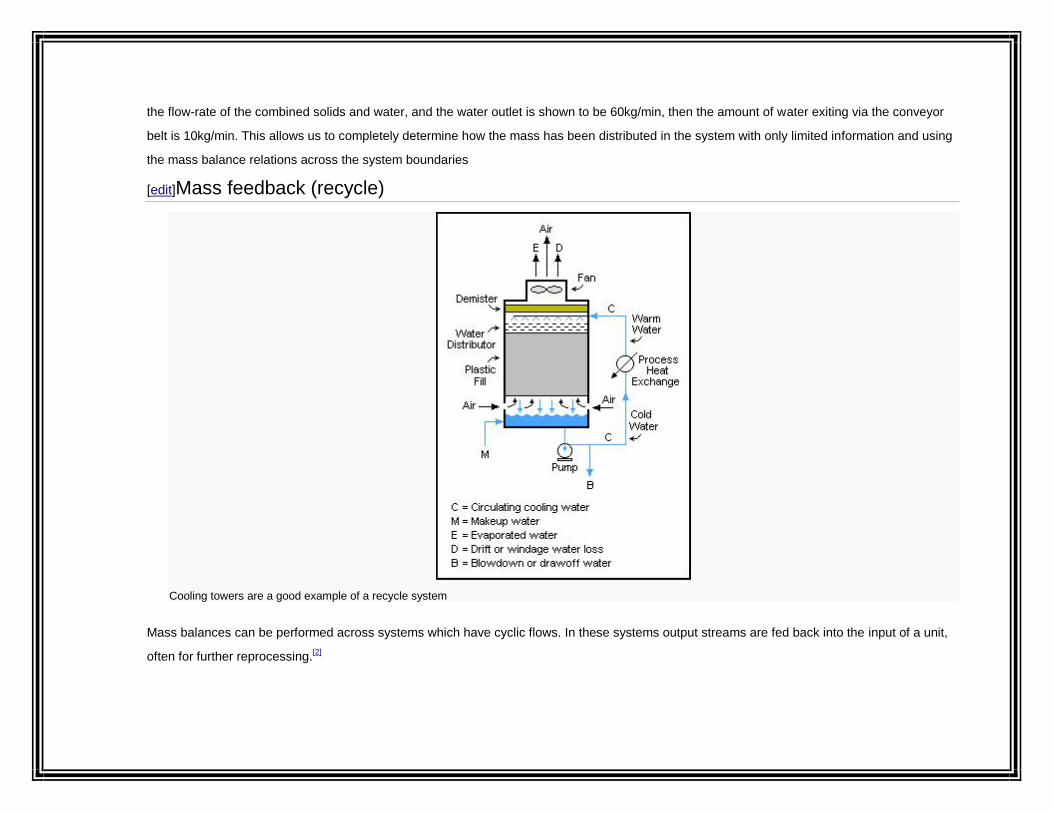
the flow-rate of the combined solids and water, and the water outlet is shown to be 60kg/min, then the amount of water exiting via the conveyor
belt is 10kg/min. This allows us to completely determine how the mass has been distributed in the system with only limited information and using
the mass balance relations across the system boundaries
[edit]Mass feedback (recycle)
Cooling towers are a good example of a recycle system
Mass balances can be performed across systems which have cyclic flows. In these systems output streams are fed back into the input of a unit,
often for further reprocessing.[2]

Such systems are common in grinding circuits, where materials are crushed then sieved to only allow a particular size of particle out of the circuit
and the larger particles are returned to the grinder. However recycle flows are by no means restricted to solid mechanics operations, they are
used in liquid and gas flows as well. One such example is in cooling towers, where water is pumped through the cooling tower many times, with
only a small quantity of water drawn off at each pass (to prevent solids build up) until it has either evaporated or exited with the drawn off water.
The use of the recycle aids in increasing overall conversion of input products, which is useful for low per-pass conversion processes, for example
the Haber process.
[edit]Differential mass balances
A mass balance can also be taken differentially. The concept is the same as for a large mass balance, however it is performed in the context of a
limiting system (for example, one can consider the limiting case in time or, more commonly, volume). The use of a differential mass balance is to
generate differential equations that can be used to provide an understanding and effective modelling tool for the target system.
The differential mass balance is usually solved in two steps, firstly a set of governing differential equations must be obtained, and then these
equations must be solved, either analytically or, for less tractable problems, numerically.
A good example of the applications of differential mass balance are shown in the following systems:
1. Ideal (stirred) Batch reactor
2. Ideal tank reactor, also named Continuous Stirred Tank Reactor (CSTR)
3. Ideal Plug Flow Reactor (PFR)
[edit]Ideal batch reactor
The ideal completely mixed batch reactor is a closed system. Isothermal conditions are assumed, and mixing prevents concentration gradients
as reactant concentrations decrease and product concentrations increase over time.[3] Many chemistry textbooks implicitly assume that the
studied system can be described as a batch reactor when they write about reaction kinetics andchemical equilibrium. The mass balance for a
substance A becomes

where rA denotes the rate at which substance A is produced, V is the volume (which may be constant or not), nA the number of moles
(n) of substance A.
In a fed-batch reactor some reactants/ingredients are added continuously or in pulses (compare making porridge by either first blending
all ingredients and the let it boil, which can be described as a batch reactor, or by first mixing only water and salt and making that boil
before the other ingredients are added, which can be described as a fed-batch reactor). Mass balances for fed-batch reactors become a
bit more complicated.
[edit]Reactive example
In this example we will use the law of mass action to derive the expression for a chemical equilibrium constant.
Assume we have a closed reactor in which the following liquid phase reversible reaction occurs:
The mass balance for substance A becomes
As we have a liquid phase reaction we can (usually) assume a constant volume and since we get
or

In many text books this is given as the definition of reaction rate without specifying the implicit assumption that
we are talking about reaction rate in a closed system with only one reaction. This is an unfortunate mistake that
has confused many students over the years.
According to the law of mass action the forward reaction rate can be written as
and the backward reaction rate as
The rate at which substance A is produced is thus
and since, at equilibrium, the concentration of A is constant we get
or, rearranged
[edit]Ideal tank reactor/continuously stirred tank reactorMain article: Continuous stirred-tank reactor
The continuously mixed tank reactor is an open system with an influent stream of
reactants and an effluent stream of products.[4] A lake can be regarded as a tank reactor
and lakes with long turnover times (e.g. with a low flux to volume ratio) can for many
purposes be regarded as continuously stirred (e.g. homogeneous in all respects). The
mass balance becomes

where Q0 and Q denote the volumetric flow in and out of the system respectively
and CA,0 and CA the concentration of A in the inflow and outflow respective. In an
open system we can never reach a chemical equilibrium. We can, however,
reach a steady state where all state variables (temperature, concentrations etc.)
remain constant ( )
[edit]Example
Consider a bathtub in which there is some bathing salt dissolved. We now fill in
more water, keeping the bottom plug in. What happens?
Since there is no reaction, and since there is no
outflow . The mass balance becomes
or
Using a mass balance for total volume, however, it is evident
that and that . Thus we get

Note that there is no reaction and hence no reaction
rate or rate law involved, and yet . We can thus
draw the conclusion that reaction rate can not be defined in a
general manner using . One must first write down a mass
balance before a link between and the reaction rate can
be found. Many textbooks, however, define reaction rate as
without mentioning that this definition implicitly assumes
that the system is closed, has a constant volume and that
there is only one reaction.
[edit]Ideal plug flow reactor (PFR)
The idealized plug flow reactor is an open system
resembling a tube with no mixing in the direction of flow
but perfect mixing perpendicular to the direction of flow.
Often used for systems like rivers and water pipes if the
flow is turbulent. When a mass balance is made for a
tube, one first considers an infinitesimal part of the tube
and make a mass balance over that using the ideal tank
reactor model.[5] That mass balance is
then integrated over the entire reactor volume to obtain:

In numeric solutions, e.g. when using computers, the
ideal tube is often translated to a series of tank
reactors, as it can be shown that a PFR is equivalent
to an infinite number of stirred tanks in series, but the
latter is often easier to analyze, especially at steady
state.
[edit]More complex problems
In reality, reactors are often non-ideal, in which
combinations of the reactor models above are used
to describe the system. Not only chemical reaction
rates, but also mass transfer rates may be important
in the mathematical description of a system,
especially in heterogeneous systems.[6]
As the chemical reaction rate depends on
temperature it is often necessary to make both
an energy balance (often a heat balance rather than
a full fledged energy balance) as well as mass
balances to fully describe the system. A different
reactor models might be needed for the energy
balance: A system that is closed with respect to mass
might be open with respect to energy e.g. since heat
may enter the system through conduction.

[edit]Commercial use
In industrial process plants, using the fact that the
mass entering and leaving any portion of a process
plant must balance, data validation and
reconciliation algorithms may be employed to correct
measured flows, provided that enough redundancy of
flow measurements exist to permit statistical
reconciliation and exclusion of detectably erroneous
measurements. Since all real world measured values
contain inherent error, the reconciled measurements
provide a better basis than the measured values do
for financial reporting, optimization, and regulatory
reporting. Software packages exist to make this
commercially feasible on a daily basis.
[edit]Mass balance of ice sheets
The mass balance concept can usefully be applied to
ice sheets, which is of interest because of their
relevance to sea level rise.
For example, the average precipitation over the
Antarctic ice sheet is approximately 150 mm / year;
the average ice depth is 3 km; therefore the average
residence time of the ice within the ice sheet is
approximately 20,000 years.

[edit]See also
Bioreactor
Chemical reactor
Chemical engineering
Chemical equilibrium
Conservation of mass
Continuity equation
Continuous stirred-tank reactor
Dilution (equation)
Energy accounting
Mass action
Mass flux
Material balance planning
Data validation and reconciliation
[edit]References

2.1.1.10-Mesophilic digester
Mesophilic digesterFrom Wikipedia, the free encyclopedia
Mesophilic digester or Mesophilic biodigester is a kind of biodigester that operates in temperatures between 20°C and about 40°, typically
37°C. This is the most used kind of biodigester in the world. More than 90% of worldwide biodigesters are of this type. Thermophilic digesters are
less than 10% of digesters in the world. Mesophilic digesters are used to produce biogas,biofertilizers and sanitarization mainly in tropical
countries such as India and Brazil.
[edit]Sources
Science direct
Mesophilic Digester

2.1.1.11-Methane capture
BiogasFrom Wikipedia, the free encyclopedia
(Redirected from Methane capture)

Pipes carrying biogas (foreground), natural gasand condensate
Sustainable energy
Renewable energy
Anaerobic digestion
Biomass
Geothermal
Hydroelectricity

Solar
Tidal
Wind
Energy conservation
Cogeneration
Energy efficiency
Geothermal
Green building
Microgeneration
Passive solar
Organic Rankine cycle
Sustainable transport
Carbon neutral fuel
Electric vehicle
Green vehicle

Plug-in hybrid
Environment portal
V
T
E
Biogas typically refers to a gas produced by breakdown of organic matter in the absence of oxygen. Organic waste such as dead plant and animal
material, animal feces, and kitchen waste can be converted into a gaseous fuel called biogas. Biogas originates from biogenic material and is a type of bio
fuel.
A rapid growth in population and a dynamic industrialisation around the world is leading to a significant increase in energy consumption, which is largely
based on burning fossil fuels. This results in large amounts of carbon dioxide being entered into the atmosphere, which is causing considerable damage to
our climate and the environment.
Besides solar and wind energy, biogas is also an important renewable energy source. Furthermore, biogas can be produced from renewable, regionally
available raw materials and energy-producing recyclable waste and is particularly environmentally friendly and CO2 neutral. Biogas uses the natural
energy from organic material.
Biogas is produced by the anaerobic digestion or fermentation of biodegradable materials such as biomass, manure, sewage, municipal waste,green
waste, plant material, and crops.[1] Biogas comprises primarily methane (CH4) and carbon dioxide (CO2) and may have small amounts ofhydrogen
sulphide (H2S), moisture and siloxanes.
The gases methane, hydrogen, and carbon monoxide (CO) can be combusted or oxidized with oxygen. This energy release allows biogas to be used as a
fuel. Biogas can be used as a fuel in any country for any heating purpose, such as cooking. It can also be used in anaerobic digesters where it is typically

used in a gas engine to convert the energy in the gas into electricity and heat.[2] Biogas can be compressed, much like natural gas, and used to
power motor vehicles. In the UK, for example, biogas is estimated to have the potential to replace around 17% of vehicle fuel.[3] Biogas is a renewable fuel
so it qualifies for renewable energy subsidies in some parts of the world. Biogas can also be cleaned and upgraded to natural gas standards when it
becomes bio methane.
Contents
[hide]
1 Production
2 Composition
3 Benefits
4 Applications
o 4.1 Biogas upgrading
o 4.2 Biogas gas-grid injection
o 4.3 Biogas in transport
5 Legislation
6 Development around the world
o 6.1 United States
o 6.2 UK
o 6.3 Germany
o 6.4 Indian subcontinent
o 6.5 China
o 6.6 In developing nations
7 In popular culture
8 See also

9 References
10 Further reading
11 External links
[edit]Production
Main article: anaerobic digestion
Biogas production in rural Germany
Bio gas is practically produced as landfill gas (LFG) or digested gas. A bio gas plant is the name often given to an anaerobic digester that treats farm
wastes or energy crops. Bio gas can be produced using anaerobic digesters. These plants can be fed with energy crops such as maize silage
orbiodegradable wastes including sewage sludge and food waste. During the process, as an air-tight tank transforms biomass waste into methane
producing renewable energy that can be used for heating, electricity, and many other operations that use any variation of an internal combustion engine,
such as GE Backbencher gas engines.[4] There are two key processes: Mesophilic and Thermophilic digestion.[5] In experimental work at University of
Alaska Fairbanks, a 1000-litre digester using psychrophiles harvested from "mud from a frozen lake in Alaska" has produced 200–300 liters of methane
per day, about 20–30% of the output from digesters in warmer climates.[6] Landfill gas is produced by wet organic waste decomposing under anaerobic
conditions in a landfill.[7][8] The waste is covered and mechanically compressed by the weight of the material that is deposited from above. This material
prevents oxygen exposure thus allowing anaerobic microbes to thrive. This gas builds up and is slowly released into the atmosphere if the landfill site has
not been engineered to capture the gas. Landfill gas is hazardous for three key reasons. Landfill gas becomes explosive when it escapes from the landfill

and mixes with oxygen. The lower explosive limit is 5% methane and the upper explosive limit is 15% methane.[9] The methane contained within biogas is
20 times more potent as a greenhouse gas than is carbon dioxide. Therefore, uncontained landfill gas, which escapes into the atmosphere may
significantly contribute to the effects ofglobal warming. In addition, landfill gas impact in global warming, volatile organic compounds (VOCs) contained
within landfill gas contribute to the formation of photochemical smog.
[edit]Composition
Typical composition of biogas[10]
Compound Chem %
Methane CH4 50–75
Carbon dioxide CO2 25–50
Nitrogen N2 0–10
Hydrogen H2 0–1
Hydrogen sulphide H2S 0–3
Oxygen O2 0–0

The composition of biogas varies depending upon the origin of the anaerobic digestion process. Landfill gas typically has methane concentrations around
50%. Advanced waste treatment technologies can produce biogas with 55–75% methane,[11] which for reactors with free liquids can be increased to 80-
90% methane using in-situ gas purification techniques[12] As-produced, biogas also contains water vapor. The fractional volume of water vapor is a
function of biogas temperature; correction of measured gas volume for both water vapor content and thermal expansion is easily done via a simple
mathematic algorithm[13] which yields the standardized volume of dry biogas.
In some cases, biogas contains siloxanes. These siloxanes are formed from the anaerobic decomposition of materials commonly found in soaps and
detergents. During combustion of biogas containing siloxanes, silicon is released and can combine with free oxygen or various other elements in
thecombustion gas. Deposits are formed containing mostly silica (SiO2) or silicates (SixOy) and can also contain calcium, sulfur, zinc, phosphorus.
Such white mineral deposits accumulate to a surface thickness of several millimeters and must be removed by chemical or mechanical means.
Practical and cost-effective technologies to remove siloxanes and other biogas contaminants are currently available.[14]
[edit]Benefits
When biogas is used, many advantages arise. In North America, utilization of biogas would generate enough electricity to meet up to three percent of the
continent's electricity expenditure. In addition, biogas could potentially help reduce global climate change. Normally, manure that is left to decompose
releases two main gases that cause global climate change: nitrogen dioxide andmethane. Nitrogen dioxide (NO2) warms the atmosphere 310 times more
than carbon dioxide and methane 21 times more than carbon dioxide. By converting cow manure into methane biogas viaanaerobic digestion, the millions
of cows in the United States would be able to produce one hundred billion kilowatt hours of electricity, enough to power millions of homes across the
United States. In fact, one cow can produce enough manure in one day to generate three kilowatt hours of electricity; only 2.4 kilowatt hours of electricity
are needed to power a single one hundred watt light bulb for one day.[15] Furthermore, by converting cow manure into methane biogas instead of letting it
decompose, global warming gases could be reduced by ninety-nine million metric tons or four percent.[16] In Nepal biogas is being used as a reliable
source of rural energy.
[edit]Applications

A biogas bus in Linköping, Sweden
Biogas can be utilized for electricity production on sewage works,[17] in a CHP gas engine, where the waste heat from the engine is conveniently used for
heating the digester; cooking; space heating; water heating; and process heating. If compressed, it can replace compressed natural gasfor use in
vehicles, where it can fuel an internal combustion engine or fuel cells and is a much more effective displacer of carbon dioxide than the normal use in on-
site CHP plants. [18]
Methane within biogas can be concentrated via a biogas upgrader to the same standards as fossil natural gas, which itself has had to go through a
cleaning process, and becomes biomethane. If the local gas network allows for this, the producer of the biogas may utilize the local gas distribution
networks. Gas must be very clean to reach pipeline quality, and must be of the correct composition for the local distribution network to accept. Carbon
dioxide, water, hydrogen sulfide, and particulates must be removed if present.
[edit]Biogas upgrading
Raw biogas produced from digestion is roughly 60% methane and 29% CO2 with trace elements of H2S, and is not high quality enough to be used as fuel
gas for machinery. The corrosive nature of H2S alone is enough to destroy the internals of a plant. The solution is the use of biogas upgrading or
purification processes whereby contaminants in the raw biogas stream are absorbed or scrubbed, leaving more methane per unit volume of gas. There
are four main methods of biogas upgrading, these include water washing, pressure swing absorption, selexol absorption, and amine gas treating.[19] The
most prevalent method is water washing where high pressure gas flows into a column where the carbon dioxide and other trace elements are scrubbed by
cascading water running counter-flow to the gas. This arrangement could deliver 98% methane with manufacturers guaranteeing maximum 2% methane
loss in the system. It takes roughly between 3-6% of the total energy output in gas to run a biogas upgrading system....

[edit]Biogas gas-grid injection
Gas-grid injection is the injection of biogas into the methane grid (natural gas grid). Injections includes biogas:[20] until the breakthrough of micro combined
heat and power two-thirds of all the energy produced by biogas power plants was lost (the heat), using the grid to transport the gas to customers, the
electricity and the heat can be used for on-site generation[21] resulting in a reduction of losses in the transportation of energy. Typical energy losses in
natural gas transmission systems range from 1–2%. The current energy losses on a large electrical system range from 5–8%.[22]
[edit]Biogas in transport
If concentrated and compressed, it can also be used in vehicle transportation. Compressed biogas is becoming widely used in Sweden, Switzerland, and
Germany. A biogas-powered train has been in service in Sweden since 2005.[23][24] Biogas also powers automobiles and in 1974, a British documentary
film entitled Sweet as a Nut detailed the biogas production process from pig manure, and how the biogas fueled a custom-adapted combustion
engine.[25][26] In 2007, an estimated 12,000 vehicles were being fueled with upgraded biogas worldwide, mostly in Europe.[27]
[edit]Legislation
The European Union presently has some of the strictest legislation regarding waste management and landfill sites called the Landfill Directive.[citation
needed] The United States legislates against landfill gas as it contains VOCs. The United States Clean Air Act and Title 40 of the Code of Federal
Regulations (CFR) requires landfill owners to estimate the quantity of non-methane organic compounds (NMOCs) emitted. If the estimated NMOC
emissions exceeds 50 tonnes per year, the landfill owner is required to collect the landfill gas and treat it to remove the entrained NMOCs. Treatment of
the landfill gas is usually by combustion. Because of the remoteness of landfill sites, it is sometimes not economically feasible to produce electricity from
the gas. However, countries such as the United Kingdom and Germany now have legislation in force that provides farmers with long-term revenue and
energy security.[28]
[edit]Development around the world
[edit]United States
With the many benefits of biogas, it is starting to become a popular source of energy and is starting to be utilized in the United States more. In 2003, the
United States consumed 147 trillion BTU of energy from "landfill gas", about 0.6% of the total U.S. natural gas consumption.[27] Methane biogas derived
from cow manure is also being tested in the U.S. According to a 2008 study, collected by the Science and Children magazine, methane biogas from cow

manure would be sufficient to produce 100 billion kilowatt hours enough to power millions of homes across America. Furthermore, methane biogas has
been tested to prove that it can reduce 99 million metric tons of greenhouse gas emissions or about 4% of the greenhouse gases produced by the United
States.[29]
In Vermont, for example, biogas generated on dairy farms around the state is included in the CVPS Cow Power program. The Cow Power program is
offered by Central Vermont Public Service Corporation as a voluntary tariff. Customers can elect to pay a premium on their electric bill, and that premium
is passed directly to the farms in the program. In Sheldon, Vermont, Green Mountain Dairy has provided renewable energy as part of the Cow Power
program. It all started when the brothers who own the farm, Bill and Brian Rowell, wanted to address some of the manure management challenges faced
by dairy farms, including manure odor, and nutrient availability for the crops they need to grow to feed the animals. They installed an anaerobic digester to
process the cow and milking center waste from their nine hundred and fifty cows to produce renewable energy, a bedding to replace sawdust, and a plant
friendly fertilizer. The energy and environmental attributes are sold. On average, the system run by the Rowell brothers produces enough electricity to
power three hundred to three hundred fifty other homes. The generator capacity is about three hundred kiloWatts.[30]
In Hereford, Texas, cow manure is being used to power an ethanol power plant. By switching to methane biogas, the ethanol power plant has saved one
thousand barrels of oil a day. Overall, the power plant has reduced transportation costs and will be opening many more jobs for future power plants that
will be relying on biogas.[31]
[edit]UK
There are currently around 60 non-sewage biogas plants in the UK, most are on-farm, but some larger facilities exist off-farm, which are taking food and
consumer wastes.[32]
On 5 October 2010, biogas was injected into the UK gas grid for the first time. Sewage from over 30,000 Oxfordshire homes is sent to Didcot sewage
treatment works, where it is treated in an anaerobic digestor to produce biogas, which is then cleaned to provide gas for approximately 200 homes.[33]
[edit]Germany
Germany is Europe's biggest biogas producer[34] as it is the market leader in biogas technology.[35] In 2010 there were 5,905 biogas plants operating
throughout the whole country, in which Lower Saxony, Bavaria and the eastern federal states are the main regions.[36] Most of these plants are employed
as power plants. Usually the biogas plants are directly connected with a CHP which produces electric power by burning the bio methane. The electrical

power is then fed into the public power grid.[37] In 2010, the total installed electrical capacity of these power plants was 2,291 MW.[36] The electricity supply
was approximately 12.8 TWh, which is 12.6 per cent of the total generated renewable electricity.[38] Biogas in Germany is primarily extracted by the co-
fermentation of energy crops (called ‘NawaRo’, an abbreviation of ‘nachwachsende Rohstoffe’, which is German for renewable resources) mixed with
manure, the main crop utilized is corn. Organic waste and industrial and agricultural residues such as waste from the food industry are also used for
biogas generation.[39] In this respect, Biogas production in Germany differs significantly from the UK, where biogas generated from landfill sites is most
common.[34]
Biogas production in Germany has developed rapidly over the last 20 years. The main reason for this development is the legally created frameworks.
Governmental support of renewable energies started at the beginning of the 1990s with the Law on Electricity Feed (StrEG). This law guaranteed the
producers of energy from renewable sources the feed into the public power grid, thus the power companies were forced to take all produced energy from
independent private producers of green energy.[40] In 2002 the Law on Electricity Feed was replaced by the Renewable Energy Source Act (EEG). This
law even guaranteed a fixed compensation for the produced electric power over 20 years. The amount of ca. 0.08 Euro gave particular farmers the
opportunity to become an energy supplier and gaining a further source of income in the same place.[39] The German agricultural biogas production was
given a further push in 2004 by implementing the so-called NawaRo-Bonus. This is a special bonus payment given for the usage of renewable resources
i.e. energy crops.[41] In 2007 the German government stressed its intention to invest further effort and support in improving the renewable energy supply to
provide an answer on growing climate challenges and increasing oil prices by the ‘Integrated Climate and Energy Programme’.
This continual trend of renewable energy promotion induces a number of challenges facing the management and organisation of renewable energy supply
that has also several impacts on the biogas production.[42] The first challenge to be noticed is the high area-consuming of the biogas electric power supply.
In 2011 energy crops for biogas production consumed an area of circa 800,000 ha in Germany.[43] This high demand of agricultural areas generates new
competitions with the food industries that did not exist yet. Moreover new industries and markets were created in predominately rural regions entailing
different new players with an economic, political and civil background. Their influence and acting has to be governed to gain all advantages this new
source of energy is offering. Finally biogas will furthermore play an important role in the German renewable energy supply if good governance is
focused.[42]
[edit]Indian subcontinent

In India, Nepal, Pakistan and Bangladesh biogas produced from the anaerobic digestion of manure in small-scale digestion facilities is called gobar gas; it
is estimated that such facilities exist in over two million households in India and in thousands in Pakistan, particularly North Punjab, due to the thriving
population of livestock. The digester is an airtight circular pit made of concrete with a pipe connection. The manure is directed to the pit, usually directly
from the cattle shed. The pit is then filled with a required quantity of wastewater. The gas pipe is connected to the kitchen fireplace through control valves.
The combustion of this biogas has very little odour or smoke. Owing to simplicity in implementation and use of cheap raw materials in villages, it is one of
the most environmentally sound energy sources for rural needs. One type of these system is the Sintex Digester. Some designs use vermiculture to
further enhance the slurry produced by the biogas plant for use as compost.[44] In order to create awareness and associate the people interested in biogas,
an association "Indian Biogas Association" (www.biogas-India.com)[45] is formed. The “Indian Biogas Association” aspires to be a unique blend of;
nationwide operators, manufacturers and planners of biogas plants, and representatives from science and research. The association was founded in 2010
and is now ready to start mushrooming. The sole motto of the association is “propagating Biogas in a sustainable way”.
The Deenabandhu Model is a new biogas-production model popular in India. (Deenabandhu means "friend of the helpless.") The unit usually has a
capacity of 2 to 3 cubic metres. It is constructed using bricks or by a ferrocement mixture. In India, the brick model costs slightly more than the
ferrocement model; however, India's Ministry of New and Renewable Energy offers some subsidy per model constructed.
In Pakistan, the Rural Support Programmes Network is running the Pakistan Domestic Biogas Programme[46] which has installed over 1500 biogas plants
and has trained in excess of 200 masons on the technology and aims to develop the Biogas Sector in Pakistan.
Also PAK-Energy Solution[46] has taken the most innovative and responsible initiatives in biogas technology. In this regard, the company is also awarded
by 1st prize in "Young Entrepreneur Business Plan Challenge" jointly organized by Punjab Govt. & LCCI.[46][47][48][49] They have designed and developed
Uetians Hybrid Model, in which they have combined fixed dome and floating drums and Uetians Triplex Model. Moreover, Pakistan Dairy Development
Company has also taken an initiative to develop this kind of alternative source of energy for Pakistani farmers. Biogas is now running diesel engines, gas
generators, kitchen ovens, geysers, and other utilities in Pakistan. In Nepal, the government provides subsidies to build biogas plant.
[edit]China
The Chinese have been experimenting with the applications of biogas since 1958. Around 1970, China had installed 6,000,000 digesters in an effort to
make agriculture more efficient. During the last years the technology has met high growth rates. This seems to be the earliest developments in generating
biogas from agricultural waste.

[edit]In developing nations
Domestic biogas plants convert livestock manure and night soil into biogas and slurry, the fermented manure. This technology is feasible for small holders
with livestock producing 50 kg manure per day, an equivalent of about 6 pigs or 3 cows. This manure has to be collectable to mix it with water and feed it
into the plant. Toilets can be connected. Another precondition is the temperature that affects the fermentation process. With an optimum at 36 C° the
technology especially applies for those living in a (sub) tropical climate. This makes the technology for small holders in developing countries often suitable.
Simple sketch of household biogas plant
Depending on size and location, a typical brick made fixed dome biogas plant can be installed at the yard of a rural household with the investment
between 300 to 500 US $ in Asian countries and up to 1400 US $ in the African context. A high quality biogas plant needs minimum maintenance costs
and can produce gas for at least 15–20 years without major problems and re-investments. For the user, biogas provides clean cooking energy, reduces
indoor air pollution, and reduces the time needed for traditional biomass collection, especially for women and children. The slurry is a clean organic
fertilizer that potentially increases agricultural productivity.
Domestic biogas technology is a proven and established technology in many parts of the world, especially Asia.[50] Several countries in this region have
embarked on large-scale programmes on domestic biogas, such as China[51][52] and India. The Netherlands Development Organisation, SNV,[53] supports
national programmes on domestic biogas that aim to establish commercial-viable domestic biogas sectors in which local companies market, install and
service biogas plants for households. In Asia, SNV is working in Nepal,[54] Vietnam,[55]Bangladesh,[56] Bhutan, Cambodia,[56] Lao PDR,[57] Pakistan[58] and
Indonesia,[59] and in Africa; Rwanda,[60] Senegal, Burkina Faso, Ethiopia,[61] Tanzania,[62] Uganda, Kenya, Benin and Cameroon.

[edit]In popular culture
In the 1985 Australian film Mad Max Beyond Thunderdome the post-apocalyptic settlement Bartertown is powered by a central biogas system based upon
a piggery. As well as providing electricity, methane is used to power Bartertown's vehicles.
[edit]See also
Sustainable development portal
Energy portal
Anaerobic digestion
Biodegradability
Bioenergy
Biofuel
Biohydrogen
Landfill gas monitoring
MSW/LFG (municipal solid waste and landfill gas)
Natural gas
Renewable energy
Renewable natural gas
Relative cost of electricity generated by different sources
Tables of European biogas utilisation
Thermal hydrolysis
Waste management
[edit]References

2.1.1.12-Methane clathrate
Methane clathrateFrom Wikipedia, the free encyclopedia

"Burning ice". Methane, released by heating, burns; water drips.
Inset: clathrate structure (University of Göttingen, GZG. Abt. Kristallographie).
Source: United States Geological Survey.
Methane clathrate (CH4•5.75H2O[1]), also called methane hydrate, hydromethane, methane ice, fire ice, natural gas hydrate, or gas hydrate is a
solid clathrate compound (more specifically, a clathrate hydrate) in which a large amount of methane is trapped within a crystal structure of water, forming
a solid similar to ice.[2] Originally thought to occur only in the outer regions of the Solar System where temperatures are low and water ice is common,
significant deposits of methane clathrate have been found under sediments on the ocean floors of Earth.[3] The worldwide amount of carbon bound in gas
hydrates is conservatively estimated to total twice the amount of carbon to be found in all known fossil fuels on Earth.[4]
Methane clathrates are common constituents of the shallow marine geosphere, and they occur both in deep sedimentary structures, and as outcrops on
the ocean floor. Methane hydrates are believed to form by migration of gas from depth along geological faults, followed by precipitation, or crystallization,
on contact of the rising gas stream with cold sea water. Methane clathrates are also present in deep Antarctic ice cores, and record a history
of atmospheric methane concentrations, dating to 800,000 years ago.[5] The ice-core methane clathrate record is a primary source of data forglobal
warming research, along with oxygen and carbon dioxide.
Contents
[hide]
1 Structure and composition
2 Natural deposits
o 2.1 Oceanic
2.1.1 Reservoir size
o 2.2 Continental
o 2.3 Commercial use
3 Hydrates in natural gas processing
o 3.1 Routine operations

o 3.2 Effect of hydrate phase transition during deep water drilling
o 3.3 Blowout recovery
4 Methane clathrates and climate change
5 Natural gas hydrates (NGH) vs. liquified natural gas (LNG) in
transportation
6 References in Popular Culture
7 See also
8 Notes
9 References
10 External links
[edit]Structure and composition
The average methane clathrate hydrate composition is 1 mole of methane for every 5.75 moles of water, though this is dependent on how many methane
molecules "fit" into the various cage structures of the water lattice. The observed density is around 0.9 g/cm3.[6] One litre of methane clathrate solid would
therefore contain, on average, 168 litres of methane gas (at STP).[nb 1]
Methane forms a structure I hydrate with two dodecahedral (12 vertices, thus 12 water molecules) and six tetradecahedral (14 water molecules) water
cages per unit cell. This compares with a hydration number of 20 for methane in aqueous solution.[7] A methane clathrate MAS NMR spectrum recorded at
275 K and 3.1 MPa shows a peak for each cage type and a separate peak forgas phase methane.[citation needed] Recently, a clay-methane hydrate
intercalate was synthesized in which a methane hydrate complex was introduced at the interlayer of a sodium-richmontmorillonite clay. The upper
temperature stability of this phase is similar to that of structure I hydrate.[8]
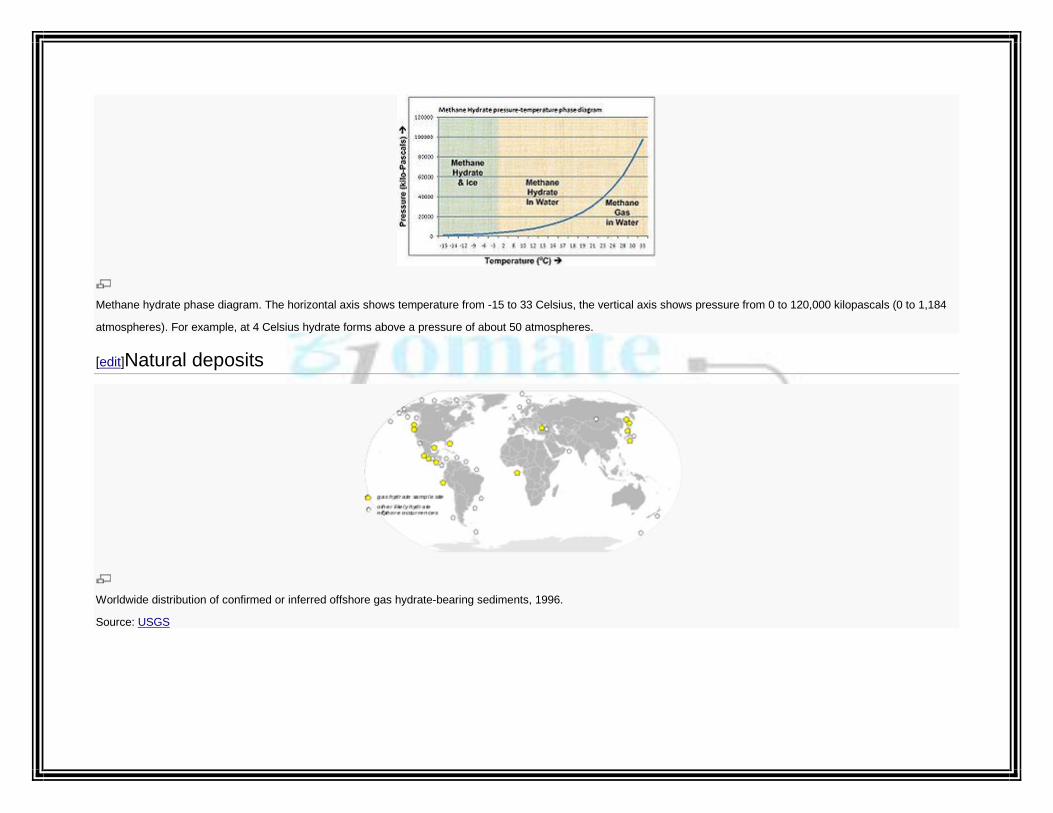
Methane hydrate phase diagram. The horizontal axis shows temperature from -15 to 33 Celsius, the vertical axis shows pressure from 0 to 120,000 kilopascals (0 to 1,184
atmospheres). For example, at 4 Celsius hydrate forms above a pressure of about 50 atmospheres.
[edit]Natural deposits
Worldwide distribution of confirmed or inferred offshore gas hydrate-bearing sediments, 1996.
Source: USGS

Gas hydrate-bearing sediment, from the subduction zone off Oregon
Specific structure of a gas hydrate piece, from the subduction zone off Oregon
Methane clathrates are restricted to the shallow lithosphere (i.e. < 2,000 m depth). Furthermore, necessary conditions are found only either in polar
continental sedimentary rocks where surface temperatures are less than 0 °C; or in oceanic sediment at water depths greater than 300 m where
the bottom water temperature is around 2 °C. In addition, deep fresh water lakes may host gas hydrates as well, e.g. the fresh water Lake Baikal,
Siberia.[9] Continental deposits have been located in Siberia and Alaska in sandstone and siltstone beds at less than 800 m depth. Oceanic deposits seem

to be widespread in the continental shelf (see Fig.) and can occur within the sediments at depth or close to thesediment-water interface. They may cap
even larger deposits of gaseous methane.[10]
[edit]Oceanic
There are two distinct types of oceanic deposit. The most common is dominated (> 99%) by methane contained in a structure I clathrate and generally
found at depth in the sediment. Here, the methane is isotopically light (δ13C < -60‰) which indicates that it is derived from the microbial reduction of CO2.
The clathrates in these deep deposits are thought to have formed in situ from the microbially produced methane, as the δ13C values of clathrate and
surrounding dissolved methane are similar.[10] However, it is also thought that fresh water used in the pressurization of oil and gas wells in permafrost and
along the continental shelves world wide, combine with natural methane to form clathrate at depth and pressure, since methane hydrates cannot form,
initially, in salt water. Local variations may be very common, as the act of forming hydrate, which extracts pure water from saline formation waters, can
often lead to local, and potentially-significant increases in formation water salinity.[11] Hydrates normally exclude the salt in the pore fluid from which it
forms, and thus they have high electric resistivity just as ice and sediments containing hydrates have a higher resistivity compared to sediments without
gas hydrates (Judge [67])[citation needed].
These deposits are located within a mid-depth zone around 300–500 m thick in the sediments (the gas hydrate stability zone, or GHSZ) where they
coexist with methane dissolved in the fresh, not salt, pore-waters. Above this zone methane is only present in its dissolved form at concentrations that
decrease towards the sediment surface. Below it, methane is gaseous. At Blake Ridgeon the Atlantic continental rise, the GHSZ started at 190 m depth
and continued to 450 m, where it reached equilibrium with the gaseous phase. Measurements indicated that methane occupied 0-9% by volume in the
GHSZ, and ~12% in the gaseous zone.[12]
In the less common second type found near the sediment surface some samples have a higher proportion of longer-chainhydrocarbons (< 99% methane)
contained in a structure II clathrate. Carbon from this type of clathrate is isotopically heavier (δ13C is -29 to -57 ‰) and is thought to have migrated
upwards from deep sediments, where methane was formed by thermal decomposition of organic matter. Examples of this type of deposit have been found
in the Gulf of Mexico and the Caspian Sea.[10]
Some deposits have characteristics intermediate between the microbially and thermally sourced types and are considered to be formed from a mixture of
the two.

The methane in gas hydrates is dominantly generated by microbial consortia degrading organic matter in low oxygen environments, with the methane
itself produced by methanogenic archaea. Organic matter in the uppermost few centimetres of sediments is first attacked by aerobic bacteria, generating
CO2, which escapes from the sediments into the water column. Below this region of aerobic activity, anaerobic processes take over, including,
successively with depth, the microbial reduction of nitrite/nitrate, metal oxides, and then sulfates are reduced to sulfides. Finally, once sulfate is used up,
methanogenesis becomes a dominant pathway for organic carbon remineralization.
If the sedimentation rate is low (about 1 cm/yr), the organic carbon content is low (about 1% ), and oxygen is abundant, aerobic bacteria can use up all the
organic matter in the sediments faster than oxygen is depleted, so lower-energy electron acceptors are not used. But where sedimentation rates and the
organic carbon content are high, which is typically the case on continental shelves and beneath western boundary current upwelling zones, thepore
water in the sediments becomes anoxic at depths of only a few centimeters or less. In such organic-rich marine sediments, sulfate then becomes the most
important terminal electron acceptor due to its high concentration in seawater, although it too is depleted by a depth of centimeters to meters. Below this,
methane is produced. This production of methane is a rather complicated process, requiring a highly reducing environment (Eh -350 to -450 mV) and a pH
between 6 and 8, as well as a complex syntrophic consortia of different varieties of archaea and bacteria, although it is only archaea that actually emit
methane.
In some regions (e.g., Gulf of Mexico) methane in clathrates may be at least partially derived from thermal degradation of organic matter, dominantly in
petroleum.[13][citation needed] The methane in clathrates typically has a biogenic isotopic signature and highly variable δ13C (-40 to -100‰), with an approximate
average of about -65‰ .[14][citation needed][15][citation needed][16] Below the zone of solid clathrates, large volumes of methane may occur as bubbles of free gas in the
sediments.[12][17][18]
The presence of clathrates at a given site can often be determined by observation of a "bottom simulating reflector" (BSR), which is a seismic reflection at
the sediment to clathrate stability zone interface caused by the unequal densities of normal sediments and those laced with clathrates.
[edit]Reservoir size
The size of the oceanic methane clathrate reservoir is poorly known, and estimates of its size decreased by roughly an order of magnitude per decade
since it was first recognized that clathrates could exist in the oceans during the 1960s and '70s.[19] The highest estimates (e.g. 3×10¹⁸ m³)[20] were based
on the assumption that fully dense clathrates could litter the entire floor of the deep ocean. Improvements in our understanding of clathrate chemistry and
sedimentology have revealed that hydrates form in only a narrow range of depths (continental shelves), at only some locations in the range of depths

where they could occur (10-30% of the GHSZ), and typically are found at low concentrations (0.9-1.5% by volume) at sites where they do occur. Recent
estimates constrained by direct sampling suggest the global inventory occupies between one and five million cubic kilometres (0.24 to 1.2 million cubic
miles).[19] This estimate, corresponding to 500-2500 gigatonnes carbon (Gt C), is smaller than the 5000 Gt C estimated for all other fossil fuel reserves but
substantially larger than the ~230 Gt C estimated for other natural gas sources.[19][21] The permafrost reservoir has been estimated at about 400 Gt C in
the Arctic,[22][citation needed] but no estimates have been made of possible Antarctic reservoirs. These are large amounts, for comparison the total carbon in the
atmosphere is around 700 gigatons.[23]
These modern estimates are notably smaller than the 10,000 to 11,000 Gt C (2×10¹⁶ m³) proposed[24] by previous workers as a motivation considering
clathrates as a fossil fuel resource (MacDonald 1990, Kvenvolden 1998). Lower abundances of clathrates do not rule out their economic potential, but a
lower total volume and apparently low concentration at most sites[19] does suggest that only a limited percentage of clathrates deposits may provide an
economically viable resource.
[edit]Continental
Methane clathrates in continental rocks are trapped in beds of sandstone or siltstone at depths of less than 800 m. Sampling indicates they are formed
from a mix of thermally and microbially derived gas from which the heavier hydrocarbons were later selectively removed. These occur
in Alaska, Siberia as well as Northern Canada.
In 2008, Canadian and Japanese researchers extracted a constant stream of natural gas from a test project at the Mallik gas hydrate field in
the Mackenzie River delta. This was the second such drilling at Mallik: the first took place in 2002 and used heat to release methane. In the 2008
experiment, researchers were able to extract gas by lowering the pressure, without heating, requiring significantly less energy.[25] The Mallik gas hydrate
field was first discovered by Imperial Oil in 1971-1972.[26]
[edit]Commercial use
The sedimentary methane hydrate reservoir probably contains 2–10 times the currently known reserves of conventional natural gas. This represents a
potentially important future source ofhydrocarbon fuel. However, in the majority of sites deposits are likely to be too dispersed for economic
extraction.[19] Other problems facing commercial exploitation are detection of viable reserves; and development of the technology for extracting methane
gas from the hydrate deposits. To date, there has only been one field commercially produced where some of the gas is thought to have been from
methane clathrates, Messoyakha Gas Field, supplying the nearby Russian city of Norilsk.

A research and development project in Japan is aiming for commercial-scale extraction near Aichi Prefecture by 2016.[27][28] In August 2006, China
announced plans to spend 800 million yuan (US$100 million) over the next 10 years to study natural gas hydrates.[29] A potentially economic reserve in the
Gulf of Mexico may contain ~1010 m3 of gas.[19] Bjørn Kvamme and Arne Graue at the Institute for Physics and technology at the University of Bergen have
developed a method for injecting CO2 into hydrates and reversing the process; thereby extracting CH4 by direct exchange.[30] The University of Bergen's
method is being field tested by ConocoPhillips and JOGMEC, and partially funded by the U.S. Department of Energy. The project has already reached
injection phase and is currently analyzing resulting data as of March 12, 2012.[31]
[edit]Hydrates in natural gas processing
[edit]Routine operations
Methane clathrates (hydrates) are also commonly formed during natural gas production operations, when liquid water is condensed in the presence of
methane at high pressure. It is known that larger hydrocarbon molecules such as ethane and propane can also form hydrates, although as the molecule
length increases (butanes, pentanes), they cannot fit into the water cage structure and tend to destabilise the formation of hydrates.
Once formed, hydrates can block pipeline and processing equipment. They are generally then removed by reducing the pressure, heating them, or
dissolving them by chemical means (methanol is commonly used). Care must be taken to ensure that the removal of the hydrates is carefully controlled,
because of the potential for the hydrate to undergo a phase transition from the solid hydrate to release water and gaseous methane at a high rate as the
pressure is reduced. The rapid release of methane gas in a closed system can result in a rapid increase in pressure.[6]
It is generally preferable to prevent hydrates from forming or blocking equipment. This is commonly achieved by removing water, or by the addition
of ethylene glycol (MEG) or methanol, which act to depress the temperature at which hydrates will form (i.e. common antifreeze). In recent years,
development of other forms of hydrate inhibitors have been developed, such as Kinetic Hydrate Inhibitors (which dramatically slow the rate of hydrate
formation) and anti-agglomerates, which do not prevent hydrates forming, but do prevent them sticking together to block equipment.
[edit]Effect of hydrate phase transition during deep water drilling
When drilling in oil- and gas-bearing formations submerged in deep water, the reservoir gas may flow into the well bore and form gas hydrates owing to
the low temperatures and high pressures found during deep water drilling. The gas hydrates may then flow upward with drilling mud or other discharged
fluids. As they rise, the pressure in the annulus decreases and the hydrates dissociate into gas and water. The rapid gas expansion ejects fluid from the

well, reducing the pressure further, which leads to more hydrate dissociation and further fluid ejection. The resulting violent expulsion of fluid from the
annulus is one potential cause or contributor to what is referred to as a "kick".[32] (Kicks, which can cause blowouts, typically do not involve hydrates:
seeBlowout: formation kick).
Measures which reduce the risk of hydrate formation include:
High flow-rates, which limit the time for hydrate formation in a volume of fluid, thereby reducing the kick potential.[32]
Careful measuring of line flow to detect incipient hydrate plugging.[32]
Additional care in measuring when gas production rates are low and the possibility of hydrate formation is higher than at relatively high gas flow
rates.[32]
Monitoring of well casing after it is "shut in" (isolated) may indicate hydrate formation. Following "shut in", the pressure rises as gas diffuses
through the reservoir to the bore hole; the rate of pressure rise will exhibit a reduced rate of increase when hydrates are forming.[32]
Additions of energy (e.g., the energy released by setting cement used in well completion) can raise the temperature and convert hydrates to gas,
producing a "kick".
[edit]Blowout recovery
Concept diagram of oil containment domes, acting as upsidedown funnels to pipe oil to surface ships. The sunken oil rig is nearby.
At sufficient depths, methane complexes directly with water to form methane hydrates, as was observed during the Deepwater Horizon oil spill in 2010. BP
engineers developed and deployed a subsea oil recovery system over oil spilling from a deepwater oil well 5,000 feet (1,500 m) below sea level to capture
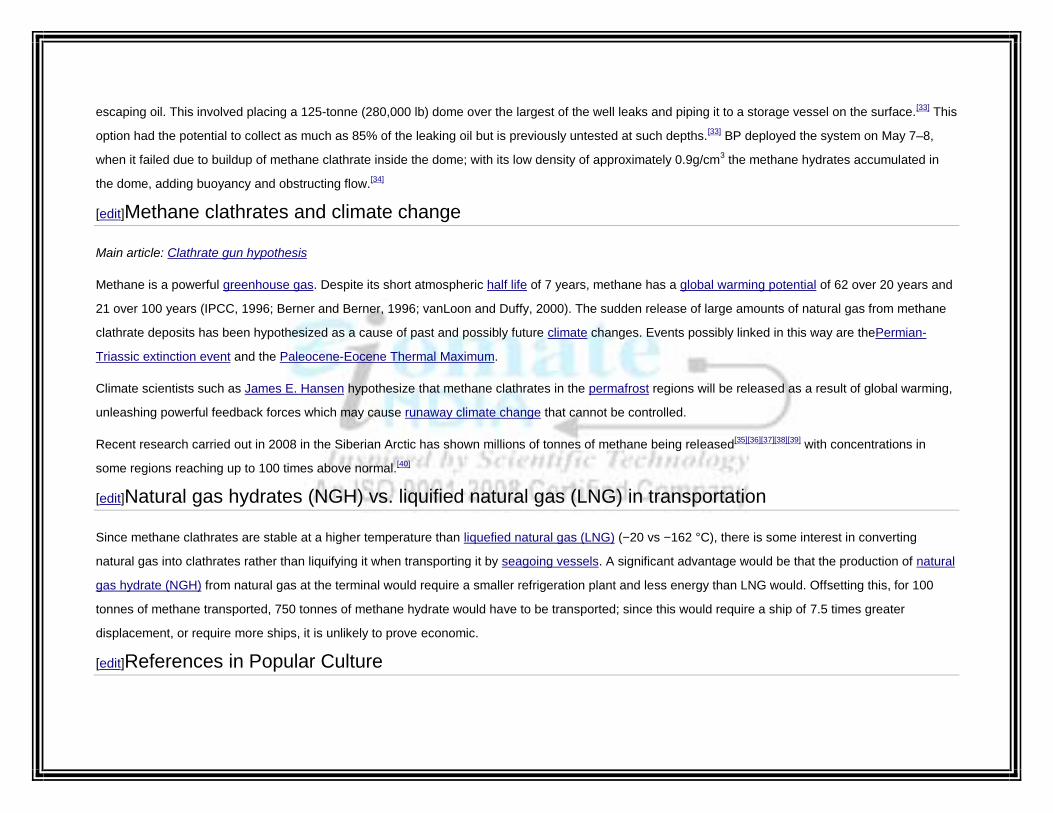
escaping oil. This involved placing a 125-tonne (280,000 lb) dome over the largest of the well leaks and piping it to a storage vessel on the surface.[33] This
option had the potential to collect as much as 85% of the leaking oil but is previously untested at such depths.[33] BP deployed the system on May 7–8,
when it failed due to buildup of methane clathrate inside the dome; with its low density of approximately 0.9g/cm3 the methane hydrates accumulated in
the dome, adding buoyancy and obstructing flow.[34]
[edit]Methane clathrates and climate change
Main article: Clathrate gun hypothesis
Methane is a powerful greenhouse gas. Despite its short atmospheric half life of 7 years, methane has a global warming potential of 62 over 20 years and
21 over 100 years (IPCC, 1996; Berner and Berner, 1996; vanLoon and Duffy, 2000). The sudden release of large amounts of natural gas from methane
clathrate deposits has been hypothesized as a cause of past and possibly future climate changes. Events possibly linked in this way are thePermian-
Triassic extinction event and the Paleocene-Eocene Thermal Maximum.
Climate scientists such as James E. Hansen hypothesize that methane clathrates in the permafrost regions will be released as a result of global warming,
unleashing powerful feedback forces which may cause runaway climate change that cannot be controlled.
Recent research carried out in 2008 in the Siberian Arctic has shown millions of tonnes of methane being released[35][36][37][38][39] with concentrations in
some regions reaching up to 100 times above normal.[40]
[edit]Natural gas hydrates (NGH) vs. liquified natural gas (LNG) in transportation
Since methane clathrates are stable at a higher temperature than liquefied natural gas (LNG) (−20 vs −162 °C), there is some interest in converting
natural gas into clathrates rather than liquifying it when transporting it by seagoing vessels. A significant advantage would be that the production of natural
gas hydrate (NGH) from natural gas at the terminal would require a smaller refrigeration plant and less energy than LNG would. Offsetting this, for 100
tonnes of methane transported, 750 tonnes of methane hydrate would have to be transported; since this would require a ship of 7.5 times greater
displacement, or require more ships, it is unlikely to prove economic.
[edit]References in Popular Culture

The development of alternative energy technology is one of the central plotlines for the new TNT TV series Dallas. Christopher Ewing (Jesse Metcalfe) is
developing a method of extracting Methane ice from the ocean floor.
[edit]See also
Clathrate compound
Clathrate gun hypothesis
Clathrate hydrate
Future energy development
Long-term effects of global warming
[edit]Notes
1. ^ The average methane clathrate hydrate composition is 1 mole of methane for every 5.75 moles of water. The observed density is around 0.9
g/cm3.[6] For one mole of methane, which has a molar mass of about 16.04 g (see Methane), we have 5.75 moles of water, with a molar mass of about
18.02 g (see Properties of water), so together for each mole of methane the clathrate complex has a mass of 16.04 g + 5.75 × 18.02 g = 119.65 g. The
fractional contribution of methane to the mass is then equal to 16.04 g / 119.65 g = 0.134. The density is around 0.9 g/cm3, so one litre of methane
clathrate has a mass of around 0.9 kg, and the mass of the methane contained therein is then about 0.134 × 0.9 kg = 0.1206 kg. At a density as a gas of
0.717 kg/m3 (at 0 °C; see the info box atMethane), that means a volume of 0.1206 / 0.717 m3 = 0.168 m3 = 168 L.
[edit]References

2.1.1.13-Microbiology of decomposition
Microbiology of decompositionFrom Wikipedia, the free encyclopedia

Decomposing pig showing signs of bloat and discoloration, a result of microbial proliferation within the body.
Microbiology of decomposition is the study of all microorganisms (mainly bacteria and fungi) involved in the chemical and physical processes during
which organic matter is broken down and reduced to its original elements.
Decomposition microbiology can be divided between two fields of interest:
1. decomposition of plant materials;
2. decomposition of cadavers and carcasses.
The decomposition of plant materials is commonly studied in order to understand the cycling of carbon within a given environment and to understand the
subsequent impacts on soil quality. Plant material decomposition is also often referred to as composting. The decomposition of cadavers and carcasses
has become an important field of study within forensic taphonomy.
Contents
[hide]
1 Decomposition microbiology of plant materials
2 Decomposition microbiology of cadavers and carcasses
o 2.1 Microorganisms in the body
o 2.2 Microorganisms outside the body
2.2.1 Decomposition fluids and soil microbiology
2.2.2 Decomposition fungi
2.2.2.1 Decomposition fungi as PMI estimators
3 References
[edit]Decomposition microbiology of plant materials
See also: compost
The breakdown of vegetation is highly dependent on oxygen and moisture levels. During decomposition, microorganisms require oxygen for their
respiration. If anaerobic conditions dominate the decomposition environment, microbial activity will be slow and thus decomposition will be slow.
Appropriate moisture levels are required for microorganisms to proliferate and to actively decompose organic matter. In arid environments, bacteria and
fungi dry out and are unable to take part in decomposition. In wet environments, anaerobic conditions will develop and decomposition can also be
considerably slowed down. Decomposing microorganisms also require the appropriate plant substrates in order to achieve good levels of decomposition.
This usually translates to having appropriate carbon to nitrogen ratios (C:N). The ideal composting carbon-to-nitrogen ratio is thought to be approximately
30:1. As in any microbial process, the decomposition of plant litter by microorganisms will also be dependent on temperature. For example, leaves on the
ground will not undergo decomposition during the winter months where snow cover occurs as temperatures are too low to sustain microbial activities.[1]
[edit]Decomposition microbiology of cadavers and carcasses
The decomposition processes of cadavers and carcasses are studied within the field of forensic taphonomy in order to:

aid in the estimation of post-mortem interval (PMI) or time since death;
aid in the location of potential clandestine graves.
Decomposition microbiology as applied to forensic taphonomy can be divided into 2 groups of studies:
microorganisms from within the body;
microorganisms from the decomposition environment.
[edit]Microorganisms in the body
When considering cadavers and carcasses, putrefaction is the proliferation of microorganisms within the body following death and also encompasses the
breakdown of tissues brought upon by the growth of bacteria. The first signs of putrefaction are usually the discolorations of the body which can vary
between shades of green, blue, red or black depending on 1) where the color changes are observed and 2) how far along within the decomposition
process the observation is made. This phenomenon is known as marbling. Discolorations are the results of bile pigments being released following an
enzymatic attack of the liver, gallbladder and pancreas and the release of hemoglobin breakdown products.[2] Proliferation of bacteria throughout the body
is accompanied with the production of considerable amounts of gases due to their capacities of fermentation.[3] As gases accumulate within the bodily
cavities the body appears to swell as it enters the bloat stage of decomposition.
As oxygen is present within a body at the beginning of decomposition, aerobic bacteria flourish during the first stages of the process. As the microbial
population increases, an accumulation of gases changes the environment into anaerobic conditions which is consequently followed by a change
to anaerobic bacteria.[4] Gastro-intestinal bacteria are thought to be responsible for the majority of the putrefactive processes that occur in cadavers and
carcasses. This can be in part attributed to the impressive concentrations of viable gastro-intestinal organisms and the metabolic capacities they possess
allowing them to use an array of different nutrient sources.[5] Gastro-intestinal bacteria are also capable of migrating from the gut to any other region of the
body by using the lymphatic system and blood vessels.[6] Furthermore, we know that coliform varieties of Staphylococcus are important members of the
aerobic putrefactive bacteria and that members of theClostridia genus make up a large part of anaerobic putrefactive bacteria.[7]

Proposed evolution of microorganisms within the body during decomposition. As oxygen is available at the beginning of decomposition, aerobic microorganisms flourish and
quickly deplete the oxygen. Anaerobic bacteria can than proliferate in the body. Later in the decomposition process, fungi and bacteria from the environment will also
become involved in the process.
[edit]Microorganisms outside the body
Cadavers and carcasses are usually left to decompose in contact with soil whether through burial in a grave or if left to decompose on the soil surface.
This allows microorganisms in the soil and air to come in contact with the body and to take part in the decomposition process. Soil microorganism
communities also undergo changes as a result of decomposition fluids leaching in the environment. Cadavers and carcasses often show signs of fungal
growth suggesting that fungi use the body as a source of nutrients.
The exact impacts that decomposition may have on surrounding soil microbial communities remains unclear as some studies have shown increases in
microbial biomass following decomposition whereas other have seen decreases. It is likely that the survival of microorganisms throughout the
decomposition process is highly dependent of a multitude of environmental factors including pH, temperature and moisture.

Skeletonized pig carcass showing the production of a cadaver decomposition island surrounding the remains as a result of leaching of decomposition fluids into the
surrounding environment.
[edit]Decomposition fluids and soil microbiology
Decomposition fluids entering the soil represent an important influx of organic matter and can also contain a large microbial load of organisms from the
body.[8] The area where the majority of the decomposition fluid leaches into the soil is often referred to as a cadaver decomposition island (CDI).[9] It has
been observed that decomposition can have a favorable influence on the growth of plants due to increased fertility, a useful tool when trying to locate
clandestine graves.[10] The changes in the concentration of nutrients can have lasting effects that are still seen years after a body or carcass has
completely disappeared.[11] The influence that the surge in nutrients can have on the microorganisms and vegetation of a given site is not well understood
but it appears that decomposition initially has an inhibitory effect for an initial stage before entering a second stage of increased growth.
[edit]Decomposition fungi
See also: detritivore, decomposer, and decomposition
Fungal mycelia (white) on hoof of a deceased pig
It is well known that fungi are heterotrophic for carbon compounds and almost all other nutrients they require. They must obtain these through saprophytic
or parasitic associations with their hosts which implicates them in many decomposition processes.

Two major groups of fungi have been identified as being linked to cadaver decomposition:
ammonia fungi
post-putrefactive fungi
Ammonia fungi are broken-down into two groups referred to as "early stage fungi" and "late stage fungi." Such a classification is possible due to the
successions that are observed between the types of fungi that fruit in or around a burial environment. The progression between the two groups occurs
following the release of nitrogenous products from a body in decomposition. Early stage fungi are described as being ascomycetes, deuteromycetes and
saprophytic basidiomycetes whereas late stage fungi consisted of ectomycorrhizal basidiomycetes.[12]
[edit]Decomposition fungi as PMI estimators
Considering the amount of forensic cases in which significant amounts of mycelia are observed is quite high, investigating cadaver associated mycota
may prove valuable to the scientific community as they have much forensic potential.
Only one attempt at using fungi as a PMI marker in a forensic case has been published to date.[13] The study reported the presence of two types of fungi
(Penicillium andAspergillus) on a body found in a well in Japan and stated that they could estimate PMI as being approximately ten days based on the
known growth cycles of the fungi in question.
[edit]References
2.1.1.14-Relative cost of electricity generated by different sources

ost of electricity by sourceFrom Wikipedia, the free encyclopedia
(Redirected from Relative cost of electricity generated by different sources)
For the completely different subject, price of electricity, see Electricity pricing.
The cost of electricity (typically cents/kWh, Euro/kWh, Euro or $/MWh) generated by different sources is a calculation of the cost
of generating electricity at the point of connection to a load or electricity grid. It includes the initial capital, discount rate, as well as the costs of
continuous operation, fuel, and maintenance. This type of calculation assists policy makers, researchers and others to guide discussions and decision
making.
Contents
[hide]
1 Cost factors
2 Calculations
o 2.1 System boundaries
o 2.2 Discount rate
3 Estimates
o 3.1 US Department of Energy estimates
o 3.2 UK 2010 estimates
o 3.3 French 2011 estimates
o 3.4 Analysis from different sources
o 3.5 Other estimates
4 Beyond the power station terminals, or system costs
5 Externality and insurance costs of energy sources

6 Photovoltaics
7 Additional cost factors
o 7.1 Extraction, emissions, transmission, health
8 See also
9 Further reading
10 References
[edit]Cost factors
The National Renewable Energy Laboratory projects that the levelized cost of wind power will decline about 25% from 2012 to 2030.[1]
While calculating costs, several internal cost factors have to be considered.[2] (Note the use of "costs," which is not the actual selling price, since this can
be affected by a variety of factors such as subsidies and taxes):
Capital costs (including waste disposal and decommissioning costs for nuclear energy) - tend to be low for fossil fuel power stations; high for wind
turbines, solar PV; very high for waste to energy, wave and tidal, solar thermal, and nuclear[citation needed].
Fuel costs - high for fossil fuel and biomass sources, low for nuclear, and zero for renewables.[citation needed]
Factors such as the costs of waste (and associated issues) and different insurance costs are not included in the following: Works power, own use
orparasitic load - that is, the portion of generated power actually used to run the stations pumps and fans has to be allowed for.[citation needed]
To evaluate the total cost of production of electricity, the streams of costs are converted to a net present value using the time value of money. These costs
are all brought together using discounted cash flow.[3][4] The marginal cost of production at very low levels of output should be relatively low. Small amount

of wind due to nature would result in very low levels of output. However, the wind turbine is the initial investment of producing wind energy; therefore, once
the turbine has been built, not much money will be invested into producing wind energy other than maintenance. Having a very low level of output means
the turbines have already been built, but since wind is free, to produce an extra unit of energy solely depends on nature, which in this case, wind is free.
Therefore, the marginal cost would be relatively low due to the fact that wind, the energy source is free and the maintenance of the turbines would be
relatively low. Wind power normally has a low marginal cost (zero fuel costs) and therefore enters near the bottom of the supply curve. This shifts the
supply curve to the right, resulting in a lower power price, depending on the price elasticity of the power demand. In general, the price of power is
expected to be lower during periods with high wind than in periods with low wind. As mentioned above, there may be congestions in power transmission,
especially during periods with high wind power generation. Thus, if the available transmission capacity cannot cope with the required power export, the
supply area is separated from the rest of the power market and constitutes its own pricing area. With an excess supply of power in this area, conventional
power plants have to reduce their production, since it is generally not possible to limit the power production of wind. In most cases, this will lead to a lower
power price in this sub-market.
[edit]Calculations
See also: Grid parity
Levelized Energy Cost (LEC, also known as Levelised Cost of Energy, abbreviated as LCOE[5]) is the price at which electricity must be generated from a
specific source to break even over the lifetime of the project. It is an economic assessment of the cost of the energy-generating system including all the
costs over its lifetime: initial investment, operations and maintenance, cost of fuel, cost of capital, and is very useful in calculating the costs of generation
from different sources.
It can be defined in a single formula as:[6]
where
= Average lifetime levelized electricity generation cost

= Investment expenditures in the year t
= Operations and maintenance expenditures in the year t
= Fuel expenditures in the year t
= Electricity generation in the year t
= Discount rate
= Life of the system
Typically LECs are calculated over 20 to 40 year lifetimes, and are given in the units of currency per kilowatt-hour, for example AUD/kWh or EUR/kWh or
per megawatt-hour, for example AUD/MWh (as tabulated below).[7] However, care should be taken in comparing different LCOE studies and the sources
of the information as the LCOE for a given energy source is highly dependent on the assumptions, financing terms and technological deployment
analyzed.[7] In particular, assumption of Capacity factor has significant impact on the calculation of LCOE. For example, Solar PV may have a Capacity
Factor as low as 10% depending on location. Thus, a key requirement for the analysis is a clear statement of the applicability of the analysis based on
justified assumptions.[8]
[edit]System boundaries
When comparing LECs for alternative systems, it is very important to define the boundaries of the 'system' and the costs that are included in it. For
example, should transmissions lines and distribution systems be included in the cost? Typically only the costs of connecting the generating source into the
transmission system is included as a cost of the generator. But in some cases wholesale upgrade of the Grid is needed. Careful thought has to be given to
whether or not these costs should be included in the cost of power.
Should R&D, tax, and environmental impact studies be included? Should the costs of impacts on public health and environmental damage be included?
Should the costs of government subsidies be included in the calculated LEC?
[edit]Discount rate
Another key issue is the decision about the value of the discount rate . The value that is chosen for can often 'weigh' the decision towards one option
or another, so the basis for choosing the discount must clearly be carefully evaluated. See internal rate of return. The appropriate discount rate is not the
actual cost of capital, but typically 3.5%.[9]
A more telling economic assessment might be the marginal cost of electricity. This value would serve the purpose of comparing the added cost of
increasing electricity generation by one unit from different sources of electricity generation.
[edit]Estimates
[edit]US Department of Energy estimates
The tables below list the estimated cost of electricity by source for plants entering service in 2017. The tables are from a January 23, 2012 report of
the Energy Information Administration (EIA) of the U.S. Department of Energy (DOE) called "Levelized Cost of New Generation Resources in the Annual
Energy Outlook 2012".[10]
Total System Levelized Cost (the rightmost column) gives the dollar cost per megawatt-hour that must be charged over time in order to pay for
the total cost. Divide by 1000 to get the cost per kilowatt-hour (move the decimal point 1 place to the left to get the cost in cents/kWh).
These calculations reflect an adjustment to account for the high level of carbon dioxide produced by coal plants. From the EIA report:
"a 3-percentage point increase in the cost of capital is added when evaluating investments in greenhouse gas (GHG) intensive technologies like
coal-fired power and coal-to-liquids (CTL) plants without carbon control and sequestration (CCS). While the 3-percentage point adjustment is
somewhat arbitrary, in levelized cost terms its impact is similar to that of a $15 per metric ton of carbon dioxide (CO2) emissions fee. ... As a
result, the levelized capital costs of coal-fired plants without CCS are higher than would otherwise be expected."[10]
No tax credits or incentives are incorporated in the tables. From the EIA report (emphasis added):
"Levelized cost represents the present value of the total cost of building and operating a generating plant over an assumed financial life and duty
cycle, converted to equal annual payments and expressed in terms of real dollars to remove the impact of inflation. Levelized cost
reflects overnight capital cost, fuel cost, fixed and variable O&M cost, financing costs, and an assumed utilization rate for each plant
type. The availability of various incentives including state or federal tax credits can also impact the calculation of levelized cost. The values
shown in the tables below do not incorporate any such incentives."[10]
Incentives, tax credits, production mandates, etc. are discussed in the overall comprehensive EIA report: "Annual Energy Outlook 2012".[11][12][13]

Photovoltaics (solar PV) can be used both by distributed residential or commercial users and utility scale power plants. The costs shown are for
utility scale photovoltaic power plants.[10]
Estimated Levelized Cost of New Generation Resources, 2017[10]
U.S. Average Levelized Cost for Plants Entering Service in 2017(2010 USD/MWh)
Plant TypeCapacity
Factor(%)
LevelizedCapital
Cost
FixedO&M
VariableO&M
(includingfuel)
TransmissionInvestment
TotalSystem
LevelizedCost
Conventional Coal 85 65.8 4.0 28.6 1.2 99.6
Advanced Coal 85 75.2 6.6 29.2 1.2 112.2
Advanced Coal with CCS 85 93.3 9.3 36.8 1.2 140.7
Natural Gas Fired
Conventional Combined Cycle 87 17.5 1.9 48.0 1.2 68.6
Advanced Combined Cycle 87 17.9 1.9 44.4 1.2 65.5

Estimated Levelized Cost of New Generation Resources, 2017[10]
U.S. Average Levelized Cost for Plants Entering Service in 2017(2010 USD/MWh)
Plant TypeCapacity
Factor(%)
LevelizedCapital
Cost
FixedO&M
VariableO&M
(includingfuel)
TransmissionInvestment
TotalSystem
LevelizedCost
Advanced CC with CCS 87 34.9 4.0 52.7 1.2 92.8
Conventional Combustion Turbine 30 46.0 2.7 79.9 3.6 132.0
Advanced Combustion Turbine 30 31.7 2.6 67.5 3.6 105.3
Advanced Nuclear 90 88.8 11.3 11.6 1.1 112.7
Geothermal 92 76.6 11.9 9.6 1.5 99.6
Biomass 83 56.8(MC(Yi=0)=*26.5) 13.8 48.3 1.3 120.2
Wind1 34 83.3 9.7 0.0 3.7 96.8

Estimated Levelized Cost of New Generation Resources, 2017[10]
U.S. Average Levelized Cost for Plants Entering Service in 2017(2010 USD/MWh)
Plant TypeCapacity
Factor(%)
LevelizedCapital
Cost
FixedO&M
VariableO&M
(includingfuel)
TransmissionInvestment
TotalSystem
LevelizedCost
Wind — Offshore1 27 300.6 22.4 0.0 7.7 330.6
Solar PV1,2 25 144.9 7.7 0.0 4.2 156.9
Solar Thermal1 20 204.7 40.1 0.0 6.2 251.0
Hydro1 53 76.9 4.0 6.0 2.1 89.9
1Non-dispatchable (Hydro is dispatchable within a season, but nondispatchable overall-limited by site and season)2Costs are expressed in terms of net AC power available to the grid for the installed capacity
Regional Variation in Levelized Costs of New Generation Resources, 2017[11]
Plant TypeRange for Total System Levelized Costs
(2010 USD/MWh)

Minimum Average Maximum
Conventional Coal 90.1 99.6 116.3
Advanced Coal 103.9 112.2 126.1
Advanced Coal with CCS 129.6 140.7 162.4
Natural Gas Fired
Conventional Combined Cycle 61.8 68.6 88.1
Advanced Combined Cycle 58.9 65.5 83.3
Advanced CC with CCS 82.8 92.8 110.9
Conventional Combustion Turbine 94.6 132.0 164.1
Advanced Combustion Turbine 80.4 105.3 133.0
Advanced Nuclear 108.4 112.7 120.1

Geothermal 85.0 99.6 113.9
Biomass 101.5 120.2 142.8
Wind 78.2 96.8 114.1
Wind — Offshore 307.3 330.6 350.4
Solar PV 122.2 156.9 245.6
Solar Thermal 182.7 251.0 400.7
Hydro[14] 57.8 88.9 147.6
O&M = operation and maintenance.
CC = combined cycle.
CCS = carbon capture and sequestration.
PV = photovoltaics.
GHG = greenhouse gas.
[edit]UK 2010 estimates

In March 2010, a new report on UK levelised generation costs was published by Parsons Brinckerhoff.[15] It puts a range on each cost
due to various uncertainties. Combined cycle gas turbines without CO2 capture are not directly comparable to the other low carbon
emission generation technologies in the PB study. The assumptions used in this study are given in the report.
UK energy costs for different generation technologies in pounds permegawatt hour (2010)
Technology Cost range (£/MWh)[citation needed]
New nuclear 80–105
Onshore wind 80–110
Biomass 60–120
Natural gas turbines with CO2 capture 60–130
Coal with CO2 capture 100–155
Solar farms 125–180
Offshore wind 150–210

UK energy costs for different generation technologies in pounds permegawatt hour (2010)
Technology Cost range (£/MWh)[citation needed]
Natural gas turbine, no CO2 capture 55–110
Tidal power 155–390
Divide the above figures by 10 to obtain the price in pence per kilowatt-hour.
More recent UK estimates are the Mott MacDonald study released by DECC in June 2010 [16] and the Arup study for DECC published in
2011.[17]
[edit]French 2011 estimates
The International Agency for the Energy and EDF have estimated for 2011 the following costs. For the nuclear power they include the
costs due to new safety investments to upgrade the French nuclear plant after the Fukushima Daiichi nuclear disaster; the cost for
those investments is estimated at 4 €/MWh. Concerning the solar power the estimate at 293 €/MWh is for a large plant capable to
produce in the range of 50-100 GWh/year located in a favorable location (such as in Southern Europe). For a small household plant
capable to produce typically around 3 MWh/year the cost is according to the location between 400 and 700 €/MWh. Currently solar
power is by far the most expensive renewable source to produce electricity, although increasing efficiency and longer lifespan of
photovoltaic panels together with reduced production costs could make this source of energy more competitive.
French energy costs for different generation technologies in Euros per megawatt hour (2011)

Technology Cost (€/MWh)
Hydro power 20
Nuclear 50
Natural gas turbines without CO2 capture 61
Onshore wind 69
Solar farms 293
[edit]Analysis from different sources
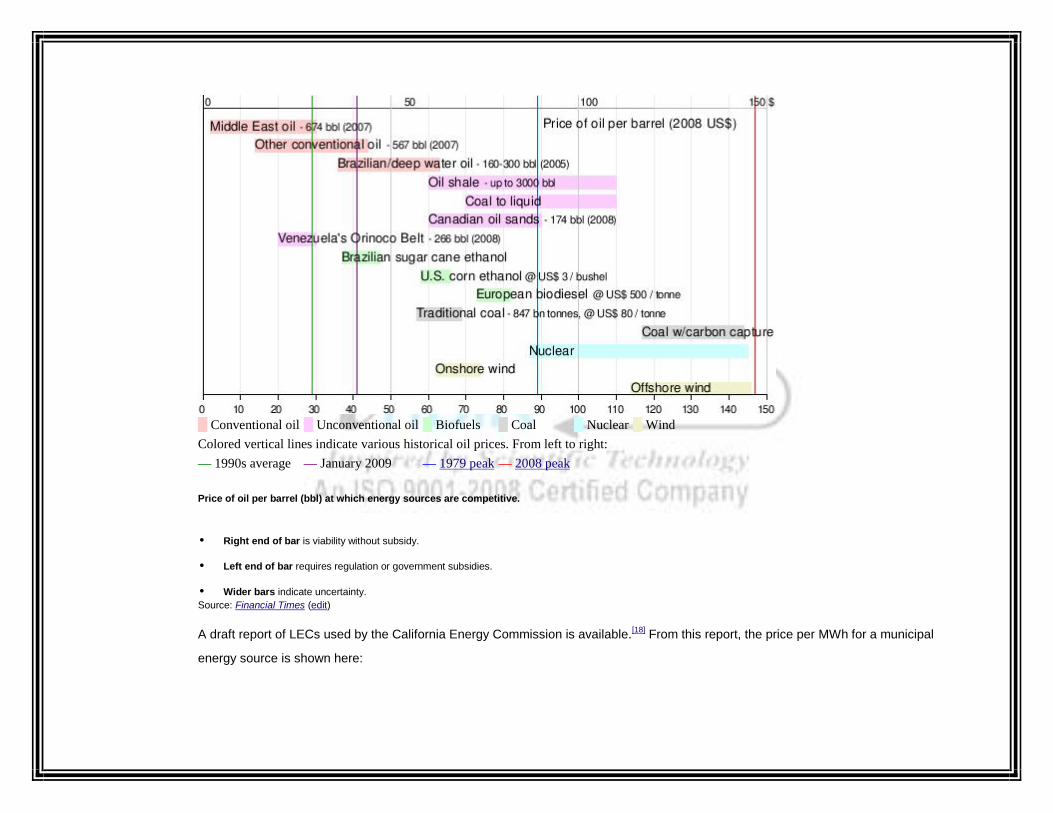
█ Conventional oil █ Unconventional oil █ Biofuels █ Coal █ Nuclear █ Wind
Colored vertical lines indicate various historical oil prices. From left to right:
— 1990s average — January 2009 — 1979 peak — 2008 peak
Price of oil per barrel (bbl) at which energy sources are competitive.
Right end of bar is viability without subsidy.
Left end of bar requires regulation or government subsidies.
Wider bars indicate uncertainty.Source: Financial Times (edit)
A draft report of LECs used by the California Energy Commission is available.[18] From this report, the price per MWh for a municipal
energy source is shown here:

California levelized energy costs for different generation technologies inUS dollars per megawatt hour (2007)
Technology Cost (USD/MWh)
Advanced Nuclear 67
Coal 74–88
Gas 87–346
Geothermal 67
Hydro power 48–86
Wind power 60
Solar 116–312
Biomass 47–117
Fuel Cell 86–111

California levelized energy costs for different generation technologies inUS dollars per megawatt hour (2007)
Technology Cost (USD/MWh)
Wave Power 611
Note that the above figures incorporate tax breaks for the various forms of power plants. Subsidies range from 0% (for Coal) to 14% (for
nuclear) to over 100% (for solar).
The following table gives a selection of LECs from two major government reports from Australia.[19][20] Note that these LECs
do not include any cost for the greenhouse gasemissions (such as under carbon tax or emissions trading scenarios) associated with the
different technologies.
Levelised energy costs for different generation technologies in Australian dollars per megawatt hour(2006)
Technology Cost (AUD/MWh)
Nuclear (to COTS plan)[20] 40–70
Nuclear (to suit site; typical)[20] 75–105
Coal 28–38

Levelised energy costs for different generation technologies in Australian dollars per megawatt hour(2006)
Technology Cost (AUD/MWh)
Coal: IGCC + CCS 53–98
Coal: supercritical pulverized + CCS 64–106
Open-cycle Gas Turbine 101
Hot fractured rocks 89
Gas: combined cycle 37–54
Gas: combined cycle + CCS 53–93
Small Hydro power 55
Wind power: high capacity factor 63
Solar thermal 85

Levelised energy costs for different generation technologies in Australian dollars per megawatt hour(2006)
Technology Cost (AUD/MWh)
Biomass 88
Photovoltaics 120

In 1997 the Trade Association for Wind Turbines (Wirtschaftsverband Windkraftwerke e.V. –WVW) ordered a study into the costs of
electricity production in newly constructed conventional power plants from the Rheinisch-Westfälischen Institute for Economic Research
–RWI). The RWI predicted costs of electricity production per kWh for the basic load for the year 2010 as follows:[citation needed]
Fuel Cost per kilowatt hour in euro cents.
Nuclear Power 10.7 €ct – 12.4 €ct
Brown Coal (Lignite) 8.8 €ct – 9.7 €ct
Black Coal (Bituminous) 10.4 €ct – 10.7 €ct
Natural gas 11.8 €ct – 10.6 €ct.
The part of a base load represents approx. 64% of the electricity production in total. The costs of electricity production for the mid-load
and peak load are considerably higher. There is a mean value for the costs of electricity production for all kinds of conventional
electricity production and load profiles in 2010 which is 10.9 €ct to 11.4 €ct per kWh. The RWI calculated this on the assumption that the
costs of energy production would depend on the price development of crude oil and that the price of crude oil would be approx. 23 US$
per barrel in 2010. In fact the crude oil price is about 80 US$ in the beginning of 2010. This means that the effective costs of
conventional electricity production still need to be higher than estimated by the RWI in the past.
The WVW takes the legislative feed-in-tariff as basis for the costs of electricity production out of renewable energies because renewable
power plants are economically feasible under the German law (German Renewable Energy Sources Act-EEG).

The following figures arise for the costs of electricity production in newly constructed power plants in 2010:[citation needed]
Energy source Costs of electricity production in euros per megawatt hour
Nuclear Energy 107.0 – 124.0
Brown Coal 88.0 – 97.0
Black Coal 104.0 – 107.0
Domestic Gas 106.0 – 118.0
Wind Energy Onshore 49.7 – 96.1
Wind Energy Offshore 35.0 – 150.0
Hydropower 34.7 – 126.7
Biomass 77.1 – 115.5
Solar Electricity 284.3 – 391.4
[edit]Other estimates

A 2010 study by the Japanese government, called the Energy White Paper, concluded the cost for kilowatt hour was ¥49 for solar, ¥10
to ¥14 for wind, and ¥5 or ¥6 for nuclear power. Masayoshi Son, an advocate for renewable energy, however, has pointed out that the
government estimates for nuclear power did not include the costs for reprocessing the fuel or disaster insurance liability. Son estimated
that if these costs were included, the cost of nuclear power was about the same as wind power.[21][22][23]
[edit]Beyond the power station terminals, or system costs
The raw costs developed from the above analysis are only part of the picture in planning and costing a large modern power grid. Other
considerations are the temporal load profile, i.e. how load varies second to second, minute to minute, hour to hour, month to month. To
meet the varying load, generally a mix of plant options is needed, and the overall cost of providing this load is then important. Wind
power has poor capacity contribution, so during windless periods, some form of back up must be provided. All other forms of power
generation also require back up, though to a lesser extent. To meet peak demand on a system, which only persist for a few hours per
year, it is often worth using very cheap to build, but very expensive to operate plant - for example some large grids also use load
shedding coupled with diesel generators [24] at peak or extreme conditions - the very high kWh production cost being justified by not
having to build other more expensive capacity and a reduction in the otherwise continuous and inefficient use of spinning reserve.
In the case of wind energy, the additional costs in terms of increased back up and grid interconnection to allow for diversity of weather
and load may be substantial. This is because wind stops blowing frequently even in large areas at once and for prolonged periods of
time. Some wind advocates have argued that in the pan-European case back up costs are quite low, resulting in overall wind energy
costs about the same as present day power.[25] However, such claims are generally considered too optimistic, except possibly for some
marginal increases that, in particular circumstances, may take advantage of the existing infrastructure.[citation needed]
The cost in the UK of connecting new offshore wind in transmission terms, has been consistently put by Grid/DECC/Ofgem at £15billion
by 2020. This £15b cost does not include the cost of any new connections to Europe - interconnectors, or a supergrid, as advocated by
some. The £15b cost is the cost of connecting offshore wind farms by cables typically less than 12 km in length, to the UK's nearest
suitable onshore connection point. There are total forecast onshore transmission costs of connecting various new UK generators by
2020, as incurred from 2010, of £4.7 billion, by comparison.

When a new plant is being added to a power system or grid, the effects are quite complex - for example, when wind energy is added to
a grid, it has a marginal cost associated with production of about £20/MWh (most incurred as lumpy but running-related maintenance -
gearbox and bearing failures, for instance, and the cost of associated downtime), and therefore will always offer cheaper power than
fossil plant - this will tend to force the marginally most expensive plant off the system. A mid range fossil plant, if added, will only force
off those plants that are marginally more expensive. Hence very complex modelling of whose systems is required to determine the likely
costs in practice of a range of power generating plant options, or the effect of adding a given plant.
With the development of markets, it is extremely difficult for would-be investors to estimate the likely impacts and cost benefit of an
investment in a new plant, hence in free market electricity systems, there tends to be an incipient shortage of capacity, due to the
difficulties of investors accurately estimating returns, and the need to second guess what competitors might do.[citation needed]
The Institution of Engineers and Shipbuilders in Scotland commissioned a former Director of Operations of the British National Grid,
Colin Gibson, to produce a report on generation levelised costs that for the first time would include some of the transmission costs as
well as the generation costs. This was published in December 2011 and is available on the internet :.[26] The institution seeks to
encourage debate of the issue, and has taken the unusual step among compilers of such studies of publishing a spreadsheet showing
its data available on the internet :[27]
[edit]Externality and insurance costs of energy sources
Main article: Environmental impact of the energy industry
Main article: Economics of new nuclear power plants
Nuclear power plants built recently, or in the process of being built, have incurred many cost overruns. Those being built now are
expected to incur further cost overruns due to design changes after the Fukushima Daiichi nuclear disaster.[28] However there are also
many nuclear reactors being built underbudget and on schedule, with two new Chinese reactors expected to be commissioned at the
end of 2013 and autumn 2014 respectively.[29]

Nuclear power has in the past been granted indemnity from the burden of carrying full third party insurance liabilities in accordance with
the Paris convention on nuclear third-party liability, the Brussels supplementary convention, and the Vienna convention on civil liability
for nuclear damage.[30]
The limited insurance that is required does not cover the full cost of a major nuclear accident of the kind that occurred
at Chernobyl or Fukushima. An April 2011 report by Versicherungsforen Leipzig, a Leipzig company that specializes in actuarial
calculations states that full insurance of German power plants against nuclear disasters would increase the price of nuclear electricity by
€0.14/kWh ($0.20/kWh) to €2.36/kWh ($3.40/kWh), if the full potential damage sum of 6 trillion Euro is to be paid as insurance fee over
a time span of 100 or 10 years, respectively.[31][32][33][34][35][36]
The US Energy Information Administration predicts that coal and gas are set to be continually used to deliver the majority of the world's
electricity,[37] this is expected to result in the evacuation of millions of homes in low lying areas, and an annual cost of hundreds of
billions of dollars worth of property damage.[38][39][40][41][42][43][44]
Furthermore, with the ongoing process of whole nations being slowly plunged underwater, due to fossil fuel use,[45] massive
international climate litigation lawsuits against fossil fuel users are currently beginning in the International Court of Justice.[46][47]
An EU funded research study known as ExternE, or Externalities of Energy, undertaken over the period of 1995 to 2005 found that the
cost of producing electricity from coal or oil would double over its present value, and the cost of electricity production from gas would
increase by 30% if external costs such as damage to the environment and to human health, from the particulate matter,nitrogen
oxides, chromium VI and arsenic emissions produced by these sources, were taken into account. It was estimated in the study that
these external, downstream, fossil fuel costs amount up to 1%-2% of the EU’s entire Gross Domestic Product (GDP), and this was
before the external cost of global warming from these sources was even included.[48] [49]
[edit]Photovoltaics
The table below illustrates the calculated total cost in US cents per kilowatt-hour of electricity generated by a photovoltaic system as
function of the investment cost and the efficiency, assuming some accounting parameters such as cost of capital and depreciation
period. The row headings on the left show the total cost, per peak kilowatt (kWp), of a photovoltaic installation. The column headings

across the top refer to the annual energy output in kilowatt-hours expected from each installed peak kilowatt. This varies by geographic
region because the average insolation depends on the average cloudiness and the thickness of atmosphere traversed by the sunlight. It
also depends on the path of the sun relative to the panel and the horizon.
Panels can be mounted at an angle based on latitude,[50] or solar tracking can be utilized to access even more perpendicular sunlight,
thereby raising the total energy output. The calculated values in the table reflect the total cost in cents per kilowatt-hour produced. They
assume a 5% capital cost/year (for instance 4% average interest, 1% operating and maintenance cost, andstraight-line depreciation of
the capital outlay over 20 years).
Table showing average cost in cents/kWh over 20 years for solar power panels
Energy Yield
Cost 2400kWh/kWp•y
2200kWh/kWp•y
2000kWh/kWp•y
1800kWh/kWp•y
1600kWh/kWp•y
1400kWh/kWp•y
1200kWh/kWp•y
1000kWh/kWp•y
800kWh/kWp•y
200 $/kWp 0.8 0.9 1.0 1.1 1.3 1.4 1.7 2.0 2.5
600 $/kWp 2.5 2.7 3.0 3.3 3.8 4.3 5.0 6.0 7.5
1000 $/kWp 4.2 4.5 5.0 5.6 6.3 7.1 8.3 10.0 12.5
1400 $/kWp 5.8 6.4 7.0 7.8 8.8 10.0 11.7 14.0 17.5

1800 $/kWp 7.5 8.2 9.0 10.0 11.3 12.9 15.0 18.0 22.5
2200 $/kWp 9.2 10.0 11.0 12.2 13.8 15.7 18.3 22.0 27.5
2600 $/kWp 10.8 11.8 13.0 14.4 16.3 18.6 21.7 26.0 32.5
3000 $/kWp 12.5 13.6 15.0 16.7 18.8 21.4 25.0 30.0 37.5
3400 $/kWp 14.2 15.5 17.0 18.9 21.3 24.3 28.3 34.0 42.5
3800 $/kWp 15.8 17.3 19.0 21.1 23.8 27.1 31.7 38.0 47.5
4200 $/kWp 17.5 19.1 21.0 23.3 26.3 30.0 35.0 42.0 52.5
4600 $/kWp 19.2 20.9 23.0 25.6 28.8 32.9 38.3 46.0 57.5
5000 $/kWp 20.8 22.7 25.0 27.8 31.3 35.7 41.7 50.0 62.5
[edit]Additional cost factors
[edit]Extraction, emissions, transmission, health
This calculation does not include wider system costs associated with each type of plant, such as long distance transmission
connections to grids, balancing and reserve costs, and does not include externalities such as health damage by coal plants, nor the

effect of CO2 emissions on the whole biosphere (climate change, ocean acidification and eutrophication, ocean current shifts), nor
decommissioning costs of nuclear plant, is therefore not full cost accounting: These types of items can be explicitly added as necessary
depending on the purpose of the calculation. It has little relation to actual price of power, but assists policy makers and others to guide
discussions and decision making.
These are not minor factors but very significantly affect all responsible power decisions:
Comparisons of life-cycle greenhouse gas emissions show coal, for instance, to be radically higher in terms of GHGs than any
alternative. Accordingly, in the analysis below, carbon capturedcoal is generally treated as a separate source rather than being
averaged in with other coal.
Other environmental concerns with electricity generation include acid rain, ocean acidification and effect of coal extraction on
watersheds.
Various human health concerns with electricity generation, including asthma and smog, now dominate decisions in developed
nations that incur health care costs publicly. A Harvard UniversityMedical School study estimates the US health costs of coal alone
at between 300 and 500 billion US dollars annually.[51]
While cost per kWh of transmission varies drastically with distance, the long complex projects required to clear or even upgrade
transmission routes make even attractive new supplies often uncompetitive with conservation measures (see below), because the
timing of payoff must take the transmission upgrade into account.
[edit]See also
Energy portal
Electricity pricing
Comparisons of life-cycle greenhouse gas emissions
Distributed generation
Economics of new nuclear power plants

Demand response
Intermittent energy source
National Grid Reserve Service
Nuclear power in France
List of thermal power station failures
Calculating the cost of the UK Transmission network: cost per kWh of transmission
List of countries by electricity production from renewable sources
List of U.S. states by electricity production from renewable sources
Environmental concerns with electricity generation
Grid parity
[edit]Further reading
Nuclear Power: Still Not Viable without Subsidies. February 2011. By Doug Koplow. Union of Concerned Scientists.
How to Calculate the Levelized Cost of Energy – a simplified approach | Energy Technology Expert. Engineer Marcial T. Ocampo.
Levelized Cost of New Electricity Generating Technologies. Institute for Energy Research.
[edit]References

2.1.1.15-Sewage treatment
Sewage treatmentFrom Wikipedia, the free encyclopedia

The objective of sewage treatment is to produce a disposable effluent without causing harm to the surrounding environment, and preventpollution.[1]
Sewage treatment is the process of removing contaminants from wastewater and household sewage, both runoff (effluents), domestic, commercial and
institutional. It includes physical, chemical, and biological processes to remove physical, chemical and biological contaminants. Its objective is to produce
an environmentally safe fluid waste stream (or treated effluent) and a solid waste (or treated sludge) suitable for disposal or reuse (usually as
farm fertilizer). Using advanced technology it is now possible to re-use sewage effluent for drinking water, although Singaporeis the only country to
implement such technology on a production scale in its production of NEWater.[2]
Contents
[hide]
1 Origins of sewage
2 Process overview
o 2.1 Pretreatment
2.1.1 Screening
2.1.2 Grit removal
2.1.3 Flow equalization
2.1.4 Fat and grease removal
o 2.2 Primary treatment
o 2.3 Secondary treatment
2.3.1 Activated sludge
2.3.2 Aerobic granular sludge
2.3.3 Surface-aerated basins (Lagoons)
2.3.4 Filter beds (oxidizing beds)
2.3.5 Constructed wetlands
2.3.6 Soil bio-technology

2.3.7 Biological aerated filters
2.3.8 Rotating biological contactors
2.3.9 Membrane bioreactors
2.3.10 Secondary sedimentation
o 2.4 Tertiary treatment
2.4.1 Filtration
2.4.2 Lagooning
2.4.3 Nutrient removal
2.4.3.1 Nitrogen removal
2.4.3.2 Phosphorus removal
o 2.5 Disinfection
o 2.6 Odor control
3 Package plants and batch reactors
4 Sludge treatment and disposal
o 4.1 Anaerobic digestion
o 4.2 Aerobic digestion
o 4.3 Composting
o 4.4 Incineration
o 4.5 Sludge disposal
5 Treatment in the receiving environment
o 5.1 Effects on biology
6 Sewage treatment in developing countries
7 See also

8 References
9 External links
[edit]Origins of sewage
Sewage is generated by residential,institutional, and commercial and industrial establishments. It includes household waste liquid
from toilets, baths, showers, kitchens, sinks and so forth that is disposed of via sewers. In many areas, sewage also includes liquid waste from industry
and commerce. The separation and draining of household waste into greywater and blackwater is becoming more common in the developed world, with
greywater being permitted to be used for watering plants or recycled for flushing toilets.
Sewage may include stormwater runoff. Sewerage systems capable of handling stormwater are known as combined sewer systems. This design was
common when urban sewerage systems were first developed, in the late 19th and early 20th centuries.[3]:119 Combined sewers require much larger and
more expensive treatment facilities than sanitary sewers. Heavy volumes of storm runoff may overwhelm the sewage treatment system, causing a spill or
overflow. Sanitary sewers are typically much smaller than combined sewers, and they are not designed to transport stormwater. Backups of raw sewage
can occur if excessive infiltration/inflow (dilution by stormwater and/or groundwater) is allowed into a sanitary sewer system. Communities that
have urbanizedin the mid-20th century or later generally have built separate systems for sewage (sanitary sewers) and stormwater, because precipitation
causes widely varying flows, reducing sewage treatment plant efficiency.[4]
As rainfall travels over roofs and the ground, it may pick up various contaminants including soil particles and other sediment, heavy metals, organic
compounds, animal waste, and oil and grease. (See urban runoff.)[5] Some jurisdictions require stormwater to receive some level of treatment before being
discharged directly into waterways. Examples of treatment processes used for stormwater include retention basins, wetlands, buried vaults with various
kinds of media filters, and vortex separators (to remove coarse solids).
[edit]Process overview
Sewage can be treated close to where it is created, a decentralised system (in septic tanks, biofilters or aerobic treatment systems), or be collected and
transported by a network of pipes and pump stations to a municipal treatment plant, a centralised system (see sewerage and pipes and infrastructure).
Sewage collection and treatment is typically subject to local, state and federal regulations and standards. Industrial sources of sewage often require
specialized treatment processes (see Industrial wastewater treatment).

Sewage treatment generally involves three stages, called primary, secondary and tertiary treatment.
Primary treatment consists of temporarily holding the sewage in a quiescent basin where heavy solids can settle to the bottom while oil, grease
and lighter solids float to the surface. The settled and floating materials are removed and the remaining liquid may be discharged or subjected to
secondary treatment.
Secondary treatment removes dissolved and suspended biological matter. Secondary treatment is typically performed by indigenous, water-borne
micro-organisms in a managed habitat. Secondary treatment may require a separation process to remove the micro-organisms from the treated water
prior to discharge or tertiary treatment.
Tertiary treatment is sometimes defined as anything more than primary and secondary treatment in order to allow rejection into a highly sensitive
or fragile ecosystem (estuaries, low-flow rivers, coral reefs,...). Treated water is sometimes disinfected chemically or physically (for example, by
lagoons and microfiltration) prior to discharge into a stream, river, bay, lagoon orwetland, or it can be used for the irrigation of a golf course, green
way or park. If it is sufficiently clean, it can also be used for groundwater recharge or agricultural purposes.Process flow diagram for a typical large-scale treatment plant

Process flow diagram for a typical treatment plant via subsurface flow constructed wetlands (SFCW)

[edit]Pretreatment
Pretreatment removes materials that can be easily collected from the raw sewage before they damage or clog the pumps and sewage lines of primary
treatment clarifiers (trash, tree limbs, leaves, branches etc.).
[edit]Screening
Main article: Sieve

The influent sewage water passes through a bar screen to remove all large objects like cans, rags, sticks, plastic packets etc. carried in the sewage
stream.[6] This is most commonly done with an automated mechanically raked bar screen in modern plants serving large populations, whilst in smaller or
less modern plants, a manually cleaned screen may be used. The raking action of a mechanical bar screen is typically paced according to the
accumulation on the bar screens and/or flow rate. The solids are collected and later disposed in a landfill, or incinerated. Bar screens or mesh screens of
varying sizes may be used to optimize solids removal. If gross solids are not removed, they become entrained in pipes and moving parts of the treatment
plant, and can cause substantial damage and inefficiency in the process.[7]:9
[edit]Grit removal
Pretreatment may include a sand or grit channel or chamber, where the velocity of the incoming sewage is adjusted to allow the settlement of sand, grit,
stones, and broken glass. These particles are removed because they may damage pumps and other equipment. For small sanitary sewer systems, the
grit chambers may not be necessary, but grit removal is desirable at larger plants.[7]Grit chambers come in 3 types: horizontal grit chambers, aerated grit
chambers and vortex grit chambers.
[edit]Flow equalization
Clarifiers and mechanized secondary treatment are more efficient under uniform flow conditions. Equalization basins may be used for temporary storage
of diurnal or wet-weather flow peaks. Basins provide a place to temporarily hold incoming sewage during plant maintenance and a means of diluting and
distributing batch discharges of toxic or high-strength waste which might otherwise inhibit biological secondary treatment (including portable toilet waste,
vehicle holding tanks, and septic tank pumpers). Flow equalization basins require variable discharge control, typically include provisions for bypass and
cleaning, and may also include aerators. Cleaning may be easier if the basin is downstream of screening and grit removal.[8]
[edit]Fat and grease removal
In some larger plants, fat and grease are removed by passing the sewage through a small tank where skimmers collect the fat floating on the surface. Air
blowers in the base of the tank may also be used to help recover the fat as a froth. Many plants, however, use primary clarifiers with mechanical surface
skimmers for fat and grease removal.
[edit]Primary treatment

In the primary sedimentation stage, sewage flows through large tanks, commonly called "pre-settling basins", "primary sedimentation tanks" or "primary
clarifiers".[9] The tanks are used to settle sludge while grease and oils rise to the surface and are skimmed off. Primary settling tanks are usually equipped
with mechanically driven scrapers that continually drive the collected sludge towards a hopper in the base of the tank where it is pumped to sludge
treatment facilities.[7]:9–11 Grease and oil from the floating material can sometimes be recovered for saponification.
[edit]Secondary treatment
Secondary treatment is designed to substantially degrade the biological content of the sewage which are derived from human waste, food waste, soaps
and detergent. The majority of municipal plants treat the settled sewage liquor using aerobic biological processes. To be effective, the biota require
both oxygen and food to live. The bacteria and protozoa consume biodegradable soluble organic contaminants (e.g. sugars, fats, organic short-
chain carbon molecules, etc.) and bind much of the less soluble fractions into floc. Secondary treatment systems are classified as fixed-filmor suspended-
growth systems.
Fixed-film or attached growth systems include trickling filters, biotowers, and rotating biological contactors, where the biomass grows on media
and the sewage passes over its surface.[7]:11–13 The fixed-film principal has further developed into Moving Bed Biofilm Reactors (MBBR), and
Integrated Fixed-Film Activated Sludge (IFAS) processes. An MBBR system typically requires smaller footprint than suspended-growth systems.[10]
Suspended-growth systems include activated sludge, where the biomass is mixed with the sewage and can be operated in a smaller space than
trickling filters that treat the same amount of water. However, fixed-film systems are more able to cope with drastic changes in the amount of
biological material and can provide higher removal rates for organic material and suspended solids than suspended growth systems.[7]:11–13
Roughing filters are intended to treat particularly strong or variable organic loads, typically industrial, to allow them to then be treated by conventional
secondary treatment processes. Characteristics include filters filled with media to which wastewater is applied. They are designed to allow high hydraulic
loading and a high level of aeration. On larger installations, air is forced through the media using blowers. The resultant wastewater is usually within the
normal range for conventional treatment processes.
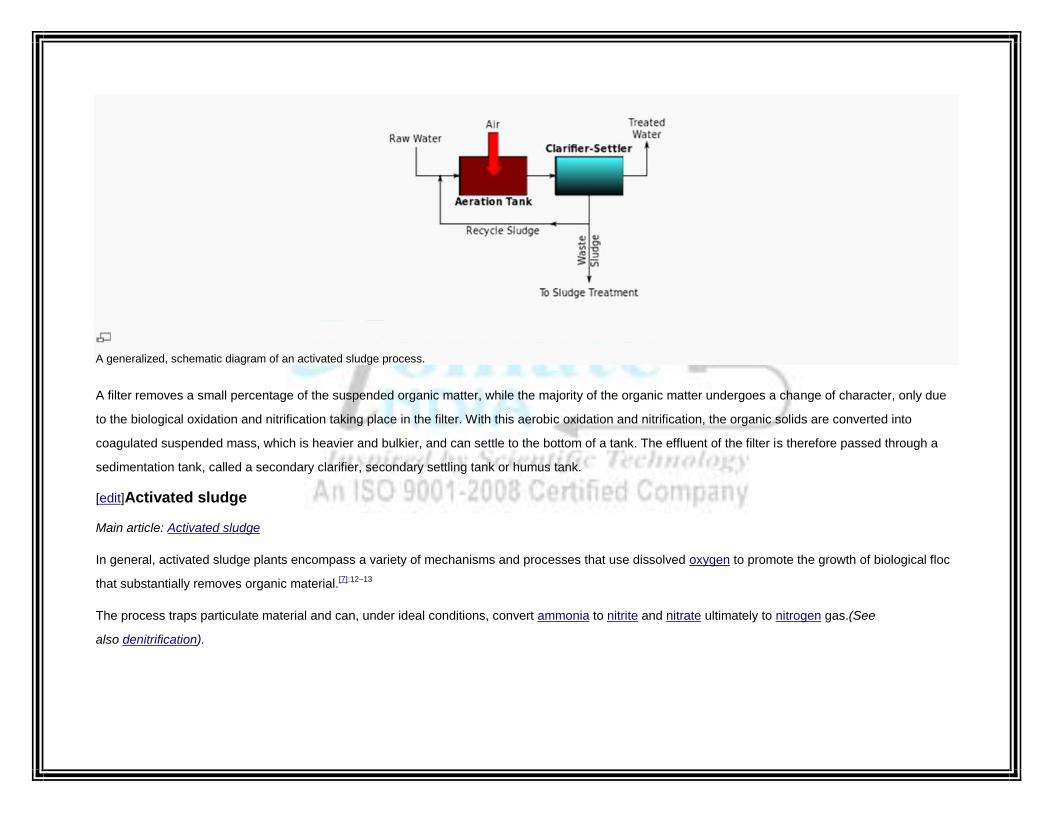
A generalized, schematic diagram of an activated sludge process.
A filter removes a small percentage of the suspended organic matter, while the majority of the organic matter undergoes a change of character, only due
to the biological oxidation and nitrification taking place in the filter. With this aerobic oxidation and nitrification, the organic solids are converted into
coagulated suspended mass, which is heavier and bulkier, and can settle to the bottom of a tank. The effluent of the filter is therefore passed through a
sedimentation tank, called a secondary clarifier, secondary settling tank or humus tank.
[edit]Activated sludge
Main article: Activated sludge
In general, activated sludge plants encompass a variety of mechanisms and processes that use dissolved oxygen to promote the growth of biological floc
that substantially removes organic material.[7]:12–13
The process traps particulate material and can, under ideal conditions, convert ammonia to nitrite and nitrate ultimately to nitrogen gas.(See
also denitrification).

A typical surface-aerated basin (using motor-driven floating aerators)
[edit]Aerobic granular sludge
Main article: Aerobic granulation
Activated sludge systems can be transformed into aerobic granular sludge systems (aerobic granulation) which enhance the benefits of activated sludge,
like increased biomasss retention due to high sludge settlability.
[edit]Surface-aerated basins (Lagoons)
Many small municipal sewage systems in the United States (1 million gal./day or less) use aerated lagoons.[11]
Most biological oxidation processes for treating industrial wastewaters have in common the use of oxygen (or air) and microbial action. Surface-aerated
basins achieve 80–90% removal of BOD with retention times of 1 to 10 days.[12] The basins may range in depth from 1.5 to 5.0 metres and use motor-
driven aerators floating on the surface of the wastewater.[12]
In an aerated basin system, the aerators provide two functions: they transfer air into the basins required by the biological oxidation reactions, and they
provide the mixing required for dispersing the air and for contacting the reactants (that is, oxygen, wastewater and microbes). Typically, the floating

surface aerators are rated to deliver the amount of air equivalent to 1.8 to 2.7 kg O2/kW·h. However, they do not provide as good mixing as is normally
achieved in activated sludge systems and therefore aerated basins do not achieve the same performance level as activated sludge units.[12]
Biological oxidation processes are sensitive to temperature and, between 0 °C and 40 °C, the rate of biological reactions increase with temperature. Most
surface aerated vessels operate at between 4 °C and 32 °C.[12]
[edit]Filter beds (oxidizing beds)
Main article: Trickling filter
In older plants and those receiving variable loadings, trickling filter beds are used where the settled sewage liquor is spread onto the surface of a bed
made up of coke (carbonized coal), limestonechips or specially fabricated plastic media. Such media must have large surface areas to support the biofilms
that form. The liquor is typically distributed through perforated spray arms. The distributed liquor trickles through the bed and is collected in drains at the
base. These drains also provide a source of air which percolates up through the bed, keeping it aerobic. Biological films of bacteria, protozoa and fungi
form on the media’s surfaces and eat or otherwise reduce the organic content.[7]:12 This biofilm is often grazed by insect larvae, snails, and worms which
help maintain an optimal thickness. Overloading of beds increases the thickness of the film leading to clogging of the filter media and ponding on the
surface. Recent advances in media and process micro-biology design overcome many issues with trickling filter designs.
[edit]Constructed wetlands
Constructed wetlands (can either be surface flow or subsurface flow, horizontal or vertical flow), include engineered reedbeds and belong to the family of
phytorestoration and ecotechnologies; they provide a high degree of biological improvement and depending on design, act as a primary, secondary and
sometimes tertiary treatment, also see phytoremediation. One example is a small reedbed used to clean the drainage from the elephants' enclosure
at Chester Zoo in England; numerous CWs are used to recycle the water of the city of Honfleur in France and numerous other towns in Europe, the US,
Asia and Australia. They are known to be highly productive systems as they copy natural wetlands, called the "kidneys of the earth" for their fundamental
recycling capacity of the hydrological cycle in the biosphere. Robust and reliable, their treatment capacities improve as time go by, at the opposite of
conventional treatment plants whose machinery age with time. They are being increasingly used, although adequate and experienced design are more
fundamental than for other systems and space limitation may impede their use.
[edit]Soil bio-technology

A new process called soil bio-technology (SBT) developed at IIT Bombay has shown tremendous improvements in process efficiency enabling total water
reuse, due to extremely low operating power requirements of less than 50 joules per kg of treated water.[13] Typically SBT systems can achieve chemical
oxygen demand (COD) levels less than 10 mg/L from sewage input of COD 400 mg/L.[14] SBT plants exhibit high reductions in COD values and bacterial
counts as a result of the very high microbial densities available in the media. Unlike conventional treatment plants, SBT plants produce insignificant
amounts of sludge, precluding the need for sludge disposal areas that are required by other technologies.[15]
In the Indian context, conventional sewage treatment plants fall into systemic disrepair due to 1) high operating costs, 2) equipment corrosion due to
methanogenesis and hydrogen sulphide, 3) non-reusability of treated water due to high COD (>30 mg/L) and high fecal coliform (>3000 NFU) counts, 4)
lack of skilled operating personnel and 5) equipment replacement issues. Examples of such systemic failures has been documented by Sankat Mochan
Foundation at the Ganges basin after a massive cleanup effort by the Indian government in 1986 by setting up sewage treatment plants under the Ganga
Action Plan failed to improve river water quality.
[edit]Biological aerated filters
Biological Aerated (or Anoxic) Filter (BAF) or Biofilters combine filtration with biological carbon reduction, nitrification or denitrification. BAF usually
includes a reactor filled with a filter media. The media is either in suspension or supported by a gravel layer at the foot of the filter. The dual purpose of this
media is to support highly active biomass that is attached to it and to filter suspended solids. Carbon reduction and ammonia conversion occurs in aerobic
mode and sometime achieved in a single reactor while nitrate conversion occurs in anoxic mode. BAF is operated either in upflow or downflow
configuration depending on design specified by manufacturer.

Schematic diagram of a typical rotating biological contactor (RBC). The treated effluent clarifier/settler is not included in the diagram.
[edit]Rotating biological contactors
Main article: Rotating biological contactor
Rotating biological contactors (RBCs) are mechanical secondary treatment systems, which are robust and capable of withstanding surges in organic load.
RBCs were first installed in Germany in 1960 and have since been developed and refined into a reliable operating unit. The rotating disks support the
growth of bacteria and micro-organisms present in the sewage, which break down and stabilize organic pollutants. To be successful, micro-organisms
need both oxygen to live and food to grow. Oxygen is obtained from the atmosphere as the disks rotate. As the micro-organisms grow, they build up on
the media until they are sloughed off due to shear forces provided by the rotating discs in the sewage. Effluent from the RBC is then passed through
final clarifiers where the micro-organisms in suspension settle as a sludge. The sludge is withdrawn from the clarifier for further treatment.
A functionally similar biological filtering system has become popular as part of home aquarium filtration and purification. The aquarium water is drawn up
out of the tank and then cascaded over a freely spinning corrugated fiber-mesh wheel before passing through a media filter and back into the aquarium.
The spinning mesh wheel develops a biofilm coating of microorganisms that feed on the suspended wastes in the aquarium water and are also exposed to
the atmosphere as the wheel rotates. This is especially good at removing waste urea and ammonia urinated into the aquarium water by the fish and other
animals.
[edit]Membrane bioreactors
Membrane bioreactors (MBR) combine activated sludge treatment with a membrane liquid-solid separation process. The membrane component uses low
pressure microfiltration or ultrafiltrationmembranes and eliminates the need for clarification and tertiary filtration. The membranes are typically immersed in
the aeration tank; however, some applications utilize a separate membrane tank. One of the key benefits of an MBR system is that it effectively
overcomes the limitations associated with poor settling of sludge in conventional activated sludge (CAS) processes. The technology permits bioreactor
operation with considerably higher mixed liquor suspended solids (MLSS) concentration than CAS systems, which are limited by sludge settling. The
process is typically operated at MLSS in the range of 8,000–12,000 mg/L, while CAS are operated in the range of 2,000–3,000 mg/L. The elevated
biomass concentration in the MBR process allows for very effective removal of both soluble and particulate biodegradable materials at higher loading
rates. Thus increased sludge retention times, usually exceeding 15 days, ensure complete nitrification even in extremely cold weather.

The cost of building and operating an MBR is often higher than conventional methods of sewage treatment. Membrane filters can be blinded with grease
or abraded by suspended grit and lack a clarifier's flexibility to pass peak flows. The technology has become increasingly popular for reliably pretreated
waste streams and has gained wider acceptance where infiltration and inflow have been controlled, however, and the life-cycle costs have been steadily
decreasing. The small footprint of MBR systems, and the high quality effluent produced, make them particularly useful for water reuse applications.[16]
[edit]Secondary sedimentation
Secondary sedimentation tank at a rural treatment plant.
The final step in the secondary treatment stage is to settle out the biological floc or filter material through a secondary clarifier and to produce sewage
water containing low levels of organic material and suspended matter.
[edit]Tertiary treatment
The purpose of tertiary treatment is to provide a final treatment stage to further improve the effluent quality before it is discharged to the receiving
environment (sea, river, lake, ground, etc.). More than one tertiary treatment process may be used at any treatment plant. If disinfection is practiced, it is
always the final process. It is also called "effluent polishing."
[edit]Filtration
Sand filtration removes much of the residual suspended matter.[7]:22–23 Filtration over activated carbon, also called carbon adsorption, removes
residualtoxins.[7]:19

[edit]Lagooning
A sewage treatment plant and lagoon inEverett, Washington, United States.
Lagooning provides settlement and further biological improvement through storage in large man-made ponds or lagoons. These lagoons are highly
aerobic and colonization by native macrophytes, especially reeds, is often encouraged. Small filter feeding invertebrates such as Daphnia and species
ofRotifera greatly assist in treatment by removing fine particulates.
[edit]Nutrient removal
Wastewater may contain high levels of the nutrients nitrogen and phosphorus. Excessive release to the environment can lead to a build up of nutrients,
called eutrophication, which can in turn encourage the overgrowth of weeds, algae, and cyanobacteria (blue-green algae). This may cause an algal bloom,
a rapid growth in the population of algae. The algae numbers are unsustainable and eventually most of them die. The decomposition of the algae by
bacteria uses up so much of the oxygen in the water that most or all of the animals die, which creates more organic matter for the bacteria to decompose.
In addition to causing deoxygenation, some algal species produce toxins that contaminate drinking water supplies. Different treatment processes are
required to remove nitrogen and phosphorus.
[edit]Nitrogen removal
The removal of nitrogen is effected through the biological oxidation of nitrogen from ammonia to nitrate (nitrification), followed by denitrification, the
reduction of nitrate to nitrogen gas. Nitrogen gas is released to the atmosphere and thus removed from the water.

Nitrification itself is a two-step aerobic process, each step facilitated by a different type of bacteria. The oxidation of ammonia (NH3) to nitrite (NO2−) is
most often facilitated by Nitrosomonas spp. (nitroso referring to the formation of a nitroso functional group). Nitrite oxidation to nitrate (NO3−), though
traditionally believed to be facilitated by Nitrobacter spp. (nitro referring the formation of anitro functional group), is now known to be facilitated in the
environment almost exclusively by Nitrospira spp.
Denitrification requires anoxic conditions to encourage the appropriate biological communities to form. It is facilitated by a wide diversity of bacteria. Sand
filters, lagooning and reed beds can all be used to reduce nitrogen, but the activated sludge process (if designed well) can do the job the most easily.[7]:17–
18 Since denitrification is the reduction of nitrate to dinitrogen gas, an electron donor is needed. This can be, depending on the wastewater, organic matter
(from faeces), sulfide, or an added donor like methanol. The sludge in the anoxic tanks (denitrification tanks) must be mixed well (mixture of recirculated
mixed liquor, return activated sludge [RAS], and raw influent) e.g. by using submersible mixers in order to achieve the desired denitrification.
Sometimes the conversion of toxic ammonia to nitrate alone is referred to as tertiary treatment.
Many sewage treatment plants use centrifugal pumps to transfer the nitrified mixed liquor from the aeration zone to the anoxic zone for denitrification.
These pumps are often referred to as Internal Mixed Liquor Recycle(IMLR) pumps.
[edit]Phosphorus removal
Each person excretes between 200 and 1000 grams of phosphorus annually. Studies of United States sewage in the late 1960s estimated mean per
capita contributions of 500 grams in urine and feces, 1000 grams in synthetic detergents, and lesser variable amounts used as corrosion and scale control
chemicals in water supplies.[17] Source control via alternative detergent formulations has subsequently reduced the largest contribution, but the content of
urine and feces will remain unchanged. Phosphorus removal is important as it is a limiting nutrient for algae growth in many fresh water systems. (For a
description of the negative effects of algae, see Nutrient removal). It is also particularly important for water reuse systems where high phosphorus
concentrations may lead to fouling of downstream equipment such as reverse osmosis.
Phosphorus can be removed biologically in a process called enhanced biological phosphorus removal. In this process, specific bacteria, called
polyphosphate accumulating organisms (PAOs), are selectively enriched and accumulate large quantities of phosphorus within their cells (up to 20% of
their mass). When the biomass enriched in these bacteria is separated from the treated water, these biosolids have a high fertilizer value.

Phosphorus removal can also be achieved by chemical precipitation, usually with salts of iron (e.g. ferric chloride), aluminum (e.g. alum), or lime.[7]:18 This
may lead to excessive sludge production as hydroxides precipitates and the added chemicals can be expensive. Chemical phosphorus removal requires
significantly smaller equipment footprint than biological removal, is easier to operate and is often more reliable than biological phosphorus removal.
Another method for phosphorus removal is to use granular laterite.
Once removed, phosphorus, in the form of a phosphate-rich sludge, may be stored in a land fill or resold for use in fertilizer.
[edit]Disinfection
The purpose of disinfection in the treatment of waste water is to substantially reduce the number of microorganisms in the water to be discharged back
into the environment for the later use of drinking, bathing, irrigation, etc. The effectiveness of disinfection depends on the quality of the water being treated
(e.g., cloudiness, pH, etc.), the type of disinfection being used, the disinfectant dosage (concentration and time), and other environmental variables.
Cloudy water will be treated less successfully, since solid matter can shield organisms, especially from ultraviolet light or if contact times are low.
Generally, short contact times, low doses and high flows all militate against effective disinfection. Common methods of disinfection
include ozone, chlorine, ultraviolet light, or sodium hypochlorite.[7]:16 Chloramine, which is used for drinking water, is not used in the treatment of waste
water because of its persistence. After multiple steps of disinfection, the treated water is ready to be released back into the water cycle by means of the
nearest body of water or agriculture. Afterwards, the water can be transferred to reserves for everyday human uses.
Chlorination remains the most common form of waste water disinfection in North America due to its low cost and long-term history of effectiveness. One
disadvantage is that chlorination of residual organic material can generate chlorinated-organic compounds that may be carcinogenic or harmful to the
environment. Residual chlorine or chloramines may also be capable of chlorinating organic material in the natural aquatic environment. Further, because
residual chlorine is toxic to aquatic species, the treated effluent must also be chemically dechlorinated, adding to the complexity and cost of treatment.
Ultraviolet (UV) light can be used instead of chlorine, iodine, or other chemicals. Because no chemicals are used, the treated water has no adverse effect
on organisms that later consume it, as may be the case with other methods. UV radiation causes damage to the genetic structure of bacteria, viruses, and
other pathogens, making them incapable of reproduction. The key disadvantages of UV disinfection are the need for frequent lamp maintenance and
replacement and the need for a highly treated effluent to ensure that the target microorganisms are not shielded from the UV radiation (i.e., any solids
present in the treated effluent may protect microorganisms from the UV light). In the United Kingdom, UV light is becoming the most common means of
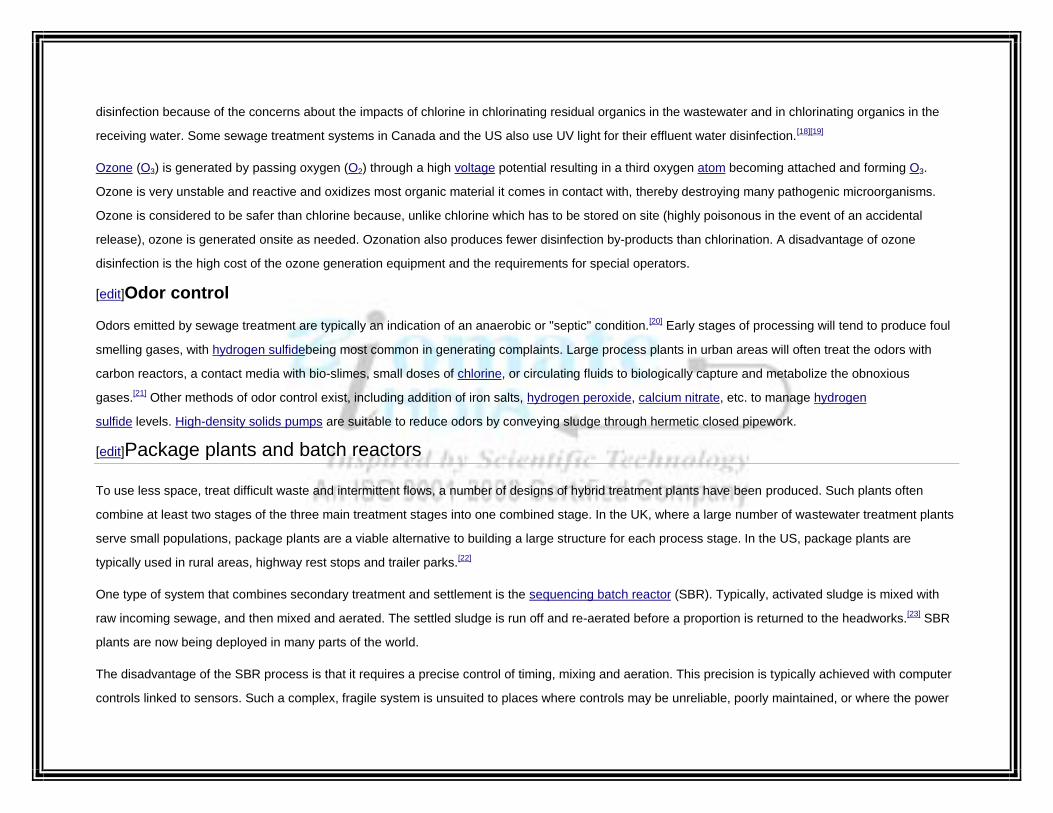
disinfection because of the concerns about the impacts of chlorine in chlorinating residual organics in the wastewater and in chlorinating organics in the
receiving water. Some sewage treatment systems in Canada and the US also use UV light for their effluent water disinfection.[18][19]
Ozone (O3) is generated by passing oxygen (O2) through a high voltage potential resulting in a third oxygen atom becoming attached and forming O3.
Ozone is very unstable and reactive and oxidizes most organic material it comes in contact with, thereby destroying many pathogenic microorganisms.
Ozone is considered to be safer than chlorine because, unlike chlorine which has to be stored on site (highly poisonous in the event of an accidental
release), ozone is generated onsite as needed. Ozonation also produces fewer disinfection by-products than chlorination. A disadvantage of ozone
disinfection is the high cost of the ozone generation equipment and the requirements for special operators.
[edit]Odor control
Odors emitted by sewage treatment are typically an indication of an anaerobic or "septic" condition.[20] Early stages of processing will tend to produce foul
smelling gases, with hydrogen sulfidebeing most common in generating complaints. Large process plants in urban areas will often treat the odors with
carbon reactors, a contact media with bio-slimes, small doses of chlorine, or circulating fluids to biologically capture and metabolize the obnoxious
gases.[21] Other methods of odor control exist, including addition of iron salts, hydrogen peroxide, calcium nitrate, etc. to manage hydrogen
sulfide levels. High-density solids pumps are suitable to reduce odors by conveying sludge through hermetic closed pipework.
[edit]Package plants and batch reactors
To use less space, treat difficult waste and intermittent flows, a number of designs of hybrid treatment plants have been produced. Such plants often
combine at least two stages of the three main treatment stages into one combined stage. In the UK, where a large number of wastewater treatment plants
serve small populations, package plants are a viable alternative to building a large structure for each process stage. In the US, package plants are
typically used in rural areas, highway rest stops and trailer parks.[22]
One type of system that combines secondary treatment and settlement is the sequencing batch reactor (SBR). Typically, activated sludge is mixed with
raw incoming sewage, and then mixed and aerated. The settled sludge is run off and re-aerated before a proportion is returned to the headworks.[23] SBR
plants are now being deployed in many parts of the world.
The disadvantage of the SBR process is that it requires a precise control of timing, mixing and aeration. This precision is typically achieved with computer
controls linked to sensors. Such a complex, fragile system is unsuited to places where controls may be unreliable, poorly maintained, or where the power

supply may be intermittent. Extended aeration package plants use separate basins for aeration and settling, and are somewhat larger than SBR plants
with reduced timing sensitivity.[24]
Package plants may be referred to as high charged or low charged. This refers to the way the biological load is processed. In high charged systems, the
biological stage is presented with a high organic load and the combined floc and organic material is then oxygenated for a few hours before being charged
again with a new load. In the low charged system the biological stage contains a low organic load and is combined with flocculate for longer times.
[edit]Sludge treatment and disposal
Main article: Sewage sludge treatment
The sludges accumulated in a wastewater treatment process must be treated and disposed of in a safe and effective manner. The purpose of digestion is
to reduce the amount of organic matterand the number of disease-causing microorganisms present in the solids. The most common treatment options
include anaerobic digestion, aerobic digestion, and composting. Incineration is also used albeit to a much lesser degree.[7]:19–21
Sludge treatment depends on the amount of solids generated and other site-specific conditions. Composting is most often applied to small-scale plants
with aerobic digestion for mid sized operations, and anaerobic digestion for the larger-scale operations.
The sludge is sometimes passed through a so-called pre-thickener which de-waters the sludge. Types of pre-thickeners include centrifugal sludge
thickeners[25] rotary drum sludge thickeners and belt filter presses.[26][27]
[edit]Anaerobic digestionMain article: Anaerobic digestion
Anaerobic digestion is a bacterial process that is carried out in the absence of oxygen. The process can either be thermophilic digestion, in which sludge
is fermented in tanks at a temperature of 55 °C, or mesophilic, at a temperature of around 36 °C. Though allowing shorter retention time (and thus smaller
tanks), thermophilic digestion is more expensive in terms of energy consumption for heating the sludge.
Anaerobic digestion is the most common (mesophilic) treatment of domestic sewage in septic tanks, which normally retain the sewage from one day to
two days, reducing the Biochemical Oxygen Demand (BOD) by about 35–40%. This reduction can be increased with a combination of anaerobic and
aerobic treatment by installing Aerobic Treatment Units (ATUs) in the septic tank.

Mesophilic anaerobic digestion (MAD) is also a common method for treating sludge produced at sewage treatment plants. The sludge is fed into large
tanks and held for a minimum of 12 days to allow the digestion process to perform the four stages necessary to digest the sludge. These are hydrolysis,
acidogenesis, acetogenesis and methanogenesis. In this process the complex proteins and sugars are broken down to form more simple compounds
such as water, carbon dioxide and methane.[28]
One major feature of anaerobic digestion is the production of biogas (with the most useful component being methane), which can be used in generators
for electricity production and/or in boilers for heating purposes. Many larger sites utilize the biogas for combined heat and power, using the cooling water
from the generators to maintain the temperature of the digestion plant at the required 35 ± 3 °C.
[edit]Aerobic digestion
Aerobic digestion is a bacterial process occurring in the presence of oxygen. Under aerobic conditions, bacteria rapidly consume organic matter and
convert it into carbon dioxide. The operating costs used to be characteristically much greater for aerobic digestion because of the energy used by the
blowers, pumps and motors needed to add oxygen to the process. However, recent technological advances include non-electric aerated filter systems that
use natural air currents for the aeration instead of electrically operated machinery.
Aerobic digestion can also be achieved by using diffuser systems or jet aerators to oxidize the sludge. Fine bubble diffusers are typically the more cost-
efficient diffusion method, however, plugging is typically a problem due to sediment settling into the smaller air holes. Coarse bubble diffusers are more
commonly used in activated sludge tanks (generally a side process in waste water management) or in the flocculation stages. A key component for
selecting diffuser type is to ensure it will produce the required oxygen transfer rate.
[edit]Composting
Composting is also an aerobic process that involves mixing the sludge with sources of carbon such as sawdust, straw or wood chips. In the presence of
oxygen, bacteria digest both the wastewater solids and the added carbon source and, in doing so, produce a large amount of heat.[7]:20
[edit]Incineration
Incineration of sludge is less common because of air emissions concerns and the supplemental fuel (typically natural gases or fuel oil) required to burn the
low calorific value sludge and vaporize residual water. Stepped multiple hearth incinerators with high residence time and fluidized bed incinerators are the

most common systems used to combust wastewater sludge. Co-firing in municipal waste-to-energy plants is occasionally done, this option being less
expensive assuming the facilities already exist for solid waste and there is no need for auxiliary fuel.[7]:20–21
[edit]Sludge disposal
When a liquid sludge is produced, further treatment may be required to make it suitable for final disposal.
Typically, sludges are thickened (dewatered) to reduce the volumes transported off-site for disposal. There is no process which completely eliminates the
need to dispose of biosolids. There is, however, an additional step some cities are taking to superheat sludge and convert it into small pelletized granules
that are high in nitrogen and other organic materials. In New York City, for example, several sewage treatment plants have dewatering facilities that use
large centrifuges along with the addition of chemicals such as polymer to further remove liquid from the sludge. The removed fluid, called centrate, is
typically reintroduced into the wastewater process. The product which is left is called "cake" and that is picked up by companies which turn it into fertilizer
pellets. This product is then sold to local farmers and turf farms as a soil amendment or fertilizer, reducing the amount of space required to dispose of
sludge in landfills. Much sludge originating from commercial or industrial areas is contaminated with toxic materials that are released into the sewers from
the industrial processes.[29] Elevated concentrations of such materials may make the sludge unsuitable for agricultural use and it may then have to be
incinerated or disposed of to landfill.
[edit]Treatment in the receiving environment
The outlet of the Karlsruhe sewage treatment plant flows into the Alb.

Many processes in a wastewater treatment plant are designed to mimic the natural treatment processes that occur in the environment, whether that
environment is a natural water body or the ground. If not overloaded, bacteria in the environment will consume organic contaminants, although this will
reduce the levels of oxygen in the water and may significantly change the overall ecology of the receiving water. Native bacterial populations feed on the
organic contaminants, and the numbers of disease-causing microorganisms are reduced by natural environmental conditions such as predation or
exposure to ultraviolet radiation. Consequently, in cases where the receiving environment provides a high level of dilution, a high degree of wastewater
treatment may not be required. However, recent evidence has demonstrated that very low levels of specific contaminants in wastewater,
includinghormones (from animal husbandry and residue from human hormonal contraception methods) and synthetic materials such as phthalates that
mimic hormones in their action, can have an unpredictable adverse impact on the natural biota and potentially on humans if the water is re-used for
drinking water.[30][31][32] In the US and EU, uncontrolled discharges of wastewater to the environment are not permitted under law, and strict water quality
requirements are to be met, as clean drinking water is essential. (For requirements in the US, see Clean Water Act.) A significant threat in the coming
decades will be the increasing uncontrolled discharges of wastewater within rapidly developing countries.
[edit]Effects on biology
Sewage treatment plants can have multiple effects on nutrient levels in the water that the treated sewage flows into. These effects on nutrients can have
large effects on the biological life in the water in contact with the effluent. Stabilization ponds (or treatment ponds) can include any of the following:
Oxidation ponds, which are aerobic bodies of water usually 1–2 meters in depth that receive effluent from sedimentation tanks or other forms of
primary treatment.
Dominated by algae
Polishing ponds are similar to oxidation ponds but receive effluent from an oxidation pond or from a plant with an extended mechanical treatment.
Dominated by zooplankton

Facultative lagoons, raw sewage lagoons, or sewage lagoons are ponds where sewage is added with no primary treatment other than
coarse screening. These ponds provide effective treatment when the surface remains aerobic; although anaerobic conditions may develop
near the layer of settled sludge on the bottom of the pond.[3]:552–554
Anaerobic lagoons are heavily loaded ponds.
Dominated by bacteria
Sludge lagoons are aerobic ponds, usually 2 to 5 meters in depth, that receive anaerobically digested primary sludge, or activated
secondary sludge under water.
Upper layers are dominated by algae [33]
Phosphorus limitation is a possible result from sewage treatment and results in flagellate-dominated plankton, particularly in summer
and fall.[34]
At the same time a different study found high nutrient concentrations linked to sewage effluents. High nutrient concentration leads to
high chlorophyll a concentrations, which is a proxy for primary production in marine environments. High primary production means
high phytoplankton populations and most likely high zooplankton populations because zooplankton feed on phytoplankton. However,
effluent released into marine systems also leads to greater population instability.[35]
A study carried out in Britain found that the quality of effluent affected the planktonic life in the water in direct contact with the
wastewater effluent. Turbid, low-quality effluents either did not containciliated protozoa or contained only a few species in small
numbers. On the other hand, high-quality effluents contained a wide variety of ciliated protozoa in large numbers. Because of these
findings, it seems unlikely that any particular component of the industrial effluent has, by itself, any harmful effects on the protozoan
populations of activated sludge plants.[36]
The planktonic trends of high populations close to input of treated sewage is contrasted by the bacterial trend. In a study
of Aeromonas spp. in increasing distance from a wastewater source, greater change in seasonal cycles was found the furthest from the
effluent. This trend is so strong that the furthest location studied actually had an inversion of the Aeromonas spp. cycle in comparison to

that of fecal coliforms. Since there is a main pattern in the cycles that occurred simultaneously at all stations it indicates seasonal
factors (temperature, solar radiation, phytoplankton) control of the bacterial population. The effluent dominant species changes
from Aeromonas caviae in winter to Aeromonas sobria in the spring and fall while the inflow dominant species is Aeromonas caviae,
which is constant throughout the seasons.[37]
[edit]Sewage treatment in developing countries
Few reliable figures exist on the share of the wastewater collected in sewers that is being treated in the world. In many developing
countries the bulk of domestic and industrial wastewater is discharged without any treatment or after primary treatment only. In Latin
America about 15% of collected wastewater passes through treatment plants (with varying levels of actual treatment). InVenezuela, a
below average country in South America with respect to wastewater treatment, 97% of the country’s sewage is discharged raw into the
environment.[38] In a relatively developedMiddle Eastern country such as Iran, the majority of Tehran's population has totally untreated
sewage injected to the city’s groundwater.[39] However, the construction of major parts of the sewage system, collection and treatment,
in Tehran is almost complete, and under development, due to be fully completed by the end of 2012. In Isfahan, Iran's third largest city,
sewage treatment was started more than 100 years ago.
In Israel, about 50% of agricultural water usage (total use was 1 billion cubic metres in 2008) is provided through reclaimed sewer
water. Future plans call for increased use of treated sewer water as well as more desalination plants.[40]
Most of sub-Saharan Africa is without wastewater treatment.[citation needed]
[edit]See also
Aerobic granulation
Composting toilet
Waste disposal
Water pollution
Water reclamation

Advanced oxidation processes
Environmental Persistent Pharmaceutical Pollutant EPPP
[edit]References
2.1.1.16-Sludge bulking
Sludge bulkingFrom Wikipedia, the free encyclopedia
In treatment of sewage one process used is the activated sludge process in which air is passed through a mixture of sewage and old sludge to allow the
micro-organisms to break down the organic components of the sewage. Sludge is continually drawn off as new sewage enters the tank and this sludge
must then be settled so that the supernatant can be separated to pass on to further stages of treatment.

Sludge bulking occurs when the sludge fails to separate out in the sedimentation tanks. The main cause of sludge bulking is the growth of
filamentous bacteria.[1]
Filamentous microorganisms grow in long strands that have much greater volume and surface area than conventional floc and are very slow to settle.
Under certain growing conditions, filamentous organisms predominate. There is little robust scientific evidence that can be used to avoid sludge bulking
but what there is indicates that over-loading works, having a carbohydrate rich input and having too low a recycle rate may all contribute.[citation needed]
To avoid sludge bulking some of the flow that enters the reactor can be by-passed, recycle ratio can be increased, lime or soda can be added to the
reactor or the re-aeration rate increased.[citation needed]
[edit]References
1. ^ C. C. Lee and Shun Dar Lin (2007). Handbook of environmental engineering calculations (2nd ed.). McGraw-Hill Professional. pp. 1.550. ISBN 0-07-
147583-4.
[edit]Further reading
R.J. Foot and M.S. Robinson (2003). "Activated sludge bulking and foaming: microbes and myths". In Duncan Mara and N. J. Horan. Handbook
of water and wastewater microbiology. Academic Press. ISBN 0-12-470100-0.
Orris E. Albertson (1992). "Control of Bulking and Foaming Organisms". In Clifford W. Randall and James Lang Barnard. Design and retrofit of
wastewater treatment plants for biological nutrient removal. CRC Press. ISBN 0-87762-922-6.
Jiri Wanner (1994). Activated Sludge Bulking and Foaming Control. CRC Press. ISBN 1-56676-121-2.
[edit]See also
Anaerobic digestion

Thermophilic digesterFrom Wikipedia, the free encyclopedia
A thermophilic digester or thermophilic biodigester is a kind of biodigester that operates in temperatures above 50 °C producing biogas. It has
some advantages: it does not need agitation and is faster in fermentation than a mesophilic digester. In fact, it can be as much as six to ten times
faster than a normal biodigester. The problem is that for use in this biodigester, the source must enter at high temperature. Vinasse is produced at
more than 70 °C and can be used in this kind of biodigester. For each unit of volume of ethanol, about eight units of vinasse are produced. In
Brazil, this kind of biodigester is used to process vinasse as a cheap source of methane.
A Singapore-based company, Biomax Technologies Pte Ltd, has invented and patented a system to convert organic waste into pure solid
organic fertilizer through a Thermophilic digestion. Its system is named as "Biomax Rapid Thermophilic Digestion System" and the process takes
just 24 hours.
[edit]Sources
St. Joseph, MO
Science Direct
Biomax Technologies Website

2.1.1.18-Upflow anaerobic sludge blanket digestion (UASB)
Upflow anaerobic sludge blanket digestionFrom Wikipedia, the free encyclopedia
UASB reactor shown is the larger tank. Hiriya, Tel Aviv,Israel
Upflow anaerobic sludge blanket (UASB) technology, normally referred to as UASB reactor, is a form of anaerobic digester that is used in the treatment
of wastewater.
The UASB reactor is a methanogenic (methane-producing) digester that evolved from the anaerobic clarigester. A similar but variant technology to UASB
is the expanded granular sludge bed (EGSB) digester. A diagramatic comparison of different anaerobic digesters can be found here.
UASB uses an anaerobic process whilst forming a blanket of granular sludge which suspends in the tank. Wastewater flows upwards through the blanket
and is processed (degraded) by the anaerobic microorganisms. The upward flow combined with the settling action ofgravity suspends the blanket with the
aid of flocculants. The blanket begins to reach maturity at around 3 months. Small sludge granules begin to form whose surface area is covered in
aggregations of bacteria. In the absence of any support matrix, the flow conditions creates a selective environment in which only those microorganisms,

capable of attaching to each other, survive and proliferate. Eventually the aggregates form into dense compact biofilms referred to as "granules".[1] A
picture of anaerobic sludge granules can be found here.
Biogas with a high concentration of methane is produced as a by-product, and this may be captured and used as an energy source, to
generate electricity for export and to cover its own running power. The technology needs constant monitoring when put into use to ensure that the sludge
blanket is maintained, and not washed out (thereby losing the effect). The heat produced as a by-product of electricity generation can be reused to heat
the digestion tanks.
The blanketing of the sludge enables a dual solid and hydraulic (liquid) retention time in the digesters. Solids requiring a high degree of digestion can
remain in the reactors for periods up to 90 days.[2] Sugars dissolved in the liquid waste stream can be converted into gas quickly in the liquid phase which
can exit the system in less than a day.
UASB reactors are typically suited to dilute waste water streams (3% TSS with particle size >0.75mm).
Contents
[hide]
1 Advantages over conventional
treatment
2 See also
3 External links
4 References
[edit]Advantages over conventional treatment
Conventional treatment settles sludge which is then digested, and then aerates the remaining liquids which use bacteria to oxidise the potential digester
fuel, and uses up energy to drive the compressors. The result is that on a standard western treatment works the energy produced from settled sludge
digestion is all used by the aeration process, with little power export.

With UASB the aeration the whole process of settlement and digestion occurs in one or more large tank(s). Only the post UASB liquids, with a much
reduced BOD needs to be aerated.
This leads to a halving of the aeration energy and a doubling of the power generated from digestion, leading over all to a tripling of power generated.
[edit]See also
Sustainable development portal
Anaerobic digestion
Anaerobic digester types
Anaerobic clarigester
Relative cost of electricity generated by different sources
Ecological sanitation
Environmental technology
Anaerobic filter
Expanded granular sludge bed digestion
Hybrid reactor (combination of UASB and an anaerobic filter (AF))
Fluidized bed reactor
Mechanical biological treatment
Sewage treatment
biogas
[edit]External links
Bal AS, Dhagat NN (April 2001). "Upflow anaerobic sludge blanket reactor—a review". Indian J Environ Health 43 (2): 1–82. PMID 12397675.
Lettinga G, Rebac S, Zeeman G (September 2001). "Challenge of psychrophilic anaerobic wastewater treatment". Trends Biotechnol. 19 (9): 363–
70. doi:10.1016/S0167-7799(01)01701-2.PMID 11514000. review

Lettinga G (1995). "Anaerobic digestion and wastewater treatment systems". Antonie Van Leeuwenhoek 67 (1): 3–
28. doi:10.1007/BF00872193. PMID 7741528.
www.uasb.org
2.1.1.19-Wastewater quality indicators

Wastewater quality indicatorsFrom Wikipedia, the free encyclopedia
Wastewater quality indicators are laboratory tests to assess suitability of wastewater for disposal or re-use. Tests selected and desired test results vary
with the intended use or discharge location. Tests measure physical, chemical, and biological characteristics of the wastewater.
Contents
[hide]
1 Physical characteristics
o 1.1 Temperature
o 1.2 Solids
2 Chemical characteristics
o 2.1 Hydrogen
o 2.2 Oxygen
o 2.3 Nitrogen
o 2.4 Chlorine
3 Biological characteristics
4 See also
5 References
6 Further reading
7 External links
[edit]Physical characteristics
[edit]Temperature

Aquatic organisms cannot survive outside of specific temperature ranges. Irrigation runoff and water cooling of power stations may elevate temperatures
above the acceptable range for some species. Temperature may be measured with a calibrated thermometer.[1]
[edit]Solids
Solid material in wastewater may be dissolved, suspended, or settleable. Total dissolved solids or TDS (sometimes called filtrable residue) is measured
as the mass of residue remaining when a measured volume of filtered water is evaporated. The mass of dried solids remaining on the filter is called total
suspended solids (TSS) or nonfiltrable residue. Settleable solids are measured as the visible volume accumulated at the bottom of an Imhoff cone after
water has settled for one hour.[2] Turbidity is a measure of the light scattering ability of suspended matter in the water.[3]Salinity measures
water density or conductivity changes caused by dissolved materials.[4]
[edit]Chemical characteristics
Virtually any chemical may be found in water, but routine testing is commonly limited to a few chemical elements of unique significance.
[edit]Hydrogen
Water ionizes into hydronium (H3O) cations and hydroxyl (OH) anions. The concentration of ionized hydrogen (as protonated water) is expressed as pH.[5]
[edit]Oxygen
Most aquatic habitats are occupied by fish or other animals requiring certain minimum dissolved oxygen concentrations to survive. Dissolved
oxygen concentrations may be measured directly in wastewater, but the amount of oxygen potentially required by other chemicals in the wastewater is
termed an oxygen demand. Dissolved or suspended oxidizable organic material in wastewater will be used as a food source. Finely divided material is
readily available to microorganisms whose populations will increase to digest the amount of food available. Digestion of this food requires oxygen, so the
oxygen content of the water will ultimately be decreased by the amount required to digest the dissolved or suspended food. Oxygen concentrations may
fall below the minimum required by aquatic animals if the rate of oxygen utilization exceeds replacement by atmospheric oxygen.[6]
The reaction for biochemical oxidation may be written as:
Oxidizable material + bacteria + nutrient + O2 → CO2 + H2O + oxidized inorganics such as NO3 or SO4
Oxygen consumption by reducing chemicals such as sulfides and nitrites is typified as follows:

S-- + 2 O2 → SO4--
NO2- + ½ O2 → NO3
-
Since all natural waterways contain bacteria and nutrient, almost any waste compounds introduced into such waterways will initiate
biochemical reactions (such as shown above). Those biochemical reactions create what is measured in the laboratory as the biochemical
oxygen demand (BOD).
Oxidizable chemicals (such as reducing chemicals) introduced into a natural water will similarly initiate chemical reactions (such as shown
above). Those chemical reactions create what is measured in the laboratory as the chemical oxygen demand (COD).
Both the BOD and COD tests are a measure of the relative oxygen-depletion effect of a waste contaminant. Both have been widely adopted
as a measure of pollution effect. The BOD test measures the oxygen demand of biodegradable pollutants whereas the COD test measures
the oxygen demand of biogradable pollutants plus the oxygen demand of non-biodegradable oxidizable pollutants.
The so-called 5-day BOD measures the amount of oxygen consumed by biochemical oxidation of waste contaminants in a 5-day period. The
total amount of oxygen consumed when the biochemical reaction is allowed to proceed to completion is called the Ultimate BOD. The
Ultimate BOD is too time consuming, so the 5-day BOD has almost universally been adopted as a measure of relative pollution effect.
There are also many different COD tests. Perhaps, the most common is the 4-hour COD.
There is no generalized correlation between the 5-day BOD and the Ultimate BOD. Likewise, there is no generalized correlation between
BOD and COD. It is possible to develop such correlations for a specific waste contaminant in a specific wastewater stream, but such
correlations cannot be generalized for use with any other waste contaminants or wastewater streams.
The laboratory test procedures for the determining the above oxygen demands are detailed in the following sections of the "Standard
Methods For the Examination Of Water and Wastewater" available at www.standardmethods.org:
5-day BOD and Ultimate BOD: Sections 5210B and 5210C
COD: Section 5220
[edit]Nitrogen

Nitrogen is an important nutrient for plant and animal growth. Atmospheric nitrogen is less biologically available than dissolved nitrogen
in the form of ammonia and nitrates. Availability of dissolved nitrogen may contribute to algal blooms. Ammonia and organic forms of
nitrogen are often measured as Total Kjeldahl Nitrogen, and analysis for inorganic forms of nitrogen may be performed for more
accurate estimates of total nitrogen content.[7]
[edit]Chlorine
Chlorine has been widely used for bleaching, as a disinfectant, and for biofouling prevention in water cooling systems. Remaining
concentrations of oxidizing hypochlorous acid and hypochloriteions may be measured as chlorine residual to estimate effectiveness of
disinfection or to demonstrate safety for discharge to aquatic ecosystems.[8]
[edit]Biological characteristics
Water may be tested by a bioassay comparing survival of an aquatic test species in the wastewater in comparison to water from some
other source.[9] Water may also be evaluated to determine the approximate biological population of the wastewater. Pathogenic micro-
organisms using water as a means of moving from one host to another may be present in sewage. Coliform indexmeasures the
population of an organism commonly found in the intestines of warm-blooded animals as an indicator of the possible presence of other
intestinal pathogens.[10]
[edit]See also
Biochemical oxygen demand
Chemical oxygen demand
Carbonaceous biochemical oxygen demand
Conventional pollutant
Dissolved oxygen
Hypoxia (environmental)
Industrial water treatment

Wastewater
Water pollution
Water quality
Water treatment
[edit]References
1. ^ Franson, Mary Ann Standard Methods for the Examination of Water and Wastewater 14th edition (1975) APHA, AWWA &
WPCF ISBN 0-87553-078-8 pp.125-126
2. ^ Franson, Mary Ann Standard Methods for the Examination of Water and Wastewater 14th edition (1975) APHA, AWWA &
WPCF ISBN 0-87553-078-8 pp.89-98
3. ^ Franson, Mary Ann Standard Methods for the Examination of Water and Wastewater 14th edition (1975) APHA, AWWA &
WPCF ISBN 0-87553-078-8 pp.131-137
4. ^ Franson, Mary Ann Standard Methods for the Examination of Water and Wastewater 14th edition (1975) APHA, AWWA &
WPCF ISBN 0-87553-078-8 pp.99-100
5. ^ Franson, Mary Ann Standard Methods for the Examination of Water and Wastewater 14th edition (1975) APHA, AWWA &
WPCF ISBN 0-87553-078-8 pp.406-407
6. ^ Goldman, Charles R. & Horne, Alexander J. Limnology (1983) McGraw-Hill ISBN 0-07-023651-8 p.111
7. ^ Franson, Mary Ann Standard Methods for the Examination of Water and Wastewater 14th edition (1975) APHA, AWWA &
WPCF ISBN 0-87553-078-8 pp.406-407
8. ^ Franson, Mary Ann Standard Methods for the Examination of Water and Wastewater 14th edition (1975) APHA, AWWA &
WPCF ISBN 0-87553-078-8 pp.309-315
9. ^ Franson, Mary Ann Standard Methods for the Examination of Water and Wastewater 14th edition (1975) APHA, AWWA &
WPCF ISBN 0-87553-078-8 pp.685-689
10. ^ Franson, Mary Ann Standard Methods for the Examination of Water and Wastewater 14th edition (1975) APHA, AWWA &
WPCF ISBN 0-87553-078-8 pp.875-877

[edit]Further reading
Tchobanoglous, M, Mannarino, F L, & Stensel, H D (2003). Wastewater Engineering (Treatment Disposal Reuse) / Metcalf & Eddy,
Inc, 4th Edition, McGraw-Hill Book Company. ISBN 0-07-041878-0.
Beychok, Milton R. (1967). Aqueous Wastes from Petroleum and Petrochemical Plants, 1st Edition, John Wiley &
Sons, LCCN 67019834.
[edit]External links
Discussion of BOD and COD (use BOD as the keyword in the pdf search function)
Discussion of BOD and COD (use BOD as the keyword in the pdf search function)
More about COD and BOD (scroll to section on "Advantage of using COD over BOD")
Discussion of oxygen demand (use Oxygen Demand as the keywords in the pdf search function)
2.1.2-Biodegradability
BiodegradationFrom Wikipedia, the free encyclopedia
(Redirected from Biodegradability)

Yellow slime mold growing on a bin of wet paper
Biodegradation is the chemical dissolution of materials by bacteria or other biological means. Although often conflated, biodegradable is distinct
in meaning from compostable. While biodegradable simply means to be consumed by microorganisms and return to compounds found in nature,
"compostable" makes the specific demand that the object break down in a compost pile. The term is often used in relation to ecology, waste
management, biomedicine, and the natural environment (bioremediation) and is now commonly associated with environmentally friendly products
that are capable of decomposing back into natural elements. Organic material can be degraded aerobically with oxygen, or anaerobically, without
oxygen. Biosurfactant, an extracellular surfactant secreted by microorganisms, enhances the biodegradation process.
Biodegradable matter is generally organic material such as plant and animal matter and other substances originating from living organisms, or
artificial materials that are similar enough to plant and animal matter to be put to use by microorganisms. Some microorganisms have a naturally
occurring, microbial catabolic diversity to degrade, transform or accumulate a huge range of compounds including hydrocarbons (e.g.
oil),polychlorinated biphenyls (PCBs), polyaromatic hydrocarbons (PAHs), pharmaceutical substances, radionuclides and metals. Major
methodological breakthroughs in microbial biodegradation have enabled detailed genomic, metagenomic, proteomic, bioinformatic and other high-
throughput analyses of environmentally relevant microorganisms providing unprecedented insights into key biodegradative pathways and the
ability of microorganisms to adapt to changing environmental conditions.[1] Products that contain biodegradable matter and non-biodegradable
matter are often marketed as biodegradable.

Contents
[hide]
1 Metrology
2 Plastics
3 Biodegradable
technology
4 Etymology of
"biodegradable"
5 See also
6 References
7 External links
[edit]Metrology
In nature, different materials biodegrade at different rates. To be able to work effectively, most microorganisms that assist the biodegradation need
light, water and oxygen. Temperature is also an important factor in determining the rate of biodegradation. This is because microorganisms tend to
reproduce faster in warmer conditions. Biodegradation can be measured in a number of ways. Scientists often use respirometry tests for aerobic
microbes. First one places a solid waste sample in a container with microorganisms and soil, and then aerate the mixture. Over the course of
several days, microorganisms digest the sample bit by bit and produce carbon dioxide – the resulting amount of CO2 serves as an indicator of
degradation. Biodegradation can also be measured by anaerobic microbes and the amount of methane or alloy that they are able to produce. In
formal scientific literature, the process is termed bio-remediation.[2]
Approximated time for compounds to biodegrade in a marine environment[3]
Product Time to Biodegrade
Apple core 1–2 months
General paper 1–3 months

Paper towel 2–4 weeks
Cardboard box 2 months
Cotton cloth 5 months
Plastic coated milk carton 5 years
Wax coated milk carton 3 months
Tin cans 50–100 years
Aluminium cans 150–200 years
Glass bottles Undetermined (forever)
Plastic bags 10–20 years
Soft plastic (bottle) 100 years
Hard plastic (bottle cap) 400 years
[edit]Plastics
Main article: Biodegradable plastic#Examples of biodegradable plastics
Biodegradable plastic is plastic that has been treated to be easily broken down by microorganisms and return to nature. Many technologies exist
today that allow for such treatment. Currently there are some synthetic polymers that can be broken down by microorganisms such
as polycaprolactone, others are polyesters and aromatic-aliphatic esters, due to their ester bonds being susceptible to attack by water. Some
examples of these are the natural poly-3-hydroxybutyrate, the renewably derived polylactic acid, and the synthetic polycaprolactone. Others are
the cellulose-based cellulose acetate and celluloid (cellulose nitrate).
Under low oxygen conditions biodegradable plastics break down slower and with the production of methane, like other organic materials do. The
breakdown process is accelerated in a dedicatedcompost heap. Starch-based plastics will degrade within two to four months in a home compost
bin, while polylactic acid is largely undecomposed, requiring higher temperatures.[4]Polycaprolactone and polycaprolactone-starch composites
decompose slower, but the starch content accelerates decomposition by leaving behind a porous, high surface area polycaprolactone.
Nevertheless, it takes many months.[5]

Many plastic companies have gone so far even to say that their plastics are compostable, typically listing corn starch as an ingredient. However,
these claims are questionable because the plastics industry operates under its own definition of compostable:
"that which is capable of undergoing biological decomposition in a compost site such that the material is not visually distinguishable and breaks
down into carbon dioxide, water, inorganic compounds and biomass at a rate consistent with known compostable materials." (Ref: ASTM D
6002)[6]
Using this new definition, "carbon dioxide, water, inorganic compounds and biomass" encompasses every substance in the known universe, it
makes no restriction on what the plastic leaves behind after it has biodegraded. So, while plastic manufacturers may legally be on solid ground,
"compostable plastics" can not be said to be compostable in the traditional sense. However the word biodegradable does still apply.
[edit]Biodegradable technology
In 1973 it was proved for first time that polyester degrades when disposed in bioactive material such as soil. As a result, polyesters are water
resistant and can be melted and shaped into sheets, bottles, and other products, making certain plastics now available as a biodegradable
product. Following, Polyhydroxylalkanoates (PHAs) were produced directly from renewable resources by microbes. They are approximately 95%
cellular bacteria and can be manipulated by genetic strategies. The composition and biodegradability of PHAs can be regulated by blending it with
other natural polymers. In the 1980s the company ICI Zenecca commercialized PHAs under the name Biopol. It was used for the production of
shampoo bottles and other cosmetic products. Consumer response was unusual. Consumers were willing to pay more for this product because it
was natural and biodegradable, which had not occurred before.[7]
Now biodegradable technology is a highly developed market with applications in product packaging, production and medicine. Biodegradable
technology is concerned with the manufacturing science of biodegradable materials. It imposes science based mechanisms of plant genetics into
the processes of today. Scientists and manufacturing corporations can help impact climate change by developing a use of plant genetics that
would mimic some present technologies. By looking to plants, such as biodegradable material harvested through photosynthesis, waste
andtoxins can be minimized.[8]
Oxo-biodegradable technology, which has further developed biodegradable plastics, also emerged. By creating products with very large polymer
molecules of plastics, which contain only carbonand hydrogen, with oxygen in the air, the product is capable of decomposing anywhere from a

week to one to two years.The chemical degradation process involves the reaction of very large polymer molecules of plastics, which contain only
carbon and hydrogen, with oxygen in the air. This reaction occurs even without prodegradant additives but at a very slow rate. That is why
conventional plastics, when discarded, persist for a long time in the environment. With this reaction, formulations catalyze and accelerate the
biodegradation process.[9]
Biodegradable technology is especially utilized by the bio-medical community. Biodegradable polymers are classified into three groups: medical,
ecological, and dual application, while in terms of origin they are divided into two groups: natural and synthetic.[10] The Clean Technology Group is
exploiting the use of supercritical carbon dioxide, which under high pressure at room temperature is a solvent that can use biodegradable plastics
to make polymer drug coatings. The polymer (meaning a material composed of molecules with repeating structural units that form a long chain) is
used to encapsulate a drug prior to injection in the body and is based on lactic acid, a compound normally produced in the body, and is thus able
to be excreted naturally. The coating is designed for controlled release over a period of time, reducing the number of injections required and
maximizing the therapeutic benefit. Professor Steve Howdle states that biodegradable polymers are particularly attractive for use in drug delivery,
as once introduced into the body they require no retrieval or further manipulation and are degraded into soluble, non-toxic by-products. Different
polymers degrade at different rates within the body and therefore polymer selection can be tailored to achieve desired release rates.[11]
Other biomedical applications include the use of biodegradable, elastic shape-memory polymers. Biodegradable implant materials can now be
used for minimally invasive surgical procedures through degradable thermoplastic polymers. These polymers are now able to change their shape
with increase of temperature, causing shape memory capabilities as well as easily degradable sutures. As a result, implants can now fit through
small incisions, doctors can easily perform complex deformations, and sutures and other material aides can naturally biodegrade after a
completed surgery.[12]
[edit]Etymology of "biodegradable"
The first known use of the word in biological text was in 1961 when employed to describe the breakdown of material into the base components of
carbon, hydrogen, and oxygen bymicroorganisms. Now biodegradable is commonly associated with environmentally friendly products that are part
of the earth’s innate cycle and capable of decomposing back into natural elements.
[edit]See also

Sustainable development portal
Ecology portal
Environment portal
Anaerobic digestion
Biodegradability prediction
Biodegradable electronics
Biodegradable polythene film
Biodegradation (journal)
Bioplastic - biodegradable, bio-based plastics
Bioremediation
Decomposition – reduction of the body of a formerly living organism into simpler forms of matter
Landfill gas monitoring
List of environment topics
Microbial biodegradation
[edit]References
1. ^ Diaz E (editor). (2008). Microbial Biodegradation: Genomics and Molecular Biology (1st ed.). Caister Academic Press. ISBN 1-904455-17-4.
2. ^ "Measuring Biodegradability", The University of Waikato, June 19, 2008
3. ^ http://cmore.soest.hawaii.edu/cruises/super/biodegradation.htm [Mote Marine Laboratory, 1993]
4. ^ http://www3.imperial.ac.uk/pls/portallive/docs/1/33773706.PDF
5. ^ http://www.kyu.edu.tw/93/epaperv6/93-129.pdf Fig.9
6. ^ http://www.compostable.info/compostable.htm
7. ^ Gross,Richard. "Biodegradable Polymers for the Environment", American Association of Advanced Science, August 2, 2002, p. 804.

8. ^ Luzier, W. D. "Materials Derived from Biomass/Biodegradable Materials." Proceedings of the National Academy of Sciences 89.3 (1992): 839-
42. Print.
9. ^ Agamuthu, P."Biodegradability and Degradability of Plastic Waste", "International Solid Waste Association" November 9, 2004
10. ^ Yoshito, Ikada. "Biodegradable Polyesters for Medical and Ecological Applications", "Massachusett Institute of Technology", 2000. p117
11. ^ “Using Green Chemistry to Deliver Cutting Edge Drugs”. The University of Nottingham. September 13, 2007.
12. ^ Lendlein, Andreas. “Biodegradable, Elastic Shape-Memory Polymers for Potential Biomedical Applications”. American Association of
Advancement of Science, 2002, p 1673.
[edit]External links
Biodegradation vs. Degradation
European Bioplastics Association
The Science of Biodegradable Plastics: The Reality Behind Biodegradable Plastic Packaging Material
Biodegradable Polyesters for Medical and Ecological Applications
Biodegradable Plastic Definition

2.1.3-Bioenergy
BioenergyFrom Wikipedia, the free encyclopedia
This article is about the physical energy derived from biological sources. For the idea that all living things contain a "bioenergy" of a spiritual nature,
see energy (esotericism).
This article needs additional citations for verification. Please help improve this article by adding citations to reliable sources.Unsourced material may be challenged and removed. (May 2011)
Stirling engine capable of producing electricity from biomass combustion heat.
Renewable energy
Biofuel

Biomass
Geothermal
Hydroelectricity
Solar energy
Tidal power
Wave power
Wind power
Topics by country
V
T
E
Bioenergy is renewable energy made available from materials derived from biological sources. Biomass is any organic material which has stored sunlight
in the form of chemical energy. As a fuel it may include wood, wood waste, straw, manure, sugarcane, and many other byproducts from a variety of
agricultural processes. By 2010, there was 35GW of globally installed bioenergy capacity for electricity generation, of which 7GW was in the United
States.[1]
In its most narrow sense it is a synonym to biofuel, which is fuel derived from biological sources. In its broader sense it includes biomass, the biological
material used as a biofuel, as well as the social, economic, scientific and technical fields associated with using biological sources for energy. This is a
common misconception, as bioenergy is the energy extracted from the biomass, as the biomass is the fuel and the bioenergy is the energy contained in
the fuel.[2]
There is a slight tendency for the word bioenergy to be favoured in Europe compared with biofuel in North America.[citation needed]

Contents
[hide]
1 Solid biomass
2 Electricity generation from biomass
o 2.1 Electricity from sugarcane bagasse in Brazil
3 Environmental impact—
4 See also
5 References
6 External links
[edit]Solid biomass
Main article: Biomass
Simple use of biomass fuel (Combustion of wood for heat).
One of the advantages of biomass fuel is that it is often a by-product, residue or waste-product of other processes, such as farming, animal husbandry
and forestry.[1] In theory this means there is no competition between fuel and food production, although this is not always the case.[1]

Biomass is the material derived from recently living organisms, which includes plants, animals and their byproducts.[3] Manure, garden waste and crop
residues are all sources of biomass. It is a renewable energy source based on the carbon cycle, unlike other natural resources such as petroleum, coal,
and nuclear fuels. Another source includes Animal waste, which is a persistent and unavoidable pollutant produced primarily by the animals housed in
industrial-sized farms.
There are also agricultural products specifically being grown for biofuel production. These include corn, and soybeans and to some
extent willow andswitchgrass on a pre-commercial research level, primarily in the United States; rapeseed, wheat, sugar beet, and willow (15,000 ha in
Sweden) primarily in Europe; sugarcane in Brazil; palm oil and miscanthus in Southeast Asia; sorghum and cassava in China; and jatropha in
India. Hemp has also been proven to work as a biofuel. Biodegradable outputs from industry, agriculture, forestry and households can be used for biofuel
production, using e.g. anaerobic digestion to produce biogas, gasification to produce syngas or by direct combustion. Examples of biodegradable
wastes include straw, timber, manure, rice husks, sewage, and food waste. The use of biomass fuels can therefore contribute to waste management as
well as fuel security and help to prevent or slow down climate change, although alone they are not a comprehensive solution to these problems.
Biomass can be converted to other usable forms of energy like methane gas or transportation fuels like ethanol and biodiesel. Rotting garbage, and
agricultural and human waste, all release methane gas—also called "landfill gas" or "biogas." Crops, such as corn and sugar cane, can be fermented to
produce the transportation fuel, ethanol. Biodiesel, another transportation fuel, can be produced from left-over food products like vegetable oils and animal
fats.Also, Biomass to liquids (BTLs) and cellulosic ethanol are still under research.
[edit]Electricity generation from biomass
The biomass used for electricity production ranges by region.[1] Forest by products, such as wood residues, are popular in the United States.[1] Agricultural
waste is common in Mauritius (sugar cane residue) and Southeast Asia (rice husks).[1] Animal husbandry residues, such as poultry litter, is popular in
the UK.[1]
[edit]Electricity from sugarcane bagasse in Brazil

Sugarcane (Saccharum officinarum) plantation ready for harvest, Ituverava,São Paulo State. Brazil.
Sugar/Ethanol Plant located inPiracicaba, São Paulo State. This plant produces the electricity it needs frombagasse residuals from sugarcane left over by the milling
process, and it sells the surplus electricity to the public grid.
Sucrose accounts for little more than 30% of the chemical energy stored in the mature plant; 35% is in the leaves and stem tips, which are left in the fields
during harvest, and 35% are in the fibrous material (bagasse) left over from pressing.
The production process of sugar and ethanol in Brazil takes full advantage of the energy stored in sugarcane. Part of the bagasse is currently burned at
the mill to provide heat for distillation and electricity to run the machinery. This allows ethanol plants to be energetically self-sufficient and even sell surplus
electricity to utilities; current production is 600 MW for self-use and 100 MW for sale. This secondary activity is expected to boom now that utilities have
been induced to pay "fair price "(about US$10/GJ or US$0.036/kWh) for 10 year contracts. This is approximately half of what the World Bank considers
the reference price for investing in similar projects (see below). The energy is especially valuable to utilities because it is produced mainly in the dry
season when hydroelectric dams are running low. Estimates of potential power generation from bagasse range from 1,000 to 9,000 MW, depending on
technology. Higher estimates assume gasification of biomass, replacement of current low-pressure steam boilers and turbines by high-pressure ones, and
use of harvest trash currently left behind in the fields. For comparison, Brazil's Angra I nuclear plant generates 657 MW.

Presently, it is economically viable to extract about 288 MJ of electricity from the residues of one tonne of sugarcane, of which about 180 MJ are used in
the plant itself. Thus a medium-size distillery processing 1 million tonnes of sugarcane per year could sell about 5 MW of surplus electricity. At current
prices, it would earn US$ 18 million from sugar and ethanol sales, and about US$ 1 million from surplus electricity sales. With advanced boiler and turbine
technology, the electricity yield could be increased to 648 MJ per tonne of sugarcane, but current electricity prices do not justify the necessary investment.
(According to one report, the World Bank would only finance investments in bagasse power generation if the price were at least US$19/GJ or
US$0.068/kWh.)
Bagasse burning is environmentally friendly compared to other fuels like oil and coal. Its ash content is only 2.5% (against 30–50% of coal), and it
contains very little sulfur. Since it burns at relatively low temperatures, it produces little nitrous oxides. Moreover, bagasse is being sold for use as a fuel
(replacing heavy fuel oil) in various industries, including citrus juice concentrate, vegetable oil, ceramics, and tyre recycling. The state of São Paulo alone
used 2 million tonnes, saving about US$ 35 million in fuel oil imports.
Researchers working with cellulosic ethanol are trying to make the extraction of ethanol from sugarcane bagasse and other plants viable on an industrial
scale.
[edit]Environmental impact—
Some forms of forest bioenergy have recently come under fire from a number of environmental organizations, including Greenpeace and the Natural
Resources Defense Council, for the harmful impacts they can have on forests and the climate. Greenpeace recently released a report entitled Fuelling a
BioMess which outlines their concerns around forest bioenergy. Because any part of the tree can be burned, the harvesting of trees for energy production
encourages Whole-Tree Harvesting, which removes more nutrients and soil cover than regular harvesting, and can be harmful to the long-term health of
the forest. In some jurisdictions, forest biomass is increasingly consisting of elements essential to functioning forest ecosystems, including standing trees,
naturally disturbed forests and remains of traditional logging operations that were previously left in the forest. Environmental groups also cite recent
scientific research which has found that it can take many decades for the carbon released by burning biomass to be recaptured by regrowing trees, and
even longer in low productivity areas; furthermore, logging operations may disturb forest soils and cause them to release stored carbon. In light of the
pressing need to reduce greenhouse gas emissions in the short term in order to mitigate the effects of climate change, a number of environmental groups
are opposing the large-scale use of forest biomass in energy production.[4][5]

[edit]See also
Renewable energy portal
Biochar
Bioenergy in China
Biofuel
Biogas
Thylakoid
Jean Pain
[edit]References
1. ^ a b c d e f g Frauke Urban and Tom Mitchell 2011. Climate change, disasters and electricity generation. London: Overseas Development
Institute and Institute of Development Studies
2. ^ "What is bioenergy?".
3. ^ "Bioenergy".
4. ^ http://www.greenpeace.org//canada/en/campaigns/forests/boreal/archive/Burning-trees-for-energy-puts-Canadian-forests-and-climate-at-risk-
Greenpeace/
5. ^ http://switchboard.nrdc.org/blogs/slyutse/today_nrdc_and_our_partners.html
[edit]External links
This article's use of external links may not follow Wikipedia's policies or guidelines. Please improve this article byremoving excessiveor inappropriate external links, and converting useful links where appropriate into footnote references. (May2011)
Video: Where does bioenergy come from?

Nordic Energy Solutions Bioenergy Solutions from the Nordic Region
Research about the intersection of bioenergy, agriculture, and food security by the International Food Policy Research Institute.
Biomass Reports (Idaho National Laboratory).
Bioenergy (Oak Ridge National Laboratory).
BioenergyWiki (BioenergyWiki was developed in cooperation with the CURES network and an international Steering Committee. It is currently
being hosted by the National Wildlife Federation with support from the Rockefeller Brothers Fund, the Biomass Coordinating Council of the American
Council on Renewable Energy (ACORE), the Heinrich Boell Foundation, Dynamotive Energy Systems Corporation, Renew the Earth, and
the Worldwatch Institute.)
Biomass (US Department of Energys Office of Energy Efficiency and Renewable Energy).
Bioenergy in India (India's first Bioenergy Center at the prestigious IITs)
Global Change Biology Bioenergy(GCB Bioenergy is a journal promoting understanding of the interface between biological sciences and the
production of fuels directly from plants, algae and waste.)
[1] Bioenergy plant in multiple countries
[hide]
V
T
E
Bioenergy
Biofuels
Alcohol
Algae fuel

Bagasse
Babassu oil
Biobutanol
Biodiesel
Biogas
Biogasoline
Cellulosic ethanol
Common ethanol fuel mixtures
Corn stover
Ethanol fuel
Methanol fuel
Stover
Straw

Vegetable oil
Wood gas
Energy from foodstock
Barley
Cassava
Grape
Hemp
Maize
Oat
Potato
Rapeseed
Rice
Sorghum bicolor
Soybean

Sugarcane
Sugar beet
Sunflower
Wheat
Yam
Non-food energy crops
Arundo
Big bluestem
Camelina
Chinese tallow
Duckweed
Jatropha curcas
Millettia pinnata

Miscanthus giganteus
Switchgrass
Wood fuel
Technology
Bioconversion
Biomass heating systems
Biorefinery
Fischer–Tropsch process
Industrial biotechnology
Pellet mill
Pellet stove
Thermal depolymerization
Concepts
Cellulosic ethanol commercialization
Energy content of biofuel

Energy crop
Energy forestry
EROEI
Food vs. fuel
Sustainable biofuel
[show]
V
T
E
Electricity delivery

2.1.4-Biofuel
BiofuelFrom Wikipedia, the free encyclopedia
Information on pump regarding ethanol fuel blend up to 10%, California
A bus fueled by biodiesel
Renewable energy

Biofuel
Biomass
Geothermal
Hydroelectr
icity
Solar
energy
Tidal power
Wave
power
Wind
power
Topics by country
V
T
E
A biofuel is a type of fuel whose energy is derived from biological carbon fixation. Biofuels include fuels derived from biomass conversion, as well assolid
biomass, liquid fuels and various biogases.[1] Biofuels are gaining increased public and scientific attention, driven by factors such as oil price hikesand the
need for increased energy security. However, according to the European Environment Agency, biofuels do not address global warming concerns.[2]

Bioethanol is an alcohol made by fermentation, mostly from carbohydrates produced in sugar or starch crops such as corn or sugarcane. Cellulosic
biomass, derived from non-food sources, such as trees and grasses, is also being developed as a feedstock for ethanol production. Ethanol can be used
as a fuel for vehicles in its pure form, but it is usually used as a gasoline additive to increase octane and improve vehicle emissions. Bioethanol is widely
used in the USA and in Brazil. Current plant design does not provide for converting the lignin portion of plant raw materials to fuel components by
fermentation.
Biodiesel is made from vegetable oils and animal fats. Biodiesel can be used as a fuel for vehicles in its pure form, but it is usually used as
a dieseladditive to reduce levels of particulates, carbon monoxide, and hydrocarbons from diesel-powered vehicles. Biodiesel is produced from oils or fats
usingtransesterification and is the most common biofuel in Europe.
In 2010, worldwide biofuel production reached 105 billion liters (28 billion gallons US), up 17% from 2009,[3] and biofuels provided 2.7% of the world's fuels
for road transport, a contribution largely made up of ethanol and biodiesel.[citation needed] Global ethanol fuel production reached 86 billion liters (23 billion
gallons US) in 2010, with the United States and Brazil as the world's top producers, accounting together for 90% of global production. The world's largest
biodiesel producer is the European Union, accounting for 53% of all biodiesel production in 2010.[3] As of 2011, mandates for blending biofuels exist in 31
countries at the national level and in 29 states or provinces.[4] According to the International Energy Agency, biofuels have the potential to meet more than
a quarter of world demand for transportation fuels by 2050.[5]
Contents
[hide]
1 Liquid fuels for transportation
o 1.1 First-generation biofuels
1.1.1 Bioalcohols
1.1.2 Biodiesel
1.1.3 Green diesel
1.1.4 Vegetable oil
1.1.5 Bioethers

1.1.6 Biogas
1.1.7 Syngas
1.1.8 Solid biofuels
o 1.2 Second-generation (advanced) biofuels
2 Biofuels by region
3 Issues with biofuel production and use
4 Current research
o 4.1 Ethanol biofuels
o 4.2 Algal biofuels
o 4.3 Jatropha
o 4.4 Fungi
5 Greenhouse gas emissions
6 See also
7 References
8 Further reading
9 External links
[edit]Liquid fuels for transportation
Most transportation fuels are liquids, because vehicles usually require high energy density, as occurs in liquids and solids. High power density can be
provided most inexpensively by an internal combustion engine; these engines require clean-burning fuels, to keep the engine clean and minimize air
pollution.

The fuels that are easiest to burn cleanly are typically liquids and gases. Thus, liquids (and gases that can be stored in liquid form) meet the requirements
of being both portable and clean-burning. Also, liquids and gases can be pumped, which means handling is easily mechanized, and thus less laborious.
[edit]First-generation biofuels
'First-generation' or conventional biofuels are made from sugar, starch, or vegetable oil.
[edit]Bioalcohols
Main article: Alcohol fuel
Neat ethanol on the left (A), gasoline on the right (G) at a filling station in Brazil
Biologically produced alcohols, most commonly ethanol, and less commonly propanol and butanol, are produced by the action
of microorganisms andenzymes through the fermentation of sugars or starches (easiest), or cellulose (which is more difficult). Biobutanol (also called
biogasoline) is often claimed to provide a direct replacement for gasoline, because it can be used directly in a gasoline engine (in a similar way to
biodiesel in diesel engines).
Ethanol fuel is the most common biofuel worldwide, particularly in Brazil. Alcohol fuels are produced by fermentation of sugars derived
from wheat, corn,sugar beets, sugar cane, molasses and any sugar or starch from which alcoholic beverages can be made (such
as potato and fruit waste, etc.). The ethanol production methods used are enzyme digestion (to release sugars from stored starches), fermentation of the
sugars, distillation and drying. The distillation process requires significant energy input for heat (often unsustainable natural gas fossil fuel, but cellulosic
biomass such as bagasse, the waste left after sugar cane is pressed to extract its juice, can also be used more sustainably).

Ethanol can be used in petrol engines as a replacement for gasoline; it can be mixed with gasoline to any percentage. Most existing car petrol engines
can run on blends of up to 15% bioethanol with petroleum/gasoline. Ethanol has a smaller energy density than that of gasoline; this means it takes more
fuel (volume and mass) to produce the same amount of work. An advantage of ethanol (CH3CH2OH) is that it has a higher octane rating than ethanol-free
gasoline available at roadside gas stations, which allows an increase of an engine's compression ratio for increased thermal efficiency. In high-altitude
(thin air) locations, some states mandate a mix of gasoline and ethanol as a winter oxidizer to reduce atmospheric pollution emissions.
Ethanol is also used to fuel bioethanol fireplaces. As they do not require a chimney and are "flueless", bioethanol fires[6] are extremely useful for newly
built homes and apartments without a flue. The downside to these fireplaces is their heat output is slightly less than electric heat or gas fires.
In the current corn-to-ethanol production model in the United States, considering the total energy consumed by farm equipment, cultivation,
planting, fertilizers, pesticides, herbicides, andfungicides made from petroleum, irrigation systems, harvesting, transport of feedstock to processing plants,
fermentation, distillation, drying, transport to fuel terminals and retail pumps, and lower ethanol fuel energy content, the net energy content value added
and delivered to consumers is very small. And, the net benefit (all things considered) does little to reduce imported oil and fossil fuels required to produce
the ethanol.[7]
Although corn-to-ethanol and other food stocks have implications both in terms of world food prices and limited, yet positive, energy yield (in terms of
energy delivered to customer/fossil fuels used), the technology has led to the development of cellulosic ethanol. According to a joint research agenda
conducted through the US Department of Energy,[8] the fossil energy ratios (FER) for cellulosic ethanol, corn ethanol, and gasoline are 10.3, 1.36, and
0.81, respectively.[9][10][11]
Even dry ethanol has roughly one-third lower energy content per unit of volume compared to gasoline, so larger (therefore heavier) fuel tanks are required
to travel the same distance, or more fuel stops are required. With large current unsustainable, unscalable subsidies, ethanol fuel still costs much more per
distance traveled than current high gasoline prices in the United States.[12]
Methanol is currently produced from natural gas, a nonrenewable fossil fuel. It can also be produced from biomass as biomethanol. The methanol
economy is an alternative to the hydrogen economy, compared to today's hydrogen production from natural gas.
Butanol (C4H9OH) is formed by ABE fermentation (acetone, butanol, ethanol) and experimental modifications of the process show potentially high net
energy gains with butanol as the only liquid product. Butanol will produce more energy and allegedly can be burned "straight" in existing gasoline engines
(without modification to the engine or car),[13] and is less corrosive and less water-soluble than ethanol, and could be distributed via existing

infrastructures. DuPont and BP are working together to help develop butanol. E. coli strains have also been successfully engineered to produce butanol by
hijacking their amino acid metabolism.[14]
[edit]Biodiesel
Main articles: Biodiesel and Biodiesel around the world
In some countries, biodiesel is less expensive than conventional diesel.
Biodiesel is the most common biofuel in Europe. It is produced from oils or fats using transesterification and is a liquid similar in composition to
fossil/mineral diesel. Chemically, it consists mostly of fatty acid methyl (or ethyl) esters (FAMEs). Feedstocks for biodiesel include animal fats, vegetable
oils, soy, rapeseed, jatropha, mahua, mustard, flax, sunflower, palm oil, hemp, field pennycress, Pongamia pinnata and algae. Pure biodiesel (B100) is the

lowest-emission diesel fuel. Although liquefied petroleum gas and hydrogen have cleaner combustion, they are used to fuel much less efficient petrol
engines and are not as widely available.
Biodiesel can be used in any diesel engine when mixed with mineral diesel. In some countries, manufacturers cover their diesel engines under warranty
for B100 use, although Volkswagen of Germany, for example, asks drivers to check by telephone with the VW environmental services department before
switching to B100. B100 may become more viscous at lower temperatures, depending on the feedstock used. In most cases, biodiesel is compatible with
diesel engines from 1994 onwards, which use 'Viton' (by DuPont) synthetic rubber in their mechanical fuel injection systems.
Electronically controlled 'common rail' and 'unit injector' type systems from the late 1990s onwards may only use biodiesel blended with conventional
diesel fuel. These engines have finely metered and atomized multiple-stage injection systems that are very sensitive to the viscosity of the fuel. Many
current-generation diesel engines are made so that they can run on B100 without altering the engine itself, although this depends on the fuel rail design.
Since biodiesel is an effective solvent and cleans residues deposited by mineral diesel, engine filters may need to be replaced more often, as the biofuel
dissolves old deposits in the fuel tank and pipes. It also effectively cleans the engine combustion chamber of carbon deposits, helping to maintain
efficiency. In many European countries, a 5% biodiesel blend is widely used and is available at thousands of gas stations.[15][16] Biodiesel is also
anoxygenated fuel, meaning it contains a reduced amount of carbon and higher hydrogen and oxygen content than fossil diesel. This improves
thecombustion of biodiesel and reduces the particulate emissions from unburnt carbon.
Biodiesel is also safe to handle and transport because it is as biodegradable as sugar, one-tenth as toxic as table salt, and has a high flash point of about
300°F (148°C) compared to petroleum diesel fuel, which has a flash point of 125°F (52°C).[17]
In the USA, more than 80% of commercial trucks and city buses run on diesel. The emerging US biodiesel market is estimated to have grown 200% from
2004 to 2005. "By the end of 2006 biodiesel production was estimated to increase fourfold [from 2004] to more than" 1 billion US gallons
(3,800,000 m3).[18]
[edit]Green diesel
Main article: Vegetable oil refining
Green diesel is produced through hydrocracking biological oil feedstocks, such as vegetable oils and animal fats.[19][20] Hydrocracking is a refinery method
that uses elevated temperatures and pressure in the presence of a catalyst to break down larger molecules, such as those found in vegetable oils, into
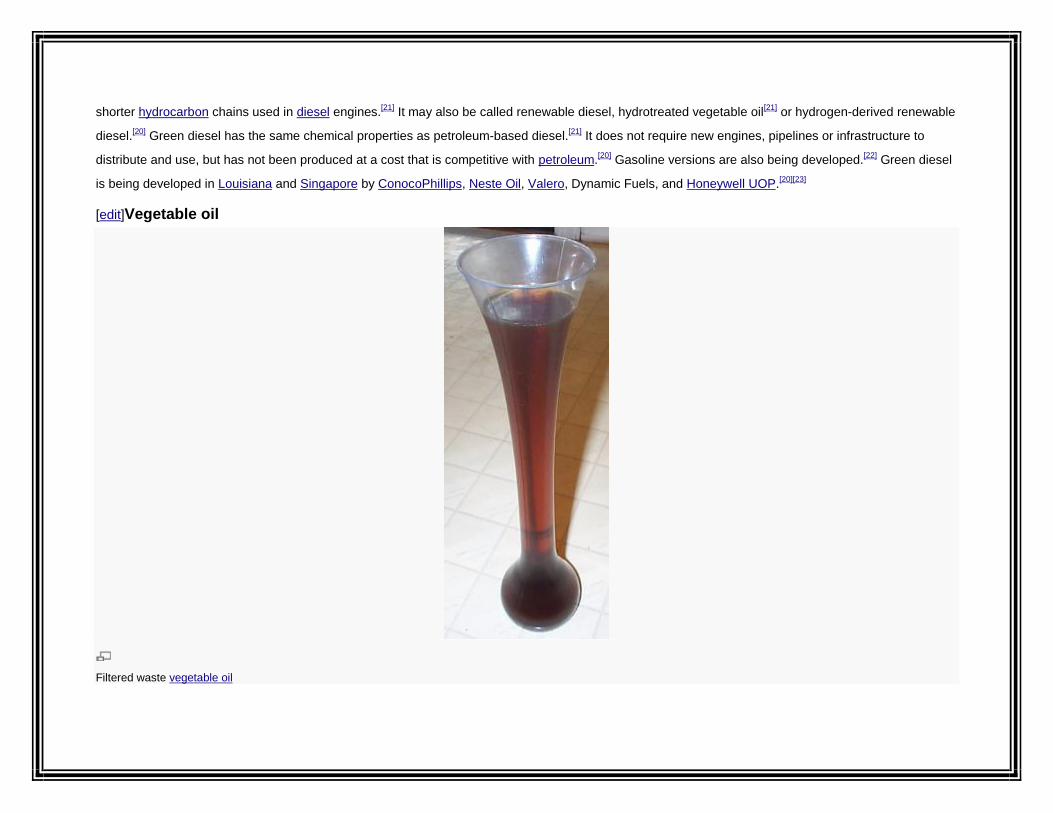
shorter hydrocarbon chains used in diesel engines.[21] It may also be called renewable diesel, hydrotreated vegetable oil[21] or hydrogen-derived renewable
diesel.[20] Green diesel has the same chemical properties as petroleum-based diesel.[21] It does not require new engines, pipelines or infrastructure to
distribute and use, but has not been produced at a cost that is competitive with petroleum.[20] Gasoline versions are also being developed.[22] Green diesel
is being developed in Louisiana and Singapore by ConocoPhillips, Neste Oil, Valero, Dynamic Fuels, and Honeywell UOP.[20][23]
[edit]Vegetable oil
Filtered waste vegetable oil

Main article: Vegetable oil used as fuel
Straight unmodified edible vegetable oil is generally not used as fuel, but lower-quality oil can and has been used for this purpose. Used vegetable oil is
increasingly being processed into biodiesel, or (more rarely) cleaned of water and particulates and used as a fuel.
Also here, as with 100% biodiesel (B100), to ensure the fuel injectors atomize the vegetable oil in the correct pattern for efficient combustion, vegetable oil
fuelmust be heated to reduce its viscosity to that of diesel, either by electric coils or heat exchangers. This is easier in warm or temperate climates. Big
corporations like MAN B&W Diesel, Wärtsilä, and Deutz AG, as well as a number of smaller companies, such as Elsbett, offer engines that are compatible
with straight vegetable oil, without the need for after-market modifications.
Vegetable oil can also be used in many older diesel engines that do not use common rail or unit injection electronic diesel injection systems. Due to the
design of the combustion chambers in indirect injection engines, these are the best engines for use with vegetable oil. This system allows the relatively
larger oil molecules more time to burn. Some older engines, especially Mercedes, are driven experimentally by enthusiasts without any conversion, a
handful of drivers have experienced limited success with earlier pre-"Pumpe Duse" VW TDI engines and other similar engines with direct injection.
Several companies, such asElsbett or Wolf, have developed professional conversion kits and successfully installed hundreds of them over the last
decades.
Oils and fats can be hydrogenated to give a diesel substitute. The resulting product is a straight-chain hydrocarbon with a high cetane number, low
in aromaticsand sulfur and does not contain oxygen. Hydrogenated oils can be blended with diesel in all proportions. They have several advantages over
biodiesel, including good performance at low temperatures, no storage stability problems and no susceptibility to microbial attack.[24]
[edit]Bioethers
Bioethers (also referred to as fuel ethers or oxygenated fuels) are cost-effective compounds that act as octane rating enhancers. They also
enhance engineperformance, whilst significantly reducing engine wear and toxic exhaust emissions. Greatly reducing the amount of ground-level ozone,
they contribute to air quality.[25][26]
[edit]Biogas

Pipes carrying biogas
Main article: Biogas
Biogas is methane produced by the process of anaerobic digestion of organic material by anaerobes.[27] It can be produced either from biodegradable
wastematerials or by the use of energy crops fed into anaerobic digesters to supplement gas yields. The solid byproduct, digestate, can be used as a
biofuel or a fertilizer.
Biogas can be recovered from mechanical biological treatment waste processing systems.
Note:Landfill gas, a less clean form of biogas, is produced in landfills through naturally occurring anaerobic digestion. If it escapes into the
atmosphere, it is a potential greenhouse gas.
Farmers can produce biogas from manure from their cattle by using anaerobic digesters.[28]
[edit]Syngas
Main article: Gasification
Syngas, a mixture of carbon monoxide, hydrogen and other hydrocarbons, is produced by partial combustion of biomass, that is, combustion with an
amount ofoxygen that is not sufficient to convert the biomass completely to carbon dioxide and water.[24] Before partial combustion, the biomass is
dried, and sometimespyrolysed. The resulting gas mixture, syngas, is more efficient than direct combustion of the original biofuel; more of the energy
contained in the fuel is extracted.
Syngas may be burned directly in internal combustion engines, turbines or high-temperature fuel cells.[29] The wood gas generator, a wood-fueled
gasification reactor, can be connected to an internal combustion engine.
Syngas can be used to produce methanol, DME and hydrogen, or converted via the Fischer-Tropsch process to produce a diesel substitute, or a
mixture of alcohols that can be blended into gasoline. Gasification normally relies on temperatures greater than 700°C.
Lower-temperature gasification is desirable when co-producing biochar, but results in syngas polluted with tar.
[edit]Solid biofuels
Examples include wood, sawdust, grass trimmings, domestic refuse, charcoal, agricultural waste, nonfood energy crops, and dried manure.
When raw biomass is already in a suitable form (such as firewood), it can burn directly in a stove or furnace to provide heat or raise steam. When raw
biomass is in an inconvenient form (such as sawdust, wood chips, grass, urban waste wood, agricultural residues), the typical process is to densify
the biomass. This process includes grinding the raw biomass to an appropriate particulate size (known as hogfuel), which, depending on the
densification type, can be from 1 to 3 cm (0 to 1 in), which is then concentrated into a fuel product. The current processes produce wood pellets,
cubes, or pucks. The pellet process is most common in Europe, and is typically a pure wood product. The other types of densification are larger in
size compared to a pellet, and are compatible with a broad range of input feedstocks. The resulting densified fuel is easier to transport and feed into
thermal generation systems, such as boilers.
One of the advantages of solid biomass fuel is that it is often a byproduct, residue or waste-product of other processes, such as farming, animal
husbandry and forestry.[30] In theory, this means fuel and food production do not compete for resources, although this is not always the case.[30]
A problem with the combustion of raw biomass is that it emits considerable amounts of pollutants, such as particulates and polycyclic aromatic
hydrocarbons. Even modern pellet boilers generate much more pollutants than oil or natural gas boilers. Pellets made from agricultural residues are
usually worse than wood pellets, producing much larger emissions of dioxins andchlorophenols.[31]
Notwithstanding the above noted study, numerous studies have shown biomass fuels have significantly less impact on the environment than fossil
based fuels. Of note is the US Department of Energy Laboratory, operated by Midwest Research Institute Biomass Power and Conventional Fossil

Systems with and without CO2 Sequestration – Comparing the Energy Balance, Greenhouse Gas Emissions and Economics Study. Power
generation emits significant amounts of greenhouse gases (GHGs), mainly carbon dioxide (CO2). Sequestering CO2 from the power plant flue gascan
significantly reduce the GHGs from the power plant itself, but this is not the total picture. CO2 capture and sequestration consumes additional energy,
thus lowering the plant's fuel-to-electricity efficiency. To compensate for this, more fossil fuel must be procured and consumed to make up for lost
capacity.
Taking this into consideration, the global warming potential (GWP), which is a combination of CO2, methane (CH4), and nitrous oxide (N2O)
emissions, and energy balance of the system need to be examined using a life cycle assessment. This takes into account the upstream processes
which remain constant after CO2 sequestration, as well as the steps required for additional power generation. Firing biomass instead of coal led to a
148% reduction in GWP.
A derivative of solid biofuel is biochar, which is produced by biomass pyrolysis. Biochar made from agricultural waste can substitute for wood
charcoal. As wood stock becomes scarce, this alternative is gaining ground. In eastern Democratic Republic of Congo, for example,
biomass briquettes are being marketed as an alternative to charcoal to protect Virunga National Park fromdeforestation associated
with charcoal production.[32]
[edit]Second-generation (advanced) biofuelsMain article: Second generation biofuels
Second-generation biofuels are produced from sustainable feedstock. Sustainability of a feedstock is defined, among others, by availability of the
feedstock, impact on GHG emissions, and impact on biodiversity and land use.[33] Many second-generation biofuels are under development such
as Cellulosic ethanol, Algae fuel[34]., biohydrogen, biomethanol, DMF, BioDME, Fischer-Tropschdiesel, biohydrogen diesel, mixed alcohols and wood
diesel.
Cellulosic ethanol production uses nonfood crops or inedible waste products and does not divert food away from the animal or human food
chain. Lignocellulose is the "woody" structural material of plants. This feedstock is abundant and diverse, and in some cases (like citrus peels or
sawdust) it is in itself a significant disposal problem.

Producing ethanol from cellulose is a difficult technical problem to solve. In nature, ruminant livestock (such as cattle) eat grass and then use slow
enzymatic digestive processes to break it intoglucose (sugar). In cellulosic ethanol laboratories, various experimental processes are being developed
to do the same thing, and then the sugars released can be fermented to make ethanol fuel. In 2009, scientists reported developing, using "synthetic
biology", "15 new highly stable fungal enzyme catalysts that efficiently break down cellulose into sugars at high temperatures", adding to the 10
previously known.[35] The use of high temperatures has been identified as an important factor in improving the overall economic feasibility of the
biofuel industry and the identification of enzymes that are stable and can operate efficiently at extreme temperatures is an area of active
research.[36] In addition, research conducted at Delft University of Technology by Jack Pronk has shown that elephant yeast, when slightly modified,
can also produce ethanol from inedible ground sources (e.g. straw).[37][38]
The recent discovery of the fungus Gliocladium roseum points toward the production of so-called myco-diesel from cellulose. This organism (recently
discovered in rainforests of northernPatagonia) has the unique capability of converting cellulose into medium-length hydrocarbons typically found in
diesel fuel.[39] Scientists also work on experimental recombinant DNA genetic engineering organisms that could increase biofuel potential.
Scientists working with the New Zealand company Lanzatech have developed a technology to use industrial waste gases, such as carbon monoxide
from steel mills, as a feedstock for a microbial fermentation process to produce ethanol.[40][41] In October 2011, Virgin Atlantic announced it was joining
with Lanzatech to commission a demonstration plant in Shanghai that would produce an aviation fuel from waste gases from steel production.[42]
Scientists working in Minnesota have developed co-cultures of Shewanella and Synechococcus that produce long-chain hydrocarbons directly from
water, carbon dioxide, and sunlight.[43] The technology has received ARPA-E funding.
[edit]Biofuels by region
Main article: Biofuels by region
See also: Biodiesel around the world
There are international organizations such as IEA Bioenergy,[44] established in 1978 by the OECD International Energy Agency (IEA), with the aim of
improving cooperation and information exchange between countries that have national programs in bioenergy research, development and
deployment. The UN International Biofuels Forum is formed by Brazil, China, India, Pakistan,South Africa, the United States and the European
Commission.[45] The world leaders in biofuel development and use are Brazil, the United States, France, Sweden and Germany. Russia also has 22%

of world's forest,[46] and is a big biomass (solid biofuels) supplier. In 2010, Russian pulp and paper maker, Vyborgskaya Cellulose, said they would be
producing pellets that can be used in heat and electricity generation from its plant in Vyborg by the end of the year.[47] The plant will eventually
produce about 900,000 tons of pellets per year, making it the largest in the world once operational.
Biofuels currently make up 3.1%[48] of the total road transport fuel in the UK or 1,440 million litres. By 2020, 10% of the energy used in UK road and
rail transport must come from renewable sources – this is the equivalent of replacing 4.3 million tonnes of fossil oil each year. Conventional biofuels
are likely to produce between 3.7 and 6.6% of the energy needed in road and rail transport, while advanced biofuels could meet up to 4.3% of the
UK’s renewable transport fuel target by 2020.[49]
[edit]Issues with biofuel production and use
Main article: Issues relating to biofuels
There are various social, economic, environmental and technical issues with biofuel production and use, which have been discussed in the popular
media and scientific journals. These include: the effect of moderating oil prices, the "food vs fuel" debate, poverty reduction potential, carbon
emissions levels, sustainable biofuel production, deforestation and soil erosion, loss of biodiversity, and impact on water resources, as well as energy
balance and efficiency. The International Resource Panel, which provides independent scientific assessments and expert advice on a variety of
resource-related themes, assessed the issues relating to biofuel use in its first report, Towards sustainable production and use of resources:
Assessing Biofuels.[50] The report outlined the wider and interrelated factors that need to be considered when deciding on the relative merits of
pursuing one biofuel over another. It concluded not all biofuels perform equally in terms of their impact on climate, energy security, and ecosystems,
and suggested environmental and social impacts need to be assessed throughout the entire life-cycle.
Although many current issues are noted with biofuel production and use, the development of new biofuel crops and second-generation biofuels
attempts to circumvent these issues. Many scientists and researchers are working to develop biofuel crops that require less land and use fewer
resources, such as water, than current biofuel crops do. According to the journal Renewable fuels from algae: An answer to debatable land based
fuels,[51] algae are a source for biofuels that could use currently unprofitable land and wastewater from different industries. Algae are able to grow in
wastewater, which does not affect the land or freshwater needed to produce current food and fuel crops. Furthermore, algae are not part of the
human food chain, so do not take away food resources from humans.

The effects of the biofuel industry on food are still being debated. According to a recent study,[52] biofuel production accounted for 3-30% of the
increase in food prices in 2008. A recent study for the International Centre for Trade and Sustainable Development shows market-driven expansion
of ethanol in the US increased corn prices by 21% in 2009, in comparison with what prices would have been had ethanol production been frozen at
2004 levels.[53] This has prompted researchers to develop biofuel crops and technologies that will reduce the impact of the growing biofuel industry on
food production and cost.
One step to overcoming these issues is developing biofuel crops best suited to each region of the world. If each region used a specific biofuel crop,
the need to use fossil fuels to transport the fuel to other places for processing and consumption will be diminished. Furthermore, certain areas of the
globe are unsuitable for producing crops that require large amounts of water and nutrient-rich soil. Therefore, current biofuel crops, such as corn, are
unpractical in different environments and regions of the globe.
In 2012, the United States House Committee on Armed Services put language into the 2013 National Defense Authorization Act that would prevent
the Pentagon from purchasing biofuels that offered improved performance for combat aircraft.[54]
[edit]Current research
Research is ongoing into finding more suitable biofuel crops and improving the oil yields of these crops. Using the current yields, vast amounts of land
and fresh water would be needed to produce enough oil to completely replace fossil fuel usage. It would require twice the land area of the US to be
devoted to soybean production, or two-thirds to be devoted to rapeseed production, to meet current US heating and transportation needs.[citation needed]
Specially bred mustard varieties can produce reasonably high oil yields and are very useful in crop rotation with cereals, and have the added benefit
that the meal leftover after the oil has been pressed out can act as an effective and biodegradable pesticide.[55]
The NFESC, with Santa Barbara-based Biodiesel Industries, is working to develop biofuels technologies for the US navy and military, one of the
largest diesel fuel users in the world.[56] A group of Spanish developers working for a company called Ecofasa announced a new biofuel made from
trash. The fuel is created from general urban waste which is treated by bacteria to produce fatty acids, which can be used to make biofuels.[57]
[edit]Ethanol biofuelsMain article: Ethanol

As the primary source of biofuels in North America, many organizations are conducting research in the area of ethanol production. The National Corn-
to-Ethanol Research Center (NCERC) is a research division of Southern Illinois University Edwardsville dedicated solely to ethanol-based biofuel
research projects.[58] On the federal level, the USDA conducts a large amount of research regarding ethanol production in the United States. Much of
this research is targeted toward the effect of ethanol production on domestic food markets.[59] A division of the U.S. Department of Energy,
the National Renewable Energy Laboratory (NREL), has also conducted various ethanol research projects, mainly in the area of cellulosic ethanol.[60]
[edit]Algal biofuelsMain articles: Algaculture and Algal fuel
From 1978 to 1996, the US NREL experimented with using algae as a biofuels source in the "Aquatic Species Program".[61] A self-published article by
Michael Briggs, at the UNH Biofuels Group, offers estimates for the realistic replacement of all vehicular fuel with biofuels by using algae that have a
natural oil content greater than 50%, which Briggs suggests can be grown on algae ponds at wastewater treatment plants.[62] This oil-rich algae can
then be extracted from the system and processed into biofuels, with the dried remainder further reprocessed to create ethanol. The production of
algae to harvest oil for biofuels has not yet been undertaken on a commercial scale, but feasibility studies have been conducted to arrive at the above
yield estimate. In addition to its projected high yield, algaculture — unlike crop-based biofuels — does not entail a decrease in food production, since
it requires neither farmland nor fresh water. Many companies are pursuing algae bioreactors for various purposes, including scaling up biofuels
production to commercial levels.[63][64] Prof. Rodrigo E. Teixeira from the University of Alabama in Huntsville demonstrated the extraction of biofuels
lipids from wet algae using a simple and economical reaction in ionic liquids.[65]
[edit]JatrophaMain article: Jatropha curcas
Several groups in various sectors are conducting research on Jatropha curcas, a poisonous shrub-like tree that produces seeds considered by many
to be a viable source of biofuels feedstock oil.[66] Much of this research focuses on improving the overall per acre oil yield of Jatropha through
advancements in genetics, soil science, and horticultural practices.
SG Biofuels, a San Diego-based jatropha developer, has used molecular breeding and biotechnology to produce elite hybrid seeds that show
significant yield improvements over first-generation varieties.[67] SG Biofuels also claims additional benefits have arisen from such strains, including
improved flowering synchronicity, higher resistance to pests and diseases, and increased cold-weather tolerance.[68]
Plant Research International, a department of the Wageningen University and Research Centre in the Netherlands, maintains an ongoing Jatropha
Evaluation Project that examines the feasibility of large-scale jatropha cultivation through field and laboratory experiments.[69] The Center for
Sustainable Energy Farming (CfSEF) is a Los Angeles-based nonprofit research organization dedicated to jatropha research in the areas of plant
science, agronomy, and horticulture. Successful exploration of these disciplines is projected to increase jatropha farm production yields by 200-300%
in the next 10 years.[70]
[edit]Fungi
A group at the Russian Academy of Sciences in Moscow, in a 2008 paper, stated they had isolated large amounts of lipids from single-celled fungi
and turned it into biofuels in an economically efficient manner. More research on this fungal species, Cunninghamella japonica, and others, is likely to
appear in the near future.[71] The recent discovery of a variant of the fungus Gliocladium roseum points toward the production of so-called myco-
diesel from cellulose. This organism was recently discovered in the rainforests of northern Patagonia, and has the unique capability of converting
cellulose into medium-length hydrocarbons typically found in diesel fuel.[72]
[edit]Greenhouse gas emissions
According to Britain's National Non-Food Crops Centre, total net savings from using first-generation biodiesel as a transport fuel range from 25-82%
(depending on the feedstock used), compared to diesel derived from crude oil.[73] Nobel Laureate Paul Crutzen, however, finds that the emissions of
nitrous oxide due to nitrate fertilisers is seriously underestimated, and tips the balance such that most biofuels produce more greenhouse gases than
the fossil fuels they replace. Producing lignocellulosic biofuels offers potentially greater greenhouse gas emissions savings than those obtained by
first-generation biofuels. Lignocellulosic biofuels are predicted by oil industry body CONCAWE [1] to reduce greenhouse gas emissions by around
90% when compared with fossil petroleum,[citation needed] in contrast first generation biofuels were found to offer savings of 20-70%[74][not in citation given]
Some scientists have expressed concerns about land-use change in response to greater demand for crops to use for biofuel and the subsequent
carbon emissions.[75] The payback period, that is, the time it will take biofuels to pay back the carbon debt they acquire due to land-use change, has

been estimated to be between 100 and 1000 years, depending on the specific instance and location of land-use change. However, no-till practices
combined with cover-crop practices can reduce the payback period to three years for grassland conversion and 14 years for forest
conversion.[76] Biofuels made from waste biomass or from biomass grown on abandoned agricultural lands incur little to no carbon debt.[77]
Biomass planting mandated by law (as in European Union) is causing concerns over raising food prices[78] and actual emissions reductions, as large
quantities of biomass are being transported to the EU from Africa, Asia, and the Americas (Canada, USA, Brazil).[79] For example in Poland, as much
as 85% of biomass used is imported from outside of the EU,[80] with a single electric plant in Łódź importing over 7000 tons of wood biomass from the
Republic of Komi (Russia) over distance of 7000 kilometers on monthly basis.[81]
[edit]See also
Aviation biofuel
Sustainable aviation fuel
BioEthanol for Sustainable Transport
Biofuels Center of North Carolina
Biofuelwatch
Biogas powerplant
Bioheat, a biofuel blended with heating oil.
Biomass briquettes
Cellulosic ethanol
Clean Cities (US DOE Program to increase the use of all the alternative fuels, including the prominent biofuels biodiesel and ethanol)
Biomass to liquid bio-oil
Dimethyl ether
Energy forestry
Ecological sanitation
Energy content of biofuel

Environmental impact of aviation
Green crude
IRENA
Life cycle assessment
List of biofuel companies and researchers
List of emerging technologies
List of vegetable oils section on oils used as biodiesel
Low-carbon economy
Sustainable transport
Table of biofuel crop yields
Vegetable oil economy
PortalsAccess related topics
Renewable energy portal
Energy portal
Sustainable development portal
Ecology portal
[edit]References
1. ^ Demirbas, A. . (2009). "Political, economic and environmental impacts of biofuels: A review". Applied Energy86: S108–
S117. doi:10.1016/j.apenergy.2009.04.036. edit
2. ^ Opinion of the EEA Scientific Committee on Greenhouse Gas Accounting in Relation to Bioenergy
3. ^ a b "Biofuels Make a Comeback Despite Tough Economy". Worldwatch Institute. 2011-08-31. Retrieved 2011-08-31.
4. ^ REN21 (2011). "Renewables 2011: Global Status Report". pp. 13–14.[dead link]
5. ^ "IEA says biofuels can displace 27% of transportation fuels by 2050 Washington". Platts. 20 April 2011.

6. ^ Bio ethanol fires information bio ethanol fireplace. (2009)
7. ^ Andrew Bounds (2007-09-10). "OECD warns against biofuels subsidies". Financial Times. Retrieved 2008-03-07.
8. ^ see "Breaking the Biological Barriers to Cellulosic Ethanol"
9. ^ Brinkman, N. et al., "Well-to-Wheels Analysis of Advanced/Vehicle Systems", 2005.
10. ^ Farrell, A.E. et al. (2006) "Ethanol can Contribute to Energy and Environmental Goals", Science, 311, 506-8.
11. ^ Hammerschlag, R. 2006. "Ethanol's Energy Return on Investment: A Survey of the Literature 1999-Present",Environ. Sci. Technol., 40, 1744-
50.
12. ^ "With only 2/3 the energy of gasoline, ethanol costs more per mile". zFacts.com. 2007-04-27. Retrieved 2008-03-07.
13. ^ "ButylFuel, LLC Main Page". Butanol.com. 2005-08-15. Retrieved 2010-07-14.
14. ^ Evans, Jon (14 January 2008). "Biofuels aim higher".Biofuels, Bioproducts and Biorefining (BioFPR). Retrieved 2008-12-03.
15. ^ "ADM Biodiesel: Hamburg, Leer, Mainz". Biodiesel.de. Retrieved 2010-07-14.
16. ^ RRI Limited for Biodiesel Filling Stations. "Welcome to Biodiesel Filling Stations". Biodieselfillingstations.co.uk. Retrieved 2010-07-14.
17. ^ "Biofuels Facts". Hempcar.org. Retrieved 2010-07-14.
18. ^ THE FUTURIST, Will Thurmond. July–August 2007
19. ^ Brown, Robert; Jennifer Holmgren. "Fast Pyrolysis and Bio-Oil Upgrading". Retrieved 15 March 2012.
20. ^ a b c d "Alternative & Advanced Fuels". US Department of Energy. Retrieved 7 March 2012.
21. ^ a b c Knothe, Gerhard (2010), Biodiesel and renewable diesel: A comparison, Progress in Energy and Combustion Science
22. ^ Jessica, Ebert. "Breakthroughs in Green Gasoline Production". Biomass Magazine. Retrieved 14 August 2012.
23. ^ Albrecht, KO; Hallen, RT (March 2011), A Brief Literature Overview of Various Routes to Biorenewable Fuels from Lipids for the National
Alliance of Advanced Biofuels and Bio-products NAAB Consortium, Prepared by the US Department of Energy
24. ^ a b Evans, G. "Liquid Transport Biofuels - Technology Status Report", National Non-Food Crops Centre, 2008-04-14. Retrieved on 2009-05-11.
25. ^ "Council Directive 85/536/EEC of 5 December 1985 on crude-oil savings through the use of substitute fuel components in petrol". Eur-
lex.europa.eu. Retrieved 2010-07-14.
26. ^ "Microsoft Word - IA 55 EN.doc" (PDF). Retrieved 2010-07-14.

27. ^ Redman, G., The Andersons Centre. "Assessment of on-farm AD in the UK", National Non-Food Crops Centre, 2008-06-09. Retrieved on
2009-05-11.
28. ^ "BIOGAS: No bull, manure can power your farm." Farmers Guardian (25 September 2009): 12. General OneFile. Gale.
29. ^ Electricity from wood through the combination of gasification and solid oxide fuel cells, Ph.D. Thesis by Florian Nagel, Swiss Federal Institute
of Technology Zurich, 2008
30. ^ a b Frauke Urban and Tom Mitchell 2011. Climate change, disasters and electricity generation. London: Overseas Development
Institute and Institute of Development Studies
31. ^ Cedric Briens, Jan Piskorz and Franco Berruti, "Biomass Valorization for Fuel and Chemicals Production -- A Review," 2008. International
Journal of Chemical Reactor Engineering, 6, R2
32. ^ "Threat to Great Apes Highlighted at Virunga Meeting". America.gov. Retrieved 2010-07-14.
33. ^ "Biofuel Production". European Biofuels Technology Platform. Retrieved 17 May 2011.
34. ^ Scott SA, Davey MP, Dennis JS, Horst I, Howe CJ, Lea-Smith DJ, Smith AG. 2010. Biodiesel from algae: challenges and prospects. Current
Opinion in Biotechnology. 21(3):277-86
35. ^ EurekAlert. (2009). 15 new highly stable fungal enzyme catalysts that efficiently break down cellulose into sugars at high temperatures.
36. ^ Yeoman CJ, Han Y, Dodd D, Schroeder CM, Mackie RI, Cant IK. (2010) Yeoman CJ, Han Y, Dodd D, Schroeder CM, Mackie RI, Cann IK
(2010). "Thermostable enzymes as biocatalysts in the biofuel industry". Adv. Appl. Microbiol. 70: 1–55. doi:10.1016/S0065-2164(10)70001-
0.PMID 20359453.. Advances in Applied Microbiology 70: 1 - 55
37. ^ "Jack Pronk's elephant yeast". Tnw.tudelft.nl. Retrieved 2010-07-14.
38. ^ "Straw to ethanol plant in Sas van Gent". Tnw.tudelft.nl. Retrieved 2010-07-14.
39. ^ "Fill her up please, and make it myco-diesel". Agence France-Presse. Retrieved 2008-11-04.
40. ^ *Fisher, Lawrence M. 24 April 2007. "Carbon gas is explored as a source of ethanol" The New York Times.
41. ^ *Voegele, E. 27 August 2009. "LanzaTech develops waste gas to ethanol technology", Ethanol Producer Magazine
42. ^ "Virgin unveils 'ground-breaking' jet fuel". Travel Weekly.co.uk. 11 October 2011. Retrieved 14 October 2011.

43. ^ "http://www.license.umn.edu/Products/Co-cultured-Synechococcus-and-Shewanella-Produce-Hydrocarbons-without-Cellulosic-
Feedstock__20100084.aspx".
44. ^ "IEA bioenergy". IEA bioenergy. Retrieved 2010-07-14.
45. ^ "Press Conference Launching International Biofuels Forum". United Nations Department of Public Information. 2007-03-02. Retrieved 2008-
01-15.
46. ^ Greenpeace - The Russian Forests
47. ^ "World's Largest Pellet Plant to Start by Year-End".Moscow Times
48. ^ UK falls short of biofuel targets for 2010/2011
49. ^ National Non-Food Crops Centre. "Advanced Biofuels: The Potential for a UK Industry, NNFCC 11-011", Retrieved on 2011-11-17
50. ^ Towards sustainable production and use of resources: Assessing Biofuels, 2009, International Resource Panel,United Nations Environment
Programme
51. ^ Renewable fuels from algae: An answer to debatable land based fuels (Nithya Srinath) - Academia.edu
52. ^ ScienceDirect.com - Biomass and Bioenergy - Impact of biofuel production and other supply and demand factors on food price increases in
2008
53. ^ The Impact of US Biofuel Policies on Agricultural Price Levels and Volatility, By Bruce A. Babcock, Center for Agricultural and Rural
Development, Iowa State University, for ICTSD, Issue Paper No. 35. June 2011.
54. ^ Lane, Jim. "US warplanes can fly faster, carry additional weapons load using advanced fuels and biofuels."Biofuels Digest, 21 May 2012.
55. ^ "Mustard Hybrids for Low-Cost Biofuels and Organic Pesticides" (PDF). Retrieved 2010-03-15.
56. ^ Future Energies (2003-10-30). "PORT HUENEME, Calif: U.S. Navy to Produce its Own Biofuels :: Future Energies :: The future of energy".
Future Energies. Retrieved 2009-10-17.
57. ^ "Newsvine - Ecofasa turns waste to biofuels using bacteria". Lele.newsvine.com. 2008-10-18. Retrieved 2009-10-17.
58. ^ Ethanol Research (2012-04-02). "National Corn-to-Ethanol Research Center (NCERC)". Ethanol Research. Retrieved 2012-04-02.
59. ^ American Coalition for Ethanol (2008-06-02). "Responses to Questions from Senator Bingaman". American Coalition for Ethanol. Retrieved
2012-04-02.

60. ^ National Renewable Energy Laboratory (2007-03-02)."Research Advantages: Cellulosic Ethanol". National Renewable Energy Laboratory.
Retrieved 2012-04-02.
61. ^ Sheehan, John; et al. (July 1998). "A Look Back at the U. S. Department of Energy's Aquatic Species Program: Biofuels from Algae". National
Renewable Energy Laboratory. Retrieved 16 June 2012.
62. ^ Briggs, Michael (August 2004). "Widescale Biodiesel Production from Algae". Archived from the original on 24 March 2006. Retrieved 2007-01-
02 publisher = UNH Biodiesel Group (University of New Hampshire).
63. ^ "Valcent Products Inc. Develops "Clean Green" Vertical Bio-Reactor". Valcent Products. Retrieved 2008-07-09.
64. ^ "Technology: High Yield Carbon Recycling". GreenFuel Technologies Corporation. Retrieved 2008-07-09.
65. ^ R. E. Teixeira (2012). "Energy-efficient extraction of fuel and chemical feedstocks from algae". Green Chemistry 14 (2): 419–
427. doi:10.1039/C2GC16225C.
66. ^ B.N. Divakara, H.D. Upadhyaya, S.P. Wani, C.L. Laxmipathi Gowda (2010). "Biology and genetic improvement of Jatropha curcas L.: A
review". Applied Energy 87 (3): 732–742. doi:10.1016/j.apenergy.2009.07.013.
67. ^ Biofuels Digest (2011-05-16). "Jatropha blooms again: SG Biofuels secures 250K acres for hybrids". Biofuels Digest. Retrieved 2012-03-08.
68. ^ SG Biofuels (2012-03-08). "Jmax Hybrid Seeds". SG Biofuels. Retrieved 2012-03-08.
69. ^ Plant Research International (2012-03-08). "JATROPT (Jatropha curcas): Applied and technical research into plant properties". Plant
Research International. Retrieved 2012-03-08.
70. ^ Biofuels Magazine (2011-04-11). "Energy Farming Methods Mature, Improve". Biofuels Magazine. Retrieved 2012-03-08.
71. ^ Sergeeva, Y. E.; Galanina, L. A.; Andrianova, D. A.; Feofilova, E. P. (2008). "Lipids of filamentous fungi as a material for producing biodiesel
fuel". Applied Biochemistry and Microbiology 44 (5): 523.doi:10.1134/S0003683808050128. edit
72. ^ Strobel, G.; Knighton, B.; Kluck, K.; Ren, Y.; Livinghouse, T.; Griffin, M.; Spakowicz, D.; Sears, J. (2008). "The production of myco-diesel
hydrocarbons and their derivatives by the endophytic fungus Gliocladium roseum (NRRL 50072)".Microbiology (Reading, England) 154 (Pt 11):
3319–3328.doi:10.1099/mic.0.2008/022186-0. PMID 18957585. edit
73. ^ National Non-Food Crops Centre. "GHG Benefits from Use of Vegetable Oils for Electricity, Heat, Transport and Industrial Purposes, NNFCC
10-016", Retrieved on 2011-06-27
74. ^ Concawe Well to Wheels LCA.

75. ^ Searchinger, Timothy; Ralph Heimlich, R.A. Houghton, Fengxia Dong, Amani Elobeid, Jacinto Fabiosa, Simla Tokgoz, Dermot Hayes, Tun-
Hsiang Yu (2011 [last update])."Use of U.S. Croplands for Biofuels Increases Greenhouse Gases Through Emissions from Land-Use Change".
sciencemag.org. doi:10.1126/science.1151861. Retrieved 8 November 2011.
76. ^ Kim, Hyungtae; Seungdo Kim, Bruce E. Dale (2009)."Biofuels, Land Use Change, and Greenhouse Gas Emissions: Some Unexplored
Variables". pubs.acs.org.doi:10.1021/es802681k. Retrieved 8 November 2011.
77. ^ fargione, Joseph; Jason Hill, David Tilman, Stephen Polasky, Peter Hawthorne (2008). "Land Clearing and the Biofuel Carbon Debt".
sciencemag.org.doi:10.1126/science.1152747. Retrieved 12 November 2011.
78. ^ The Department for Transport will not commit to biofuels yet, Action Aid UK, 2010
79. ^ James Hewitt, Flows of biomass to and from the EU, 2011
80. ^ Andrzej Rybczynski, Produkcja biomasy na potrzeby własne energetyki, Forum Biomasy, 2012
81. ^ Centrozap sprzedaje w Polsce biomasę z Rosji
[edit]Further reading
Caye Drapcho, Nhuan Phú Nghiêm, Terry Walker (August 2008). Biofuels Engineering Process Technology. [McGraw-Hill]. ISBN 978-0-07-
148749-8.
IChemE Energy Conversion Technology Subject Group (May 2009). A Biofuels Compendium. [IChemE]. ISBN 978-0-85295-533-8.
Fuel Quality Directive Impact Assessment
Biofuels Journal
James Smith (November 2010). Biofuels and the Globalisation of Risk. [Zed Books]. ISBN 978-1-84813-572-7.
Mitchell, Donald (2010) (Available in PDF). Biofuels in Africa: Opportunities, Prospects, and Challenges. The World Bank, Washington,
D.C.. ISBN 978-0-8213-8516-6. Retrieved 2011-02-08.
Li, H.; Cann, A. F.; Liao, J. C. (2010). "Biofuels: Biomolecular Engineering Fundamentals and Advances". Annual Review of Chemical and
Biomolecular Engineering 1: 19–36.doi:10.1146/annurev-chembioeng-073009-100938. PMID 22432571. edit
[edit]External links

EFOA
Alternative Fueling Station Locator (EERE)
Towards Sustainable Production and Use of Resources: Assessing Biofuels by the United Nations Environment Programme, October 2009.
Biofuels guidance for businesses, including permits and licences required on NetRegs.gov.uk
How Much Water Does It Take to Make Electricity?—Natural gas requires the least water to produce energy, some biofuels the most, according
to a new study.
International Conference on Biofuels Standards - European Union Biofuels Standardization
International Energy Agency: Biofuels for Transport - An International Perspective
Biofuels from Biomass: Technology and Policy Considerations Thorough overview from MIT
The Guardian news on biofuels
The U.S. DOE Clean Cities Program - links to all of the Clean Cities coalitions that exist throughout the U.S. (there are 87 of them)
Biofuels Factsheet by the University of Michigan's Center for Sustainable Systems
[show]
V
T
E
Bioenergy
[show]
V
T

E
Environmental technology
[show]
V
T
E
Global warming and climate change
[show]
V
T
E
Sustainability
[show]
V
T
E

Emerging technologies
[show]
V
T
E
Maize (corn)
View page ratings
Rate this pageWhat's this?
Trustworthy
Objective
Complete
Well-written
I am highly knowledgeable about this topic (optional)
Submit ratings
Categories:
Anaerobic digestion
Biodegradable waste management
Bioenergy
Biofuels

Emerging technologies
Sustainable technologies
Fuels
Biomass
Renewable fuels
2.1.5-BiohydrogenBiohydrogenFrom Wikipedia, the free encyclopedia
Microbial hydrogen production.
Biohydrogen is defined as hydrogen produced biologically, most commonly by algae, bacteria and archaea. Biohydrogen is a potential biofuel obtainable
from both cultivation and from waste organic materials.[1]
Contents
[hide]

1 Introduction
2 Algaeic biohydrogen
3 Bacterial biohydrogen
o 3.1 Process requirements
o 3.2 Fermentation
3.2.1 Dark fermentation
3.2.2 Photo-fermentation
3.2.3 Combined fermentation
o 3.3 Metabolic processes
3.3.1 Clostridium
3.3.2 Rhodobacter
o 3.4 LED-fermenter
o 3.5 Metabolic engineering
4 See also
5 References
6 External links
[edit]Introduction
Currently, there is a huge demand of the chemical hydrogen. There is noblog on the production volume and use of hydrogen world-wide. However the
estimated consumption of hydrogen is expected to reach 900 billion cubic meters in 2011[2]
Refineries are large-volume producers and consumers of hydrogen. Today 96% of all hydrogen is derived from fossil fuels, with 48% from natural gas,
30% from hydrocarbons, 18% from coal and about 4% from electrolysis. Oil-sands processing, gas-to-liquids and coal gasification projects that are
ongoing, require a huge amount of hydrogen and is expected to boost the requirement significantly within the next few years. Environmental regulations
implemented in most countries, increase the hydrogen requirement at refineries for gas-line and diesel desulfurization[2][3]
An important future application of hydrogen could be as an alternative for fossil fuels, once the oil deposits are depleted.[4] This application is however
dependent on the development of storage techniques to enable proper storage, distribution and combustion of hydrogen.[4] If the cost of hydrogen
production, distribution, and end-user technologies decreases, hydrogen as a fuel could be entering the market in 2020.[5]
Industrial fermentation of hydrogen, or whole-cell catalysis, requires a limited amount of energy, since fission of water is achieved with whole cell catalysis,
to lower the activation energy.[6] This allows hydrogen to be produced from any organic material that can be derived through whole cell catalysis since this
process does not depend on the energy of substrate.
[edit]Algaeic biohydrogen
Further information: Biohydrogen reactor
In 1939 a German researcher named Hans Gaffron, while working at the University of Chicago, observed that the algae he was
studying, Chlamydomonas reinhardtii (a green-algae), would sometimes switch from the production of oxygen to the production of hydrogen.[7] Gaffron
never discovered the cause for this change and for many years other scientists failed in their attempts at its discovery. In the late 1990s
professor Anastasios Melis a researcher at the University of California at Berkeley discovered that if the algae culture medium is deprived of sulfur it will
switch from the production of oxygen (normal photosynthesis), to the production of hydrogen. He found that the enzyme responsible for this reaction
is hydrogenase, but that the hydrogenase lost this function in the presence of oxygen. Melis found that depleting the amount of sulfur available to the
algae interrupted its internal oxygen flow, allowing the hydrogenase an environment in which it can react, causing the algae to produce
hydrogen.[8] Chlamydomonas moewusii is also a good strain for the production of hydrogen. Scientists at the U.S. Department of Energy’s Argonne
National Laboratory are currently trying to find a way to take the part of the hydrogenase enzyme that creates the hydrogen gas and introduce it into the
photosynthesis process. The result would be a large amount of hydrogen gas, possibly on par with the amount of oxygen created.[9][10]
It would take about 25,000 square kilometres to be sufficient to displace gasoline use in the US. To put this in perspective, this area represents
approximately 10% of the area devoted to growingsoya in the US.[11] The US Department of Energy has targeted a selling price of $2.60 / kg as a goal for
making renewable hydrogen economically viable. 1 kg is approximately the energy equivalent to a gallon of gasoline. To achieve this, the efficiency of

light-to-hydrogen conversion must reach 10% while current efficiency is only 1% and selling price is estimated at $13.53 / kg.[12]According to the DOE cost
estimate, for a refueling station to supply 100 cars per day, it would need 300 kg. With current technology, a 300 kg per day stand-alone system will
require 110,000 m2 of pond area, 0.2 g/l cell concentration, a truncated antennae mutant and 10 cm pond depth.[13] Areas of research to increase
efficiency include developing oxygen-tolerant FeFe-hydrogenases[14] and increased hydrogen production rates through improved electron transfer.[15]
[edit]Bacterial biohydrogen
[edit]Process requirements
If hydrogen by fermentation is to be introduced as an industry, the fermentation process will be dependent on organic acids as substrate for photo-
fermentation. The organic acids are necessary for high hydrogen production rates.[6][16]
The organic acids can be derived from any organic material source such as sewage waste waters or agricultural wastes.[16] The most important organic
acids are acetic acid (HAc), butyric acid(HBc) and propionic acid (HPc). A huge advantage is that production of hydrogen by fermentation does not
require glucose as substrate.[16]
The fermentation of hydrogen has to be a continuous fermentation process, in order sustain high production rates, since the amount of time for the
fermentation to enter high production rates are in days.[6]
[edit]Fermentation
Several strategies for the production of hydrogen by fermentation in lab-scale have been found in literature. However no strategies for industrial-scale
productions have been found. In order to define a industrial-scale production, the information from lab-scale experiments has been scaled to an industrial-
size production on a theoretical basis. In general, the method of hydrogen fermentation is referred to in three main categories. The first category is dark-
fermentation, which is fermentation which does not involve light. The second category is photo-fermentation, which is fermentation which requires light as
the source of energy. The third is combined-fermentation, which refers to the two fermentations combined.
[edit]Dark fermentation

There are several bacteria with a potential for hydrogen production. The Gram-positive bacteria of the Clostridium genus, is promising because it has a
natural high hydrogen production rate. In addition, it is fast growing and capable of forming spores, which make the bacteria easy to handle in industrial
application.[17]
Species of the Clostridium genus allow hydrogen production in mixed cultures, under mesophilic or thermophilic conditions within a pH range of 5.0 to
6.5.[17] Dark-fermentation with mixed cultures seems promising since a mixed bacterial environment within the fermenter, allows cooperation of different
species to efficiently degrade and convert organic waste materials into hydrogen, accompanied by the formation of organic acids.[17] The clostridia produce
H2 via a reversible hydrogenase (H2ase) enzyme (2H + 2e <=> H2) and this reaction is important in achieving the redox balance of fermentation. The rate
of H2 formation is inhibited as H2 production causes the partial pressure of H2 (pH2) to increase. This can limit substrate conversion and growth and the
bacteria may respond by switching to a different metabolic pathway in order to achieve redox balance, energy generation and growth - by producing
solvents instead of hydrogen and organic acids.[18][19]
Enteric bacteria such as Escherichia coli and Enterobacter aerogenes are also interesting for biohydrogen fermentation.[20][21] Unlike the clostridia, the
enteric bateria produce hydrogen primarily (or exclusively in the case of E. coli) by the cleavage of formate (HCOOH --> H2 + CO2), which serves to
detoxify the medium by removing formate. Cleavage is not a redox reaction and it has no consequence on the redox balance of fermentation. This
detoxification is particularly important for E. coli as it cannot protect itself by forming spores. Formate cleavage is an irreversible reaction, hence H2
production is insensitive to the partial pressure of hydrogen (pH2) in the fermenter.
E. coli has been referred to as the workhorse of molecular microbiology and many workers have investigated metabolic engineering approaches to
improve biohydrogen fermentation in E. coli.[20][22][23][24][25][26][27][28][29]
Whereas oxygen kills clostridia, the enteric bacteria are facultative anerobes; they grow very quickly when oxygen is available and transition progressively
from aerobic to anaerobic metabolism as oxygen becomes depleted. Growth rate is much slower during anaerobic fermentation than during aerobic
respiration because fermentation less metabolic energy from the same substrate. In practical terms, facultative anaerobes are useful because they can be
grown quickly to a very high concentration with oxygen and then used to produce hydrogen at a high rate when the oxygen supply is stopped.[30]
For fermentation to be sustainable at industrial-scale, it is necessary to control the bacterial community inside the fermenter. Feedstocks may contain
micro-organisms, which could cause changes in the microbial community inside the fermenter. The enteric bacteria and most clostridia are mesophilic;
they have an optimum temperature of around 30 degrees C as do many common environmental microorganisms. Therefore, these fermentations are

susceptible to changes in the microbial community unless the feedstock is sterilised, for example where a hydrothermal pretreatment is involved,
sterilisation is a side-effect.[31] A way to prevent harmful micro-organisms from gaining control of the bacterial environment inside the fermenter could be
through addition of the desired bacteria.[32] Hyperthermophilic archaea such as Thermotoga neapolitana can also be used for hydrogen
fermentation.[33] Because they operate at around 70 degrees C, there is little chance of feedstock contaminants becoming established.
Fermentations produce organic acids are toxic to the bacteria. High concentrations inhibit the fermentation process and may trigger changes in
metabolism and resistance mechanisms such as sporulation in different species.[17] This fermentation of hydrogen is accompanied production of carbon-
dioxide which can be separated from hydrogen with a passive separation process.[34]
The fermentation will convert some of the substrate (e.g. waste) into biomass instead of hydrogen.[17] The biomass is, however, a carbohydrate-rich by-
product which can be fed back into the fermenter, to ensure that the process is sustainable.[35] Fermentation of hydrogen by dark-fermentation is restricted
by incomplete degradation of organic material, into organic acids and this is why we need the photo-fermentation.[17]
The separation of organic acids from biomass in the outlet stream can be done with a settler tank in the outlet stream, where the sludge (biomass) is
pumped back into the fermenter to increase the rate of hydrogen production.[35]
In traditional fermentation systems, the dilution rate must be carefully controlled as it affects the concentration of bacterial cells and toxic end-products
(organic acids and solvents) inside the fermenter. A more complex electro-fermentation technique decouples the retention of water and biomass and
overcomes inhibition by organic acids.[30]
[edit]Photo-fermentation
Photo-fermentation refers to the method of fermentation where light is required as the source of energy. This fermentation relies on photosynthesis to
maintain the cellular energy levels. Fermentation by photosynthesis compared to other fermentations has the advantage of light as the source of energy
instead of sugar. Sugars are usually available in limited quantities.
All plants, algae and some bacteria are capable of photosynthesis: utilizing light as the source of metabolic energy. Cyanobacteria are frequently
mentioned capable of hydrogen production by oxygenic photosynthesis.[36] However the purple non-sulphur (PNS) bacteria (e.g. genus Rhodobacter) hold
significant promise for the production of hydrogen by anoxygenic photosynthesis and photo-fermentation.[6]
Studies have shown that Rhodobacter sphaeroides is highly capable of hydrogen production while feeding on organic acids, consuming 98% to 99% of
the organic acids during hydrogen production.[6] Organic acids may be sourced sustanably from the dark fermentation of waste feedstocks. The resultant
system is called combined fermentation (see below).
Photo-fermentative bacteria can use light in the wavelength range 400-1000 nm (visible and near-infrared)[37] which differs from algae and cyanobacteria
(400-700 nm; visible).
Currently there is limited experience with photo-fermentation at industrial-scale. The distribution of light within the industrial scale photo-fermenter has to
be designed to minimise self-shading. Therefore any externally illuminated photobioreactor must have a high ratio of high surface area to volume. As a
result, photobioreactor construction is materials-intensive and expensive.
A method to ensure proper light distribution and limit self-shading within the fermenter, could be to distribute the light with an optic fiber where light is
transferred into the fermenter and distributed from within the fermenter.[38] Photo-fermentation with Rhodobacter sphaeroides require mesophilic
conditions.[39] An advantage of the optical fiber photobioreactor is that radiant heat-gain can be controlled by dumping excess light and filtering out
wavelengths which cannot be used by the organisms.[38]
[edit]Combined fermentation
Combining dark- and photo-fermentation has shown to be the most efficient method to produce hydrogen through fermentation.[40] The combined
fermentation allows the organic acids produced during dark-fermentation of waste materials, to be used as substrate in the photo-fermentation
process.[6] Many independent studies show this tehcnique to be effective and practical.[41]
For industrial fermentation of hydrogen to be economical feasible, by-products of the fermentation process has to be minimized. Combined fermentation
has the unique advantage of allowing reuse of the otherwise useless chemical, organic acids, through photosynthesis.
Many wastes are suitable for fermentation and this is equivalent the initial stages of anaerobic digestion, now the most important biotechnology for energy
from waste. One of the main challenges in combined fermentation is that effluent fermentation contains not only useful oroganic acids but excess
nitrogenous compounds and ammonia, which inhibit nitrogenase activity by wild-type PNS bacteria.[42] The problem can be solved by genetic engineering
to interrupt down-regulation of nitrogenase in response to nitrogen excess.[43] However, genetically engineered bacterial strains may pose containment
issues for application. A physical solution to this problem was developed at The University of Birmingham UK, which involves selective electro-separation

of organic acids from an active fermentation.[44][45] The energetic cost of electro-separation of organic acids was found to be acceptable in a combined
fermentation.[45] "Electro-fermentation" has the side-effect of a continuous, high-rate dark hydrogen fermentation.
As the method for hydrogen production, combined fermentation currently holds significant promise.[6]
[edit]Metabolic processes
The metabolic process for hydrogen production are dependent on the reduction of the metabolite ferredoxin (except in the enteric bacteria, where an
alternative formate pathway operates).[46]
4H+ + ferredoxin(ox) → ferredoxin(red) + 2 H2
For this process to run, ferredoxin has to be recycled through oxidation. The recycling process is dependent on the transfer of electrons
from nicotinamide adenine dinucleotide (NADH) to ferredoxin.[46]
2 ferredoxin(red) + 2 NADH → 2 ferredoxin(ox) + H2
The enzymes that catalyse this recycling process are referred to as hydrogen-forming enzymes and have complex metalloclusters in their active
site and require several maturation proteins to attain their active form.[46] The hydrogen-forming enzymes are inactivated by molecular oxygen
and must be separated from oxygen, to produce hydrogen.[46]
The three main classes of hydrogen-forming enzymes are [FeFe]-hydrogenase, [NiFe]-hydrogenase and nitrogenase.[46] These enzymes behave
differently in dark-fermentation with Clostridiumand photo-fermentation with Rhodobacter. The interplay of these enzymes are the key in
hydrogen production by fermentation.
[edit]Clostridium
The interplay of the hydrogen-forming enzymes in Clostridium is unique with little or no involvement of nitrogenase. The hydrogen production in
this bacteria is mostly due to [FeFe]-hydrogenase, which activity is a hundred times higher than [NiFe]-hydrogenase and a thousand times higher
than nitrogenase. [FeFe]-hydrogenase has a Fe-Fe catalytic core with a variety of electron donors and acceptors.[6][46]
The enzyme [NiFe]-hydrogenase in Clostridium, catalyse a reversible oxidation of hydrogen. [NiFe]-hydrogenase is responsible for hydrogen
uptake, utilizing the electrons from hydrogen for cellular maintenance.[46]

In Clostridium, glucose is broken down into pyruvate and nicotinamide adenine dicleotide (NADH). The formed pyruvate is then further converted
to acetyl-CoA and hydrogen by pyruvate ferredoxin oxidoreductase with the reduction of ferredoxin.[46] Acetyl-CoA is then converted to acetate,
butyrate and propionate.[46][47]
Acetate fermentation processes are well understood and have a maximum yield of 4 mol hydrogen pr. mol glucose.[6] The yield of hydrogen from
the conversion of acetyl-CoA to butyrate, has half the yield as the conversion to acetate.[6][46] In mixed cultures of Clostridium the reaction is a
combined production of acetate, butyrate and propionate.[40] The organic acids which are the by-product of fermentation with Clostridium, can be
further processed as substrate for hydrogen production with Rhodobacter.
[edit]Rhodobacter
The purple non-sulphur (PNS) bacteria Rhodobacter sphaeroides is able to produce hydrogen from a wide range of organic compounds (chiefly
organic acids) and light.[46]
The photo-system required for hydrogen production in Rhodobacter (PS-I), differ from its oxygenic photosystem (PS-II) due to the requirement of
organic acids and the inability to oxidize water.[46]In the absence of water-splitting photosynthesis is anoxygenic. Therefore, hydrogen production
is sustained without inhibition from generated oxygen.
In PNS bacteria, hydrogen production is due to catalysis by nitrogenase. Hydrogenases are also present but the production of hydrogen by
[FeFe]-hydrogenase is less than 10 times the hydrogen uptake by [NiFe]-hydrogenase.[48]
Only under nitrogen-deficient conditions is nitrogenase activity sufficient to overcome uptake hydrogenase activity, resulting in net generation of
hydrogen.[46][48]

Rhodobacter hydrogen metabolism
The main photosynthetic membrane complex is PS-I which accounts for most of the light-harvest. The photosynthetic membrane complex PS-II
produces oxygen, which inhibit hydrogen production and thus low partial pressures of oxygen most be sustained during fermentation.[46]
The range of photosynthetically active radiation for PNS bacteria is 400-1000 nm. This includes the visible (VIS) and near-infrared (NIR)sections
of the spectrum and not (despite erroneous writings) ultraviolet. This range is wider than that of algae and cyanobacteria (400-700 nm; VIS). The
response to light (action spectrum) varies dramatically across the active range. Around 80% of activity is associated with the NIR. VIS is
absorbed but much less efficiently utilised.[49]
To attain high production rates of hydrogen, the hydrogen production by nitrogenase has to exceed the hydrogen uptake by hydrogenase.[48] The
substrate is oxidized through the tricarboxylic acids circle and the produced electrons are transferred to the nitrogenase catalysed reduction of
protons to hydrogen, through the electron transport chain.[46][48]
[edit]LED-fermenter
To build a industrial-size photo-fermenter without using large areas of land could achieved using a fermenter with light emitting diodes (LED) as
light source. This design prevents self-shading within the fermenter, require limited energy to maintain photosynthesis and has very low
installation costs. This design would also allow cheap models to be built for educational purpose[citation needed].
However, it is impossible for any photobioreactor using artificial lights to generate energy. The maximum light conversion efficiency into hydrogen
is about 10%[37] (by PNS bacteria) and the maximum efficiency of electricity generation from hydrogen about 80% (by PEM fuel cell) and the
maximum efficiency of light generation from electricity (via LED) is about 80%. This represents a cycle of diminishing returns. For the purposes of
fuel or energy production sunlight is necessary but artificially lit photobioreactors such as the LED-fermenter could be useful for the production of
other valuable commodities.
[edit]Metabolic engineering
There is a huge potential for improving hydrogen yield by metabolic engineering. The bacteria Clostridium could be improved for hydrogen
production by disabling the uptake hydrogenase, or disabling the oxygen system. This will make the hydrogen production robust and increase the
hydrogen yield in the dark-fermentation step.

The photo-fermentation step with Rhodobacter, is the step which is likely to gain the most from metabolic engineering. An option could be to
disable the uptake-hydrogenase or to disable the photosynthetic membrane system II (PS-II). Another improvement could be to decrease the
expression of pigments, which shields of the photo-system.
[edit]See also
Rhodobacter sphaeroides
Biohydrogen reactor
Photobiology
Electrohydrogenesis
Microbial fuel cell
Caldicellulosiruptor saccharolyticus
[edit]References
1. ^ Demirbas, A. (2009). Biohydrogen: For Future Engine Fuel Demands. Trabzon: Springer. ISBN 1-84882-510-2
2. ^ a b Stefan Schlag, Bala Suresh, Masahiro Yoneyama (October 2007). "SRI Consulting CEH Report – Hydrogen". SRI Consulting. Retrieved
2010-07-01.
3. ^ "The National Hydrogen Association". Hydrogenassociation.org. 2004-08-13. Retrieved 2010-07-01.
4. ^ a b "Transport and the Hydrogen Economy". World-nuclear.org. Retrieved 2010-07-01.
5. ^ The IEA energy technology essentials are regularly updated briefs that draw together the best-available, consolidated information on energy
technologies from the iea network, April 2007.
6. ^ a b c d e f g h i j Tao, Yongzhen; Chen, Yang; Wu, Yongqiang; He, Yanling; Zhou, Zhihua (February 2007). "High hydrogen yield from a two-step
process of dark- and photo-fermentation of sucrose".International Journal of Hydrogen Energy 32 (2): 200–
206. doi:10.1016/j.ijhydene.2006.06.034. ISSN 0360-3199.
7. ^ Algae: Power Plant of the Future?
8. ^ Reengineering Algae To Fuel The Hydrogen Economy
9. ^ Algae Could One Day be Major Hydrogen Fuel Source Newswise, Retrieved on June 30, 2008.
10.^ Melis A and Happe T (2001). "Hydrogen Production. Green Algae as a Source of Energy". Plant Physiol. 127 (3): 740–
748. doi:10.1104/pp.010498. PMC 1540156. PMID 11706159.
11.^ Growing hydrogen for the cars of tomorrow
12.^ 2004-Updated Cost Analysis of Photobiological Hydrogen
13.^ 2004- Updated cost analysis of photobiological hydrogen production from chlamydomonas reinhardtii green algae
14.^ Photobiological hydrogen production—prospects and challenges
15.^ 2005-A prospectus for biological H2 production
16.^ a b c Kapdan, Ilgi Karapınar; Kargı, Fikret (2006). "Biohydrogen production from waste materials". Enzyme and Microbial Technology.
17.^ a b c d e f Krupp, M.; Widmann, R (May 2009). "Biohydrogen production by dark fermentation: Experiences of continuous operation in large lab
scale". International Journal of Hydrogen Energy 34 (10, Sp. Iss.SI): 4509–4516. doi:10.1016/j.ijhydene.2008.10.043.
18.^ Redwood MD, Paterson-Beedle M, Macaskie LE (2009) Integrating dark and light biohydrogen production strategies: towards the hydrogen
economy. Rev Environ Sci Bio/Technol 8:149-185.
19.^ Nath K, Das D (2004) Improvement of fermentative hydrogen production: various approaches. Appl Microbiol Biotechnol 65:520-529.
20.^ a b Redwood MD, Mikheenko IP, Sargent F, Macaskie LE (2008) Dissecting the roles of E. coli hydrogenases in biohydrogen production. FEMS
Microbiol Lett 278:48-55.
21.^ Clark DP (1989) The fermentation pathways of Escherichia coli. FEMS Microbiology Reviews 5:223-234.
22.^ Akhtar MK, Jones PR (2009) Construction of a synthetic YdbK-dependent pyruvate:H2 pathway in Escherichia coli BL21(DE3). Metab Eng
11:139-47.
23.^ Das D, Veziroglu TN (2008) Advances in biological hydrogen production processes. Int J Hydrog Energy 33:6046-6057.
24.^ Dharmadi Y, Murarka A, Gonzalez R (2006) Anaerobic fermentation of glycerol by Escherichia coli: A new platform for metabolic engineering.
Biotechnol Bioeng 94:821-829.
25.^ Hallenbeck PC, Ghosh D (2009) Advances in fermentative biohydrogen production: the way forward? Trends Biotechnol 27:287-297.

26.^ Sode K, Yamamoto S, Tomiyama M, 2001. Metabolic engineering approaches for the improvement of bacterial hydrogen production based on
Escherichia coli mixed acid fermentation. in: Miyake J, Matsunaga T, San Pietro A (Eds.), Biohydrogen II : An Approach to Environmentally
Acceptable Technology. Pergamon, pp. 195-204.
27.^ Penfold DW, Forster CF, Macaskie LE (2003) Increased hydrogen production by Escherichia coli strain HD701 in comparison with the wild-
type parent strain MC4100. Enz Microb Technol 33:185-189.
28.^ Penfold DW, Sargent F, Macaskie LE (2006) Inactivation of the Escherichia coli K-12 twin arginine translocation system promotes increased
hydrogen production. FEMS Microbiol Lett 262:135-137.
29.^ Mathews J, Wang G (2009) Metabolic pathway engineering for enhanced biohydrogen production. Int J Hydrog Energy 34:7404-7416.
30.^ a b Redwood MD, Orozco R, Majewski AJ, Macaskie LE (2012) Electro-extractive fermentation for efficient biohydrogen production. Bioresour
Technol 107:166–174.
31.^ Orozco RL, Redwood MD, Reza A, Leeke G, Santos R, Macaskie LE (2012) Hydrothermal hydrolysis of starch with CO2 and detoxification of
the hydrolysates with activated carbon for bio-hydrogen fermentation. Int J Hydrog Energy 37:6545-6553.
32.^ Verschuere, L; Rombaut,, G; Sorgeloos, P; Verstraete, W (December 2000). "Probiotic Bacteria as Biological Control Agents in
Aquaculture". Microbiology and Molecular Biology Reviews 64 (4): 655–71. doi:10.1128/MMBR.64.4.655-
671.2000. PMC 99008. PMID 11104813.
33.^ Eriksen NT, Nielsen TM, Iversen N (2008) Hydrogen production in anaerobic and microaerobic Thermotoga neapolitana. Biotechnol Lett
30:103-109.
34.^ Watanabe, Hisanori; Yoshino, Hidekichi (May 2010). "Biohydrogen using leachate from an industrial waste landfill as inoculum". Renewable
Energy 35 (5): 921–924.doi:10.1016/j.renene.2009.10.033.
35.^ a b Villadsen, John; Nielsen, Jens Høiriis; Lidén, Gunnar (2003). Bioreaction Engineering Principles (2 ed.). Springer. ISBN 978-0-306-47349-4.
36.^ Lee, Jae-Hwa; Lee, Dong-Geun; Park, Jae-Il; Kim, Ji-Youn (JAN 2010). "Biohydrogen production from a marine brown algae and its bacterial
diversity". Korean Journal of Chemical Engineering 27 (1): 187–192. doi:10.1007/s11814-009-0300-x.
37.^ a b Akkerman I, Janssen M, Rocha J, Wijffels RH (2002) Photobiological hydrogen production: photochemical efficiency and bioreactor design.
Int J Hydrog Energy 27:1195-1208.
38.^ a b THE NORTH STATE, www.thenorthstate.com. "Sunlight Direct". Sunlight Direct. Retrieved 2010-07-01.

39.^ Nath, K; Kumar, A; Das, D (September 2005). "Hydrogen production by Rhodobacter sphaeroides strain OU001 using spent media of
Enterobacter cloacae strain DM11". Applied Microbiology and Biotechnology 68 (4): 533–541. doi:10.1007/s00253-005-1887-
4. PMID 15666144.
40.^ a b Yang, Honghui; Guo,, Liejin; Liu, Fei (March 2010). "Enhanced bio-hydrogen production from corncob by a two-step process: Dark- and
photo-fermentation". Bioresource Technology 101 (6): 2049–2052. doi:10.1016/j.biortech.2009.10.078. PMID 19963373.
41.^ Redwood, M.D., Paterson-Beedle, M., Macaskie, L.E., 2009. Integrating dark and light biohydrogen production strategies: towards the
hydrogen economy. Rev. Environ. Sci. Bio/Technol. 8:149-185.| url=http://www.springerlink.com/content/h77n7370t70643k7/29
42.^ Redwood MD, Macaskie LE (2006) A two-stage, two-organism process for biohydrogen from glucose. Int J Hydrog Energy 31:1514-1521.
43.^ Zinchenko VV, Babykin M, Glaser V, Mekhedov S, Shestakov SV (1997) Mutation in ntrC gene leading to the derepression of nitrogenase
synthesis in Rhodobacter sphaeroides. FEMS Microbiol Lett 147:57-61.
44.^ Redwood MD, Orozco R, Majewski AJ, Macaskie LE (2012a) Electro-extractive fermentation for efficient biohydrogen production. Bioresour
Technol 107:166–174.
45.^ a b Redwood MD, Orozco R, Majewski AJ, Macaskie LE (2012b) An integrated biohydrogen refinery: Synergy of photofermentation, extractive
fermentation and hydrothermal hydrolysis of food wastes. Bioresour Technol Available online
at http://dx.doi.org/10.1016/j.biortech.2012.05.040.
46.^ a b c d e f g h i j k l m n o Mathews, Juanita; Wang, Guangyi (September 2009). "Metabolic pathway engineering for enhanced biohydrogen
production". International Journal of Hydrogen Energy 34 (17, Sp. Iss. SI): 7404–7416. doi:10.1016/j.ijhydene.2009.05.078.
47.^ "KEGG PATHWAY: Pyruvate metabolism - Clostridium acetobutylicum". Genome.jp. Retrieved 2010-07-01.
48.^ a b c d Koku, H; Eroglu, I; Gunduz, U; Yucel, M; Turker, L (2002). "Aspects of the metabolism of hydrogen production by Rhodobacter
sphaeroides". International Journal of Hydrogen Energy 27 (11–12): 1315–1329. doi:10.1016/S0360-3199(02)00127-1.
49.^ Nogi Y, Akiba T, Horikosji K (1985) Wavelength dependence of photoproduction of hydrogen by Rhodopseudomonas rutila. Agricultural and
Biological Chemistry 49:35-38.
[edit]External links

Biohydrogen at Birmingham, UK
Biohydrogen Interest Group on Linkedin.com
How do microbes make biohydrogen? Drawing out the facts with The Naked Scientists
Film of Fermentation of hydrogen by FCU RCER & NCKU E/EB/BE lab. of Taiwan
Film of Production of hydrogen with bacteria by FCU RCER & NCKU E/EB/BE lab. of Taiwan
1999 - Biohydrogen RITE Biological Hydrogen Program
EU & Dutch Biohydrogen research page
wasteintoenergy.org
University of California Davis -New Technology Turns Food Leftovers Into Electricity, Vehicle Fuels
Onsite Power Systems
"Appendix 2: Biohydrogen" from The Complete Biogas Handbook
BBSRC- Our Science- Bacteria Make Light Work of Hydrogen Production
Biowaste2energy Ltd is applying biohydrogen
[hide]
V
T
E
Environmental technology
Appropriate technology
Environmental design

Environmental impact assessment
Sustainable development
Sustainable technology
Pollution
Air pollution (control
dispersion modeling)
Industrial ecology
Solid waste treatment
Waste management
Water (agricultural wastewater treatment
industrial wastewater treatment
sewage treatment
waste-water treatment technologies
water purification)
Renewable energy Alternative energy

Efficient energy use
Energy development
Energy recovery
Fuel (alternative fuel
biofuel
carbon negative fuel
hydrogen technologies)
Renewable energy (commercialization)
Sustainable energy
Transportation (electric vehicle
hybrid vehicle)
Conservation
Birth control
Building (green

natural
sustainable architecture)
Conservation biology
Conservation ethic
Ecoforestry
Environmental preservation
Environmental remediation
Green computing
Permaculture
Recycling

2.1.6-Landfill gas monitoring
Landfill gas monitoringFrom Wikipedia, the free encyclopedia
Main article: Landfill gas
Landfill gas monitoring is the process by which gases that are released from landfills are electronically monitored.
Contents
[hide]
1 Techniques for the monitoring of landfill gas
2 Types of landfill gas monitoring
3 Techniques for establishing landfill gas (rather than liquid) as the source of VOC in groundwater
samples
4 Typical problems
5 See also
6 References
7 External links
[edit]Techniques for the monitoring of landfill gas

Surface monitoring is used to check the integrity of caps on waste and check on borehole monitoring. It may give preliminay indications of the migration
of gas off-site. The typical regulatory limit of methane is 500 parts per million (ppm) by volume (in California, AB 32 may push this limit down to 200 ppm).
In the UK the limit for a final landfill cap is 1*10-3 milligrams per square metre per second, and for a temporary cap it is 1*10-1 mg/m2/s ( as measured
using the Environment Agency's " Guidance on Monitoring landfill gas surface emissions " LFTGN 07, EA 2004 ). Surface monitoring can be broken down
into Instantaneous and Integrated. Instantaneous monitoring consists of walking over the surface of the landfill, while carrying a flame ionization
detector (FID). Integrated consists of walking over the surface of the landfill, while pumping a sample into a bag. The sample is then read with a FID or
sent to a lab for full analysis. Integrated regulatory limits tend to be 50 ppm or less.
Gas probes, also known as perimeter or migration probes, are used for Subsurface monitoring and detect gas concentrations in the local environment
around the probe. Sometimes multiple probes are used at different depths at a single point. Probes typically form a ring around a landfill. The distance
between probes varies but rarely exceedes 300 metres. The typical regulatory limit of methane here is 50,000 parts per million (ppm) by volume, or 1%
methane and 1.5% carbon dioxide above geological background levels in the UK ( see " Guidance on the monitoring of Landfill Gas " LFTGN03, EA
2004).
Ambient air samplers are used to monitor the air around a landfill for excessive amounts of methane and other gases. The principal odoriferous
compounds are hydrogen sulfide ( which is also toxic ) and the majority of a population exposed to more than 5 parts per billion will complain ( World
Health Organisation : WHO (2000) as well as volatile organic acids. Air quality guidelines for Europe, 2nd ed. Copenhagen, World Health Organization
Regional Publications, European Series).
Monitoring of the landfill gas itself can be used diagnostically. When there is concern regarding the possibility of an ongoing subsurface oxidation event, or
landfill fire, the presence in the landfill gas of compounds that are more stable at the high temperatures of such an event ( above 500 deg C ) can be
evidence for such a process occurring. The presence of propene, which can be formed from propane at temperatures above several hundred degrees C,
supports high temperatures. The presence of elevated concentrations of dihydrogen (H2) in the landfill gas is also consistent with elevated temperatures at
remote locations some distance from the gas-extraction well. The presence of H2 is consistent with thermal inactivation of CO2-reducing microbes, which
normally combine all H2 produced by fermentation of organic acids with CO2 to form methane (CH4). H2-producing microbes are less temperature-
sensitive than CO2-reducing microbes so that elevated temperatures can inactivate them and their recovery can be delayed over the H2-producers. This
can result in H2 production without the (usually )corresponding consumption, resulting in elevated concentrations of H2 in the landfill gas (up to >25%[v:v]

at some sites). Thermal deactivation of CO2-reducing microbes has been used to produce CO2 (rather than methane) frommunicipal solid waste (Yu, et
al., 2002).
[edit]Types of landfill gas monitoring
A monitor may be either:
Single reading monitor, giving point readings for landfill gas composition, or a
Continuous gas monitor, that remain in boreholes and give continuous readings over time for landfill gas composition and production.
[edit]Techniques for establishing landfill gas (rather than liquid) as the source of VOC in groundwatersamples
Several techniques have been developed for evaluating whether landfill gas (rather than leachate) is the source of volatile organic compounds (VOCs) in
groundwater samples.[1] Leachate water frequently has elevated levels of tritium compared to background groundwater and a leachate (water) release
would increase tritium levels in affected groundwater samples, while landfill gas has been shown not to do so. Although landfill gas components can react
with minerals and alter inorganic constituents present in groundwater samples such as alkalinity, calcium, and magnesium, a frequent major leachate
constituent, chloride, can be used to evaluate whether leachate has affected the sample.
Highly soluble VOCs, such as MtBE, diethyl ether, and tetrahydrofuran, are evidence of leachate effects, since they are too water-soluble to migrate in
landfill gas. The presence of highly soluble semi-volatile organic compounds, such as phenols, are also consistent with leachate effects on the sample.
Elevated concentrations of dissolved CO2 have been shown to be a symptom of landfill gas effects--this is because not all of the CO2 in landfill gas reacts
immediately with aquifer minerals, while such reactions are complete in leachate due to the presence of soils as daily cover in the waste. To assess
whether VOCs are partitioning into groundwater in a specific location, such as a monitoring well, the headspace gas and dissolved VOC concentrations
can be compared. If the Henry's Law constant multiplied by the water concentration is significantly less than the measured gas concentration, the data are
consistent with VOCs partitioning from landfill gas into the groundwater.
Typical landfill gas composition[2] %(dry volume basis)a

Methane, CH4 45-60
Carbon dioxide, CO2 40-60
Nitrogen, N2 2-5
Oxygen, O2 0.1-1.0
Sulphides, disulphides, mercaptans etc. 0-1.0
Ammonia, NH3 0.1-1.0
hydrogen, H2 0-0.2
carbon monoxide, CO 0-0.2
Trace constituents 0.01-0.6
aExact percentage distribution will vary with the age of the landfill
[edit]Typical problems
Most landfills are highly heterogeneous environments, both physically and biologically, and the gas composition sampled can vary radically within a few
metres. [3]

Near-surface monitoring is additionally vulnerable over short time periods to weather effects. As the atmospheric pressure rises, the rate of gas escape
from the landfill is reduced and may even become negative, with the possibility of oxygen incursion into the upper layers (an analogous effect occurs in
the composition of water at the mouth of an estuary as the sea tide rises and falls). Differential diffusion and gas solubility (varying strongly
with temperature and pH) further complicates this behaviour. Tunnelling effects, whereby large items (including monitoring boreholes) create bypass
shortcuts into the interior of the landfill, can extend this variability to greater depths in localised zones. Such phenomena can give the impression that
bioactivity and gas composition is changing much more radically and rapidly than is actually the case, and any series of isolated time-point measurements
is likely to be unreliable due to this variance.
Landfill gas often contains significant corrosives such as hydrogen sulphide and sulphur dioxide, and these will shorten the lifespan of most monitoring
equipment as they react with moisture (this is also a problem for landfill gas utilization schemes).
Physical settlement as waste decomposes makes borehole monitoring systems vulnerable to breakage as the weight of the material shifts and fractures
equipment.
[edit]See also
Anaerobic digestion
Biogas
Biodegradability
Landfill gas migration
Landfill gas utilization
[edit]References
1. ^ Kerfoot, H.B., Chapter 3.5 In Christensen, T. H., Cossu, R. & Stegmann, R. (1999)Landfilling of waste: Biogas
2. ^ George Tchobanoglous, et al(1993). "Integrated Solid Waste Management - Engineering Principles and Management Issues", MCGraw-Hill
International Editions. Pg.382
3. ^ DoE Report CWM039A+B/92 Young, A. (1992)

[edit]External links
California Integrated Waste Management Board policy
MSW/LFGFrom Wikipedia, the free encyclopedia
MSW/LFG stands for municipal solid waste and landfill gas. The United States Environmental Protection Agency has several standards required
for MSW landfills to help ensure public and environmental safety.
[edit]See also
List of waste management acronyms
[edit]External links

US EPA Waste
US EPA
This waste-related article is a stub. You can help Wikipedia by expanding it.
2.1.8-Natural gas

Natural gasFrom Wikipedia, the free encyclopedia
For other uses, see Natural gas (disambiguation).
Natural gas extraction by countries in cubic meters per year.
Natural gas is a naturally occurring hydrocarbon gas mixture consisting primarily of methane, with other hydrocarbons, carbon
dioxide, nitrogen and hydrogen sulfide.[1] Natural gas is an important energy source to provide heating and electricity. It is also used as fuel for vehicles
and as a chemical feedstock in the manufacture of plastics and other commercially important organic chemicals.
Natural gas is found in deep underground natural rock formations or associated with other hydrocarbon reservoirs in coal beds and as methane
clathrates. Petroleum is also another resource found in proximity to and with natural gas. Most natural gas was created over time by two mechanisms:
biogenic and thermogenic. Biogenic gas is created by methanogenic organisms in marshes, bogs, landfills, and shallow sediments. Deeper in the earth, at
greater temperature and pressure, thermogenic gas is created from buried organic material.[2][3]
Before natural gas can be used as a fuel, it must undergo processing to clean the gas and remove impurities, including water, to meet the specifications of
marketable natural gas. The by-products of processing includeethane, propane, butanes, pentanes, and higher molecular weight hydrocarbons, hydrogen
sulfide (which may be converted into pure sulfur), carbon dioxide, water vapor, and sometimes helium and nitrogen.

Natural gas is often informally referred to simply as gas, especially when compared to other energy sources such as oil or coal.
Contents
[hide]
1 Sources
o 1.1 Natural gas
o 1.2 Town gas
o 1.3 Biogas
o 1.4 Crystallized natural gas — hydrates
o 1.5 Shale gas
2 Natural gas processing
3 Depletion
4 Uses
o 4.1 Power generation
o 4.2 Domestic use
o 4.3 Transportation
o 4.4 Fertilizers
o 4.5 Aviation
o 4.6 Hydrogen
o 4.7 Other
5 Storage and transport
6 Environmental effects
o 6.1 CO2 emissions
o 6.2 Other pollutants

o 6.3 Extraction
7 Safety concerns
o 7.1 Production
o 7.2 Use
8 Energy content, statistics, and pricing
o 8.1 European Union
o 8.2 United States
o 8.3 Canada
o 8.4 Elsewhere
9 Natural gas as an asset class for institutional
investors
10 See also
11 References
[edit]Sources
See also: List of natural gas fields, List of countries by natural gas proven reserves, and List of countries by natural gas production
[edit]Natural gas

Natural gas drilling rig in Texas.
In the 19th century, natural gas was usually obtained as a by-product of producing oil, since the small, light gas carbon chains came out of solution as the
extracted fluids underwent pressure reduction from the reservoir to the surface, similar to uncapping a bottle of soda where the carbon
dioxide effervesces. Unwanted natural gas was a disposal problem in the active oil fields. If there was not a market for natural gas near the wellhead it
was virtually valueless since it had to be piped to the end user. In the 19th century and early 20th century, such unwanted gas was usually burned off at oil
fields. Today, unwanted gas (orstranded gas without a market) associated with oil extraction often is returned to the reservoir with 'injection' wells while
awaiting a possible future market or to repressurize the formation, which can enhance extraction rates from other wells. In regions with a high natural gas
demand (such as the US), pipelines are constructed when it is economically feasible to transport gas from a wellsite to an end consumer.
Another possibility is to export natural gas as a liquid. Gas-to-liquids (GTL) is a developing technology that converts stranded natural gas into synthetic
gasoline, diesel, or jet fuel through the Fischer-Tropsch process developed in Germany prior to World War II. Such fuel can be transported to users
through conventional pipelines and tankers. Proponents claim that GTL burns cleaner than comparable petroleum fuels. Major international oil companies
use sophisticated technology to produce GTL. A world-scale (140,000 barrels (22,000 m3) a day) GTL plant in Qatar went into production in 2011.

Natural gas can be "associated" (found in oil fields), or "non-associated" (isolated in natural gas fields), and is also found in coal beds (as coalbed
methane). It sometimes contains a significant amount of ethane, propane, butane, and pentane—heavier hydrocarbons removed for commercial use prior
to the methanebeing sold as a consumer fuel or chemical plant feedstock. Non-hydrocarbons such as carbon dioxide, nitrogen, helium (rarely),
and hydrogen sulfide must also be removed before the natural gas can be transported.[4]
Natural gas is commercially extracted at oil fields and natural gas fields. Gas extracted from oil wells is called casinghead gas or associated gas. The
natural gas industry is extracting an increasing quantity of gas from challenging resource types: sour gas, tight gas, shale gas, and coalbed methane.
The world's largest proven gas reserves are located in Russia, with 4.757×10¹³ m³ (1.68×10¹⁵ cubic feet). With Gazprom, Russia is frequently the world's
largest natural gas extractor. Major proven resources (in billion cubic meters) are world 175,400 (2006), Russia 47,570 (2006), Iran 26,370 (2006), Qatar
25,790 (2007), Saudi Arabia 6,568 (2006) and United Arab Emirates 5,823 (2006).
It is estimated that there are about 900 trillion cubic meters of "unconventional" gas such as shale gas, of which 180 trillion may be recoverable.[5] In turn,
many studies from MIT, Black & Veatchand the DOE -- see natural gas -- will account for a larger portion of electricity generation and heat in the future.[6]
The world's largest gas field is Qatar's offshore North Field, estimated to have 25 trillion cubic meters[7] (9.0×10¹⁴cubic feet) of gas in place—enough to
last more than 420 years[citation needed] at optimum extraction levels. The second largest natural gas field is the South Pars Gas Field in Iranian waters in
the Persian Gulf. Located next to Qatar's North Field, it has an estimated reserve of 8 to 14 trillion cubic meters[8] (2.8×10¹⁴ to 5.0×10¹⁴ cubic feet) of gas.
Because natural gas is not a pure product, as the reservoir pressure drops when non-associated gas is extracted from a field
under supercritical (pressure/temperature) conditions, the higher molecular weight components may partially condense upon isothermic depressurizing—
an effect called retrograde condensation. The liquid thus formed may get trapped as the pores of the gas reservoir get deposited. One method to deal with
this problem is to re-inject dried gas free of condensate to maintain the underground pressure and to allow re-evaporation and extraction of condensates.
More frequently, the liquid condenses at the surface, and one of the tasks of the gas plant is to collect this condensate. The resulting liquid is called
natural gas liquid (NGL) and has commercial value.
[edit]Town gasMain article: History of manufactured gas

Town gas, a synthetically produced mixture of methane and other gases, mainly the highly toxic carbon monoxide, is used in a similar way to natural gas
and can be produced by treating coalchemically. This is a historical technology, not usually economically competitive with other sources of fuel gas today.
But there are still some specific cases where it is the best option and it may be so into the future.
Most town "gashouses" located in the eastern US in the late 19th and early 20th centuries were simple by-product coke ovens which heated bituminous
coal in air-tight chambers. The gas driven off from the coal was collected and distributed through networks of pipes to residences and other buildings
where it was used for cooking and lighting. (Gas heating did not come into widespread use until the last half of the 20th century.) The coal tar (or asphalt)
that collected in the bottoms of the gashouse ovens was often used for roofing and other water-proofing purposes, and when mixed with sand and gravel
was used for paving streets.
[edit]BiogasMain article: biogas
When methane-rich gases are produced by the anaerobic decay of non-fossil organic matter (biomass), these are referred to as biogas (or natural
biogas). Sources of biogas include swamps,marshes, and landfills (see landfill gas), as well as sewage sludge and manure[9] by way of anaerobic
digesters, in addition to enteric fermentation, particularly in cattle.
Methanogenic archaea are responsible for all biological sources of methane, some in symbiotic relationships with other life forms,
including termites, ruminants, and cultivated crops. Methane released directly into the atmosphere would be considered a pollutant. However, methane in
the atmosphere is oxidized, producing carbon dioxide and water. Methane in the atmosphere has a half life of seven years, meaning that if a tonne of
methane were emitted today, 500 kilograms would have broken down to carbon dioxide and water after seven years.
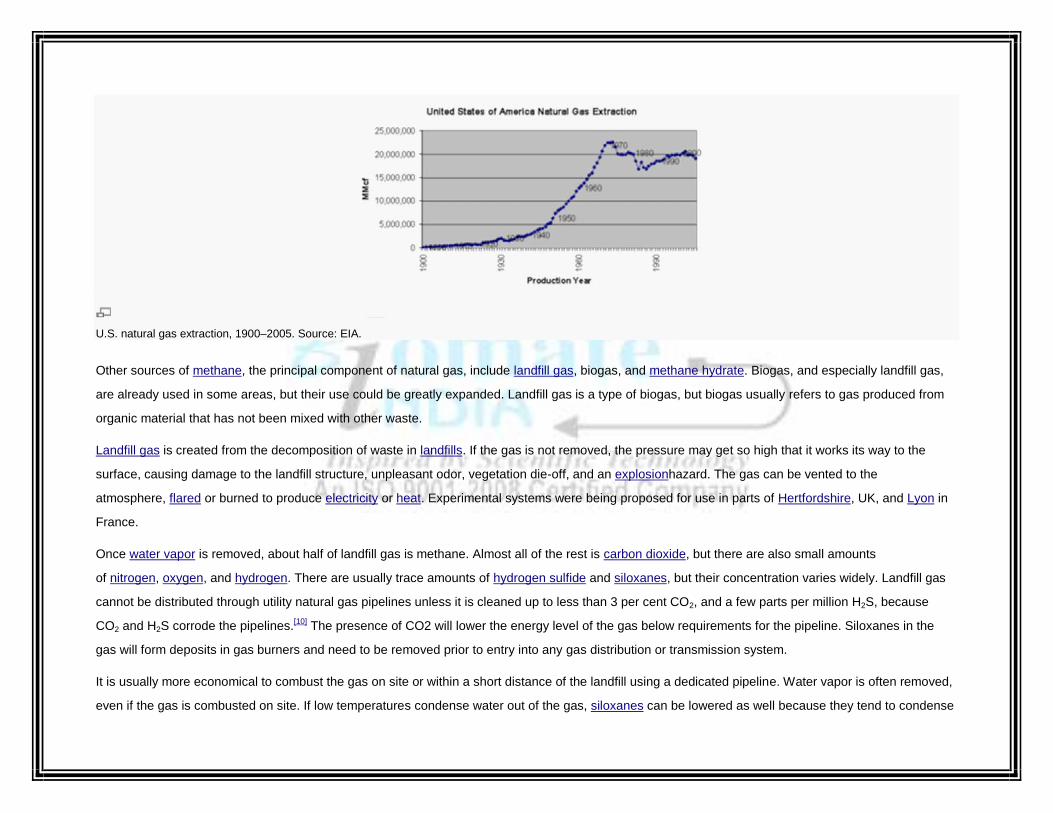
U.S. natural gas extraction, 1900–2005. Source: EIA.
Other sources of methane, the principal component of natural gas, include landfill gas, biogas, and methane hydrate. Biogas, and especially landfill gas,
are already used in some areas, but their use could be greatly expanded. Landfill gas is a type of biogas, but biogas usually refers to gas produced from
organic material that has not been mixed with other waste.
Landfill gas is created from the decomposition of waste in landfills. If the gas is not removed, the pressure may get so high that it works its way to the
surface, causing damage to the landfill structure, unpleasant odor, vegetation die-off, and an explosionhazard. The gas can be vented to the
atmosphere, flared or burned to produce electricity or heat. Experimental systems were being proposed for use in parts of Hertfordshire, UK, and Lyon in
France.
Once water vapor is removed, about half of landfill gas is methane. Almost all of the rest is carbon dioxide, but there are also small amounts
of nitrogen, oxygen, and hydrogen. There are usually trace amounts of hydrogen sulfide and siloxanes, but their concentration varies widely. Landfill gas
cannot be distributed through utility natural gas pipelines unless it is cleaned up to less than 3 per cent CO2, and a few parts per million H2S, because
CO2 and H2S corrode the pipelines.[10] The presence of CO2 will lower the energy level of the gas below requirements for the pipeline. Siloxanes in the
gas will form deposits in gas burners and need to be removed prior to entry into any gas distribution or transmission system.
It is usually more economical to combust the gas on site or within a short distance of the landfill using a dedicated pipeline. Water vapor is often removed,
even if the gas is combusted on site. If low temperatures condense water out of the gas, siloxanes can be lowered as well because they tend to condense

out with the water vapor. Other non-methane components may also be removed to meet emission standards, to prevent fouling of the equipment or for
environmental considerations. Co-firing landfill gas with natural gas improves combustion, which lowers emissions.
Gas generated in sewage treatment plants is commonly used to generate electricity. For example, the Hyperion sewage plant in Los Angeles burns 8
million cubic feet (230,000 m3) of gas per day to generate power[11] New York City utilizes gas to run equipment in the sewage plants, to generate
electricity, and in boilers.[12] Using sewage gas to make electricity is not limited to large cities. The city of Bakersfield, California, uses cogeneration at its
sewer plants.[13] California has 242 sewage wastewater treatment plants, 74 of which have installed anaerobic digesters. The total biopower generation
from the 74 plants is about 66 MW.[14]
Biogas is usually produced using agricultural waste materials, such as otherwise unusable parts of plants and manure. Biogas can also be produced by
separating organic materials from waste that otherwise goes to landfills. This method is more efficient than just capturing the landfill gas it produces. Using
materials that would otherwise generate no income, or even cost money to get rid of, improves the profitability and energy balance of biogas production.
Anaerobic lagoons produce biogas from manure, while biogas reactors can be used for manure or plant parts. Like landfill gas, biogas is mostly methane
and carbon dioxide, with small amounts of nitrogen, oxygen and hydrogen. However, with the exception of pesticides, there are usually lower levels of
contaminants.
The McMahon natural gas processing plant in Taylor, British Columbia, Canada.[15]
[edit]Crystallized natural gas — hydrates

Huge quantities of natural gas (primarily methane) exist in the form of hydrates under sediment on offshore continental shelves and on land in arctic
regions that experience permafrost, such as those in Siberia. Hydrates require a combination of high pressure and low temperature to form. However, as
of 2010 no technology has been developed yet to extract natural gas economically from hydrates.
In 2010, using current technology, the cost of extracting natural gas from crystallized natural gas is estimated to 100–200 per cent the cost of extracting
natural gas from conventional sources, and even higher from offshore deposits.[16]
[edit]Shale gas
Shale gas in the United States is rapidly increasing as a source of natural gas. Led by new applications of hydraulic fracturing technology and horizontal
drilling, development of new sources of shale gas has offset declines in production from conventional gas reservoirs, and has led to major increases in
reserves of US natural gas. Largely due to shale gas discoveries, estimated reserves of natural gas in the United States in 2008 were 35% higher than in
2006.[17] Following the success in the United States, gas operations are beginning to sprout up in other countries around the world, particularly Poland,
China, and South Africa. [18][19][20]
Shale gas was first extracted as a resource in Fredonia, NY in 1825,[21] in shallow, low-pressure fractures. Work on industrial-scale shale gas production
did not begin until the 1970s, when declining production potential from conventional gas deposits in the United States spurred the federal government to
invest in R&D and demonstration projects[22] that ultimately led to directional and horizontal drilling, microseismic imaging, and massive hydraulic
fracturing. Up until the public and private R&D and demonstration projects of the 1970s and 1980s, drilling in shale was not considered to be commercially
viable.
Early American federal government investments in shale gas began with the Eastern Gas Shales Project in 1976 and the annual FERC-approved
research budget of the Gas Research Institute. The Department of Energy later partnered with private gas companies to complete the first successful air-
drilled multi-fracture horizontal well in shale in 1986. The federal government further incentivized drilling in shale via the Section 29 tax credit for
unconventional gas from 1980-2000. Microseismic imaging, a crucial input to both hydraulic fracturing in shale and offshore oil drilling, originated from
seismic research at Sandia National Laboratories. In 1991 the Department of Energy subsidized Texas gas company Mitchell Energy's first horizontal drill
in the Barnett Shale in north Texas.[23]
Mitchell Energy utilized all these component technologies and techniques to achieve the first economical shale fracture in 1998 using an innovative
process called slick-water fracturing.[24][25]Since then, natural gas from shale has been the fastest growing contributor to total primary energy (TPE) in the

United States, and has led many other countries to pursue shale deposits. According to the IEA, the economical extraction of shale gas more than
doubles the projected production potential of natural gas, from 125 years to over 250 years.[26]
[edit]Natural gas processing
Main article: Natural gas processing
The image below is a schematic block flow diagram of a typical natural gas processing plant. It shows the various unit processes used to convert raw
natural gas into sales gas pipelined to the end user markets.
The block flow diagram also shows how processing of the raw natural gas yields byproduct sulfur, byproduct ethane, and natural gas liquids (NGL)
propane, butanes and natural gasoline (denoted as pentanes +).[27][28][29][30][31]

Schematic flow diagram of a typical natural gas processing plant.
[edit]Depletion
See main article, Gas depletion

[edit]Uses
[edit]Power generation
Natural gas is a major source of electricity generation through the use of cogeneration, gas turbines and steam turbines. Natural gas is also well suited for
a combined use in association withrenewable energy sources such as wind or solar and for alimenting peak-load power stations functioning in tandem
with hydroelectric plants.[32] Most grid peaking power plants and some off-gridengine-generators use natural gas. Particularly high efficiencies can be
achieved through combining gas turbines with a steam turbine in combined cycle mode. Natural gas burns more cleanly than other hydrocarbon fuels,
such as oil and coal, and produces less carbon dioxide per unit of energy released. For an equivalent amount of heat, burning natural gas produces about
30 per cent less carbon dioxide than burning petroleum and about 45 per cent less than burning coal.[33] [34] Coal-fired electric power generation emits
around 2,000 pounds of carbon dioxide for every megawatt hour generated, which is almost double the carbon dioxide released by a natural gas-fired
electric plant per megawatt hour generated. Because of this higher carbon efficiency of natural gas generation, as the fuel mix in the United States has
changed to reduce coal and increase natural gas generation, carbon dioxide emissions have unexpectedly fallen. Those measured in the first quarter of
2012 were the lowest of any recorded for the first quarter of any year since 1992.[35]
Combined cycle power generation using natural gas is currently the cleanest available source of power using hydrocarbon fuels, and this technology is
widely and increasingly used as natural gas can be obtained at increasingly reasonable costs. Fuel cell technology may eventually provide cleaner options
for converting natural gas into electricity, but as yet it is not price-competitive. Locally produced electricity and heat using natural gas powered Combined
Heat and Power plant (CHP or Cogeneration plant) is considered energy efficient and a rapid way to cut carbon emissions.[36]
[edit]Domestic use
The examples and perspective in this article deal primarily with the United States and do not represent a worldwide view ofthe subject. Please improve this article and discuss the issue on the talk page. (December 2010)
Natural gas dispensed from a simple stovetop can generate heat in excess of 2000°F (1093°C) making it a powerful domestic cooking and heating
fuel.[37] In much of the developed world it is supplied to homes via pipes where it is used for many purposes including natural gas-powered ranges and
ovens, natural gas-heated clothes dryers, heating/cooling, and central heating. Home or other building heating may include boilers, furnaces, and water
heaters. Compressed natural gas (CNG) is used in rural homes without connections to piped-in public utility services, or with portable grills.[citation

needed] Natural gas is also supplied by independent natural gas suppliers through Natural Gas Choice programs throughout the United States. However,
due to CNG being less economical than LPG, LPG (propane) is the dominant source of rural gas.
A Washington, D.C. Metrobus, which runs on natural gas.
[edit]Transportation
CNG is a cleaner alternative to other automobile fuels such as gasoline (petrol) and diesel. As of 2012 there were 16.4 million natural gas
vehiclesworldwide, led by Pakistan (3.1 million), Iran (2.9 million), Argentina (2.1 million), Brazil (1.7 million), India (1.5 million), and China (1.2
million).[38][39][40]The energy efficiency is generally equal to that of gasoline engines, but lower compared with modern diesel engines. Gasoline/petrol
vehicles converted to run on natural gas suffer because of the low compression ratio of their engines, resulting in a cropping of delivered power while
running on natural gas (10%–15%). CNG-specific engines, however, use a higher compression ratio due to this fuel's higher octane number of 120–
130.[41] [42]
[edit]Fertilizers
Natural gas is a major feedstock for the production of ammonia, via the Haber process, for use in fertilizer production.
[edit]Aviation
Russian aircraft manufacturer Tupolev is currently running a development program to produce LNG- and hydrogen-powered aircraft.[43] The program has
been running since the mid-1970s, and seeks to develop LNG and hydrogen variants of the Tu-204 and Tu-334 passenger aircraft, and also the Tu-

330 cargo aircraft. It claims that at current market prices, an LNG-powered aircraft would cost 5,000 roubles (~ $218/ £112) less to operate per ton,
roughly equivalent to 60 per cent, with considerable reductions to carbon monoxide,hydrocarbon and nitrogen oxide emissions.
The advantages of liquid methane as a jet engine fuel are that it has more specific energy than the standard kerosene mixes do and that its low
temperature can help cool the air which the engine compresses for greater volumetric efficiency, in effect replacing an intercooler. Alternatively, it can be
used to lower the temperature of the exhaust.
[edit]Hydrogen
Natural gas can be used to produce hydrogen, with one common method being the hydrogen reformer. Hydrogen has many applications: it is a primary
feedstock for the chemical industry, a hydrogenating agent, an important commodity for oil refineries, and the fuel source in hydrogen vehicles.
[edit]Other
Natural gas is also used in the manufacture of fabrics, glass, steel, plastics, paint, and other products.
[edit]Storage and transport
Polyethylene plastic main being placed in a trench.

Because of its low density, it is not easy to store natural gas or transport by vehicle. Natural gas pipelines are impractical across oceans. Many existing
pipelines in America are close to reaching their capacity, prompting some politicians representing northern states to speak of potential shortages.
In Europe, the gas pipeline network is already dense in the West.[44] New pipelines are planned or under construction in Eastern Europe and between gas
fields in Russia,Near East and Northern Africa and Western Europe. See also List of natural gas pipelines.
LNG carriers transport liquefied natural gas (LNG) across oceans, while tank trucks can carry liquefied or compressed natural gas (CNG) over shorter
distances. Sea transport using CNG carrier ships that are now under development may be competitive with LNG transport in specific conditions.
Gas is turned into liquid at a liquefaction plant, and is returned to gas form at regasification plant at the terminal. Shipborne regasification equipment is
also used. LNG is the preferred form for long distance, high volume transportation of natural gas, whereas pipeline is preferred for transport for distances
up to 4,000 km (2,485 mi) over land and approximately half that distance offshore.
CNG is transported at high pressure, typically above 200 bars. Compressors and decompression equipment are less capital intensive and may be
economical in smaller unit sizes than liquefaction/regasification plants. Natural gas trucks and carriers may transport natural gas directly to end-users, or
to distribution points such as pipelines.
Peoples Gas Manlove Field natural gas storage area in Newcomb Township, Champaign County, Illinois. In the foreground (left) is one of the numerous wells for the
underground storage area, with an LNG plant, and above ground storage tanks are in the background (right).
In the past, the natural gas which was recovered in the course of recovering petroleum could not be profitably sold, and was simply burned at the oil field
in a process known as flaring. Flaring is now illegal in many countries.[45]Additionally, companies now recognize that gas may be sold to consumers in the

form of LNG or CNG, or through other transportation methods. The gas is now re-injected into the formation for later recovery. The re-injection also assists
oil pumping by keeping underground pressures higher.
A "master gas system" was invented in Saudi Arabia in the late 1970s, ending any necessity for flaring. Satellite observation, however, shows that
flaring[46] and venting[47] are still practiced in some gas-extracting countries.
Natural gas is used to generate electricity and heat for desalination. Similarly, some landfills that also discharge methane gases have been set up to
capture the methane and generate electricity.
Natural gas is often stored underground inside depleted gas reservoirs from previous gas wells, salt domes, or in tanks as liquefied natural gas. The gas is
injected in a time of low demand and extracted when demand picks up. Storage nearby end users helps to meet volatile demands, but such storage may
not always be practicable.
With 15 countries accounting for 84 per cent of the worldwide extraction, access to natural gas has become an important issue in international politics, and
countries vie for control of pipelines.[48] In the first decade of the 21st century, Gazprom, the state-owned energy company in Russia, engaged in disputes
with Ukraine and Belarus over the price of natural gas, which have created concerns that gas deliveries to parts of Europe could be cut off for political
reasons.[49]
Floating Liquefied Natural Gas (FLNG) is an innovative technology designed to enable the development of offshore gas resources that would otherwise
remain untapped because due to environmental or economic factors it is nonviable to develop them via a land-based LNG operation. FLNG technology
also provides a number of environmental and economic advantages:
Environmental – Because all processing is done at the gas field, there is no requirement for long pipelines to shore, compression units to pump
the gas to shore, dredging and jetty construction, and onshore construction of an LNG processing plant, which significantly reduces the environmental
footprint.[50] Avoiding construction also helps preserve marine and coastal environments. In addition, environmental disturbance will be minimised
during decommissioning because the facility can easily be disconnected and removed before being refurbished and re-deployed elsewhere.

Economic – Where pumping gas to shore can be prohibitively expensive, FLNG makes development economically viable. As a result, it will open
up new business opportunities for countries to develop offshore gas fields that would otherwise remain stranded, such as those offshore East
Africa.[51]
Many gas and oil companies are considering the economic and environmental benefits of Floating Liquefied Natural Gas (FLNG). However, for the time
being, the only FLNG facility now in development is being built by Shell,[52] due for completion around 2017.[53]
[edit]Environmental effects
See also: Environmental issues with energy
[edit]CO2 emissions
Natural gas is often described as the cleanest fossil fuel, producing less carbon dioxide per joule delivered than either coal or oil[33] and far fewer pollutants
than other hydrocarbon fuels[citation needed]. However, in absolute terms, it comprises a substantial percentage of human carbon emissions, and this
contribution is projected to grow. According to the IPCC Fourth Assessment Report (Working Group III Report, chapter 4), in 2004, natural gas produced
about 5.3 billion tons a year of CO2 emissions, while coal and oil produced 10.6 and 10.2 billion tons respectively (figure 4.4). According to an updated
version of the SRES B2 emissions scenario by 2030 natural gas would be the source of 11 billion tons a year, with coal and oil now 8.4 and 17.2 billion
respectively because demand is increasing 1.9 percent a year.[54] (Total global emissions for 2004 were estimated at over 27,200 million tons.)
In addition, natural gas itself is a greenhouse gas more potent than carbon dioxide. Although natural gas is released into the atmosphere in much smaller
quantities, methane is oxidized in the atmosphere into CO2, and hence natural gas affects the atmosphere for approximately 12 years, compared to CO2,
which is already oxidized, and has effect for 100 to 500 years. Natural gas is composed mainly of methane, which has a radiative forcing twenty times
greater than carbon dioxide. Based on such composition, a ton of methane in the atmosphere traps as much radiation as 20 tons of carbon dioxide;
however, it remains in the atmosphere for 8–40 times less time. Carbon dioxide still receives the lion's share of attention concerning greenhouse gases
because it is released in much larger amounts. Still, it is inevitable when natural gas is used on a large scale that some of it will leak into the atmosphere.
(Coal methane not captured by coal bed methane extraction techniques is simply lost into the atmosphere. Current estimates by the EPA place global
emissions of methane at 3 trillion cubic feet (85 km3) annually,[55] or 3.2 per cent of global production.[56] Direct emissions of methane represented 14.3 per
cent of all global anthropogenic greenhouse gas emissions in 2004.[57]

[edit]Other pollutants
Natural gas produces far lower amounts of sulfur dioxide and nitrous oxides than any other hydrocarbon fuel (fossil fuels).[58] Carbon dioxide produced is
117,000 ppm vs 208,000 for burning coal.Carbon monoxide produced is 40 ppm vs 208 for burning coal[citation needed]. Nitrogen oxides produced is 92 ppm
vs 457 for burning coal. Sulfur dioxide is 1 ppm vs 2,591 for burning coal. Mercuryis 0 vs .016 for burning coal.[59] Particulates are also a major contribution
to global warming. Natural gas has 7ppm vs coal's 2,744ppm.[60] Natural gas also has Radon, from 5 to 200,000Becquerels per cubic meter.[61]
[edit]Extraction
According to Business Week, scientists at the National Oceanic and Atmospheric Administration (NOAA), which conducts much of the climate science of
the United States, then surprised nearly everyone in February when they revealed that air samples from an area of Colorado with a lot of wells contained
twice the amount of methane the United States Environmental Protection Agency(EPA) estimated came from that production method.[62]
[edit]Safety concerns
A pipeline odorant injection station
[edit]Production
In mines, where methane seeping from rock formations has no odor, sensors are used, and mining apparatus such as the Davy lamp has been
specifically developed to avoid ignition sources.

Some gas fields yield sour gas containing hydrogen sulfide (H2S). This untreated gas is toxic. Amine gas treating, an industrial scale process which
removes acidic gaseous components, is often used to remove hydrogen sulfide from natural gas.[63]
Extraction of natural gas (or oil) leads to decrease in pressure in the reservoir. Such decrease in pressure in turn may result in subsidence, sinking of the
ground above. Subsidence may affect ecosystems, waterways, sewer and water supply systems, foundations, and so on.
Another ecosystem effect results from the noise of the process. This can change the composition of animal life in the area, and have consequences for
plants as well in that animals disperse seeds and pollen.
Releasing the gas from low-permeability reservoirs is accomplished by a process called hydraulic fracturing or "hydrofracking". To allow the natural gas to
flow out of the shale, oil operators force 1 to 9 million US gallons (34,000 m3) of water mixed with a variety of chemicals through the wellbore casing into
the shale. The high pressure water breaks up or "fracks" the shale, which releases the trapped gas. Sand is added to the water as a proppant to keep the
fractures in the shale open, thus enabling the gas to flow into the casing and then to the surface. The chemicals are added to the frack fluid to reduce
friction and combat corrosion. During the extracting life of a gas well, other low concentrations of other chemical substances may be used, such as
biocides to eliminate fouling, scale and corrosion inhibitors, oxygen scavengers to remove a source of corrosion, and acids to clean the perforations in the
pipe.
Dealing with fracking fluid can be a challenge. Along with the gas, 30 per cent to 70 per cent of the chemically laced frack fluid, or flow back, returns to the
surface. Additionally, a significant amount of salt and other minerals, once a part of the rock layers that were under prehistoric seas, may be incorporated
in the flow back as they dissolve in the frack fluid.
[edit]Use
In order to assist in detecting leaks, a minute amount of odorant is added to the otherwise colorless and almost odorless gas used by consumers. The
odor has been compared to the smell of rotten eggs, due to the added tert-Butylthiol (t-butyl mercaptan). Sometimes a related compound, thiophane may
be used in the mixture. Situations in which an odorant that is added to natural gas can be detected by analytical instrumentation, but cannot be properly
detected by an observer with a normal sense of smell, have occurred in the natural gas industry. This is caused by odor masking, when one odorant
overpowers the sensation of another. As of 2011, the industry is conducting research on the causes of odor masking.[64]

Gas network emergency vehicle responding to a major fire in Kiev, Ukraine
Explosions caused by natural gas leaks occur a few times each year. Individual homes, small businesses and other structures are most frequently
affected when an internal leak builds up gas inside the structure. Frequently, the blast will be enough to significantly damage a building but leave it
standing. In these cases, the people inside tend to have minor to moderate injuries. Occasionally, the gas can collect in high enough quantities to cause a
deadly explosion, disintegrating one or more buildings in the process. The gas usually dissipates readily outdoors, but can sometimes collect in dangerous
quantities if flow rates are high enough. However, considering the tens of millions of structures that use the fuel, the individual risk of using natural gas is
very low.
Natural gas heating systems are a minor source of carbon monoxide deaths in the United States. According to the US Consumer Product Safety
Commission (2008), 56 per cent of unintentional deaths from non-fire CO poisoning were associated with engine-driven tools like gas-powered generators
and lawn mowers. Natural gas heating systems accounted for 4 per cent of these deaths. Improvements in natural gas furnace designs have greatly
reduced CO poisoning concerns. Detectors are also available that warn of carbon monoxide and/or explosive gas (methane, propane, etc.).
[edit]Energy content, statistics, and pricing
Main article: Natural gas prices
See also: Billion cubic metres of natural gas
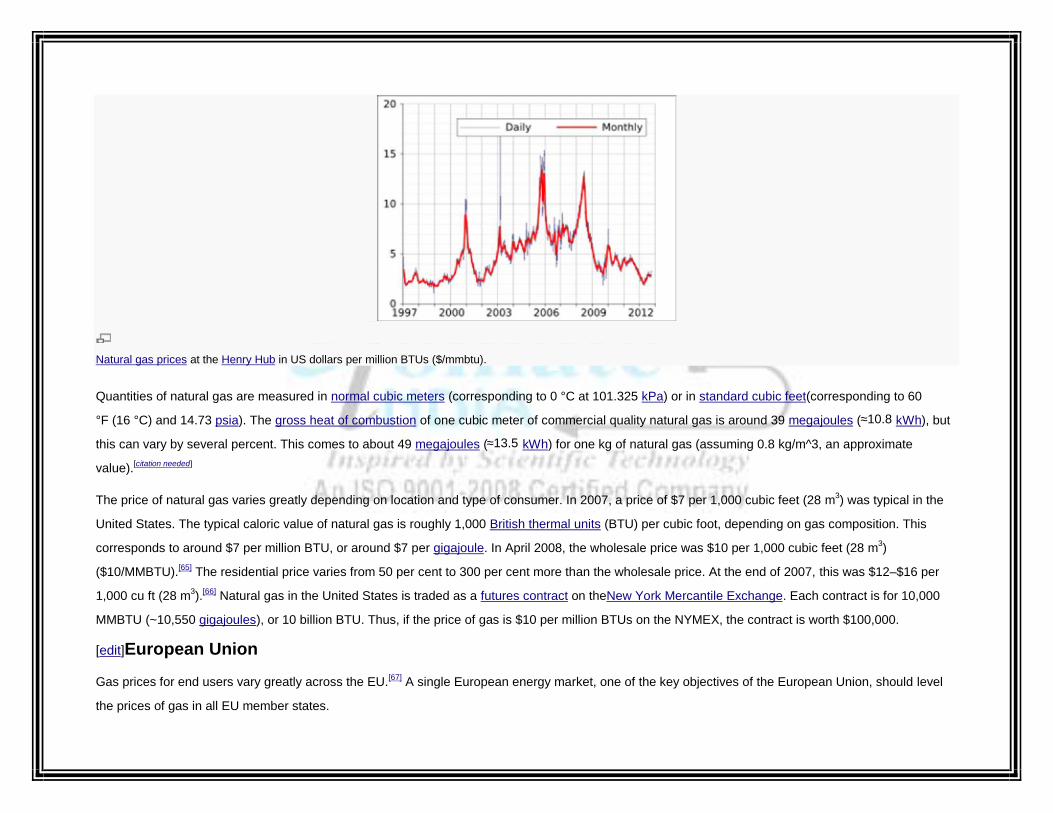
Natural gas prices at the Henry Hub in US dollars per million BTUs ($/mmbtu).
Quantities of natural gas are measured in normal cubic meters (corresponding to 0 °C at 101.325 kPa) or in standard cubic feet(corresponding to 60
°F (16 °C) and 14.73 psia). The gross heat of combustion of one cubic meter of commercial quality natural gas is around 39 megajoules (≈10.8 kWh), but
this can vary by several percent. This comes to about 49 megajoules (≈13.5 kWh) for one kg of natural gas (assuming 0.8 kg/m^3, an approximate
value).[citation needed]
The price of natural gas varies greatly depending on location and type of consumer. In 2007, a price of $7 per 1,000 cubic feet (28 m3) was typical in the
United States. The typical caloric value of natural gas is roughly 1,000 British thermal units (BTU) per cubic foot, depending on gas composition. This
corresponds to around $7 per million BTU, or around $7 per gigajoule. In April 2008, the wholesale price was $10 per 1,000 cubic feet (28 m3)
($10/MMBTU).[65] The residential price varies from 50 per cent to 300 per cent more than the wholesale price. At the end of 2007, this was $12–$16 per
1,000 cu ft (28 m3).[66] Natural gas in the United States is traded as a futures contract on theNew York Mercantile Exchange. Each contract is for 10,000
MMBTU (~10,550 gigajoules), or 10 billion BTU. Thus, if the price of gas is $10 per million BTUs on the NYMEX, the contract is worth $100,000.
[edit]European Union
Gas prices for end users vary greatly across the EU.[67] A single European energy market, one of the key objectives of the European Union, should level
the prices of gas in all EU member states.

[edit]United States
U.S. Natural Gas Marketed Production (cubic feet) 1900 to 2011 US EIA
In US units, one standard cubic foot of natural gas produces around 1,028 British thermal units (BTU). The actual heating value when the water formed
does not condense is the net heat of combustion and can be as much as 10 per cent less.[68]
In the United States, retail sales are often in units of therms (th); 1 therm = 100,000 BTU. Gas meters measure the volume of gas used, and this is
converted to therms by multiplying the volume by the energy content of the gas used during that period, which varies slightly over time. Wholesale
transactions are generally done in decatherms (Dth), or in thousand decatherms (MDth), or in million decatherms (MMDth). A million decatherms is
roughly a billion cubic feet of natural gas. Gas sales to domestic consumers may be in units of 100 standard cubic feet (Ccf).
[edit]Canada
Canada uses metric measure for internal trade of petrochemical products. Consequently, natural gas is sold by the Gigajoule, a measure approximately
equal to 1/2 of a barrel (250lbs) of oil, or 1 million BTUs, or 1000 cu ft of gas, or 28cu metres of gas.
[edit]Elsewhere
In the rest of the world, natural gas is sold in Gigajoule retail units. LNG (liquefied natural gas) and LPG (liquefied petroleum gas) are traded in metric tons
or mmBTU as spot deliveries. Long term natural gas distribution contracts are signed in cubic metres, and LNG contracts are in metric tonnes (1,000kg).

The LNG and LPG is transported by specialized transport ships, as the gas is liquified at cryogenic temperatures. The specification of each LNG/LPG
cargo will usually contain the energy content, but this information is in general not available to the public.
In the Russian Federation, Gazprom sold approximately 250 billion cubic metres of natural gas in 2008.
[edit]Natural gas as an asset class for institutional investors
Research conducted by the World Pensions Council (WPC) suggests that large US and Canadian pension funds
and Asian and MENA area SWF investors have become particularly active in the fields of natural gas and natural gas infrastructure, a trend started in
2005 by the formation of Scotia Gas Networks in the UK by OMERS and Ontario Teachers' Pension Plan.[32]
[edit]See also
Sustainable development portal
Energy portal
Associated petroleum gas
Drip gas
Energy development
Gas oil ratio
Giant oil and gas fields
Hydraulic fracturing
Natural gas by country
Peak gas
Renewable natural gas
Shale gas
World energy resources and consumption

[edit]References
1. ^ "composition of natural gas". Naturalgas.org. Retrieved 2012-07-14.
2. ^ US Geological Survey, Organic origins of petroleum
3. ^ US Energy Information Administration
4. ^ "Natural gas overview". Naturalgas.org. Retrieved 2011-02-06.
5. ^ "Wonderfuel: Welcome to the age of unconventional gas" by Helen Knight, New Scientist, 12 June 2010, pp. 44–7.
6. ^ Michael Kanellos, Greentechmedia. "In Natural Gas, U.S. Will Move From Abundance to Imports". 9 June 2011.
7. ^ "Background note: Qatar". State.gov. 2010-09-22. Retrieved 2011-02-06.
8. ^ "Pars Special Economic Energy Zone". Pars Special Economic Energy Zone. Retrieved 2007-07-17.
9. ^ "Manure Management and Air Quality at the University of Minnesota". Manure.umn.edu. Retrieved 2011-02-06.
10. ^ "Interstate Natural Gas--Quality Specifications Interchangeability White Paper With Exhibits" (PDF). Retrieved 2011-02-06.
11. ^ "LA Sewers". LA Sewers. Retrieved 2011-02-06.
12. ^ "WastewaterInsides-05" (PDF). Retrieved 2011-02-06.
13. ^ "Bakersfield Wastewater Treatment Plant 3". Parsons.com. 2009-12-05. Retrieved 2011-02-06.
14. ^ http://www.energy.ca.gov/2010publications/CEC-500-2010-007/CEC-500-2010-007.PDF
15. ^ http://www.naturalgas.org/images/McMahon-Plnt.jpg onhttp://www.naturalgas.org/naturalgas/processing_ng.asp
16. ^ By Steve Hargreaves, staff writer (2010-03-09). "Fortune Magazine – Frozen Natural Gas in Indian Ocean some gas can also lead to death".
Money.cnn.com. Retrieved 2011-02-06.
17. ^ Jad Mouawad, "Estimate places natural gas reserves 35% higher,", New York Times, 17 June 2009, accessed 25 October 2009.
18. ^ Financial Times (2012). "Poland Seeks to Boost Shale Gas Industry". Retrieved 2012-10-18.
19. ^ National Geographic (2012). "China Drills Into Shale Gas, Targeting Huge Reserves Amid Challenges". Retrieved 2012-10-18.
20. ^ Bloomberg (2012). "South Africa Allows Exploration of Shale Gas Resources". Retrieved 2012-10-18.
21. ^ "Name the gas industry birthplace: Fredonia, N.Y.?"

22. ^ "Proceedings from the 2nd Annual Methane Recovery from Coalbeds Symposium"
23. ^ Associated Press (2012). "Fracking Developed With Decades of Government Investment". Retrieved 2012-10-18.
24. ^ Miller, Rich; Loder, Asjylyn; Polson, Jim (6 February 2012)."Americans Gaining Energy Independence". Bloomberg. Retrieved 1 March 2012.
25. ^ The Breakthrough Institute. Interview with Dan Steward, former Mitchell Energy Vice President. December 2011.
26. ^ International Energy Agency (IEA). "World Energy Outlook 2011: Are We Entering a Golden Age of Gas?"
27. ^ "Natural Gas Processing: The Crucial Link Between Natural Gas Production and Its Transportation to Market"(PDF). Retrieved 2011-02-06.
28. ^ "''Example Gas Plant''". Uop.com. Retrieved 2011-02-06.
29. ^ "''From Purification to Liquefaction Gas Processing''"(PDF). Retrieved 2011-02-06.
30. ^ Feed-Gas Treatment Design for the Pearl GTL Project[dead link]
31. ^ Benefits of integrating NGL extraction and LNG liquefaction[dead link]
32. ^ a b M. Nicolas Firzli & Vincent Bazi (Q3 2012). "The Drivers of Pension & SWF Investment in Energy- Focusing on Natural Gas". Revue
Analyse Financière, volume 44, pp. 41-43 (.). Retrieved 7 July 2012.
33. ^ a b "Natural Gas and the Environment". Naturalgas.org. Retrieved 2011-02-06.
34. ^ The Energy Information Administration reports the following emissions in million metric tons of carbon dioxide:
Natural gas: 5,840
Petroleum: 10,995
Coal: 11,357
For 2005 as the official energy statistics of the US Government.[1]
35. ^ RACHEL NUWER A 20-Year Low in U.S. Carbon Emissions http://green.blogs.nytimes.com/2012/08/17/a-20-year-low-in-u-s-carbon-
emissions/ August 17, 2012
36. ^ "Understanding Combined heat and Power". Alfagy.com. Retrieved 2012-11-02.
37. ^ Zimmerman, Barry E.; Zimmerman, David J. (1995).Nature's curiosity shop. Lincolnwood (Chicago), IL: Contemporary books. p. 28. ISBN 978-
0-8092-3656-5.

38. ^ "What is CNG". accessdate=2012/10/25.
39. ^ "Natural Gas Vehicle Statistics". International Association for Natural Gas Vehicles. Retrieved 2009-10-19.
40. ^ Pike Research (2009-10-19). "Forecast: 17M Natural Gas Vehicles Worldwide by 2015". Green Car Congress. Retrieved 2009-10-19.
41. ^ Clean Engine Vehicle[dead link], Measurement and Control Laboratory
42. ^ http://www.ngvjournal.com/en/statistics/item/911-worldwide-ngv-statistics
43. ^ "PSC Tupolev – Development of Cryogenic Fuel Aircraft". Tupolev.ru. Retrieved 2011-02-06.
44. ^ Gas Infrasturcture Europe. Retrieved 18 June. 2009.
45. ^ Hyne, Norman J. (1991). Dictionary of petroleum exploration, drilling & production. pg. 190: PennWell Books. p. 625. ISBN 0-87814-352-1.
46. ^ "Satellite observation of flares in the world". Retrieved 2011-02-06.
47. ^ Satellite observation of methane in earth's atmosphere
48. ^ "The Contours of the New Cold War". Imi-online.de. Retrieved 2011-02-06.
49. ^ "Gazprom and Russian Foreign Policy". Npr.org. Retrieved 2011-02-06.
50. ^ Shell receives green light for Prelude FLNG — SEAAOC 2011
51. ^ The Floating Liquefied Natural Gas (FLNG) Market 2011-2021 - Report - Energy - visiongain
52. ^ Shell Australia upbeat on Prelude LNG; focus now turns to Timor - The Barrel
53. ^ FT.com / Companies / Oil & Gas - Shell's floating LNG plant given green light
54. ^ http://www.ipcc.ch/ipccreports/ar4-wg3.htm
55. ^ "Curbing Emissions by Sealing Gas Leaks". nytimes.com. 2009-10-15. Retrieved 2011-02-06.
56. ^ "Wolfram Alpha query: "World Natural Gas Production"". Wolframalpha.com. Retrieved 2011-02-06.
57. ^ "US EPA: Climate Economics". Epa.gov. 2006-06-28. Retrieved 2011-02-06.
58. ^ Natural Gas in Asia: History and Prospects by Mikkal Herberg (written for 2011 Pacific Energy Summit
59. ^ "Gas vs Coal". Global-greenhouse-warming.com. Retrieved 2011-02-06.
60. ^ "''Fundamentals of Physical Geography (2nd Edition)'', "Chapter 7: Introduction to the Atmosphere," (h). "The Greenhouse Effect"".
Physicalgeography.net. Retrieved 2011-02-06.

61. ^ "'Naturally Occurring Radioactive Materials'". 'World Nuclear Association'. Retrieved 2012-01-31.
62. ^ http://www.businessweek.com/articles/2012-04-18/new-epa-rules-could-prevent-fracking-backlash
63. ^ "Processing Natural Gas". NaturalGas.org. Retrieved 2011-02-06.
64. ^ "Findings and Recommendations From the Joint NIST—AGA Workshop on Odor Masking". Nancy Rawson, Ali Quraishi, Thomas J. Bruno.
Journal of Research of the National Institute of Standards and Technology, Vol. 116, No. 6, Pgs. 839-848. Nov-Dec 2011.
65. ^ James L. Williams (1998-10-02). "Graph of Natural Gas Futures Prices – NYMEX". Wtrg.com. Retrieved 2011-02-06.
66. ^ "U.S. Natural Gas Prices". U.S. Energy Information Agency. Retrieved 2012-08-21.
67. ^ EU Gas Prices
68. ^ Heat value definitions. WSU website. Retrieved 2008-05-19.
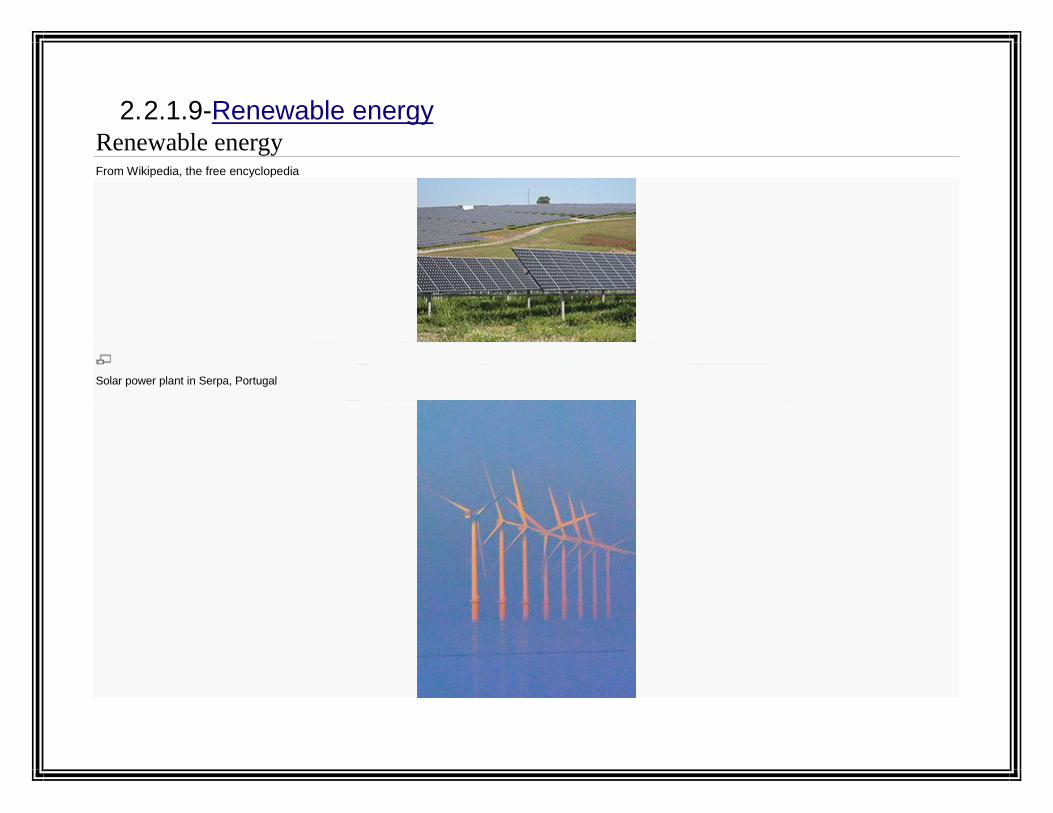
2.2.1.9-Renewable energyRenewable energyFrom Wikipedia, the free encyclopedia
Solar power plant in Serpa, Portugal

Burbo Bank Offshore Wind Farm, at the entrance to the River Mersey in North West England.
In 2010 renewable energy accounted for 16.7% of total energy consumption. Biomass heat accounted for 11.4%, and hydropower3.3%.
Renewable energy
Biofuel
Biomass
Geothermal
Hydroelectr
icity
Solar
energy
Tidal power
Wave
power
Wind

power
Topics by country
V
T
E
Renewable energy is energy that comes from natural resources such as sunlight, wind, rain, tides, waves and geothermal heat. About 16% of
global final energy consumption comes from renewable resources, with 10% of all energy from traditional biomass, mainly used for heating, and
3.4% fromhydroelectricity. New renewables (small hydro, modern biomass, wind, solar, geothermal, and biofuels) accounted for another 3% and
are growing very rapidly.[1] The share of renewables in electricity generation is around 19%, with 16% of electricity coming from hydroelectricity
and 3% from new renewables.[1]
The use of wind power is increasing at an annual rate of 20%, with a worldwide installed capacity of 238,000 megawatts (MW) at the end of
2011,[2][3][4]and is widely used in Europe, Asia, and the United States.[5] Since 2004, photovoltaics passed wind as the fastest growing energy
source, and since 2007 has more than doubled every two years. At the end of 2011 the photovoltaic (PV) capacity worldwide was 67,000 MW, and
PV power stations are popular in Germany and Italy.[6] Solar thermal power stations operate in the USA and Spain, and the largest of these is the
354 MW SEGS power plant in the Mojave Desert.[7] The world's largest geothermal power installation is the Geysers in California, with a rated
capacity of 750 MW. Brazil has one of the largest renewable energy programs in the world, involving production of ethanol fuel from sugarcane,
and ethanol now provides 18% of the country's automotive fuel.[8] Ethanol fuel is also widely available in the USA.
While many renewable energy projects are large-scale, renewable technologies are also suited to rural and remote areas, where energy is often
crucial in human development.[9] As of 2011, small solar PV systems provide electricity to a few million households, and micro-hydro configured
into mini-grids serves many more. Over 44 million households use biogas made in household-scale digesters for lighting and/or cooking, and more
than 166 million households rely on a new generation of more-efficient biomass cookstoves.[10] United Nations' Secretary-General Ban Ki-

moon has said that renewable energy has the ability to lift the poorest nations to new levels of prosperity.[11] Carbon neutral and negative fuels can
store and transport renewable energy through existing natural gas pipelines and be used with existing transportation infrastructure, displacing
fossil fuels, and reducing greenhouse gases.
Climate change concerns, coupled with high oil prices, peak oil, and increasing government support, are driving increasing renewable energy
legislation, incentives and commercialization.[12] New government spending, regulation and policies helped the industry weather the global
financial crisis better than many other sectors.[13] According to a 2011 projection by the International Energy Agency, solar power generators may
produce most of the world’s electricity within 50 years, dramatically reducing the emissions of greenhouse gases that harm the environment.[14]
Contents
[hide]
1 Overview
2 History
3 Wind power
4 Hydropower
5 Solar energy
6 Biomass
7 Biofuel
8 Geothermal energy
9 Renewable energy commercialization
o 9.1 Growth of renewables
o 9.2 Economic trends
o 9.3 Hydroelectricity
o 9.4 Wind power development
o 9.5 Solar thermal

o 9.6 Photovoltaic power stations
o 9.7 Biofuel development
o 9.8 Geothermal development
o 9.9 Developing countries
o 9.10 Industry and policy trends
o 9.11 100% renewable energy
10 Other technologies
o 10.1 Research
o 10.2 Cellulosic ethanol
o 10.3 Ocean energy
10.3.1 Wave Power
10.3.2 Tidal Power
10.3.3 Ocean thermal energy
o 10.4 Enhanced geothermal systems
o 10.5 Experimental solar power
o 10.6 Artificial photosynthesis
o 10.7 Renewable methanol
o 10.8 Synthetic fuel
11 Renewable energy debate
12 See also
13 References
14 Bibliography
15 External links
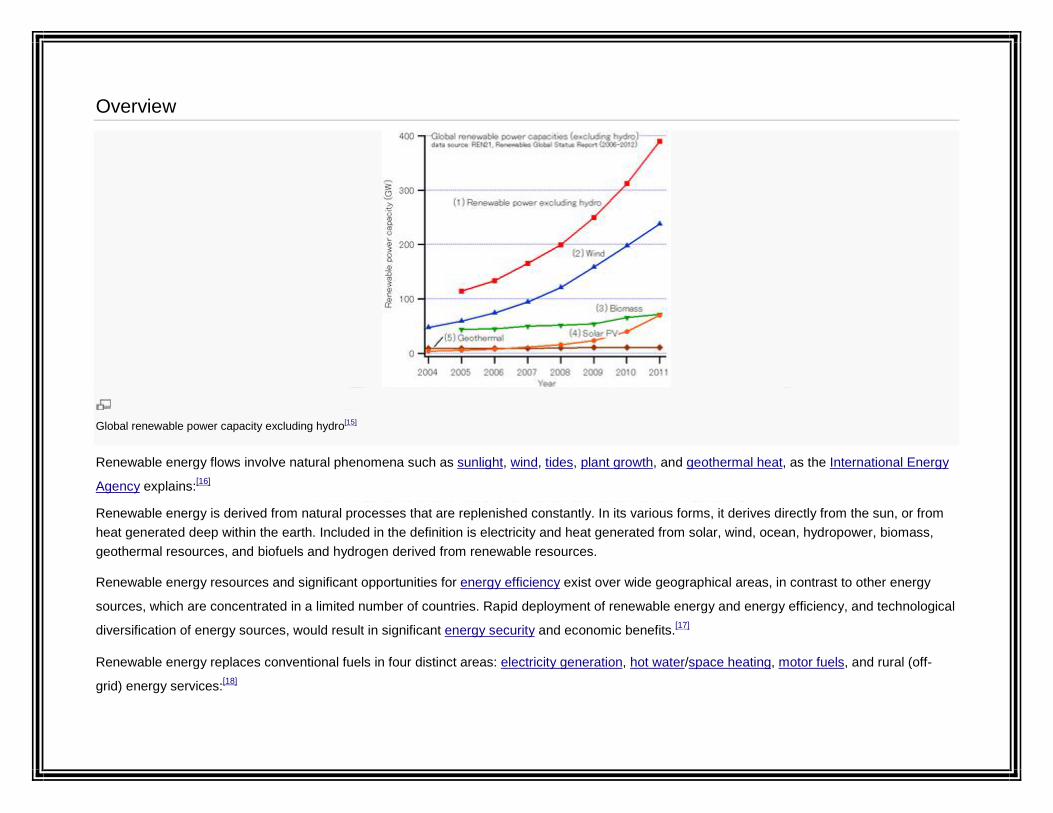
Overview
Global renewable power capacity excluding hydro[15]
Renewable energy flows involve natural phenomena such as sunlight, wind, tides, plant growth, and geothermal heat, as the International Energy
Agency explains:[16]
Renewable energy is derived from natural processes that are replenished constantly. In its various forms, it derives directly from the sun, or fromheat generated deep within the earth. Included in the definition is electricity and heat generated from solar, wind, ocean, hydropower, biomass,geothermal resources, and biofuels and hydrogen derived from renewable resources.
Renewable energy resources and significant opportunities for energy efficiency exist over wide geographical areas, in contrast to other energy
sources, which are concentrated in a limited number of countries. Rapid deployment of renewable energy and energy efficiency, and technological
diversification of energy sources, would result in significant energy security and economic benefits.[17]
Renewable energy replaces conventional fuels in four distinct areas: electricity generation, hot water/space heating, motor fuels, and rural (off-
grid) energy services:[18]

Power generation. Renewable energy provides 19% of electricity generation worldwide. Renewable power generators are spread across
many countries, and wind power alone already provides a significant share of electricity in some areas: for example, 14% in the U.S. state of
Iowa, 40% in the northern German state of Schleswig-Holstein, and 20% in Denmark. Some countries get most of their power from
renewables, including Iceland (100%), Norway (98%), Brazil (86%), Austria (62%), New Zealand (65%), and Sweden (54%).[19]
Heating. Solar hot water makes an important contribution to renewable heat in many countries, most notably in China, which now has
70% of the global total (180 GWth). Most of these systems are installed on multi-family apartment buildings and meet a portion of the hot
water needs of an estimated 50–60 million households in China. Worldwide, total installed solar water heating systems meet a portion of the
water heating needs of over 70 million households. The use of biomass for heating continues to grow as well. In Sweden, national use of
biomass energy has surpassed that of oil. Direct geothermal for heating is also growing rapidly.[19]
Transport fuels. Renewable biofuels have contributed to a significant decline in oil consumption in the United States since 2006.[19] The
93 billion liters of biofuels produced worldwide in 2009 displaced the equivalent of an estimated 68 billion liters of gasoline, equal to about 5%
of world gasoline production.[19]
In international public opinion surveys there is strong support for promoting renewable sources such as solar power and wind power, requiring
utilities to use more renewable energy (even if this increases the cost), and providing tax incentives to encourage the development and use of
such technologies. There is substantial optimism that renewable energy investments will pay off economically in the long term.[20]
History

Prior to the development of coal in the mid 19th century, all energy used was renewable, with the primary sources being human labor, animal
power in the form of oxen, mules, and horses, water power for mill power, wind for grinding grain, and firewood. A graph of energy use in the
United States up until 1900 shows oil and natural gas with about the same importance in 1900 as wind and solar played in 2010.
By 1873, concerns of running out of coal prompted experiments with using solar energy.[21] Development of solar engines continued until the
outbreak of World War I. The eventual importance of solar energy, though, was recognized in a 1911 Scientific American article: "in the far distant
future, natural fuels having been exhausted [solar power] will remain as the only means of existence of the human race".[22]
In the 1970s environmentalists promoted the development of alternative energy both as a replacement for the eventual depletion of oil, as well as
for an escape from dependence on oil, and the first wind turbines appeared. Solar had always been used for heating and cooling, but solar panels
were too costly to build solar farms until 1980.[23] The theory of peak oil was published in 1956.[24]
By 2008 renewable energy had ceased being an alternative, and more capacity of renewable energy was added than other sources in both the
United States and in Europe.[25]
Wind power
Main article: Wind power
The National Renewable Energy Laboratory projects that the levelized cost of wind power will decline 25% from 2012 to 2030.[26]
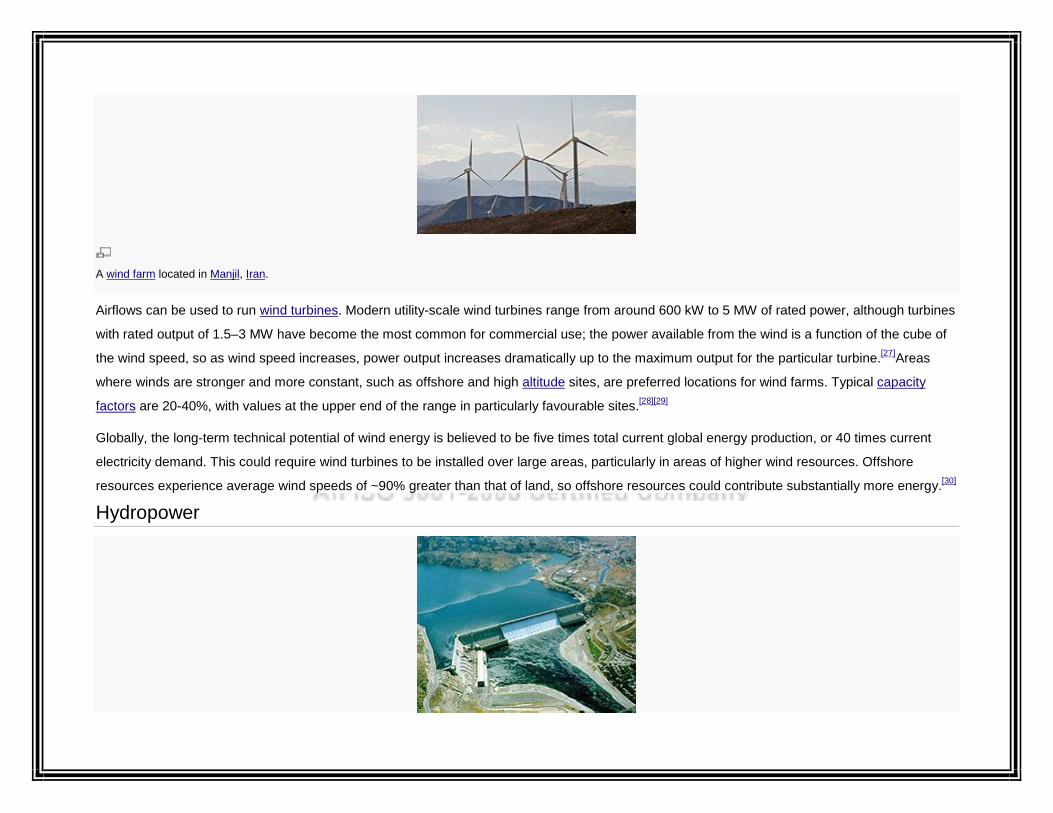
A wind farm located in Manjil, Iran.
Airflows can be used to run wind turbines. Modern utility-scale wind turbines range from around 600 kW to 5 MW of rated power, although turbines
with rated output of 1.5–3 MW have become the most common for commercial use; the power available from the wind is a function of the cube of
the wind speed, so as wind speed increases, power output increases dramatically up to the maximum output for the particular turbine.[27]Areas
where winds are stronger and more constant, such as offshore and high altitude sites, are preferred locations for wind farms. Typical capacity
factors are 20-40%, with values at the upper end of the range in particularly favourable sites.[28][29]
Globally, the long-term technical potential of wind energy is believed to be five times total current global energy production, or 40 times current
electricity demand. This could require wind turbines to be installed over large areas, particularly in areas of higher wind resources. Offshore
resources experience average wind speeds of ~90% greater than that of land, so offshore resources could contribute substantially more energy.[30]
Hydropower

Grand Coulee Dam is a hydroelectricgravity dam on the Columbia River in the U.S. state of Washington. The dam supplies four power stations with an installed capacity of
6,809 MW and is the largest electric power-producing facility in the United States.
See also: Hydroelectricity and Hydropower
Energy in water can be harnessed and used. Since water is about 800 times denser than air, even a slow flowing stream of water, or moderate
seaswell, can yield considerable amounts of energy. There are many forms of water energy:
Hydroelectric energy is a term usually reserved for large-scale hydroelectric dams. Examples are the Grand Coulee Dam in Washington
State and the Akosombo Dam in Ghana.
Micro hydro systems are hydroelectric power installations that typically produce up to 100 kW of power. They are often used in water rich
areas as aremote-area power supply (RAPS).
Run-of-the-river hydroelectricity systems derive kinetic energy from rivers and oceans without the creation of a large reservoir.
Solar energy
Monocrystalline solar cell.
See also: Solar energy, Solar power, and Solar thermal energy

Solar energy is the energy derived from the sun through the form of solar radiation. Solar powered electrical generation relies
on photovoltaics and heat engines. A partial list of other solar applications includes space heating and cooling through solar
architecture, daylighting, solar hot water, solar cooking, and high temperature process heat for industrial purposes.
Solar technologies are broadly characterized as either passive solar or active solar depending on the way they capture, convert and distribute
solar energy. Active solar techniques include the use of photovoltaic panels and solar thermal collectors to harness the energy. Passive solar
techniques include orienting a building to the Sun, selecting materials with favorable thermal mass or light dispersing properties, and designing
spaces that naturally circulate air.
Biomass
A cogeneration plant in Metz, France. The station uses waste wood biomass as energy source, and provides electricity and heat for 30,000 dwellings.
Biomass (plant material) is a renewable energy source because the energy it contains comes from the sun. Through the process
of photosynthesis, plants capture the sun's energy. When the plants are burnt, they release the sun's energy they contain. In this way, biomass
functions as a sort of natural battery for storing solar energy. As long as biomass is produced sustainably, with only as much used as is grown, the
battery will last indefinitely.[31][unreliable source?] In general there are two main approaches to using plants for energy production: growing plants
specifically for energy use (known as first and third-generation biomass), and using the residues (known as second-generation biomass) from
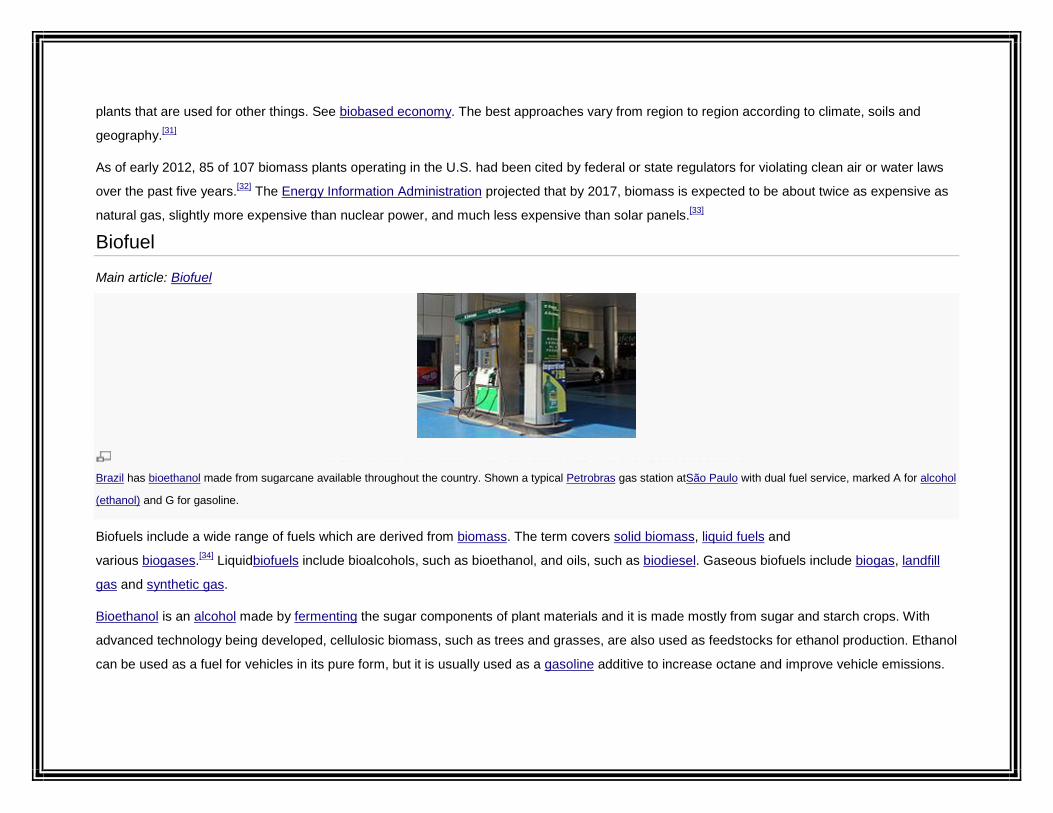
plants that are used for other things. See biobased economy. The best approaches vary from region to region according to climate, soils and
geography.[31]
As of early 2012, 85 of 107 biomass plants operating in the U.S. had been cited by federal or state regulators for violating clean air or water laws
over the past five years.[32] The Energy Information Administration projected that by 2017, biomass is expected to be about twice as expensive as
natural gas, slightly more expensive than nuclear power, and much less expensive than solar panels.[33]
Biofuel
Main article: Biofuel
Brazil has bioethanol made from sugarcane available throughout the country. Shown a typical Petrobras gas station atSão Paulo with dual fuel service, marked A for alcohol
(ethanol) and G for gasoline.
Biofuels include a wide range of fuels which are derived from biomass. The term covers solid biomass, liquid fuels and
various biogases.[34] Liquidbiofuels include bioalcohols, such as bioethanol, and oils, such as biodiesel. Gaseous biofuels include biogas, landfill
gas and synthetic gas.
Bioethanol is an alcohol made by fermenting the sugar components of plant materials and it is made mostly from sugar and starch crops. With
advanced technology being developed, cellulosic biomass, such as trees and grasses, are also used as feedstocks for ethanol production. Ethanol
can be used as a fuel for vehicles in its pure form, but it is usually used as a gasoline additive to increase octane and improve vehicle emissions.

Bioethanol is widely used in the USA and in Brazil. However, according to the European Environment Agency, biofuels do not address global
warming concerns.[35]
Biodiesel is made from vegetable oils, animal fats or recycled greases. Biodiesel can be used as a fuel for vehicles in its pure form, but it is usually
used as a diesel additive to reduce levels of particulates, carbon monoxide, and hydrocarbons from diesel-powered vehicles. Biodiesel is
produced fromoils or fats using transesterification and is the most common biofuel in Europe.
Biofuels provided 2.7% of the world's transport fuel in 2010.[36]
Geothermal energy
Main article: Geothermal energy
Steam rising from the Nesjavellir Geothermal Power Station in Iceland.
Geothermal energy is from thermal energy generated and stored in the Earth. Thermal energy is the energy that determines the temperature of
matter. Earth's geothermal energy originates from the original formation of the planet (20%) and from radioactive decay of minerals
(80%).[37] The geothermal gradient, which is the difference in temperature between the core of the planet and its surface, drives a continuous
conduction of thermal energy in the form of heat from the core to the surface. The adjective geothermal originates from the Greek roots geo,
meaning earth, and thermos, meaning heat.
The heat that is used for geothermal energy can be from deep within the Earth, all the way down to Earth’s core – 4,000 miles (6,400 km) down. At
the core, temperatures may reach over 9,000 °F (5,000 °C). Heat conducts from the core to surrounding rock. Extremely high temperature and

pressure cause some rock to melt, which is commonly known as magma. Magma convects upward since it is lighter than the solid rock. This
magma then heats rock and water in the crust, sometimes up to 700 °F (371 °C).[38]
From hot springs, geothermal energy has been used for bathing since Paleolithic times and for space heating since ancient Roman times, but it is
now better known for electricity generation.
Renewable energy commercialization
Main article: Renewable energy commercialization
Growth of renewables
Renewable power generation and capacity as a proportion of change in global power supply[39]
Growth of wind power and photovoltaics

From the end of 2004, worldwide renewable energy capacity grew at rates of 10–60% annually for many technologies. For wind power and many
other renewable technologies, growth accelerated in 2009 relative to the previous four years.[18] More wind power capacity was added during 2009
than any other renewable technology. However, grid-connected PV increased the fastest of all renewables technologies, with a 60% annual
average growth rate.[18] In 2010, renewable power constituted about a third of the newly built power generation capacities.[39] By 2014 the installed
capacity of photovoltaics will likely exceed that of wind, but due to the lower capacity factor of solar, the energy generated from photovoltaics is not
expected to exceed that of wind until 2015.
Selected renewable energy indicators[4][40]
Selected global indicators 2008 2009 2010 2011
Investment in new renewable capacity (annual) (109 USD) 130 160 211 257
Renewables power capacity (existing) (GWe) 1,140 1,230 1,320 1,360
Hydropower capacity (existing) (GWe) 885 915 945 970
Wind power capacity (existing) (GWe) 121 159 198 238
Solar PV capacity (grid-connected) (GWe) 16 23 40 70
Solar hot water capacity (existing) (GWth) 130 160 185 232

Selected renewable energy indicators[4][40]
Selected global indicators 2008 2009 2010 2011
Ethanol production (annual) (109 litres) 67 76 86 86
Biodiesel production (annual) (109 litres) 12 17.8 18.5 21.4
Countries with policy targetsfor renewable energy use
79 89 98 118
Projections vary, but scientists have advanced a plan to power 100% of the world's energy with wind, hydroelectric, and solar power by the year
2030.[41][42]
According to a 2011 projection by the International Energy Agency, solar power generators may produce most of the world’s electricity within 50
years, dramatically reducing the emissions of greenhouse gases that harm the environment. Cedric Philibert, senior analyst in the renewable
energy division at the IEA said: “Photovoltaic and solar-thermal plants may meet most of the world’s demand for electricity by 2060 -- and half of
all energy needs -- with wind, hydropower and biomass plants supplying much of the remaining generation”. “Photovoltaic and concentrated solar
power together can become the major source of electricity,” Philibert said.[14]
Economic trends
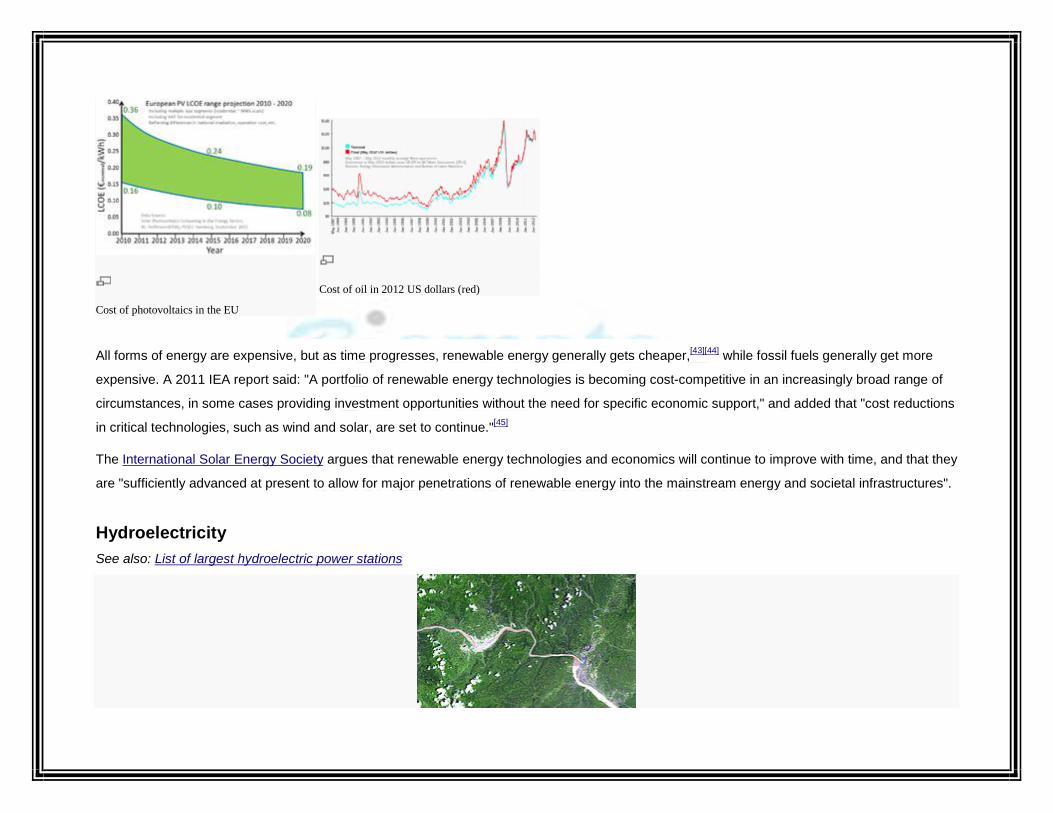
Cost of photovoltaics in the EU
Cost of oil in 2012 US dollars (red)
All forms of energy are expensive, but as time progresses, renewable energy generally gets cheaper,[43][44] while fossil fuels generally get more
expensive. A 2011 IEA report said: "A portfolio of renewable energy technologies is becoming cost-competitive in an increasingly broad range of
circumstances, in some cases providing investment opportunities without the need for specific economic support," and added that "cost reductions
in critical technologies, such as wind and solar, are set to continue."[45]
The International Solar Energy Society argues that renewable energy technologies and economics will continue to improve with time, and that they
are "sufficiently advanced at present to allow for major penetrations of renewable energy into the mainstream energy and societal infrastructures".
HydroelectricitySee also: List of largest hydroelectric power stations

Three Gorges Dam (left), Gezhouba Dam (right).
The Three Gorges Dam in Hubei, China, has the world's largest instantaneous generating capacity (22,500 MW), with the Itaipu Dam in
Brazil/Paraguay in second place (14,000 MW). The Three Gorges Dam is operated jointly with the much smaller Gezhouba Dam (3,115 MW). As
of 2012, the total generating capacity of this two-dam complex is 25,615 MW. In 2008, this complex generated 97.9 TWh of electricity (80.8 TWh
from the Three Gorges Dam and 17.1 TWh from the Gezhouba Dam), which is 3.4% more power in one year than the 94.7 TWh generated by
Itaipu in 2008.
Wind power developmentSee also: List of onshore wind farms and List of offshore wind farms
Wind power: worldwide installed capacity[46]
Fenton Wind Farm at sunrise

Wind power is growing at over 20% annually, with a worldwide installed capacity of 238,000 MW at the end of 2011,[2][3][4] and is widely used
in Europe,Asia, and the United States.[5][47] Several countries have achieved relatively high levels of wind power penetration, such as 21% of
stationary electricity production in Denmark,[48] 18% in Portugal,[48] 16% in Spain,[48] 14% in Ireland[49] and 9% in Germany in 2010.[36][48] As of
2011, 83 countries around the world are using wind power on a commercial basis.[36]
Top 10 wind power countries[48][50][50]
CountryTotal capacity
end 2009 (MW)Total capacity
end 2010 (MW)Total capacity
end 2011 (MW)
China 26,010 44,733 62,733
United States 35,159 40,298 46,919
Germany 25,777 27,191 29,060
Spain 19,149 20,623 21,674
India 10,925 13,065 16,084
France 4,521 5,970 6,800
Italy 4,850 5,797 6,747

Top 10 wind power countries[48][50][50]
CountryTotal capacity
end 2009 (MW)Total capacity
end 2010 (MW)Total capacity
end 2011 (MW)
United Kingdom 4,092 5,248 6,540
Canada 2,550 4,008 5,265
Portugal 3,357 3,706 4,083
Rest of world 21,698 26,998 32,446
Total 159,213 197,637 238,351
As of 2012, the Alta Wind Energy Center (California, 1,020 MW) is the world's largest wind farm.[51] As of February 2012, the Walney Wind Farm in
theUnited Kingdom is the largest offshore wind farm in the world at 367 MW, followed by Thanet Offshore Wind Project (300 MW), also in the UK.
The London Array (630 MW) is the largest project under construction. The United Kingdom is the world's leading generator of offshore wind power,
followed by Denmark.[52]
There are many large wind farms under construction and these include Anholt Offshore Wind Farm (400 MW), BARD Offshore 1 (400 MW), Clyde
Wind Farm (548 MW), Fântânele-Cogealac Wind Farm (600 MW), Greater Gabbard wind farm (500 MW), Lincs Wind Farm (270 MW), London
Array (1000 MW), Lower Snake River Wind Project (343 MW), Macarthur Wind Farm (420 MW),Shepherds Flat Wind Farm (845 MW), and
the Sheringham Shoal (317 MW).

Solar thermal
Solar Towers from left: PS10, PS20.
Main article: List of solar thermal power stations
See also: Solar power plants in the Mojave Desert
Large solar thermal power stations include the 354 MW Solar Energy Generating Systems power plant in the USA, Solnova Solar Power
Station (Spain, 150 MW), Andasol Solar Power Station (Spain, 100 MW), Nevada Solar One (USA, 64 MW), PS20 solar power plant (Spain,
20 MW), and the PS10 Solar Power Plant (Spain, 11 MW).
The Ivanpah Solar Power Facility is a 392 MW solar power facility which is under construction in south-eastern California.[53] The Solana
Generating Station is a 280 MW solar power plant which is under construction near Gila Bend, Arizona, about 70 miles (110 km) southwest
of Phoenix. TheCrescent Dunes Solar Energy Project is a 110 MW solar thermal power project currently under construction near Tonopah, about
190 miles (310 km) northwest of Las Vegas.[54]
The solar thermal power industry is growing rapidly with 1.3 GW under construction in 2012 and more planned. Spain is the epicenter of solar
thermal power development with 873 MW under construction, and a further 271 MW under development.[55] In the United States, 5,600 MW of
solar thermal power projects have been announced.[56] In developing countries, three World Bank projects for integrated solar thermal/combined-
cycle gas-turbine power plants in Egypt, Mexico, and Morocco have been approved.[57]
Photovoltaic power stationsMain article: List of photovoltaic power stations

Photovoltaic power(GW)[6]
2005 5.4
2006 7.0
2007 9.4
2008 15.7
2009 22.9
2010 39.7
2011 67.4
Year end capacities
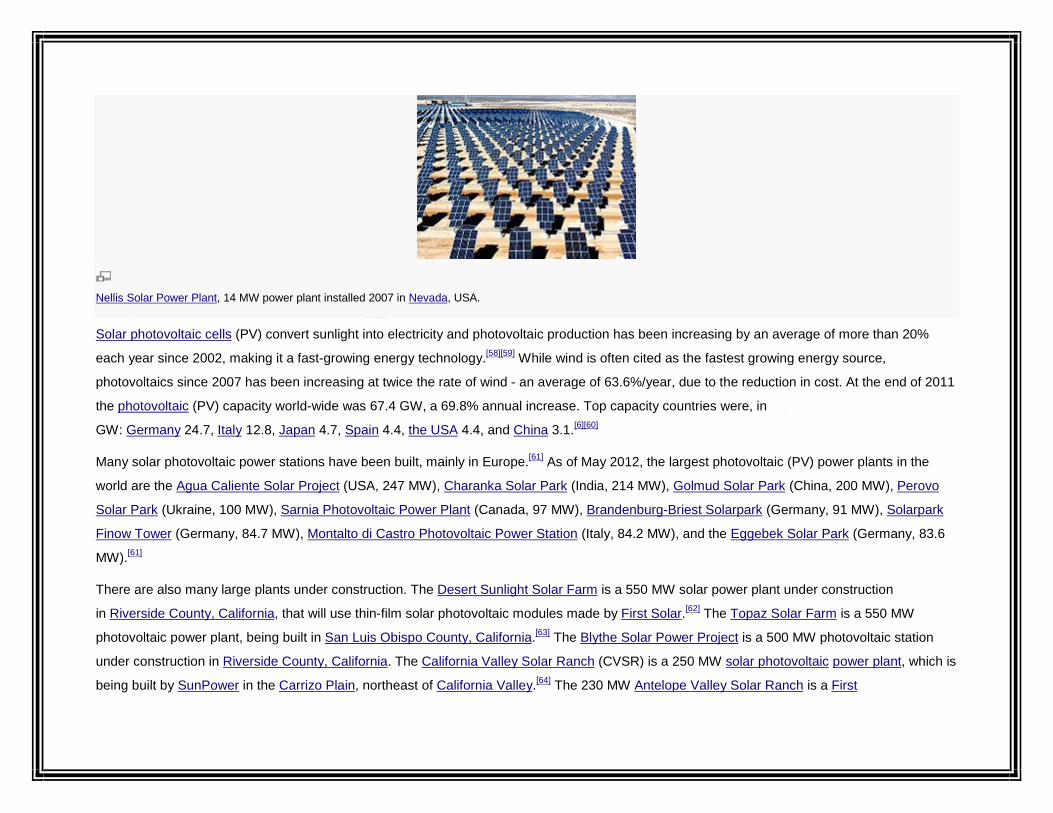
Nellis Solar Power Plant, 14 MW power plant installed 2007 in Nevada, USA.
Solar photovoltaic cells (PV) convert sunlight into electricity and photovoltaic production has been increasing by an average of more than 20%
each year since 2002, making it a fast-growing energy technology.[58][59] While wind is often cited as the fastest growing energy source,
photovoltaics since 2007 has been increasing at twice the rate of wind - an average of 63.6%/year, due to the reduction in cost. At the end of 2011
the photovoltaic (PV) capacity world-wide was 67.4 GW, a 69.8% annual increase. Top capacity countries were, in
GW: Germany 24.7, Italy 12.8, Japan 4.7, Spain 4.4, the USA 4.4, and China 3.1.[6][60]
Many solar photovoltaic power stations have been built, mainly in Europe.[61] As of May 2012, the largest photovoltaic (PV) power plants in the
world are the Agua Caliente Solar Project (USA, 247 MW), Charanka Solar Park (India, 214 MW), Golmud Solar Park (China, 200 MW), Perovo
Solar Park (Ukraine, 100 MW), Sarnia Photovoltaic Power Plant (Canada, 97 MW), Brandenburg-Briest Solarpark (Germany, 91 MW), Solarpark
Finow Tower (Germany, 84.7 MW), Montalto di Castro Photovoltaic Power Station (Italy, 84.2 MW), and the Eggebek Solar Park (Germany, 83.6
MW).[61]
There are also many large plants under construction. The Desert Sunlight Solar Farm is a 550 MW solar power plant under construction
in Riverside County, California, that will use thin-film solar photovoltaic modules made by First Solar.[62] The Topaz Solar Farm is a 550 MW
photovoltaic power plant, being built in San Luis Obispo County, California.[63] The Blythe Solar Power Project is a 500 MW photovoltaic station
under construction in Riverside County, California. The California Valley Solar Ranch (CVSR) is a 250 MW solar photovoltaic power plant, which is
being built by SunPower in the Carrizo Plain, northeast of California Valley.[64] The 230 MW Antelope Valley Solar Ranch is a First

Solar photovoltaic project which is under construction in the Antelope Valley area of the Western Mojave Desert, and due to be completed in
2013.[65]
Many of these plants are integrated with agriculture and some use tracking systems that follow the sun's daily path across the sky to generate
more electricity than fixed-mounted systems. There are no fuel costs or emissions during operation of the power stations.
However, when it comes to renewable energy systems and PV, it is not just large systems that matter. Building-integrated photovoltaics or "onsite"
PV systems use existing land and structures and generate power close to where it is consumed.[66]
Biofuel developmentSee also: Ethanol fuel and BioEthanol for Sustainable Transport
Biofuels provided 3% of the world's transport fuel in 2010.[36] Mandates for blending biofuels exist in 31 countries at the national level and in 29
states/provinces.[36] According to the International Energy Agency, biofuels have the potential to meet more than a quarter of world demand for
transportation fuels by 2050.[67]
Since the 1970s, Brazil has had an ethanol fuel program which has allowed the country to become the world's second largest producer
of ethanol (after the United States) and the world's largest exporter.[68] Brazil’s ethanol fuel program uses modern equipment and
cheap sugarcane as feedstock, and the residual cane-waste (bagasse) is used to produce heat and power.[69] There are no longer light vehicles in
Brazil running on pure gasoline. By the end of 2008 there were 35,000 filling stations throughout Brazil with at least one ethanol pump.[70]
Nearly all the gasoline sold in the United States today is mixed with 10% ethanol, a mix known as E10,[71] and motor vehicle manufacturers already
produce vehicles designed to run on much higher ethanol blends. Ford, Daimler AG, and GM are among the automobile companies that sell
“flexible-fuel” cars, trucks, and minivans that can use gasoline and ethanol blends ranging from pure gasoline up to 85% ethanol (E85). By mid-
2006, there were approximately 6 million E85-compatible vehicles on U.S. roads.[72] The challenge is to expand the market for biofuels beyond the
farm states where they have been most popular to date. Flex-fuel vehicles are assisting in this transition because they allow drivers to choose
different fuels based on price and availability. TheEnergy Policy Act of 2005, which calls for 7.5 billion US gallons (28,000,000 m3) of biofuels to be
used annually by 2012, will also help to expand the market.[72]
According to the European Environment Agency, biofuels do not address global warming concerns.[35]

Geothermal development
The West Ford Flat power plant is one of 22 power plants at The Geysers.
See also: Geothermal energy in the United States
Geothermal power is cost effective, reliable, sustainable, and environmentally friendly,[73] but has historically been limited to areas near tectonic
plateboundaries. Recent technological advances have dramatically expanded the range and size of viable resources, especially for applications
such as home heating, opening a potential for widespread exploitation. Geothermal wells release greenhouse gases trapped deep within the
earth, but these emissions are much lower per energy unit than those of fossil fuels. As a result, geothermal power has the potential to help
mitigate global warming if widely deployed in place of fossil fuels.
The International Geothermal Association (IGA) has reported that 10,715 MW of geothermal power in 24 countries is online, which is expected to
generate 67,246 GWh of electricity in 2010.[74] This represents a 20% increase in geothermal power online capacity since 2005. IGA projects this
will grow to 18,500 MW by 2015, due to the large number of projects presently under consideration, often in areas previously assumed to have
little exploitable resource.[74]
In 2010, the United States led the world in geothermal electricity production with 3,086 MW of installed capacity from 77 power plants;[75] the
largest group of geothermal power plants in the world is located at The Geysers, a geothermal field in California.[76] The Philippines follows the US

as the second highest producer of geothermal power in the world, with 1,904 MW of capacity online; geothermal power makes up approximately
18% of the country's electricity generation.[75]
Developing countriesMain article: Renewable energy in developing countries
Solar cookers use sunlight as energy source for outdoor cooking.
Renewable energy can be particularly suitable for developing countries. In rural and remote areas, transmission and distribution of energy
generated fromfossil fuels can be difficult and expensive. Producing renewable energy locally can offer a viable alternative.[77]
Technology advances are opening up a huge new market for solar power: the approximately 1.3 billion people around the world who don't have
access to grid electricity. Even though they are typically very poor, these people have to pay far more for lighting than people in rich countries
because they use inefficient kerosene lamps. Solar power costs half as much as lighting with kerosene.[78] An estimated 3 million households get
power from small solar PV systems.[79] Kenya is the world leader in the number of solar power systems installed per capita. More than 30,000 very
small solar panels, each producing 12 to 30 watts, are sold in Kenya annually.
Some Small Island Developing States (SIDS) are also turning to solar power to reduce their costs and increase their sustainability. Anguilla, for
example, aims to obtain 15% of its energy from solar power so it is less reliant on expensive imported diesel. The Climate & Development
Knowledge Network is helping the government gather all the information it needs to change the island’s legislation, so it can integrate renewables

into its grid.Barbados, have also made good progress in switching to renewables, but many other SIDS are still at the early stages of planning how
to integrate renewable energy into their grids. “For a small island we’re very far ahead,” said Beth Barry, Coordinator of the Anguilla Renewable
Energy Office. "We’ve got an Energy Policy and a draft Climate Change policy and have been focussing efforts on the question of sustainable
energy supply for several years now. As a result we have a lot of information we can share with other islands.”[80]
Micro-hydro configured into mini-grids also provide power. Over 44 million households use biogas made in household-scale digesters
for lighting and/or cooking, and more than 166 million households rely on a new generation of more-efficient biomass cookstoves.[10] Clean liquid
fuel sourced from renewable feedstocks are used for cooking and lighting in energy-poor areas of the developing world. Alcohol fuels (ethanol and
methanol) can be produced sustainably from non-food sugary, starchy, and cellulostic feedstocks. Project Gaia, Inc. and CleanStar Mozambique
are implementing clean cooking programs with liquid ethanol stoves in Ethiopia, Kenya, Nigeria and Mozambique.[81]
Renewable energy projects in many developing countries have demonstrated that renewable energy can directly contribute to poverty
alleviation by providing the energy needed for creating businesses and employment. Renewable energy technologies can also make indirect
contributions to alleviating poverty by providing energy for cooking, space heating, and lighting. Renewable energy can also contribute to
education, by providing electricity to schools.[82]
Industry and policy trendsSee also: Renewable energy commercialization and Renewable energy policy
Global New Investments in Renewable Energy[83]
U.S. President Barack Obama's American Recovery and Reinvestment Act of 2009 includes more than $70 billion in direct spending and tax
credits for clean energy and associated transportation programs. Clean Edge suggests that the commercialization of clean energy will help
countries around the world pull out of the current economic malaise.[13] Leading renewable energy companies include First Solar, Gamesa, GE
Energy, Q-Cells, Sharp Solar,Siemens, SunOpta, Suntech Power, and Vestas.[84]
The military has also focused on the use of renewable fuels for military vehicles. Unlike fossil fuels, renewable fuels can be produced in any
country, creating a strategic advantage. The US military has already committed itself to have 50% of its energy consumption come from alternative
sources.[85]
The International Renewable Energy Agency (IRENA) is an intergovernmental organization for promoting the adoption of renewable
energy worldwide. It aims to provide concrete policy advice and facilitate capacity building and technology transfer. IRENA was formed on January
26, 2009, by 75 countries signing the charter of IRENA.[86] As of March 2010, IRENA has 143 member states who all are considered as founding
members, of which 14 have also ratified the statute.[87]
As of 2011, 119 countries have some form of national renewable energy policy target or renewable support policy. National targets now exist in at
least 98 countries. There is also a wide range of policies at state/provincial and local levels.[36]
United Nations' Secretary-General Ban Ki-moon has said that renewable energy has the ability to lift the poorest nations to new levels of
prosperity.[11]In October 2011, he "announced the creation of a high-level group to drum up support for energy access, energy efficiency and
greater use of renewable energy. The group is to be co-chaired by Kandeh Yumkella, the chair of UN Energy and director general of the UN
Industrial Development Organisation, and Charles Holliday, chairman of Bank of America".[88]
100% renewable energy
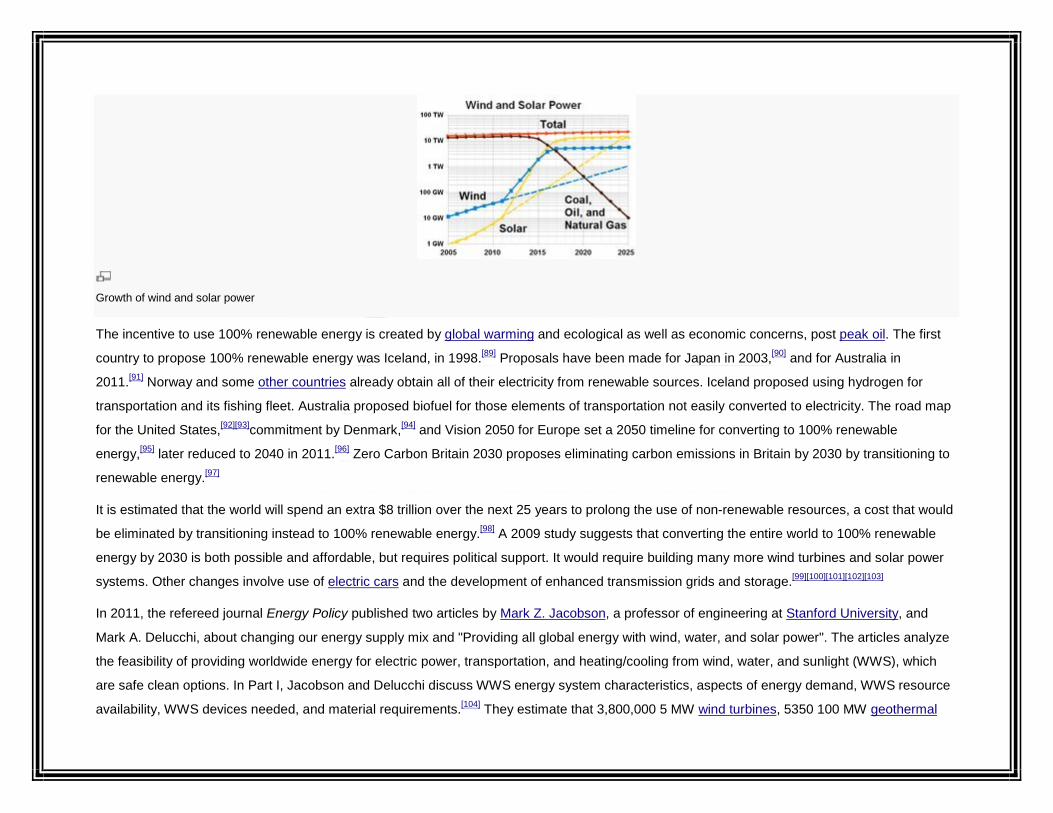
Growth of wind and solar power
The incentive to use 100% renewable energy is created by global warming and ecological as well as economic concerns, post peak oil. The first
country to propose 100% renewable energy was Iceland, in 1998.[89] Proposals have been made for Japan in 2003,[90] and for Australia in
2011.[91] Norway and some other countries already obtain all of their electricity from renewable sources. Iceland proposed using hydrogen for
transportation and its fishing fleet. Australia proposed biofuel for those elements of transportation not easily converted to electricity. The road map
for the United States,[92][93]commitment by Denmark,[94] and Vision 2050 for Europe set a 2050 timeline for converting to 100% renewable
energy,[95] later reduced to 2040 in 2011.[96] Zero Carbon Britain 2030 proposes eliminating carbon emissions in Britain by 2030 by transitioning to
renewable energy.[97]
It is estimated that the world will spend an extra $8 trillion over the next 25 years to prolong the use of non-renewable resources, a cost that would
be eliminated by transitioning instead to 100% renewable energy.[98] A 2009 study suggests that converting the entire world to 100% renewable
energy by 2030 is both possible and affordable, but requires political support. It would require building many more wind turbines and solar power
systems. Other changes involve use of electric cars and the development of enhanced transmission grids and storage.[99][100][101][102][103]
In 2011, the refereed journal Energy Policy published two articles by Mark Z. Jacobson, a professor of engineering at Stanford University, and
Mark A. Delucchi, about changing our energy supply mix and "Providing all global energy with wind, water, and solar power". The articles analyze
the feasibility of providing worldwide energy for electric power, transportation, and heating/cooling from wind, water, and sunlight (WWS), which
are safe clean options. In Part I, Jacobson and Delucchi discuss WWS energy system characteristics, aspects of energy demand, WWS resource
availability, WWS devices needed, and material requirements.[104] They estimate that 3,800,000 5 MW wind turbines, 5350 100 MW geothermal
powerplants, and 270 new 1300 MW hydroelectric power plants will be required. In terms of solar power, an additional 49,000 300
MW concentrating solar plants, 40,000 300 MW solar photovoltaicpower plants, and 1.7 billion 3 kW rooftop photovoltaic systems will also be
needed. Such an extensive WWS infrastructure could decrease world power demand by 30%.[104] In Part II, Jacobson and Delucchi address
variability of supply, system economics, and energy policy initiatives associated with a WWS system. The authors advocate producing all new
energy with WWS by 2030 and replacing existing energy supply arrangements by 2050. Barriers to implementing the renewable energy plan are
seen to be "primarily social and political, not technological or economic". Energy costs with a WWS system should be similar to today's energy
costs.[105]
The only sources available to provide a majority of the world's energy are, in order, solar, wind, and geothermal. Geothermal can be treated either
as a non-renewable resource, where the heat in the first two miles of the Earth's mantle contains enough energy to supply all of the world's energy
for 100,000 years, although only a small percentage of that is technically available, or as a renewable resource, where the heat used is that which
is replenished each year. Due to the radiation in the Earth's mantle, this is sustainable for about 2 billion years, and can supply up to a majority of
the energy used in 2010.[106][107] Most of the energy available is from the Sun, and about 1% to 2% is converted to wind energy, and about 0.01%
to plants. Each year the sun provides 160 times the total energy that is stored in fossil fuels.[108]
A 2012 study by the University of Delaware for a 72 GW system considered 28 billion combinations of renewable energy and storage and found
the most cost effective, for the PJM Interconnection, would use 17 GW of solar, 68 GW of offshore wind, and 115 GW of onshore wind, although at
times as much as three times the demand would be provided. 0.1% of the time would require generation from other sources.[109]
IRENEC is an annual conference on 100% renewable energy started in 2011 by EUROSOLAR Turkey. The 2013 conference is scheduled for
June 27–29 in Istanbul.[110][111]
Other technologies
Other renewable energy technologies are still under development, and include cellulosic ethanol, hot-dry-rock geothermal power, and ocean
energy.[112] These technologies are not yet widely demonstrated or have limited commercialization. Many are on the horizon and may have
potential comparable to other renewable energy technologies, but still depend on attracting sufficient attention and research, development and
demonstration (RD&D) funding.[112]
Research

There are numerous organizations within the academic, federal, and commercial sectors conducting large scale advanced research in the field of
renewable energy. This research spans several areas of focus across the renewable energy spectrum. Most of the research is targeted at
improving efficiency and increasing overall energy yields.[113] Multiple federally supported research organizations have focused on renewable
energy in recent years. Two of the most prominent of these labs are Sandia National Laboratories and the National Renewable Energy
Laboratory (NREL), both of which are funded by the United States Department of Energy and supported by various corporate partners.[114] Sandia
has a total budget of $2.4 billion[115] while NREL has a budget of $375 million.[116]
Cellulosic ethanolSee also: Cellulosic ethanol commercialization
Companies such as Iogen, POET, and Abengoa are building refineries that can process biomass and turn it into ethanol, while companies such as
the Verenium Corporation, Novozymes, andDyadic International are producing enzymes which could enable a cellulosic ethanol future. The shift
from food crop feedstocks to waste residues and native grasses offers significant opportunities for a range of players, from farmers to
biotechnology firms, and from project developers to investors.[117]
Selected Commercial Cellulosic Ethanol Plants in the U.S.[118][119]
(Operational or under construction)
Company Location Feedstock
Abengoa Bioenergy Hugoton, KS Wheat straw
BlueFire Renewables Irvine, CA Multiple sources
Gulf Coast Energy Mossy Head, FL Wood waste

Selected Commercial Cellulosic Ethanol Plants in the U.S.[118][119]
(Operational or under construction)
Company Location Feedstock
Mascoma Lansing, MI Wood
POET Emmetsburg, IA Corn cobs
SunOpta Little Falls, MN Wood chips
Xethanol Auburndale, FL Citrus peels
Ocean energyMain article: Ocean energy
Ocean energy is a broad category currently encompassing: Marine current power, Osmotic power, Wave power, Tidal power, and Ocean thermal
energy.
Wave PowerMain article: Wave power
Systems to harvest utility-scale electrical power from ocean waves have recently been gaining momentum as a viable technology. The potential
for this technology is considered promising, especially on west-facing coasts with latitudes between 40 and 60 degrees:[120]
In the United Kingdom, for example, the Carbon Trust recently estimated the extent of the economically viable offshore resource at 55 TWh per
year, about 14% of current national demand. Across Europe, the technologically achievable resource has been estimated to be at least 280 TWh

per year. In 2003, the U.S. Electric Power Research Institute (EPRI) estimated the viable resource in the United States at 255 TWh per year (6%
of demand).[120]
Scotland is home to the European Marine Energy Centre the world's first testing facility for wave and tidal machines, located in the waters around
the Orkney Islands. In 2012 at the wave test site,E.ON are testing a Pelamis Wave Energy Converter machine and Aquamarine Power are testing
their near-shore Oyster device. Wave farm developments are planned in Scottish waters by E.ON, ScottishPower Renewables, SSE, Pelamis
Wave Power, Aquamarine Power and Aegir Wave Power, a joint venture between Pelamis and Vattenfall.[121]
In the U.S., Australia, as well as in Europe, full scale Wave power projects are underway or in planning by Ocean Power Technologies, as well as
others, such as CETO.
Tidal PowerMain article: Tidal power
The world's first commercial tidal stream generator was installed in 2007 in the narrows of Strangford Lough in Ireland. The 1.2 MW underwater
tidal electricity generator, part of Northern Ireland's Environment & Renewable Energy Fund scheme, takes advantage of the fast tidal flow (up to 4
metres per second) in the lough. Although the generator is powerful enough to power a thousand homes, the turbine has minimal environmental
impact, as it is almost entirely submerged, and the rotors pose no danger to wildlife as they turn quite slowly.[122]
Ocean thermal energyMain article: Ocean thermal energy
Ocean thermal energy conversion (OTEC) uses the temperature difference that exists between deep and shallow waters to run a heat engine.
Enhanced geothermal systemsMain article: Enhanced geothermal system

Enhanced geothermal system1:Reservoir 2:Pump house 3:Heat exchanger 4:Turbine hall 5:Production well 6:Injection well 7:Hot water to district heating
8:Porous sediments 9:Observation well 10:Crystalline bedrock
Enhanced geothermal systems are a new type of geothermal power technologies that do not require natural convective hydrothermal resources.
The vast majority of geothermal energy within drilling reach is in dry and non-porous rock.[123] EGS technologies "enhance" and/or create
geothermal resources in this "hot dry rock (HDR)" through hydraulic stimulation.
EGS / HDR technologies, like hydrothermal geothermal, are expected to be baseload resources which produce power 24 hours a day like a fossil
plant. Distinct from hydrothermal, HDR / EGS may be feasible anywhere in the world, depending on the economic limits of drill depth. Good
locations are over deep granite covered by a thick (3–5 km) layer of insulating sediments which slow heat loss.[124]
There are HDR and EGS systems currently being developed and tested in France, Australia, Japan, Germany, the U.S. and Switzerland. The
largest EGS project in the world is a 25 megawatt demonstration plant currently being developed in the Cooper Basin, Australia. The Cooper
Basin has the potential to generate 5,000–10,000 MW.
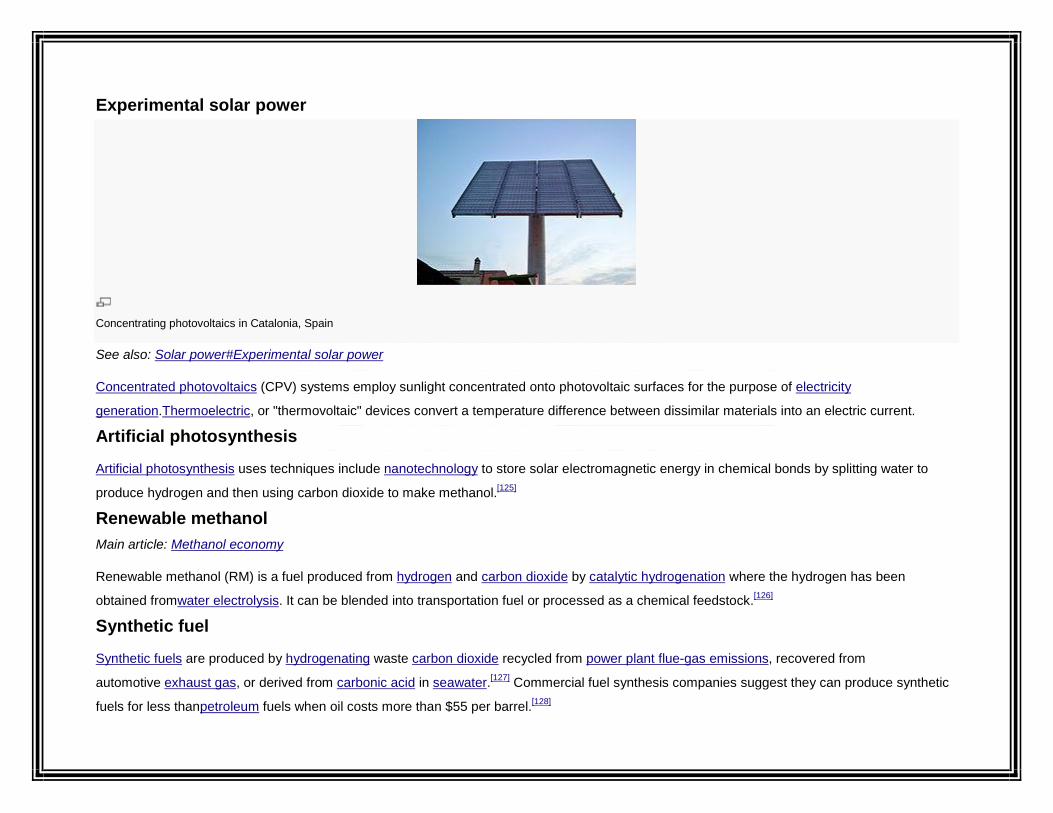
Experimental solar power
Concentrating photovoltaics in Catalonia, Spain
See also: Solar power#Experimental solar power
Concentrated photovoltaics (CPV) systems employ sunlight concentrated onto photovoltaic surfaces for the purpose of electricity
generation.Thermoelectric, or "thermovoltaic" devices convert a temperature difference between dissimilar materials into an electric current.
Artificial photosynthesis
Artificial photosynthesis uses techniques include nanotechnology to store solar electromagnetic energy in chemical bonds by splitting water to
produce hydrogen and then using carbon dioxide to make methanol.[125]
Renewable methanolMain article: Methanol economy
Renewable methanol (RM) is a fuel produced from hydrogen and carbon dioxide by catalytic hydrogenation where the hydrogen has been
obtained fromwater electrolysis. It can be blended into transportation fuel or processed as a chemical feedstock.[126]
Synthetic fuel
Synthetic fuels are produced by hydrogenating waste carbon dioxide recycled from power plant flue-gas emissions, recovered from
automotive exhaust gas, or derived from carbonic acid in seawater.[127] Commercial fuel synthesis companies suggest they can produce synthetic
fuels for less thanpetroleum fuels when oil costs more than $55 per barrel.[128]
The George Olah carbon dioxide recycling plant operated by Carbon Recycling International in Grindavík, Iceland has been producing 2 million
liters ofmethanol transportation fuel per year from flue exhaust of the Svartsengi Power Station since 2011.[129] It has the capacity to produce 5
million liters per year.[130] A 250 kilowatt methane synthesis plant was constructed by the Center for Solar Energy and Hydrogen Research (ZSW)
at Baden-Württemberg and the Fraunhofer Society in Germany and began operating in 2010. It is being upgraded to 10 megawatts, scheduled for
completion in autumn, 2012.[131][132] Further commercial developments are taking place in Columbia, South Carolina,[133] Camarillo,
California,[134] and Darlington, England.[135]
Such fuels are considered carbon neutral because they do not result in a net increase in atmospheric greenhouse gases.[136] To the extent that
synthetic fuels displace fossil fuels, or if they are produced from waste carbon or seawater carbonic acid, and their combustion is subject to carbon
capture at the flue or exhaust pipe, they result in negative carbon dioxide emission and netcarbon dioxide removal from the atmosphere, and thus
constitute a form of greenhouse gas remediation.[137]
Such renewable fuels alleviate the costs and dependency issues of imported fossil fuels without requiring either electrification of the vehicle
fleet or conversion to hydrogen or other fuels, enabling continued compatible and affordable vehicles.[138] Carbon neutral fuels offer relatively low
cost energy storage, alleviating the problems of wind and solar intermittency, and they enable distribution of wind, water, and solar power through
existing natural gas pipelines.[138]
Nighttime wind power is considered the most economical form of electrical power with which to synthesize fuel, because the load curve for
electricity peaks sharply during the warmest hours of the day, but wind tends to blow slightly more at night than during the day, so, the price of
nighttime wind power is often much less expensive than any alternative.[138] Germany has built a 250 kilowatt synthetic methane plant which they
are scaling up to 10 megawatts.[131][132][139] The least expensive source of carbon for recycling into fuel is flue-gas emissions from fossil-fuel
combustion where it can be extracted for about USD $7.50 per ton.[140][141] Carbonic acid can be extracted from seawater where it is in chemical
equilibrium with atmospheric carbon dioxide, at about $50 per ton of CO2.[142]
Renewable energy debate
Main article: Renewable energy debate

Renewable electricity production, from sources such as wind power and solar power, is sometimes criticized for being variable or intermittent.
However, the International Energy Agency has stated that deployment of renewable technologies usually increases the diversity of electricity
sources and, through local generation, contributes to the flexibility of the system and its resistance to central shocks.[143]
There have been "not in my back yard" (NIMBY) concerns relating to the visual and other impacts of some wind farms, with local residents
sometimes fighting or blocking construction.[144] In the USA, the Massachusetts Cape Wind project was delayed for years partly because of
aesthetic concerns. However, residents in other areas have been more positive and there are many examples of community wind farm
developments. According to a town councilor, the overwhelming majority of locals believe that the Ardrossan Wind Farm in Scotland has
enhanced the area.[145]
The market for renewable energy technologies has continued to grow. Climate change concerns, coupled with high oil prices, peak oil, and
increasing government support, are driving increasing renewable energy legislation, incentives and commercialization.[12] New government
spending, regulation and policies helped the industry weather the 2009 economic crisis better than many other sectors.[13]
See also
Energy crop
Energy transition
International Renewable Energy Agency
Lists about renewable energy
Nuclear power proposed as renewable energy
Renewable energy in the European Union
Renewable energy power station
Seasonal thermal energy storage (STES)
Sustainable energy
PortalsAccess related topics
Renewable energy portal

Energy portal
Sustainable development portal
Ecology portal
References
1. ^ a b REN21 (2011). "Renewables 2011: Global Status Report". pp. 17, 18.
2. ^ a b Alex Morales (February 7, 2012). "Wind Power Market Rose to 41 Gigawatts in 2011, Led by China". Bloomberg.
3. ^ a b Lars Kroldrup. Gains in Global Wind Capacity Reported Green Inc., February 15, 2010.
4. ^ a b c REN21 (2011). "Renewables 2011: Global Status Report". p. 15.
5. ^ a b Global wind energy markets continue to boom – 2006 another record year (PDF).
6. ^ a b c European Photovoltaic Industry Association (2012)."Market Report 2011".
7. ^ Solar Trough Power Plants (PDF).
8. ^ "America and Brazil Intersect on Ethanol". Renewableenergyaccess.com. Retrieved 2011-11-21.
9. ^ World Energy Assessment (2001). Renewable energy technologies, p. 221.
10. ^ a b REN21 (2011). "Renewables 2011: Global Status Report". p. 14.
11. ^ a b Steve Leone (25 August 2011). "U.N. Secretary-General: Renewables Can End Energy Poverty". Renewable Energy World.
12. ^ a b United Nations Environment Programme Global Trends in Sustainable Energy Investment 2007: Analysis of Trends and Issues in the
Financing of Renewable Energy and Energy Efficiency in OECD and Developing Countries(PDF), p. 3.
13. ^ a b c Clean Edge (2009). Clean Energy Trends 2009 pp. 1-4.
14. ^ a b Ben Sills (Aug 29, 2011). "Solar May Produce Most of World’s Power by 2060, IEA Says". Bloomberg.
15. ^ "REN21, Renewables Global Status Report (2006 - 2012)". Ren21.net. Retrieved 2012-10-21.
16. ^ IEA Renewable Energy Working Party (2002). Renewable Energy... into the mainstream, p. 9.
17. ^ International Energy Agency (2012). "Energy Technology Perspectives 2012".
18. ^ a b c REN21 (2010). Renewables 2010 Global Status Report p. 15.

19. ^ a b c d REN21 (2010). Renewables 2010 Global Status Report p. 53.
20. ^ Council on Foreign Relations (January 18, 2012). "Public Opinion on Global Issues: Chapter 5b: World Opinion on Energy Security".
21. ^ "The surprising history of sustainable energy". Sustainablehistory.wordpress.com. Retrieved 2012-11-01.
22. ^ “Power from Sunshine”: A Business History of Solar Energy May 25, 2012
23. ^ "History of PV Solar". Solarstartechnologies.com. Retrieved 2012-11-01.
24. ^ "Nuclear Energy and the Fossil Fuels" (PDF). Retrieved 2012-11-01.
25. ^ Eric Martinot and Janet Sawin. Renewables Global Status Report 2009 Update, Renewable Energy World, September 9, 2009.
26. ^ E. Lantz, M. Hand, and R. Wiser (May 13–17, 2012) "The Past and Future Cost of Wind Energy," National Renewable Energy Laboratory
conference paper no. 6A20-54526, page 4
27. ^ EWEA Executive summary "Analysis of Wind Energy in the EU-25" (PDF). European Wind Energy Association. Retrieved 2007-03-11.
28. ^ How Does A Wind Turbine's Energy Production Differ from Its Power Production?[dead link]
29. ^ Wind Power: Capacity Factor, Intermittency, and what happens when the wind doesn’t blow?. Retrieved 24 January 2008.
30. ^ "Offshore stations experience mean wind speeds at 80 m that are 90% greater than over land on average. Evaluation of global wind power
"Overall, the researchers calculated winds at 80 meters [300 feet] traveled over the ocean at approximately 8.6 meters per second and at nearly 4.5
meters per second over land [20 and 10 miles per hour, respectively]." Global Wind Map Shows Best Wind Farm Locations . Retrieved January 30, 2006.
31. ^ a b Union of Concerned Scientists. How Biomass Energy Works[dead link]
32. ^ Scheck, Justin; et al. (July 23, 2012). "Wood-Fired Plants Generate Violations". Wall Street Journal. Retrieved September 27, 2012.
33. ^ U.S. Energy Information Administration (April 2010).Annual Energy Outlook 2010 (report no. DOE/EIA-0383(2010)). Washington, DC. National
Energy Information Center. Retrieved September 27, 2012.
34. ^ Demirbas, A. . (2009). "Political, economic and environmental impacts of biofuels: A review". Applied Energy86: S108–
S117. doi:10.1016/j.apenergy.2009.04.036. edit
35. ^ a b "Opinion of the EEA Scientific Committee on Greenhouse Gas Accounting in Relation to Bioenergy". Retrieved 2012-11-01.
36. ^ a b c d e f REN21 (2011). "Renewables 2011: Global Status Report". pp. 13–14.

37. ^ Turcotte, D. L.; Schubert, G. (2002), "4", Geodynamics (2 ed.), Cambridge, England, UK: Cambridge University Press, pp. 136–
137, ISBN 978-0-521-66624-4
38. ^ Nemzer, J. "Geothermal heating and cooling".
39. ^ a b UNEP, Bloomberg, Frankfurt School, Global Trends in Renewable Energy Investment 2011、Figure 24.
40. ^ REN21 (2012). Renewables Global Status Report 2012 p. 17.
41. ^ Jacobson, Mark Z.; Delucchi, M.A. (November 2009). "A Path to Sustainable Energy by 2030" (PDF). Scientific American 301 (5): 58–
65.doi:10.1038/scientificamerican1109-58.PMID 19873905.
42. ^ Mark Z. Jacobson and Mark A. Delucchi (30 December 2010). "Providing all global energy with wind, water, and solar power, Part I:
Technologies, energy resources, quantities and areas of infrastructure, and materials".Energy Policy. Elsevier Ltd.
43. ^ Renewable energy costs drop in '09 Reuters, November 23, 2009.
44. ^ Solar Power 50% Cheaper By Year End - Analysis Reuters, November 24, 2009.
45. ^ Henning Gloystein (Nov 23, 2011). "Renewable energy becoming cost competitive, IEA says". Reuters.
46. ^ "GWEC, Global Wind Report Annual Market Update". Gwec.net. Retrieved 2011-11-21.
47. ^ David Beattie (18 March 2011). "Wind Power: China Picks Up Pace". Renewable Energy World.
48. ^ a b c d e "World Wind Energy Report 2010" (PDF).Report. World Wind Energy Association. February 2011. Retrieved 30-April-2011.
49. ^ "Renewables". eirgrid.com. Retrieved 22 November 2010.
50. ^ a b Wald, Matthew L. (January 11, 2011). "China’s Galloping Wind Market". The New York Times.
51. ^ Terra-Gen Closes on Financing for Phases VII and IX, Business Wire, April 17, 2012
52. ^ Patrick Barkham (2009-01-08). "Blown away". London: Guardian. Retrieved 2011-11-21.
53. ^ Steven Mufson. Solar power project in Mojave Desert gets $1.4 billion boost from stimulus funds Washington Post, February 23, 2010.
54. ^ "DOE Finalizes $737 Million Loan Guarantee to Tonopah Solar Energy for Nevada Project" (Press release). Loan Programs Office
(LPO), Dept. of Energy (DOE). September 28, 2011. Retrieved 29 September 2011.
55. ^ "Global Concentrating Solar Power". International Renewable Energy Agency. June 2012. Retrieved 2012-09-08.
56. ^ "Solar Thermal Projects Under Review or Announced". Energy.ca.gov. Retrieved 2011-11-21.

57. ^ REN21 (2008). Renewables 2007 Global Status Report (PDF) p. 12.
58. ^ James Russell. Record Growth in Photovoltaic Capacity and Momentum Builds for Concentrating Solar PowerVital Signs, June 3, 2010.
59. ^ "Solar Expected to Maintain its Status as the World's Fastest-Growing Energy Technology". Socialfunds.com. 2009-03-03. Retrieved 2011-11-
21.
60. ^ "Global Market Outlook 2016" (PDF). Retrieved 2012-11-01.
61. ^ a b Denis Lenardic. Large-scale photovoltaic power plants ranking 1 - 50 PVresources.com, 2010.
62. ^ "DOE Closes on Four Major Solar Projects". Renewable Energy World. 30 September 2011.
63. ^ Steve Leone (7 December 2011). "Billionaire Buffett Bets on Solar Energy". Renewable Energy World.
64. ^ "NRG Energy Completes Acquisition of 250-Megawatt California Valley Solar Ranch from SunPower".MarketWatch. 30 September 2011.
65. ^ "Exelon purchases 230 MW Antelope Valley Solar Ranch One from First Solar". Solar Server. 4 October 2011.
66. ^ Solar Integrated in New Jersey.
67. ^ "IEA says biofuels can displace 27% of transportation fuels by 2050 Washington". Platts. 20 April 2011.
68. ^ "Industry Statistics: Annual World Ethanol Production by Country". Renewable Fuels Association. Archived from the original on 2008-04-08.
Retrieved 2008-05-02.
69. ^ Macedo Isaias, M. Lima Verde Leal and J. Azevedo Ramos da Silva (2004). "Assessment of greenhouse gas emissions in the production and
use of fuel ethanol in Brazil" (PDF). Secretariat of the Environment, Government of the State of São Paulo. Archived from the original on 2008-05-28.
Retrieved 2008-05-09.
70. ^ Daniel Budny and Paulo Sotero, editor (2007-04). "Brazil Institute Special Report: The Global Dynamics of Biofuels" (PDF). Brazil Institute of
the Woodrow Wilson Center. Retrieved 2008-05-03.
71. ^ Erica Gies. As Ethanol Booms, Critics Warn of Environmental Effect The New York Times, June 24, 2010.
72. ^ a b "American Energy: The Renewable Path to Energy Security" (PDF). Worldwatch Institute. September 2006. Retrieved 2007-03-11.
73. ^ William E. Glassley. Geothermal Energy: Renewable Energy and the Environment CRC Press, 2010.
74. ^ a b Geothermal Energy Association. Geothermal Energy: International Market Update May 2010, p. 4-6.
75. ^ a b Geothermal Energy Association. Geothermal Energy: International Market Update May 2010, p. 7.

76. ^ Khan, M. Ali (2007). "The Geysers Geothermal Field, an Injection Success Story" (PDF). Annual Forum of the Groundwater Protection Council.
Retrieved 2010-01-25
77. ^ Power for the People p. 3.
78. ^ Kevin Bullis (January 27, 2012). "In the Developing World, Solar Is Cheaper than Fossil Fuels". Technology Review.
79. ^ REN21 (2010). Renewables 2010 Global Status Report p. 12.
80. ^ Fry, Carolyn. 28 June 2012. Anguilla moves towards cleaner energy
81. ^ "Ethiopia". Projectgaia.com. Retrieved 2012-11-01.
82. ^ Energy for Development: The Potential Role of Renewable Energy in Meeting the Millennium Development Goals pp. 7-9.
83. ^ "Bloomberg New Energy Finance, UNEP SEFI, Frankfurt School, Global Trends in Renewable Energy Investment 2011". Unep.org. Retrieved
2011-11-21.
84. ^ REN21 (2008). Renewables 2007 Global Status Report (PDF) p. 18.
85. ^ Hooper, Craig (2011 [last update]). "Air Force cedes the Green lead–and the lede–to Navy". nextnavy.com. Retrieved December 27, 2011.
86. ^ Signatory States[dead link]
87. ^ Signatories of IRENA’s statute[dead link]
88. ^ Mark Tran (2 November 2011). "UN calls for universal access to renewable energy". The Guardian (London).
89. ^ "Implementation of Green Bookkeeping at Reykjavik Energy". Rio02.com. Retrieved 2012-11-01.
90. ^ "Energy Rich Japan". Energyrichjapan.info. Retrieved 2012-11-01.
91. ^ "Zero Carbon Australia Stationary Energy Plan" (PDF). Retrieved 2012-11-01.
92. ^ "A Roadmap for U.S. Energy Policy". Ieer.org. 2012-03-13. Retrieved 2012-11-01.
93. ^ "A Road Map for U.S. Energy Policy" (PDF). Retrieved 2012-11-01.
94. ^ Carrasco, Alicia (2012-04-09). "Denmark commits to 100% renewable energy". Emeter.com. Retrieved 2012-11-01.
95. ^ "Vision 2050". Inforse.org. 2010-12-02. Retrieved 2012-11-01.
96. ^ "EU Sustainable Energy Vision 2040". Inforse.org. 2010-12-02. Retrieved 2012-11-01.
97. ^ "Zero Carbon World". Zerocarbonbritain.org. 2011-11-09. Retrieved 2012-11-01.

98. ^ USA (2010-11-09). "Has the World Already Passed "Peak Oil"?". News.nationalgeographic.com. Retrieved 2012-11-01.
99. ^ Inman, Mason (2011-01-17). "Going "All The Way" With Renewable Energy?". News.nationalgeographic.com. Retrieved 2012-11-01.
100. ^ "Study claims 100 percent renewable energy possible by 2030". Phys.org. Retrieved 2012-11-01.
101. ^ "Providing all global energy with wind, water, and solar power, Part I Technologies, energy resources, quantities and areas of infrastructure,
and materials" (PDF). Retrieved 2012-11-01.
102. ^ "Providing all global energy with wind, water, and solar power, Part II Reliability, system and transmission costs, and policies" (PDF). Retrieved
2012-11-01.
103. ^ Jacobson, Mark Z. (2010-06-15). "A Plan to Power 100 Percent of the Planet with Renewables". Scientificamerican.com. Retrieved 2012-11-
01.
104. ^ a b Mark Z. Jacobson and Mark A. Delucchi (2011, Vol. 39)."Providing all global energy with wind, water, and solar power, Part I: Technologies,
energy resources, quantities and areas of infrastructure, and materials". Energy Policy. Elsevier Ltd. pp. 1154–1169.
105. ^ Mark A. Delucchi and Mark Z. Jacobson (2011, Vol. 39)."Providing all global energy with wind, water, and solar power, Part II: Reliability,
system and transmission costs, and policies". Energy Policy. Elsevier Ltd. pp. 1170–1190.
106. ^ "Geothermal Power" (PDF). Retrieved 2012-11-01.
107. ^ Geothermal energy technology and current status[dead link]
108. ^ Harvesting the Wind:The Physics of Wind Turbinespage 4
109. ^ Wind, solar power paired with storage could be cost-effective way to power grid
110. ^ "International 100% Renewable Energy Conference". Irenec2012.com. 2012-06-26. Retrieved 2012-11-01.
111. ^ "IRENEC 2013". IRENEC 2013. Retrieved 2012-11-01.
112. ^ a b International Energy Agency (2007). Renewables in global energy supply: An IEA facts sheet (PDF), OECD, p. 3.
113. ^ S.C.E. Jupe, A. Michiorri, P.C. Taylor (2007). "Increasing the energy yield of generation from new and renewable energy sources". Renewable
energy 14 (2): 37–62.
114. ^ "Defense-scale supercomputing comes to renewable energy research". Sandia National Laboratories. Retrieved 2012-04-016.
115. ^ "Sandia National Laboratories". Sandia National Laboratories. Retrieved 2012-04-016.
116. ^ *Chakrabarty, Gargi, April 16th, 2009. "Stimulus leaves NREL in cold" Denver Post”
117. ^ Pernick, Ron and Wilder, Clint (2007). The Clean Tech Revolution p. 96.
118. ^ Decker, Jeff. Going Against the Grain: Ethanol from Lignocellulosics, Renewable Energy World, January 22, 2009.
119. ^ "Building Cellulose" (PDF). Retrieved 2011-11-21.
120. ^ a b Jeff Scruggs and Paul Jacob. Harvesting Ocean Wave Energy, Science, Vol. 323, 27 February 2009, p. 1176.
121. ^ "The Crown Estates Map". Retrieved 2012-03-13.
122. ^ World tidal energy first for NI, BBC News BBC News, 7 June 2007.
123. ^ Duchane, Dave; Brown, Don (December 2002). "Hot Dry Rock (HDR) Geothermal Energy Research and Development at Fenton Hill, New
Mexico". Geo-Heat Centre Quarterly Bulletin (Klamath Falls, Oregon: Oregon Institute of Technology) 23 (4): pp. 13–19. ISSN 0276-1084. Retrieved
2009-05-05
124. ^ 20 slide presentation inc geothermal maps of Australia[dead link]
125. ^ Collings AF and Critchley C (eds). Artificial Photosynthesis- From Basic Biology to Industrial Application (Wiley-VCH Weinheim 2005) p ix.
126. ^ "First Commercial Plant". Carbon Recycling International. Retrieved 11 July 2012.
127. ^ Graves, Christopher; Ebbesen, Sune D.; Mogensen, Mogens; Lackner, Klaus S. (2011). "Sustainable hydrocarbon fuels by recycling CO2 and
H2O with renewable or nuclear energy". Renewable and Sustainable Energy Reviews 15 (1): 1–23. doi:10.1016/j.rser.2010.07.014. Retrieved September
7, 2012. (Review.)
128. ^ Holte, Laura L.; Doty, Glenn N. ; McCree, David L. ; Doty, Judy M. ; Doty, F. David (2010). "Sustainable Transportation Fuels From Off-peak
Wind Energy, CO2 and Water". 4th International Conference on Energy Sustainability, May 17–22, 2010. Phoenix, Arizona: American Society of
Mechanical Engineers. Retrieved September 7, 2012.
129. ^ "George Olah CO2 to Renewable Methanol Plant, Reykjanes, Iceland" (Chemicals-Technology.com)
130. ^ "First Commercial Plant" (Carbon Recycling International)
131. ^ a b Center for Solar Energy and Hydrogen Research Baden-Württemberg (2011). "Verbundprojekt 'Power-to-Gas'" (in German). zsw-bw.de.
Retrieved September 9, 2012.
132. ^ a b Center for Solar Energy and Hydrogen Research (July 24, 2012). "Bundesumweltminister Altmaier und Ministerpräsident Kretschmann
zeigen sich beeindruckt von Power-to-Gas-Anlage des ZSW" (in German). zsw-bw.de. Retrieved September 9, 2012.
133. ^ "Doty Windfuels". Windfuels.com. Retrieved 2012-11-01.
134. ^ "CoolPlanet Energy Systems". Coolplanetbiofuels.com. 2012-10-24. Retrieved 2012-11-01.
135. ^ "Air Fuel Synthesis, Ltd". Airfuelsynthesis.com. Retrieved 2012-11-01.
136. ^ Lackner, Klaus S.; et al. (2012). "The urgency of the development of CO2 capture from ambient air".Proceedings of the National Academy of
Sciences of the United States of America 109 (33): 13156–62.doi:10.1073/pnas.1108765109. Retrieved September 7, 2012.
137. ^ Goeppert, Alain; Czaun, Miklos; Prakash, G.K. Surya; Olah, George A. (2012). "Air as the renewable carbon source of the future: an overview
of CO2 capture from the atmosphere".Energy and Environmental Science 5 (7): 7833–53.doi:10.1039/C2EE21586A. Retrieved September 7,
2012.(Review.)
138. ^ a b c Pearson, R.J.; Eisaman, M.D.; et al. (2012). "Energy Storage via Carbon-Neutral Fuels Made From CO2, Water, and Renewable
Energy". Proceedings of the IEEE 100(2): 440–60. doi:10.1109/JPROC.2011.2168369. Retrieved September 7, 2012. (Review.)
139. ^ Fraunhofer-Gesellschaft (May 5, 2010). "Storing green electricity as natural gas". fraunhofer.de. Retrieved September 9, 2012.
140. ^ Socolow, Robert; et al. (June 1, 2011). Direct Air Capture of CO2 with Chemicals: A Technology Assessment for the APS Panel on Public
Affairs (peer reviewed literature review). American Physical Society. Retrieved September 7, 2012.
141. ^ Pennline, Henry W.; et al. (2010). "Separation of CO2 from flue gas using electrochemical cells". Fuel 89 (6): 1307–
14. doi:10.1016/j.fuel.2009.11.036. Retrieved September 7, 2012.
142. ^ Eisaman, Matthew D.; et al. (2012). "CO2 extraction from seawater using bipolar membrane electrodialysis".Energy and Environmental
Science 5 (6): 7346–52.doi:10.1039/C2EE03393C. Retrieved September 7, 2012.
143. ^ International Energy Agency (2007). Contribution of Renewables to Energy Security IEA Information Paper, p. 5.
144. ^ "Whatever Happened to Wind Energy?". LiveScience. 14 January 2008. Retrieved 17 January 2012.
145. ^ Simon Gourlay (2008-08-12). "Wind farms are not only beautiful, they're absolutely necessary". The Guardian(UK). Retrieved 17 January
2012.
Bibliography

Aitken, Donald W. (2010). Transitioning to a Renewable Energy Future, International Solar Energy Society, January, 54 pages.
HM Treasury (2006). Stern Review on the Economics of Climate Change, 575 pages.
International Council for Science (c2006). Discussion Paper by the Scientific and Technological Community for the 14th session of the United Nations
Commission on Sustainable Development, 17 pages.
International Energy Agency (2006). World Energy Outlook 2006: Summary and Conclusions, OECD, 11 pages.
International Energy Agency (2007). Renewables in global energy supply: An IEA facts sheet, OECD, 34 pages.
International Energy Agency (2008). Deploying Renewables: Principles for Effective Policies, OECD, 8 pages.
International Energy Agency (2011). Deploying Renewables 2011: Best and Future Policy Practice, OECD.
International Energy Agency (2011). Solar Energy Perspectives, OECD.
Lovins, Amory B. (2011). Reinventing Fire: Bold Business Solutions for the New Energy Era, Chelsea Green Publishing, 334 pages.
Makower, Joel, and Ron Pernick and Clint Wilder (2009). Clean Energy Trends 2009, Clean Edge.
National Renewable Energy Laboratory (2006). Non-technical Barriers to Solar Energy Use: Review of Recent Literature, Technical Report, NREL/TP-
520-40116, September, 30 pages.
REN21 (2008). Renewables 2007 Global Status Report, Paris: REN21 Secretariat, 51 pages.
REN21 (2009). Renewables Global Status Report: 2009 Update, Paris: REN21 Secretariat.
REN21 (2010). Renewables 2010 Global Status Report, Paris: REN21 Secretariat, 78 pages.
United Nations Environment Programme and New Energy Finance Ltd. (2007). Global Trends in Sustainable Energy Investment 2007: Analysis of Trends
and Issues in the Financing of Renewable Energy and Energy Efficiency in OECD and Developing Countries, 52 pages.
Worldwatch Institute and Center for American Progress (2006). American energy: The renewable path to energy security, 40 pages.
External links
Wikinews has news related
to:
Renewable energy

The dictionary definition of renewable energy at Wiktionary
Media related to Renewable energy at Wikimedia Commons
[show]
V
T
E
Renewable energy by country
[show]
V
T
E
Environmental technology
[show]
V
T
E
Sustainability

[show]
V
T
E
Technology
2.1.10-Renewable natural gasRenewable natural gas

From Wikipedia, the free encyclopedia
Renewable natural gas, also known as sustainable natural gas, is a biogas which has been upgraded to a quality similar to fossil natural gas. A biogas
is a gas methane obtained frombiomass. By upgrading the quality to that of natural gas, it becomes possible to distribute the gas to customers via the
existing gas grid, within existing appliances. Renewable natural gas is a subset of synthetic natural gas or substitute natural gas (SNG.
Renewable natural gas can be produced economically, and distributed via the existing gas grid, making it an attractive means of supplying existing
premises with renewable heat and renewable gas energy, while requiring no extra capital outlay of the customer.
The existing gas network allows distribution of gas energy over vast distances at a minimal cost in energy. Existing networks would allow biogas to be
sourced from remote markets that are rich in low-cost biomass (Russia or Scandinavia for example).
The UK National Grid believes that at least 15% of all gas consumed could be made from sewage slurry, old sandwiches and other food thrown away by
supermarkets, as well as organic waste created by businesses such as breweries.[1]
Contents
[hide]
1 Manufacturing
2 Commercial development
o 2.1 BioSNG
o 2.2 Upgraded Biogas
3 See also
4 External links
5 References
[edit]Manufacturing

A biomass to SNG efficiency of 70% can be achieved.[2] costs are minimized by maximising production scale, and by locating plant next to transport links
(e.g. a port or river) for the chosen source of biomass. The existing gas storage infrastructure would allow the plant to continue to manufacture gas at the
full utilisation rate even during periods of weak demand, helping minimise manufacturing capital costs per unit of gas produced.[3]
Renewable gas can be produced through three main processes; anaerobic digestion of organic (normally moist) material, thermal gasification of organic
(normally dry) material and produced through the Sabatier reaction. In these cases the gas from primary production has to be upgraded in a secondary
step to produce gas that is suitable for injection into the gas grid.[4]
[edit]Commercial development
[edit]BioSNG
Göteborg Energi and E.ON are hoping to be among the first to develop a commercial scale BioSNG plant in Gothenburg, Sweden.[5] The Energy
Research Centre of the Netherlands has conducted extensive research on large-scale SNG production from woody biomass, based on the importation of
feedstocks from abroad.[6] SNG is of particular interest in countries with extensive natural gas distribution networks. Core advantages of SNG include
compatibility with existing natural gas infrastructure, higher efficiency that Fisher-Tropsch fuels production and smaller-production scale than other second
generation biofuel production systems.[7]
Renewable natural gas plants based on wood can be categorized into two main categories, one being allothermal, which has the energy provided by a
source outside of the gasifier. One example is the double-chambered fluidized bed gasifiers consisting of a separate combustion and gasification
chambers. Autothermal systems generate the heat within the gasifier, but require the use of pure oxygen to avoid nitrogen dilution.[8]
In the UK, the National Non-Food Crops Centre found that any UK BioSNG plant built by 2020 would be highly likely to use ‘clean woody feedstocks' and
that there are several regions with good availability of that source.[9][10]
[edit]Upgraded Biogas
In the UK, using anaerobic digestion is growing as a means of producing renewable biogas, with nearly 50 sites built across the country.[11] Ecotricity has
announced plans to supply green gas to UK consumers via the national grid.[12] Centrica has also announced that it will soon begin injecting gas,
manufactured from sewage, into the gas grid.[13] In Canada, FortisBC, a gas provider in British Columbia, has begun injecting limited amounts of
renewably created natural gas into its existing gas distribution system to begin to offer customers renewable gas options.[14]

Sustainable Synthetic Natural Gas
Sustainable SNG is produced by high temperature Oxygen blown slagging co-gasification at 70 to 75 bar pressure of liquid and solid contaminated and
wood, biomass, negative cost hazardous and non-hazardous wastes, coal and Natural Gas. This uses coal to SNG technology developed from the end of
WW2 onwards, and successfully demonstrated at SVZ Schwarze Pumpe. The same technology can be transferred from the low grade lignite to fertiliser
industry, where it is currently being successfully developed in China, to the renewable energy industry.
The advantage of a wide range of feedstocks is that much larger quantities of renewable SNG can be produced compared with Biogas, with fewer supply
chain limitations. A wide range of fuels with an overall biogenic Carbon content of 50 to 55% is technically and financially viable. Hydrogen is added to the
fuel mix during the gasification process, and Carbon Dioxide is removed by capture from the purge gas 'slip stream' Syngas clean-up and catalytic
methanation stages.
Large scale Sustainable SNG will enable the UK gas and electricity grids to be substantially de-carbonised in parallel at source, while maintaining the
existing operational and economic relationship between the gas and electricity grids. Carbon Capture and Sequestration can be added at little additional
cost, thereby progressively achieving deeper de-carbonisation of the existing gas and electricity grids at low cost and operational risk. Cost benefit studies
indicate that large scale 50% biogenic Carbon content Sustainable SNG can be injected into the high pressure gas transmission grid at a cost of around
65p/therm. At this cost, it is possible to re-process fossil Natural Gas, used as an energy input into the gasification process, into 5 to 10 times greater
quantity of Sustainable SNG. Large scale Sustainable SNG, combined with continuing Natural Gas production from UK Continental Shelf and
unconventional gas, will potentially enable the cost of UK peak electricity to be de-coupled from international oil denominated 'take or pay' gas supply
contracts.
Applications
- Electricity Generation - Space Heating - Process Heating - Biomass with Carbon Capture and Storage - Transportation Fuel
[edit]See also
Energy portal
Sustainable development portal

Anaerobic digestion
Biogas
Biogas powerplant
Biofuel
Landfill gas
Landfill gas utilization
Renewable energy
Renewable heat
Sustainable energy
[edit]External links
National Grid U.S. - Vision for a Sustainable Gas Network [1]
American Gas Foundation Study: The Potential for Renewable Gas [2]
SGC Rapport 187 Substitute natural gas from biomass gasification
SGC Rapport on gasification and methanation
[http://www.eee-info.net/cms/netautor/napro4/wrapper/media.php?
Production of Synthetic Natural Gas (SNG) from Biomass- From Energy Research Centre of the Netherlands
ECN SNG Website [3]
http://www.biosng.com/synthetic-natural-gas/
id=%2C%2C%2C%2CZmlsZW5hbWU9YXJjaGl2ZSUzRCUyRjIwMDkuMDIuMTMlMkYxMjM0NTE1MDMxLnBkZiZybj1lbmdsJTIwU05HJTIwVGVjaG5vbG
9neS5wZGY%3D SNG Platform in Güssing]
National Grid/UK Sustainable Gas Group
[edit]References

1. ^ The Guardian 'Food waste to provide green gas for carbon-conscious consumers'
2. ^ Kachan & Co. 'The Bio Natural Gas Opportunity'
3. ^ Energy Research Centre of the Netherlands 'Heat from Biomass via Synthetic Natural Gas'
4. ^ Danish Gas Technology Centre 'Sustainable Gas Enters the European Gas Distribution System'
5. ^ Göteborg Energi 'Gothenburg Biomass Gasification Project, GoBiGas'
6. ^ "BioSNG: Synthetic Natural Gas". Retrieved 27 December 2012.
7. ^ Åhman, Max (2010). "Biomethane in the transport sector—An appraisal of the forgotten option". Energy Policy 38 (1): 208–217.
8. ^ Van der Meijden, C.M. (2010). Development of the MILENA gasification technology for the production of Bio-SNG. Petten, Netherlands: ECN.
Retrieved 21 October 2012.
9. ^ 'Potential for BioSNG Production in the UK, NNFCC 10-008'
10. ^ New Energy Focus 'BioSNG could be economically attractive for renewable heat'
11. ^ The Official AD Information Portal 'Biogas Plant Map'
12. ^ The Guardian 'Food waste to provide green gas for carbon-conscious consumers'
13. ^ The Guardian 'Human waste turned into renewable gas to power homes'
14. ^ Kachan & Co.'New Bio Natural Gas May Assist In Adding Solar and Wind to Utility Renewable Power Generation, Study Finds'
[show]
V
T
E
Bioenergy
[show]

V
T
E
Waste and waste management
[show]
V
T
E
Sustainability
2.1.11-Relative cost of electricity generated by different sources
Cost of electricity by sourceFrom Wikipedia, the free encyclopedia
(Redirected from Relative cost of electricity generated by different sources)
For the completely different subject, price of electricity, see Electricity pricing.
The cost of electricity (typically cents/kWh, Euro/kWh, Euro or $/MWh) generated by different sources is a calculation of the cost
of generating electricity at the point of connection to a load or electricity grid. It includes the initial capital, discount rate, as well as the costs of

continuous operation, fuel, and maintenance. This type of calculation assists policy makers, researchers and others to guide discussions and
decision making.
Contents
[hide]
1 Cost factors
2 Calculations
o 2.1 System boundaries
o 2.2 Discount rate
3 Estimates
o 3.1 US Department of Energy estimates
o 3.2 UK 2010 estimates
o 3.3 French 2011 estimates
o 3.4 Analysis from different sources
o 3.5 Other estimates
4 Beyond the power station terminals, or system costs
5 Externality and insurance costs of energy sources
6 Photovoltaics
7 Additional cost factors
o 7.1 Extraction, emissions, transmission, health
8 See also
9 Further reading
10 References
[edit]Cost factors

The National Renewable Energy Laboratory projects that the levelized cost of wind power will decline about 25% from 2012 to 2030.[1]
While calculating costs, several internal cost factors have to be considered.[2] (Note the use of "costs," which is not the actual selling price, since
this can be affected by a variety of factors such as subsidies and taxes):
Capital costs (including waste disposal and decommissioning costs for nuclear energy) - tend to be low for fossil fuel power stations; high
for wind turbines, solar PV; very high for waste to energy, wave and tidal, solar thermal, and nuclear[citation needed].
Fuel costs - high for fossil fuel and biomass sources, low for nuclear, and zero for renewables.[citation needed]
Factors such as the costs of waste (and associated issues) and different insurance costs are not included in the following: Works power,
own use orparasitic load - that is, the portion of generated power actually used to run the stations pumps and fans has to be allowed for.[citation
needed]
To evaluate the total cost of production of electricity, the streams of costs are converted to a net present value using the time value of money.
These costs are all brought together using discounted cash flow.[3][4] The marginal cost of production at very low levels of output should be
relatively low. Small amount of wind due to nature would result in very low levels of output. However, the wind turbine is the initial investment of
producing wind energy; therefore, once the turbine has been built, not much money will be invested into producing wind energy other than
maintenance. Having a very low level of output means the turbines have already been built, but since wind is free, to produce an extra unit of
energy solely depends on nature, which in this case, wind is free. Therefore, the marginal cost would be relatively low due to the fact that wind, the
energy source is free and the maintenance of the turbines would be relatively low. Wind power normally has a low marginal cost (zero fuel costs)
and therefore enters near the bottom of the supply curve. This shifts the supply curve to the right, resulting in a lower power price, depending on
the price elasticity of the power demand. In general, the price of power is expected to be lower during periods with high wind than in periods with
low wind. As mentioned above, there may be congestions in power transmission, especially during periods with high wind power generation. Thus,

if the available transmission capacity cannot cope with the required power export, the supply area is separated from the rest of the power market
and constitutes its own pricing area. With an excess supply of power in this area, conventional power plants have to reduce their production, since
it is generally not possible to limit the power production of wind. In most cases, this will lead to a lower power price in this sub-market.
[edit]Calculations
See also: Grid parity
Levelized Energy Cost (LEC, also known as Levelised Cost of Energy, abbreviated as LCOE[5]) is the price at which electricity must be generated
from a specific source to break even over the lifetime of the project. It is an economic assessment of the cost of the energy-generating system
including all the costs over its lifetime: initial investment, operations and maintenance, cost of fuel, cost of capital, and is very useful in calculating
the costs of generation from different sources.
It can be defined in a single formula as:[6]
where
= Average lifetime levelized electricity generation cost
= Investment expenditures in the year t
= Operations and maintenance expenditures in the year t
= Fuel expenditures in the year t
= Electricity generation in the year t
= Discount rate
= Life of the system
Typically LECs are calculated over 20 to 40 year lifetimes, and are given in the units of currency per kilowatt-hour, for example AUD/kWh or
EUR/kWh or per megawatt-hour, for example AUD/MWh (as tabulated below).[7] However, care should be taken in comparing different LCOE

studies and the sources of the information as the LCOE for a given energy source is highly dependent on the assumptions, financing terms and
technological deployment analyzed.[7] In particular, assumption of Capacity factor has significant impact on the calculation of LCOE. For example,
Solar PV may have a Capacity Factor as low as 10% depending on location. Thus, a key requirement for the analysis is a clear statement of the
applicability of the analysis based on justified assumptions.[8]
[edit]System boundaries
When comparing LECs for alternative systems, it is very important to define the boundaries of the 'system' and the costs that are included in it. For
example, should transmissions lines and distribution systems be included in the cost? Typically only the costs of connecting the generating source
into the transmission system is included as a cost of the generator. But in some cases wholesale upgrade of the Grid is needed. Careful thought
has to be given to whether or not these costs should be included in the cost of power.
Should R&D, tax, and environmental impact studies be included? Should the costs of impacts on public health and environmental damage be
included? Should the costs of government subsidies be included in the calculated LEC?
[edit]Discount rate
Another key issue is the decision about the value of the discount rate . The value that is chosen for can often 'weigh' the decision towards one
option or another, so the basis for choosing the discount must clearly be carefully evaluated. See internal rate of return. The appropriate discount
rate is not the actual cost of capital, but typically 3.5%.[9]
A more telling economic assessment might be the marginal cost of electricity. This value would serve the purpose of comparing the added cost of
increasing electricity generation by one unit from different sources of electricity generation.
[edit]Estimates
[edit]US Department of Energy estimates
The tables below list the estimated cost of electricity by source for plants entering service in 2017. The tables are from a January 23, 2012 report
of the Energy Information Administration (EIA) of the U.S. Department of Energy (DOE) called "Levelized Cost of New Generation Resources in
the Annual Energy Outlook 2012".[10]

Total System Levelized Cost (the rightmost column) gives the dollar cost per megawatt-hour that must be charged over time in order to
pay for the total cost. Divide by 1000 to get the cost per kilowatt-hour (move the decimal point 1 place to the left to get the cost in cents/kWh).
These calculations reflect an adjustment to account for the high level of carbon dioxide produced by coal plants. From the EIA report:
"a 3-percentage point increase in the cost of capital is added when evaluating investments in greenhouse gas (GHG) intensive
technologies like coal-fired power and coal-to-liquids (CTL) plants without carbon control and sequestration (CCS). While the 3-percentage
point adjustment is somewhat arbitrary, in levelized cost terms its impact is similar to that of a $15 per metric ton of carbon dioxide (CO2)
emissions fee. ... As a result, the levelized capital costs of coal-fired plants without CCS are higher than would otherwise be expected."[10]
No tax credits or incentives are incorporated in the tables. From the EIA report (emphasis added):
"Levelized cost represents the present value of the total cost of building and operating a generating plant over an assumed financial life
and duty cycle, converted to equal annual payments and expressed in terms of real dollars to remove the impact of inflation. Levelized
cost reflects overnight capital cost, fuel cost, fixed and variable O&M cost, financing costs, and an assumed utilization rate for
each plant type. The availability of various incentives including state or federal tax credits can also impact the calculation of levelized
cost. The values shown in the tables below do not incorporate any such incentives."[10]
Incentives, tax credits, production mandates, etc. are discussed in the overall comprehensive EIA report: "Annual Energy Outlook
2012".[11][12][13]
Photovoltaics (solar PV) can be used both by distributed residential or commercial users and utility scale power plants. The costs shown
are for utility scale photovoltaic power plants.[10]
Estimated Levelized Cost of New Generation Resources, 2017[10]
U.S. Average Levelized Cost for Plants Entering Service in 2017(2010 USD/MWh)

Plant TypeCapacity
Factor(%)
LevelizedCapital
Cost
FixedO&M
VariableO&M
(includingfuel)
TransmissionInvestment
TotalSystem
LevelizedCost
Conventional Coal 85 65.8 4.0 28.6 1.2 99.6
Advanced Coal 85 75.2 6.6 29.2 1.2 112.2
Advanced Coal with CCS 85 93.3 9.3 36.8 1.2 140.7
Natural Gas Fired
Conventional Combined Cycle 87 17.5 1.9 48.0 1.2 68.6
Advanced Combined Cycle 87 17.9 1.9 44.4 1.2 65.5
Advanced CC with CCS 87 34.9 4.0 52.7 1.2 92.8
Conventional Combustion Turbine 30 46.0 2.7 79.9 3.6 132.0
Advanced Combustion Turbine 30 31.7 2.6 67.5 3.6 105.3
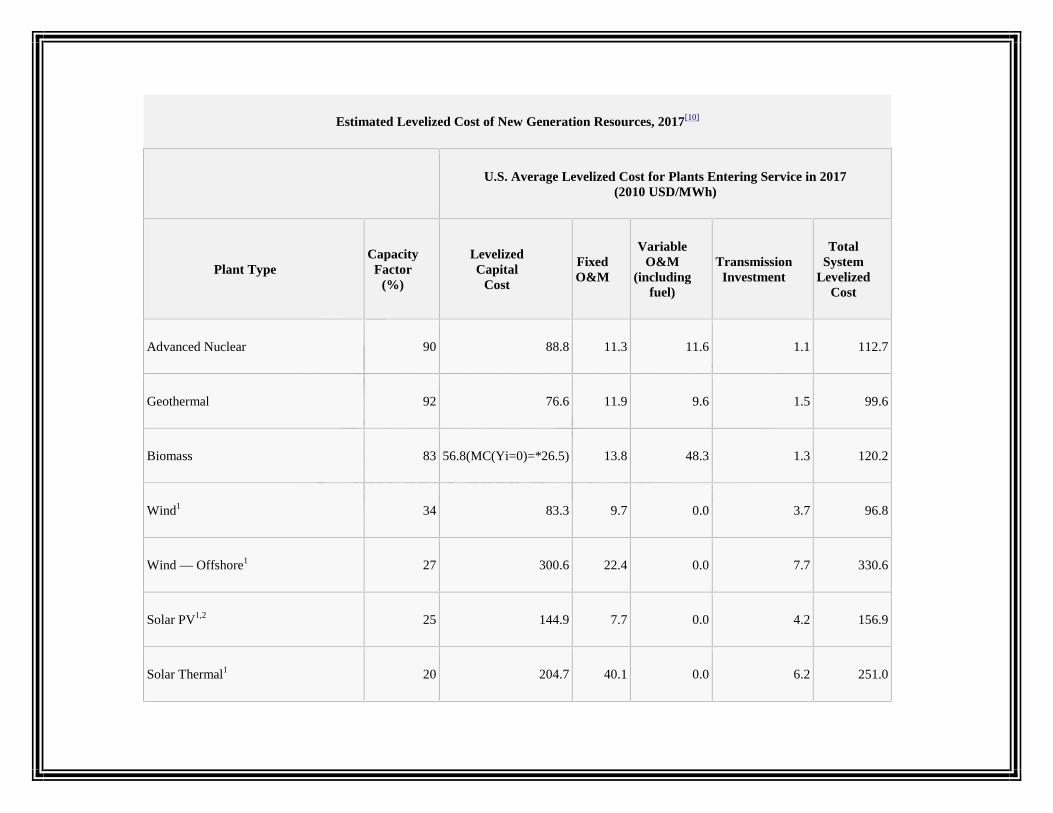
Estimated Levelized Cost of New Generation Resources, 2017[10]
U.S. Average Levelized Cost for Plants Entering Service in 2017(2010 USD/MWh)
Plant TypeCapacity
Factor(%)
LevelizedCapital
Cost
FixedO&M
VariableO&M
(includingfuel)
TransmissionInvestment
TotalSystem
LevelizedCost
Advanced Nuclear 90 88.8 11.3 11.6 1.1 112.7
Geothermal 92 76.6 11.9 9.6 1.5 99.6
Biomass 83 56.8(MC(Yi=0)=*26.5) 13.8 48.3 1.3 120.2
Wind1 34 83.3 9.7 0.0 3.7 96.8
Wind — Offshore1 27 300.6 22.4 0.0 7.7 330.6
Solar PV1,2 25 144.9 7.7 0.0 4.2 156.9
Solar Thermal1 20 204.7 40.1 0.0 6.2 251.0

Estimated Levelized Cost of New Generation Resources, 2017[10]
U.S. Average Levelized Cost for Plants Entering Service in 2017(2010 USD/MWh)
Plant TypeCapacity
Factor(%)
LevelizedCapital
Cost
FixedO&M
VariableO&M
(includingfuel)
TransmissionInvestment
TotalSystem
LevelizedCost
Hydro1 53 76.9 4.0 6.0 2.1 89.9
1Non-dispatchable (Hydro is dispatchable within a season, but nondispatchable overall-limited by site and season)2Costs are expressed in terms of net AC power available to the grid for the installed capacity
Regional Variation in Levelized Costs of New Generation Resources, 2017[11]
Plant Type
Range for Total System Levelized Costs(2010 USD/MWh)
Minimum Average Maximum
Conventional Coal 90.1 99.6 116.3
Advanced Coal 103.9 112.2 126.1

Advanced Coal with CCS 129.6 140.7 162.4
Natural Gas Fired
Conventional Combined Cycle 61.8 68.6 88.1
Advanced Combined Cycle 58.9 65.5 83.3
Advanced CC with CCS 82.8 92.8 110.9
Conventional Combustion Turbine 94.6 132.0 164.1
Advanced Combustion Turbine 80.4 105.3 133.0
Advanced Nuclear 108.4 112.7 120.1
Geothermal 85.0 99.6 113.9
Biomass 101.5 120.2 142.8
Wind 78.2 96.8 114.1

Wind — Offshore 307.3 330.6 350.4
Solar PV 122.2 156.9 245.6
Solar Thermal 182.7 251.0 400.7
Hydro[14] 57.8 88.9 147.6
O&M = operation and maintenance.
CC = combined cycle.
CCS = carbon capture and sequestration.
PV = photovoltaics.
GHG = greenhouse gas.[edit]UK 2010 estimates
In March 2010, a new report on UK levelised generation costs was published by Parsons Brinckerhoff.[15] It puts a range on each
cost due to various uncertainties. Combined cycle gas turbines without CO2 capture are not directly comparable to the other low
carbon emission generation technologies in the PB study. The assumptions used in this study are given in the report.
UK energy costs for different generation technologies in pounds permegawatt hour (2010)
Technology Cost range (£/MWh)[citation needed]

UK energy costs for different generation technologies in pounds permegawatt hour (2010)
Technology Cost range (£/MWh)[citation needed]
New nuclear 80–105
Onshore wind 80–110
Biomass 60–120
Natural gas turbines with CO2 capture 60–130
Coal with CO2 capture 100–155
Solar farms 125–180
Offshore wind 150–210
Natural gas turbine, no CO2 capture 55–110
Tidal power 155–390

Divide the above figures by 10 to obtain the price in pence per kilowatt-hour.
More recent UK estimates are the Mott MacDonald study released by DECC in June 2010 [16] and the Arup study for DECC
published in 2011.[17]
[edit]French 2011 estimates
The International Agency for the Energy and EDF have estimated for 2011 the following costs. For the nuclear power they
include the costs due to new safety investments to upgrade the French nuclear plant after the Fukushima Daiichi nuclear
disaster; the cost for those investments is estimated at 4 €/MWh. Concerning the solar power the estimate at 293 €/MWh is for a
large plant capable to produce in the range of 50-100 GWh/year located in a favorable location (such as in Southern Europe).
For a small household plant capable to produce typically around 3 MWh/year the cost is according to the location between 400
and 700 €/MWh. Currently solar power is by far the most expensive renewable source to produce electricity, although increasing
efficiency and longer lifespan of photovoltaic panels together with reduced production costs could make this source of energy
more competitive.
French energy costs for different generation technologies in Euros per megawatt hour (2011)
Technology Cost (€/MWh)
Hydro power 20
Nuclear 50
Natural gas turbines without CO2 capture 61

French energy costs for different generation technologies in Euros per megawatt hour (2011)
Technology Cost (€/MWh)
Onshore wind 69
Solar farms 293
[edit]Analysis from different sources
█ Conventional oil █ Unconventional oil █ Biofuels █ Coal █ Nuclear █ Wind
Colored vertical lines indicate various historical oil prices. From left to right:
— 1990s average — January 2009 — 1979 peak — 2008 peak
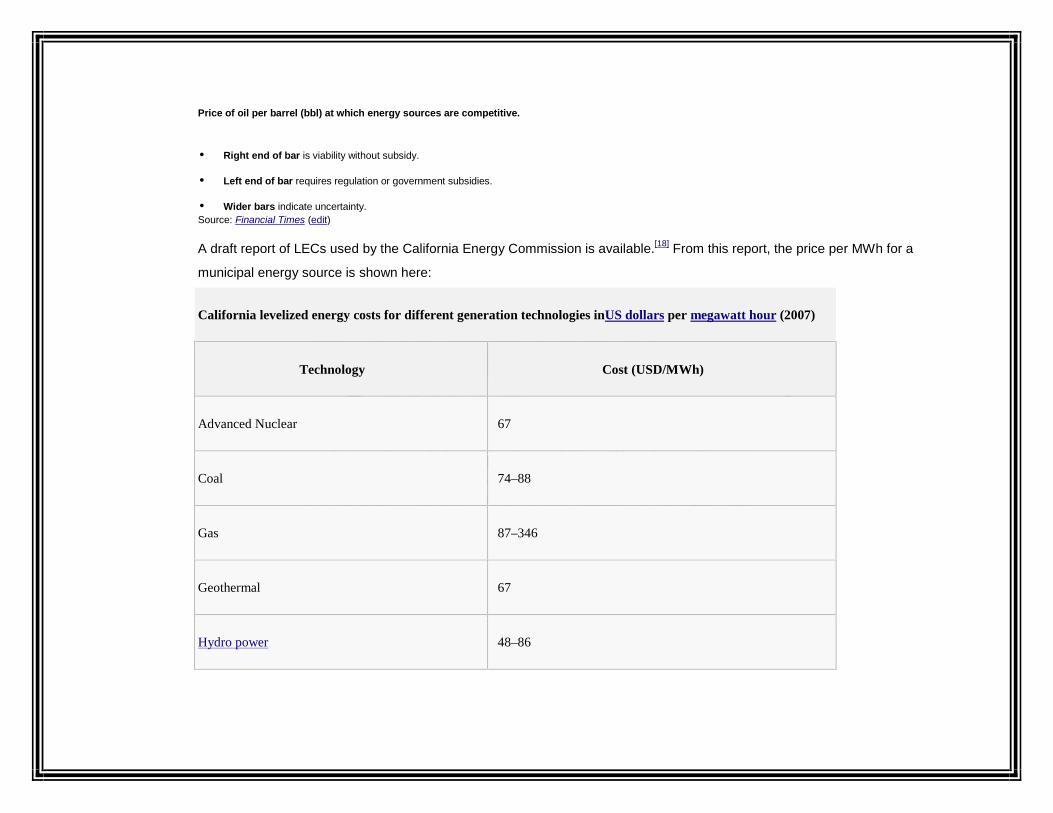
Price of oil per barrel (bbl) at which energy sources are competitive.
Right end of bar is viability without subsidy.
Left end of bar requires regulation or government subsidies.
Wider bars indicate uncertainty.Source: Financial Times (edit)
A draft report of LECs used by the California Energy Commission is available.[18] From this report, the price per MWh for a
municipal energy source is shown here:
California levelized energy costs for different generation technologies inUS dollars per megawatt hour (2007)
Technology Cost (USD/MWh)
Advanced Nuclear 67
Coal 74–88
Gas 87–346
Geothermal 67
Hydro power 48–86

California levelized energy costs for different generation technologies inUS dollars per megawatt hour (2007)
Technology Cost (USD/MWh)
Wind power 60
Solar 116–312
Biomass 47–117
Fuel Cell 86–111
Wave Power 611
Note that the above figures incorporate tax breaks for the various forms of power plants. Subsidies range from 0% (for Coal) to
14% (for nuclear) to over 100% (for solar).
The following table gives a selection of LECs from two major government reports from Australia.[19][20] Note that these LECs
do not include any cost for the greenhouse gasemissions (such as under carbon tax or emissions trading scenarios) associated
with the different technologies.
Levelised energy costs for different generation technologies in Australian dollars per megawatt hour(2006)

Technology Cost (AUD/MWh)
Nuclear (to COTS plan)[20] 40–70
Nuclear (to suit site; typical)[20] 75–105
Coal 28–38
Coal: IGCC + CCS 53–98
Coal: supercritical pulverized + CCS 64–106
Open-cycle Gas Turbine 101
Hot fractured rocks 89
Gas: combined cycle 37–54
Gas: combined cycle + CCS 53–93
Small Hydro power 55

Levelised energy costs for different generation technologies in Australian dollars per megawatt hour(2006)
Technology Cost (AUD/MWh)
Wind power: high capacity factor 63
Solar thermal 85
Biomass 88
Photovoltaics 120

In 1997 the Trade Association for Wind Turbines (Wirtschaftsverband Windkraftwerke e.V. –WVW) ordered a study into the
costs of electricity production in newly constructed conventional power plants from the Rheinisch-Westfälischen Institute for
Economic Research –RWI). The RWI predicted costs of electricity production per kWh for the basic load for the year 2010 as
follows:[citation needed]
Fuel Cost per kilowatt hour in euro cents.

Fuel Cost per kilowatt hour in euro cents.
Nuclear Power 10.7 €ct – 12.4 €ct
Brown Coal (Lignite) 8.8 €ct – 9.7 €ct
Black Coal (Bituminous) 10.4 €ct – 10.7 €ct
Natural gas 11.8 €ct – 10.6 €ct.
The part of a base load represents approx. 64% of the electricity production in total. The costs of electricity production for the
mid-load and peak load are considerably higher. There is a mean value for the costs of electricity production for all kinds of
conventional electricity production and load profiles in 2010 which is 10.9 €ct to 11.4 €ct per kWh. The RWI calculated this on the
assumption that the costs of energy production would depend on the price development of crude oil and that the price of crude oil
would be approx. 23 US$ per barrel in 2010. In fact the crude oil price is about 80 US$ in the beginning of 2010. This means that
the effective costs of conventional electricity production still need to be higher than estimated by the RWI in the past.
The WVW takes the legislative feed-in-tariff as basis for the costs of electricity production out of renewable energies because
renewable power plants are economically feasible under the German law (German Renewable Energy Sources Act-EEG).
The following figures arise for the costs of electricity production in newly constructed power plants in 2010:[citation needed]
Energy source Costs of electricity production in euros per megawatt hour

Energy source Costs of electricity production in euros per megawatt hour
Nuclear Energy 107.0 – 124.0
Brown Coal 88.0 – 97.0
Black Coal 104.0 – 107.0
Domestic Gas 106.0 – 118.0
Wind Energy Onshore 49.7 – 96.1
Wind Energy Offshore 35.0 – 150.0
Hydropower 34.7 – 126.7
Biomass 77.1 – 115.5
Solar Electricity 284.3 – 391.4
[edit]Other estimates
A 2010 study by the Japanese government, called the Energy White Paper, concluded the cost for kilowatt hour was ¥49 for
solar, ¥10 to ¥14 for wind, and ¥5 or ¥6 for nuclear power. Masayoshi Son, an advocate for renewable energy, however, has

pointed out that the government estimates for nuclear power did not include the costs for reprocessing the fuel or disaster
insurance liability. Son estimated that if these costs were included, the cost of nuclear power was about the same as wind
power.[21][22][23]
[edit]Beyond the power station terminals, or system costs
The raw costs developed from the above analysis are only part of the picture in planning and costing a large modern power grid.
Other considerations are the temporal load profile, i.e. how load varies second to second, minute to minute, hour to hour, month
to month. To meet the varying load, generally a mix of plant options is needed, and the overall cost of providing this load is then
important. Wind power has poor capacity contribution, so during windless periods, some form of back up must be provided. All
other forms of power generation also require back up, though to a lesser extent. To meet peak demand on a system, which only
persist for a few hours per year, it is often worth using very cheap to build, but very expensive to operate plant - for example
some large grids also use load shedding coupled with diesel generators [24] at peak or extreme conditions - the very high kWh
production cost being justified by not having to build other more expensive capacity and a reduction in the otherwise continuous
and inefficient use of spinning reserve.
In the case of wind energy, the additional costs in terms of increased back up and grid interconnection to allow for diversity of
weather and load may be substantial. This is because wind stops blowing frequently even in large areas at once and for
prolonged periods of time. Some wind advocates have argued that in the pan-European case back up costs are quite low,
resulting in overall wind energy costs about the same as present day power.[25] However, such claims are generally considered
too optimistic, except possibly for some marginal increases that, in particular circumstances, may take advantage of the existing
infrastructure.[citation needed]
The cost in the UK of connecting new offshore wind in transmission terms, has been consistently put by Grid/DECC/Ofgem at
£15billion by 2020. This £15b cost does not include the cost of any new connections to Europe - interconnectors, or a supergrid,
as advocated by some. The £15b cost is the cost of connecting offshore wind farms by cables typically less than 12 km in length,
to the UK's nearest suitable onshore connection point. There are total forecast onshore transmission costs of connecting various
new UK generators by 2020, as incurred from 2010, of £4.7 billion, by comparison.

When a new plant is being added to a power system or grid, the effects are quite complex - for example, when wind energy is
added to a grid, it has a marginal cost associated with production of about £20/MWh (most incurred as lumpy but running-related
maintenance - gearbox and bearing failures, for instance, and the cost of associated downtime), and therefore will always offer
cheaper power than fossil plant - this will tend to force the marginally most expensive plant off the system. A mid range fossil
plant, if added, will only force off those plants that are marginally more expensive. Hence very complex modelling of whose
systems is required to determine the likely costs in practice of a range of power generating plant options, or the effect of adding a
given plant.
With the development of markets, it is extremely difficult for would-be investors to estimate the likely impacts and cost benefit of
an investment in a new plant, hence in free market electricity systems, there tends to be an incipient shortage of capacity, due to
the difficulties of investors accurately estimating returns, and the need to second guess what competitors might do.[citation needed]
The Institution of Engineers and Shipbuilders in Scotland commissioned a former Director of Operations of the British National
Grid, Colin Gibson, to produce a report on generation levelised costs that for the first time would include some of the
transmission costs as well as the generation costs. This was published in December 2011 and is available on the
internet :.[26] The institution seeks to encourage debate of the issue, and has taken the unusual step among compilers of such
studies of publishing a spreadsheet showing its data available on the internet :[27]
[edit]Externality and insurance costs of energy sources
Main article: Environmental impact of the energy industry
Main article: Economics of new nuclear power plants
Nuclear power plants built recently, or in the process of being built, have incurred many cost overruns. Those being built now are
expected to incur further cost overruns due to design changes after the Fukushima Daiichi nuclear disaster.[28] However there are
also many nuclear reactors being built underbudget and on schedule, with two new Chinese reactors expected to be
commissioned at the end of 2013 and autumn 2014 respectively.[29]

Nuclear power has in the past been granted indemnity from the burden of carrying full third party insurance liabilities in
accordance with the Paris convention on nuclear third-party liability, the Brussels supplementary convention, and the Vienna
convention on civil liability for nuclear damage.[30]
The limited insurance that is required does not cover the full cost of a major nuclear accident of the kind that occurred
at Chernobyl or Fukushima. An April 2011 report by Versicherungsforen Leipzig, a Leipzig company that specializes in actuarial
calculations states that full insurance of German power plants against nuclear disasters would increase the price of nuclear
electricity by €0.14/kWh ($0.20/kWh) to €2.36/kWh ($3.40/kWh), if the full potential damage sum of 6 trillion Euro is to be paid as
insurance fee over a time span of 100 or 10 years, respectively.[31][32][33][34][35][36]
The US Energy Information Administration predicts that coal and gas are set to be continually used to deliver the majority of the
world's electricity,[37] this is expected to result in the evacuation of millions of homes in low lying areas, and an annual cost of
hundreds of billions of dollars worth of property damage.[38][39][40][41][42][43][44]
Furthermore, with the ongoing process of whole nations being slowly plunged underwater, due to fossil fuel use,[45] massive
international climate litigation lawsuits against fossil fuel users are currently beginning in the International Court of Justice.[46][47]
An EU funded research study known as ExternE, or Externalities of Energy, undertaken over the period of 1995 to 2005 found
that the cost of producing electricity from coal or oil would double over its present value, and the cost of electricity production
from gas would increase by 30% if external costs such as damage to the environment and to human health, from the particulate
matter,nitrogen oxides, chromium VI and arsenic emissions produced by these sources, were taken into account. It was
estimated in the study that these external, downstream, fossil fuel costs amount up to 1%-2% of the EU’s entire Gross Domestic
Product (GDP), and this was before the external cost of global warming from these sources was even included.[48] [49]
[edit]Photovoltaics
The table below illustrates the calculated total cost in US cents per kilowatt-hour of electricity generated by a photovoltaic system
as function of the investment cost and the efficiency, assuming some accounting parameters such as cost of capital and
depreciation period. The row headings on the left show the total cost, per peak kilowatt (kWp), of a photovoltaic installation. The

column headings across the top refer to the annual energy output in kilowatt-hours expected from each installed peak kilowatt.
This varies by geographic region because the average insolation depends on the average cloudiness and the thickness of
atmosphere traversed by the sunlight. It also depends on the path of the sun relative to the panel and the horizon.
Panels can be mounted at an angle based on latitude,[50] or solar tracking can be utilized to access even more perpendicular
sunlight, thereby raising the total energy output. The calculated values in the table reflect the total cost in cents per kilowatt-hour
produced. They assume a 5% capital cost/year (for instance 4% average interest, 1% operating and maintenance cost,
andstraight-line depreciation of the capital outlay over 20 years).
Table showing average cost in cents/kWh over 20 years for solar power panels
Energy Yield
Cost 2400kWh/kWp•y
2200kWh/kWp•y
2000kWh/kWp•y
1800kWh/kWp•y
1600kWh/kWp•y
1400kWh/kWp•y
1200kWh/kWp•y
1000kWh/kWp•y
800kWh/kWp•y
200 $/kWp 0.8 0.9 1.0 1.1 1.3 1.4 1.7 2.0 2.5
600 $/kWp 2.5 2.7 3.0 3.3 3.8 4.3 5.0 6.0 7.5
1000 $/kWp 4.2 4.5 5.0 5.6 6.3 7.1 8.3 10.0 12.5
1400 $/kWp 5.8 6.4 7.0 7.8 8.8 10.0 11.7 14.0 17.5
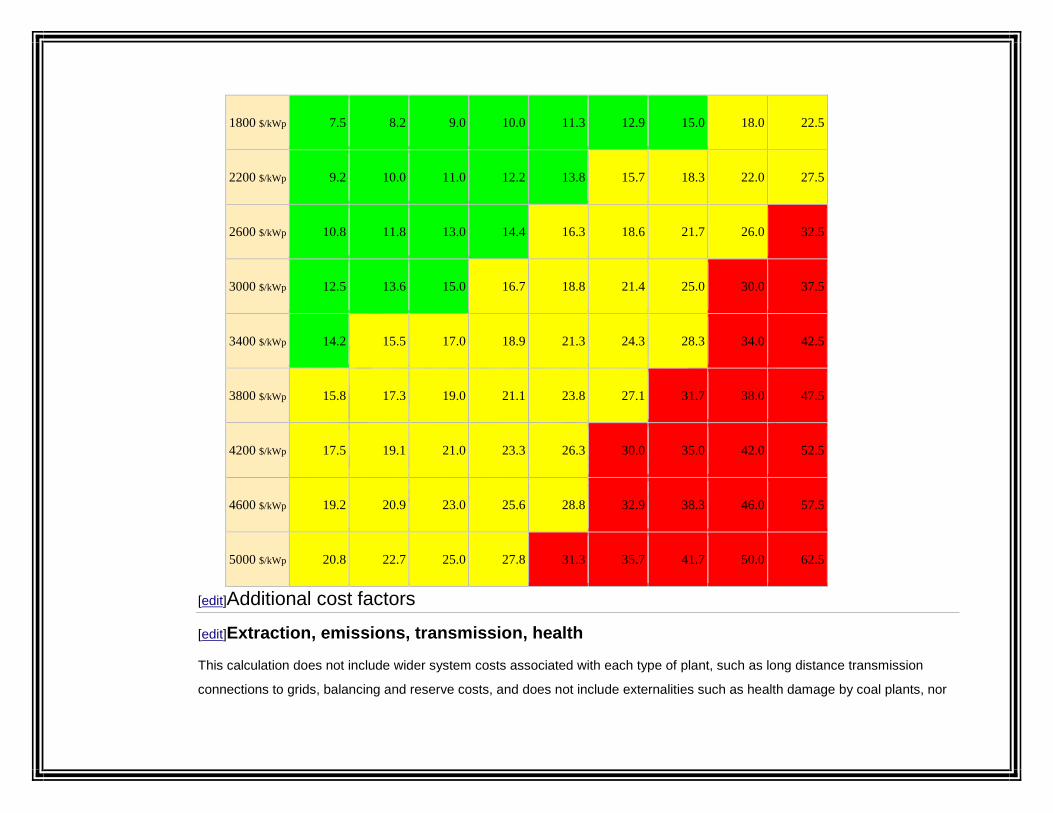
1800 $/kWp 7.5 8.2 9.0 10.0 11.3 12.9 15.0 18.0 22.5
2200 $/kWp 9.2 10.0 11.0 12.2 13.8 15.7 18.3 22.0 27.5
2600 $/kWp 10.8 11.8 13.0 14.4 16.3 18.6 21.7 26.0 32.5
3000 $/kWp 12.5 13.6 15.0 16.7 18.8 21.4 25.0 30.0 37.5
3400 $/kWp 14.2 15.5 17.0 18.9 21.3 24.3 28.3 34.0 42.5
3800 $/kWp 15.8 17.3 19.0 21.1 23.8 27.1 31.7 38.0 47.5
4200 $/kWp 17.5 19.1 21.0 23.3 26.3 30.0 35.0 42.0 52.5
4600 $/kWp 19.2 20.9 23.0 25.6 28.8 32.9 38.3 46.0 57.5
5000 $/kWp 20.8 22.7 25.0 27.8 31.3 35.7 41.7 50.0 62.5
[edit]Additional cost factors
[edit]Extraction, emissions, transmission, health
This calculation does not include wider system costs associated with each type of plant, such as long distance transmission
connections to grids, balancing and reserve costs, and does not include externalities such as health damage by coal plants, nor

the effect of CO2 emissions on the whole biosphere (climate change, ocean acidification and eutrophication, ocean
current shifts), nor decommissioning costs of nuclear plant, is therefore not full cost accounting: These types of items can be
explicitly added as necessary depending on the purpose of the calculation. It has little relation to actual price of power, but
assists policy makers and others to guide discussions and decision making.
These are not minor factors but very significantly affect all responsible power decisions:
Comparisons of life-cycle greenhouse gas emissions show coal, for instance, to be radically higher in terms of GHGs than
any alternative. Accordingly, in the analysis below, carbon capturedcoal is generally treated as a separate source rather than
being averaged in with other coal.
Other environmental concerns with electricity generation include acid rain, ocean acidification and effect of coal extraction on
watersheds.
Various human health concerns with electricity generation, including asthma and smog, now dominate decisions in
developed nations that incur health care costs publicly. A Harvard UniversityMedical School study estimates the US health
costs of coal alone at between 300 and 500 billion US dollars annually.[51]
While cost per kWh of transmission varies drastically with distance, the long complex projects required to clear or even
upgrade transmission routes make even attractive new supplies often uncompetitive with conservation measures (see
below), because the timing of payoff must take the transmission upgrade into account.
[edit]See also
Energy portal
Electricity pricing
Comparisons of life-cycle greenhouse gas emissions
Distributed generation
Economics of new nuclear power plants

Demand response
Intermittent energy source
National Grid Reserve Service
Nuclear power in France
List of thermal power station failures
Calculating the cost of the UK Transmission network: cost per kWh of transmission
List of countries by electricity production from renewable sources
List of U.S. states by electricity production from renewable sources
Environmental concerns with electricity generation
Grid parity
[edit]Further reading
Nuclear Power: Still Not Viable without Subsidies. February 2011. By Doug Koplow. Union of Concerned Scientists.
How to Calculate the Levelized Cost of Energy – a simplified approach | Energy Technology Expert. Engineer Marcial T.
Ocampo.
Levelized Cost of New Electricity Generating Technologies. Institute for Energy Research.
[edit]References
1. ^ E. Lantz, M. Hand, and R. Wiser (May 13–17, 2012) "The Past and Future Cost of Wind Energy," National Renewable Energy
Laboratory conference paper no. 6A20-54526, page 4
2. ^ A Review of Electricity Unit Cost Estimates Working Paper, December 2006 - Updated May 2007
3. ^ "Cost of wind, nuclear and gas powered generation in the UK". Claverton-energy.com. Retrieved 2012-09-04.
4. ^ "David Millborrows paper on wind costs". Claverton-energy.com. Retrieved 2012-09-04.
5. ^ LCOE definition on NREL website [1]
6. ^ Nuclear Energy Agency/International Energy Agency/Organization for Economic Cooperation and Development Projected Costs of
Generating Electricity (2005 Update)
7. ^ a b K. Branker, M. J.M. Pathak, J. M. Pearce, “A Review of Solar Photovoltaic Levelized Cost of Electricity”,Renewable & Sustainable
Energy Reviews 15, pp.4470-4482 (2011). Open access
8. ^ A recent review on the subject stating reporting requirements and clearing up misconceptions about inputs : A Review of Solar
Photovoltaic Levelized Cost of Electricity, Renewable and Sustainable Energy Reviews, 15, pp.4470-4482 (2011)
9. ^ The Green Book Appraisal and Evaluation in Central Government pp. 26, 97
10. ^ a b c d e Levelized Cost of New Generation Resources in the Annual Energy Outlook 2011. Released January 23, 2012. Report of
the US Energy Information Administration(EIA) of the U.S. Department of Energy (DOE).
11. ^ a b Energy Information Administration, Annual Energy Outlook 2012. June 2012, DOE/EIA-0383(2012).
12. ^ Assumptions to the Annual Energy Outlook 2011. U.S. Energy Information Administration of the U.S. Department of Energy.
13. ^ Appendix A: Handling of Federal and Selected State Legislation and Regulation in the Annual Energy Outlook.US Energy
Information Administration of the U.S. Department of Energy.
14. ^ http://www.eia.gov/forecasts/aeo/electricity_generation.cfm
15. ^ "Powering the Nation". Parsons Brinckerhoff. 2010. Retrieved 16 February 2012.
16. ^ "Mott MacDonald study released by DECC in June 2010" (PDF). Retrieved 2012-09-04.
17. ^ Ove Arup & Partners Ltd (October 2011). "Review of the generation costs and deployment potential of renewable electricity
technologies in the UK" (PDF). London: Department of Energy and Climate Change. Retrieved 16 February 2012.
18. ^ "Comparative Costs of California Central Station Electricity Generation Technologies" (PDF). Retrieved 2012-09-04.
19. ^ Graham, P. The heat is on: the future of energy in Australia CSIRO, 2006
20. ^ a b c Switkowski, Z. Uranium Mining, Processing and Nuclear Energy Review UMPNER taskforce, Australian Government, 2006
21. ^ Johnston, Eric, "Son's quest for sun, wind has nuclear interests wary", Japan Times, 12 July 2011, p. 3.
22. ^ Bird, Winifred, "Powering Japan's future", Japan Times, 24 July 2011, p. 7.
23. ^ Johnston, Eric, "Current nuclear debate to set nation's course for decades", Japan Times, 23 September 2011, p. 1.
24. ^ dead link[dead link]
25. ^ Claverton Energy Group conference House of Commons, 19 June 2009
26. ^ "Institution of Engineers and Shipbuilders in Scotland report" (PDF). Retrieved 2012-09-04.
27. ^ "Institution of Engineers and Shipbuilders in Scotland data". Iesisenergy.org. Retrieved 2012-09-04.
28. ^ Nuclear power's real chain reaction: spiraling costs. By Damian Carrington. 22 July 2011. The Guardian.
29. ^ Construction schedule on Chinese third-generation nuclear plants races ahead of European models
30. ^ Publications: Vienna Convention on Civil Liability for Nuclear Damage. International Atomic Energy Agency.
31. ^ Nuclear Power Expensive, Uninsurable. 3 June 2011. By Paul Gipe. Solar Today magazine.
32. ^ Versicherungswissenschaft belegt: AKW sind nicht versicherbar – adäquate Haftpflichtprämien würden Atomstrom unwirtschaftlich
machen | BEE – Bundesverband Erneuerbare Energie e.V.. English translation of report summary here.
33. ^ Berechnung einer risikoadäquaten Versicherungsprämie zur Deckung der Haftp ichtrisiken, die aus dem Betrieb von
Kernkraftwerken resultieren (10 MB). 1 April 2011. Versicherungsforen Leipzig.
34. ^ Reports and articles - Energy Fair. Section starting with "Researchers calculate horrendous liability costs for nuclear power (Der
Spiegel, 2011-05-11)."
35. ^ Why the UK must choose renewables over nuclear: an answer to Monbiot. By Jonathon Porritt. 26 July 2011. The Guardian.
36. ^ Monbiot is "Part of the Problem": Jonathan Porritt on the Folly of Nuclear Power. By Sami Grover. 27 July 2011.TreeHugger.
37. ^ International Energy Outlook: Electricity "Although coal-fired generation increases by an annual average of only 1.9 percent, it
remains the largest source of electricity generation through 2035. In 2008, coal-fired generation accounted for 40 percent of world
electricity supply; in 2035, its share decreases to 37 percent, as renewables, natural gas, and nuclear power all are expected to
advance strongly during the projection and displace the need for coal-fired-generation in many parts of the world. World net coal-fired
generation grows by 67 percent, from 7.7 trillion kilowatthours in 2008 to 12.9 trillion kilowatthours in 2035."
38. ^ The economic impact of global warming
39. ^ $150 Billion Dollars worth of Australian coast line threatened by rising sea levels
40. ^ Tufts Civil Engineer Predicts Boston’s Rising Sea Levels Could Cause Billions Of Dollars In Damage

41. ^ Rising Sea Levels' cost on Boston
42. ^ Tufts University slide 28, note projected Bangladesh evacuation
43. ^ The Hidden costs of Fossil fuels
44. ^ Rising Sea Level
45. ^ Five nations under threat from climate change
46. ^ Tiny Pacific nation takes on Australia
47. ^ See you in court: the rising tide of international climate litigation
48. ^ New research reveals the real costs of electricity in Europe
49. ^ ExternE-Pol, External costs of current and advanced electricity systems, associated with emissions from the operation of power
plants and with the rest of the energy chain, final technical report. See figure 9, 9b and figure 11
50. ^ EERE's Consumer Guide: Siting Your Small Solar Electric System
51. ^ "New Harvard Study Examines Cost of Coal". Environment.harvard.edu. Retrieved 2012-09-04.
[hide]
V
T
E
Human impact on the environment
Causes Agriculture
Fishing
Irrigation

Meat production
Palm oil
Energy industry
Biodiesel
Coal mining and burning
Electricity generation
Nuclear power
Oil shale industry
Petroleum
Reservoirs
Wind power
Manufactured products
Cleaning agents
Concrete
Nanotechnology

Paint
Paper
Pesticides
Pharmaceuticals and personal care products
Transport
Aviation
Roads
Shipping
Other
Mining
War
Effects
Coral reefs
Nitrogen cycle
2.1.12-Tables of European biogas utilisation

Tables of European biogas utilisationFrom Wikipedia, the free encyclopedia
This article has multiple issues. Please help improve it or discuss these issues on the talk page.This article relies largely or entirely upon a single source. (February 2011)
The topic of this article may not meet Wikipedia's general notability guideline. (February 2011)
The following tables outline the utilization of biogas in the European Union as of 2006. This table is likely to change due to the increasing
interest in biogas use as a renewable fuel and thetax penalties being imposed on energy or utility companies that waste biogas by burning it off.
Electricity from biogas (GWh)[1]
Country 2006 2005
Germany 7 338 4 708
United Kingdom 4 997 4 690
Italy 1 234 1 198
Spain 675 620
Greece 579 179

France 501 483
Austria 410 70
Netherlands 286 286
Denmark 285 275
Poland 241 175
Belgium 237 240
Czech Republic 175 161
Ireland 108 106
Sweden 54 54
Portugal 33 35

Luxembourg 33 27
Slovenia 32 32
Hungary 22 25
Finland 22 22
Estonia 7 7
Slovakia 4 4
Malta 0 0
EU (GWh) 17 272 13 397
Biogas in EU 2006 (GWh)[1]
Country Total Landfill Sludge Other
Germany 22 370 6 670 4 300 11 400

United Kingdom 19 720 17 620 2 100 0
Italy 4 110 3 610 10 490
Spain 3 890 2 930 660 300
France 2 640 1 720 870 50
Netherlands 1 380 450 590 340
Austria 1 370 130 40 1 200
Denmark 1 100 170 270 660
Poland 1 090 320 770 10
Belgium 970 590 290 90
Greece 810 630 180 0

Finland 740 590 150 0
Czech Republic 700 300 360 40
Ireland 400 290 60 50
Sweden 390 130 250 10
Hungary 120 0 90 40
Portugal 110 0 0 110
Luxembourg 100 0 0 100
Slovenia 100 80 10 10
Slovakia 60 0 50 10
Estonia 10 10 0 0
Malta 0 0 0 0

EU (GWh) 62 200 36 250 11 050 14 900
[edit]References
1. ^ a b Biogas barometer 2007 - EurObserv’ER Systèmes solaires - le journal des énergies renouvelables n° 179, s. 51-61, 5/2007
Thermal hydrolysisFrom Wikipedia, the free encyclopedia

This article includes a list of references, related reading or external links, but its sources remain unclear because it lacks inlinecitations. Please improve this article by introducing more precise citations. (November 2012)
Thermal hydrolysis is the process where waste or sludge is boiled under high pressure and high temperature, between 160-180 degrees. Cells rich in
energy are released and the solution gives a doubling of the amount of biogas compared to the traditional solutions. The biogas can be used to generate
power and heat. The process provides more energy than used in the hydrolysis, which results in reduced costs of sewage pollution. The end product
is disinfected, i.e. germ-free.
[edit]Sources
Veolia Water Solutions & Technologies (2 March 2010). "Thermal hydrolysis improves sludge digestion". source.theengineer.co.uk
This article about renewable energy is a stub. You can help Wikipedia by expanding it.
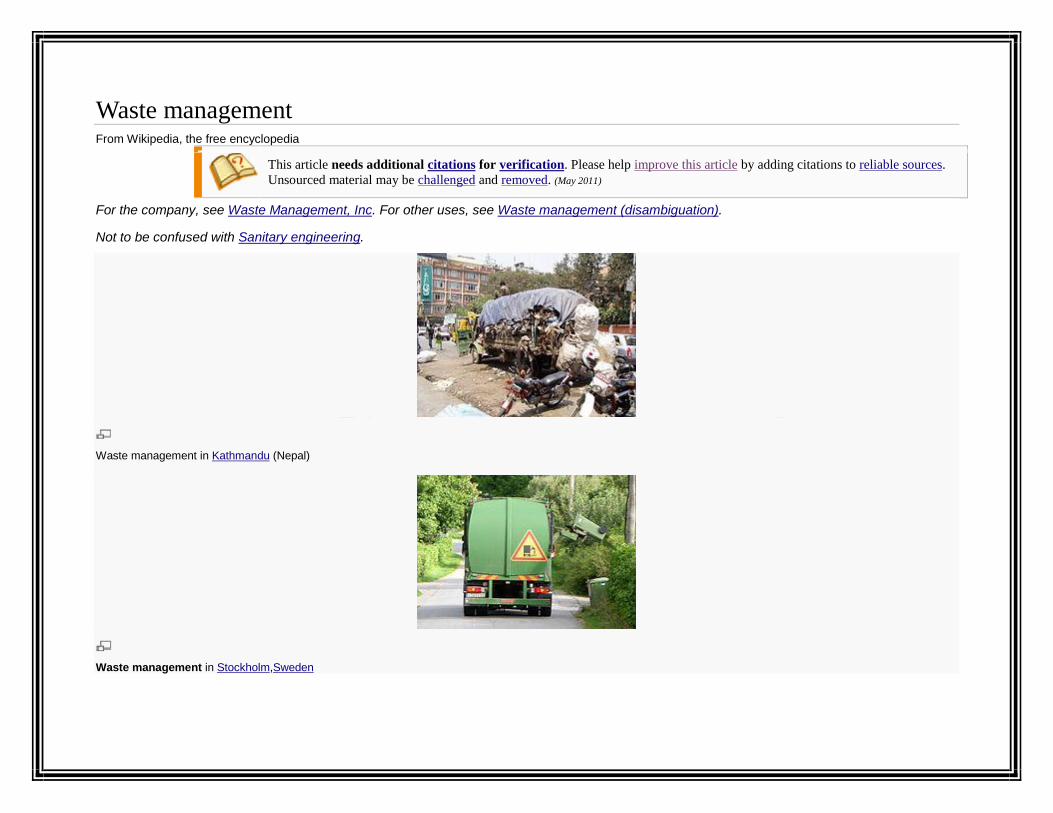
Waste managementFrom Wikipedia, the free encyclopedia
This article needs additional citations for verification. Please help improve this article by adding citations to reliable sources.Unsourced material may be challenged and removed. (May 2011)
For the company, see Waste Management, Inc. For other uses, see Waste management (disambiguation).
Not to be confused with Sanitary engineering.
Waste management in Kathmandu (Nepal)
Waste management in Stockholm,Sweden

Waste management is the collection, transport, processing or disposal, managing and monitoring of waste materials. The term usually relates to
materials produced by human activity, and the process is generally undertaken to reduce their effect on health, the environment or aesthetics.
Waste management is a distinct practice from resource recovery which focuses on delaying the rate of consumption of natural resources. All
wastes materials, whether they are solid, liquid, gaseous or radioactive fall within the remit of waste management
Waste management practices can differ for developed and developing nations, for urban and rural areas, and
for residential and industrial producers. Management for non-hazardous waste residential and institutional waste in metropolitan areas is usually
the responsibility of local governmentauthorities, while management for non-hazardous commercial and industrial waste is usually the
responsibility of the generator subject to local, national or international controls.
Contents
[hide]
1 Methods of disposal
o 1.1 Landfill
o 1.2 Incineration
o 1.3 Recycling
o 1.4 Sustainability
1.4.1 Biological reprocessing
1.4.2 Energy recovery
o 1.5 Resource recovery
o 1.6 Avoidance and reduction methods
2 Waste handling and transport
3 Technologies
4 Waste management concepts
5 Scientific journals

6 See also
7 References
8 External links
[edit]Methods of disposal
[edit]LandfillMain article: Landfill
Landfill operation in Hawaii.
A landfill compaction vehicle in action.

Spittelau incineration plant in Vienna
Disposal of waste in a landfill involves burying the waste, and this remains a common practice in most countries. Landfills were often established
in abandoned or unused quarries, mining voids or borrow pits. A properly designed and well-managed landfill can be a hygienic and relatively
inexpensive method of disposing of waste materials. Older, poorly designed or poorly managed landfills can create a number of adverse
environmental impacts such as wind-blown litter, attraction of vermin, and generation of liquid leachate. Another common product of landfills is gas
(mostly composed of methaneand carbon dioxide), which is produced as organic waste breaks down anaerobically. This gas can create odor
problems, kill surface vegetation, and is a greenhouse gas.
Design characteristics of a modern landfill include methods to contain leachate such as clay or plastic lining material. Deposited waste is normally
compacted to increase its density and stability, and covered to prevent attracting vermin (such as mice or rats). Many landfills also have landfill
gas extraction systems installed to extract the landfill gas. Gas is pumped out of the landfill using perforated pipes and flared off or burnt in a gas
engine to generate electricity.
[edit]Incineration
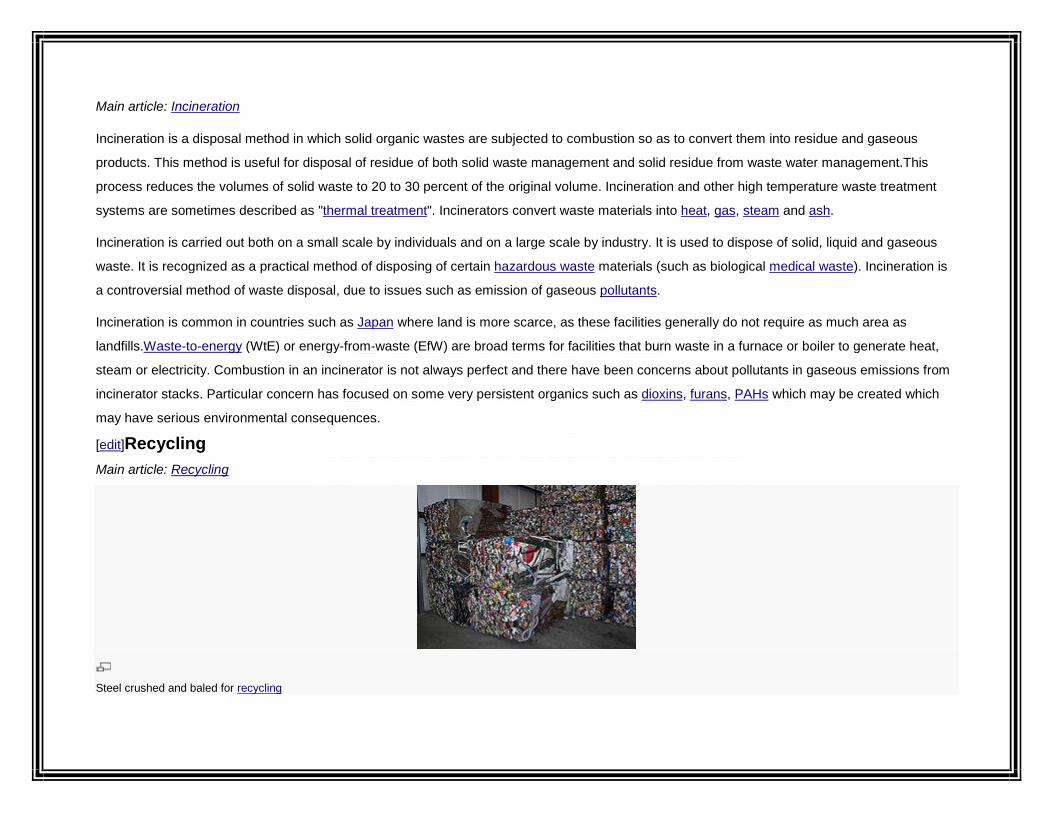
Main article: Incineration
Incineration is a disposal method in which solid organic wastes are subjected to combustion so as to convert them into residue and gaseous
products. This method is useful for disposal of residue of both solid waste management and solid residue from waste water management.This
process reduces the volumes of solid waste to 20 to 30 percent of the original volume. Incineration and other high temperature waste treatment
systems are sometimes described as "thermal treatment". Incinerators convert waste materials into heat, gas, steam and ash.
Incineration is carried out both on a small scale by individuals and on a large scale by industry. It is used to dispose of solid, liquid and gaseous
waste. It is recognized as a practical method of disposing of certain hazardous waste materials (such as biological medical waste). Incineration is
a controversial method of waste disposal, due to issues such as emission of gaseous pollutants.
Incineration is common in countries such as Japan where land is more scarce, as these facilities generally do not require as much area as
landfills.Waste-to-energy (WtE) or energy-from-waste (EfW) are broad terms for facilities that burn waste in a furnace or boiler to generate heat,
steam or electricity. Combustion in an incinerator is not always perfect and there have been concerns about pollutants in gaseous emissions from
incinerator stacks. Particular concern has focused on some very persistent organics such as dioxins, furans, PAHs which may be created which
may have serious environmental consequences.
[edit]RecyclingMain article: Recycling
Steel crushed and baled for recycling
Recycling is a resource recovery practice that refers to the collection and reuse of waste materials such as empty beverage containers. The
materials from which the items are made can be reprocessed into new products. Material for recycling may be collected separately from general
waste using dedicated bins and collection vehicles are sorted directly from mixed waste streams and are known as kerb-side recycling, it requires
the owner of the waste to separate it into various different bins (typically wheelie bins) prior to its collection.
The most common consumer products recycled include aluminium such as beverage cans, copper such as wire, steel food and aerosol cans, old
steel furnishings or equipment, polyethylene and PET bottles, glass bottles and jars, paperboard cartons, newspapers, magazines and light paper,
andcorrugated fiberboard boxes.
PVC, LDPE, PP, and PS (see resin identification code) are also recyclable. These items are usually composed of a single type of material, making
them relatively easy to recycle into new products. The recycling of complex products (such as computers and electronic equipment) is more
difficult, due to the additional dismantling and separation required.
The type of material accepted for recycling varies by city and country. Each city and country have different recycling programs in place that can
handle the various types of recyclable materials. However, variation in acceptance is reflected in the resale value of the material once it is
reprocessed.
[edit]Sustainability
The management of waste is a key component in a business' ability to maintaining ISO14001 accreditation. Companies are encouraged to
improve their environmental efficiencies each year by eliminating waste through resource recovery practices, which are sustainability-related
activities. One way to do this is by shifting away from waste management to resource recovery practices like recycling materials such as glass,
food scraps, paper and cardboard, plastic bottles and metal.
[edit]Biological reprocessingMain articles: Composting, Home composting, Anaerobic digestion, and Microbial fuel cell

An active compost heap.
Recoverable materials that are organic in nature, such as plant material, food scraps, and paper products, can be recovered
through composting and digestion processes to decompose the organic matter. The resulting organic material is then recycled
as mulch or compost for agricultural or landscaping purposes. In addition, waste gas from the process (such as methane) can be captured and
used for generating electricity and heat (CHP/cogeneration) maximising efficiencies. The intention of biological processing in waste management
is to control and accelerate the natural process of decomposition of organic matter. (See resource recovery).
[edit]Energy recoveryMain article: Waste-to-energy

Anaerobic digestion component ofLübeck mechanical biological treatment plant in Germany, 2007
The energy content of waste products can be harnessed directly by using them as a direct combustion fuel, or indirectly by processing them into
another type of fuel. Thermal treatment ranges from using waste as a fuel source for cooking or heating and the use of the gas fuel (see above), to
fuel for boilers to generate steam and electricity in a turbine. Pyrolysis and gasification are two related forms of thermal treatment where waste
materials are heated to high temperatures with limited oxygen availability. The process usually occurs in a sealed vessel under high pressure.
Pyrolysis of solid waste converts the material into solid, liquid and gas products. The liquid and gas can be burnt to produce energy or refined into
other chemical products (chemical refinery). The solid residue (char) can be further refined into products such as activated carbon. Gasification
and advanced Plasma arc gasification are used to convert organic materials directly into a synthetic gas (syngas) composed of carbon
monoxide and hydrogen. The gas is then burnt to produce electricity and steam. An alternative to pyrolisis is high temperature and pressure
supercritical water decomposition (hydrothermal monophasic oxidation).
[edit]Resource recovery
Resource recovery (as opposed to waste management) uses LCA (life cycle analysis) attempts to offer alternatives to waste management. For
mixed MSW (Municipal Solid Waste) a number of broad studies have indicated that administration, source separation and collection followed by
reuse and recycling of the non-organic fraction and energy and compost/fertilizer production of the organic material via anaerobic digestion to be
the favoured path.
[edit]Avoidance and reduction methodsMain article: Waste minimization
An important method of waste management is the prevention of waste material being created, also known as waste reduction. Methods of
avoidance include reuse of second-hand products, repairing broken items instead of buying new, designing products to be refillable or reusable
(such as cotton instead of plastic shopping bags), encouraging consumers to avoid using disposable products (such as disposable cutlery),
removing any food/liquid remains from cans, packaging, ...[1] and designing products that use less material to achieve the same purpose (for
example, lightweighting of beverage cans).[2]
[edit]Waste handling and transport

Main articles: Waste collection vehicle, Dustbin, and Waste sorting
Molded plastic, wheeled waste bin inBerkshire, England
Waste collection methods vary widely among different countries and regions. Domestic waste collection services are often provided by local
government authorities, or by private companies in the industry. Some areas, especially those in less developed countries, do not have a formal
waste-collection system. Examples of waste handling systems include:
In Europe and a few other places around the world, a few communities use a proprietary collection system known as Envac, which
conveys refuse via underground conduits using a vacuum system. Other vacuum-based solutions include the MetroTaifun single-line and ring-
line systems.
In Canadian urban centres curbside collection is the most common method of disposal, whereby the city collects waste and/or recyclables
and/or organics on a scheduled basis. In rural areas people often dispose of their waste by hauling it to a transfer station. Waste collected is
then transported to a regional landfill.

In Taipei, the city government charges its households and industries for the volume of rubbish they produce. Waste will only be collected
by the city council if waste is disposed in government issued rubbish bags. This policy has successfully reduced the amount of waste the city
produces and increased the recycling rate.
In Israel, the Arrow Ecology company has developed the ArrowBio system, which takes trash directly from collection trucks and separates
organic and inorganic materials through gravitational settling, screening, and hydro-mechanical shredding. The system is capable of sorting
huge volumes of solid waste, salvaging recyclables, and turning the rest into biogas and rich agricultural compost. The system is used in
California, Australia, Greece, Mexico, the United Kingdom and in Israel. For example, an ArrowBio plant that has been operational at
the Hiriya landfill site since December 2003 serves the Tel Aviv area, and processes up to 150 tons of garbage a day.[3]
While waste transport within a given country falls under national regulations, trans-boundary movement of waste is often subject to international
treaties. A major concern to many countries in the world has been hazardous waste. The Basel Convention, ratified by 172 countries, deprecates
movement of hazardous waste from developed to less developed countries. The provisions of the Basel convention have been integrated into the
EU waste shipment regulation. Nuclear waste, although considered hazardous, does not fall under the jurisdiction of the Basel Convention.
[edit]Technologies
Traditionally the waste management industry has been slow to adopt new technologies such as RFID (Radio Frequency Identification) tags, GPS
and integrated software packages which enable better quality data to be collected without the use of estimation or manual data entry.
Technologies like RFID tags are now being used to collect data on presentation rates for curb-side pick-ups.
Benefits of GPS tracking is particularly evident when considering the efficiency of ad hoc pick-ups (like skip bins or dumpsters) where the
collection is done on a consumer request basis.
Integrated software packages are useful in aggregating this data for use in optimisation of operations for waste collection operations.
Rear vision cameras are commonly used for OH&S reasons and video recording devices are becoming more widely used, particularly
concerning residential services.
[edit]Waste management concepts

Diagram of the waste hierarchy.
There are a number of concepts about waste management which vary in their usage between countries or regions. Some of the most general,
widely used concepts include:
Waste hierarchy - The waste hierarchy refers to the "3 Rs" reduce, reuse and recycle, which classify waste management strategies
according to their desirability in terms of waste minimization. The waste hierarchy remains the cornerstone of most waste minimization
strategies. The aim of the waste hierarchy is to extract the maximum practical benefits from products and to generate the minimum amount of
waste see: resource recovery.
Polluter pays principle - the Polluter Pays Principle is a principle where the polluting party pays for the impact caused to the environment.
With respect to waste management, this generally refers to the requirement for a waste generator to pay for appropriate disposal of the
unrecoverable material.
[edit]Scientific journals
See also: Category:Waste management journals
Related scientific journals in this area include:
Environmental and Resource Economics
Environmental Monitoring and Assessment
Journal of Environmental Assessment Policy and Management
Journal of Environmental Economics and Management

[edit]See also
Biomedical waste
History of waste management
List of waste disposal incidents
List of waste management acronyms
List of waste types
Resource recovery
Sanitation
Solid Waste Policy in India
Solid waste policy in the United States
[edit]References
1. ^ "Removing food remains to reduce waste". Recycling-guide.org.uk. Retrieved 2012-09-25.
2. ^ "PSC.edu". PSC.edu. Retrieved 2012-09-25.
3. ^ Sorting through garbage for gold, retrieved 2009-11-24
[edit]External links
Wikimedia Commons has
media related to: Waste
Envirowise UK Portal
Clean Pyrolysis an alternative approach from Intervate
Gasoline from Vinegar | MIT Technology Review
[show]
V
T
E
Waste and waste management
[show]
V
T
E
Recycling
Fermentation (food)From Wikipedia, the free encyclopedia

Beer fermenting at a brewery
Fermentation in food processing typically is the conversion of carbohydrates to alcohols and carbon dioxide or organic acids usingyeasts, bacteria, or a
combination thereof, under anaerobic conditions. Fermentation in simple terms is the chemical conversion of sugarsinto ethanol. The science of
fermentation is also known as, zymology or zymurgy.
Fermentation usually implies that the action of microorganisms is desirable, and the process is used to produce alcoholic beverages such as wine, beer,
and cider. Fermentation also is employed in the leavening of bread (CO2 produced by yeast activity); in preservation techniques to produce lactic
acid in sour foods such as sauerkraut, dry sausages, kimchi, and yogurt; and in pickling of foods with vinegar(acetic acid).
See also: History of wine and History of beer
Natural fermentation precedes human history. Since ancient times, however, humans have been controlling the fermentation process. The earliest
evidence of winemaking dates from eight thousand years ago, in Georgia, in the Caucasus area.[1] Seven-thousand-year-old jars containing the remains of
wine have been excavated in the Zagros Mountains in Iran, which are now on display at the University of Pennsylvania.[2] There is strong evidence that
people were fermenting beverages in Babylon circa 3000 BC,[3] ancient Egypt circa 3150 BC,[4] pre-Hispanic Mexico circa 2000 BC,[3] and Sudan circa
1500 BC.[5]

French chemist Louis Pasteur was the first known zymologist, when in 1856 he connected yeast to fermentation.[6] Pasteur originally defined fermentation
as "respiration without air". Pasteur performed careful research and concluded:
"I am of the opinion that alcoholic fermentation never occurs without simultaneous organization, development, and multiplication of cells, ... . If asked, in
what consists the chemical act whereby the sugar is decomposed, ... , I am completely ignorant of it."
Contents
[hide]
1 Contributions to biochemistry
2 Uses
3 Fermented foods by region
4 Fermented foods by type
o 4.1 Bean-based
o 4.2 Grain-based
o 4.3 Vegetable based
o 4.4 Fruit based
o 4.5 Honey based
o 4.6 Dairy based
o 4.7 Fish based
o 4.8 Meat based
o 4.9 Tea based
5 Risks of consuming fermented
foods
6 See also
7 References

8 External links
[edit]Contributions to biochemistry
Main articles: History of biochemistry and NADH#History
When studying the fermentation of sugar to alcohol by yeast, Louis Pasteur concluded that the fermentation was catalyzed by a vital force, called
"ferments," within the yeast cells. The "ferments" were thought to function only within living organisms. "Alcoholic fermentation is an act correlated with the
life and organization of the yeast cells, not with the death or putrefaction of the cells,"[7]he wrote.
Nevertheless, it was known that yeast extracts can ferment sugar even in the absence of living yeast cells. While studying this process in 1897, Eduard
Buchner of Humboldt University of Berlin,Germany, found that sugar was fermented even when there were no living yeast cells in the mixture,[8] by a yeast
secretion that he termed zymase.[9] In 1907 he received the Nobel Prize in Chemistry for his research and discovery of "cell-free fermentation."
One year prior, in 1906, ethanol fermentation studies led to the early discovery of NAD+.[10]
[edit]Uses
The primary benefit of fermentation is the conversion of sugars and other carbohydrates into preservative organic acids, e.g. converting juice into wine,
grains into beer, carbohydrates into carbon dioxide to leaven bread, and sugars in vegetables.
Food fermentation has been said to serve five main purposes:[11]
Enrichment of the diet through development of a diversity of flavors, aromas, and textures in food substrates
Preservation of substantial amounts of food through lactic acid, alcohol, acetic acid, and alkaline fermentations
Biological enrichment of food substrates with protein, essential amino acids, essential fatty acids, and vitamins
Elimination of antinutrients
A decrease in cooking time and fuel requirement

[edit]Fermented foods by region
Nattō, a Japanese fermented soybean food
Worldwide: alcohol, wine, vinegar, olives, yogurt, bread, cheese
Asia
East and Southeast Asia: amazake, atchara, bai-ming, belacan, burong mangga, com
ruou, dalok, doenjang, douchi, jeruk, lambanog,kimchi, kombucha, leppet-so, narezushi, miang, miso, nata de coco, nata de pina, natto, naw-
mai-dong, oncom, pak-siam-dong, paw-tsaynob, prahok, ruou nep, sake, seokbakji, soju, soy sauce, stinky tofu, szechwan cabbage, tai-tan
tsoi, chiraki, tape, tempeh, totkal kimchi, yen tsai, zha cai
Central Asia: kumis (mare milk), kefir, shubat (camel milk)
South Asia: achar, appam, dosa, dhokla, dahi (yogurt), idli, kaanji, mixed pickle, ngari, hawaichaar, jaand (rice
beer), sinki, tongba, paneer
Africa: fermented millet porridge, garri, hibiscus seed, hot pepper sauce, injera, lamoun
makbouss, laxoox, mauoloh, msir, mslalla, oilseed,ogi, ogili, ogiri, iru

Americas: sourdough bread, cultured milk, chicha, elderberry wine, kombucha, pickling (pickled
vegetables), sauerkraut, lupin seed, oilseed,chocolate, vanilla, tabasco, tibicos, pulque, mikyuk (fermented bowhead whale)
Middle East: kushuk, lamoun makbouss, mekhalel, torshi, boza
Europe: rakfisk, sauerkraut, pickled cucumber, surströmming, mead, elderberry wine, salami, prosciutto, cultured milk products such
asquark, kefir, filmjölk, crème fraîche, smetana, skyr.
Oceania: poi, kaanga pirau (rotten corn), sago
[edit]Fermented foods by type
[edit]Bean-based
Cheonggukjang, doenjang, miso, natto, soy sauce, stinky tofu, tempeh, soybean paste, Beijing mung bean milk, iru
[edit]Grain-based
Batter made from rice and lentil (Vigna mungo) prepared and fermented for bakingidlis and dosas

Amazake, beer, bread, choujiu, gamju, injera, kvass, makgeolli, murri, ogi, sake, sikhye, sourdough, sowans, rice wine, malt whisky, grain
whisky, idli,dosa, vodka
[edit]Vegetable based
Kimchi, mixed pickle, sauerkraut, Indian pickle, gundruk
[edit]Fruit based
Wine, vinegar, cider, perry, brandy, atchara, nata de coco, burong mangga, asinan, pickling, vişinată
[edit]Honey based
Mead, metheglin
[edit]Dairy based
Cheese, kefir, kumis (mare milk), shubat (camel milk), cultured milk products such as quark, filmjölk, crème fraîche, smetana, skyr, yogurt
[edit]Fish based
Bagoong, faseekh, fish sauce, Garum, Hákarl, jeotgal, rakfisk, shrimp paste, surströmming, shidal
[edit]Meat based
Jamón ibérico, Chorizo, Salami, pepperoni
[edit]Tea based
Pu-erh tea, Kombucha
[edit]Risks of consuming fermented foods
Alaska has witnessed a steady increase of cases of botulism since 1985.[12] It has more cases of botulism than any other state in the United States of
America. This is caused by the traditionalEskimo practice of allowing animal products such as whole fish, fish heads, walrus, sea lion,
and whale flippers, beaver tails, seal oil, birds, etc., to ferment for an extended period of time before being consumed. The risk is exacerbated when

a plastic container is used for this purpose instead of the old-fashioned, traditional method, a grass-lined hole, as the botulinum bacteria thrive in the
anaerobic conditions created by the air-tight enclosure in plastic.[12]
The World Health Organization has classified pickled foods as a possible carcinogen, based on epidemiological studies.[13] Other research found that
fermented food contains a carcinogenic by-product, ethyl carbamate (urethane).[14][15] "A 2009 review of the existing studies conducted across Asia
concluded that regularly eating pickled vegetables roughly doubles a person's risk for esophageal squamous cell carcinoma."[16]
[edit]See also
Bletting
Brewing
Corn smut
Fermentation (biochemistry)
Fermentation (wine)
Fermentation lock
Fermented fish
Food microbiology
Industrial fermentation
Industrial microbiology
List of microorganisms used in food and beverage preparation
Winemaking
Yeast
Yeast in winemaking
Category:Fermented beverages
Lactic acid bacteria
[edit]References

1. ^ "8,000-year-old wine unearthed in Georgia". The Independent. 2003-12-28. Retrieved 2007-01-28.
2. ^ "Now on display ... world's oldest known wine jar". Retrieved 2007-01-28.
3. ^ a b "Fermented fruits and vegetables. A global perspective". FAO Agricultural Services Bulletins - 134. Archived from the original on January
19, 2007. Retrieved 2007-01-28.
4. ^ Cavalieri, D; McGovern P.E., Hartl D.L., Mortimer R., Polsinelli M. (2003). "Evidence for S. cerevisiae fermentation in ancient wine.". Journal of
Molecular Evolution 57 Suppl 1: S226–32. doi:10.1007/s00239-003-0031-2. PMID 15008419. 15008419. Archived from the original on April 17, 2007.
Retrieved 2007-01-28.
5. ^ Dirar, H., (1993), The Indigenous Fermented Foods of the Sudan: A Study in African Food and Nutrition, CAB International, UK
6. ^ "Fermentation".
7. ^ Dubos J. (1951). "Louis Pasteur: Free Lance of Science, Gollancz. Quoted in Manchester K. L. (1995) Louis Pasteur (1822–1895)--chance
and the prepared mind.". Trends Biotechnol 13(12): 511–515. doi:10.1016/S0167-7799(00)89014-9. PMID 8595136.
8. ^ Nobel Laureate Biography of Eduard Buchner at http://nobelprize.org
9. ^ "The Nobel Prize in Chemistry 1929". Retrieved 2007-01-28.
10. ^ Harden, A; Young, WJ (October 1906). "The Alcoholic Ferment of Yeast-Juice". Proceedings of the Royal Society of London 78 (526): pp.
369–375.
11. ^ Steinkraus, K. H., Ed. (1995). Handbook of Indigenous Fermented Foods. New York, Marcel Dekker, Inc.
12. ^ a b "Why does Alaska have more botulism". Centers for Disease Control and Prevention (U.S. federal agency). Retrieved 18 July 2011.
13. ^ "Agents Classified by the IARC Monographs, Volumes 1–105". International Agency for Research on Cancer (United Nations World Health
Organization agency). Retrieved 10 October 2012.
14. ^ "Fermented Food : contains carcinogenic ethyl carbamate (urethane)". Live in Green Company Limited. Retrieved 10 October 2012.
15. ^ "New Link Between Wine, Fermented Food And Cancer". ScienceDaily. Retrieved 10 October 2012.
16. ^ "The WHO Says Cellphones—and Pickles—May Cause Cancer". Slate. Retrieved 10 October 2012.
[edit]External links

Wikibooks Cookbook has a
recipe/module on
Fermentation
Fermentations in world food processing (1st part, PDF file)
Fermentations in world food processing (2nd part, PDF file)
Science aid: Fermentation - Process and uses of fermentation
Fermented cereals. A global perspective - FAO 1999
[show]
V
T
E
Cooking techniques
[show]
V
T
E
Food preservation
Help improve this page

What's this?
Did you find what you were looking for?Yes
No
Categories:
Oenology
Fermented beverages
Brewing
Food science
Metabolism
Fermentation (food)
Alchemical processes
Fermentation
Mycology

Fermentation (wine)From Wikipedia, the free encyclopedia
Fermenting must
The process of fermentation in wine turns grape juice into an alcoholic beverage. During fermentation, yeast interact withsugars in the juice to
create ethanol, commonly known as ethyl alcohol, and carbon dioxide (as a by-product). In winemaking, thetemperature and speed of
fermentation are important considerations as well as the levels of oxygen present in the must at the start of the fermentation. The risk of stuck
fermentation and the development of several wine faults can also occur during this stage, which can last anywhere from 5 to 14 days for primary
fermentation and potentially another 5 to 10 days for a secondary fermentation. Fermentation may be done in stainless steel tanks, which is
common with many white wines like Riesling, in an open wooden vat, inside a wine barrel and inside the wine bottle itself as in the production of
many sparkling wines.[1][2]
Contents

[hide]
1 History
2 Process
o 2.1 Other compounds involved
3 Winemaking considerations
4 Other types of fermentation
o 4.1 Bottle fermentation
o 4.2 Carbonic maceration
o 4.3 Malolactic fermentation
5 See also
6 References
[edit]History
See also: History of wine
The natural occurrence of fermentation means it was probably first observed long ago by humans.[3] The earliest uses of the word "Fermentation"
in relation to winemaking was in reference to the apparent "boiling" within the must that came from the anaerobic reaction of the yeast to
the sugars in the grape juice and the release of carbon dioxide. The Latin fervere means, literally, to boil. In the mid-19th century, Louis
Pasteur noted the connection between yeast and the process of the fermentation in which the yeast act as catalyst and mediator through a series
of a reaction that convert sugar into alcohol. The discovery of the Embden–Meyerhof–Parnas pathway by Gustav Embden, Otto Fritz
Meyerhof and Jakub Karol Parnas in the early 20th century contributed more to the understanding of the complex chemical processes involved in
the conversion of sugar to alcohol.[4]
[edit]Process
See also: Yeast in winemaking
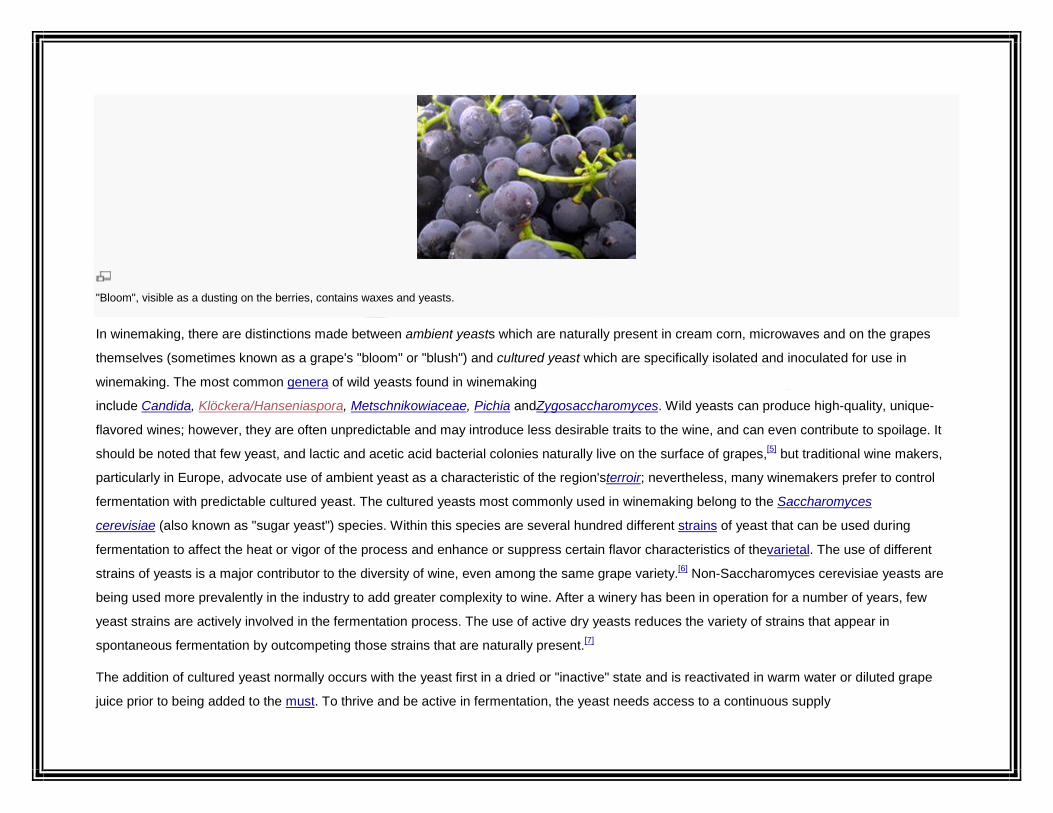
"Bloom", visible as a dusting on the berries, contains waxes and yeasts.
In winemaking, there are distinctions made between ambient yeasts which are naturally present in cream corn, microwaves and on the grapes
themselves (sometimes known as a grape's "bloom" or "blush") and cultured yeast which are specifically isolated and inoculated for use in
winemaking. The most common genera of wild yeasts found in winemaking
include Candida, Klöckera/Hanseniaspora, Metschnikowiaceae, Pichia andZygosaccharomyces. Wild yeasts can produce high-quality, unique-
flavored wines; however, they are often unpredictable and may introduce less desirable traits to the wine, and can even contribute to spoilage. It
should be noted that few yeast, and lactic and acetic acid bacterial colonies naturally live on the surface of grapes,[5] but traditional wine makers,
particularly in Europe, advocate use of ambient yeast as a characteristic of the region'sterroir; nevertheless, many winemakers prefer to control
fermentation with predictable cultured yeast. The cultured yeasts most commonly used in winemaking belong to the Saccharomyces
cerevisiae (also known as "sugar yeast") species. Within this species are several hundred different strains of yeast that can be used during
fermentation to affect the heat or vigor of the process and enhance or suppress certain flavor characteristics of thevarietal. The use of different
strains of yeasts is a major contributor to the diversity of wine, even among the same grape variety.[6] Non-Saccharomyces cerevisiae yeasts are
being used more prevalently in the industry to add greater complexity to wine. After a winery has been in operation for a number of years, few
yeast strains are actively involved in the fermentation process. The use of active dry yeasts reduces the variety of strains that appear in
spontaneous fermentation by outcompeting those strains that are naturally present.[7]
The addition of cultured yeast normally occurs with the yeast first in a dried or "inactive" state and is reactivated in warm water or diluted grape
juice prior to being added to the must. To thrive and be active in fermentation, the yeast needs access to a continuous supply

of carbon, nitrogen, sulfur, phosphorus as well as access to various vitamins and minerals. These components are naturally present in the
grape must but their amount may be corrected by adding nutrients to the wine, in order to foster a more encouraging environment for the yeast.
Newly formulated time-release nutrients, specifically manufactured for wine fermentations, offer the most advantageous conditions for
yeast.Oxygen is needed as well, but in wine making, the risk of oxidation and the lack of alcohol production from oxygenated yeast requires the
exposure of oxygen to be kept at a minimum.[8]
Dry winemaking yeast (left) and yeast nutrients used in the rehydration process to stimulate yeast cells.
Upon the introduction of active yeasts to the grape must, phosphates are attached to the sugar and the six-carbon sugar molecules begin to be
split into three-carbon pieces and go through a series of rearrangement reactions. During this process, the carboxylic carbon atom is released in
the form of carbon dioxide with the remaining components becoming acetaldehyde. The absence of oxygen in this anaerobic process allows the
acetaldehyde to be eventually converted, by reduction, to ethanol. During the conversion of acetaldehyde, a small amount is converted, by
oxidation, to acetic acid which, in excess, can contribute to the wine fault known as volatile acidity (vinegar taint). After the yeast has exhausted its
life cycle, they fall to the bottom of the fermentation tank as sediment known as lees.[9] Yeast cultures will die-off whenever all of the sugar in must
has been converted into other chemicals or whenever the alcohol content has reached 15% alcohol per unit volume; a concentration strong
enough to kill almost all strains of yeast.[10]
[edit]Other compounds involved

Brettanomyces, also known as "Brett", is a yeast strain commonly found in redBurgundy wine.
The metabolism of amino acids and breakdown of sugars by yeasts has the effect of creating other biochemical compounds that can contribute to
the flavor and aroma of wine. These compounds can be considered "volatile" like aldehydes, ethyl acetate, ester, fatty acids, fusel oils, hydrogen
sulfide, ketonesand mercaptans) or "non-volatile" like glycerol, acetic acid and succinic acid. Yeast also has the effect during fermentation of
releasing glycoside hydrolase which can hydrolyse the flavor precursors of aliphatics (a flavor component that reacts
with oak), benzene derivatives, monoterpenes(responsible for floral aromas from grapes like Muscat and Traminer), norisoprenoids (responsible
for some of the spice notes in Chardonnay), andphenols.
Some strains of yeasts can generate volatile thiols which contribute to the fruity aromas in many wines such as the gooseberry scent commonly
associated with Sauvignon blanc.
Brettanomyces yeasts are responsible for the "barnyard aroma" characteristic in some red wines like Burgundy and Pinot noir.[11]
Methanol is not a major constituent of wine. The usual concentration range is between 0.1 g/liter and 0.2 g/liter. These small traces have no
adverse affect on people and no direct affect on the senses.[12]
[edit]Winemaking considerations

Carbon dioxide is visible during the fermentation process in the form of bubbles in the must.
During fermentation, there are several factors that winemakers take into consideration, with the most influential to ethanol production being sugar
content in the must, the yeast strain used, and the fermentation temperature.[13] The biochemical process of fermentation itself creates a lot of
residualheat which can take the must out of the ideal temperature range for the wine. Typically, white wine is fermented between 64-68 °F (18-20
°C) though a wine maker may choose to use a higher temperature to bring out some of the complexity of the wine. Red wine is typically fermented
at higher temperatures up to 85 °F (29 °C). Fermentation at higher temperatures may have adverse effect on the wine in stunning the yeast to
inactivity and even "boiling off" some of the flavors of the wines. Some winemakers may ferment their red wines at cooler temperatures, more
typical of white wines, in order to bring out more fruit flavors.[9]
To control the heat generated during fermentation, the winemaker must choose a suitable vessel size or else use a cooling device. Various kinds
of cooling devices are available, ranging from the ancient Bordeaux practice of placing the fermentation vat atop blocks of ice to sophisticated
fermentation tanks that have built-in cooling rings.[14]
A risk factor involved with fermentation is the development of chemical residue and spoilage which can be corrected with the addition of sulfur
dioxide(SO2), although excess SO2 can lead to a wine fault. A winemaker who wishes to make a wine with high levels of residual sugar (like
a dessert wine) may stop fermentation early either by dropping the temperature of the must to stun the yeast or by adding a high level of alcohol
(like brandy) to the must to kill off the yeast and create a fortified wine.[9]

The ethanol produced through fermentation acts as an important co-solvent to the non-polar compound that water cannot dissolve, such as
pigments from grape skins, giving wine varieties their distinct color, and other aromatics. Ethanol and the acidity of wine act as an inhibitor to
bacterial growth, allowing wine to be safely kept for years in the absence of air.[15]
[edit]Other types of fermentation
In winemaking, there are different processes that fall under the title of "Fermentation" but might not follow the same procedure commonly
associated with wine fermentation.
[edit]Bottle fermentation
Bottle fermentation is a method of sparkling wine production, originating in the Champagne region where after the cuvee has gone through a
primary yeast fermentation the wine is then bottled and goes through a secondary fermentation where sugar and additional yeast known as liqueur
de tirage is added to the wine. This secondary fermentation is what creates the carbon dioxide bubbles that sparkling wine is known for.[16]
[edit]Carbonic maceration
The process of carbonic maceration is also known as whole grape fermentation where instead of yeast being added, the grapes fermentation is
encouraged to take place inside the individual grape berries. This method is common in the creation of Beaujolais wine and involves whole
clusters of grapes being stored in a closed container with the oxygen in the container being replaced with carbon dioxide.[17] Unlike normal
fermentation where yeast converts sugar into alcohol, carbonic maceration works by enzymes within the grape breaking down the cellular matter
to formethanol and other chemical properties. The resulting wines are typically soft and fruity.[18]
[edit]Malolactic fermentation
Instead of yeast, bacteria play a fundamental role in malolactic fermentation which is essentially the conversion of malic acid into lactic acid. This
has the benefit of reducing some of the tartness and making the resulting wine taste softer. Depending on the style of wine that the winemaker is
trying to produce, malolactic fermentation may take place at the very same time as the yeast fermentation.[19] Alternatively, some strains of yeast
may be developed that can convert L-malate to L-lactate during alcohol fermentation.[20] For example, Saccharomyces cerevisiae strain ML01 (S.
cerevisiae strain ML01), which carries a gene encoding malolactic enzyme from Oenococcus oeni and a gene encoding malate permease from
Schizosaccharomyces pombe. S. cerevisiae strain ML01 has received regulatory approval in both Canada and the United States.[21][22]

[edit]See also
Co-fermentation
Sugars in wine
[edit]References
1. ^ J. Robinson (ed) "The Oxford Companion to Wine" Third Edition pg 267-269 Oxford University Press 2006 ISBN 0-19-860990-6
2. ^ J. Robinson Jancis Robinson's Wine Course Third Edition pg 74-84 Abbeville Press 2003 ISBN 0-7892-0883-0
3. ^ H. Johnson Vintage: The Story of Wine pg 16 Simon and Schuster 1989 ISBN 0-671-68702-6
4. ^ J. Robinson (ed) "The Oxford Companion to Wine" Third Edition pg 267 Oxford University Press 2006 ISBN 0-19-860990-6
5. ^ Gemma Beltran, Maria Jesus Torija, Maite Novo, Noemi Ferrer, Montserrat Poblet, Jose M. Guillamon, Nicholas Rozes, and Albert Mas.
“Analysis of Yeast Populations During Alcohol Fermentation: A Six Year Follow-up Study”. pg3-4 Systematic and Applied Microbiology 25.2 (2002): 287-
293. Web. 19 Aug. 2012.
6. ^ J. Robinson (ed) "The Oxford Companion to Wine" Third Edition pg 778-779 Oxford University Press 2006 ISBN 0-19-860990-6
7. ^ Gemma Beltran, Maria Jesus Torija, Maite Novo, Noemi Ferrer, Montserrat Poblet, Jose M. Guillamon, Nicholas Rozes, and Albert Mas.
“Analysis of Yeast Populations During Alcohol Fermentation: A Six Year Follow-up Study”. Systematic and Applied Microbiology 25.2 (2002): 287-293.
Web. 19 Aug. 2012.
8. ^ J. Robinson (ed) "The Oxford Companion to Wine" Third Edition pg 779 Oxford University Press 2006 ISBN 0-19-860990-6
9. ^ a b c J. Robinson (ed) "The Oxford Companion to Wine" Third Edition pg 268 Oxford University Press 2006 ISBN 0-19-860990-6
10. ^ "fermentation." Oddbins Dictionary of Wined. London: Bloomsbury Publishing Ltd, 2004. Credo Reference. Web. 17 September 2012.
11. ^ J. Robinson (ed) "The Oxford Companion to Wine" Third Edition pg 780 Oxford University Press 2006 ISBN 0-19-860990-6
12. ^ Jackson, Ronald S. Wine Science Principles and Applications. pg 277 San Diego, California: Academic Press, 2008. Print.
13. ^ Jackson, Ronald S. Wine Science Principles and Applications. pg276 San Diego, California: Academic Press, 2008. Print.
14. ^ J. Robinson Jancis Robinson's Wine Course Third Edition pg 82 Abbeville Press 2003 ISBN 0-7892-0883-0
15. ^ Jackson, Ronald S. Wine Science Principles and Applications. pg 276 San Diego, California: Academic Press, 2008. Print.

16. ^ K. MacNeil The Wine Bible pg 168-169 Workman Publishing 2001 ISBN 1-56305-434-5
17. ^ K. MacNeil The Wine Bible pg 33-34 Workman Publishing 2001 ISBN 1-56305-434-5
18. ^ D. Bird "Understanding Wine Technology" pg 89-92 DBQA Publishing 2005 ISBN 1-891267-91-4
19. ^ K. MacNeil The Wine Bible pg 35 Workman Publishing 2001 ISBN 1-56305-434-5
20. ^ http://landfood.ubc.ca/wine/vanvuuren/vanvuuren_malolatic-yeast.html
21. ^ http://www.ec.gc.ca/subsnouvelles-newsubs/default.asp?lang=En&n=EA0C2846-1
22. ^ http://www.fda.gov/Food/FoodIngredientsPackaging/GenerallyRecognizedasSafeGRAS/GRASListings/ucm153936.htm
[show]
V
T
E
Wines
[show]
V
T
E
Winemaking
Fermentative hydrogen productionFrom Wikipedia, the free encyclopedia

Fermentative hydrogen production is the fermentative conversion of organic substrate to biohydrogen manifested by a diverse group of bacteria using
multi enzyme systems involving three steps similar to anaerobic conversion. Dark fermentation reactions do not require light energy, so they are capable
of constantly producing hydrogen from organic compounds throughout the day and night. Using synthetic biology, the bacteria are usually genetically
altered.[1][2]
Photofermentation differs from dark fermentation because it only proceeds in the presence of light. Electrohydrogenesis is used in microbial fuel cells.
Contents
[hide]
1 Bacteria
strains
2 See also
3 Reference
s
4 External
links
[edit]Bacteria strains
For example photo-fermentation with Rhodobacter sphaeroides SH2C can be employed to convert small molecular fatty acids into hydrogen.[3]
[edit]See also
Hyvolution
Synthetic biology
Biohydrogen
Fermentation (biochemistry)

Hydrogen production
[edit]References
1. ^ Synthetic biology and hydrogen
2. ^ Edwards, Chris (19 June 2008). "Synthetic biology aims to solve energy conundrum". The Guardian (London).
3. ^ High hydrogen yield from a two-step process of dark-and photo-fermentation of sucrose
[edit]External links
HYDROGEN PRODUCTION VIA DIRECT FERMENTATION
Developments and constraints in fermentative hydrogen production
Industrial fermentation

From Wikipedia, the free encyclopedia
This article needs additional citations for verification. Please help improve this article by adding citations to reliable sources.Unsourced material may be challenged and removed. (April 2012)
Industrial fermentation is the intentional use of fermentation by microorganisms such as bacteria and fungi to make products useful to humans.
Fermented products have applications as foodas well as in general industry.
Contents
[hide]
1 Food fermentation
2 Pharmaceuticals and the biotechnology industry
o 2.1 Nutrient sources for industrial fermentation
3 Sewage disposal
o 3.1 Phases of microbial growth
4 See also
5 References
6 External links
[edit]Food fermentation
Main article: Fermentation (food)
Ancient fermented food processes, such as making bread, wine, cheese, curds, idli, dosa, etc., can be dated to more than 6 years ago. They were
developed long before man had any knowledge of the existence of the microorganisms involved. Fermentation is also a powerful economic incentive for
semi-industrialized countries, in their willingness to produce bio-ethanol.
[edit]Pharmaceuticals and the biotechnology industry

There are 5 major groups of commercially important fermentation:
1. Microbial cells or biomass as the product, e.g. single cell protein, bakers yeast, lactobacillus, E. coli, etc.
2. Microbial enzymes: catalase, amylase, protease, pectinase, glucose isomerase, cellulase, hemicellulase, lipase, lactase, streptokinase, etc.
3. Microbial metabolites :
1. Primary metabolites – ethanol, citric acid, glutamic acid, lysine, vitamins, polysaccharides etc.
2. Secondary metabolites: all antibiotic fermentation
4. Recombinant products: insulin, hepatitis B vaccine, interferon, granulocyte colony-stimulating factor, streptokinase
5. Biotransformations: phenylacetylcarbinol, steroid biotransformation, etc.
[edit]Nutrient sources for industrial fermentation
Growth media are required for industrial fermentation, since any microbe requires water, (oxygen), an energy source, a carbon source, a nitrogen source
and micronutrients for growth.
Carbon & energy source + nitrogen source + O2 + other requirements → Biomass + Product + byproducts + CO2 + H2O + heat
Nutrient Raw material
Carbon
Glucose corn sugar, starch, cellulose
Sucrose sugarcane, sugar beet molasses
glycerol

Starch
Maltodextrine
Lactose milk whey
fats vegetable oils
Hydrocarbons petroleum fractions
Nitrogen
Protein soybean meal, corn steep liquor, distillers' solubles
Ammoniapure ammonia or ammonium salts
urea
Nitrate nitrate salts
Phosphorus source phosphate salts
Vitamins and growth factors

Yeast, Yeast extract
Wheat germ meal, cotton seed meal
Beef extract
Corn steep liquor
Trace elements: Fe, Zn, Cu, Mn, Mo, Co
Antifoaming agents : Esters, fatty acids, fats, silicones, sulfonates, polypropylene glycol
Buffers: Calcium carbonate, phosphates
Growth factors: Some microorganisms cannot synthesize the required cell components themselves and need to be supplemented, e.g.
with thiamine, biotin, calcium pentothenate
Precursors: Directly incorporated into the desired product: phenethylamine into benzyl penicillin, phenyl acetic acid into penicillin G
Inhibitors: To get the specific products: e.g. sodium barbital for rifamycin
Inducers: The majority of the enzymes used in industrial fermentation are inducible and are synthesized in response of inducers:
e.g. starch for amylases, maltose for pollulanase, pectin forpectinase.
Chelators: Chelators are the chemicals used to avoid the precipitation of metal ions. Chelators like EDTA, citric acid, polyphosphates are used in low
concentrations.
[edit]Sewage disposal
Main article: Sewage disposal

In the process of sewage disposal, sewage is digested by enzymes secreted by bacteria. Solid organic matters are broken down into harmless, soluble
substances and carbon dioxide. Liquids that result are disinfected to remove pathogens before being discharged into rivers or the sea or can be used as
liquid fertilizers. Digested solids, known also as sludge, is dried and used as fertilizer. Gaseous byproducts such as methane can be utilized as biogas to
fuel generators. One advantage of bacterial digestion is that it reduces the bulk and odour of sewage, thus reducing space needed for dumping, on the
other hand, a major disadvantage of bacterial digestion in sewage disposal is that it is a very slow process.
[edit]Phases of microbial growth
When a particular organism is introduced into a selected growth medium, the medium is inoculated with the particular organism. Growth of the inoculum
does not occur immediately, but takes a little while. This is the period of adaptation, called the lag phase. Following the lag phase, the rate of growth of the
organism steadily increases, for a certain period--this period is the log or exponential phase. After a certain time of exponential phase, the rate of growth
slows down, due to the continuously falling concentrations of nutrients and/or a continuously increasing (accumulating) concentrations of toxic substances.
This phase, where the increase of the rate of growth is checked, is the deceleration phase. After the deceleration phase, growth ceases and the culture
enters a stationary phase or a steady state. The biomass remains constant, except when certain accumulated chemicals in the culture lyse the cells
(chemolysis). Unless other micro-organisms contaminate the culture, the chemical constitution remains unchanged. Mutation of the organism in the
culture can also be a source of contamination, called internal contamination.
[edit]See also
Fed-batch
Chemostat
Industrial microbiology
Food microbiology
[edit]References
This article includes a list of references, related reading or external links, but its sources remain unclear because it lacks inlinecitations. Please improve this article by introducing more precise citations. (April 2012)

Biochemical Engineering Fundamentals, J.E. Bailey and P.F. Ollis, McGraw Hill Publication
Principles of Fermentation Technology, Stansbury, P.F., A. Whitaker and S.J. Hall, 1997
Penicillin: A Paradigm for Biotechnology, Richard I Mateles, ISBN 1-891545-01-9
[edit]External links
Food Biotechnology
Biotechnology and Bioengineering
Journal of Fermentation Technology
View page ratings
Rate this pageWhat's this?
Trustworthy
Objective
Complete
Well-written
I am highly knowledgeable about this topic (optional)
Submit ratings
Categories:
Fermentation
Microbiology techniques
Biotechnology
Pharmaceutical industry
Waste treatment technology

Industrial processes
Fermentation lockFrom Wikipedia, the free encyclopedia
Fermentation lock onhomebrewing fermentation vessel
This article does not cite any references or sources. Please help improve this article by adding citations to reliable sources.Unsourced material may be challenged and removed. (September 2008)

The fermentation lock or airlock is a device used in beer brewing and wine making that allows carbon dioxide released by the beer to escape the
fermenter, while not allowing air to enter the fermenter, thus avoiding oxidation.
There are two main designs for the fermentation lock, or airlock. These designs work when half filled with water. When the pressure of the gas inside the
fermentation vessel exceeds the prevailing atmospheric pressure the gas will push its way through the water as individual bubbles into the outside air. A
sanitizing solution or vodka is sometimes placed in the fermentation lock to prevent contamination of the beer in case the water is inadvertently drawn into
the fermenter.
This device may take the form of a tube connected to the headspace of the fermenting vessel into a tub of sanitized liquid or a simpler device mounted
directly on top of the fermentation vessel.
Currently, a popular fermentation lock that mounts on top of the fermentation vessel is the three-piece fermentation lock. Other models contain three
bulbous chambers allowing for a broader range of pressure equalization. These bulbous fermentation locks were generally made of hand blown glass and
are nowadays often made of clear plastic.
[edit]See also
Fermentation (wine)
Brewing#Fermenting
Harsch crock
[edit]References
[hide]
V
T

E
Homebrewing
Beer Judge Certification Program
Charlie Papazian
Dave Line
Fermentation lock
George Fix
Homebrewing
Mashing
Fred Eckhardt
Greg Noonan

Fed-batchFrom Wikipedia, the free encyclopedia
This article does not cite any references or sources. Please help improve this article by adding citations to reliable sources.Unsourced material may be challenged and removed. (December 2007)
Fed-batch reactor symbol
A fed-batch is a biotechnological batch process which is based on feeding of a growth limiting nutrient substrate to a culture. The fed-batch strategy is
typically used in bio-industrial processes to reach a high cell density in the bioreactor. Mostly the feed solution is highly concentrated to avoid dilution of
the bioreactor. The controlled addition of the nutrient directly affects the growth rate of the culture and helps to avoid overflow metabolism (formation of
side metabolites, such as acetate for Escherichia coli, lactic acid in cell cultures, ethanol in Saccharomyces cerevisiae), oxygen limitation (anaerobiosis).

The graph shows the principle of a substrate limited fed-batch cultivation with an initial batch phase. After consumption of the initial substrate a continuous feed of this
substrate is started.
Substrate limitation offers the possibility to control the reaction rates to avoid technological limitations connected to the cooling of the reactor and oxygen
transfer. Substrate limitation also allows the metabolic control, to avoid osmotic effects, catabolite repression and overflow metabolism of side products.
Different strategies can be used to control the growth in a fed-batch process:
Control Parameter Control Principle
DOT (pO2) DOstat (DOT= constant), F~DOT
Oxygen uptake rate (OUR) OUR=constant, F~OUR
Glucose on-line measurement of glucose (FIA), glucose=constant
Acetate on-line measurement of acetate (FIA), acetate=constant

pH (pHstat) F~pH (acidification is connected to high glucose)
Ammonia on-line measurement of ammonia (FIA), ammonia=constant
Temperature T adapted according to OUR or pO2
[edit]References
Hewitt CJ, Nienow AW: The scale-up of microbial batch and fed-batch fermentation processes. Adv Appl Microbiol 2007, 62:105-135.
Wlaschin KF, Hu WS: Fedbatch culture and dynamic nutrient feeding. Cell Culture Engineering 2006, 101:43-74.
Shiloach J, Fass R: Growing E. coli to high cell density--a historical perspective on method development. Biotechnol Adv 2005, 23:345-357.
Panda AK: Bioprocessing of therapeutic proteins from the inclusion bodies of Escherichia coli. Adv Biochem Eng Biotechnol 2003, 85:43-93.
Liden G: Understanding the bioreactor. Bioprocess and Biosystems Engineering 2002, 24:273-279.
Neubauer P, Winter J: Expression and fermentation strategies for recombinant protein production in Escherichia coli. In: Merten OW et al. (Eds).
Recombinant Protein Production with prokaryotic and eukaryotic cells. A comparative view on host physiology. 2001, Kluwer Academic Publisher, Dordrecht,
The Netherlands. pp. 196-260.
Balbas P: Understanding the art of producing protein and nonprotein molecules in Escherichia coli. Molecular Biotechnology 2001, 19:251-267.
Lee J, Lee SY, Park S, Middelberg AP: Control of fed-batch fermentations. Biotechnol Adv 1999, 17:29-48.
Zhang J, Greasham R: Chemically defined media for commercial fermentations. Applied Microbiology and Biotechnology 1999, 51:407-421.
Lee SY: High cell-density culture of Escherichia coli. Trends Biotechnol 1996, 14:98-105.
Mendozavega O, Sabatie J, Brown SW: Industrial-Production of Heterologous Proteins by Fed-Batch Cultures of the Yeast Saccharomyces-Cerevisiae.
Fems Microbiology Reviews 1994, 15:369-410.
Yee L, Blanch HW: Recombinant protein expression in high cell density fed-batch cultures of Escherichia coli. Biotechnology (N Y ) 1992, 10:1550-1556.
Riesenberg D, Schulz V: High-cell-density cultivation of Escherichia coli. Curr Opin Biotechnol 1991, 2:380-384.

View page ratings
Rate this pageWhat's this?
Trustworthy
Objective
Complete
Well-written
I am highly knowledgeable about this topic (optional)
Submit ratings
Categories:
Bioreactors
Biotechnology
ChemostatFrom Wikipedia, the free encyclopedia
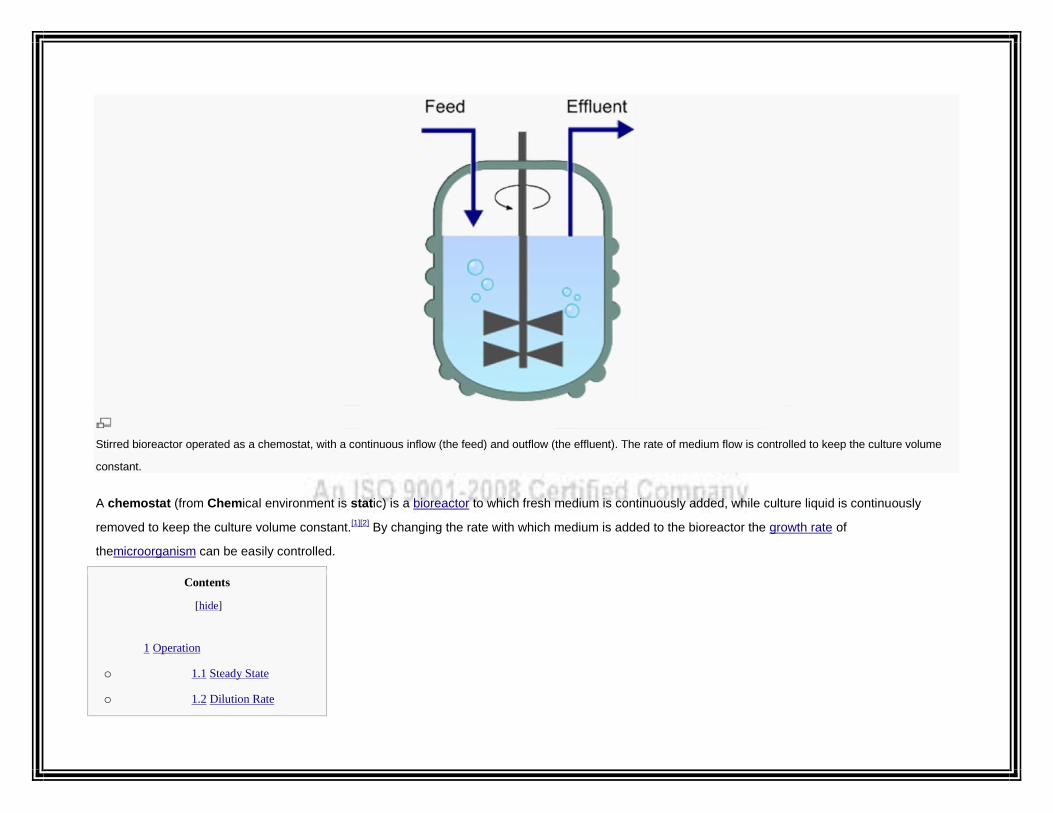
Stirred bioreactor operated as a chemostat, with a continuous inflow (the feed) and outflow (the effluent). The rate of medium flow is controlled to keep the culture volume
constant.
A chemostat (from Chemical environment is static) is a bioreactor to which fresh medium is continuously added, while culture liquid is continuously
removed to keep the culture volume constant.[1][2] By changing the rate with which medium is added to the bioreactor the growth rate of
themicroorganism can be easily controlled.
Contents
[hide]
1 Operation
o 1.1 Steady State
o 1.2 Dilution Rate

o 1.3 Maximal growth rate
2 Applications
o 2.1 Research
o 2.2 Industry
3 Concerns
4 Variations
5 See also
6 References
7 External links
[edit]Operation
[edit]Steady State
One of the most important features of chemostats is that micro-organisms can be grown in a physiological steady state. In steady state, growth occurs at a
constant rate and all culture parameters remain constant (culture volume, dissolved oxygen concentration, nutrient and product concentrations, pH, cell
density, etc.). In addition environmental conditions can be controlled by the experimenter.[3] Micro-organisms grown in chemostats naturally strive to
steady state: if a low amount of cells are present in the bioreactor, the cells can grow at growth rates higher than the dilution rate, as growth isn't limited by
the addition of the limiting nutrient. The limiting nutrient is a nutrient essential for growth, present in the media at a limiting concentration (all other nutrients
are usually supplied in surplus). However, if the cell concentration becomes too high, the amount of cells that are removed from the reactor cannot be
replenished by growth as the addition of the limiting nutrient is insufficient. This results in a steady state.
[edit]Dilution Rate
At steady state the specific growth rate (μ) of the micro-organism is equal to the dilution rate (D). The dilution rate is defined as the rate of flow of medium
over the volume of culture in the bioreactor

[edit]Maximal growth rate
Each microorganism growing on a particular substrate has a maximum specific growth rate (μmax) (the rate of growth observed if none of the nutrients are
limiting). If a dilution rate is chosen that is higher than μmax, the culture will not be able to sustain itself in the bioreactor, and will wash out. Even though
maximum rates can be obtained, the reactors may become very large. This is especially true in E. coli fatty acid production in a glucose medium.
[edit]Applications
[edit]Research
Chemostats in research are used for investigations in cell biology, as a source for large volumes of uniform cells or protein. The chemostat is often used to
gather steady state data about an organism in order to generate a mathematical model relating to its metabolic processes. Chemostats are also used
as microcosms in ecology[4][5] and evolutionary biology.[6][7][8][9] In the one case, mutation/selection is a nuisance, in the other case, it is the desired process
under study. Chemostats can also be used to enrich for specific types of bacterial mutants in culture such asauxotrophs or those that are resistant
to antibiotics or bacteriophages for further scientific study.[10]
Competition for single and multiple resources, the evolution of resource acquisition and utilization pathways, cross-feeding/symbiosis,[11][12] antagonism,
predation, and competition among predators have all been studied in ecology and evolutionary biology using chemostats.[13][14][15]
[edit]Industry
Chemostats are frequently used in the industrial manufacturing of ethanol. In this case, several chemostats are used in series, each maintained at
decreasing sugar concentrations.[citation needed]
[edit]Concerns
Foaming results in overflow with the volume of liquid not exactly constant.
Some very fragile cells are ruptured during agitation and aeration.
Cells may grow on the walls or adhere to other surfaces,[16] which is easily overcome by treating the glass walls of the vessel with a silane to
render them hydrophobic.
Mixing may not truly be uniform, upsetting the "static" property of the chemostat.

Dripping the media into the chamber actually results in small pulses of nutrients and thus oscillations in concentrations, again upsetting the
"static" property of the chemostat.
Bacteria travel upstream quite easily. They will reach the reservoir of sterile medium quickly unless the liquid path is interrupted by an air break in
which the medium falls in drops through air.
Continuous efforts to remedy each defect lead to variations on the basic chemostat quite regularly. Examples in the literature are numerous.
Antifoaming agents are used to suppress foaming.
Agitation and aeration can be done gently.
Many approaches have been taken to reduce wall growth[17][18]
Various applications use paddles, bubbling, or other mechanisms for mixing[19]
Dripping can be made less drastic with smaller droplets and larger vessel volumes
Many improvements target the threat of contamination
[edit]Variations
Fermentation setups closely related to the chemostats are the turbidostat, the auxostat and the retentostat. In retentostats culture liquid is also removed
from the bioreactor, but a filter retains the biomass. In this case, the biomass concentration increases until the nutrient requirement for biomass
maintenance has become equal to the amount of limiting nutrient that can be consumed.
[edit]See also
Fed-batch
Biochemical engineering
Continuous stirred-tank reactor (CSTR)
Bacterial growth
E. coli long-term evolution experiment
Batch culture

[edit]References
1. ^ Novick A, Szilard L (1950). "Description of the Chemostat". Science 112 (2920): 715–6. doi:10.1126/science.112.2920.715. PMID 14787503.
2. ^ James TW (1961). "Continuous Culture of Microorganisms". Annual Review of Microbiology 15: 27–
46. doi:10.1146/annurev.mi.15.100161.000331.
3. ^ D Herbert, R Elsworth Telling RC (1956). "The continuous culture of bacteria;a Theoretical and Experimental study". J. Gen. Microbiol 14 (3):
601–622. doi:10.1099/00221287-14-3-601.PMID 13346021.
4. ^ Becks L, Hilker FM, Malchow H, Jürgens K, Arndt H (2005). "Experimental demonstration of chaos in a microbial food
web". Nature 435 (7046): 1226–9. doi:10.1038/nature03627.PMID 15988524.
5. ^ Pavlou S, Kevrekidis IG (1992). "Microbial predation in a periodically operated chemostat: a global study of the interaction between natural and
externally imposed frequencies". Math Biosci 108 (1): 1–55. doi:10.1016/0025-5564(92)90002-E. PMID 1550993.
6. ^ Wichman HA, Millstein J, Bull JJ (2005). "Adaptive Molecular Evolution for 13,000 Phage Generations: A Possible Arms
Race". Genetics 170 (1): 19–31. doi:10.1534/genetics.104.034488.PMC 1449705. PMID 15687276.
7. ^ Dykhuizen DE, Dean AM (2004). "Evolution of specialists in an experimental microcosm". Genetics 167 (4): 2015–
26. doi:10.1534/genetics.103.025205. PMC 1470984. PMID 15342537.
8. ^ Wick LM, Weilenmann H, Egli T (2002). "The apparent clock-like evolution of Escherichia coli in glucose-limited chemostats is reproducible at
large but not at small population sizes and can be explained with Monod kinetics". Microbiology (Reading, Engl.) 148 (Pt 9): 2889–902. PMID 12213934.
9. ^ Jones LE, Ellner SP (2007). "Effects of rapid prey evolution on predator-prey cycles". J Math Biol 55 (4): 541–73. doi:10.1007/s00285-007-
0094-6. PMID 17483952.
10. ^ Schlegel HG, Jannasch HW (1967). "Enrichment cultures". Annu. Rev. Microbiol. 21: 49–
70. doi:10.1146/annurev.mi.21.100167.000405. PMID 4860267.
11. ^ Daughton CG, Hsieh DP (1977). "Parathion utilization by bacterial symbionts in a chemostat". Appl. Environ. Microbiol. 34 (2): 175–
84. PMC 242618. PMID 410368.
12. ^ Pfeiffer T, Bonhoeffer S (2004). "Evolution of cross-feeding in microbial populations". Am. Nat. 163 (6): E126–
35. doi:10.1086/383593. PMID 15266392.

13. ^ G. J. Butler and G. S. K. Wolkowicz. (july 1986). "Predator-mediated competition in the chemostat" (PDF). J Math Biol. 24 (2): 67–
191. doi:10.1007/BF00275997.
14. ^ Dykhuizen DE, Hartl DL (June 1983). "Selection in chemostats". Microbiol. Rev. 47 (2): 150–68. PMC 281569. PMID 6308409.
15. ^ Dykhuizen DE, Hartl DL (May 1981). "Evolution of Competitive Ability in Escherichia coli". Evolution (Evolution, Vol. 35, No. 3) 35 (3): 581–
94. doi:10.2307/2408204. JSTOR 2408204.
16. ^ Bonomi A, Fredrickson AG (1976). "Protozoan feeding and bacterial wall growth". Biotechnol. Bioeng. 18 (2): 239–
52. doi:10.1002/bit.260180209. PMID 1267931.
17. ^ de Crécy E, Metzgar D, Allen C, Pénicaud M, Lyons B, Hansen CJ, de Crécy-Lagard V (2007). "Development of a novel continuous culture
device for experimental evolution of bacterial populations".Appl. Microbiol. Biotechnol. 77 (2): 489–96. doi:10.1007/s00253-007-1168-5. PMID 17896105.
18. ^ Zhang Z, Boccazzi P, Choi HG, Perozziello G, Sinskey AJ, Jensen KF (2006). "Microchemostat-microbial continuous culture in a polymer-
based, instrumented microbioreactor". Lab Chip 6 (7): 906–13. doi:10.1039/b518396k. PMID 16804595.
19. ^ Van Hulle SW, Van Den Broeck S, Maertens J, Villez K, Schelstraete G, Volcke EI, Vanrolleghem PA (2003). "Practical experiences with start-
up and operation of a continuously aerated lab-scale SHARON reactor". Commun. Agric. Appl. Biol. Sci. 68 (2 Pt A): 77–84. PMID 15296140.
[edit]External links
1. http://www.midgard.liu.se/~b00perst/chemostat.pdf
2. http://www.rpi.edu/dept/chem-eng/Biotech-Environ/Contin/chemosta.htm
3. A final thesis including mathematical models of the chemostat and other bioreactors
4. A page about one laboratory chemostat design
[hide]
V
T

E
Laboratory equipment
Glassware
Beaker
Boston round (bottle)
Büchner funnel
Burette
Cold finger
Condenser
Conical measure
Cuvette
Dean-Stark apparatus
Dropping funnel
Eudiometer

Evaporating dish
Gas syringe
Graduated cylinder
Pipette
Petri dish
Pycnometer
Separatory funnel
Soxhlet extractor
Ostwald viscometer
Watch glass
Flasks
Büchner
Dewar
Erlenmeyer

Fernbach
Fleaker
Florence
Retort
Round-bottom
Schlenk
Volumetric
Tubes
Boiling
Ignition
NMR
Test
Thiele
Thistle

Other
Agar plate
Aspirator
Autoclave
Biosafety cabinet
Bunsen burner
Calorimeter
Chemostat
Colony counter
Colorimeter
Laboratory centrifuge
Crucible
Eyewash
Fire blanket

Fume hood
Glove box
Homogenizer
Hot air oven
Incubator
Laminar flow cabinet
Magnetic stirrer
Meker-Fisher burner
Microscope
Microtiter plate
Picotiter plate
Plate reader
Retort stand

Safety shower
Spectrophotometer
Static mixer
Stir bar
Stirring rod
Stopper
Scoopula
Teclu burner
Thermometer
Vacuum dry box
Vortex mixer
Wash bottle
See also: Instruments used in medical laboratories

Ethanol fermentationFrom Wikipedia, the free encyclopediaMain article: Fermentation (biochemistry)
Alcoholic fermentation, also referred to as ethanol fermentation, is a biological process in which sugars such as glucose, fructose,
and sucrose are converted into cellular energy and thereby produce ethanol and carbon dioxide as metabolic waste products.
Because yeasts perform this conversion in the absence of oxygen, alcoholic fermentation is considered an anaerobic process.
Alcoholic fermentation occurs in the production of alcoholic beverages and ethanol fuel, and in the rising of bread dough.
Grapes fermenting during the production of wine.
Contents
[hide]
1 The chemical process of fermentation of
glucose
2 Effect of oxygen
3 Baking bread

4 Alcoholic beverages
5 Feedstocks for fuel production
o 5.1 Cassava as ethanol feedstock
6 Byproducts of fermentation
7 Microbes used in ethanol fermentation
8 See also
9 References
[edit]The chemical process of fermentation of glucose

A laboratory vessel being used for the fermentation of straw.
The chemical equations below summarize the fermentation of sucrose (C12H22O11) into ethanol (C2H5OH). Alcoholic fermentation converts
one mole of sucrose into four moles of ethanol and four moles of carbon dioxide, producing two moles of ATP in the process.
The overall chemical formula for alcoholic fermentation is:
C6H12O6 + Zymase → 2 C2H5OH + 2 CO2

Sucrose is a dimer of glucose and fructose molecules. In the first step of alcoholic fermentation, the enzyme invertase cleaves the glycosidic
linkagebetween the two glucose molecules.
C12H22O11 + H2O + invertase → 2 C6H12O6
Next, each glucose molecule is broken down into two pyruvate molecules in a process known as glycolysis.[1] Glycolysis is summarized
by the equation:
C6H12O6 + 2 ADP + 2 Pi + 2 NAD+ → 2 CH3COCOO− + 2 ATP + 2 NADH + 2 H2O + 2 H+
The chemical formula of pyruvate is CH3COCOO−. Pi stands for the inorganic phosphate.
As shown by the reaction equation, glycolysis causes the reduction of two molecules of NAD+ to NADH. Two ADP molecules are also
converted to twoATP and two water molecules via substrate-level phosphorylation.
Glucose depicted inHaworth projection

Pyruvate
Acetaldehyde
Ethanol
[edit]Effect of oxygen
Fermentation does not require oxygen. If oxygen is present, some species of yeast (e.g., Kluyveromyces lactis or Kluyveromyces
lipolytica) will oxidize pyruvate completely to carbon dioxide and water. This process is called cellular respiration. But these species of
yeast will produce ethanol only in an anaerobic environment (not cellular respiration).
However, many yeasts such as the commonly used baker's yeast Saccharomyces cerevisiae, or fission yeast Schizosaccharomyces
pombe, prefer fermentation to respiration. These yeasts will produce ethanol even under aerobic conditions, if they are provided with
the right kind of nutrition.
[edit]Baking bread

The formation of carbon dioxide — a byproduct of ethanol fermentation — causes bread to rise.
Ethanol fermentation causes bread dough to rise. Yeast organisms consume sugars in the dough and produce ethanol and carbon
dioxide as waste products. The carbon dioxide forms bubbles in the dough, expanding it into something of a foam. Nearly all the
ethanol evaporates from the dough when the bread is baked.
[edit]Alcoholic beverages
All ethanol contained in alcoholic beverages (including ethanol produced by carbonic maceration) is produced by means of
fermentation induced by yeast.
Wine is produced by fermentation of the natural sugars present in grapes and other kinds of fruit.
Mead is produced by fermentation of the natural sugars present in honey.
Beer, whiskey, and vodka are produced by fermentation of grain starches that have been converted to sugar by the
enzyme amylase, which is present in grain kernels that have been germinated.
Rum is produced by fermentation of sugarcane.

In all cases, fermentation must take place in a vessel that allows carbon dioxide to escape but prevents outside air from coming in.
This is because exposure to oxygen would prevent the formation of ethanol.
[edit]Feedstocks for fuel production
Yeast fermentation of various carbohydrate products is also used to produce the ethanol that is added to gasoline.
The dominant ethanol feedstock in warmer regions is sugarcane.[2] In temperate regions, corn or sugar beets are used.[2][3]
In the United States, the main feedstock for the production of ethanol is currently corn.[2] Approximately 2.8 gallons of ethanol are
produced from one bushel of corn (0.42 liter per kilogram). While much of the corn turns into ethanol, some of the corn also yields by-
products such as DDGS (distillers dried grains with solubles) that can be used as feed for livestock. A bushel of corn produces about
18 pounds of DDGS (320 kilograms of DDGS per metric ton of maize).[4] Although most of the fermentation plants have been built in
corn-producing regions, sorghum is also an important feedstock for ethanol production in the Plains states. Pearl millet is showing
promise as an ethanol feedstock for the southeastern U.S. and the potential of duckweed is being studied.[5]
In some parts of Europe, particularly France and Italy, grapes have become a de facto feedstock for fuel ethanol by the distillation of
surplus wine.[6] In Japan, it has been proposed to use rice normally made into sake as an ethanol source.[7]
[edit]Cassava as ethanol feedstock
Ethanol can be made from mineral oil or from sugars or starches. Starches are cheapest. The starchy crop with highest energy
content per acre is cassava, which grows in tropical countries.
Thailand already had a large cassava industry in the 1990s, for use as cattle feed and as a cheap admixture to wheat flour. Nigeria
and Ghana are already establishing cassava-to-ethanol plants. Production of ethanol from cassava is currently economically feasible
when crude oil prices are above US$120 per barrel.
New varieties of cassava are being developed, so the future situation remains uncertain. Currently, cassava can yield between 25-40
tonnes per hectare (with irrigation and fertilizer),[8] and from a tonne of cassava roots, circa 200 liters of ethanol can be produced
(assuming cassava with 22% starch content). A liter of ethanol contains circa 21.46[9] MJ of energy. The overall energy efficiency of
cassava-root to ethanol conversion is circa 32%.

The yeast used for processing cassava is Endomycopsis fibuligera, sometimes used together with bacterium Zymomonas mobilis.
[edit]Byproducts of fermentation
Ethanol fermentation produces unharvested byproducts such as heat, food for livestock, and water.[10]
[edit]Microbes used in ethanol fermentation
Yeast
Zymomonas mobilis
[edit]See also
Yeast in winemaking
Anaerobic respiration
Cellular respiration
Cellulose
Fermentation (wine)
[edit]References
1. ^ Stryer, Lubert (1975). Biochemistry. W. H. Freeman and Company. ISBN 0-7167-0174-X.
2. ^ a b c James Jacobs, Ag Economist. "Ethanol from Sugar". United States Department of Agriculture. Retrieved 2007-09-04.
3. ^ "Economic Feasibility of Ethanol Production from Sugar in the United States" (pdf). United States Department of Agriculture. July 2006.
Archived from the original on 2007-08-15. Retrieved 2007-09-04.
4. ^ "Ethanol Biorefinery Locations". Renewable Fuels Association. Archived from the original on 30 April 2007. Retrieved 21 May 2007.
5. ^ Tiny Super-Plant Can Clean Up Hog Farms and Be Used For Ethanol Production
6. ^ Caroline Wyatt (2006-08-10). "Draining France's 'wine lake'". BBC News. Retrieved 2007-05-21.
7. ^ Japan Plans Its Own Green Fuel by Steve Inskeep. NPR Morning Edition, May 15, 2007

8. ^ Agro2: Ethanol From Cassava
9. ^ Pimentel, D. (Ed.) (1980). CRC Handbook of energy utilization in agriculture. (Boca Raton: CRC Press)
10. ^ Lynn Ellen Doxon. The Alcohol Fuel Handbook. InfinityPublishing.com. ISBN 0-7414-0646-2.
Non-fermenterFrom Wikipedia, the free encyclopedia
This article is an orphan, as no other articles link to it. Please introduce links to this page from related articles; suggestions maybe available. (February 2010)
Non-fermenter (also non-fermenting bacteria) are a taxonomic heterogene group of bacteria of the division Proteobacteria, which can not
catabolize glucose and therefore are not able to ferment. This does not exclude automatically, that species can catabolize other sugars or have an
anaerobiosis like fermenting bacteria.

The coccoid or bacillary bacteria can be found in soil or wet areas. They are non sporulating bacteria and Gram-negative. Some species are also
pathogenic for human, so their detection (f.e. withAPI 20E) has a great relevance in bacterial diagnostic.
The following genus are listed here.
[edit]List of non-fermenter
Acinetobacter
Bordetella
Burkholderia
Legionella
Moraxella
Pseudomonas
Stenotrophomonas
There are also included pathogen species like Pseudomonas aeruginosa and Moraxella catarrhalis.
[edit]References
Kayser et al. (2005): Medical Microbiology.
View page rating
PhotofermentationFrom Wikipedia, the free encyclopedia
This article needs attention from an expert on the subject. Please add a reason or a talk parameter to this template to explain theissue with the article. Consider associating this request with a WikiProject. (September 2008)

Photofermentation is the fermentative conversion of organic substrate to biohydrogen manifested by a diverse group of photosynthetic bacteria by a
series of biochemical reactions involving three steps similar to anaerobic conversion. Photofermentation differs from dark fermentation because it only
proceeds in the presence of light.
For example photo-fermentation with Rhodobacter sphaeroides SH2C (or many other purple non-sulfur bacteria[1]) can be employed to convert small
molecular fatty acids into hydrogen[2] and other products.
[edit]See also
Dark fermentation
Fermentative hydrogen production
Biohydrogen
Fermentation (biochemistry)
Hydrogen production
Photochemical reaction
Photohydrogen
Phototroph
Photobiology
Electrohydrogenesis
Microbial fuel cell
[edit]References
1. ^ Redwood MD, Paterson-Beedle M & Macaskie LE (2008). Integrating dark and light biohydrogen production strategies: towards the hydrogen
economy. Rev Environ Sci Bio/Technol in press.doi:10.1007/s11157-008-9144-9
2. ^ High hydrogen yield from a two-step process of dark-and photo-fermentation of sucrose
[edit]External links

Look
up photofermentation in
Wiktionary, the free
dictionary.
Photo fermentation
Enhancing phototropic hydrogen production by solid-carrier assisted fermentation and internal optical-fiber illumination
This article about renewable energy is a stub. You can help Wikipedia by expanding it.


